Viewpoint

On the Ecological Compensation Standard of Cultivated Land Under the “Separation of Three Rights”: From the Perspective of Contract Rights

College of Public Administration, Nanjing Agricultural University, Nanjing 210095, China
*
Author to whom correspondence should be addressed.
Land 2025, 14(5), 1003; https://doi.org/10.3390/land14051003
Submission received: 23 March 2025 / Revised: 2 May 2025 / Accepted: 3 May 2025 / Published: 6 May 2025

Abstract

:
Contracting farmers are the main entities in cultivated land protection. From the perspective of contractual rights, improving the ecological compensation standards for cultivated land under the “Separation of Three Rights” system helps coordinate interest relationships in ecological compensation and serves as the key to benefit distribution among multiple right-holders. Reasonable compensation to contracting farmers facilitates the dual consideration of food security and ecological safety in cultivated land. The study starts from the connotation of contractual rights, incorporates both opportunity cost losses and ecological values into compensation criteria based on the membership attributes of contractual rights and the nature of use rights. Employing the equivalent factor method, replacement cost method, and opportunity cost method, it calculates compensation standards for both transferred and non-transferred contracting farmers, using prefecture-level cities in Jiangsu Province as case examples. (1) Land-transferring contracted farmers: The compensation standard is calculated based on opportunity cost loss as the compensation basis. (2) Non-transferring contracted farmers: The compensation standard incorporates both opportunity cost losses and the ecological value generated through agricultural production. Research Findings: The average compensation standard for contracted farmland transfer in Jiangsu Province is 6275.79 CNY/hm2, primarily implemented through government compensation mechanisms. The average compensation standard for non-transferred contracted farmland in Jiangsu Province is 40,604 CNY/hm2, implemented through a government–market–community collaborative mechanism. The tiered compensation criteria, by accounting for differential contributions of farmland transfer participants and non-participants to agro-ecosystem services, effectively reconcile the dual imperatives of arable land preservation and livelihood enhancement for contracted farmers.

1. Introduction

Cultivated land serves dual functions as both an ecological asset and a production resource, constituting a critical means of agricultural production. On the one hand, stable productivity depends on well-maintained land quality and ecosystem integrity. On the other hand, the quantity and quality of cultivated land directly determine its capacity to deliver ecosystem services [1]. For decades, socioeconomic development and urbanization have encroached upon agricultural land, triggering the widespread “non-grain conversion” and “non-agriculturalization” of cultivated land. This spatial restructuring has disrupted the synergistic balance between cultivated land’s productive and ecological functions. To address the incentive challenges in cultivated land conservation, General Secretary Xi Jinping articulated the “lucid waters and lush mountains are invaluable assets” principle, establishing a new paradigm for reconciling economic development with farmland protection. As a cornerstone institutional innovation in ecological civilization, the farmland eco-compensation mechanism has emerged as a critical instrument for balancing socioeconomic progress and environmental stewardship. In 2024, China’s State Council promulgated the Regulations on Ecological Protection Compensation, which mandates compensation for entities and individuals engaged in ecological conservation. The regulations emphasize differentiated compensation schemes based on three key criteria, the spillover effects of ecological benefits, the criticality of ecological functions, and regional economic development levels, thereby safeguarding the interests of ecological stewards [2]. Thus, the fundamental questions of “what to compensate, whom to compensate, and how much to compensate” constitute the cornerstone for establishing an effective farmland eco-compensation mechanism.
The cultivated land ecological compensation system is essentially a measure designed to coordinate the interests and distribution among stakeholders arising from ecological conservation activities, aiming to internalize the external costs generated by related activities [3]. A reasonable ecological compensation standard not only serves as the key to resolving conflicts of interest but also directly affects farmers’ motivation to protect cultivated land. Current research on cultivated land ecological compensation standards primarily focuses on three aspects. The first is the accounting basis and methodology for compensation standards. Existing approaches to calculating cultivated land ecological compensation standards mainly proceed from two perspectives: ecological value [4] and the costs of ecosystem services provided by cultivated land systems [5]. Compensation standard calculations based on ecological value primarily originate from either the classification of cultivated land ecosystem services or focus on the relationship between the demand and actual supply of cultivated land [6], typically involving measurement methods such as the Equivalent factor method [7], Positive and negative externality valuation of ecosystem services [8], Energy analysis [9], the Market pricing method [10], the Willingness-to-accept (WTA) approach [11], and the Contingent valuation method (CVM) [12]. While methodologies for ecological value accounting have seen progressive refinement in recent years, there persists a lack of standardized evaluation indicators and assessment frameworks. This methodological ambiguity frequently results in substantial discrepancies when valuing identical ecological services through different parameter systems, while systematically overlooking cost differentials among distinct providers delivering equivalent ecological functions. Compensation standards based on ecosystem service costs aim to redress economic development constraints caused by cultivated land conservation measures [13], typically employing the Opportunity cost method [14], the Willingness-to-pay (WTP) approach [15,16], the Quantification of local government welfare losses, and Benefit-internalization models integrating external benefits and internal costs [17]. Costs derived from such methodologies frequently demonstrate incongruities with the genuine ecological value rendered by cultivated land resources. The second aspect includes perspectives on compensation standard calculation. The prevailing research predominantly adopts a farmer-centric approach in determining cultivated land ecological compensation standards, generally regarding ecological value providers [18] or entities constrained by development rights [19] as primary compensation recipients. Under China’s current agricultural land tenure system, studies addressing compensation standards for differentiated right holders remain comparatively underdeveloped. Scholarship concerning ecological compensation within the “Separation of Three Rights” (separating ownership, contract, and management rights) predominantly focuses on compensation targets, with academic consensus diverging. Some scholars advocate for compensating village collectives, contracted households, agricultural operators, and local governments [20]; others posit cultivated land users (contract farmers and operators) as principal value contributors [21]. The third aspect to consider is institutional frameworks for cultivated land ecological compensation. Whether employing ecological valuation approaches or cost-based methodologies to determine compensation standards, their operational efficacy necessitates synergistic institutional arrangements. For example, optimizing compensation standards can be supported through compensation methods and fund allocation, fiscal and financial policies, property rights definition, and legislation on ecological compensation for farmland [22]. Additionally, measures can be refined by considering economic development and social welfare [23] or by addressing operational environments of compensation mechanisms through factors such as environmental pressures [24], technological innovation [25], and social equity [26], to ensure the effective implementation of farmland ecological compensation policies.
In summary, current approaches to determining ecological compensation standards predominantly stem from singular theoretical frameworks. Some emphasize cultivated land’s ecological security by basing valuations on its ecosystem service value, while others prioritize food security through opportunity cost calculations [27]. However, this unilateral methodology reveals critical limitations. Ecological value exclusivity risks disrupting the production–ecology equilibrium of cultivated land, undermining its capacity to ensure sustainable food security; opportunity cost dependency fails to establish effective incentive mechanisms, thereby contravening the fundamental purpose of ecological compensation systems. However, while cost and value constitute an organic whole in the ecological compensation framework for cultivated land [28], prevailing accounting practices frequently fail to integrate these dual dimensions. Current compensation standard calculations predominantly exhibit unilateral considerations, focusing solely on either generated ecological value or protection-induced opportunity costs, neglecting their symbiotic relationship, and overlooking the legal necessity to align compensation mechanisms with the “Separation of Three Rights” framework. Contracting farmers, as the principal entities in cultivated land protection, bridge ownership and management rights while fulfilling the additional functions of food security [29]. Determining compensation standards for contracting entities under the “Separation of Three Rights” system facilitates the resolution of benefit distribution among multiple right holders in cultivated land ecological compensation. Against the institutional backdrop of the “Separation of Three Rights”, this study adopts the perspective of contractual rights and integrates two accounting theoretical foundations—the opportunity cost method and the ecological value method. Based on the connotation and attributes of contractual rights, it calculates compensation standards for contracting farmers by evaluating their specific contributions across prefecture-level cities in Jiangsu Province. The findings aim to support the improvement of cultivated land ecological compensation mechanisms under the “Separation of Three Rights” framework.

2. Research Framework and Methods

Cultivated land protection constitutes the foundation for ensuring food production security. Sustainable agricultural output necessitates the harmonization of ecological conservation, while productive investment in farmland serves as the prerequisite for delivering ecosystem services. To achieve food security and ecological security while adhering to the compensation principle of “those who provide, those who benefit”, the targets of cultivated land ecological compensation primarily include compensation for grain production exceeding self-sufficiency requirements and the associated economic losses from forfeited development opportunities due to cultivated land protection—namely, opportunity cost losses; compensation for ecological values incidentally generated through grain cultivation, such as water and soil conservation and biodiversity enhancement. These ecological benefits possess public goods characteristics that cannot be realized through market transactions, thus warranting compensation. Notably, production costs incurred from agricultural inputs are inherently incorporated into commodity prices through market mechanisms, thus being excluded from compensation considerations. Under the “Separation of Three Rights” framework, the legal attributes of ownership, contract rights, and management rights differ substantially, leading to distinct responsibilities and contributions among right holders regarding cultivated land protection. First, the right holders’ bearing opportunity cost losses encompass both contracted land-use right holders who forgo cultivating more profitable cash crops due to farmland preservation mandates and land ownership right holders who sacrifice economically preferable industrial development options to maintain rural ecological integrity. Land ownership refers to the collective ownership of rural land by farmers’ collectives. This collective ownership inherently entails public interests, requiring not only the coordinated development of rural economies but also bearing the responsibility of protecting cultivated land to ensure sustainable agricultural and ecological outcomes. The opportunity costs associated with foregone development alternatives due to rural ecological conservation are borne collectively by all community members [30]. According to the principles of equal opportunity and shared responsibility, the contractual right with membership eligibility and the ownership right jointly share the opportunity cost loss compensation. Therefore, when using opportunity cost loss as the basis for compensation, the compensation benefits shall be allocated equally, with the ownership entity and contractual right entity each entitled to 50%. Second, regarding non-marketable ecological values, the principal contributors should be identified following the “providers getting benefits” principle. For ecological benefits incidentally generated through agricultural production, the primary contributors are the right holders who directly invest in and manage the cultivated land. Consequently, when ecological value serves as the basis for compensation, the compensation benefits shall accrue for contracted farming households when they directly engage in cultivation and management as well as agricultural operators when they undertake production investments and operational activities (Figure 1).
Under the “Separation of Three Rights” framework, the contracted land-use right serves as the pivotal nexus connecting land ownership and land operation rights. This core institutional arrangement performs dual critical functions: acting as the custodian of cultivated land quality when no transfer occurs, while simultaneously serving as the principal entity responsible for grain production under such circumstances. First, contractual rights are exclusively granted to members of the village collective. The household contract system fundamentally operates as a collective mechanism, where all members jointly allocate village land equally and proportionally to each individual, reflecting a value orientation rooted in fairness. This ensures that land distribution aligns with principles of equity while maintaining collective ownership structures. Second, the essence of contractual rights lies in the holder’s authority to utilize and control contracted land. Particularly when land remains untransferred, contracted farmers directly invest in and engage in production and operations on cultivated land, making them the primary executors of land contractual rights [31]. This underscores their central role in exercising and maintaining these rights under the “Separation of Three Rights“ system. The dual attributes and substantive content of the contracted land-use right necessitate that the compensation standards under the “Separation of Three Rights” framework incorporate not only opportunity cost losses but also the ecological value generated through agricultural production. The compensation criteria exhibit nuanced variations contingent upon whether the contracted land-use right is transferred or retained, reflecting differential contributions to cultivated land ecosystem services under these distinct institutional arrangements. (1) When using opportunity cost losses as the basis for compensation, the compensation recipients should include both contracted farmers with transferred land and those with untransferred land. This approach reflects the equal forfeiture of alternative development opportunities by all collective members due to their shared responsibility for cultivated land protection, ensuring fairness in distributing the costs of ecological stewardship. The land contractual right, derived from collective economic organization membership, inherently carries identity-based attributes [32]. Regardless of land transfer status, these rights transform the collectively owned land—as the primary means of production—into a crucial vehicle for fulfilling social security functions [33]. Sustainable provision of both grain outputs and ecological services necessitates well-functioning cultivated land systems. Contracted farmers serve not only as principal stewards of farmland conservation, but also bear the long-term maintenance responsibilities [34]. This custodial role inevitably entails opportunity costs by forgoing alternative income-generating development options. (2) Ecological compensation mechanisms primarily target contracted farmers under non-transferring conditions. When contracted land remains untransferred, the contracted management rights and operational rights are unified, granting contracted farmers the legal authority to possess, utilize, and derive benefits from the land. The ecological value generated by cultivated land systems is premised on the utilization of land resources, emerging as a byproduct of agricultural production inputs. Therefore, compensation for ecological value arising from such production activities rightfully belongs to contracted farmers. Importantly, the ecological value of cultivated land encompasses both positive contributions and negative impacts, necessitating a holistic assessment in compensation frameworks. With the diversification of human demands, contracted farming households generate ecological and social byproducts through agricultural production on cultivated lands. This results in the cultivated land resource system creating uncompensated ecological value (i.e., positive externalities) that enhances human living conditions and environments beyond market transactions [35]. Concurrently, the pursuit of increased grain yields has driven farmers to excessively apply chemical fertilizers and pesticides in agricultural production, resulting in negative externalities such as soil fertility depletion and land contamination. Consequently, when establishing compensation standards based on ecological value, it is imperative to incorporate not only the positive value of cultivated land ecosystem services, but also the negative environmental externalities arising from agricultural production. These include excessive agrochemical inputs, overconsumption of water resources, residual agricultural plastic mulch, and greenhouse gas emissions from cultivated lands.

2.1. Calculation of Ecological Value

2.1.1. Calculation of Positive Value

Building upon existing research, the assessment of positive values primarily employs the equivalent factor method. First, the monetary value per unit biological equivalent factor is calculated. Then, based on Xie Gaodi’s study on the ecological service value per unit area of China’s ecosystems, the sum of positive value equivalent factors (F) is determined to be 6.51. The positive values of cultivated land ecosystem services encompass nine distinct service categories: gas regulation, climate regulation, water conservation, waste treatment, soil formation and protection, biodiversity maintenance, aesthetic landscape provision, food production, and raw material supply [36]. This study quantifies positive values exclusively for seven service categories that exhibit public goods attributes, whose value transformation through market transactions is impeded by ill-defined property rights. Among these, food production and raw material supply demonstrate private good characteristics, with clearly identifiable provisioning agents whose values are realized through market transactions. These are therefore excluded from the valuation scope. The final assessment results are adjusted using the multiple cropping index, with specific reference to Liu Lihua’s research findings [37], as expressed in the following formula:
E a = 1 7 k = 1 n m k p k q k m
V 1 = E a × F × j
where Ea denotes the monetary value per unit of biological equivalence factor (CNY/hm2); k represents the grain crop type; mk, pk, and qk correspond to the sown area (hm2), average price (CNY/kg), and yield per unit area (kg/hm2) of the k-th grain crop, respectively; m and n denote the total sown area (hm2) of n grain crop types and the number of grain crop species, respectively; V1 represents the positive ecosystem service value per unit cropland area (CNY/hm2) in year i; F denotes the sum of seven positive value equivalence factors (taken as 6.51) [38]; and j indicates the multiple cropping index adjustment factor for year i, defined as the ratio of the regional multiple cropping index to the national average.

2.1.2. Calculation of Negative Value

The negative values provided by contracted farming households primarily encompass four categories: environmental pollution from chemical fertilizer and pesticide application during production, negative externalities of agricultural water consumption, environmental costs associated with residual agricultural plastic mulch on croplands, and greenhouse gas emissions from cultivated land. The calculation methodology is the replacement cost approach, building upon the research framework established by Liu Lihua [37]. The negative externalities of fertilizers and pesticides are quantified by substituting their input costs as a proxy measure, The negative externalities arising from agricultural water consumption are quantified using agricultural water depletion costs as a proxy measure, The negative externalities arising from residual agricultural plastic mulch are quantified by substituting the economic value of crop yield losses induced by the residual plastic film as a proxy measure, The negative value arising from greenhouse gas emissions in cultivated land is primarily estimated by substituting the values of CH4 and N2O emissions. The specific computational formula is presented in (Table 1). The total environmental costs generated by contracted farming households’ production inputs are ultimately calculated through summation according to Equations (4)–(10).
The rationale for exclusively considering CH4 and N2O emissions when quantifying the environmental costs of greenhouse gases lies in their dominant contribution to agricultural radiative forcing. First, rice cultivation represents the primary source of CH4 emissions, as the flooding of paddy fields creates anaerobic conditions that facilitate the decomposition of organic matter and subsequent methane production. Wheat and maize contribute minimally to CH4 emissions due to their well-developed root systems, which enhance soil oxygen availability. Consequently, CH4 emissions are primarily attributed to rice cultivation. Second, while cropland ecosystems emit CO2, they simultaneously absorb atmospheric CO2 through photosynthesis and sequester it in vegetation and soil, thereby reducing atmospheric CO2 concentrations. Consequently, net CO2 emissions from cropland ecosystems are generally considered negligible. Regarding N2O emissions, the calculation incorporates both the baseline flux (under unfertilized conditions) and fertilization-induced emissions (from nitrogen and compound fertilizers), consistent with established research methodologies [37].
Furthermore, regarding the parameters in the greenhouse gas calculation formula, this includes the carbon trading price Pic and the global warming potential GWPij values. The carbon trading price was determined as 0.608 CNY/kg C, derived from the average of China’s afforestation cost (260.90 RMB/t C) and Sweden’s carbon tax rate (150 USD/t C) [37]. For the GWPij values, CO2 serves as the reference gas for conversion, where CH4 and N2O are normalized to CO2-equivalent greenhouse effects. The conversion yields relative values of 21 for CH4 and 310 for N2O when CO2 is set to 1 [37].
The aggregate negative value generated during contracted farmers’ production processes was ultimately calculated through summation based on Equations (4)–(10).

2.2. Calculation of Opportunity Cost Loss

The opportunity cost incurred by contracted farming households is quantified as the foregone economic returns arising from restricted access to alternative development opportunities due to cultivated land conservation obligations. This study quantifies the opportunity cost as the difference between the revenue from converting cultivated land to construction land and the income from grain market transactions. The specific formula is as follows:
C = O Q = ( P 1 + P 2 + P 3 ) × r × ( 1 + r ) n ( 1 + r ) n 1 × 1 2 Q
The average revenue from converting cultivated land to construction land was calculated as half of the annual usufructuary value of construction land use rights in urban/peri-urban areas [39]. C, O, and Q represent the opportunity cost per unit of cultivated land protection (CNY/hm2), the revenue per unit of construction land (CNY/hm2), and the average yield-based revenue from grain production (CNY/hm2), respectively; P1, P2, and P3 denote the net revenue from land conveyance, the deed tax on land use rights transfer, and the cultivated land occupation tax, respectively; n indicates the land use term, which is set as 50 years for comprehensive land use based on the standard conveyance period. The land capitalization rate r is determined as the sum of a risk-free adjustment rate and a risk adjustment rate. The risk-free rate adopts the 2022 one-year bank fixed deposit interest rate of Jiangsu Province (1.5%), while the risk adjustment rate employs the geometric mean of the province’s consumer price index (CPI) fluctuation rate over the past five years (2.4%). Consequently, r equals 3.9%.

2.3. Calculation of Compensation Standard Applicable to Contractual Rights Holders

Under the “Separation of Three Rights” framework, the compensation standard calculation differs slightly between contracted farming households who have transferred their land use rights and those who have not, due to distinct compensation bases. For households who have transferred their contractual rights, compensation standards need only account for opportunity cost losses, as they no longer directly invest in agricultural production. In contrast, for households retaining operational rights, compensation standards should incorporate both opportunity costs and associated ecological values, reflecting their continued direct investments in cultivated land.
When determining compensation criteria through opportunity cost valuation, it is imperative to recognize that the relinquishment of developmental entitlements extends beyond individual households to encompass the collective membership of rural communities. Given that cultivated land resources are legally vested in village collective economic organizations, the subjects of opportunity cost compensation must additionally include the subject of ownership. Under the principles of benefit sharing and equal opportunity entitlement, compensation for opportunity cost losses shall be equally apportioned between contracted farming households holding valid collective membership status and the proprietary entity. Specifically, the land ownership entity is entitled to 50% of the compensation quantum, with the remaining 50% allocated to certified contracted farming households as collective members. When incorporating ecological value into compensation criteria under the principle of shared ecological benefits between urban populations and agricultural communities, contracted farming households are recognized as both providers and beneficiaries of ecological services. Consequently, the proportion of ecological value accruing to their own welfare is excluded from compensation calculations, leading to the determination of compensation standards for non-transferred contracted households based on 50% of the total quantified ecological value [39].
Regardless of whether contracted households have transferred their land-use rights or not, the compensation standards determined must incorporate the regional socio-economic development level, necessitating adjustments through the application of a region-specific socio-economic development coefficient. The regional socio-economic development adjustment coefficient is derived from the arithmetic mean of urban and rural Engel coefficients, as formalized in the following equation:
  • Ecological compensation standard for contracted farming households under non-transferring conditions:
V = ( V 1 V 2 + C ) / 2 × l
l = 1 1 + e t
t = 1 E n 3
The compensation standard for non-transferred contracted farmers equals half the total of net ecological value plus opportunity cost losses, adjusted according to the social development level coefficient. Where V is the compensation standard of non-transferring contracted farmers, l is the regional development coefficient, and En is the average of the rural Engel coefficient and urban Engel coefficient in each region.
2.
Ecological compensation standard for contracted farming households under transferring conditions:
V = C / 2 × l
The compensation standard for transferred contracted farmers equals half the opportunity cost losses, adjusted according to the regional development coefficient. V′ is the compensation standard for transferring contracted farmers.

2.4. Data Source

Jiangsu Province promulgated the Interim Measures on Ecological Compensation in Jiangsu Province in 2013, featuring extensive compensation coverage and prolonged implementation duration. As a pivotal agricultural province in China, Jiangsu maintains generally stable arable land resources while confronting dual pressures from urbanization and ecological conservation. Meanwhile, given its location within the Yangtze River Delta region and the corresponding fiscal capacity of local governments, this study selects prefecture-level cities in Jiangsu Province as representative cases.
(1) Data on Ecological Values: The positive ecosystem service values of cultivated land were primarily determined based on crop cultivation patterns in Jiangsu Province and data availability; we ultimately selected six crop types: wheat, rice, soybeans, rapeseed, corn, and vegetables. (2) Opportunity cost loss-related data: The net proceeds of land conveyance can only be obtained as comprehensive statistics on a national scale, while transaction prices for land use rights are limited to Jiangsu Province. The opportunity cost of arable land allocated to grain cultivation depends on local socioeconomic development levels. Consequently, the net income from land conveyance at the regional level was calculated by adjusting the national average net revenue per unit of land conveyance according to each region’s per capita GDP as a proportion of the national per capita GDP. Similarly, the deed tax on land use right transfers was derived from Jiangsu Province’s transaction prices, weighted by each region’s per capita GDP relative to Jiangsu’s provincial average. Detailed data sources can be found in Table 2.

3. Empirical Analysis

3.1. Calculation Results of the Positive Value of Cultivated Land Ecosystem Services in Jiangsu Province

Based on regional data acquisition, the economic value per unit biophysical equivalent factor (Ea) for each prefecture-level city in Jiangsu Province was initially calculated using Equation (1). For regions cultivating early-season rice, mid-season rice, and late-season rice, the grain prices were determined by averaging the respective prices documented in the National Compilation of Cost-Benefit Data for Agricultural Products. The analytical results indicate that the three regions with the highest Ea values were, in descending order, Huai’an, Xuzhou, and Nanjing; the three regions with the lowest Ea values were, in ascending order, Lianyungang, Zhenjiang, and Yangzhou. Subsequently, the positive value of cultivated land ecosystem services for each region was calculated by applying the multiple cropping index correction factor through Equation (2). The three regions with the highest positive values of cultivated land ecosystem services were, in descending order, Huai’an (192,300 CNY/hm2), Xuzhou (189,400 CNY/hm2), and Nanjing (159,500 CNY/hm2). Conversely, the three regions with the lowest positive values were, in ascending order, Lianyungang (96,500 CNY/hm2), Yangzhou (72,700 CNY/hm2), and Zhenjiang (64,700 CNY/hm2) (see Table 3 for detailed results).

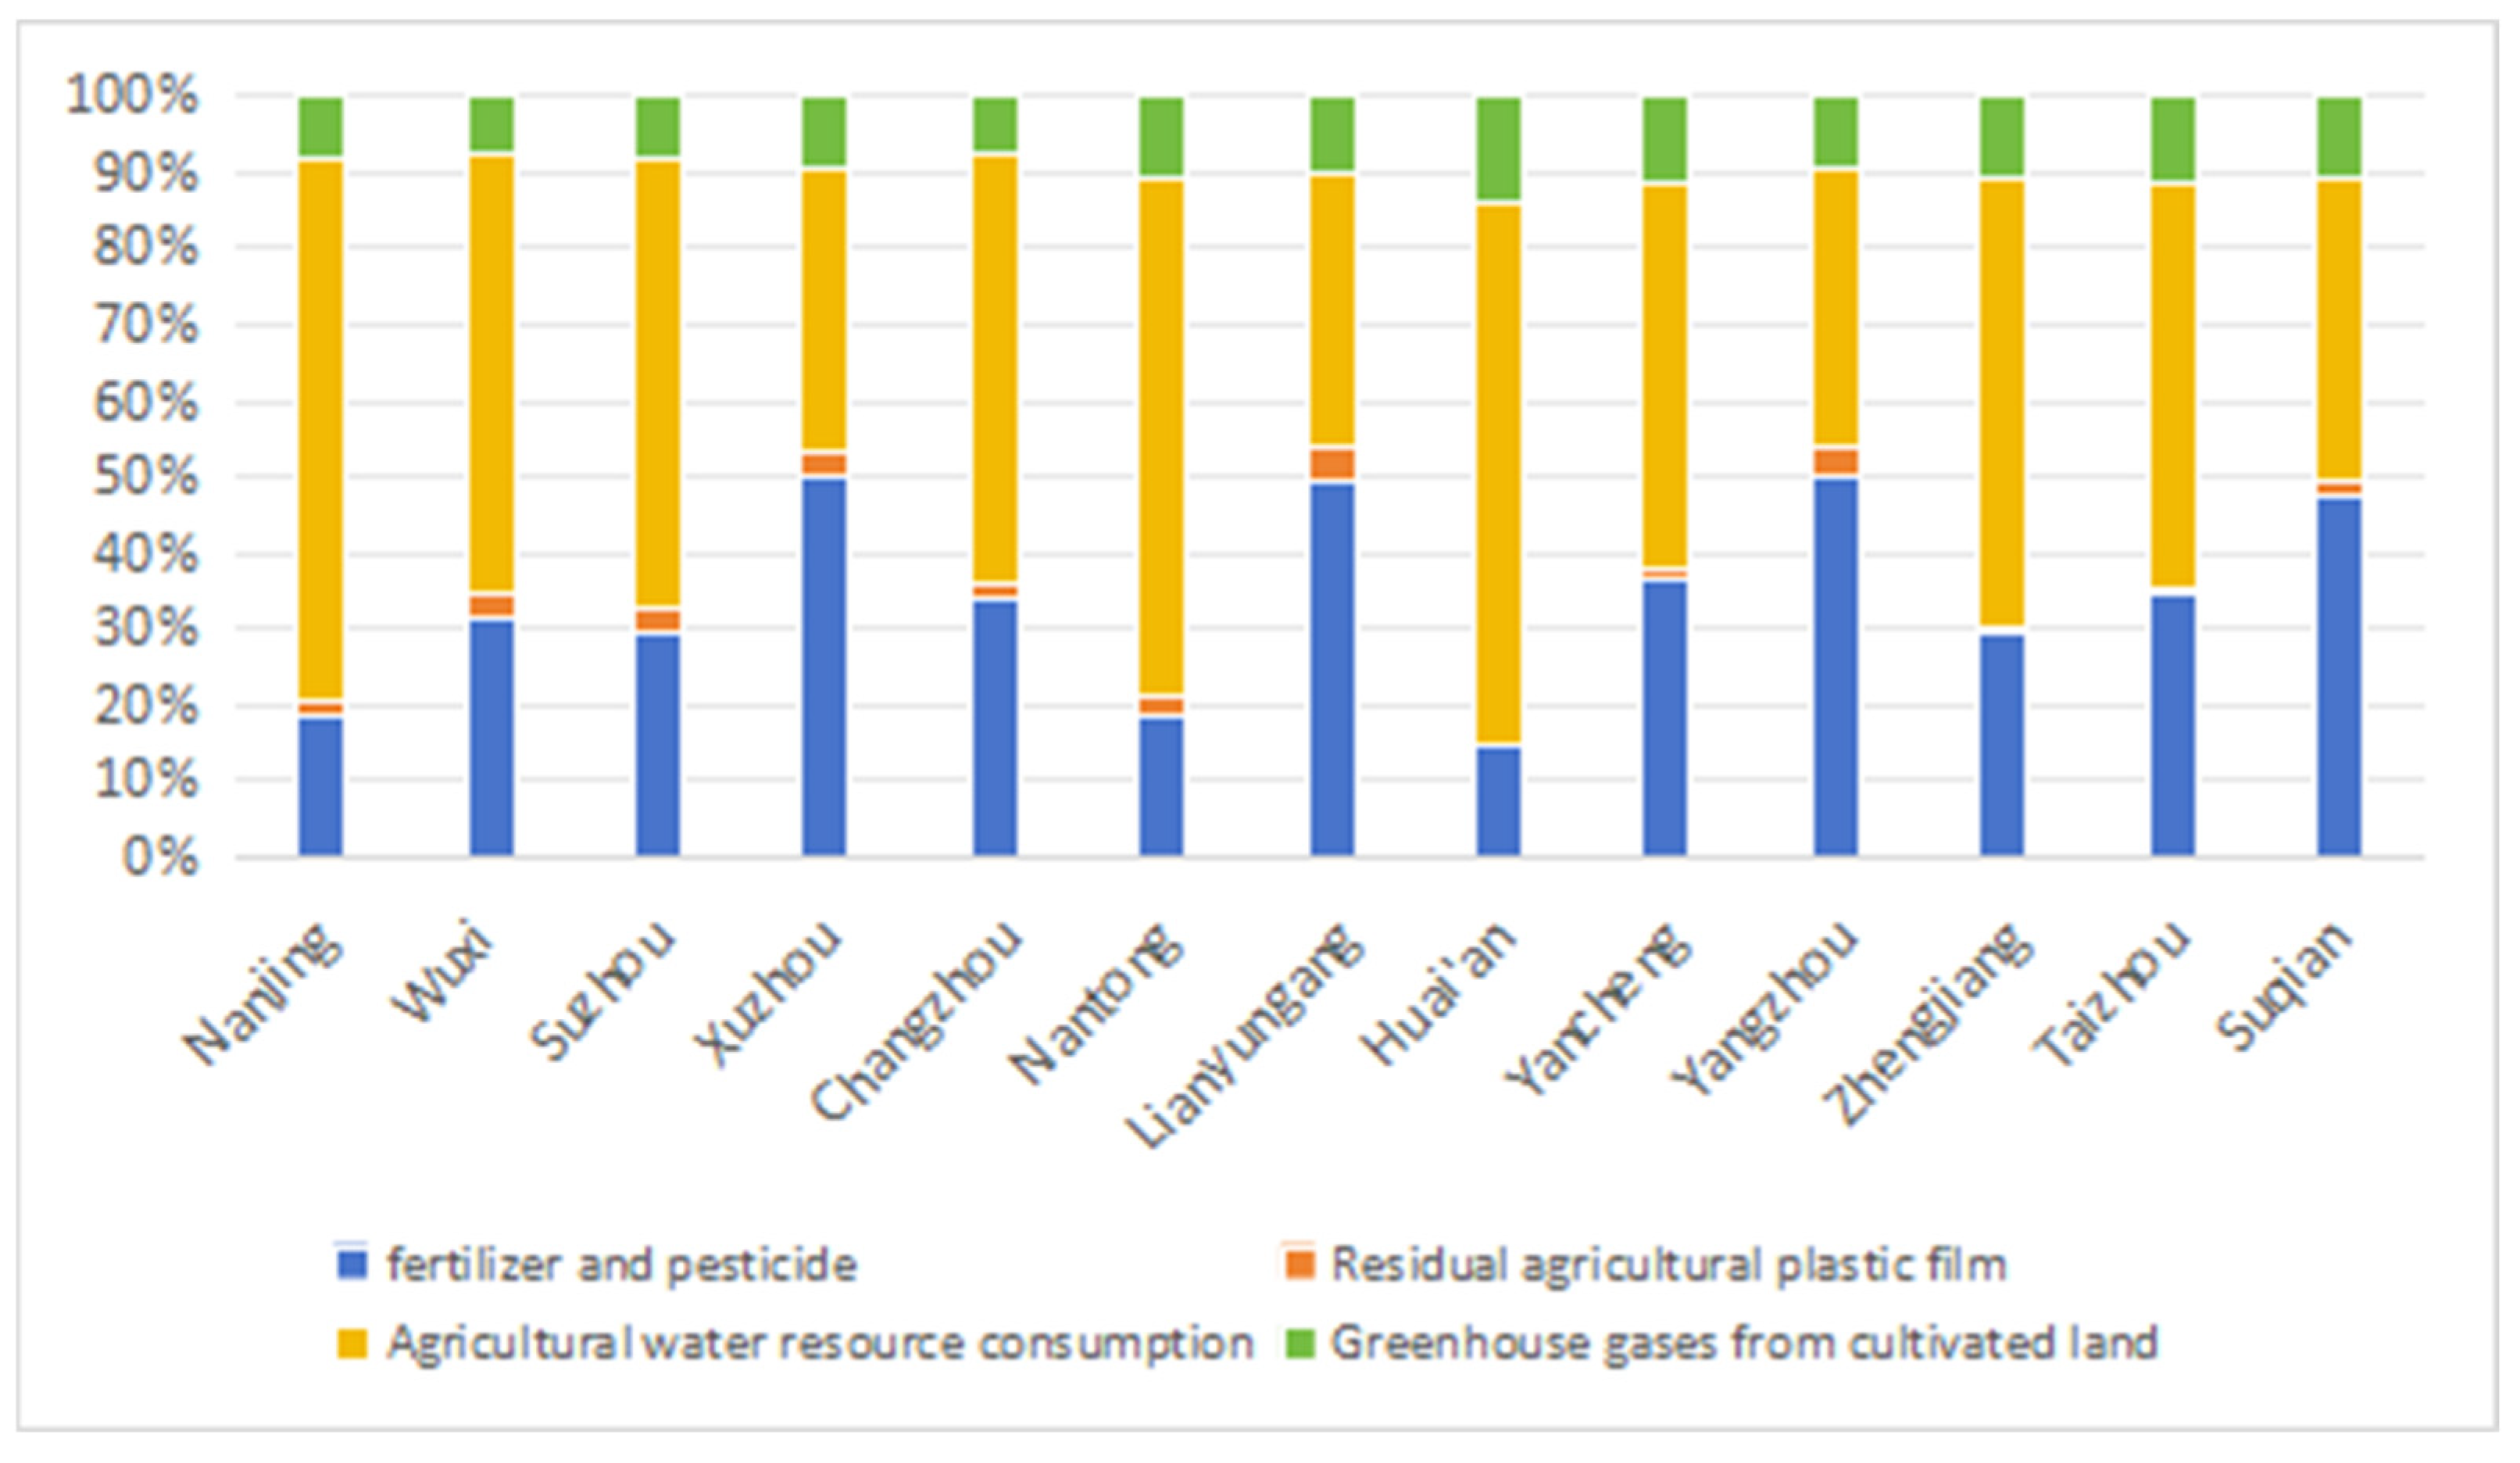
3.2. Calculation Results of Negative Value of Cultivated Land Ecosystem Services in Jiangsu Province

The negative values of cultivated land ecosystem services comprise four key components: negative value from chemical inputs (fertilizers and pesticides), negative value from agricultural water consumption, negative value from residual agricultural plastic mulch, and negative value from greenhouse gas emissions. (1) Negative value from chemical inputs: The regional negative values in 2022 were calculated using Equation (4), revealing significant spatial disparities. Yangzhou exhibited the highest negative value at 6675 CNY/hm2, while Huaian recorded the lowest at 938 CNY/hm2 (Table 4). (2) Negative value from agricultural water consumption: The regional negative values in 2022 were quantified using Equation (5), with Nanjing exhibiting the highest value (8706 CNY/hm2) and Xuzhou the lowest (4111 CNY/hm2) (Table 4). (3) Negative value from residual agricultural plastic mulch: The 2022 negative values were calculated using Equation (6), revealing substantial regional variation. Lianyungang exhibited the highest impact (529 CNY/hm2), while Huaian showed negligible effects (4 CNY/hm2). (4) Negative value from greenhouse gas emissions: ① Methane (CH4) emissions: The negative value was derived by quantifying CH4 emissions using Formula (9). The CH4 emission coefficients for rice cultivation were sourced from Wang Mingxing’s China Agricultural Statistics, adopting the weighted average values for early rice, late rice, and mid-season rice varieties. Following the quantification of regional CH4 emissions, Formula (7) was applied to derive the 2022 negative values of CH4 across prefecture-level cities in Jiangsu Province (Table 5). For the Regional Disparities in Negative Valuation, the analysis revealed significant spatial variation, with Huaian exhibiting the highest negative value (756 CNY/hm2) and Xuzhou showing the lowest impact (359 CNY/hm2). ② The N2O emissions were quantified using Equation (10). The emission coefficients for N2O were derived from the existing literature, with the coefficients and emission fluxes for wheat calculated as the average values for winter wheat and spring wheat. Following the determination of N2O emissions, the associated negative economic value was calculated using Formula (7) (Table 5). The analysis revealed significant spatial heterogeneity in N2O-induced negative values, with Xuzhou exhibiting the highest impact (692 CNY/hm2) and Huaian demonstrating the lowest valuation (154 CNY/hm2). Aggregate Assessment of Greenhouse Gas Externalities. The total negative value of greenhouse gases was derived by summing the individual externalities from CH4 and N2O emissions. Regional analysis revealed Yangzhou as the highest-impact area (1274 CNY/hm2), while Nantong exhibited the lowest valuation (695 CNY/hm2), as detailed in Table 5. ③ Total negative value: The majority of regions exhibited total negative values exceeding 10,000 CNY/hm2, with only Nantong, Huaian, and Yancheng falling below this threshold. However, regional disparities remained moderate overall, with Changzhou representing the highest-impact area (14,751 CNY/hm2) and Huaian the lowest (6270 CNY/hm2), demonstrating an approximate two-fold difference.
Based on the previously calculated component-specific and aggregate negative values, the proportional contributions of each component were derived (Figure 2). The analysis reveals that the current negative values in cultivated land ecosystem services are predominantly driven by chemical fertilizer/pesticide application and agricultural water consumption. Notably, Changzhou exhibited the highest combined share (91%) for these two dominant externality sources. Yangzhou exhibited the highest proportional contribution from chemical inputs (fertilizers/pesticides) at 50.37%. Agricultural water consumption represented the largest share (71.12%) in Nanjing, residual agricultural film reached its peak contribution (4.61%) in Lianyungang, and greenhouse gas emissions accounted for the maximum proportion (11.37%) in Taizhou. The lowest negative value of fertilizer and pesticide was 14.63%, in Huaian City. The lowest negative value of agricultural water resource consumption was 36.00%. The negative value of residual agricultural mulch was 0.06%, in Huaian City. The lowest negative value of greenhouse gases was 7.42%, in Changzhou.

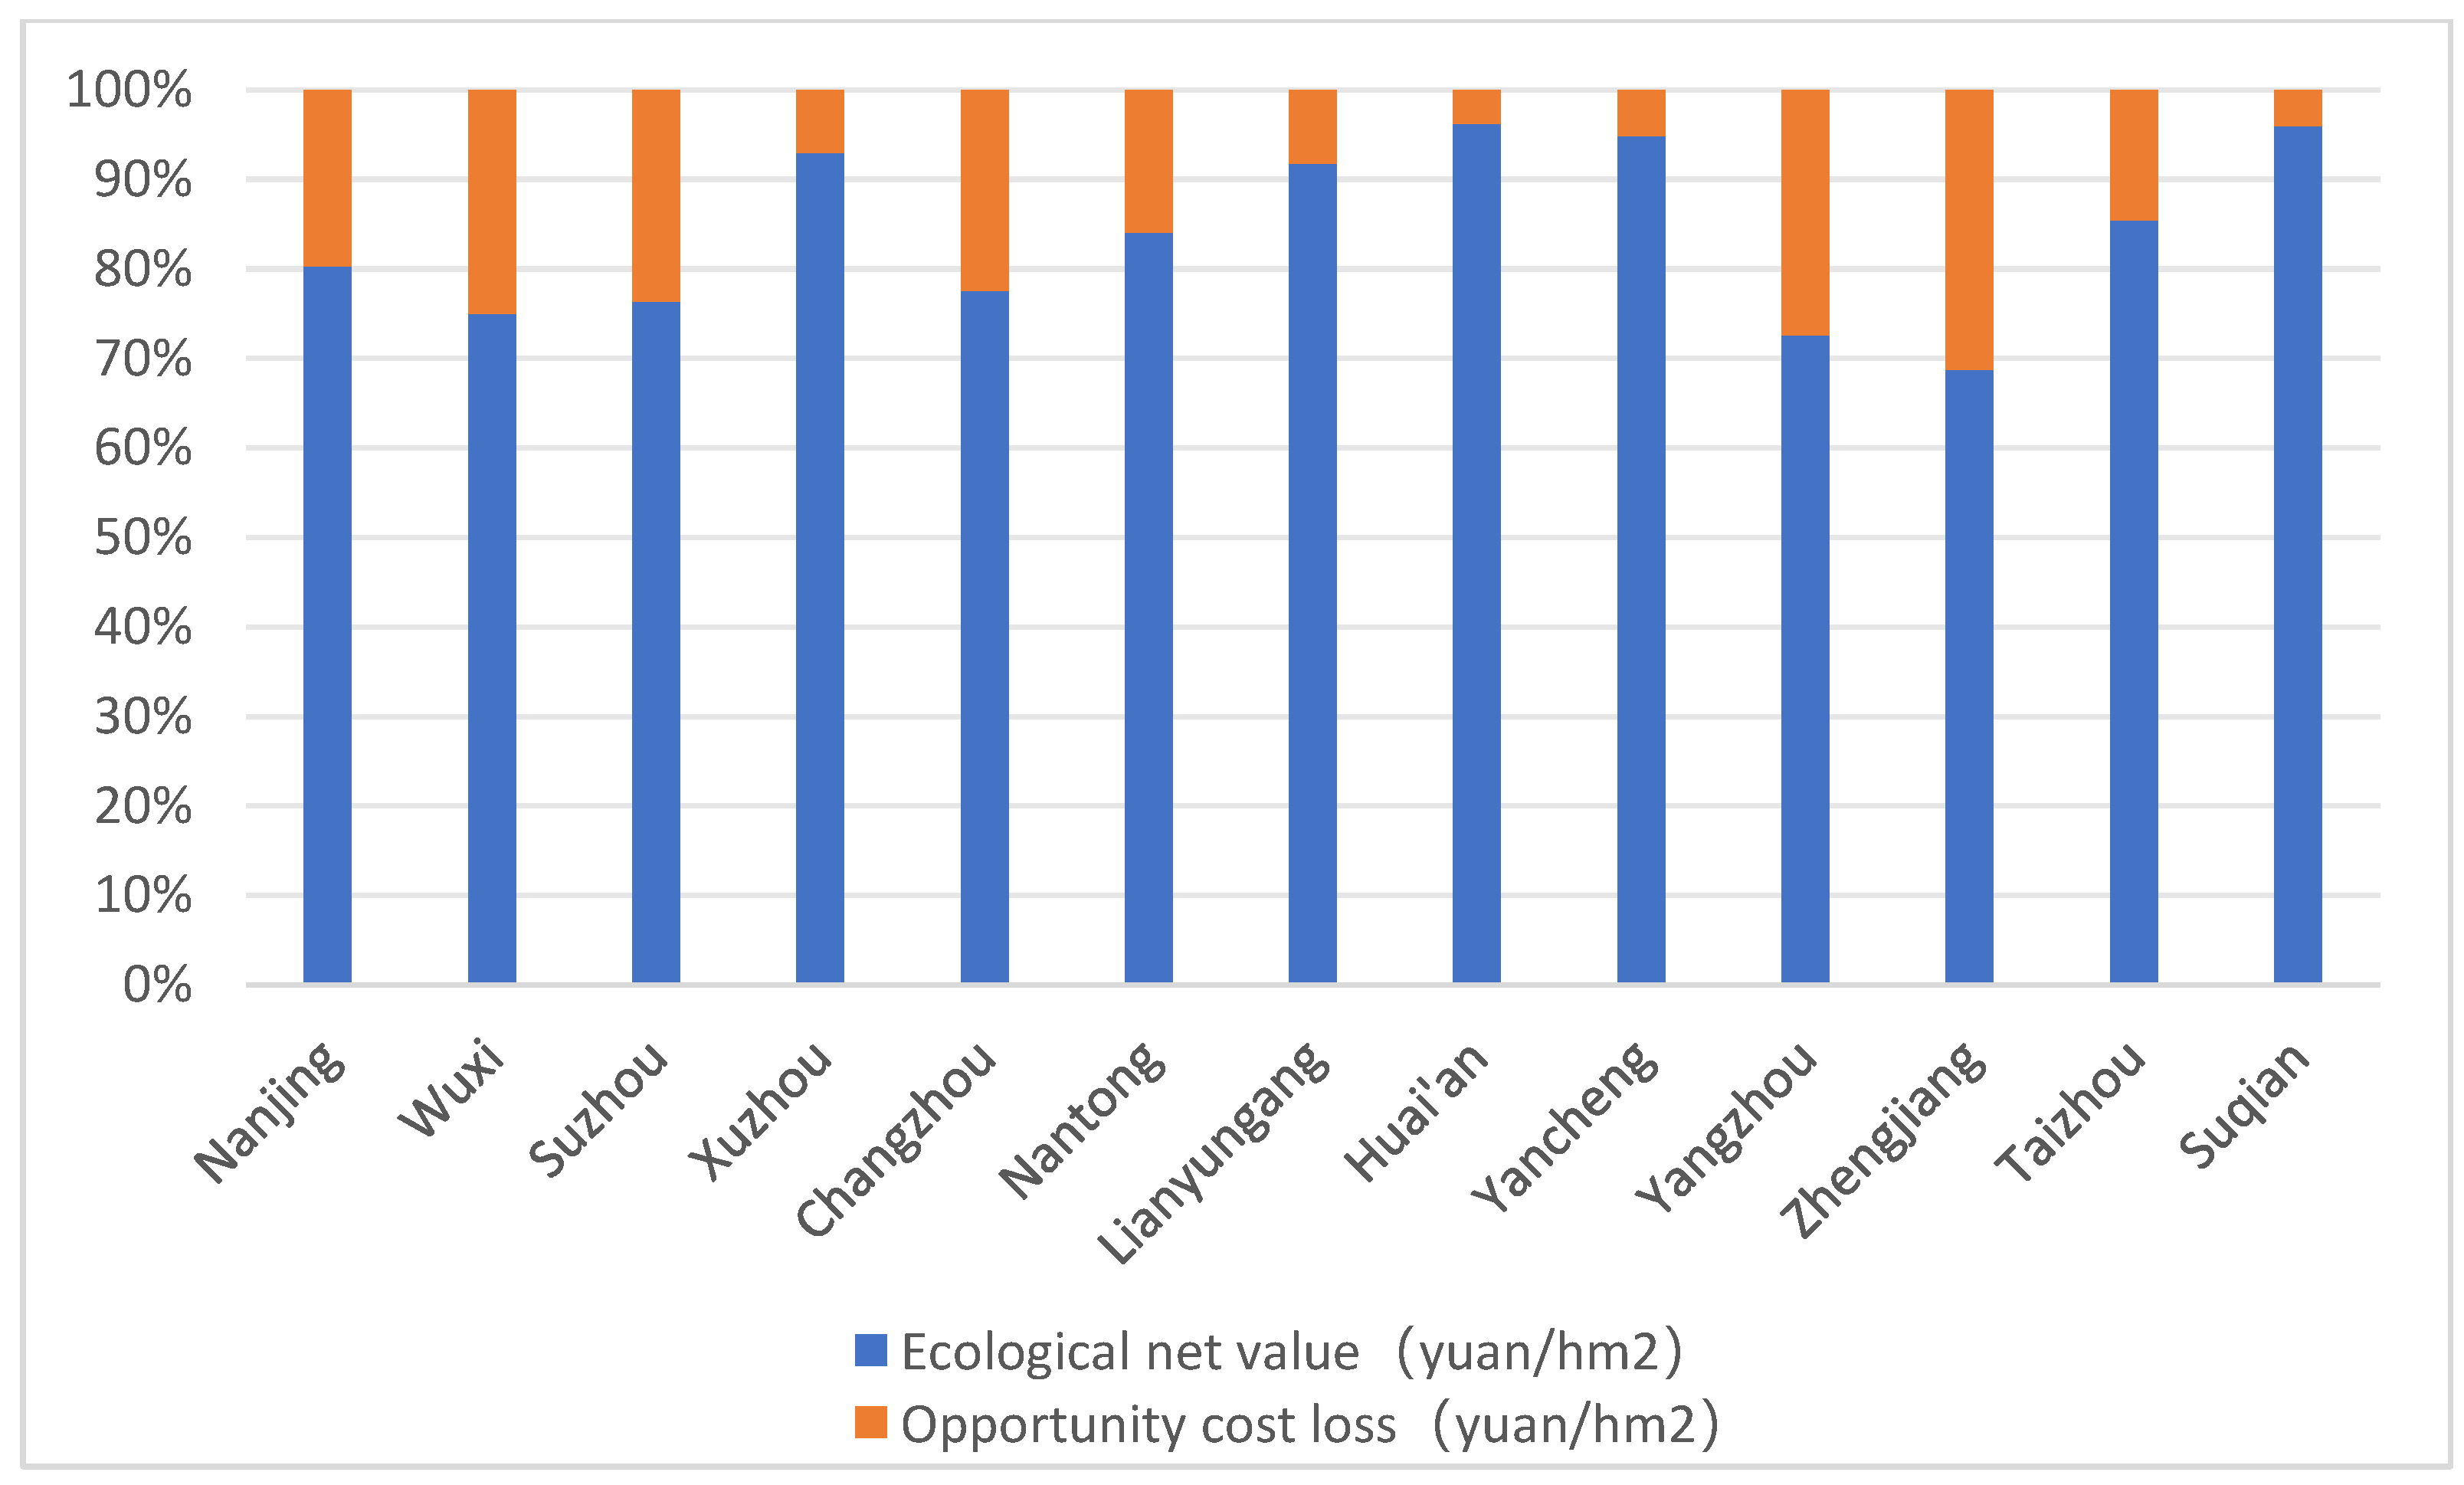
3.3. Loss of Opportunity Cost for Cultivated Land Protection in Jiangsu Province

The procedural steps for quantifying the opportunity cost associated with cultivated land preservation are as follows: ① Net revenue from land conveyance (P1): Data sources include the Official statistics from the Central People’s Government of China and the 2023 China Natural Resources Statistical Bulletin. Key Parameters (2022) are as follows: Total conveyance area of state-owned construction land is 307,000 hectares. Aggregate net revenue from land conveyance is 311.8 billion CNY. The Derived Unit Value is National average net revenue per hectare: 1,015,600 CNY/hm2. The net proceeds from land sales in various regions for 2022 were then adjusted based on both the national per capita GDP and the regional per capita GDP. The highest regional net proceeds from land sales were recorded in Wuxi City, at CNY 2.3623 million per hectare, while the lowest were observed in Suqian City, at CNY 1.0789 million per hectare. ② The deed tax on land use right transfers (P2) = Transaction price of land use rights/9 × 3%. This calculation is based on the transaction price of land use rights, with the 3% tax rate derived from the Deed Tax Law of the People’s Republic of China. Due to the unavailability of regional land use right transfer transaction prices for 2022, the transaction prices for various regions in 2022 were estimated by adjusting Jiangsu Province’s 2022 land use right transfer transaction prices using the ratio of Jiangsu’s 2022 per capita GDP to each region’s 2022 per capita GDP. Meanwhile, the price level for converting cultivated land to construction land approximates that of designated towns. The average land price in urban-rural fringe areas (including designated towns) is approximately one-ninth of the urban land price level [39]. Finally, the deed tax on land use right transfers for each region in 2022 was calculated. The highest rate was observed in Nanjing, at 414,400 CNY/hm2, while the lowest was recorded in Suqian City, at 106,200 CNY/hm2. ③ Cultivated land occupation tax (P3): The tax rates were primarily determined based on the applicable tax schedule for Jiangsu Province. ④ Yield of grain per unit area: This section primarily calculates grain prices based on the average prices of wheat, rice, corn, and soybeans, multiplied by the grain yield per unit area. Based on the previously calculated P1, P2, and P3 values, substitution into Equation (11) yields the differential between unit construction land revenue and average grain yield revenue, representing the opportunity cost loss of cultivated land protection across Jiangsu’s regions (Table 6). The highest opportunity cost loss was observed in Wuxi City, at 38,400 CNY/hm2, while the lowest was recorded in Suqian City, at 4200 CNY/hm2.

3.4. Calculation of Compensation Standard for Contracted Farmers in Jiangsu Province

Contracting households engaged in land transfer primarily undertake cropland protection functions, with compensation standards primarily based on opportunity cost losses. The compensation standards for these households were calculated and adjusted according to Equations (13)–(15), as presented in Table 7. The regions with compensation standards exceeding 10,000 CNY/ha include Nanjing (11,727.35 CNY/hm2), Wuxi (11,664.05 CNY/hm2), and Suzhou (11,340.87 CNY/hm2). The areas with the lowest compensation standards were Yancheng (2110.76 CNY/hm2), Huaian (2077.60 CNY/hm2), and Suqian (1226.27 CNY/hm2), in descending order. As illustrated in Figure 3, the compensation standards for contracted farming households engaged in land transfer exhibit a distinct spatial gradient, with higher values observed in southern Jiangsu compared to northern Jiangsu, demonstrating an overall decreasing trend from south to north. Among these regions, seven areas exceeded the provincial average compensation level, including five located in Sunan and two in central Jiangsu—specifically Yangzhou and Nantong.
The compensation standard for non-transferring contracted farming households incorporates not only the opportunity cost losses arising from cropland protection but also the ecological value generated as a byproduct of agricultural cultivation. First, the calculation of net ecological value: the difference between positive and negative values constitutes the net ecological value. All regions exhibited positive values exceeding negative values, with net ecological values surpassing 100,000 CNY/hm2, except for Lianyungang, Yangzhou, and Zhenjiang, where values fell below this threshold. Subsequently, the compensation standard for non-transferring contracted farming households was derived by adjusting the sum of net ecological value and opportunity cost losses, calculated according to Equations (12)–(14) (Table 7). The highest compensation standards were recorded in Nanjing (59,545 CNY/hm2), Xuzhou (55,766 CNY/hm2), and Huaian (54,604 CNY/hm2). Conversely, the lowest compensation levels were observed in Lianyungang (21,787 CNY/hm2), Zhenjiang (23,608 CNY/hm2), and Yangzhou (24,802 CNY/hm2), listed in ascending order. Figure 4 demonstrates that the compensation standards in southern Jiangsu are generally higher, with the exception of Zhenjiang, while northern Jiangsu exhibits substantial variation across regions. Overall, the spatial heterogeneity of compensation standards for non-transferring contracted farming households in Jiangsu Province is more pronounced, differing from the “high in the south and low in the north” gradient pattern observed among transfer contracted farming households. Zhenjiang in southern Jiangsu was the only city with compensation below the provincial average of 40,604 CNY/hm2 for non-transferring contracted farmers. In central Jiangsu, Yangzhou and Taizhou, along with Lianyungang and Suqian in northern Jiangsu, all fell below this provincial average standard. As observed in Figure 5, the compensation standards for non-transferred contracted rural households are predominantly based on ecological net value, accounting for over 50% of the total in all regions, while opportunity costs consistently represent less than 50%. Notably, the proportion of opportunity costs in the compensation standards for non-transferred households is lowest in the regions of Huaian, Yancheng, Suqian, and Xuzhou.
A comparison of compensation standards between transferred and non-transferred contracted rural households: (1) Differences in compensation calculation criteria. Non-transferred households, which directly invest in agricultural production on their contracted farmland, have compensation standards calculated by considering both opportunity cost losses and the ecological net value generated from agricultural outputs. Consequently, the compensation standards for non-transferred households are generally higher than those for transferred households. In Jiangsu Province, the average compensation standard for non-transferred households is 40,604 CNY/hm2, whereas for transferred households, it is 6275.79 CNY/hm2. (2) Manifestations of spatial heterogeneity. The compensation standards for transferred and non-transferred contracted rural households exhibit distinct spatial patterns across Jiangsu Province. Compensation standards for transferred households generally show a gradual south-to-north gradient decrease. In contrast, non-transferred households demonstrate stronger spatial heterogeneity, with higher compensation levels in Southern Jiangsu (Su’nan) and significant disparities between Northern Jiangsu (Subei) and Central Jiangsu (Suzhong). (3) Causes of spatial heterogeneity. First, the regional disparities in compensation standards between the two types of contracted households primarily stem from differences in compensation criteria. Transferred households are compensated based on opportunity cost losses, whereas non-transferred households receive compensation that incorporates both opportunity cost losses and ecological net value. Second, there are regional disparities in the distribution of contracted land transfers among rural households. As shown in Figure 6, the regional variations in contracted land transfers align closely with per capita GDP trends. Areas with higher economic development levels exhibit relatively higher land use rights transfer prices and greater income from land transactions, corresponding to increased opportunity costs incurred. Consequently, compensation standards for contracted land transfers progressively decrease from southern to northern regions. Third, there are regional disparities in the distribution of non-transferred contracted rural households. As shown in Figure 5, the net ecological value constitutes the primary component of compensation standards for non-transferred contracted land, with regional differences closely linked to the ecological value associated with agricultural production. When both the ecological value generated by grain production and the opportunity cost losses are relatively high, compensation standards are correspondingly elevated; conversely, when both factors are lower, compensation standards are proportionally reduced. Grain yield per unit area was selected as an indicator to represent the ecological value of grain production. The study found that the compensation standards for non-transferred contracted farming households closely align with the Regional resource endowment. However, when opportunity cost losses are significant, the aggregated compensation standard becomes moderate (Figure 7).

4. Discussion

Existing domestic research on the calculation of cultivated land ecological compensation standards primarily targets farmers, yet it fails to clearly distinguish between contractual right holders and operational right holders. There is even less exploration of the differentiated contributions among different right holders in ecological compensation, making it difficult to implement precise compensation and hindering equitable distribution of compensation benefits. Secondly, current calculation methods mainly focus on either ecological valuation approaches or opportunity cost methods, with rare integration of these two theoretical frameworks. Sole reliance on opportunity cost leads to underestimated compensation standards that fail to cover contributors’ losses, while exclusive use of ecological valuation results in overestimated standards with poor operational feasibility. This study takes contractual right holders as the calculation subject, integrates the opportunity cost method and ecological valuation approach within a unified analytical framework, and simultaneously considers the negative values generated by cultivated land. Using Jiangsu Province as a case study, it explores cultivated land ecological compensation standards under the “Separation of Three Rights” system, addressing current research deficiencies. The calculated compensation standard for contracted farmers with land transfer (6300 CNY/ha) aligns closely with Suzhou City’s current standard, while the calculated standard for non-transfer contracted farmers significantly exceeds existing implementation levels. As the compensation calculation results are static, further exploration is required regarding funding supply mechanisms, distribution methods, adjustment mechanisms, differentiated compensation implementation for contracted farmers, and the establishment of dynamic adjustment mechanisms.
(1)
Compensation for Transferred Contracted Farmers Based on Opportunity Cost: This compensation mechanism is primarily government funded. It involves establishing multi-level government compensation schemes, where municipal and district governments contribute proportionally, or creating a cultivated land protection special fund. Tiered compensation standards are formulated based on regional development levels. Funds are centrally allocated to rural communities and distributed proportionally to village collectives and contracted farmers, incentivizing farmer collectives to engage in cultivated land protection.
(2)
Non-transferred contracted farmers, based on ecological value and opportunity cost loss compensation: The establishment of a government-market-community collaborative compensation mechanism is suggested, to alleviate fiscal pressure on the government. Compensation for opportunity cost losses can be achieved through government compensation; compensation for ecological value should be realized by improving the market trading platform for ecological products, leveraging the community co-governance mechanism to exercise ownership rights, implementing unified planning for rural ecological products with collective pricing, and utilizing the leveraging role of financial markets in rural economies. Equity participation mechanisms should be adopted to compensate contracted farmers, thereby sharing the government’s compensation burden.
(3)
Dynamic adjustment of compensation standards: The establishment of compensation standards for contracted farmers constitutes a key factor in balancing and coordinating the interests of the three rights holders in cultivated land ecological compensation. It must consider both the willingness to accept compensation and the payment capacity of local governments while also addressing regional disparities. Therefore, it is essential to introduce price mechanisms and implement dynamic adjustment mechanisms aligned with current economic development levels. By enhancing public participation, such approaches can ensure the effectiveness and sustainability of compensation policies.
(4)
Supporting measures: First, accelerate the certification of land contract rights to safeguard contracted farmers’ access to related benefits. Second, promote innovation in green development models by reducing chemical fertilizer and pesticide usage, mitigating negative impacts on cultivated land ecosystem services and increasing the supply of high-quality agricultural products. Third, optimize agricultural production layouts and advance ecological certification of agricultural products, achieving compensation for non-transferred contracted farmers through brand premium strategies.

5. Conclusions

This study primarily focuses on the subjects of contracted land-use rights, incorporating both the ecological value of cultivated land and opportunity cost losses into the calculation of compensation standards for these rights. By classifying and discussing the compensation basis for both transferred and non-transferred contracted farmers and considering the differences in contributions and the nature of rights among contracted, ownership, and management rights, the study aims to establish compensation standards for contracted farmers. This framework provides a foundation for rationally formulating ecological compensation policies for cultivated land under the “Separation of Three Rights” system. It also offers feasible solutions to address the questions of “what to compensate, whom to compensate, and how much to compensate”. Meanwhile, accurately calculating compensation standards for contracted farmers will help incentivize their enthusiasm for cultivated land protection, harmonize the productive and ecological functions of farmland, balance ecological security and food security in land resource utilization, and provide a basis for equitable benefit distribution among multiple right holders under the “Separation of Three Rights” system.
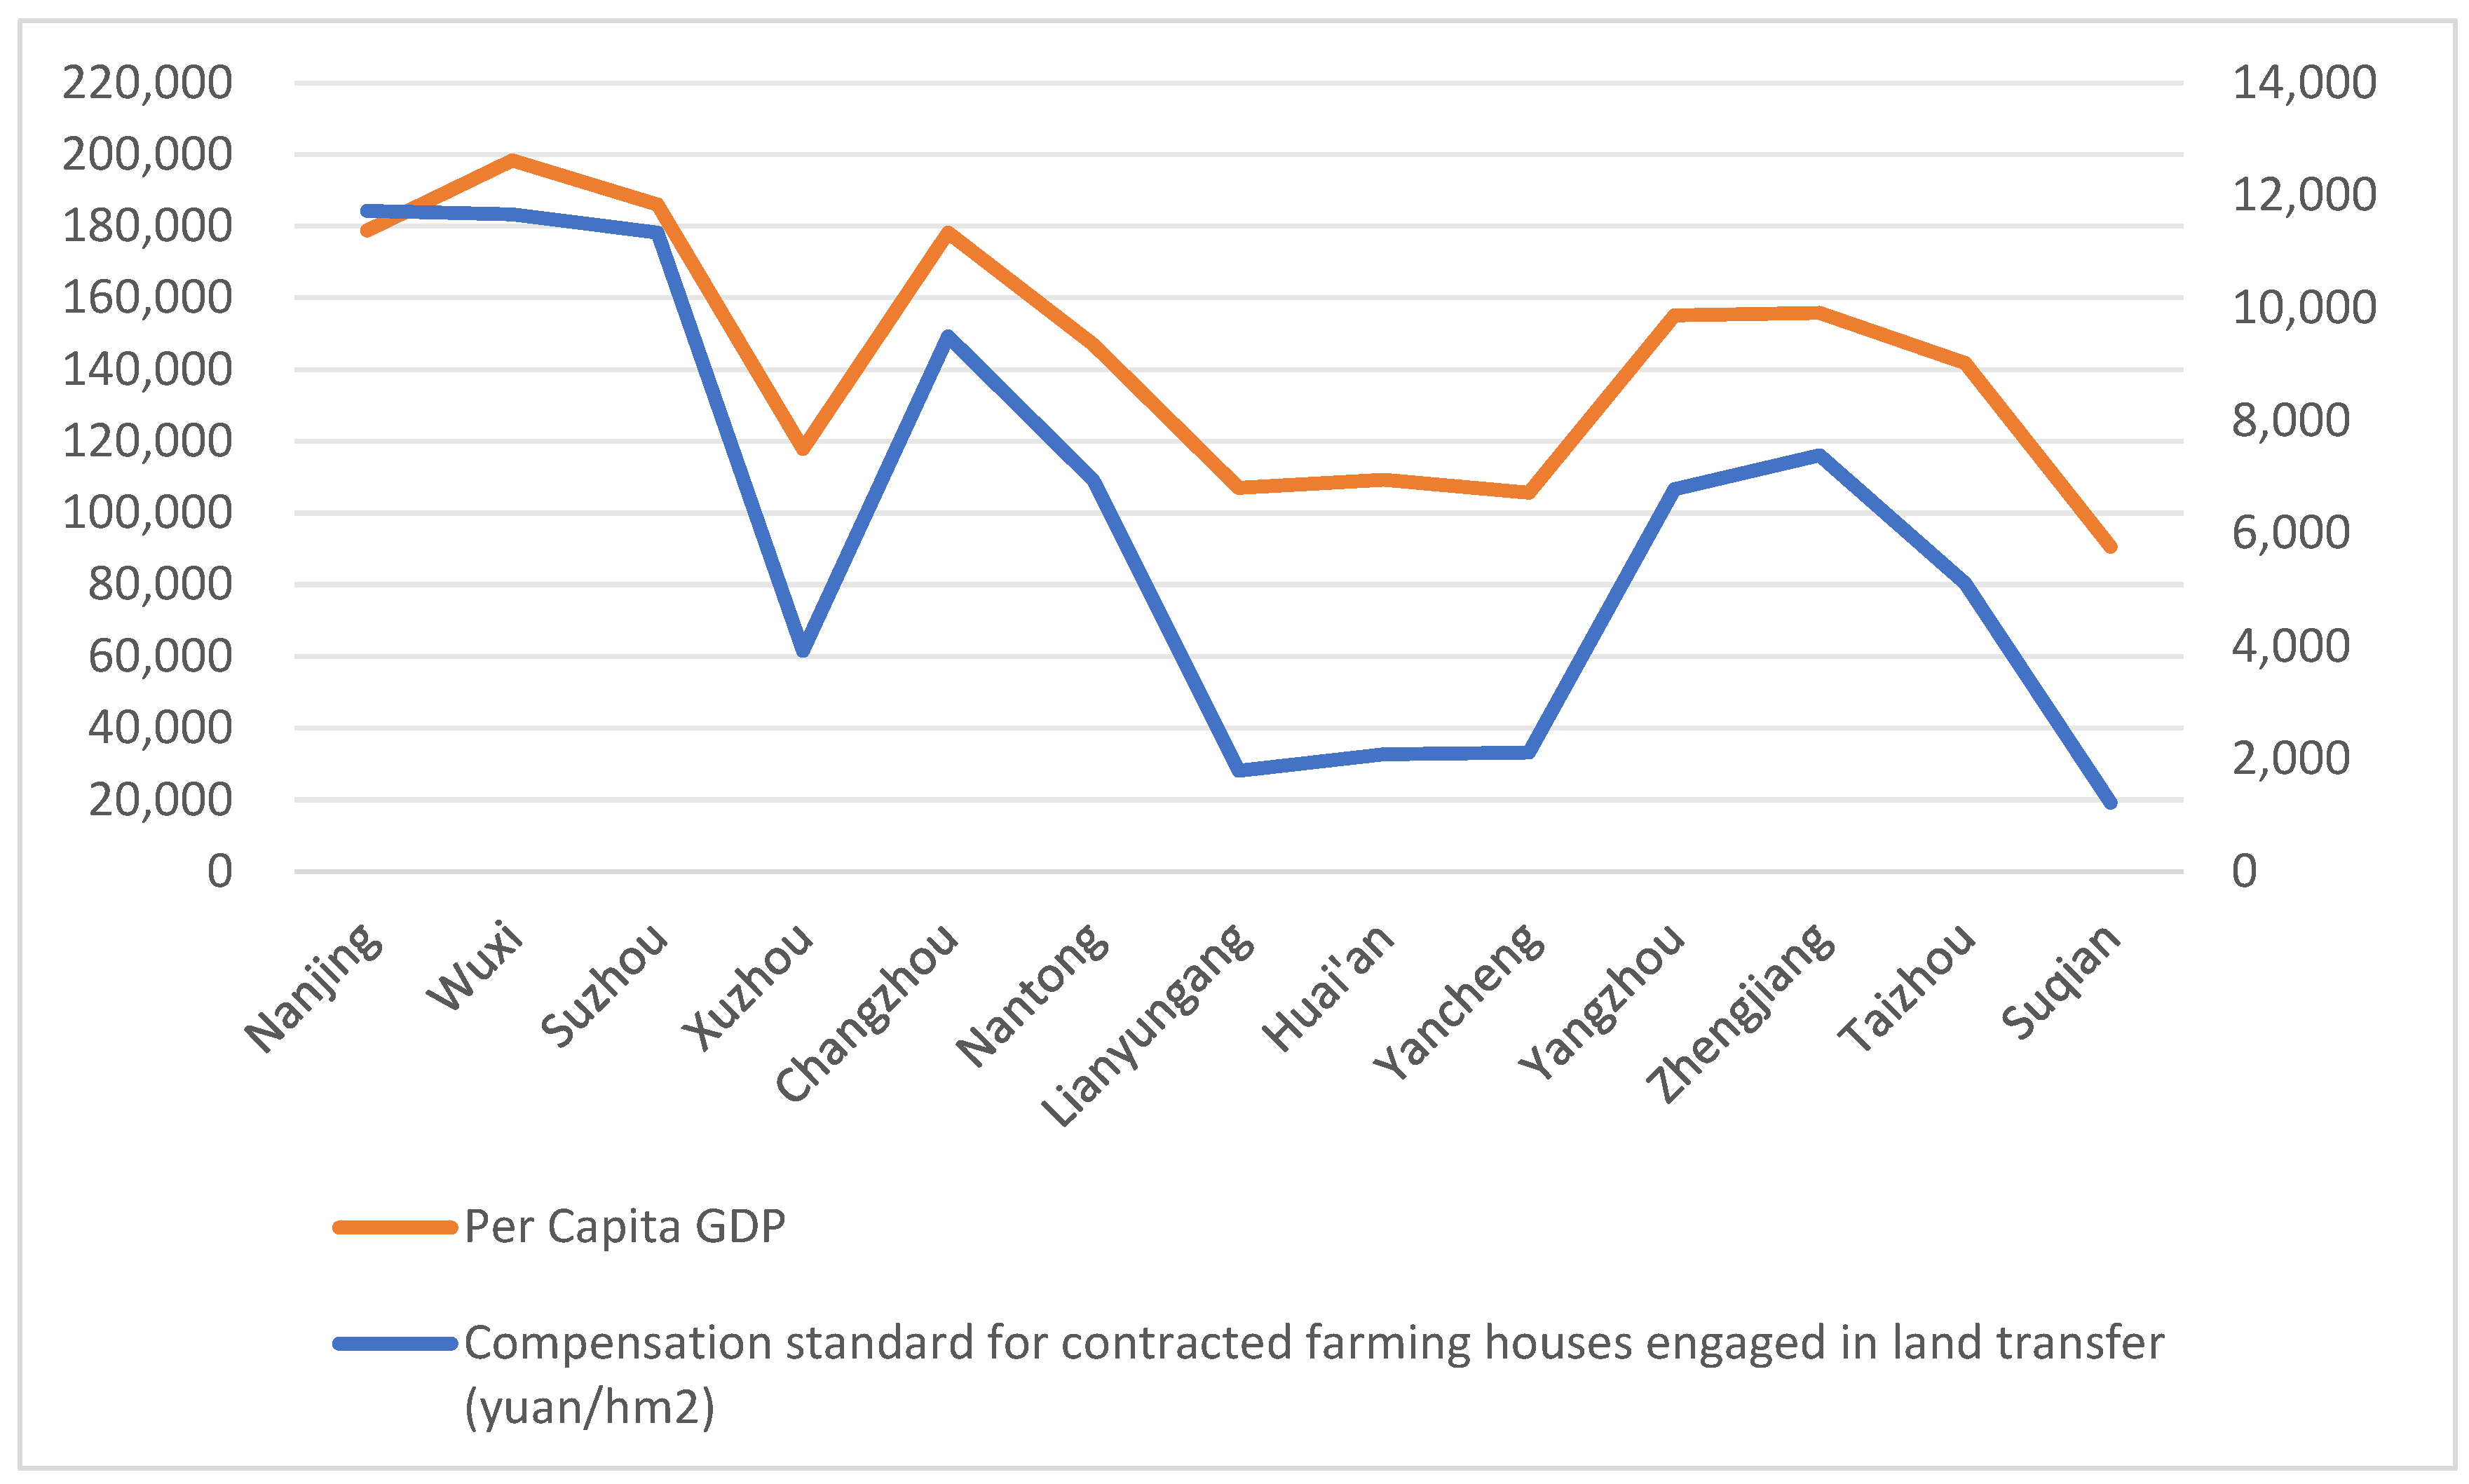
  • Contracted farming households engaged in land transfer: The compensation standard is primarily based on opportunity costs, calculated as the difference between the revenue generated from converting cultivated land to construction land and the income from grain market transactions. This compensates for the economic benefits lost due to foregone development opportunities resulting from cultivated land protection. For contracted farming households engaged in land transfers, since they do not directly invest in agricultural production on the contracted land, the ecological value associated with crop cultivation is excluded from the compensation standard. The calculation results reveal that only Nanjing, Wuxi, and Suzhou demonstrate compensation standards exceeding 10,000 CNY/ha for contracted farming households engaged in land transfers. The provincial average in Jiangsu stands at 6275.79 CNY/hm2.
  • Contracted farming households not engaged in land transfer: Compensation should encompass not only the ecological value associated with agricultural products but also the opportunity costs incurred. Ecological values associated with agricultural products encompass both positive and negative values, with their differential constituting the net ecological value. The assessment results of positive values demonstrate that cultivated land exhibits significant ecological value. The region with the highest positive value of cultivated land ecosystem services is Huaian City, at 192,300 CNY/hm2, while the lowest is Zhenjiang City, at 64,700 CNY/hm2. The negative values encompass those generated by chemical inputs, agricultural water consumption, residual plastic mulch, and greenhouse gas emissions, with fertilizer/pesticide use and agricultural water consumption constituting the predominant components. The average compensation standard for non-transferred contracted farmers within the region stands at 40,604 CNY/hm2, with the net ecological value constituting the predominant component.
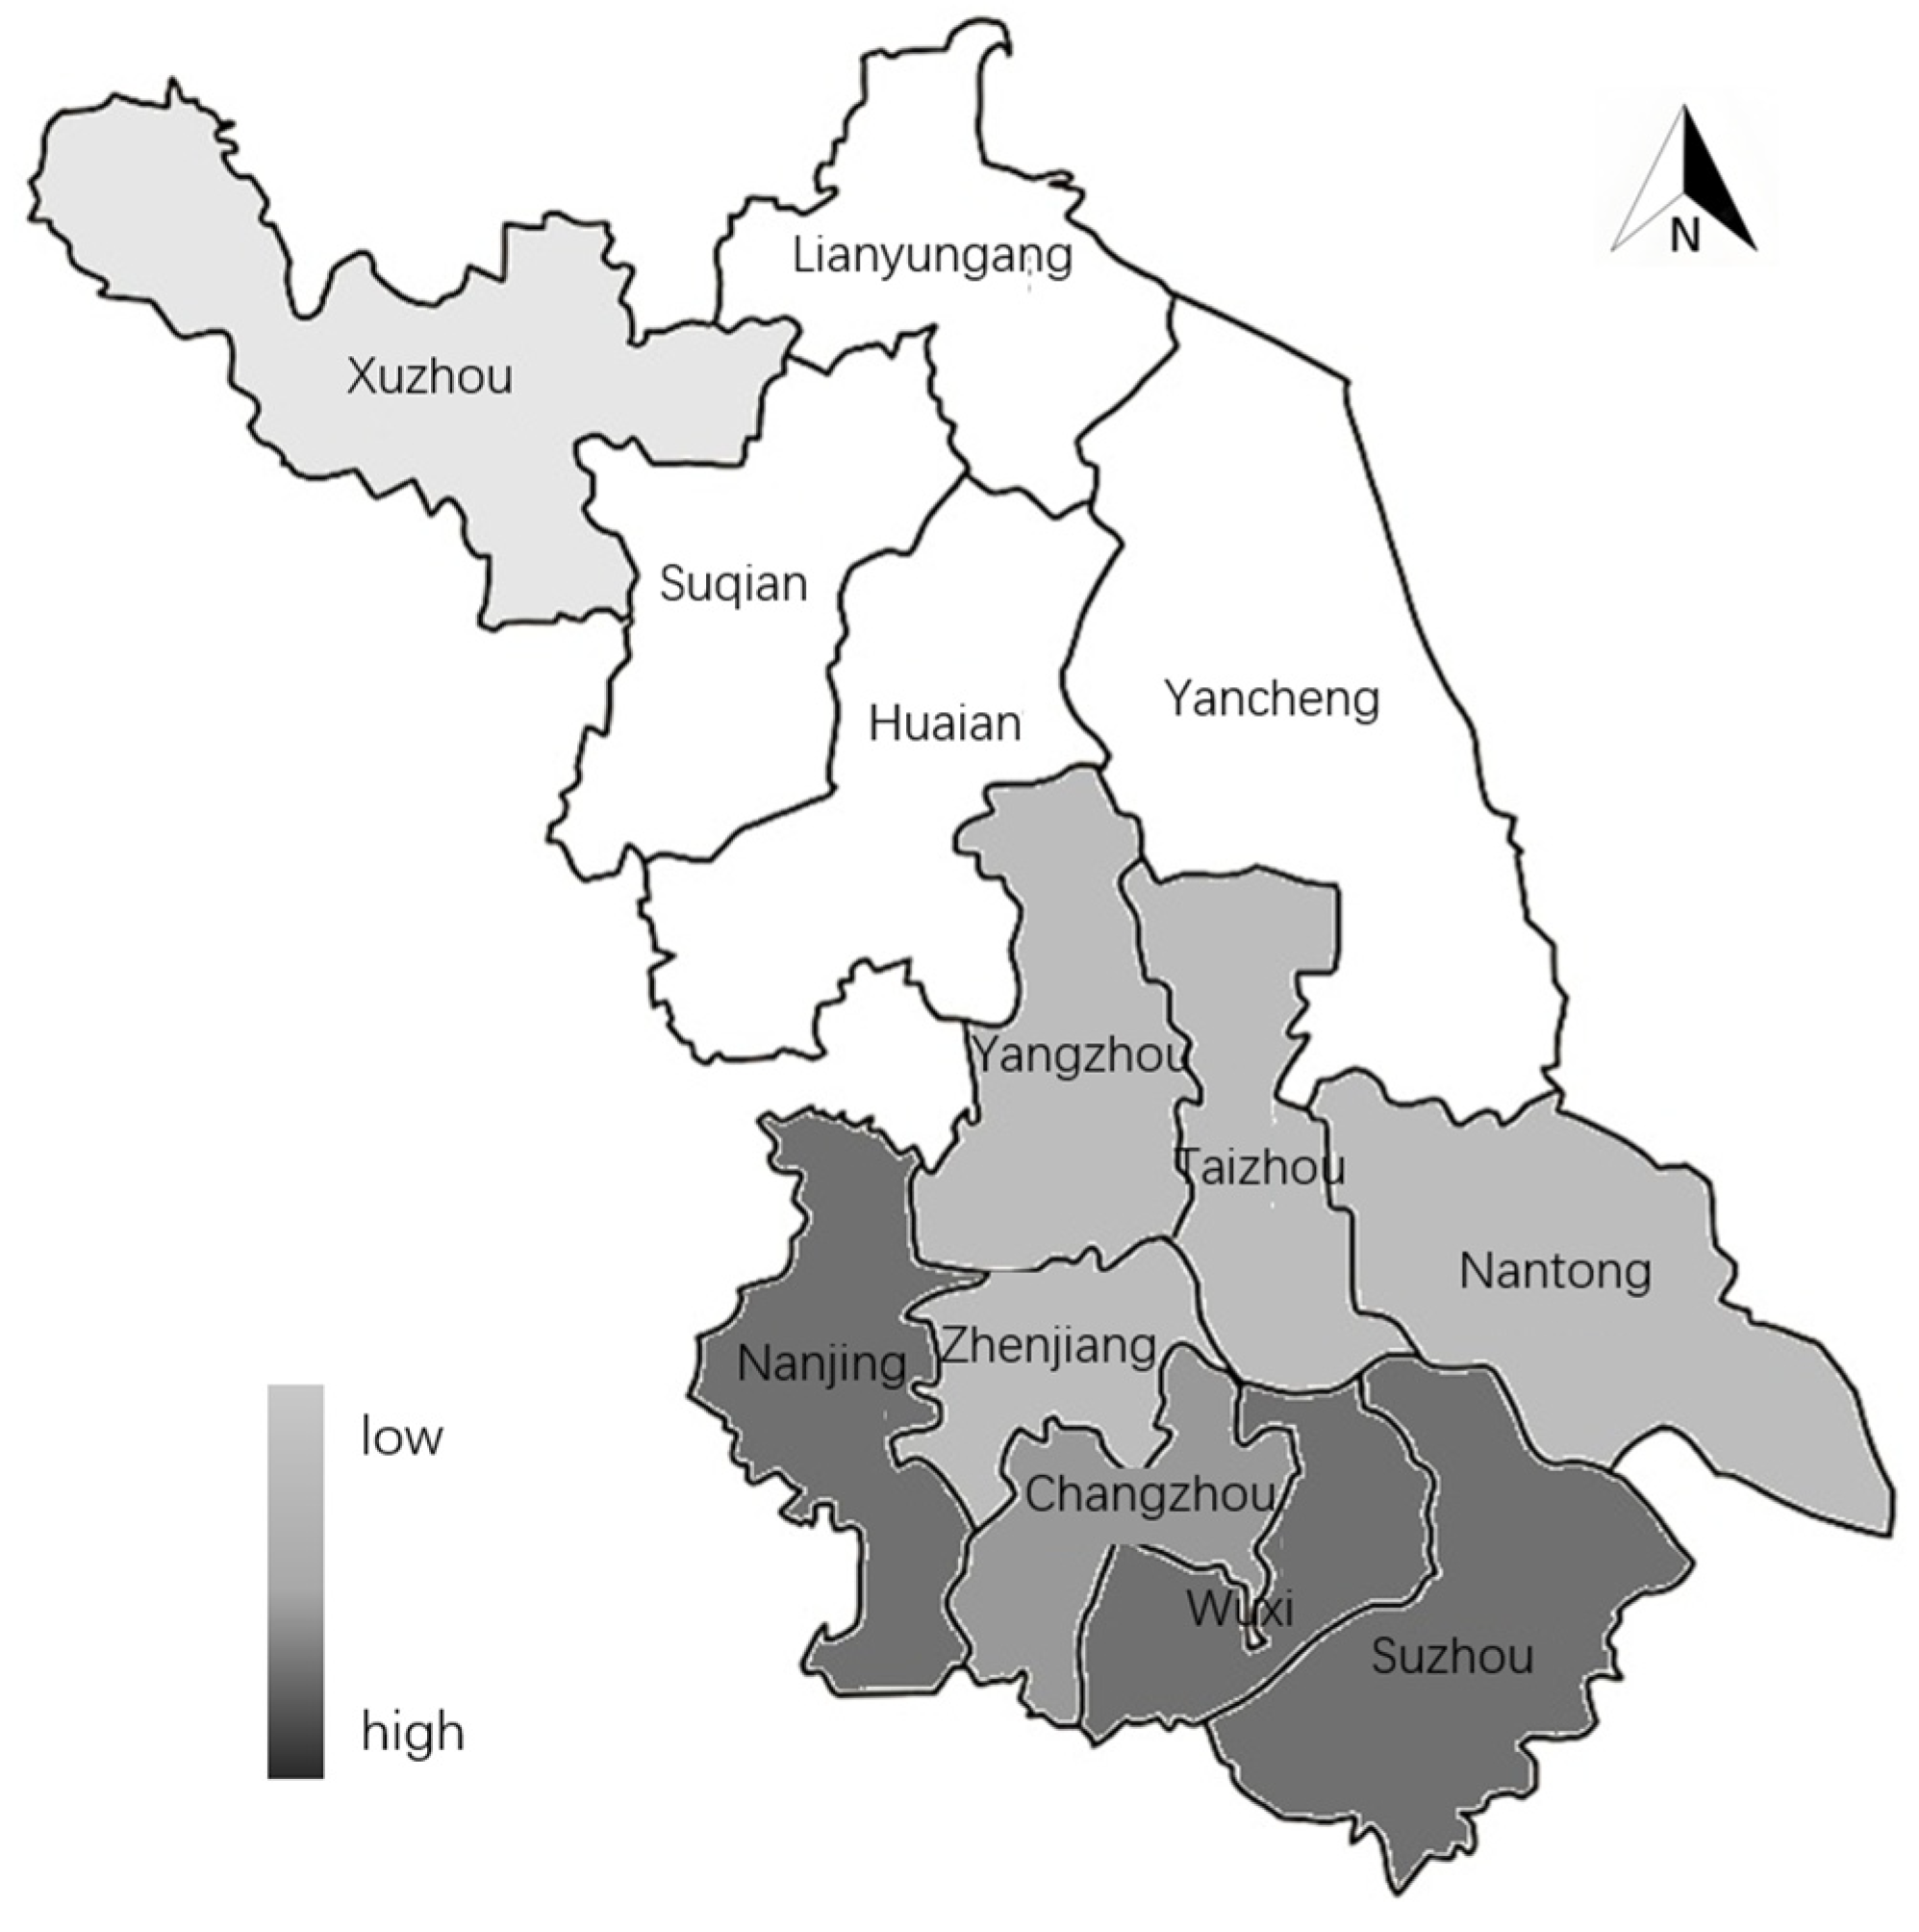
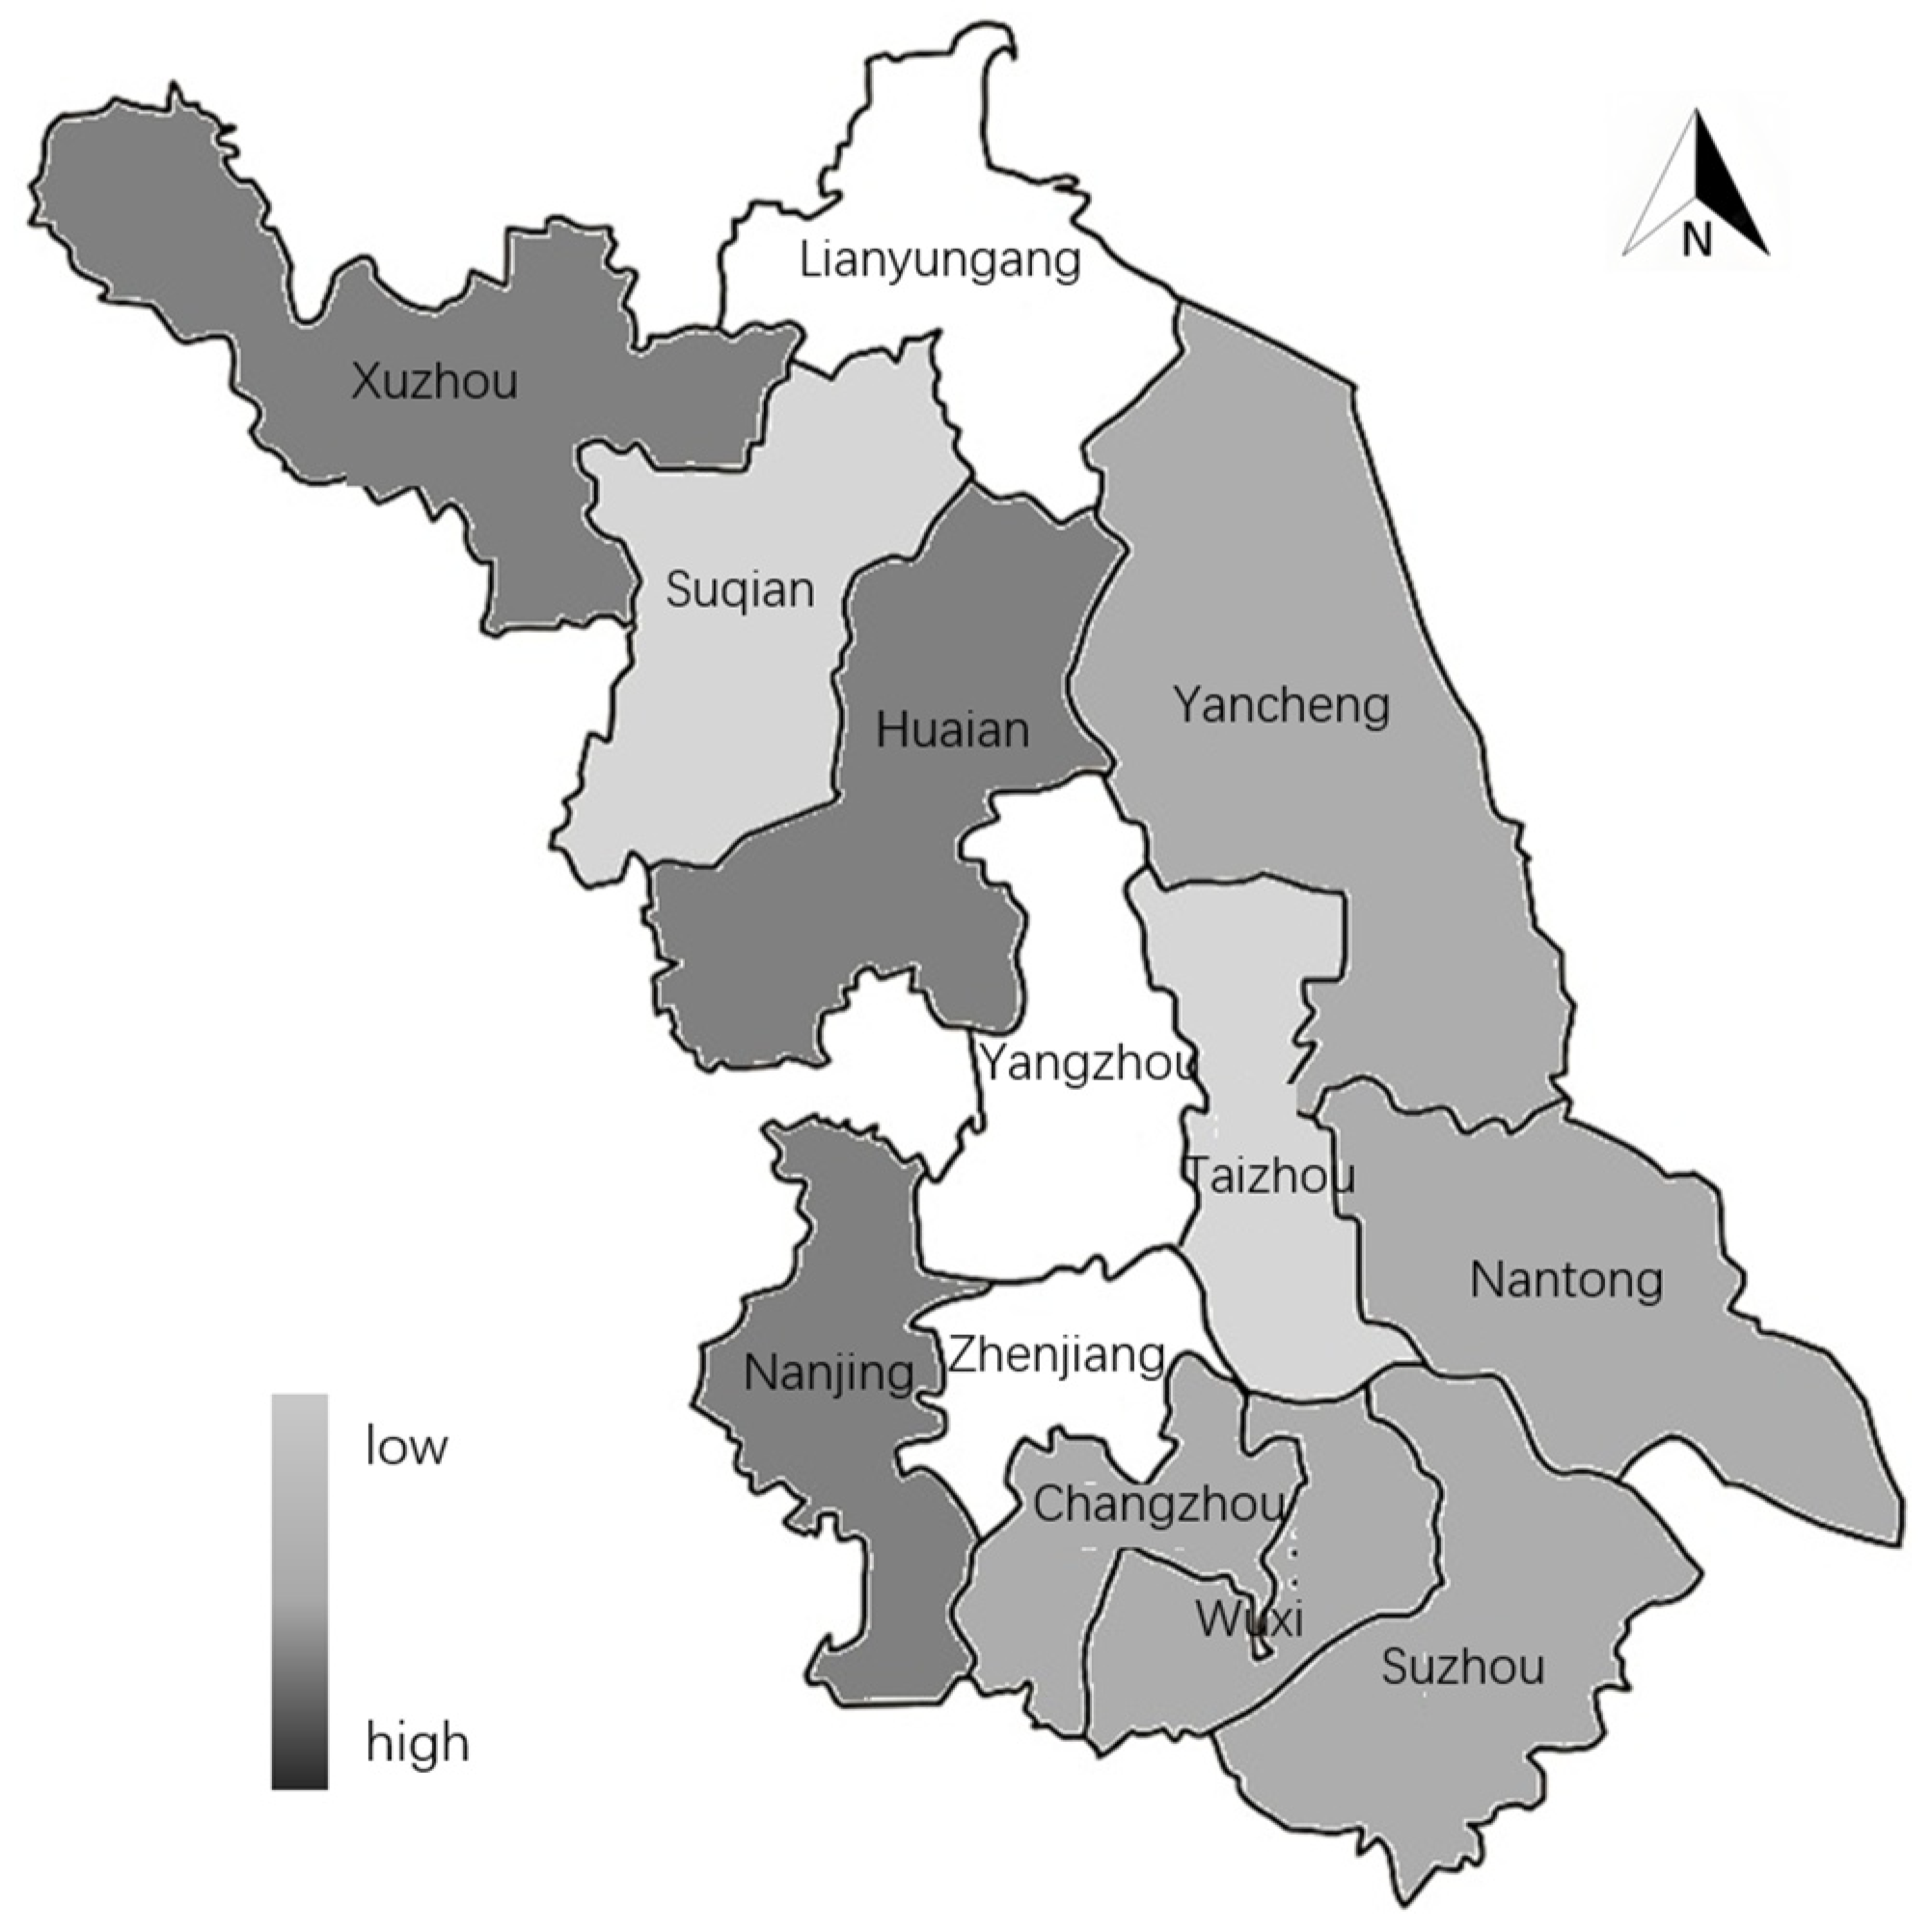
  • Comparative analysis of compensation standards between transferred and non-transferred contracted farmers: Non-transferred contracted farmers require compensation not only for opportunity cost losses but also for the ecological value generated through agricultural production, resulting in significantly higher compensation standards compared to their transferred counterparts. In Jiangsu Province, regional variations in compensation for transferred farmers align closely with regional economic development level, exhibiting gradient decrease from south to north geographically. Conversely, compensation standards for non-transferred farmers demonstrate more pronounced regional disparities. The compensation standard for contracted farming households without land transfer is primarily determined by the net ecological value and is closely associated with opportunity cost losses. The generation of ecological value depends on grain production: when both grain yield per unit area and opportunity cost losses are high, the compensation standard in such regions is correspondingly higher, whereas when both factors are lower, the compensation standard decreases accordingly. Consequently, the compensation standards for non-transferred contracted farming households demonstrate significantly pronounced spatial heterogeneity across different regions.
Policy implications of this study: Cultivated land ecological compensation policies should adhere to the principles of “those who provide, those who benefit” and “compensation proportional to contributions”. In practice, however, current compensation mechanisms often fail to fully identify the actual contributors. Some regions still allocate compensation solely to village collectives, with standards mostly ranging between CNY 200 and 400 per m2 annually, which inadequately incentivizes genuine providers of cultivated land ecosystem services. Also, while increasing attention is paid to the ecological value of cultivated land, negative environmental impacts remain underrecognized. Focusing on contracted farmers as primary contributors, this study incorporates both opportunity costs (as collective members) when land remains untransferred and the positive/negative values generated through agricultural production into its accounting framework. By integrating the strengths of dual accounting approaches, it provides a reference for equitable benefit distribution in cultivated land ecological compensation under the “Separation of Three Rights” system.

Author Contributions

Conceptualization, N.W. and K.L.; methodology, N.W. and W.L.; validation, N.W. and W.L.; formal analysis, N.W. and W.L.; investigation, N.W.; resources, K.L.; data curation, N.W.; writing—original draft preparation, N.W. and W.L.; writing—review and editing, N.W. and W.L.; supervision, K.L. All authors have read and agreed to the published version of the manuscript.

Funding

This research was supported by the Key Project of Social Science Fund of Jiangsu Province “A Study on the Equilibrium of Ecological Compensation Benefits of Farmland in Jiangsu Province under the Split Rights of Farmland and the Choice of Implementation Path” (19GLA004).

Data Availability Statement

As the research is ongoing, the data have not been made public. Reasonable requests for access can be directed to the authors.

Conflicts of Interest

The authors declare no conflicts of interest.

References

  1. Li, J.; Chen, X.; De Maeyer, P.; Van de Voorde, T.; Li, Y. Investigating the supply–demand gap of farmland ecosystem services to advance sustainable development goals (SDGs) in Central Asia. Agric. Water Manag. 2025, 312, 109419. [Google Scholar] [CrossRef]
  2. Ecological Protection Compensation Regulations. Website of Xining City Central District People’s Government. 28 May 2024. Available online: https://www.xncz.gov.cn/info/3319/185585.htm (accessed on 10 April 2025).
  3. Liu, M.; Yang, L.; Min, Q. Establishment of an eco-compensation fund based on eco-services consumption. J. Environ. Manag. 2018, 211, 306–312. [Google Scholar] [CrossRef]
  4. Gao, F.; Zhou, J.; Jiang, H.; Yang, W.; Wang, G. Assessing the true value of ecological restoration in mining areas: An input-output approach based on ecosystem service valuation. Ecol. Indic. 2024, 166, 112591. [Google Scholar] [CrossRef]
  5. Zhang, B.; Feng, Q.; Lu, Z.; Li, Z.; Zhang, B.; Cheng, W. Ecosystem service value and ecological compensation in Qilian Mountain National Park: Implications for ecological conservation strategies. Ecol. Indic. 2024, 167, 112661. [Google Scholar] [CrossRef]
  6. Sheng, W.; Zhen, L.; Xie, G.; Xiao, Y. Determining eco-compensation standards based on the ecosystem services value of the mountain ecological forests in Beijing, China. Ecosyst. Serv. 2017, 26, 422–430. [Google Scholar] [CrossRef]
  7. Jia, Y.; Liu, Y.; Zhang, S. Evaluation of agricultural ecosystem service value in arid and semiarid regions of northwest China based on the equivalent factor method. Environ. Process. 2021, 8, 713–727. [Google Scholar] [CrossRef]
  8. Zhen, H.; He, X.; Qiao, Y.; Ju, X.; Xu, Z.; Hashemi, F.; Knudsen, M.T. Does organic agriculture need eco-compensation? Evidence from Chinese organic farms using an eco-compensation model. Sustain. Prod. Consum. 2024, 49, 72–81. [Google Scholar] [CrossRef]
  9. Wang, Y.; Cai, Y.; Liu, G.; Zhang, P.; Li, B.; Li, B.; Jia, Q.; Huang, Y.; Shu, T. Evaluation of sustainable crop production from an ecological perspective based emergy analysis: A case of China’s provinces. J. Clean. Prod. 2021, 313, 127912. [Google Scholar] [CrossRef]
  10. Kniivilä, M. Users and non-users of conservation areas: Are there differences in WTP, motives and the validity of responses in CVM surveys? Ecol. Econ. 2006, 59, 530–539. [Google Scholar] [CrossRef]
  11. Zhang, Z.; Cui, Y.; Wang, L.; Sun, X.; Gao, Y. Determining the ecological compensation standards based on willingness to accept (WTA) for intensive agricultural production areas: A case in China. Appl. Geogr. 2023, 158, 103051. [Google Scholar] [CrossRef]
  12. Loomis, J.; Kent, P.; Strange, L.; Fausch, K.; Covich, A. Measuring the total economic value of restoring ecosystem services in an impaired river basin: Results from a contingent valuation survey. Ecol. Econ. 2000, 33, 103–117. [Google Scholar] [CrossRef]
  13. Zhou, S.; Huang, Y.; He, H.; Zhang, Z. Focusing on structural changes and future risks of ecosystems: An opportunity-cost based ecosystem service account for riparian ecosystems and its case study. Ecol. Indic. 2024, 158, 111523. [Google Scholar] [CrossRef]
  14. Guan, D.; Xi, Q.; Su, X.C.; Liu, X.; Zhou, L.; Liu, Z. Quantification and multiscenario simulation of ecological compensation and economic development coupling relationships in the YRB, China. Ecol. Indic. 2024, 168, 112760. [Google Scholar] [CrossRef]
  15. Hu, P.; Zhou, Y.; Zhou, J.; Wang, G.; Zhu, G. Uncovering the willingness to pay for ecological red lines protection: Evidence from China. Ecol. Indic. 2022, 134, 108458. [Google Scholar] [CrossRef]
  16. Kong, F.; Xiong, K.; Zhang, N. Determinants of Farmers’ Willingness to Pay and Its Level for Ecological Compensation of Poyang Lake Wetland, China: A Household-Level Survey. Sustainability 2014, 6, 6714–6728. [Google Scholar] [CrossRef]
  17. Zhen, H.; Qiao, Y.; Zhao, H.; Ju, X.; Zanoli, R.; Waqas, M.A.; Lun, F.; Knudsen, M.T. Developing a conceptual model to quantify eco-compensation based on environmental and economic cost-benefit analysis for promoting the ecologically intensified agriculture. Ecosyst. Serv. 2022, 56, 101442. [Google Scholar] [CrossRef]
  18. Reed, M.S.; Moxey, A.; Prager, K.; Hanley, N.; Skates, J.; Bonn, A.; Evans, C.D.; Glenk, K.; Thomson, K. Improving the link between payments and the provision of ecosystem services in agri-environment schemes. Ecosyst. Serv. 2014, 9, 44–53. [Google Scholar] [CrossRef]
  19. Lu, Z.; Wu, X.; Zhang, S.; Li, J.; Cai, F.; Xu, R. A study of ecological compensation in watersheds based on the three-way decisions theory. J. Clean. Prod. 2022, 368, 133166. [Google Scholar] [CrossRef]
  20. Luan, R.; Wen, G.; Hu, X.; Lin, X.; Zhang, C. Eco-compensation for Farmers’ cultivated land protection based on Field-Habitus theory. Ecol. Indic. 2025, 172, 113319. [Google Scholar] [CrossRef]
  21. Ainiwaerjiang, A.; Jin, X.; Xie, Z.; Tian, T.; Dang, Y. Research on the multi-agent motivation coupling evolution and synergy improvement for farmland ecological protection in China. Environ. Sustain. Indic. 2025, 25, 100583. [Google Scholar] [CrossRef]
  22. Shen, N.; Pang, A.; Li, C.; Liu, K. Study on Ecological Compensation Mechanism of Xin’an Spring Water Source Protection Zone in Shanxi Province, China. Procedia Environ. Sci. 2010, 2, 1063–1073. [Google Scholar] [CrossRef]
  23. Kuai, C.; Huang, Y.; Wang, F. A framework for eco-compensation in the Yangtze River Delta region of China based on multiple policy objectives. J. Clean. Prod. 2024, 436, 140370. [Google Scholar] [CrossRef]
  24. Liu, M.; Chen, C.; Yang, L.; Min, Q.; Xiong, Y. Agricultural eco-compensation may not necessarily reduce chemical inputs. Sci. Total Environ. 2020, 741, 139847. [Google Scholar] [CrossRef]
  25. Yang, Y.; Zhu, Y.; Zhao, Y. Improving farmers’ livelihoods through the eco-compensation of forest carbon sinks. Renew. Sustain. Energy Rev. 2024, 198, 114401. [Google Scholar] [CrossRef]
  26. Chi, C.; Shen, J.; Huang, X.; Gao, X.; Hu, P.; Sun, F. A new framework for eco-compensation funds allocation in China based on multi-attribute decision-making method. Environ. Impact Assess. Rev. 2025, 114, 107891. [Google Scholar] [CrossRef]
  27. Ritten, J.; Fernández-Giménez, M.E.; Pritchett, J.; Kachergis, E.; Bish, W. Using State and Transition Models to Determine the Opportunity Cost of Providing Ecosystem Services. Rangel. Ecol. Manag. 2018, 71, 737–752. [Google Scholar] [CrossRef]
  28. da Motta, R.S.; Ortiz, R.A. Costs and perceptions conditioning willingness to accept payments for ecosystem services in a Brazilian case. Ecol. Econ. 2018, 147, 333–342. [Google Scholar] [CrossRef]
  29. Yan, J.; Yang, Y.; Xia, F. Subjective land ownership and the endowment effect in land markets: A case study of the farmland “three rights separation” reform in China. Land Use Policy 2021, 101, 105137. [Google Scholar] [CrossRef]
  30. Wang, Q.; Zhang, X. Three rights separation: China’s proposed rural land rights reform and four types of local trials. Land Use Policy 2017, 63, 111–121. [Google Scholar] [CrossRef]
  31. Zhang, Y.; Kant, S. Secure tenure or equal access? Farmers’ preferences for reallocating the property rights of collective farmland and forestland in Southeast China. Land Use Policy 2022, 112, 105814. [Google Scholar] [CrossRef]
  32. Gong, M.; Li, H.; Elahi, E. Three Rights Separation reform and its impact over farm’s productivity: A case study of China. Land Use Policy 2022, 122, 106393. [Google Scholar] [CrossRef]
  33. Gao, X.; Shi, X.; Fang, S. Property rights and misallocation: Evidence from land certification in China. World Dev. 2021, 147, 105632. [Google Scholar] [CrossRef]
  34. Cao, Y.; Bai, Y.; Zhang, L. The impact of farmland property rights security on the farmland investment in rural China. Land Use Policy 2020, 97, 104736. [Google Scholar] [CrossRef]
  35. Li, X.; Wang, Y.; Wang, Z. Quantifying the industrial development modes and their capability of realizing the ecological value in rural China. Technol. Forecast. Soc. Chang. 2024, 203, 123386. [Google Scholar] [CrossRef]
  36. Tzilivakis, J.; Warner, D.J.; Holland, J.M. Developing practical techniques for quantitative assessment of ecosystem services on farmland. Ecol. Indic. 2019, 106, 105514. [Google Scholar] [CrossRef]
  37. Liu, L.H.; Yang, B.R. Research on ecological compensation for cultivated land in China. China Popul. Resour. Environ. 2019, 29, 52–62. (In Chinese) [Google Scholar]
  38. Xie, G.; Zhang, C.; Zhen, L.; Zhang, L. Dynamic changes in the value of China’s ecosystem services. Ecosyst. Serv. 2017, 26, 146–154. [Google Scholar] [CrossRef]
  39. Liu, L.H.; Yang, Y.F.; Li, X.X. Research on Cultivated land protection compensation based on food security. J. Northwest AF Univ. (Soc. Sci. Ed.) 2017, 17, 30–38. (In Chinese) [Google Scholar] [CrossRef]
Figure 1. The principle of ecological compensation of cultivated land to farmers under the system of “Separation of Three Rights”.
Land 14 01003 g001
Figure 2. The proportion of negative value and total negative value of various regions in Jiangsu Province in 2022.
Land 14 01003 g002
Figure 3. Compensation standard for transferring farmers (left).
Land 14 01003 g003
Figure 4. Compensation standard for non-transferring farmers (right).
Land 14 01003 g004
Figure 5. The proportion of net ecological value and opportunity cost to the compensation standards for non-transferring contracted farming households across various regions in Jiangsu Province (2022). Blue: Ecological net value (yuan/hm2); Orange: Opportunity cost loss (yuan/hm2).
Land 14 01003 g005
Figure 6. Compensation standards for contracted rural households and per capita GDP trends in Jiangsu Province (2022).
Land 14 01003 g006
Figure 7. Compensation standards, opportunity cost loss, and grain yield per unit area; trend chart for non-transferred contracted farmers in Jiangsu Province (2022).
Land 14 01003 g007
Table 1. The method to calculate the negative value of cultivated land ecosystem services.
Negative ValueFormulaFormula ExplanationEvaluation Method
Total negative value V 2 = V H + V D + V W + V G (3)V2 is the negative value of cultivated land ecosystem services (CNY/hm2) in the study area in year i. VH, VW, VD, and VG are the negative values (CNY/hm2) generated by the use of chemical fertilizers and pesticides, consumption of agricultural water resources, residual agricultural mulch, and greenhouse gas emissions in the study area in year i, respectively.Replacement Cost Method
Fertilizer
pesticide
V H = F P i × ( 1 t 1 ) × p f i + N P i × ( 1 t 2 ) × p p i g i (4)FPi and NPi are the amount of chemical fertilizer (calculated by reduction method, kg) and pesticide (kg) used in the study area in year i; pfi and ppi are fertilizer price (CNY/kg) and pesticide price (CNY/kg) in the study area in year i. t1 and t2 are fertilizer utilization rate (%) and pesticide utilization rate (%), respectively. According to the research of relevant scholars, t1 is 34.17% and t2 is 35%. gi is the cultivated land area of the study area in year i (103 hm2).
Agriculture Water
resources
V W = W c i × R w i × C w g i (5)Wci, Rwi, and Cw are respectively the year i of agricultural water consumption (108 m3), agricultural water consumption rate (%), and reservoir storage cost. The value of Cw combined with previous studies is 1.17 CNY/m3.
Residual
agricultural mulch
V D = D i × t 3 × q y i × s × p f i g i (6)Di, qyi, and pfi are the agricultural mulch cover area (hm2), grain yield per unit area (kg/hm2), and grain market price (CNY/kg) in the study area in year i. t3 and s are the mulch residue ratio (%) and grain loss rate (%), respectively. Combined with the research of relevant scholars, the value of t3 is 41.7% and the value of s is 10%.
Greenhouse gas V G = P ic G W P ij × G G i j × 27.27 % g i (7)Pic and GWPij are the year i carbon trading price and year i global warming potential of Class j greenhouse gases; 27.27% is the content of C in CO2.
G G i j = Q C H 4 + Q N 2 O (8)GGij, QCH4, and QN2O are Class j greenhouse gas emissions (kg) in year i, CH4 emissions (kg) in cultivated land, and N2O emissions (kg) in cultivated land.
Q C H 4 = k = 1 n m k × α k (9)mk and αk are the annual sown area (hm2) of the k crop and the CH4 emission coefficient per unit area of the k crop (kg/hm2).
Q N 2 O = k = 1 n ( m k × β k + H k × λ k + Q ck × δ k ) (10)mk and βk are the annual sown area (hm2) and the annual background N2O emission flux per unit area of the k crop (kg/hm2). Hk and Qck are the total annual nitrogen fertilizer application (kg) and total annual compound fertilizer application (kg) of the k crop. λk and δk are the N2O emission coefficients of nitrogen fertilizer and compound fertilizer of the k crop (%).
Table 2. Related data sources.
Data CategoryNameData Sources
Ecological Valuetotal grain output, grain yield per unit area, cultivated land area, sown crop area, pesticide and fertilizer application rates, agricultural plastic mulch coverage area, and grain yield per unit area2023 statistical yearbooks of respective region,
the official website of Jiangsu Reform and Development Commission,
the official website of Jiangsu Provincial Bureau of Natural Resources, the official website of the regional Reform and Development Commission, the official website of the regional Natural resources Bureau,
grain prices, pesticide and fertilizer pricesNational Agricultural Product Cost and Income Data Compilation 2023, Jiangsu Yearbook 2023, Jiangsu Survey Yearbook 2023
the source of agricultural water consumption2023 Jiangsu Water Resources Bulletin,
the official website of the Jiangsu Water Resources Department, the official website of the regional Agriculture and Rural Bureau
Opportunity CostNet proceeds from land conveyance, Transaction price of land use right, Deed tax rate2023 China Natural Resources Statistical Bulletin, Deed Tax Law of the People’s Republic of China, the official website of the Central People’s Government of the People’s Republic of China, the official website of the Jiangsu Provincial Department of Justice
Correction FactorThe one-year bank deposit rate, per capita GDP by region, per capita GDP of Jiangsu Province, per capita GDP of the whole country, multiple cropping index, Engel coefficient and CPIthe official website of the People’s Bank of China,
the official website of regional Statistics Bureau,
the official website of Jiangsu Provincial Statistics Bureau, the official website of China Macroeconomic Statistics for 30 Years, the Statistical Bulletin of National Economic and Social Development 2023 of each region
Table 3. Positive value of cultivated land ecosystem services in prefecture-level cities of Jiangsu Province (2022).
CityEa (CNY/hm2) Multiple Cropping IndexPositive Value (CNY/hm2)
Nanjing1.321.8515.95
Wuxi1.181.6712.79
Suzhou1.181.5511.88
Xuzhou1.382.1118.94
Changzhou0.951.9612.16
Nantong1.031.9913.34
Lianyungang0.871.719.65
Huaian1.731.7119.23
Yancheng1.201.8014.03
Yangzhou0.761.467.27
Zhenjiang0.801.246.47
Taizhou0.931.9211.61
Suqian0.941.8211.19
Table 4. Negative values of various ecosystem service components in cultivated land across prefecture-level cities of Jiangsu Province (2022).
CityNegative Value of Fertilizers and Pesticides (CNY/hm2)Negative Value of Agricultural Water Consumption (CNY/hm2)Negative Value of Agricultural Mulch (CNY/hm2)Negative Value of Greenhouse Gases (CNY/hm2)Total Negative Value (CNY/hm2)
Nanjing22978706216102212,242
Wuxi3896721842893212,474
Suzhou3191640131990210,811
Xuzhou55124111314105110,988
Changzhou50518376230109414,751
Nantong117842271696956270
Lianyungang56774129529113411,469
Huaian938455949116411
Yancheng3347466916210259202
Yangzhou66754835469127413,253
Zhenjiang2980597755112310,134
Taizhou3488536248114110,040
Suqian50164238201112910,583
Table 5. CH4 and N2O emissions with associated negative value by prefecture-level city in Jiangsu Province (2022).
CityAnnual Planting Area of Rice × 104 (hm2) CH4 Emission × 104 (kg) CH4 Value (CNY/hm2) N2O Emission × 104 (kg) Cultivated Land Area × 104 (hm2) N2O Value (CNY/hm2)VG (CNY/hm2)
Nanjing8.302688.2366199.5114.163611022
Wuxi4.071318.6857156.488.04361932
Suzhou7.222338.3159980.1413.60303902
Xuzhou17.965819.69359760.1756.476921051
Changzhou5.311720.4469267.788.664021094
Nantong17.995827.79514139.1339.47181695
Lianyungang20.666693.84632360.1936.895021134
Huaian32.0010,368.00756143.4747.73154911
Yancheng41.2613,367.59599643.0377.684251025
Yangzhou19.406285.60663392.2133.016111274
Zhenjiang7.302365.2075478.3510.923691123
Taizhou17.935809.64748207.2627.063941141
Suqian22.647336.66622405.0441.085071129
Table 6. The opportunity cost loss of cultivated land protection in Jiangsu Province.
CityNet Income from Land Transfer (104 CNY/hm2)Deed Tax for Land Use Right Transfer (104 CNY/hm2)Land Occupation Tax
(104 CNY/hm2)
Grain Yield per Unit Area (104 CNY/hm2)Opportunity Cost Loss
(104 CNY/hm2)
Nanjing212.8741.44302.893.61
Wuxi236.2323.25302.783.84
Suzhou221.4921.80302.913.34
Xuzhou140.3313.81202.641.35
Changzhou212.2320.89302.943.08
Nantong175.1017.24252.562.41
Lianyungang127.3712.54202.900.76
Huaian130.1012.81202.990.74
Yancheng125.7912.38202.910.71
Yangzhou184.7118.18252.972.24
Zhenjiang185.5318.26302.872.48
Taizhou168.8716.62253.011.80
Suqian107.8910.62202.750.42
Table 7. Compensation standards for contracted farming households across regions in Jiangsu Province (2022).
CityEcological Net Value
× 104 (CNY/hm2)
Opportunity Cost Loss
(CNY/hm2)
Compensation Standard for Transferring Farmers (CNY/hm2)Compensation Standard for Non-Transferring Farmers (CNY/hm2)
Nanjing14.7336,114.2411,727.2559,545
Wuxi11.5438,406.0311,664.0546,705
Suzhou10.8033,446.1111,340.8747,948
Xuzhou17.8413,471.623914.9955,766
Changzhou10.6830,839.349497.1242,399
Nantong12.7224,074.656947.8543,647
Lianyungang8.507589.711785.4621,787
Huaian18.587350.622077.6054,604
Yancheng13.117080.202110.7641,206
Yangzhou5.9522,400.816787.4524,802
Zhenjiang5.4524,833.517386.2323,608
Taizhou10.6018,029.045119.4235,228
Suqian10.144229.431226.2730,612
Jiangsu Province11.5920,605.026275.7940,604
Disclaimer/Publisher’s Note: The statements, opinions and data contained in all publications are solely those of the individual author(s) and contributor(s) and not of MDPI and/or the editor(s). MDPI and/or the editor(s) disclaim responsibility for any injury to people or property resulting from any ideas, methods, instructions or products referred to in the content.

