
Effects of Exogenous Silicon Addition on Nitrification and Denitrification-Derived N2O Emissions from Moso Bamboo (Phyllostachys edulis) Forest Soil

 , , , ,
Abstract
:1. Introduction
2. Materials and Methods
2.1. Soil Used for Cultivation
2.2. Soil Incubation
2.3. Experimental Design
2.4. N2O Sampling and Analyses
2.5. Soil Sampling and Analyses
2.6. Availability of Materials and Data
2.7. Use of Generative Artificial Intelligence
3. Results
3.1. Soil pH and Nitrogen Dynamics
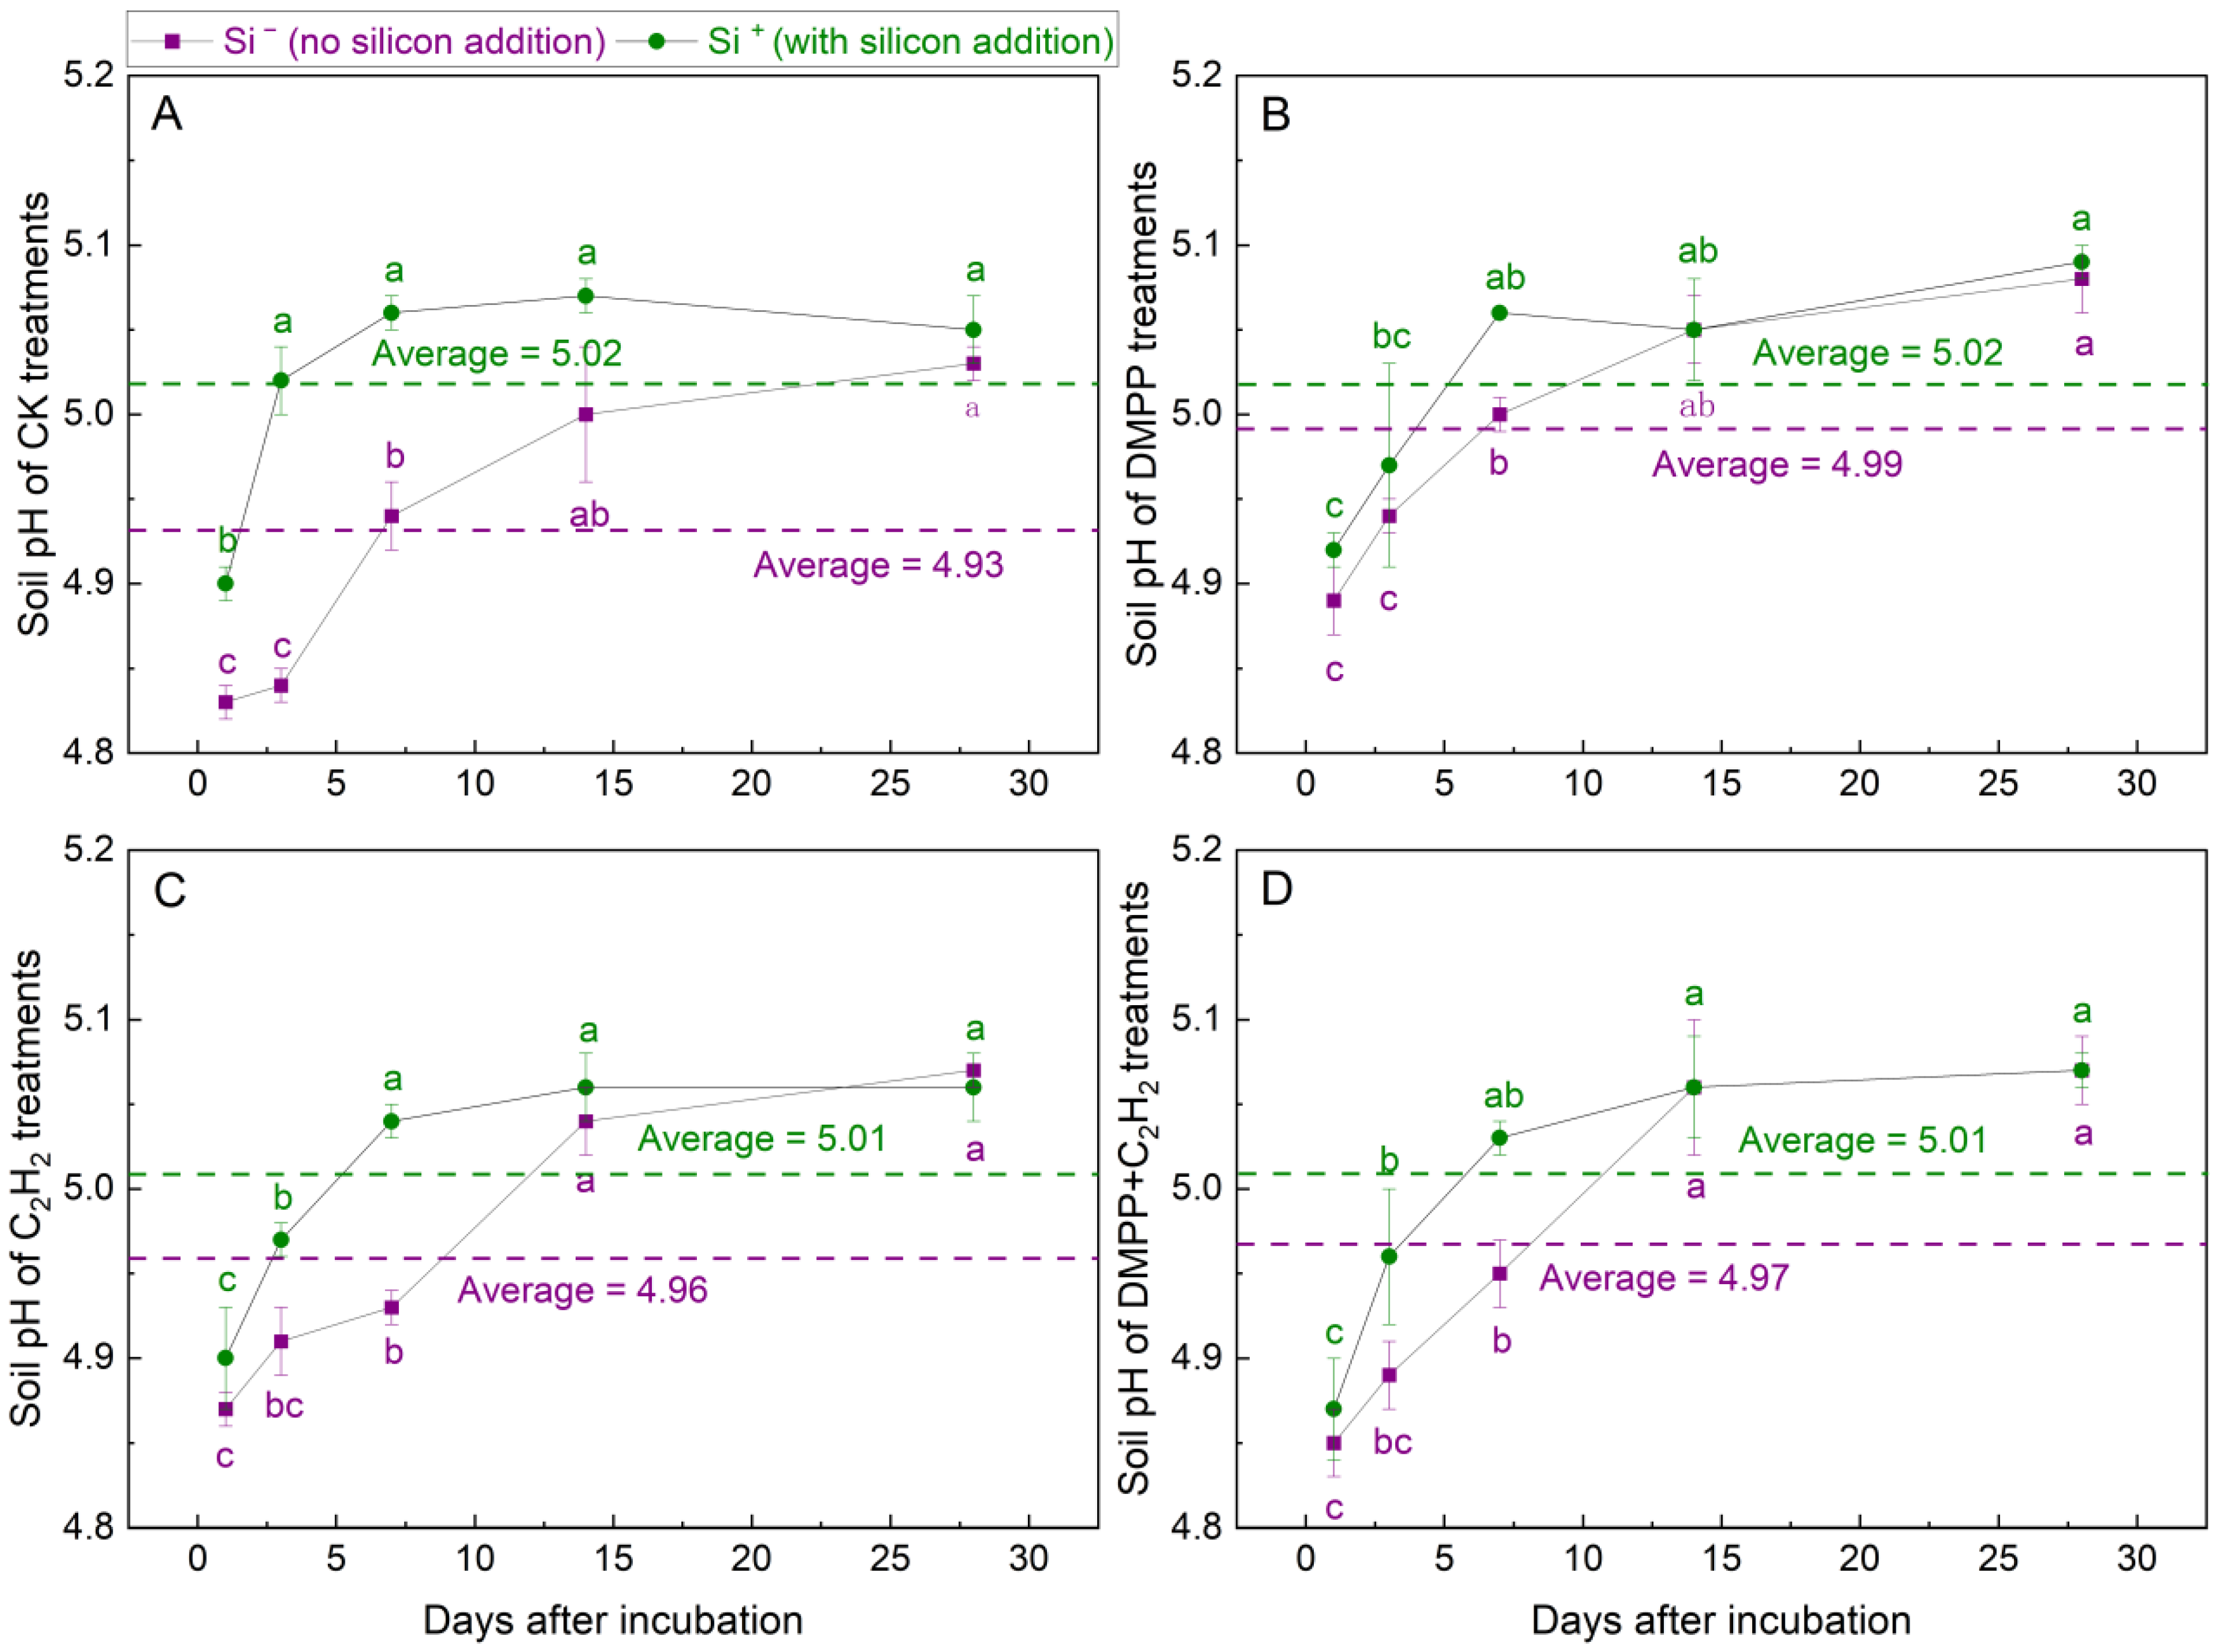
3.1.1. Soil pH
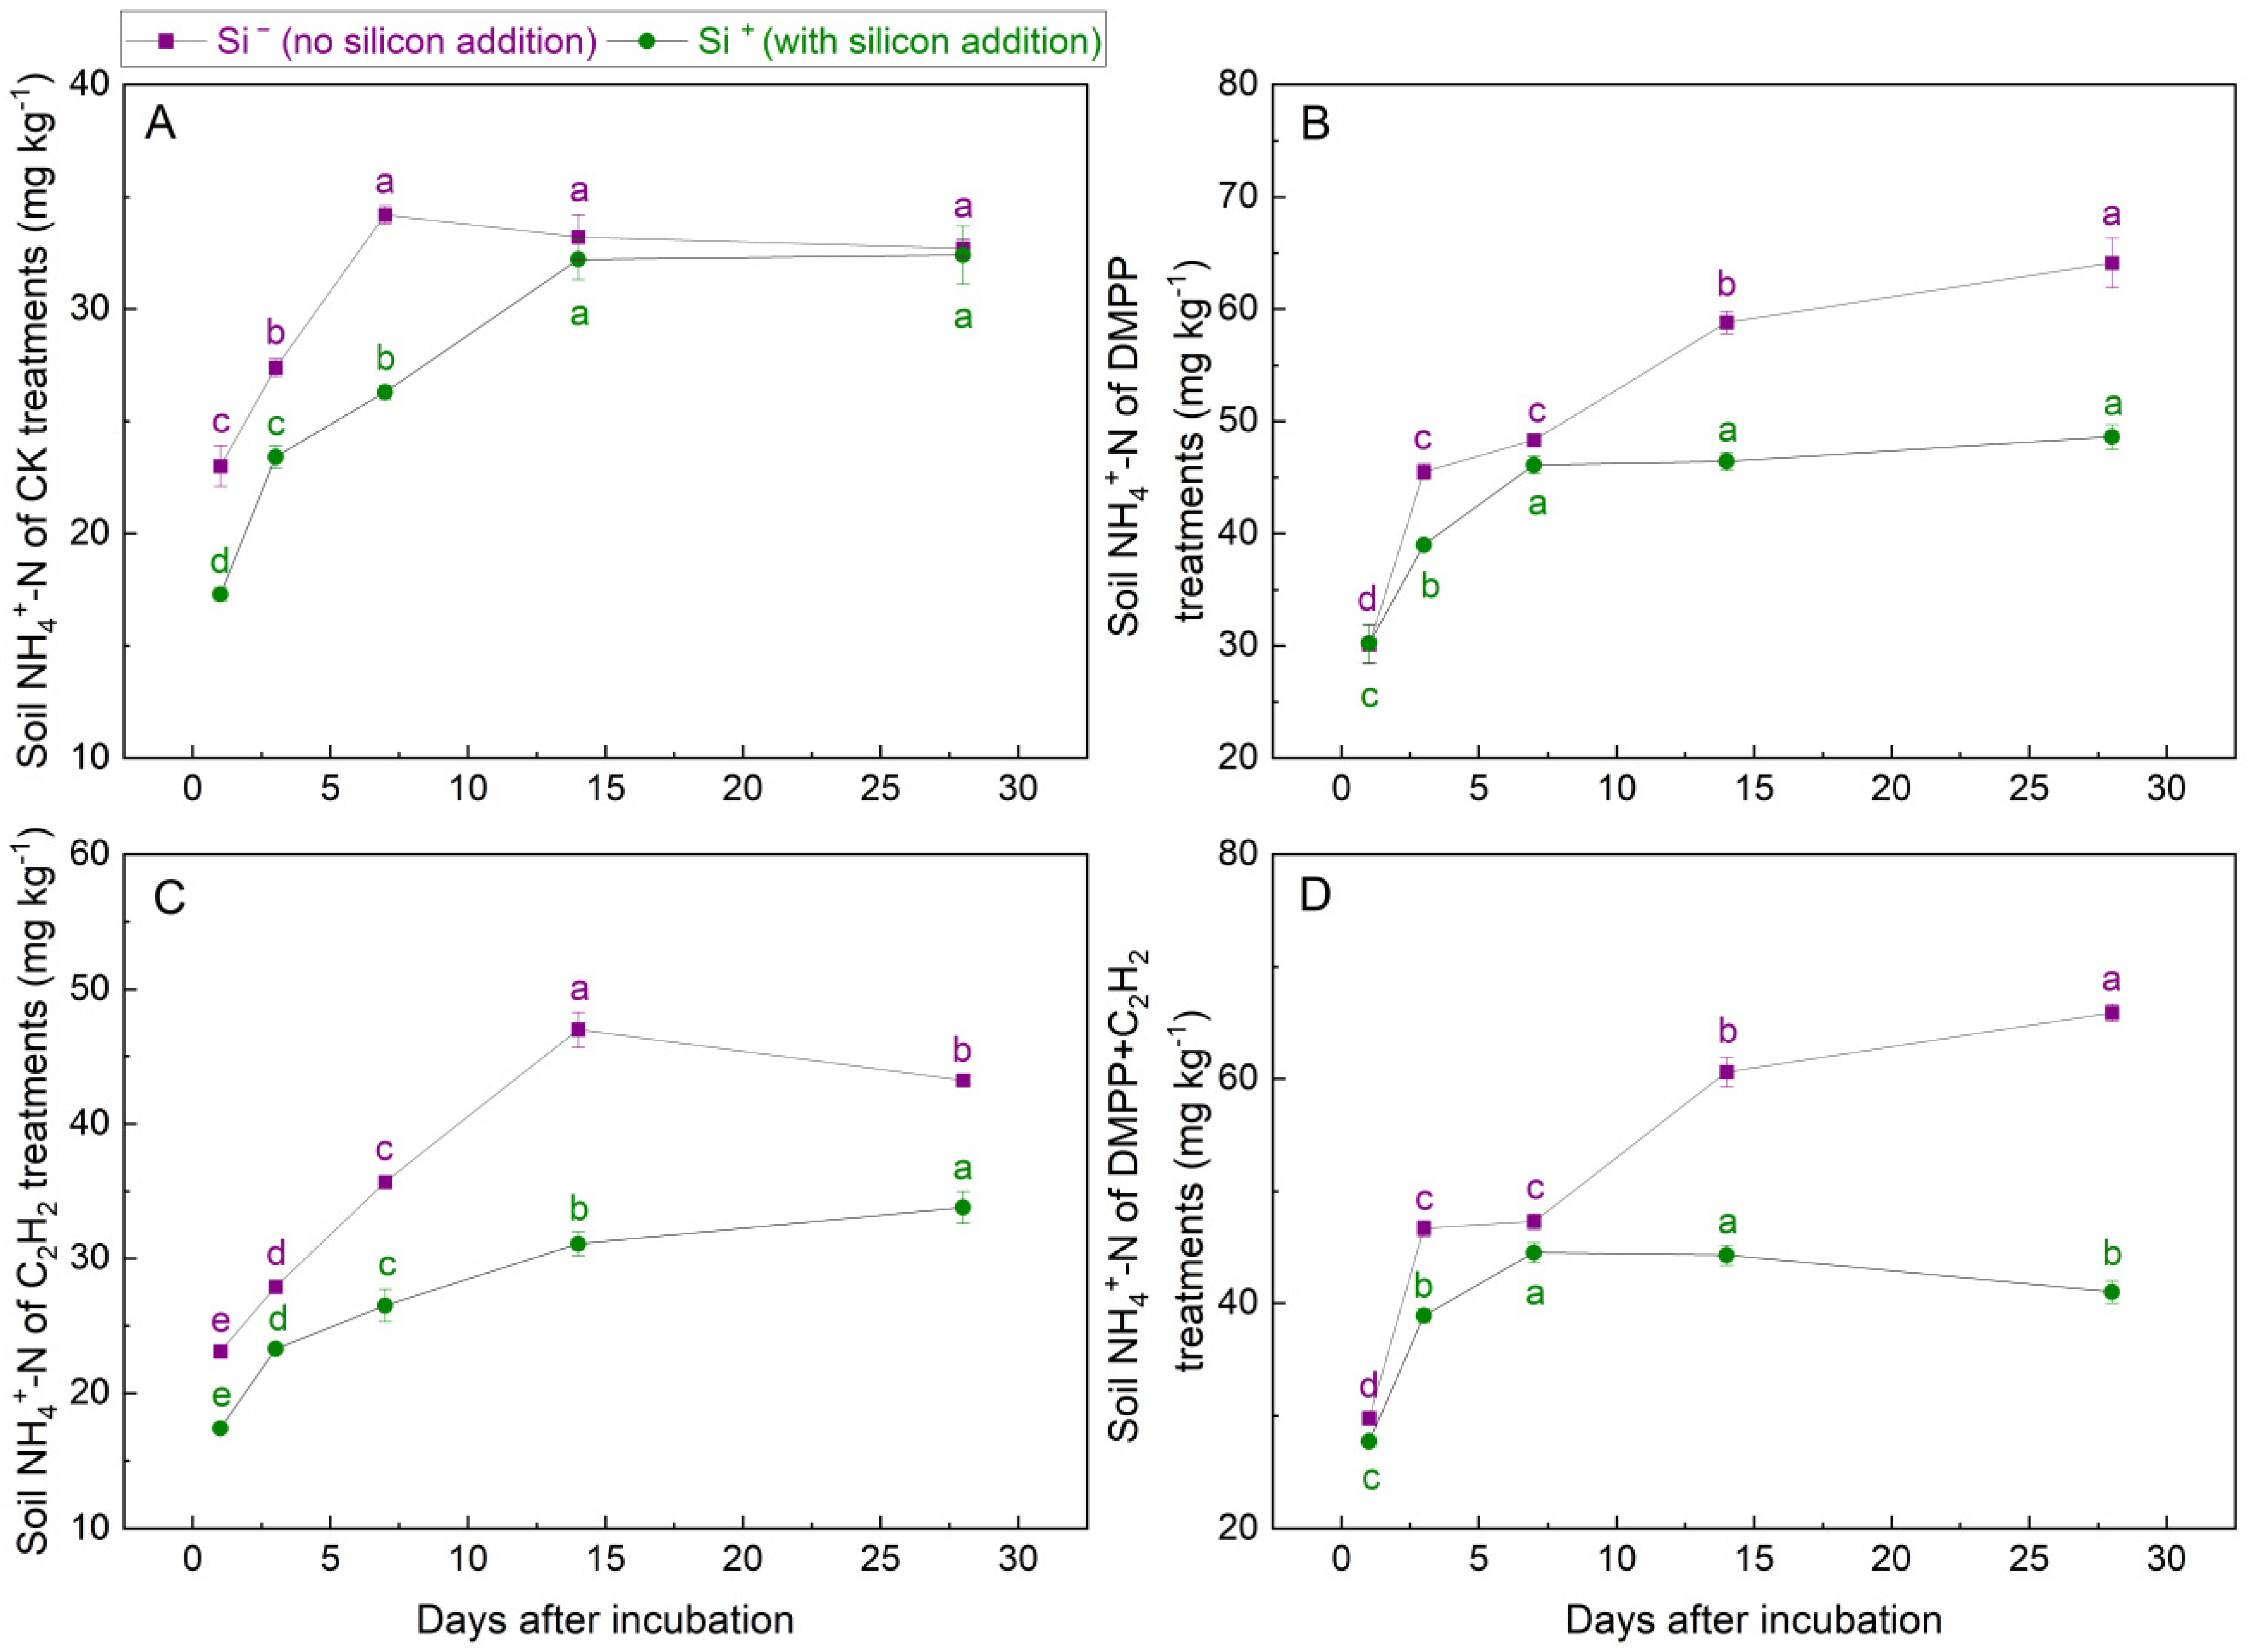
3.1.2. NH4+-N Concentrations
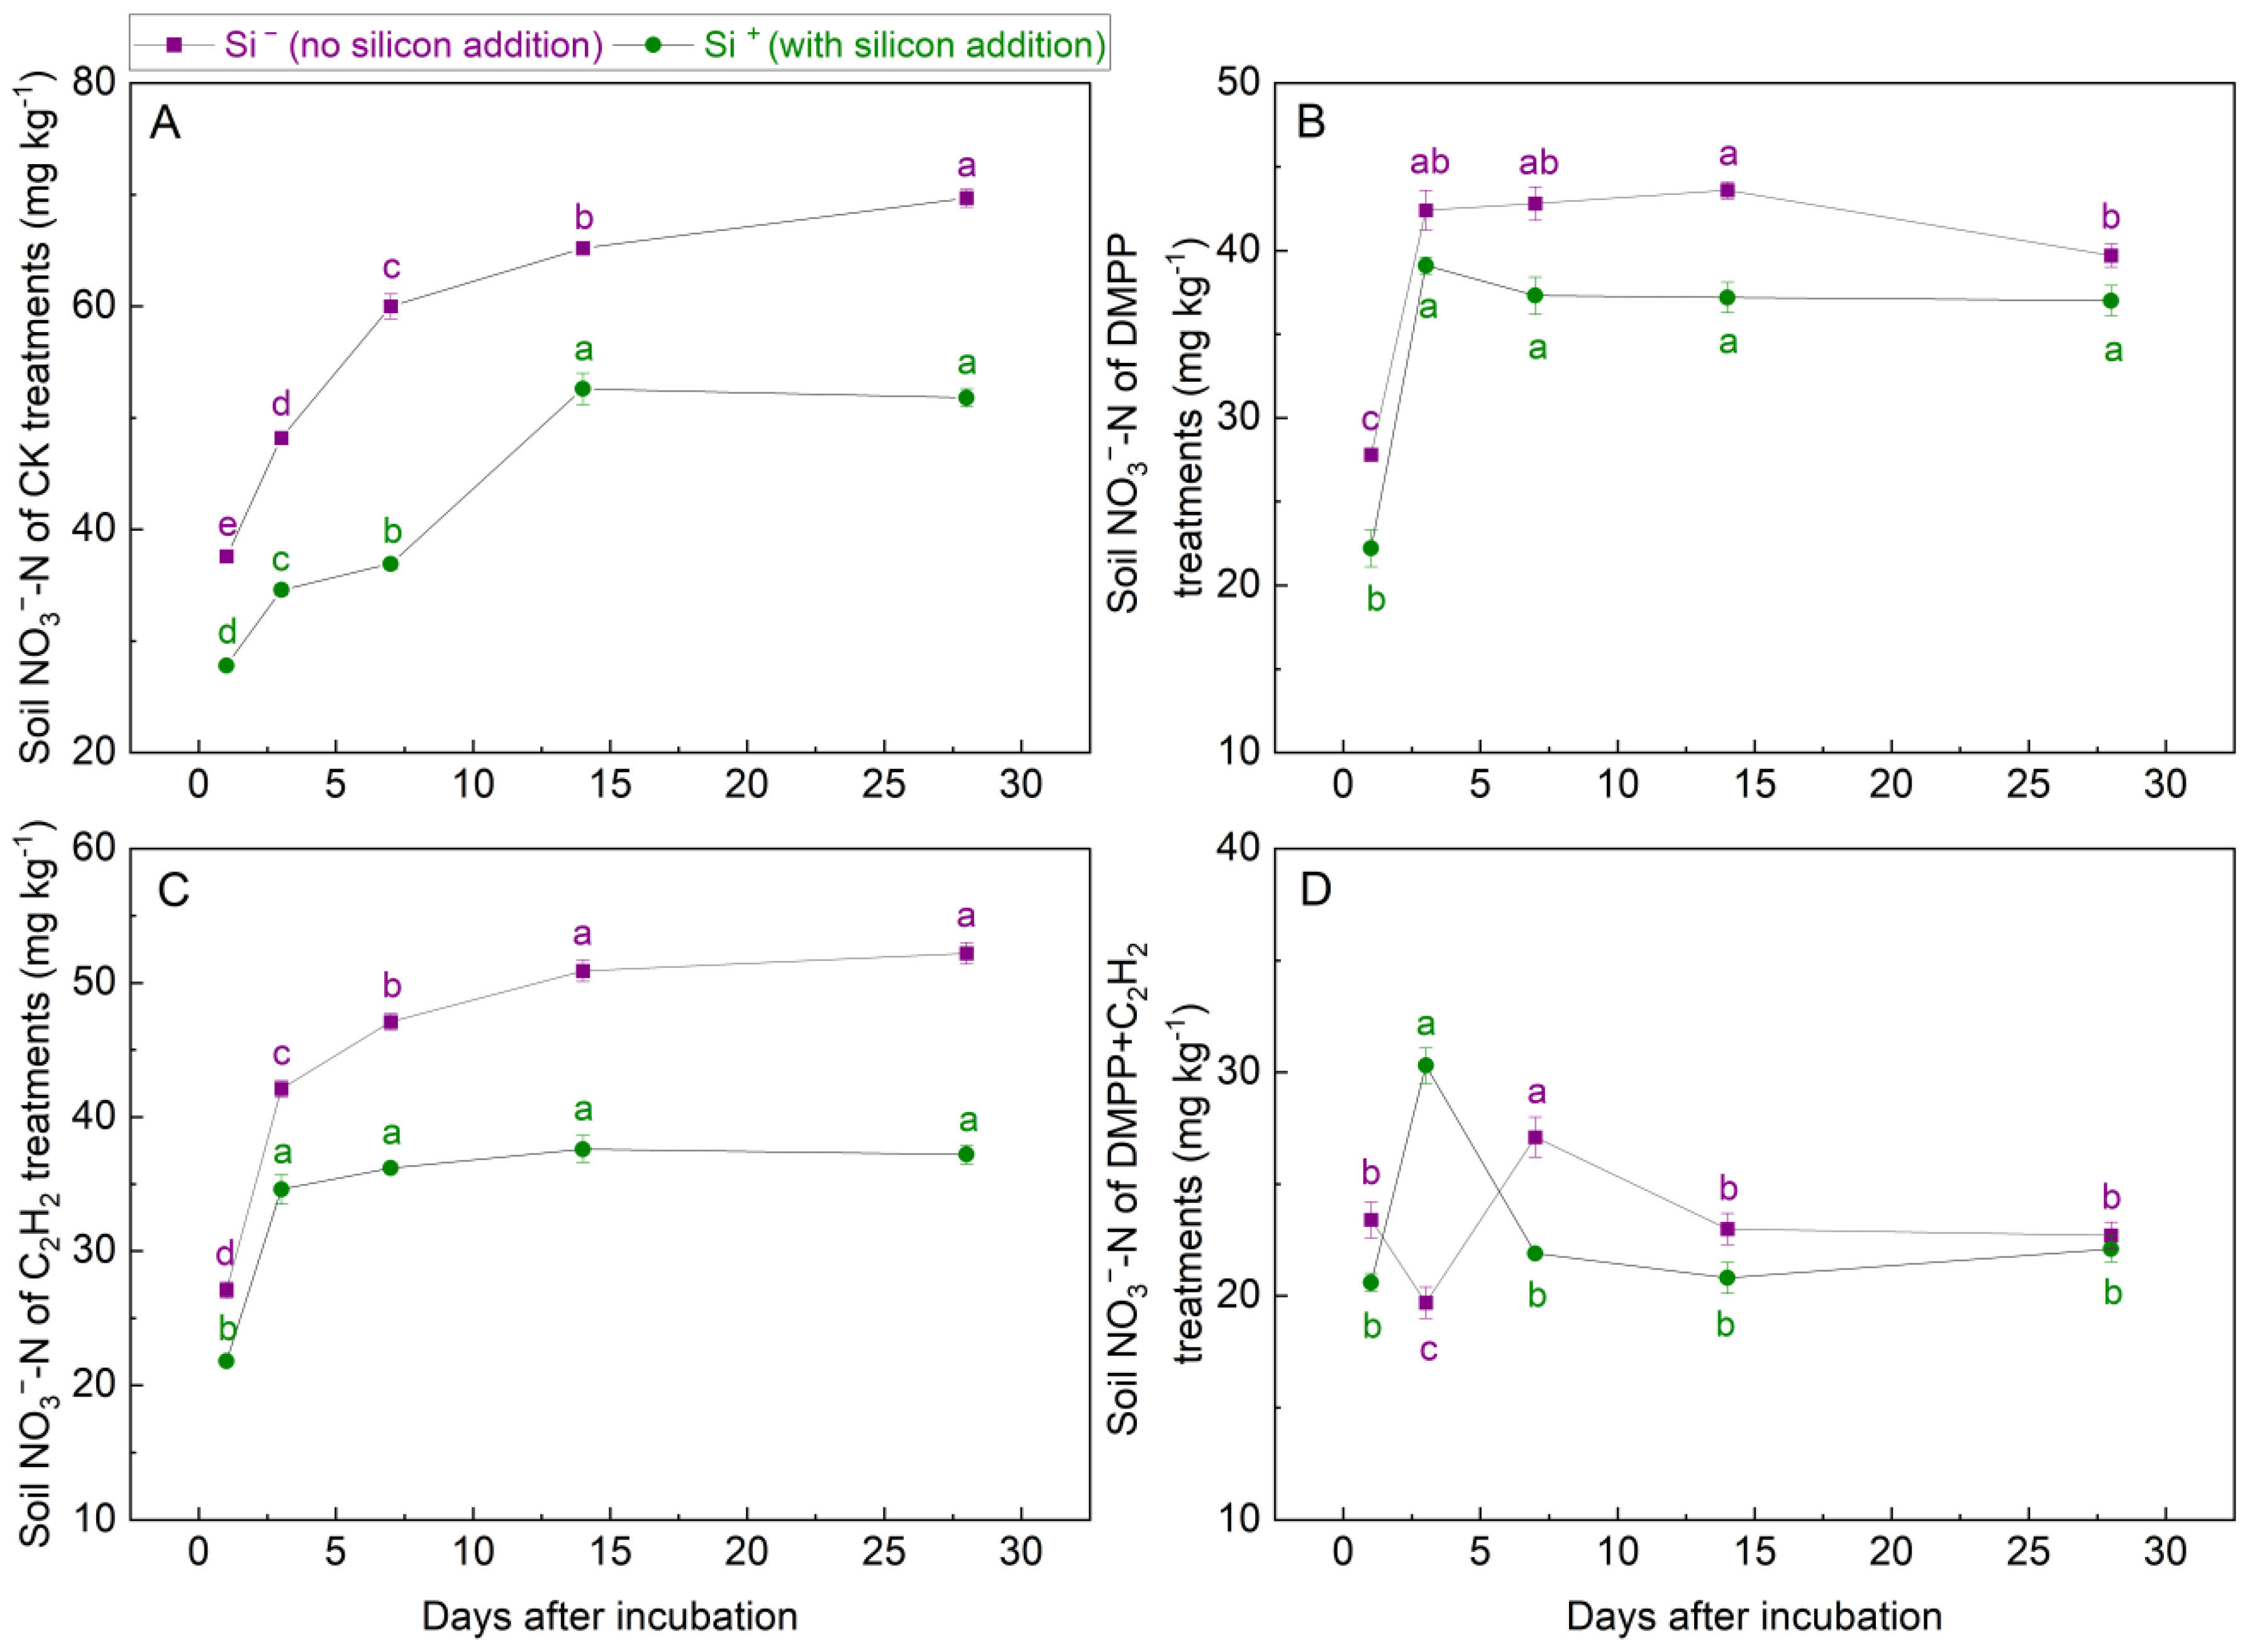
3.1.3. NO3−-N Concentrations
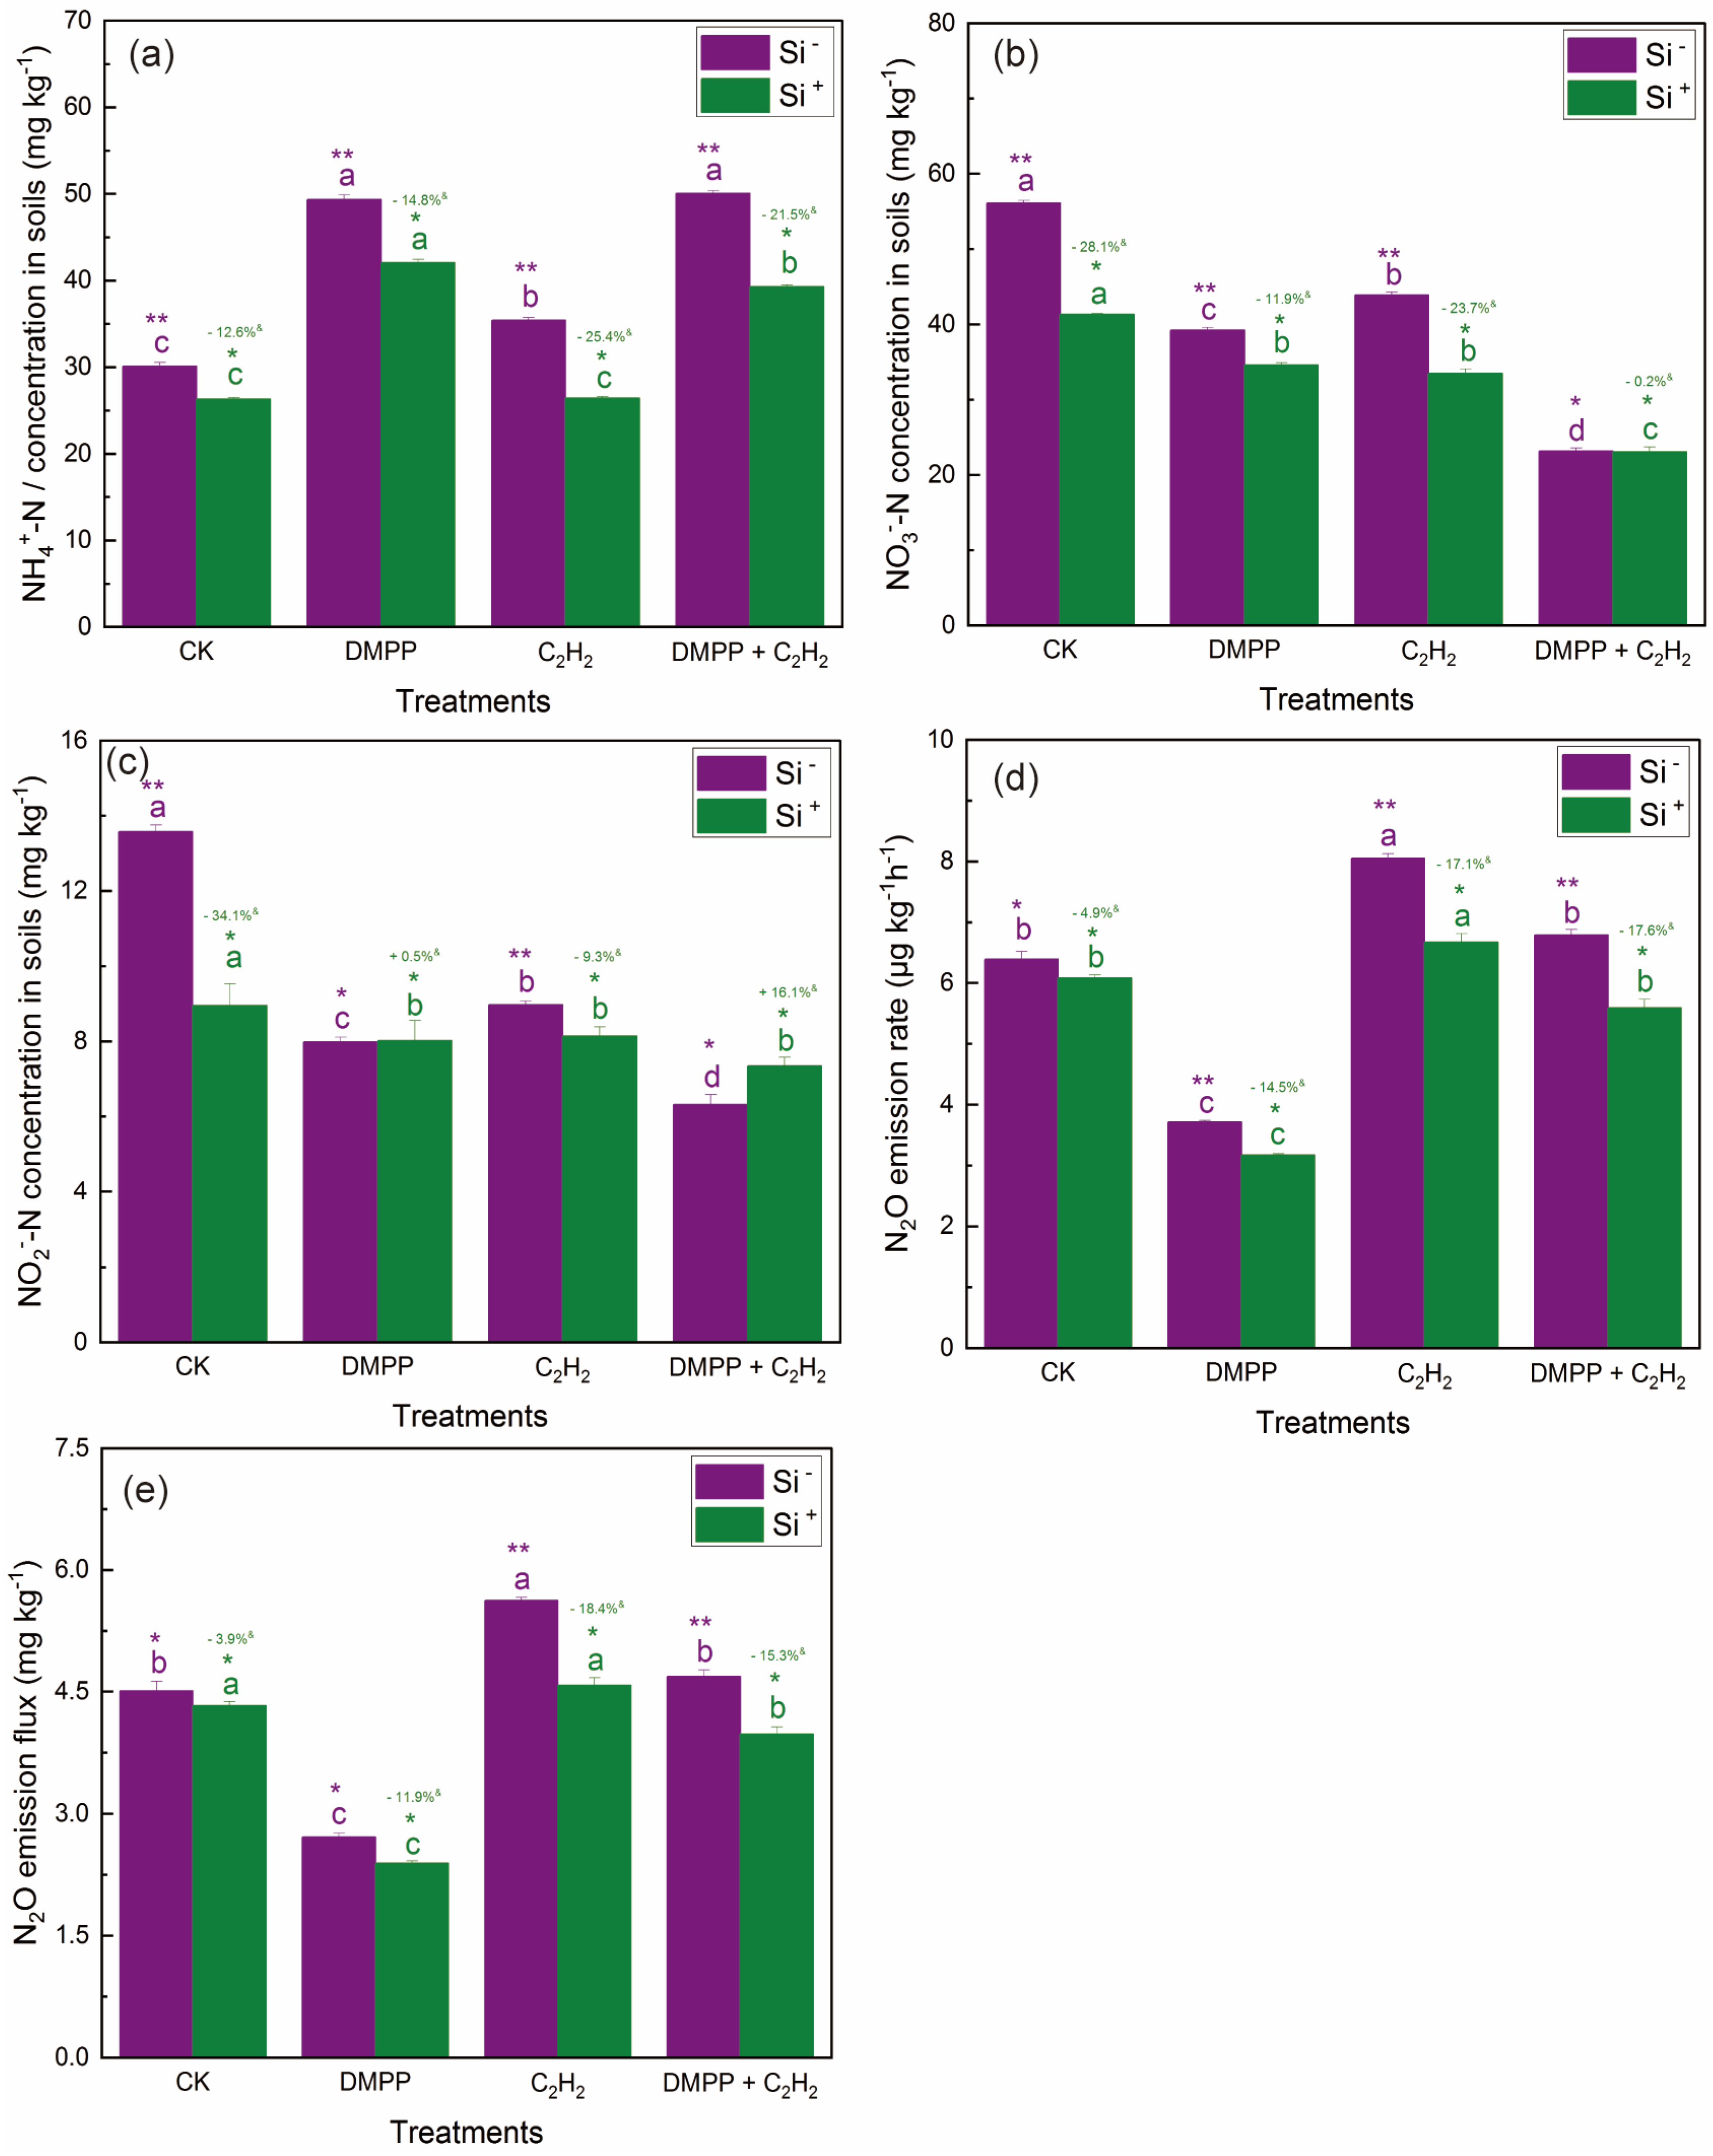
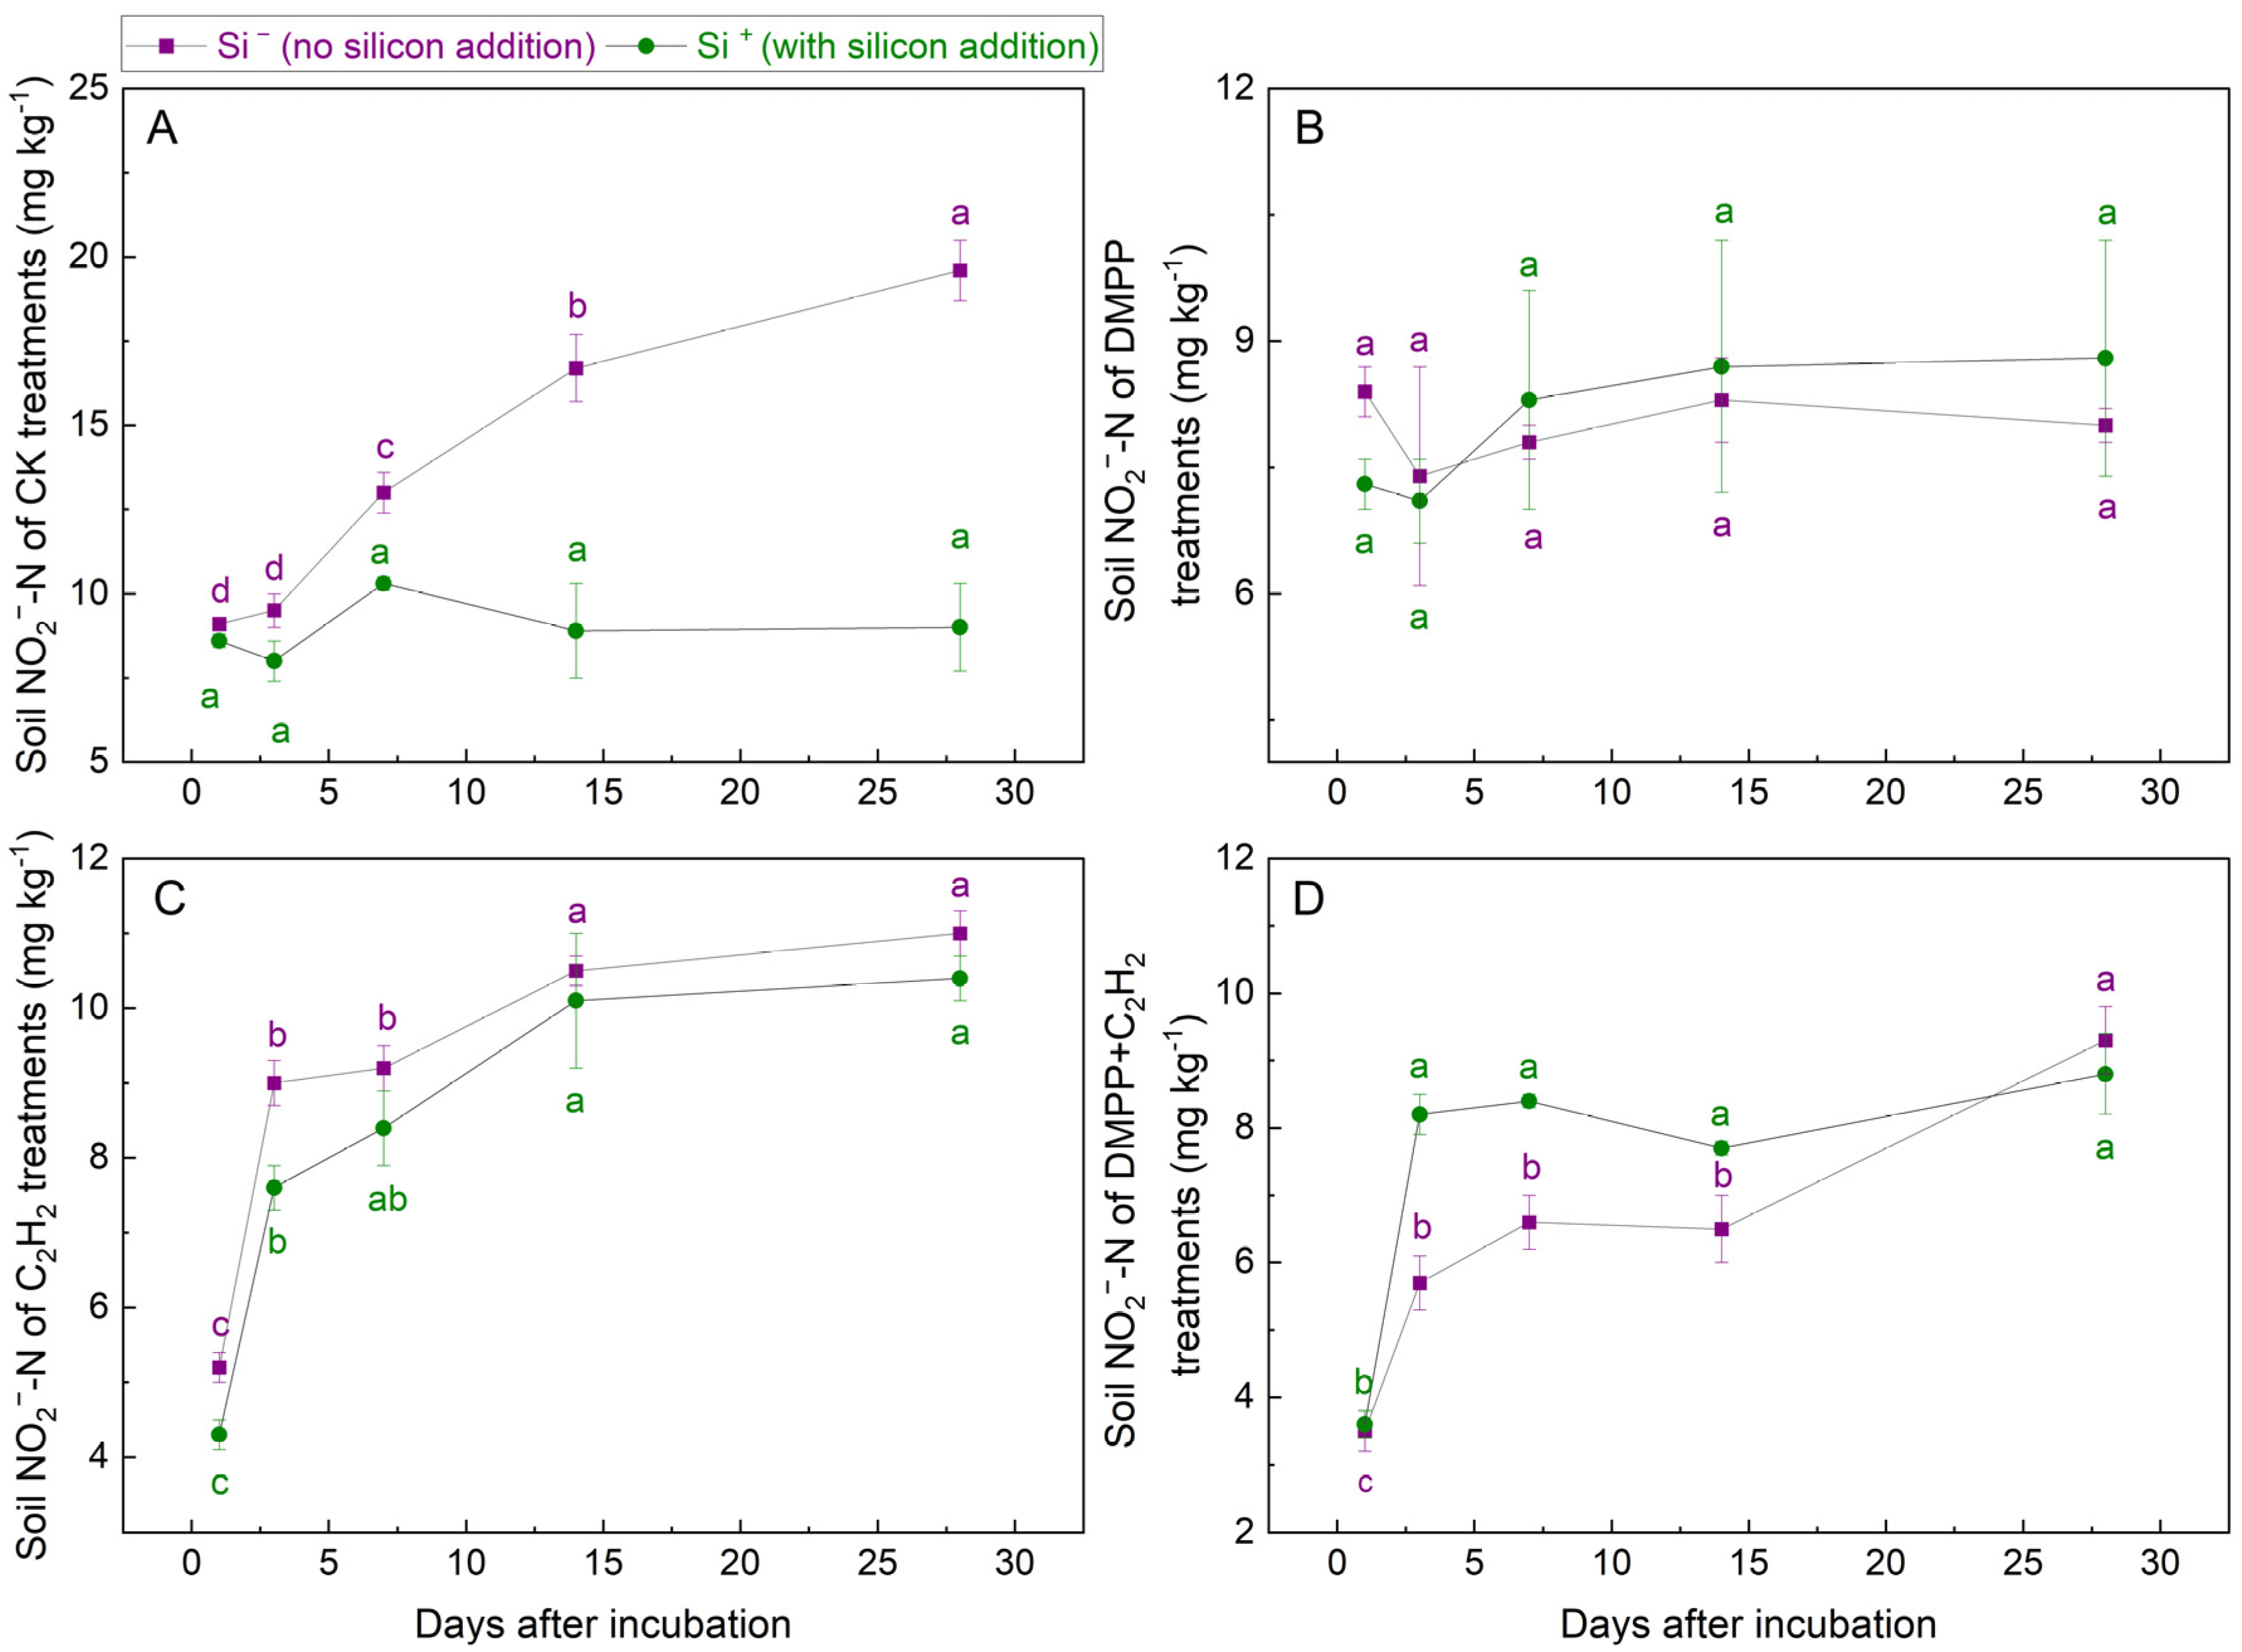
3.1.4. NO2−-N Concentrations
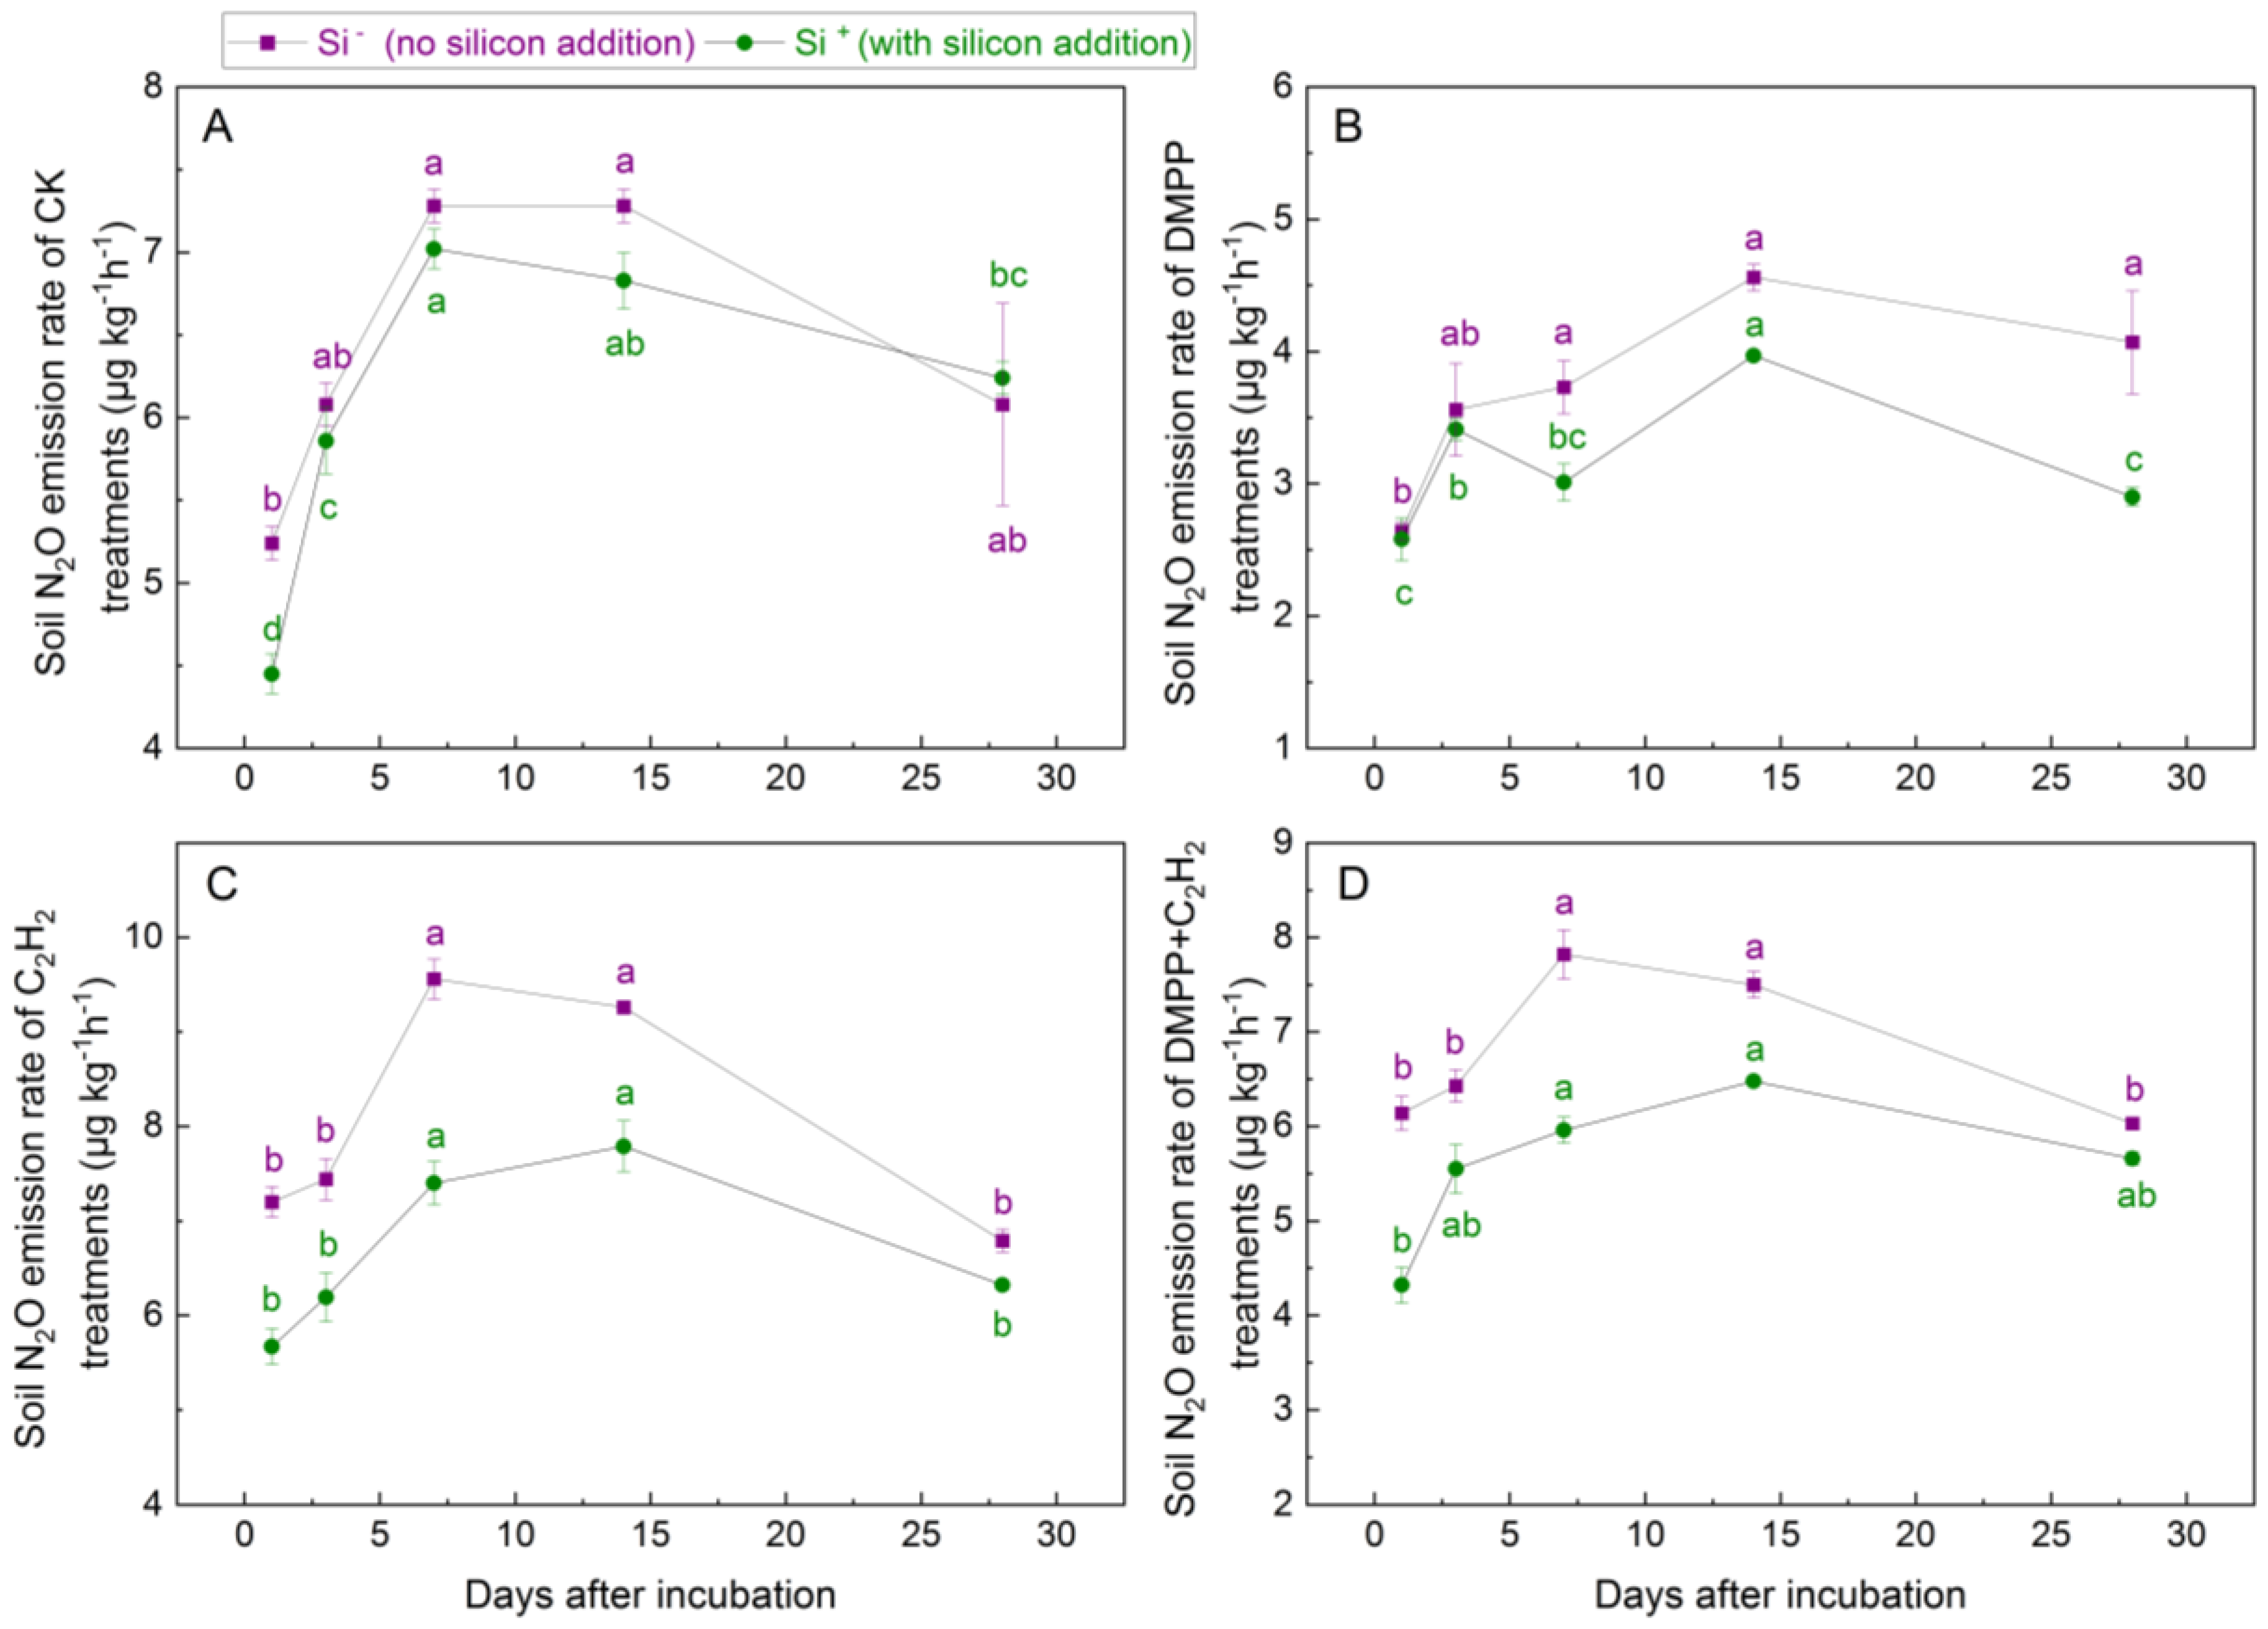
3.2. N2O Emission Rates
3.3. Contributions of Nitrification and Denitrification to N2O Emissions
4. Discussion
4.1. Effect of Silicon Addition on Soil Nitrogen Transformation
4.2. Effect of Silicon Addition on Soil N2O Emission Rate
4.3. Relative Contribution of Nitrification and Denitrification to Soil N2O Emissions
5. Conclusions
Author Contributions
Funding
Data Availability Statement
Acknowledgments
Conflicts of Interest
References
- Caillol, S. Fighting global warming: The potential of photocatalysis against CO2, CH4, N2O, CFCs, tropospheric O3, BC and other major contributors to climate change. J. Photochem. Photobiol. C 2011, 12, 1–19. [Google Scholar]
- Hu, Y. Possible impact of stratospheric polar ozone depletion on tropospheric climate. Acta Sci. Nat. Univ. Pekin. 2006, 42, 561–568. [Google Scholar]
- Revell, L.E.; Tummon, F.; Salawitch, R.J.; Stenke, A.; Peter, T. The changing ozone depletion potential of N2O in a future climate. Geophys. Res. Lett. 2016, 42, 10047–10055. [Google Scholar] [CrossRef]
- Manne, A.; Mendelsohn, R.; Richels, R. MERGE: A model for evaluating regional and global effects of GHG reduction policies. Energy Policy 1995, 23, 17–34. [Google Scholar] [CrossRef]
- Weisser, D. A guide to life-cycle greenhouse gas (GHG) emissions from electric supply technologies. Energy 2007, 32, 1543–1559. [Google Scholar] [CrossRef]
- Ankit, S.; Kazuyuki, I. Effect of slag-type fertilizers on N2O flux from komatsuna vegetated soil and CH4 flux from paddy vegetated soil. Paddy Water Environ. 2015, 13, 43–50. [Google Scholar]
- Wei, Q.; Li, X.; Xu, J.; Dai, H.; Li, B.; Xu, J.; Wang, K. Responses of Soil N2O and CO2 Emissions and Their Global Warming Potentials to Irrigation Water Salinity. Atmosphere 2022, 13, 1777. [Google Scholar] [CrossRef]
- Suter, H.; Lam, S.K.; Walker, C.; Chen, D.L. Enhanced efficiency fertilisers reduce nitrous oxide emissions and improve fertiliser N-15 recovery in a Southern Australian pasture. Sci. Total Environ. 2020, 699, 134147. [Google Scholar] [CrossRef]
- Luo, Z.; Lam, K.; Fu, H.; Hu, S.; Chen, D. Temporal and spatial evolution of nitrous oxide emissions in China: Assessment, strategy and recommendation. J. Clean. Prod. 2019, 223, 360–367. [Google Scholar] [CrossRef]
- Hussain, M.; Butt, A.R.; Uzma, F.; Ahmed, R.; Irshad, S.; Rehman, A.; Yousaf, B. A comprehensive review of climate change impacts, adaptation, and mitigation on environmental and natural calamities in Pakistan. Environ. Monit. Assess. 2020, 192, 1–20. [Google Scholar] [CrossRef]
- Yin, M.; Gao, X.; Tenuta, M.; Kuang, W.; Gui, D.; Zeng, F. Manure application increased denitrifying gene abundance in a drip-irrigated cotton field. PeerJ 2019, 7, e7894. [Google Scholar] [CrossRef] [PubMed]
- Chen, J.; Ma, X.; Lu, X.; Xu, H.; Chen, D.; Li, Y.; Zhou, Z.; Li, Y.; Ma, S.; Yakov, K. Long-term phosphorus addition alleviates CO2 and N2O emissions via altering soil microbial functions in secondary rather than primary tropical forests. Environ. Pollut. 2023, 323, 121295. [Google Scholar] [CrossRef] [PubMed]
- Zhang, S.; Zhou, J.; Chen, J.; Ge, T.; Cai, Y.; Yu, B.; Wang, H.; White, J.C.; Li, Y. Changes in soil CO2 and N2O emissions in response to urea and biochar-based urea in a subtropical Moso bamboo forest. Soil Tillage Res. 2023, 228, 105625. [Google Scholar] [CrossRef]
- Xiao, Y.; Chen, H.; Qiu, L.; Zhang, Y.; Wan, S. Effects of understory removal on soil microbial community composition in subtropical Phyllostachys edulis plantations. J. Appl. Ecol. 2021, 32, 3089–3096. [Google Scholar]
- Li, Y.F.; Jiang, P.K.; Liu, J.; Wang, X.D.; Wu, J.S.; Ye, G.P.; Zhou, G.M. Effect of fertilization on water-soluble organic C, N, and emission of greenhouse gases in the soil of Phyllostachys edulis stands. Sci. Silvae Sin. 2010, 46, 165–170. [Google Scholar]
- Zhang, X.; Wang, L.; Ma, F.; Shan, D. Effects of arbuscular mycorrhizal fungi on N2O emissions from rice paddies. Water Air Soil Pollut. 2015, 226, 1–10. [Google Scholar] [CrossRef]
- Della Chiesa, T.; Piñeiro, G.; Del Grosso, S.J.; Parton, W.J.; Araujo, P.I.; Yahdjian, L. Higher than expected N2O emissions from soybean crops in the Pampas region of Argentina: Estimates from DayCent simulations and field measurements. Sci. Total Environ. 2022, 835, 155408. [Google Scholar] [CrossRef]
- Liu, J.; Jiang, P.; Li, Y.; Zhou, G.; Wu, J.; Yang, F. Responses of N2O flux from forest soils to land use change in subtropical China. Bot. Rev. 2011, 77, 320–325. [Google Scholar] [CrossRef]
- Fungo, B.; Chen, Z.; Butterbach-Bahl, K.; Lehmannn, J.; Saiz, G.; Braojos, V.; Kolar, A.; Rittl, T.F.; Tenywa, M.; Kalbitz, K.; et al. Nitrogen turnover and N2O/N2 ratio of three contrasting tropical soils amended with biochar. Geoderma 2019, 348, 12–20. [Google Scholar] [CrossRef]
- Ma, J.F.; Tamai, K.; Yamaji, N.; Mitani, N.; Konishi, S.; Katsuhara, M.; Ishiguro, M.; Murata, Y.; Yano, M. A silicon transporter in rice. Nature 2006, 440, 688–691. [Google Scholar] [CrossRef]
- Ma, J.; Niu, A.; Liao, Z.; Qin, J.; Xu, S.; Lin, C. Factors affecting N2O fluxes from heavy metal-contaminated mangrove soils in a subtropical estuary. Mar. Pollut. Bull. 2022, 186, 114425. [Google Scholar] [CrossRef] [PubMed]
- Takahashi, E.; Miyake, Y. Distribution of silica accumulator plants in the plant kingdom: (1) Monocotyledons. J. Sci. Soil Manure 1976, 47, 296–300. [Google Scholar]
- Liu, J.; Ma, J.; He, C.; Li, X.; Zhang, W.; Xu, F.; Lin, Y.; Wang, L. Inhibition of cadmium ion uptake in rice (Oryza sativa) cells by a wall-bound form of silicon. New Phytol. 2013, 200, 691–699. [Google Scholar] [CrossRef] [PubMed]
- Sheng, H.; Chen, S. Plant silicon-cell wall complexes: Identification, model of covalent bond formation and biofunction. Plant Physiol. Biochem. 2020, 155, 13–19. [Google Scholar] [CrossRef]
- Wang, W.; Han, R.; Wang, G.; Tang, X.; Liang, B. Research advancement on the radial oxygen loss in wetland plants and its diffusion effect in natural sediments. Acta Ecol. Sin. 2015, 35, 7286–7297. [Google Scholar]
- Bin, Z.J.; Zhang, R.Y.; Zhang, W.P.; Xu, D.H. Effects of nitrogen, phosphorus and silicon addition on leaf carbon, nitrogen, and phosphorus concentration of Elymus nutans in alpine meadow on Qinghai–Tibetan Plateau, China. Acta Ecol. Sin. 2015, 35, 4699–4706. [Google Scholar]
- Xian, W.; Sheng, C. Steel Slag as an Iron Fertilizer for Corn Growth and Soil Improvement in a Pot Experiment. Pedosphere 2006, 16, 519–524. [Google Scholar]
- Song, A.; Fan, F.; Yin, C.; Wen, S.; Zhang, Y.; Fan, X.; Liang, Y. The effects of silicon fertilizer on denitrification potential and associated gene abundance in paddy soil. Biol. Fertil. Soils 2017, 53, 627–638. [Google Scholar] [CrossRef]
- Wang, J.G.; Xia, F.; Zeleke, J.; Zou, B.; Rhee, S.K.; Quan, Z.X. An improved protocol with a highly degenerate primer targeting copper-containing membrane-bound monooxygenase genes for community analysis of methane- and ammonia-oxidizing bacteria. FEMS Microbiol. Ecol. 2017, 93, 244. [Google Scholar] [CrossRef]
- Braker, G.; Conrad, R. Diversity, structure, and size of N2O-producing microbial communities in soils—What matters for their functioning? Adv. Appl. Microbiol. 2011, 75, 33–70. [Google Scholar]
- Firestone, M.K.; Firestone, R.B.; Tiedje, J.M. Nitrous oxide from soil denitrification: Factors controlling its biological production. Science 1980, 208, 749–751. [Google Scholar] [CrossRef] [PubMed]
- Anderson, I.C.; Levine, J.S. Relative rates of nitric oxide and nitrous oxide production by nitrifiers, denitrifiers, and nitrate respirers. Appl. Environ. Microbiol. 1986, 51, 938–945. [Google Scholar] [CrossRef] [PubMed]
- Butterbach-Bahl, K.; Baggs, E.M.; Dannenmann, M.; Kiese, R.; Zechmeister-Boltenstern, S. Nitrous oxide emissions from soils: How well do we understand the processes and their controls? Philos. Trans. R. Soc. B Biol. Sci. 2013, 368, 20130122. [Google Scholar] [CrossRef] [PubMed]
- Jiang, X.Y.; Yao, X.L.; Xu, H.X.; Zhang, L. Dissimilatory nitrate reduction processes between the sediment-water interface in three typical wetlands of middle and lower reaches of Yangtze River. J. Lake Sci. 2016, 28, 1283–1292. [Google Scholar]
- Hu, Y.; Wu, J.; Ye, J.; Liu, X.; Wang, Y.; Ye, F.; Hong, Y. The imbalance between N2O production and reduction by multi-microbial communities determines sedimentary N2O emission potential in the Pearl River Estuary. Mar. Environ. Res. 2023, 190, 106021. [Google Scholar] [CrossRef]
- Lu, R.K. Soil Agrochemical Analytical Methods; China Agricultural Science and Technology Press: Beijing, China, 2000. [Google Scholar]
- Ni, R.; Wang, Y.; Lei, Y.; Song, L. Response of denitrification microbiome to the nitrogen flux in Three Gorges Reservoir (TGR) sediments during two seasonal water fluctuation events. Environ. Res. 2023, 237, 117025. [Google Scholar] [CrossRef]
- Gineyts, R.; Niboyet, A. Nitrification, denitrification, and related functional genes under elevated CO2: A meta-analysis in terrestrial ecosystems. Glob. Change Biol. 2023, 29, 1839–1853. [Google Scholar] [CrossRef]
- Kowalchuk, G.A.; Stephen, J.R. Ammonia-oxidizing bacteria: A model for molecular microbial ecology. Annu. Rev. Microbiol. 2001, 55, 485–529. [Google Scholar] [CrossRef]
- Shimamura, M. Another multiheme protein, hydroxylamine oxidoreductase, abundantly produced in an anammox bacterium besides the hydrazine-oxidizing enzyme. J. Biosci. Bioeng. 2008, 105, 243–248. [Google Scholar] [CrossRef]
- Han, W.Y. Study on Microbial Biomass, Nitrification and Denitrification in Tea Garden Soils. Master’s Thesis, Zhejiang University, Hangzhou, China, 2012. [Google Scholar]
- Ji, C. Mitigation Potentials and Associated Microbial Mechanisms for N2O and NO Emissions Following Biochar Amendment into Acidic Soils in a Tea Plantation. Ph.D. Thesis, Nanjing Agricultural University, Nanjing, China, 2019. [Google Scholar]
- Pedneault, E.; Galand, P.E.; Potvin, M.; Tremblay, J.É.; Lovejoy, C. Archaeal amoA and ureC genes and their transcriptional activity in the Arctic Ocean. Sci. Rep. 2014, 4, 4661. [Google Scholar] [CrossRef]
- Anthonisen, A.C.; Loehr, R.C.; Prakasam, T.B.S. Inhibition of nitrification by ammonia and nitrous acid. J. Water Pollut. Control Fed. 1976, 48, 835–852. [Google Scholar] [PubMed]
- Ding, H.; Cai, G.; Wang, Y.; Chen, D. Nitrification-denitrification loss and N2O emission from maize-wheat rotation system in north China. J. Agro-Environ. Sci. 2003, 22, 557–560. [Google Scholar]
- Qin, S.; Yuan, H.; Hu, C.; Oenema, O.; Zhang, Y.; Li, X. Determination of potential N2O-reductase activity in soil. Soil Biol. Biochem. 2014, 70, 205–210. [Google Scholar] [CrossRef]
- Wrage, N.; Velthof, G.L.; van Beusichem, M.L.; Oenema, O. Role of nitrifier denitrification in the production of nitrous oxide. Soil Biol. Biochem. 2001, 33, 1723–1732. [Google Scholar] [CrossRef]
- Wang, G.L.; Hao, M.D.; Chen, D.L. Effect of stubble incorporation and nitrogen fertilization on denitrification and nitrous oxide emission in an irrigated maize soil. J. Plant Nutr. Fertil. 2006, 12, 840–844. [Google Scholar]
- Zhang, L.H.; Shao, H.B.; Wang, B.C.; Zhang, L.W.; Qin, X.C. Effects of nitrogen and phosphorus on the production of carbon dioxide and nitrous oxide in salt-affected soils under different vegetation communities. Atmos. Environ. 2019, 204, 78–88. [Google Scholar] [CrossRef]
- Yang, J. Effect of N–Si Addition on Phytolith-Occluded Organic Carbon of Phyllostachys edulis. J. Zhejiang A&F Univ. 2024, 41, 369–378. [Google Scholar]
- Pan, B.; Zhang, Y.; Xia, L.; Lam, S.K.; Hu, H.W.; Chen, D. Nitrous oxide production pathways in Australian forest soils. Geoderma 2022, 420, 115871. [Google Scholar] [CrossRef]
- Huang, Y. Soil N2O Emission Feature and Its Microbial Mechanism in Tea Orchard. Ph.D. Thesis, Zhejiang University, Hangzhou, China, 2014. [Google Scholar]
- Liu, Z.P.; Liu, S.J. Advances in the molecular biology of nitrifying microorganisms. Chin. J. Appl. Environ. Biol. 2004, 10, 521–525. [Google Scholar]
- Xu, T.T.; Zheng, J.Q.; Han, S.J.; Zhang, F.L.; Wang, X.X. Acetylene inhibition applied in the nitrification and denitrification. Biotechnology 2009, 19, 95–97. [Google Scholar]
- Shou, N.S.; Huang, D.; Wu, Y.; Chen, R.F.; Zhang, L.Q.; Wu, X.Y. Effects of silicon on microbial community structure of rhizosphere soil of rice at different nitrogen levels. Chin. J. Soil Sci. 2021, 52, 903–911. [Google Scholar]
- He, D.H.; Chen, J.H.; Xu, Q.F.; Shen, Q.L.; Li, Y.C.; Mao, X.W.; Cheng, M. Effects of intensive management on abundance and composition of soil N2-fixing bacteria in Phyllostachys heterocycla stands. Chin. J. Appl. Ecol. 2015, 26, 2961–2968. [Google Scholar]
- Zumft, W.G. Cell biology and molecular basis of denitrification. Microbiol. Mol. Biol. Rev. 2003, 67, 533–616. [Google Scholar]
- Bai, Y.; Wang, Y.; Xiu, H.; Liu, T.; Zou, L.; Liao, G.; Xiao, Q. Experimental study on integrated desulfurization and denitrification of low-temperature flue gas by oxidation method. Sci. Rep. 2024, 14, 3527. [Google Scholar] [CrossRef]
- Zhang, F.Q.; Liu, J.; Chen, X.J. Comparative analysis of bacterial diversity in two hot springs in Hefei, China. Sci. Rep. 2023, 13, 5832. [Google Scholar] [CrossRef]
- Pandey, R.; Singh, C.; Mishra, S.; Abdulraheem, M.; Vyas, D. Silicon uptake and transport mechanisms in plants: Processes, applications and challenges in sustainable plant management. Biol. Futura 2024. [Google Scholar] [CrossRef]
- Wu, L.; Zhang, Y.; Guo, X.; Ning, D.; Zhou, X.; Feng, J.; Yuan, M.M.; Liu, S.; Guo, J.; Gao, Z.; et al. Reduction of microbial diversity in grassland soil is driven by long-term climate warming. Nat. Microbiol. 2022, 7, 1054–1062. [Google Scholar] [CrossRef]
- Wang, F.; Cui, Q.; Liu, W.; Jiang, W.; Ai, S.; Liu, W.; Bian, D. Synergistic denitrification mechanism of domesticated aerobic denitrifying bacteria in low-temperature municipal wastewater treatment. NPJ Clean Water 2024, 7, 6. [Google Scholar] [CrossRef]


| Soil Type | Total N (g kg−1) | pH | SOC (g kg−1) | Alkali-Hydrolysable N (mg kg−1) | Available P (mg kg−1) | Available K (g kg−1) | Available Si (mg kg−1) |
|---|---|---|---|---|---|---|---|
| Red soil | 1.39 | 4.80 | 23.75 | 160.14 | 1.37 | 84.00 | 65.00 |
| Group | Treatment | DMPP | C2H2 | N (mg kg−1) | Si (mg kg−1) |
|---|---|---|---|---|---|
| Si− * | CK | - | - | 80 | 0 |
| DMPP | + | - | 80 | 0 | |
| C2H2 | - | + | 80 | 0 | |
| DMPP + C2H2 | + | + | 80 | 0 | |
| Si+ | CK | - | - | 80 | 25 |
| DMPP | + | - | 80 | 25 | |
| C2H2 | - | + | 80 | 25 | |
| DMPP + C2H2 | + | + | 80 | 25 |
Disclaimer/Publisher’s Note: The statements, opinions and data contained in all publications are solely those of the individual author(s) and contributor(s) and not of MDPI and/or the editor(s). MDPI and/or the editor(s) disclaim responsibility for any injury to people or property resulting from any ideas, methods, instructions or products referred to in the content. |
© 2025 by the authors. Licensee MDPI, Basel, Switzerland. This article is an open access article distributed under the terms and conditions of the Creative Commons Attribution (CC BY) license (https://creativecommons.org/licenses/by/4.0/).
Share and Cite
Yang, J.; Wang, K.; Liu, L.; Li, Y.; Wu, J.; Zhong, J.; Zheng, R.; Fan, L.; Huang, C.; Jiang, P. Effects of Exogenous Silicon Addition on Nitrification and Denitrification-Derived N2O Emissions from Moso Bamboo (Phyllostachys edulis) Forest Soil. Land 2025, 14, 1004. https://doi.org/10.3390/land14051004
Yang J, Wang K, Liu L, Li Y, Wu J, Zhong J, Zheng R, Fan L, Huang C, Jiang P. Effects of Exogenous Silicon Addition on Nitrification and Denitrification-Derived N2O Emissions from Moso Bamboo (Phyllostachys edulis) Forest Soil. Land. 2025; 14(5):1004. https://doi.org/10.3390/land14051004
Chicago/Turabian StyleYang, Jie, Kecheng Wang, Lijun Liu, Yongchun Li, Jiasen Wu, Jinhuan Zhong, Rong Zheng, Lili Fan, Chengpeng Huang, and Peikun Jiang. 2025. "Effects of Exogenous Silicon Addition on Nitrification and Denitrification-Derived N2O Emissions from Moso Bamboo (Phyllostachys edulis) Forest Soil" Land 14, no. 5: 1004. https://doi.org/10.3390/land14051004
APA StyleYang, J., Wang, K., Liu, L., Li, Y., Wu, J., Zhong, J., Zheng, R., Fan, L., Huang, C., & Jiang, P. (2025). Effects of Exogenous Silicon Addition on Nitrification and Denitrification-Derived N2O Emissions from Moso Bamboo (Phyllostachys edulis) Forest Soil. Land, 14(5), 1004. https://doi.org/10.3390/land14051004