Article

A Machine Learning Approach to Generate High-Resolution Maps of Irrigated Olive Groves

by
Rosa Gutiérrez-Cabrera
1,2,
Ana M. Tarquis
1,3 and
Javier Borondo
2,4,*
1
Grupo de Sistemas Complejos, Universidad Politécnica de Madrid, 28040 Madrid, Spain
2
AgrowingData, 04001 Almería, Spain
3
CEIGRAM, Universidad Politécnica de Madrid, 28040 Madrid, Spain
4
ICAI Engineering School, Universidad Pontificia de Comillas, Alberto Aguilera 23, 28015 Madrid, Spain
*
Author to whom correspondence should be addressed.
Land 2025, 14(5), 1001; https://doi.org/10.3390/land14051001
Submission received: 2 March 2025 / Revised: 16 April 2025 / Accepted: 29 April 2025 / Published: 6 May 2025

Abstract

:
The increasing severity of water scarcity in southern Europe, caused by climate change, requires advanced and more efficient approaches to agricultural water management. In particular, in this paper, we address this problem for olive groves—a cornerstone of the region’s economy. We propose a novel framework for generating high-resolution maps of irrigated olive groves that integrates remote sensing imagery and machine learning. Our approach leverages multi-temporal Sentinel-2 data, specifically the Normalized Difference Vegetation Index (NDVI), to capture seasonal vegetation dynamics. For classification, we explore two distinct models: (1) A Dynamic Time Warping (DTW)-based approach (with and without the Sakoe–Chiba Band constraints), where DTW aligns temporal NDVI sequences to enable robust comparisons of irrigation regimes, followed by a K-Nearest Neighbor classifier (KNN) that classifies plots as irrigated or rainfed. (2) An eXtreme Gradient Boosting (XGBoost) model that directly uses temporal NDVI profiles. Additionally, we compare the dependence of model performance on the length of the NDVI time series (ranging from one to seven seasons), finding that XGBoost requires a shorter time series to achieve optimal results, while KNN with DTW can benefit from longer historical records. Indeed, XGBoost nearly reaches its maximum accuracy using only data based on three seasons, achieving 0.79 compared to its peak performance of 0.80. Hence, our results indicate that this approach can accurately differentiate between irrigated and rainfed plots, enabling the generation of high-resolution irrigation maps for southern Spain. Finally, we argue that the results of this paper go beyond mere mapping: they lay the foundation for a comprehensive management guide that can optimize water use, with broad implications. Such implications range from empowering precision agriculture to providing a roadmap for land management, ensuring both the sustainability and productivity of olive groves in drought-affected regions.

1. Introduction

The growing challenge of water scarcity, exacerbated by climate change, poses significant threats to agricultural productivity, ecological sustainability, and economic stability worldwide. This issue is particularly acute in Mediterranean regions such as southern Europe, where agriculture is a cornerstone of the economy and a primary consumer of water resources [1,2,3]. In addition, it is estimated that the decrease in Mediterranean water resources will be 11% by 2060 as a result of both natural factors—such as decreased rainfall and increased temperatures up to 1.5 degrees—and human activities, including inefficient irrigation practices [1,4,5].
In this context, the olive sector faces important challenges that threaten its sustainability, even though the crop is highly adaptable to drought [6]. In particular, Spanish olive groves, which contribute substantially to global olive oil production, exemplify the delicate balance between agricultural productivity and water resource management [1,7]. Addressing this challenge requires innovative approaches to improve water use efficiency and adapt to changing climatic conditions [1,8].
The Guadalquivir River Basin exemplifies these challenges, serving as a case study for integrated water resource management. In olive groves, irrigation remains essential to sustaining productivity; however, traditional methods often lack efficiency. Recent drought management plans in Spain prioritize balancing diverse water demands while sustaining the viability of the olive sector and mitigating broader environmental impacts [9]. Similarly, in Tunisia, irrigation has become critical for maintaining olive groves amidst water scarcity, underscoring the need for efficient water management systems to ensure food security and economic stability [3].
Remote sensing (RS) technologies are transforming agricultural monitoring by providing high-resolution insights into vegetation dynamics, water stress, and land use patterns. Among these tools, spectral indices, such as the Normalized Difference Vegetation Index (NDVI), have emerged as critical instruments for assessing plant health and optimizing irrigation strategies [4,10]. NDVI and other spectral indices are invaluable for identifying spatial and temporal variations in crop conditions, making them ideal for precision agriculture [10,11].
Beyond its role in precision agriculture, RS enables large-scale monitoring of crop dynamics by capturing vegetation changes at regular intervals. This capability is particularly useful for assessing phenological stages and distinguishing between different cropping systems [12]. Various studies have demonstrated the efficiency of both single-date and multi-temporal RS imagery for crop classification [3,13]. In particular, multi-temporal approaches enhance classification accuracy by leveraging temporal patterns to differentiate between crops and their phenological stages [12]. This study employs multi-temporal Sentinel-2 imagery to analyze NDVI trends, leveraging its proven effectiveness in tracking vegetation health and dynamics [11].
Recent advancements in time-series (TS) analysis have further enhanced the utility of RS in agriculture. Techniques such as Dynamic Time Warping (DTW) have proven effective in aligning and analyzing vegetation dynamics in various agricultural systems, including rice in Vietnam and sugarcane in Brazil [3,14,15]. These innovations hold particular promise for Mediterranean olive groves, where irrigation practices and vegetation growth vary widely across regions and seasons [3]. By leveraging advanced RS tools and analytical techniques, as demonstrated in previous research studies that were conducted in Spain and Tunisia, innovative frameworks can effectively differentiate between irrigated and rainfed plots, paving the way for sustainable water management in drought-prone regions [2,3]. Thus, we take advantage of DTW to measure the distance between the NDVI TS of olive groves and use it to classify the water management regime. In addition, we show that limiting the horizontal warping of DTW is a key factor to achieve optimal results.
Machine learning (ML) is emerging as a powerful complementary tool, revolutionizing RS applications with robust frameworks for drought monitoring and water management solutions. Models such as Random Forest (RF) and eXtreme Gradient Boosting (XGBoost) have demonstrated exceptional accuracy in integrating multi-source RS data for drought detection and prediction [10,12,16]. These models excel in handling complex, multi-dimensional datasets, making them ideal for applications such as drought monitoring, irrigation mapping, and yield prediction [12,16]. In this trend, a study in Southwest China demonstrated the superior performance of XGBoost by combining spectral indices with land surface temperature data. It was concluded that it enhances the precision of agricultural monitoring and decision making [12].
Combining DTW with ML classifiers has proven particularly effective for agricultural classification tasks. A recent study on wetland vegetation mapping in China achieved high accuracy using DTW-enhanced K-Nearest Neighbor (KNN) models [17]. Similarly, integrating LSTM models with DTW has shown promise for the short- and medium-term prediction of vegetation indices, further extending the potential of these methodologies [18].
In the context of olive groves, these advancements are particularly significant. Studies conducted in regions such as Tunisia have leveraged vegetation indices and thermal RS data to differentiate between irrigated and rainfed plots [3]. These efforts have not only optimized irrigation practices but have also laid the groundwork for broader strategies to enhance food security and promote environmental sustainability in drought-affected areas [19]. In this paper, we follow this line and propose and analyze an efficient framework to differentiate irrigated and rainfed olive groves using ML, relying exclusively on NDVI TS. Moreover, we also examine how model performance depends on the length of the TS, concluding that optimal results can be achieved with as little as 3 years of data.
The remainder of this paper is organized as follows: In Section 2, we describe the data and present the methodology, introducing the ML models. In Section 3, we present our results, which compare the performance of several ML models. Finally, Section 4 summarizes and discusses our major conclusions.

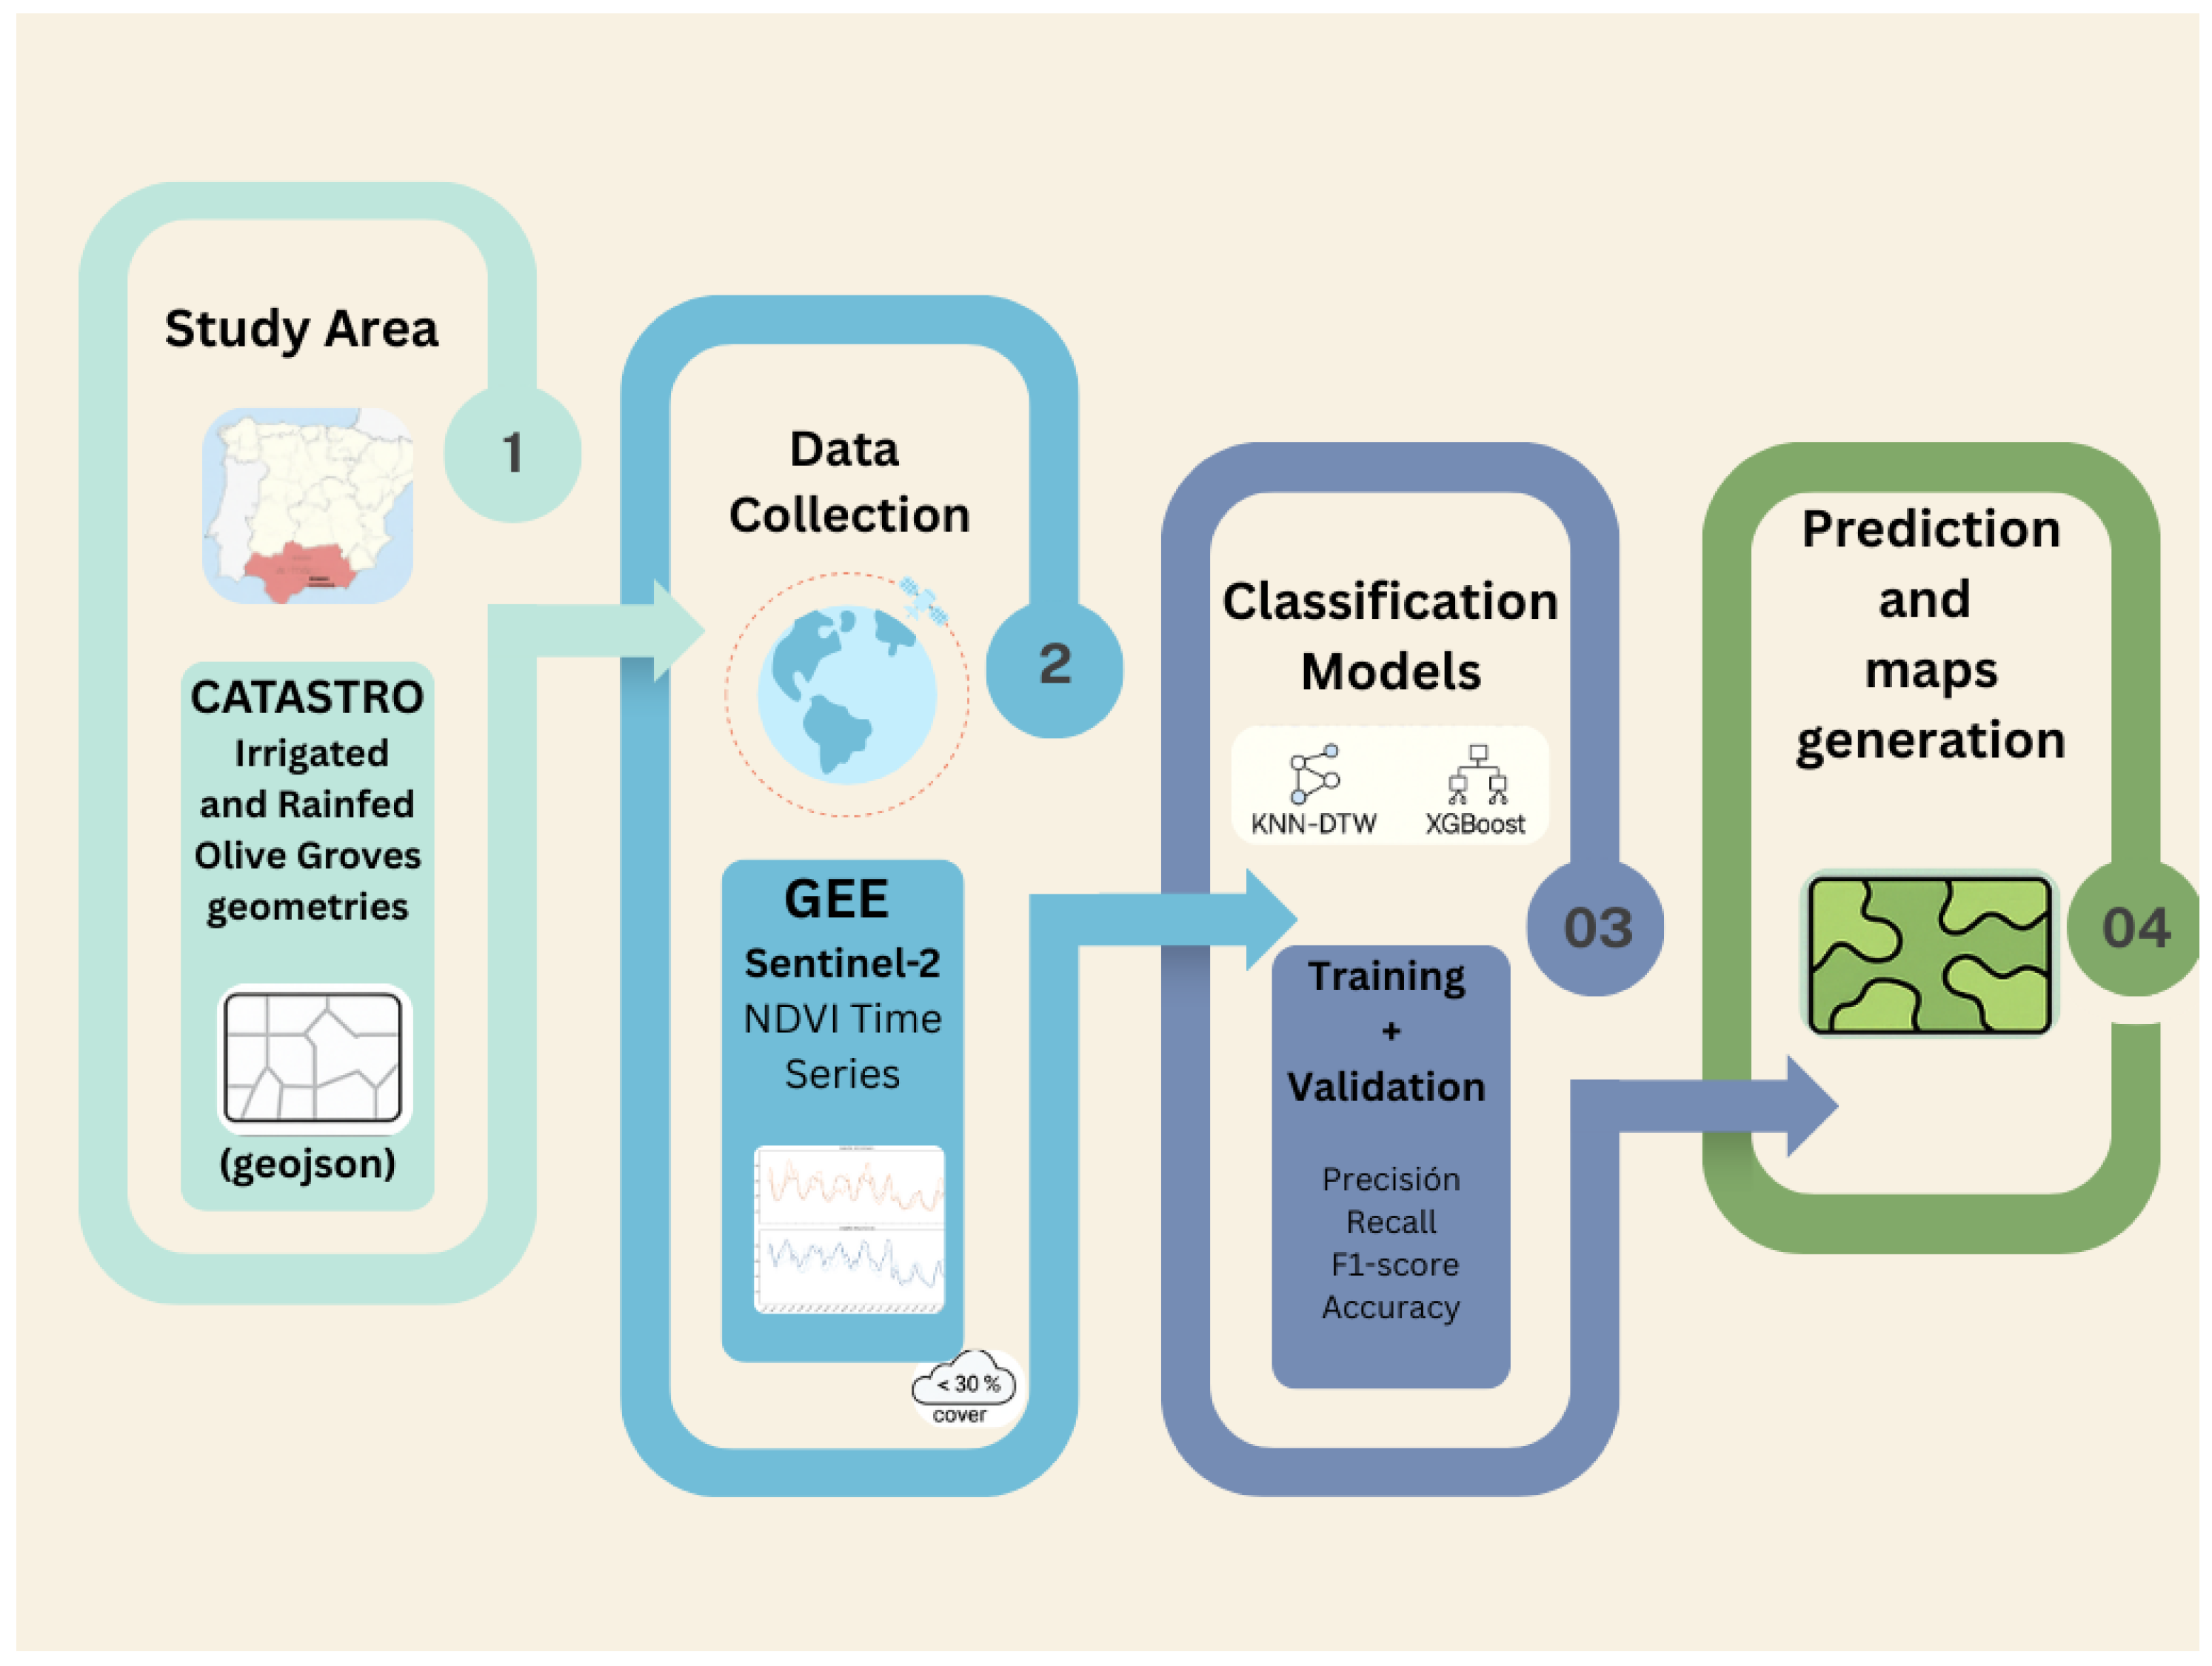
2. Materials and Methods
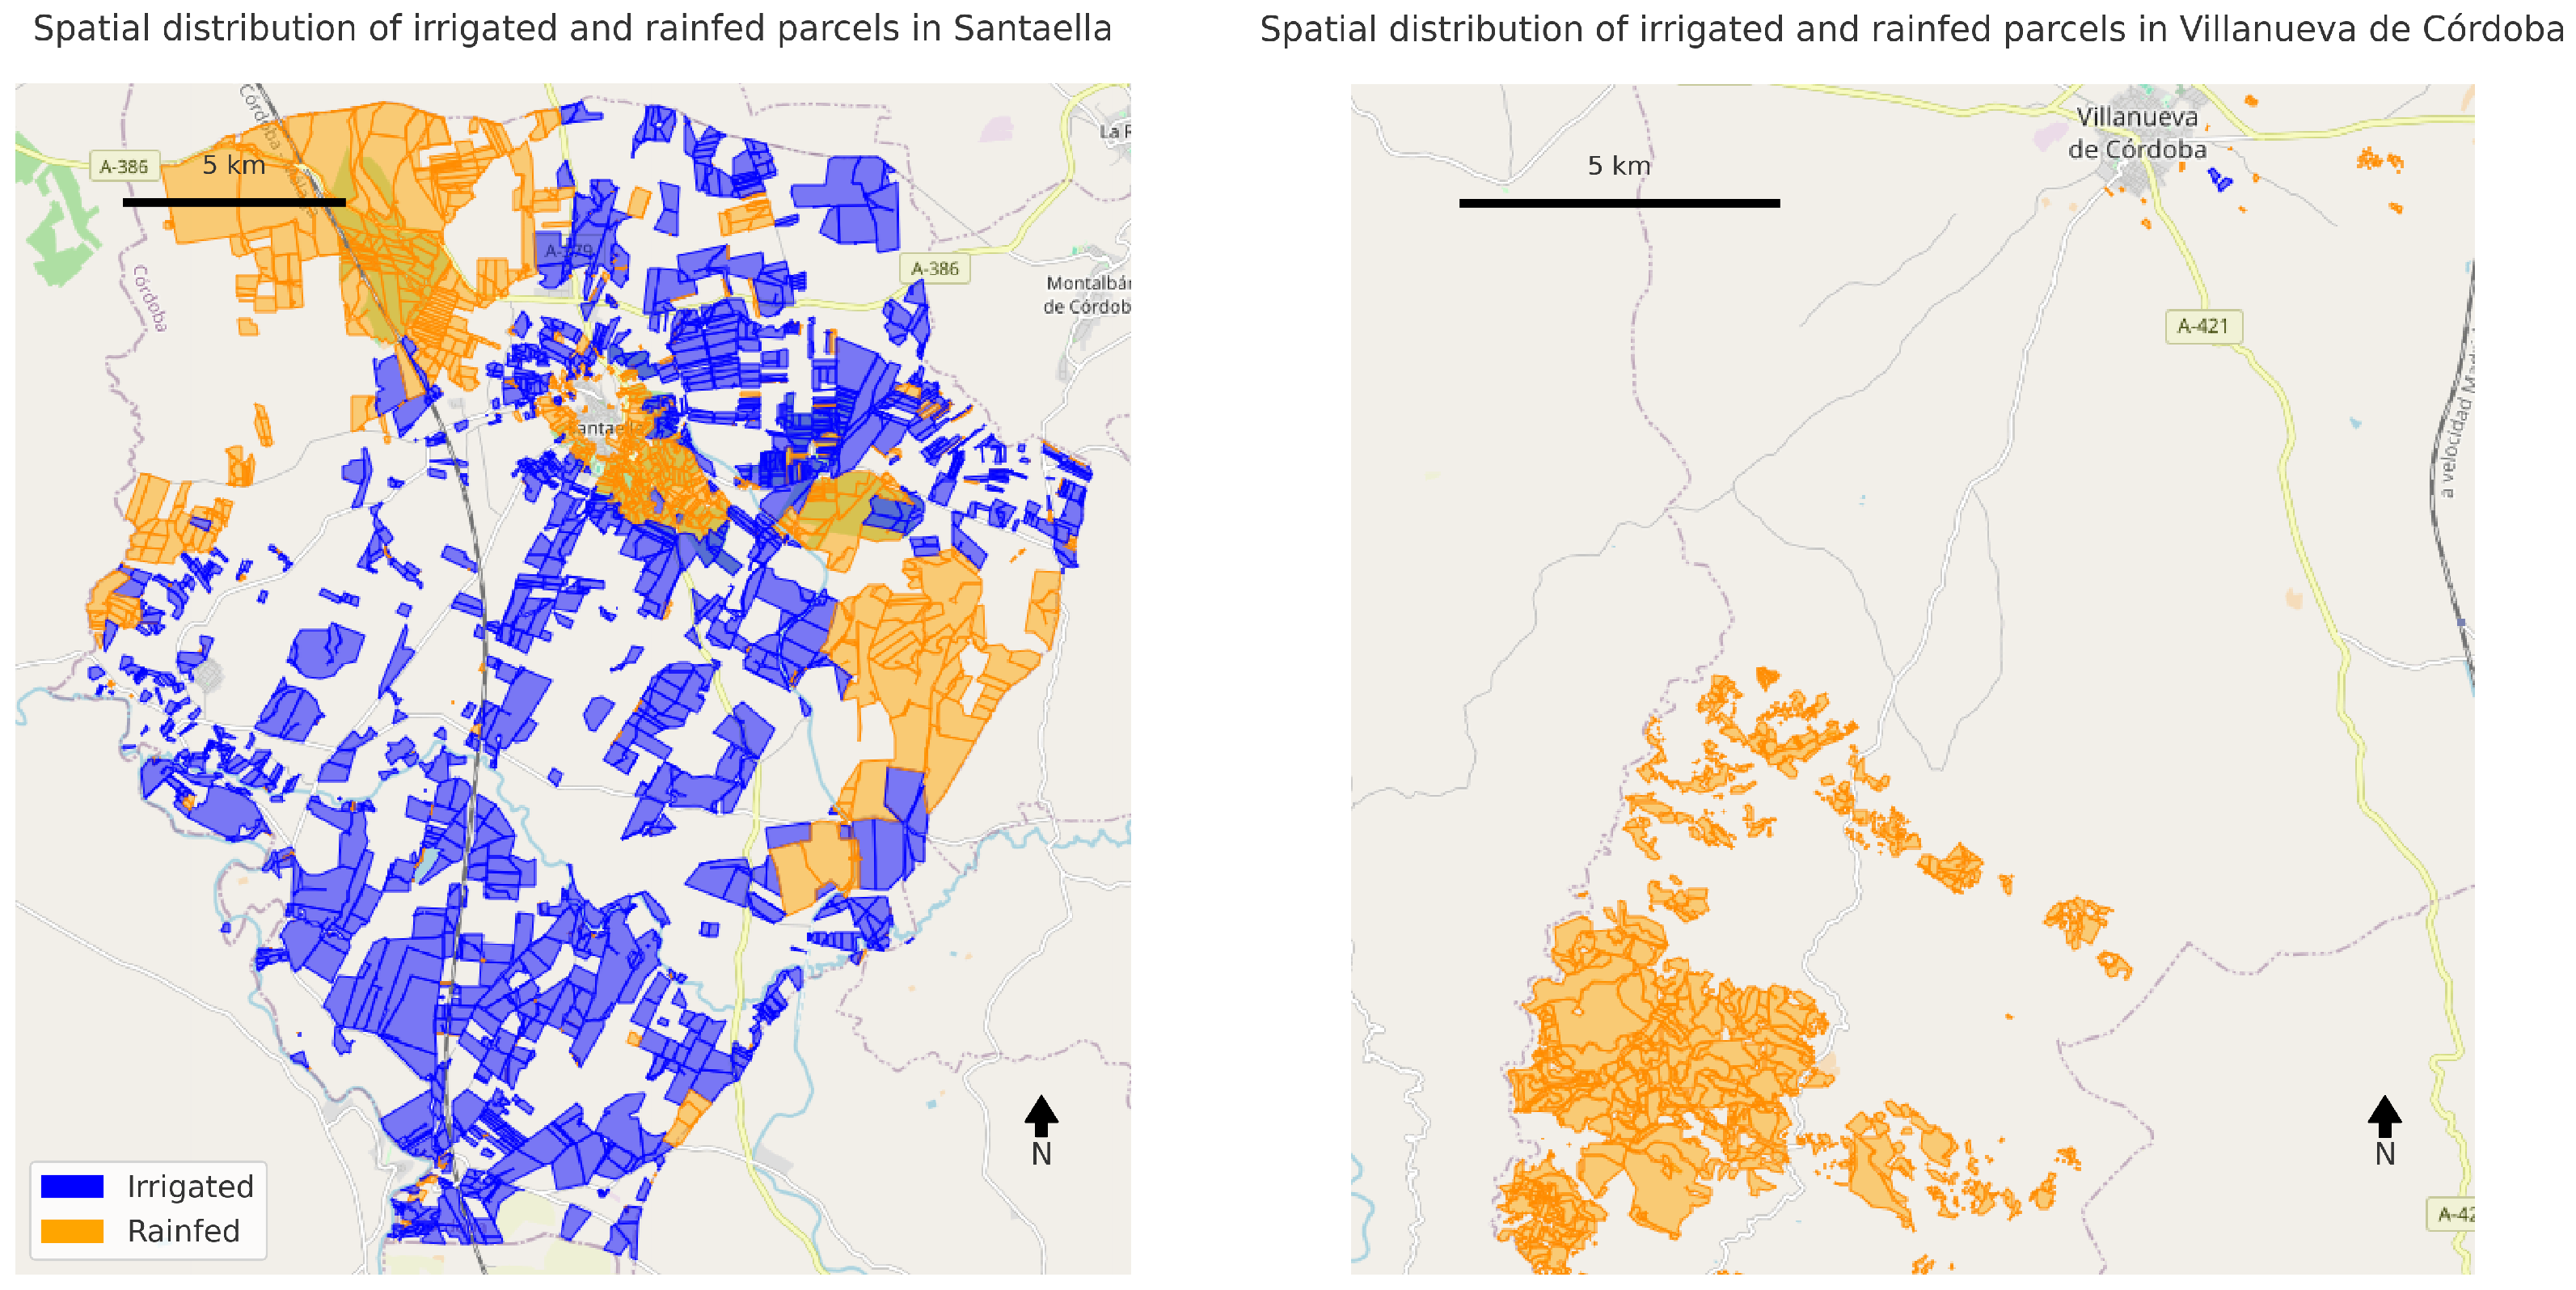
2.1. Study Area

In search of a study area that possesses diverse topographic features and varied irrigation management strategies, two municipalities, Santaella and Villanueva, located in Córdoba, Andalusia, were selected. This area in southern Spain is distinguished by its extensive olive groves, with olive cultivation representing more than 91% of land use in certain areas [20] and encompassing a mixture of traditional rainfed systems and modern irrigated plantations [21].
In addition, Andalusia’s climate, characterized by semi-arid conditions, presents the challenge of water scarcity because these conditions make it a critical area for studying sustainable practices in olive farming [22]. In concrete, the agricultural landscapes of Córdoba offer a unique opportunity to analyze diverse agricultural practices under changing climatic conditions. This region’s climate shows a seasonal rainfall pattern, with most precipitation occurring between autumn and spring, although spring rainfall has been irregular in recent years. Limited precipitation and extreme temperatures from March to June during certain seasons have intensified drought stress in rainfed groves, emphasizing the need for adaptive water management strategies. For these reasons, the region has seen a notable increase in irrigated olive groves, driven by the need to adapt to water scarcity [20], highlighting the importance of Córdoba as a case study to advance efficient water management technologies and prioritize adaptive agricultural practices.

2.2. Data Collection

To effectively monitor different olive grove management systems, this study uses Google Earth Engine (GEE) to extract NDVI values from Sentinel-2 surface reflection data. The methodology is structured to ensure both spatial accuracy, by leveraging parcel geometries, and temporal consistency, through the extraction of NDVI values at weekly intervals.

2.2.1. Defining Parcel Geometries Using Catastro Data

To enhance spatial precision, olive grove boundaries from both municipalities (Santaella and Villanueva de Córdoba) are obtained from Catastro, the official land registry [23]. The cadastral dataset was pre-processed to include essential attributes such as parcel ID and those related to irrigation status (rainfed or irrigated). Parcel boundaries were automatically extracted from the official cadastral website using web scraping techniques implemented in Python. The extracted data, initially stored in Well-Known Text (WKT) format, were subsequently converted into Shapely polygons and transformed into a GeoJSON FeatureCollection. This processing workflow was entirely developed in Python, utilizing the Shapely library for geometry handling and GeoPandas for the management, manipulation, and export of parcel data. The resulting structured format enables seamless integration with Google Earth Engine (GEE) for geospatial processing of 1155 irrigated and 1284 rainfed olive parcels (see Figure 1). However, it should be noted that the irrigation status (irrigated or rainfed) assigned to each parcel was derived from the cadastral data at the time of data acquisition and assumed to remain constant over the study period, due to the absence of historical management information.
In addition to irrigation classification, parcel surface statistics were derived to characterize the spatial structure of the study area. A summary of parcel surface characteristics for both municipalities is provided in Table 1.
In Santaella, parcel sizes ranged from 0.0017 ha to 169.64 ha, with a mean area of 3.68 ha and a median of 1.04 ha. In Villanueva de Córdoba, parcels ranged from 0.0026 ha to 107.64 ha, with a mean of 2.08 ha and a median of 0.50 ha. When considering irrigation status, irrigated parcels generally exhibited larger mean areas (3.81 ha) compared to rainfed parcels (2.80 ha), reflecting the typical trend of larger parcel consolidation under irrigation schemes. These size distributions reflect the typical heterogeneity of olive groves in Andalusia.

2.2.2. Filtering Sentinel-2 Images

To maintain data quality and minimize atmospheric distortions, Sentinel-2 Surface Reflectance (S2_SR_HARMONIZED) imagery is filtered based on temporal and spatial constraints. The dataset covers the period from 2017 to 2024, ensuring a multi-seasonal perspective. Only images with less than 30% cloud cover, based on the CLOUDY_PIXEL_PERCENTAGE metadata provided with each product, are selected to minimize the influence of clouds and shadows [24]. This approach follows standard Sentinel-2 data pre-processing practices. A geometric intersection is performed to retain only those images overlapping with the predefined parcel boundaries. NDVI is derived from Sentinel-2 spectral bands, specifically the near-infrared ( B 8 ) and red ( B 4 ) bands, using the following standard formula:
N D V I = ( B 8 B 4 ) ( B 8 + B 4 )
For each parcel, Sentinel-2 imagery is processed to compute NDVI values for every valid pixel. Cloud masking is applied to remove high-interference pixels, ensuring data reliability. To maintain temporal consistency, NDVI values are aggregated weekly, retaining the highest NDVI value per week.

2.3. Machine Learning: Classification Models

To classify the olive groves based on NDVI-TS data, two ML models were implemented using the Python 3.12 programming language within a local computing environment, independent from Google Earth Engine (GEE): KNN with DTW, and XGBoost. These models were selected based on their ability to handle time-series data and their proven performance in classification tasks related to vegetation monitoring.

2.3.1. Dynamic Time Warping

DTW was employed to measure similarities between NDVI TS-sequences while allowing flexible temporal alignments. Unlike traditional Euclidean distance, DTW accommodates variations in NDVI peak timing, which is crucial for monitoring phenological differences between irrigated and rainfed groves [17].
DTW operates by computing an optimal alignment between two TSs, minimizing the cumulative cost of matching points:
Γ ( i , j ) = d ( x i , y j ) + min Γ ( ( i 1 , j 1 ) , Γ ( i 1 , j ) ) , Γ ( i , j 1 )
where d ( x i , y j ) represents the point-wise distance, typically computed using Euclidean or Mahalanobis distance [16]. The warping path is then derived to find the best alignment between the NDVI trajectories of different parcels.

2.3.2. The Sakoe–Chiba Band as a Constraint

To ensure computational efficiency and prevent excessive warping, the Sakoe–Chiba Band was applied as a global constraint on DTW. This band limits the allowable warping to a predefined window around the diagonal, ensuring that only temporally close points are matched, reducing overfitting and computational complexity [25]. The band size R is defined as follows:
R = round ( r / 100 ) × ( n 1 )
where r represents the percentage width of the band [26]. Studies have shown that optimal tuning of the Sakoe–Chiba Band improves classification accuracy in TS datasets while maintaining computational efficiency [11].

2.3.3. KNN with DTW

KNN is a non-parametric algorithm that classifies data points based on their similarity to their nearest neighbors [16]. Given that NDVI values vary temporally across different plots, DTW was used as the distance metric to align TS sequences and improve classification accuracy. The optimal number of neighbors (k) was determined through iterative testing, balancing bias–variance trade-offs. This method provided an advantage in recognizing subtle temporal variations in NDVI curves, which are indicative of phenological changes.

2.3.4. XGBoost

XGBoost is a gradient boosting algorithm known for its high computational efficiency and accuracy. It enhances traditional decision trees through iterative optimization, regularization, and parallel computation [14]. Based on the principle of Tree Boosting, XGBoost builds a strong predictive model by combining an ensemble of weak learners, i.e., decision trees. In XGBoost, each tree is trained to correct the errors made by the previous ones. Specifically, after each iteration, misclassified observations receive higher weights, while correctly classified ones lose weight. The XGBoost models were trained with NDVI values, incorporating first- and second-order derivatives to capture growth trends. To prevent overfitting, L1 (Lasso) and L2 (Ridge) regularization terms were adjusted, avoiding excessive complexity while retaining relevant features. L1 adds the absolute values of coefficients as a penalty to the loss function, reducing the impact of less relevant features, helping the model focus on the most significant NDVI trends. L2 penalizes the squared values of coefficients, ensuring that the learned feature weights remained small and balanced.

2.3.5. Model Train and Evaluation

Each model was trained and tested using a 70/30 training/testing split, ensuring that evaluation was conducted on out-of-sample data. Additionally, during training, we applied K-fold cross-validation to select the optimal parameters for each model. Finally, model performance was assessed on the test set using the following metrics:
P r e c i s i o n = T r u e P o s t i t i v e s T r u e P o s i t i v e s + F a l s e P o s i t i v e s   R e c a l l = T r u e P o s i t i v e s T r u e P o s i t i v e s + F a l s e N e g a t i v e s   A c c u r a c y = T r u e P o s i t i v e s + T r u e N e g a t i v e s T r u e P o s i t i v e s + F a l s e N e g a t i v e s + T r u e N e g a t i v e s + F a l s e P o s i t i v e s   F 1 S c o r e = 2 × P r e c i s i o n × R e c a l l P r e c i s i o n + R e c a l l
To provide a clear overview of the methodological framework adopted in this study, we present a flowchart in Figure 2 summarizing the main steps involved in the data collection, processing, classification, and prediction workflow.

3. Results

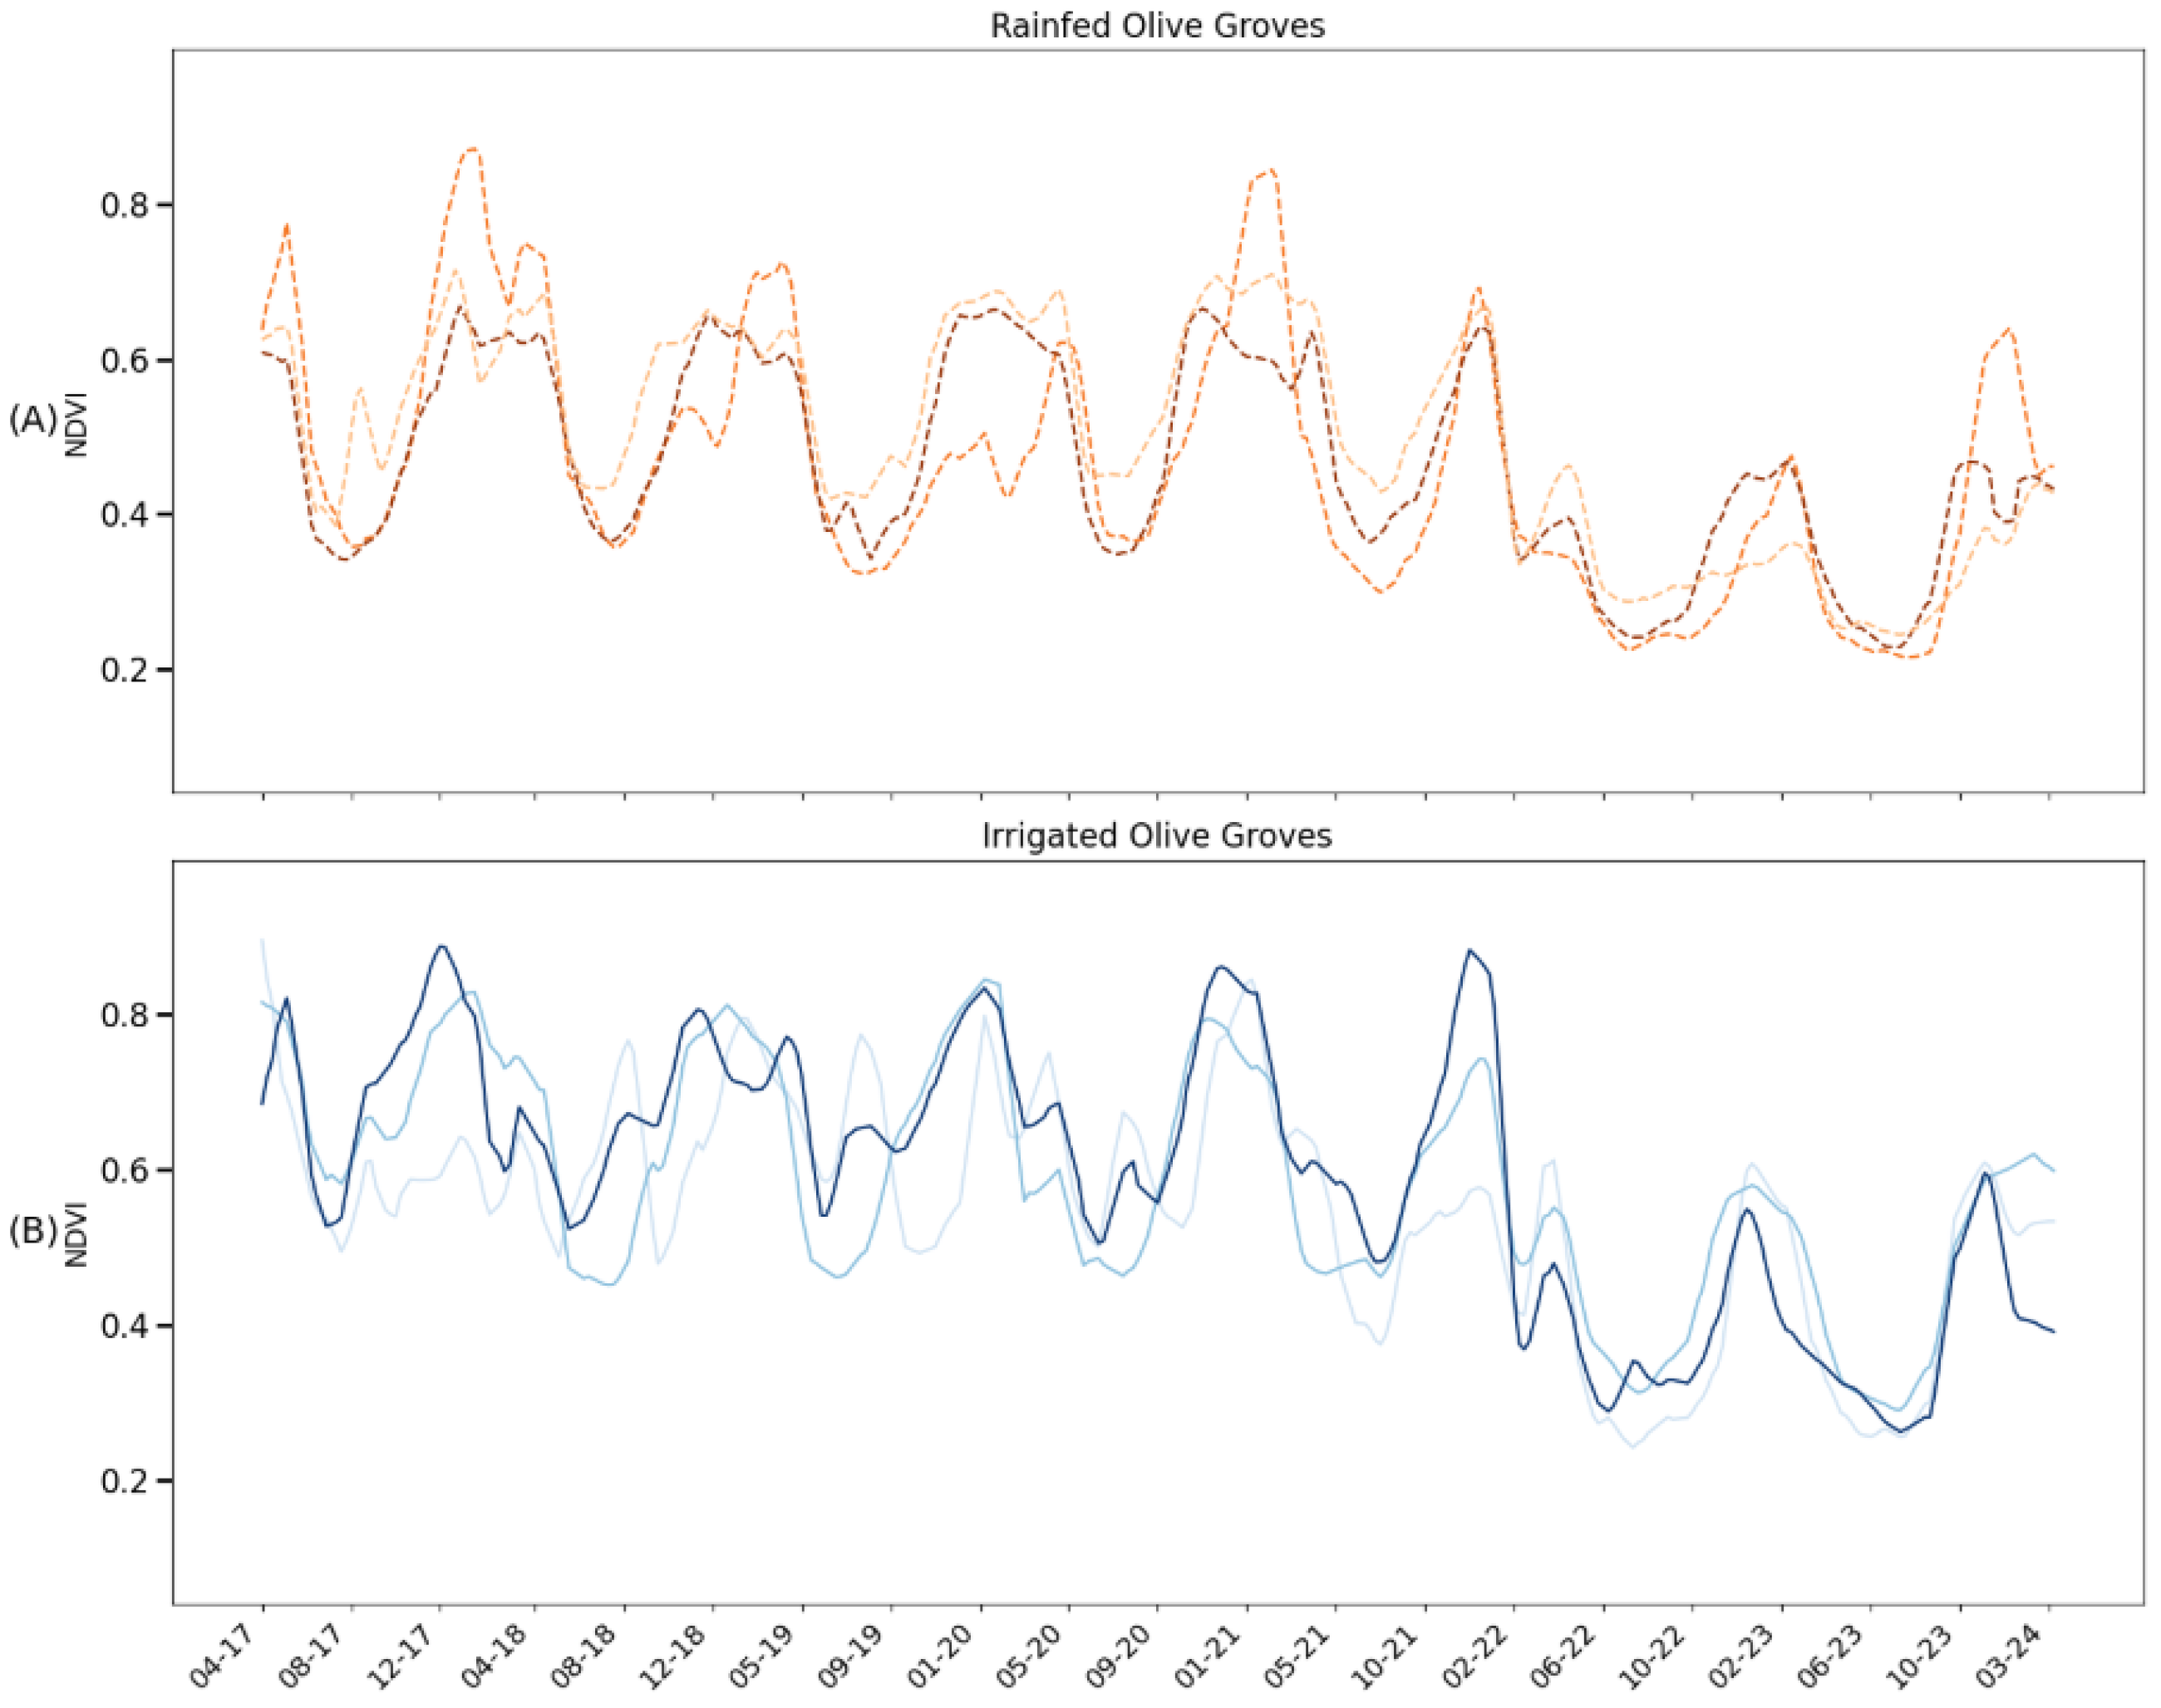
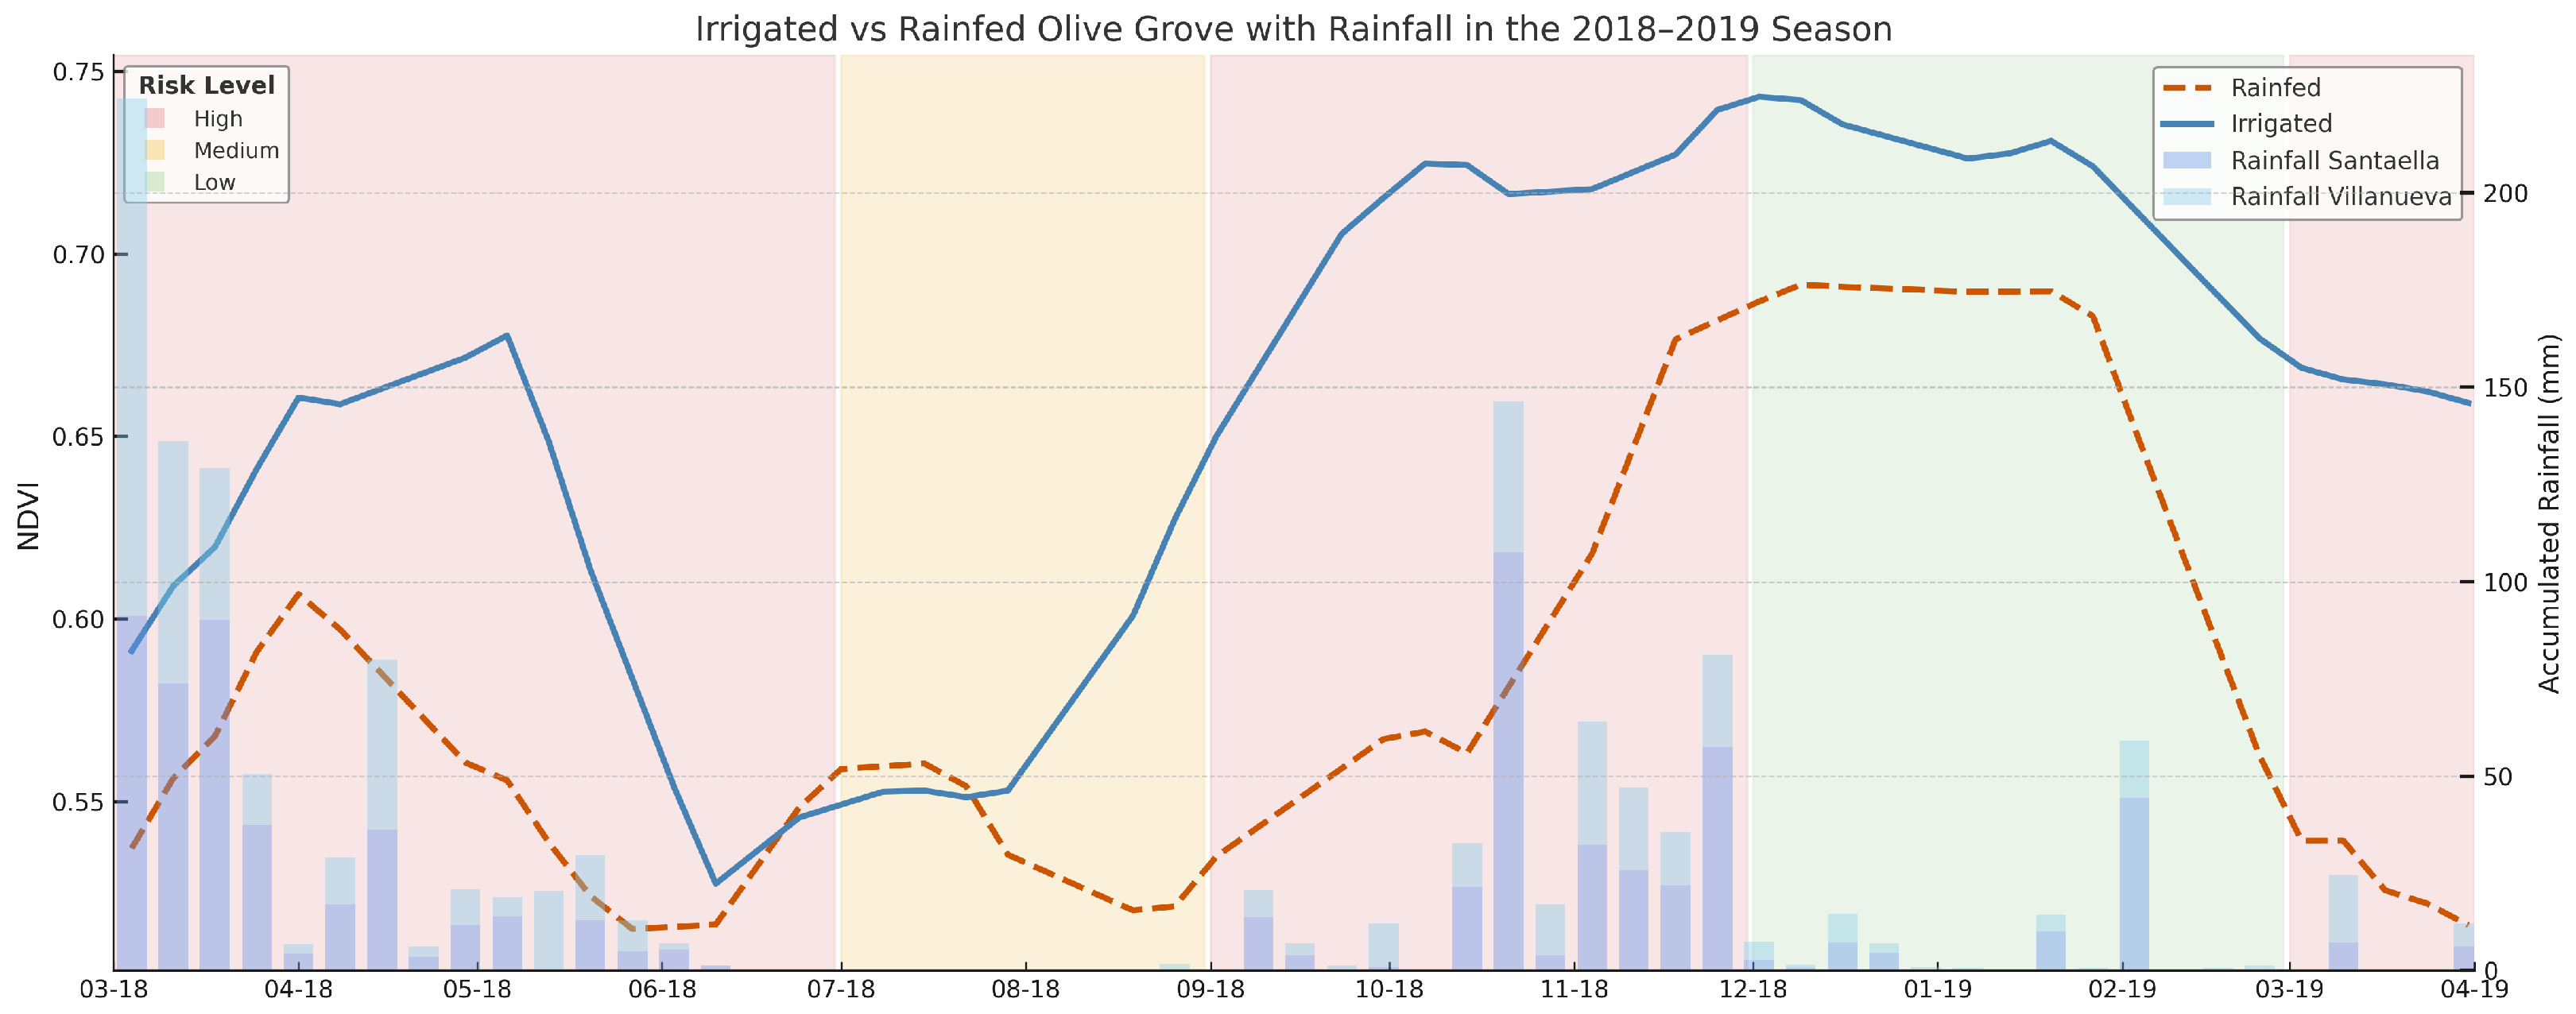
3.1. NDVI Time Series in Rainfed and Irrigated Olive Groves: Characterization and Comparisons

First, we analyze the NDVI-TS of rainfed and irrigated olive groves. Figure 3 presents the NDVI-TS for a selection of rainfed (Panel A) and irrigated (Panel B) olive groves across multiple campaigns. As shown, these TSs exhibit distinct temporal patterns between the two management regimes, highlighting the impact of irrigation practices on vegetation dynamics.
Rainfed olive groves exhibited pronounced seasonal variability, with NDVI values peaking during spring and fall, followed by a sharp decline in summer. This pattern aligns with the natural phenological cycle of olive trees under water-limited conditions [6]. The peaks in NDVI correspond to periods of active growth, driven by the availability of soil moisture from winter rains. However, the lower NDVI values during the dry season highlight the constraints imposed by limited water availability, which reduces vegetation vigor while causing less stable vegetative health and delaying recovery in subsequent growth cycles [16].
In contrast, irrigated olive groves show consistently higher NDVI values and a more stable NDVI pattern throughout the years, with less pronounced seasonal fluctuations. This stability is attributed to supplemental irrigation, which mitigates water stress and maintains higher vegetation productivity during the dry season [25,27]. The alignment of NDVI peaks with phenological stages, such as flowering and fruit development, suggests that irrigation practices effectively support the physiological needs of the crop during critical growth periods. However, variability among irrigated plots may reflect differences in irrigation strategies, soil properties, and water availability.
At the same time, the impact of prolonged drought conditions from 2022 onward is evident in both rainfed and irrigated olive groves. This is illustrated in Figure 3. Rainfed groves experienced a significant NDVI decline, with lower seasonal peaks, reflecting increased water stress and reduced vegetation growth. The downward trend in NDVI suggests that water scarcity has intensified, particularly in the summer months. Notably, since 2022, the NDVI patterns between the two grove types have become increasingly similar, indicating close trends. This convergence raises important questions about the resilience of both systems under drought conditions. Although irrigated groves show declines in NDVI levels, they maintain higher NDVI values than rainfed groves. This suggests that irrigation may have been insufficient to fully compensate for the extreme drought. Nonetheless, irrigated groves exhibit more stable trends compared to rainfed groves, highlighting the role of irrigation in reducing stress and maintaining vegetation health.
To further illustrate the effect of irrigation on mitigating water stress, Figure 4 offers a detailed view of NDVI variation in a single growing season (2018–2019), and the color-coded background highlights periods in which extreme water stress can lead to serious, moderate, or minor impacts on production [28,29]. As shown, the rainfed grove (orange line) shows a progressive decline in NDVI during the summer months, indicating reduced vegetation vigor, likely due to water stress and physiological adjustment. This decline is particularly evident from late spring through early fall, a period when water scarcity can limit growth and trigger conservation mechanisms such as stomatal closure and reduced photosynthetic activity. In contrast, irrigated grove (blue line) sustains higher and more stable NDVI values, suggesting that supplemental irrigation during high-risk months supports physiological activity, migrates severe water stress and enhances crop resilience. These observations highlight the differing management techniques observed in rainfed and irrigated olive groves.

3.2. Machine Learning for Mapping Irrigated Olive Groves

In this section, we will develop and train different ML models that effectively classify olive grove parcels into rainfed or irrigated ones. The performance of the models in classifying irrigated and rainfed olive groves is then evaluated under various temporal configurations and feature combinations. We used the following metrics to evaluate and compare the models: accuracy, precision, recall, and F1 score.

3.2.1. Classification of Water Management Regimes Using KNN-DTW

Building on the observed differences between the TSs of irrigated and non-irrigated olive groves, the underlying intuition behind this approach is that olive groves under the same water management regime exhibit similar temporal patterns. In contrast, those under different regimes show greater divergence. Then, to classify the two management regimes, we first apply a model based on the distance between the NDVI-TS. Specifically, we use the KNN algorithm with DTW as the distance metric, leveraging its ability to align the NDVI-TS effectively. This initial model serves as a baseline for distinguishing rainfed and irrigated groves. We used the NDVI-TS of 7 years (2017–2024) and trained and evaluated the model as described in Section 2.3.5. This configuration of the model achieved an accuracy of 0.72 , a precision of 0.73 , a recall of 0.72 , and an F1 score of 0.72 on the test set (see Table 2). Overall, the model demonstrated a reasonably good ability to identify the water management regime of each olive grove parcel. Notably, the balance between precision and recall indicates that the model is equally effective at identifying both classes, without a tendency to overestimate either. However, despite the model demonstrating a fair level of performance, the metrics are not optimal, leaving room for improvement.
To enhance the KNN-DTW model, we incorporated the Sakoe–Chiba Band constraint (see Section 2.3.2 for more details). Sakoe–Chiba constraints limit excessive temporal warping, preventing distortions in distance measurements between time series. Consequently, this significantly improved the performance of KNN-DTW, achieving an accuracy, precision, recall, and F1 score of 0.76 (see Table 2). Remarkably, this configuration preserves the balance between precision and recall while substantially enhancing overall performance. These results further underscore the importance of optimizing temporal alignment, as it reduces overfitting and improves the model’s ability to distinguish subtle temporal differences between irrigated and rainfed plots.

3.2.2. Classification of Water Management Regimes Using XGBoost

Despite the performance improvement from incorporating the Sakoe–Chiba Band constraint, the high dimensionality of the NDVI-TS can still present a challenge for distance-based methods like KNN. Given this limitation, we train an XGBoost model. XGBoost is a ML algorithm known for its efficiency in handling high-dimensional data, as it can efficiently manage complex feature spaces, capturing non-linear relationships. This makes it a suitable choice for overcoming the dimensionality challenges inherent in TS classification.
The XGBoost configuration, trained on the previously described training set—where each parcel’s TS spanned the full seven-year period—demonstrated superior performance when evaluated on the test set. Full details of the comparison are presented in Table 2, which shows that all metrics increased, reaching 80 % for accuracy, recall, and F1 score, and 81 % for precision.
Next, we use this configuration of the XGBoost model to generate a predictive irrigation map for the municipality of Bujalance—an area not included in the original data used to train and validate the models. With this map, we aim to underscore the capability and utility of the model to generalize and identify regions with a higher likelihood of irrigated fields. The resulting maps are presented in Figure 5. These maps not only highlight areas with expected higher irrigation density (Figure 5A) but also provide fine-grained, per-pixel insights (Figure 5A), offering valuable details on irrigation patterns within individual parcels (Figure 5C,D). In fact, we believe that this level of spatial detail can support more informed decisions on irrigation effectiveness and help identify areas where additional water management may be needed.

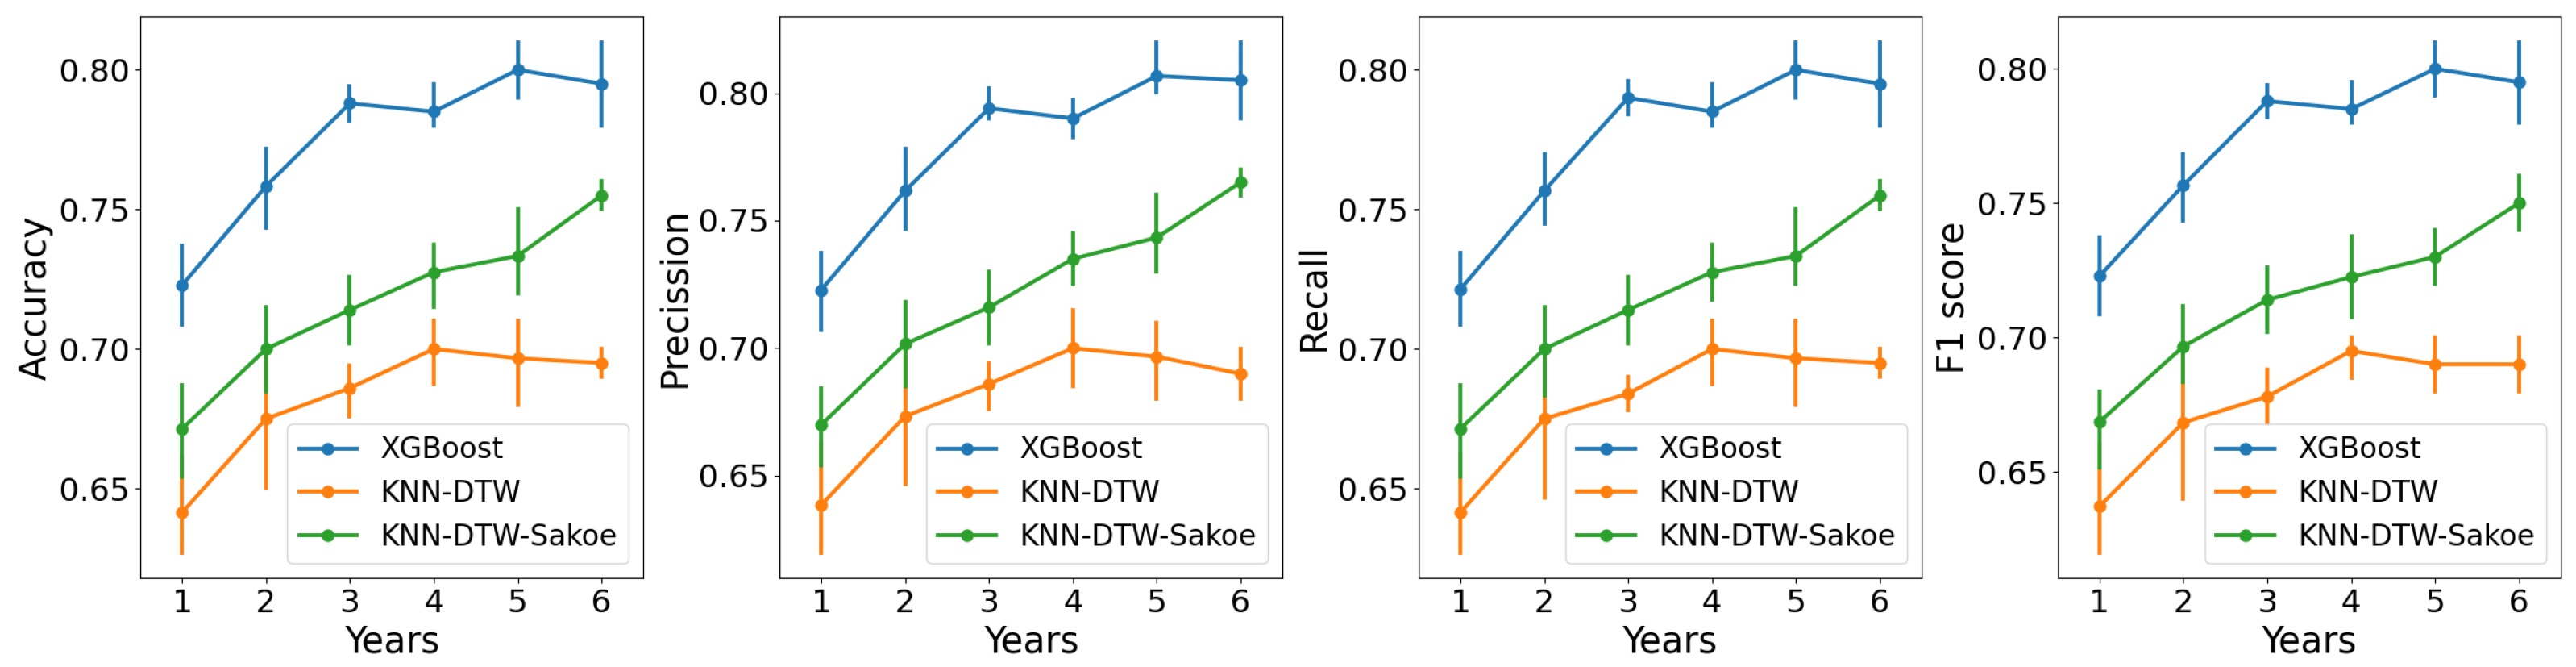
3.2.3. Do More Historical Data Improve Forecasting? Analyzing the Length of Time Series

In this part of this study, we explore the effect of NDVI-TS length on the forecasting performance of our models, evaluating whether incorporating additional years improves prediction accuracy, precision, recall, and F1 score.
Our analysis begins with training and testing each model using the NDVI-TS from a single year. This approach enables us to analyze the data by season and gather performance metrics for each configuration.
The per-season analysis revealed distinct performance patterns for the KNN-DTW and XGBoost models. First, we conducted the classification with KNN-DTW, taking advantage of its ability to align NDVI-TS data using DTW. As shown in Table 3, KNN-DTW achieved moderate success with accuracies ranging from 0.62 (2023–2024) to 0.70 (2017–2018). However, the high dimensionality of the data posed challenges, particularly in distinguishing irrigated plots during recent drought years. Again, the Sakoe–Chiba Band constraints address this limitation. When incorporating it, the results of KNN-DTW significantly improved, with accuracy rising from 64 % to an average of 67 % . Furthermore, the boost in performance was similar across the other three metrics.
As explained before, XGBoost can further address these limitations and consistently outperforms the former KNN-DTW model, with accuracies ranging from 0.69 to 0.75. Moreover when comparing it to the KNN-DTW configurations that use the Sakoe–Chiba Band, the difference in performance is smaller and the accuracy is five percentage points larger for XGBoost, achieving an average accuracy of 72 % (see Table 4).
Similarly to the seven-season TS case, the precision and recall metrics demonstrated a balanced performance for all the models in distinguishing irrigated and rainfed classes, with XGBoost showing slightly better recall rates for irrigated groves. This result highlights that the balanced performance of the models differentiating between the two water management regimes is independent of the length of the NDVI-TS.
After building models for each season, we next train and test models using aggregations of 2 to 6 consecutive years, generating models for all possible combinations within each aggregation. By doing so, we aim to quantify the increase in performance associated with incorporating additional years and seek to identify the point at which performance converges to an optimal level. In Figure 6, we illustrate how performance improves with longer TSs for both KNN-DTW (with and without the Sakoe–Chiba constraint) and XGBoost. As the length increases, broader temporal trends become more apparent. Across KNN-DTW and XGBoost, we identify two distinct regimes. In the first, performance improves proportionally with the length of the NDVI-TS. Then, a turning point is reached, beyond which performance gains begin to plateau, and the benefit of extending the TS becomes minimal. However, this turning point occurs at different points for each model: for KNN-DTW, it appears in the fourth year; for XGBoost, it emerges in the third year. This suggests that XGBoost requires a shorter NDVI-TS to achieve optimal performance. In contrast, for KNN-DTW with the Sakoe–Chiba Band, we did not observe the previously mentioned turning point. Instead, performance consistently improved as the length of the TS increased, with this trend holding across all tests from 2 to 6 years. Hence, the increase in classification performance associated with the Sakoe–Chiba Band becomes larger when training the models with a longer NDVI-TS.

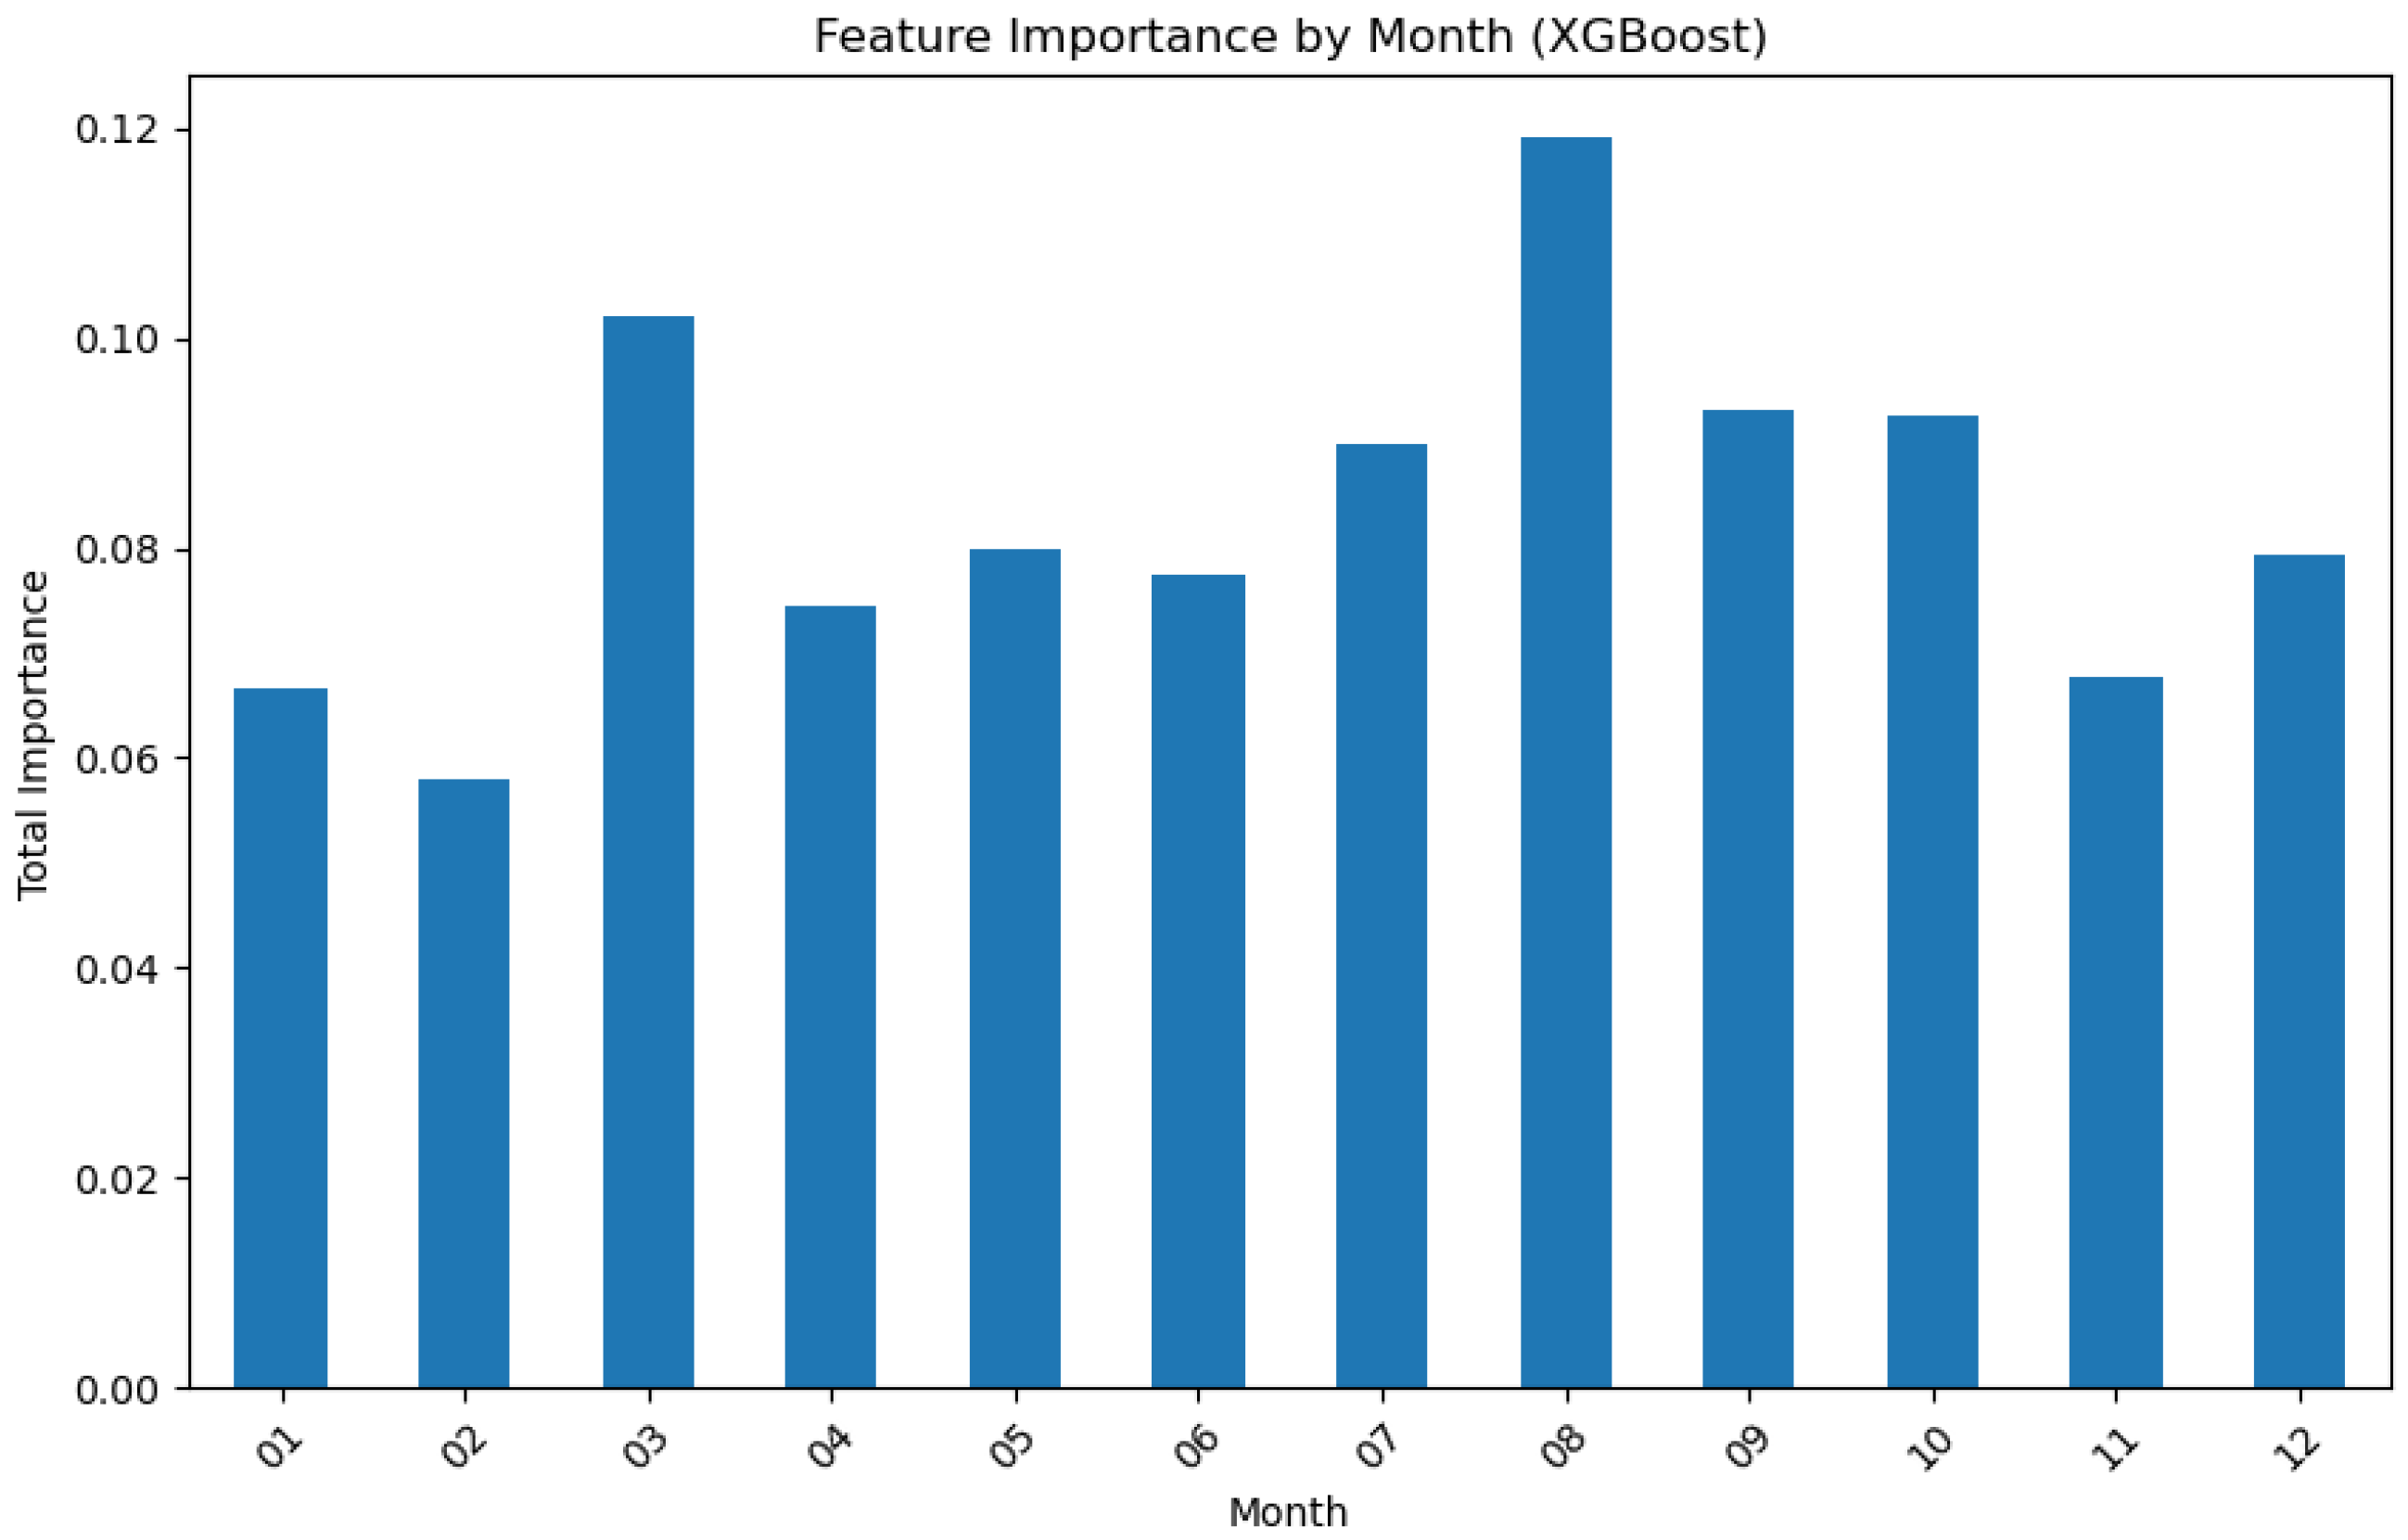
3.3. Feature Importance Analysis: Identifying Key Months to Differentiate Irrigated Parcels

To understand which are the most critical months to distinguish between the two water management regimes, we performed a feature importance analysis using the XGBoost model across the entire 7-year TS. We then grouped the features based on their corresponding months, with the results being presented in Figure 7.
The results of the analysis reveal that March and August are the most important months in distinguishing between irrigated and rainfed olive groves. This finding aligns with the known phenological and physiological processes that occur in olive trees. The release of floral buds from dormancy, a critical stage in olive development, takes place during March [30,31]. At this time, water stress should be avoided to promote proper bud development and ensure optimal conditions for the upcoming flowering period [29,32]. The higher importance assigned to March highlights the sensitivity of NDVI values to irrigation practices during this period. Due to water scarcity in August, significant differences in NDVI can be observed between irrigated and rainfed groves [33]. In irrigated areas, trees maintain higher NDVI values due to sustained photosynthesis; in rainfed areas, trees reduce stomatal conductance and chlorophyll activity to minimize water loss [33,34], leading to lower NDVI values.

4. Discussion

Accurately classifying water management regimes is a foundational step toward developing more efficient and sustainable irrigation practices, addressing the dual challenge of balancing agricultural water demands with the conservation of vital water resources. This is particularly crucial in drought-prone regions, such as the olive groves of southern Spain—the focus of our study—where efficient water use can significantly impact agricultural productivity and ecological balance. Our findings demonstrate that ML models, particularly XGBoost and KNN-DTW, effectively differentiate between rainfed and irrigated olive groves based on NDVI-TS data. Thus, our framework represents a scalable, data-driven approach for monitoring irrigation practices, which can help in water resource management.
The temporal divergence between irrigated and non-irrigated olive groves highlights the stabilizing effect of irrigation on vegetation dynamics. This effect is particularly evident in drought-prone regions. The alignment of NDVI-TS using DTW and Sakoe–Chiba Band constraints proved essential in detecting subtle yet critical variations across different olive groves. By mitigating temporal distortions in NDVI signals and aligning NDVI peaks across different plots, this approach enabled consistent comparisons of vegetation growth patterns, reinforcing its value in agricultural monitoring [26]. Our results demonstrate that NDVI fluctuations over time encode critical distinguishing features, enabling the accurate classification of irrigation regimes. Among the models tested, XGBoost consistently outperformed the other models in classification accuracy. We attribute this superior performance to its ability to capture complex, non-linear temporal relationships in high-dimensional spaces. On the other hand, KNN-DTW showed a robust performance, particularly when incorporating Sakoe–Chiba Band constraints, by effectively aligning and comparing NDVI-TS across parcels. Additionally, while XGBoost stands out for its computational efficiency, KNN-DTW is significantly more computationally intensive. In addition, we have to remark that KNN-DTW and XGBoost were not trained on identical feature sets, due to the inherent differences in how each algorithm processes temporal data: although KNN-DTW relies on full NDVI time series for distance-based comparisons, XGBoost requires derived features due to its requirement of fixed-size input vectors.
Beyond model classification performance, our feature importance analysis identified key time points in the NDVI series that play a crucial role in distinguishing water management regimes. Specifically, March and August emerged as critical months, capturing peak growth periods and stress responses. These insights represent valuable information to optimize irrigation scheduling and refine drought mitigation strategies, as they reveal when water application has the greatest impact on crop resilience and productivity. By focusing irrigation efforts during the key developmental stages, farmers can enhance resource utilization, improve agricultural sustainability, and contribute to the long-term conservation of water resources.

5. Conclusions

Finally, we conclude that the ability of RS and ML opens new avenues for precision agriculture and sustainable water resource management. By leveraging multi-temporal NDVI data, we can efficiently generate high-resolution irrigation maps on a large scale, supporting data-driven decision making for farmers and policymakers. Moreover, the availability of irrigation maps should help to design more efficient water allocation strategies, reduce waste, and improve the resilience of Mediterranean olive groves under increasing climate stress.

Author Contributions

Conceptualization, R.G.-C., A.M.T. and J.B.; methodology, J.B.; validation, A.M.T., R.G.-C. and J.B.; formal analysis, R.G.-C.; investigation, R.G.-C. and J.B.; resources, J.B.; data curation, R.G.-C.; writing—original draft preparation, R.G.-C. and J.B.; writing—review and editing, R.G.-C., J.B. and A.M.T.; visualization, R.G.-C. and J.B.; supervision, J.B.; funding acquisition, J.B. All authors have read and agreed to the published version of the manuscript.

Funding

The authors acknowledge the support from Project No. DIN2021-011913 and PID2021-122711NB-C21 of the Spanish Ministry of Science and Innovation.

Data Availability Statement

The original contributions presented in the study are included in the article, further inquiries can be directed to the corresponding author.

Conflicts of Interest

Authors Rosa Gutierrez-Cabrera and Javier Borondo were employed by the company AGrowingData. The remaining authors declare that the research was conducted in the absence of any commercial or financial relationships that could be construed as a potential conflict of interest.

References

  1. Parrilla González, J.A.; Ortega Alonso, D. Sustainable Development Goals in the Andalusian Olive Oil Cooperative Sector: Heritage, Innovation, Gender Perspective and Sustainability. New Medit 2022, 2, 110–115. [Google Scholar] [CrossRef]
  2. Ropero, R.F.; Rumí, R.; Aguilera, P.A. Bayesian Networks for Evaluating Climate Change Influence in Olive Crops in Andalusia, Spain. Nat. Resour. Model. 2022, 32, e12169. [Google Scholar] [CrossRef]
  3. Kefi, M.; Pham, T.D.; Kashiwagi, K.; Yoshino, K. Identification of Irrigated Olive Growing Farms Using Remote Sensing Techniques. Euro-Mediterr. J. Environ. Integr. 2016, 1, 3. [Google Scholar] [CrossRef]
  4. Mattar, C.e.a. The LAB-Net Soil Moisture Network: Application to Thermal Remote Sensing and Surface Energy Balance. Data 2016, 1, 6. [Google Scholar] [CrossRef]
  5. Intergovernmental Panel on Climate Change (IPCC). Special Report: Global Warming of 1.5 °C; Technical Report; IPCC: Paris, France, 2018. [Google Scholar]
  6. Boussadia, O.; Omri, A.; Mzid, N. Eco-Physiological Behavior of Five Tunisian Olive Tree Cultivars under Drought Stress. Agronomy 2023, 13, 720. [Google Scholar] [CrossRef]
  7. Ramadhani, D.e.a. Application of NDVI Sentinel-2Ac Imagery for Agricultural Land Development in Food Buffer Area of New Capital City Indonesia. IOP Conf. Ser. Earth Environ. Sci. 2024, 1290, 012016. [Google Scholar] [CrossRef]
  8. Hervás-Gámez, C.; Delgado-Ramos, F. Are the Modern Drought Management Plans Modern Enough? The Guadalquivir River Basin Case in Spain. Water 2020, 12, 49. [Google Scholar] [CrossRef]
  9. Hervás-Gámez, C.; Delgado-Ramos, F. Drought Management Planning Policy: From Europe to Spain. Sustainability 2019, 11, 1862. [Google Scholar] [CrossRef]
  10. Anderson, L.O.; Malhi, Y.; Aragão, L.E.; Ladle, R.; Arai, E.; Barbier, N.; Phillips, O. Remote Sensing Detection of Droughts in Amazonian Forest Canopies. New Phytol. 2010, 187, 733–750. [Google Scholar] [CrossRef]
  11. Montero, D.; Aybar, C.; Mahecha, M.D.; Martinuzzi, F.; Söchting, M.; Wieneke, S. A Standardized Catalogue of Spectral Indices to Advance the Use of Remote Sensing in Earth System Research. Sci. Data 2023, 10, 197. [Google Scholar] [CrossRef]
  12. Li, X.; Jia, H.; Wang, L. Remote Sensing Monitoring of Drought in Southwest China Using Random Forest and eXtreme Gradient Boosting Methods. Remote Sens. 2023, 15, 4840. [Google Scholar] [CrossRef]
  13. Potgieter, A.B.; Zhao, Y.; Zarco-Tejada, P.J.; Chenu, K.; Zhang, Y.; Porker, K.; Biddulph, B.; Dang, Y.P.; Neale, T.; Roosta, F.; et al. Evolution and Application of Digital Technologies to Predict Crop Type and Crop Phenology in Agriculture. Silico Plants 2021, 3, diab017. [Google Scholar] [CrossRef]
  14. Guan, X.; Huang, C.; Liu, G.; Meng, X.; Liu, Q. Mapping Rice Cropping Systems in Vietnam Using an NDVI-Based Time-Series Similarity Measurement Based on DTW Distance. Remote Sens. 2016, 8, 19. [Google Scholar] [CrossRef]
  15. Kunze, L.F.; Amaral, T.; Moraes, L.M.P.; Oliveira, J.J.M.; Junior, A.G.B.; de Sousa, E.P.M.; Cordeiro, R.L.F. Classification Analysis of NDVI Time Series in Metric Spaces for Sugarcane Identification. In Proceedings of the ICEIS 2018 Proceedings, Funchal, Portugal, 21–24 March 2018; pp. 162–169. [Google Scholar] [CrossRef]
  16. Ketchum, D.; Jencso, K.; Maneta, M.P.; Melton, F.; Jones, M.O.; Huntington, J. IrrMapper: A Machine Learning Approach for High Resolution Mapping of Irrigated Agriculture Across the Western U.S. Remote Sens. 2020, 12, 2328. [Google Scholar] [CrossRef]
  17. Li, H.; Wan, J.; Liu, S.; Sheng, H.; Xu, M. Wetland Vegetation Classification through Multi-Dimensional Feature Time Series Remote Sensing Images Using Mahalanobis Distance-Based Dynamic Time Warping. Remote Sens. 2022, 14, 501. [Google Scholar] [CrossRef]
  18. Zhao, F.; Yang, G.; Yang, H.; Zhu, Y.; Meng, Y.; Han, S.; Bu, X. Short and Medium-Term Prediction of Winter Wheat NDVI Based on the DTW-LSTM Combination Method and MODIS Time Series Data. Remote Sens. 2021, 13, 4660. [Google Scholar] [CrossRef]
  19. Marques, P.; Pádua, L.; Sousa, J.; Fernandes-Silva, A. Advancements in Remote Sensing Imagery Applications for Precision Management in Olive Growing: A Systematic Review. Remote Sens. 2024, 16, 1324. [Google Scholar] [CrossRef]
  20. Rodríguez, C.; Durán, V.; Francia, J.R.; Martín, F.J.; Moreno, F.; García, I.F. Organic olive farming in Andalusia, Spain. A review. Agron. Sustain. Dev. 2018, 38, 20. [Google Scholar] [CrossRef]
  21. Guzmán, G.; Boumahdi, A.; Gómez, J. Expansion of olive orchards and their impact on the cultivation and landscape through a case study in the countryside of Cordoba (Spain). Land Use Policy 2022, 116, 106065. [Google Scholar] [CrossRef]
  22. Martinez, P.; Blanco, M. Sensitivity of Agricultural Development to Water-Related Drivers: The Case of Andalusia (Spain). Water 2019, 11, 1854. [Google Scholar] [CrossRef]
  23. del Catastro, D.G. Datos Catastrales de España (Archivo Shapefile); Ministerio de Hacienda y Función Pública: Madrid, Spain, 2024. [Google Scholar]
  24. Gascon, F.; Bouzinac, C.; Thépaut, O.; Jung, M.; Francesconi, B.; Mecklenburg, S. Copernicus Sentinel-2A Calibration and Products Validation Status. Remote Sens. 2017, 9, 584. [Google Scholar] [CrossRef]
  25. Górecki, T.; Łuczak, M. The Influence of the Sakoe–Chiba Band Size on Time Series Classification. J. Intell. Fuzzy Syst. 2019, 36, 527–539. [Google Scholar] [CrossRef]
  26. Vasilakos, C.; Tsekouras, G.E.; Kavroudakis, D. LSTM-Based Prediction of Mediterranean Vegetation Dynamics Using NDVI Time-Series Data. Land 2022, 11, 923. [Google Scholar] [CrossRef]
  27. Herbert, C. Advanced Methods for Earth Observation Data Synergy for Geophysical Parameter R. Doctoral Thesis, Universitat Politècnica de Catalunya, Barcelona, Spain, 2022. [Google Scholar] [CrossRef]
  28. Leyva, A.; Hidalgo, J.; Vega, V.; Pérez, D.; Hidalgo, J. El Estrés Hídrico y la Formación de Aceite de Oliva; Technical Report; IFAPA, Consejería de Agricultura, Pesca y Desarrollo Rural, Junta de Andalucía: Córdoba, Spain, 2017. [Google Scholar]
  29. Romi, M.; Hoshika, Y.; Giovannelli, A.; Dias, M.C. Morpho-Physiological Responses of Three Italian Olive Tree (Olea europaea L.) Cultivars to Drought Stress. Horticulturae 2023, 9, 830. [Google Scholar] [CrossRef]
  30. Orlandi, F.; Garcia-Mozo, H.; Galán, C.; Romano, B.; de la Guardia, C.D.; Ruiz, L.; del Mar Trigo, M.; Dominguez-Vilches, E.; Fornaciari, M. Olive flowering trends in a large Mediterranean area (Italy and Spain). Int. J. Biometeorol. 2010, 54, 151–163. [Google Scholar] [CrossRef]
  31. Navas-Lopez, J.F.; León, L.; Rapoport, H.F.; Moreno-Alías, I.; Lorite, I.; de la Rosa, R. Genotype, Environment, and Their Interaction Effects on Olive Tree Flowering Phenology and Flower Quality. Euphytica 2019, 215, 184. [Google Scholar] [CrossRef]
  32. Hueso, A.; Camacho, G.; del Campo, M.G. Spring deficit irrigation promotes significant reduction on vegetative growth, flowering, fruit growth and production in hedgerow olive orchards (cv. Arbequina). Agric. Water Manag. 2021, 248, 106695. [Google Scholar] [CrossRef]
  33. Fernández, J.E.; Moreno, F.; Girón, I.F. Stomatal Control of Water Use in Olive Trees. Plants Soil 1997, 190, 179–192. [Google Scholar] [CrossRef]
  34. Marques, P.; Pádua, L.; Sousa, J.J.; Fernandes-Silva, A. Assessing the Water Status and Leaf Pigment Content of Olive Trees: Evaluating the Potential and Feasibility of Unmanned Aerial Vehicle Multispectral and Thermal Data for Estimation Purposes. Remote Sens. 2023, 15, 4777. [Google Scholar] [CrossRef]
Figure 1. Spatial distribution of Santaella and Villanueva de Córdoba olive groves.
Land 14 01001 g001
Figure 2. Workflow of the methodology used for the classification of irrigated and rainfed olive groves.
Land 14 01001 g002
Figure 3. NDVI time series for rainfed (A) and irrigated (B) olive groves, illustrating temporal differences in vegetation dynamics. Orange lines depict three randomly selected rainfed parcels whereas blue lines depict three irrigated parcels.
Land 14 01001 g003
Figure 4. NDVI time series, accumulated rainfall and water stress impact on olive production: a comparison of irrigated and rainfed management systems (2018–2019).
Land 14 01001 g004
Figure 5. Map of irrigated olive groves generated by the model for a region covering the municipality of Bujalance in Spain. Panel (A) shows the overall density map highlighting regions with an expected higher density of irrigated parcels. Green colors indicate a higher density of irrigated fields, while yellow tones indicate a lower one. Panel (B) shows the details of the probability of irrigation for each pixel in a field. Panels (C,D) show the predicted probability of irrigation at a parcel spatial resolution.
Land 14 01001 g005
Figure 6. The figure illustrates the relation between the performance of the ML models and the length of the NDVI time series (measured in years).
Land 14 01001 g006
Figure 7. Feature importance by month derived from the XGBoost model for the 7-seasons.
Land 14 01001 g007
Table 1. Summary of parcel surfaces (in hectares) by irrigation system and municipality.
MunicipalitySystemMin (ha)Max (ha)Mean (ha)Median (ha)
SantaellaRainfed0.0019169.643.340.67
SantaellaIrrigated0.001781.893.901.28
Villanueva de CórdobaRainfed0.0026107.642.100.50
Villanueva de CórdobaIrrigated0.16842.431.461.77
TotalRainfed0.0019169.642.800.57
TotalIrrigated0.001781.893.811.30
Table 2. Performance metrics for KNN-DTW, KNN-DTW with Sakoe–Chiba Band and XGBoost using the time series from seven seasons.
KNN-DTWKNN-DTW-SakoeXGBoost
Accuracy Precision Recall F 1 Score Accuracy Precision Recall F 1 Score Accuracy Precision Recall F 1 Score
7 seasons0.720.730.720.720.760.760.760.760.800.810.800.80
Table 3. Performance metrics for KNN-DTW, KNN-DTW with Sakoe–Chiba Band and XGBoost per single-season configuration.
SeasonsKNN-DTWKNN-DTW-SakoeXGBoost
Accuracy Precision Recall F 1 Score Accuracy Precision Recall F 1 Score Accuracy Precision Recall F 1 Score
2017–20180.700.700.700.700.700.700.700.690.720.720.720.72
2018–20190.650.650.650.640.690.680.690.680.750.750.750.75
2019–20200.630.630.630.630.670.670.670.670.720.720.720.72
2020–20210.630.630.630.630.680.680.680.680.720.720.720.72
2021–20220.630.630.630.630.680.680.680.680.750.750.740.75
2022–20230.630.630.630.630.630.630.630.630.690.690.690.69
2023–20240.620.600.600.600.650.650.650.650.710.710.710.71
Table 4. Performance metrics for KNN-DTW with Sakoe–Chiba Band and XGBoost under different season configurations.
Grouped SeasonsKNN-DTW with Sakoe–Chiba BandXGBoost
Accuracy Precision Recall F 1 Score Accuracy Precision Recall F 1 Score
1 season0.670.670.670.670.720.720.720.72
2 seasons0.700.700.700.700.760.760.760.76
3 seasons0.710.720.710.710.790.790.790.79
4 seasons0.730.740.730.720.790.790.790.79
5 seasons0.730.740.730.730.800.810.800.80
6 seasons0.760.770.760.750.800.810.800.80
7 seasons0.760.760.760.760.800.810.800.80
Disclaimer/Publisher’s Note: The statements, opinions and data contained in all publications are solely those of the individual author(s) and contributor(s) and not of MDPI and/or the editor(s). MDPI and/or the editor(s) disclaim responsibility for any injury to people or property resulting from any ideas, methods, instructions or products referred to in the content.

