

How Land Use and Hydrological Characteristics Impact Stream Conditions in Impaired Ecosystems

 , , and
Abstract
1. Introduction
2. Materials and Methods
2.1. Impaired Stream Diagnosis Program by Korean Ministry of Environment (MOE)
2.2. Study Streams and Sampling Sites
2.3. Selected Variables
2.4. Structural Equation Model (SEM)
3. Results
3.1. Descriptive Statistics
3.2. Comprehensive Model for Benthic Macroinvertebrate Communities
3.2.1. Full Model
3.2.2. Optimization of the Model
3.2.3. Model Validation
4. Discussion
4.1. Influence of Land Use and Hydrological Characteristics on Stream Ecosystems
4.2. Effects of Other Environmental Factors on Sream Ecosystems
4.3. Management and Restoration of Impaired Streams
5. Conclusions
Author Contributions
Funding
Data Availability Statement
Acknowledgments
Conflicts of Interest
References
- Palmer, M.; Ruhi, A. Linkages between flow regime, biota, and ecosystem processes: Implications for river restoration. Science 2019, 365, eaaw2087. [Google Scholar] [CrossRef] [PubMed]
- Yeakley, J.A.; Ervin, D.; Chang, H.; Granek, E.F.; Dujon, V.; Shandas, V.; Brown, D. Ecosystem services of streams and rivers. In River Science: Research and Management for the 21st Century; Wiley: Hoboken, NJ, USA, 2016; pp. 335–352. [Google Scholar]
- Veerkamp, C.J.; Schipper, A.M.; Hedlund, K.; Lazarova, T.; Nordin, A.; Hanson, H.I. A review of studies assessing ecosystem services provided by urban green and blue infrastructure. Ecosyst. Serv. 2021, 52, 101367. [Google Scholar] [CrossRef]
- Meyer, J.L.; Paul, M.J.; Taulbee, W.K. Stream ecosystem function in urbanizing landscapes. J. N. Am. Benthol. Soc. 2005, 24, 602–612. [Google Scholar] [CrossRef]
- Allan, J.D. Landscapes and riverscapes: The influence of land use on stream ecosystems. Annu. Rev. Ecol. Evol. Syst. 2004, 35, 257–284. [Google Scholar] [CrossRef]
- Liao, H.; Sarver, E.; Krometis, L.H. Interactive effects of water quality, physical habitat, and watershed anthropogenic activities on stream ecosystem health. Water Res. 2018, 130, 69–78. [Google Scholar] [CrossRef]
- Power, M.E.; Stout, R.J.; Cushing, C.E.; Harper, P.P.; Hauer, F.R.; Matthews, W.J.; Moyle, P.B.; Statzner, B. Biotic and abiotic controls in river and stream communities. J. N. Am. Benthol. Soc. 1988, 7, 456–479. [Google Scholar] [CrossRef]
- Lee, J.-W.; Lee, S.-W.; Hwang, S.-J.; Jang, M.-H.; Won, D.-H.; An, K.-J.; Park, H.-J.; Lee, J. Establishing diagnosis systems for impaired stream ecosystem using stream/river ecosystem survey and health Assessment. Korean J. Ecol. Environ. 2020, 53, 1–10. [Google Scholar] [CrossRef]
- Feld, C.K.; Saeedghalati, M.; Hering, D. A framework to diagnose the causes of river ecosystem deterioration using biological symptoms. J. Appl. Ecol. 2020, 57, 2271–2284. [Google Scholar] [CrossRef]
- Verdonschot, P.F.M.; Verdonschot, R.C.M. The role of stream restoration in enhancing ecosystem services. Hydrobiologia 2023, 850, 2537–2562. [Google Scholar] [CrossRef]
- Assireu, A.; Sperber, C.; Alcântara, E.; Fernandes, G.W.; Hughes, R. Editorial: River and watershed restoration, rehabilitation, and conservation: Challenges, actions, and perspectives. Front. Environ. Sci. 2022, 10, 1032628. [Google Scholar] [CrossRef]
- Kim, S.; Lee, S.-W.; Park, S.-R.; Shin, Y.; An, K. Socioeconomic risks and their impacts on ecological river health in South Korea: An application of the analytic hierarchy process. Sustainability 2021, 13, 6287. [Google Scholar] [CrossRef]
- Lee, J.-W.; Lee, S.-W.; An, K.-J.; Hwang, S.-J.; Kim, N.-Y. An estimated structural equation model to assess the effects of land use on water quality and benthic macroinvertebrates in streams of the Nam-Han River System, South Korea. Int. J. Environ. Res. Public Health 2020, 17, 2116. [Google Scholar] [CrossRef] [PubMed]
- An, C.-H.; Han, J.-S.; Choi, J.-K.; Lee, H.-G. The effect of water conveyance of Boryeong Dam on structural changes of benthic macroinvertebrates community. Korean J. Environ. Ecol. 2018, 32, 381–391. [Google Scholar] [CrossRef]
- Norton, S.B.; Cormier, S.M.; Suter, G.W.; Schofield, K.; Yuan, L.; Shaw-Allen, P.; Ziegler, C.R. Caddis: The causal analysis/diagnosis decision information system. In Decision Support Systems for Risk-Based Management of Contaminated Sites; Springer: Berlin/Heidelberg, Germany, 2008; pp. 1–24. [Google Scholar]
- USEPA. Causal Analysis/Diagnosis Decision Information System (CADDIS); USEPA; Environmental Protection Agency Office of Research and Development: Washington, DC, USA, 2010. Available online: https://www.epa.gov/caddis (accessed on 26 February 2025).
- Nichols, S.; Webb, A.; Norris, R.; Stewardson, M. Eco Evidence Analysis Methods Manual: A Systematic Approach to Evaluate Causality in Environmental Science; eWater Cooperative Research Centre: Bruce, Australia, 2011. [Google Scholar]
- Ministry of the Environment (MOE). Guide to Diagnosis of Health Deterioratin in River Auatic Ecosystem; Ministry of the Environment Water Environment Policy Division: Sejong, Republic of Korea, 2019.
- Karr, J.R. Defining and measuring river health. Freshw. Biol. 1999, 41, 221–234. [Google Scholar] [CrossRef]
- Kelly, M.G.; Whitton, B.A. The trophic diatom index: A new index for monitoring eutrophication in rivers. J. Appl. Phycol. 1995, 7, 433–444. [Google Scholar] [CrossRef]
- Rai, R.; Sharma, S.; Gurung, D.B.; Sitaula, B.K.; Shah, R.D.T. Assessing the impacts of vehicle wash wastewater on surface water quality through physico-chemical and benthic macroinvertebrates analyses. Water Sci. 2020, 34, 39–49. [Google Scholar] [CrossRef]
- Laini, A.; Viaroli, P.; Bolpagni, R.; Cancellario, T.; Racchetti, E.; Guareschi, S. Taxonomic and functional responses of benthic macroinvertebrate communities to hydrological and water quality variations in a heavily regulated river. Water 2019, 11, 1478. [Google Scholar] [CrossRef]
- Von Bertrab, M.G.; Krein, A.; Stendera, S.; Thielen, F.; Hering, D. Is fine sediment deposition a main driver for the composition of benthic macroinvertebrate assemblages? Ecol. Indic. 2013, 24, 589–598. [Google Scholar] [CrossRef]
- Krynak, E.M.; Yates, A.G. Benthic invertebrate taxonomic and trait associations with land use in an intensively managed watershed: Implications for indicator identification. Ecol. Indic. 2018, 93, 1050–1059. [Google Scholar] [CrossRef]
- Musonge, P.S.L.; Boets, P.; Lock, K.; Damanik Ambarita, N.M.D.; Forio, M.A.E.; Verschuren, D.; Goethals, P.L.M. Baseline assessment of benthic macroinvertebrate community structure and ecological water quality in Rwenzori rivers (Albertine rift valley, Uganda) using biotic-index tools. Limnologica 2019, 75, 1–10. [Google Scholar] [CrossRef]
- Mwaijengo, G.N.; Vanschoenwinkel, B.; Dube, T.; Njau, K.N.; Brendonck, L. Seasonal variation in benthic macroinvertebrate assemblages and water quality in an Afrotropical river catchment, northeastern Tanzania. Limnologica 2020, 82, 125780. [Google Scholar] [CrossRef]
- Esri. ArcGIS Desktop: Release 10.6.1; Environmental Systems Research Institute: Redlands, CA, USA, 2018. [Google Scholar]
- Maruyama, G. Basics of Structural Equation Modeling; Sage: Washington, DC, USA, 1997; ISBN 0803974094. [Google Scholar]
- Bowen, N.K.; Guo, S. Structural Equation Modeling; Oxford University Press: Oxford, UK, 2011; ISBN 0199710104. [Google Scholar]
- Fernandes, A.C.P.; Sanches Fernandes, L.F.S.; Moura, J.P.; Cortes, R.M.V.; Pacheco, F.A.L. A structural equation model to predict macroinvertebrate-based ecological status in catchments influenced by anthropogenic pressures. Sci. Total Environ. 2019, 681, 242–257. [Google Scholar] [CrossRef] [PubMed]
- Li, X.; Zhang, Y.; Guo, F.; Gao, X.; Wang, Y. Predicting the effect of land use and climate change on stream macroinvertebrates based on the linkage between structural equation modeling and bayesian network. Ecol. Indic. 2018, 85, 820–831. [Google Scholar] [CrossRef]
- Bizzi, S.; Surridge, B.W.J.; Lerner, D.N. Structural equation modelling: A novel statistical framework for exploring the spatial distribution of benthic macroinvertebrates in riverine ecosystems. River Res. Appl. 2013, 29, 743–759. [Google Scholar] [CrossRef]
- Taniwaki, R.H.; Cassiano, C.C.; Filoso, S.; Ferraz, S.F.B.; Camargo, P.B.; Martinelli, L.A. Impacts of converting low-intensity pastureland to high-intensity bioenergy cropland on the water quality of tropical streams in Brazil. Sci. Total Environ. 2017, 584–585, 339–347. [Google Scholar] [CrossRef] [PubMed]
- Grimstead, J.P.; Krynak, E.M.; Yates, A.G. Scale-Specific Land Cover Thresholds for Conservation of Stream Invertebrate Communities in Agricultural Landscapes. Landsc. Ecol. 2018, 33, 2239–2252. [Google Scholar] [CrossRef]
- Tong, S.T.Y.; Chen, W. Modeling the relationship between land use and surface water quality. J. Environ. Manag. 2002, 66, 377–393. [Google Scholar] [CrossRef]
- Carlson, P.E.; Johnson, R.K.; McKie, B.G. Optimizing stream bioassessment: Habitat, season, and the impacts of land use on benthic macroinvertebrates. Hydrobiologia 2013, 704, 363–373. [Google Scholar] [CrossRef]
- Fergus, C.E.; Brooks, J.R.; Kaufmann, P.R.; Herlihy, A.T.; Hill, R.A.; Mitchell, R.M.; Ringold, P. Disentangling natural and anthropogenic effects on benthic macroinvertebrate assemblages in western US streams. Ecosphere 2023, 14, e4688. [Google Scholar] [CrossRef]
- Wagenhoff, A.; Townsend, C.R.; Phillips, N.; Matthaei, C.D. Subsidy-stress and multiple-stressor effects along gradients of deposited fine sediment and dissolved nutrients in a regional set of streams and rivers. Freshw. Biol. 2011, 56, 1916–1936. [Google Scholar] [CrossRef]
- Jowett, I.G. Hydraulic constraints on habitat suitability for benthic invertebrates in gravel-bed rivers. River Res. Appl. 2003, 19, 495–507. [Google Scholar] [CrossRef]
- Lee, S.H.; Lee, M.J.; Seo, E.W.; Lee, J.E. Analysis of functional habitat groups of benthic macroinvertebrates according to changes in the riverbed. J. Environ. Sci. Int. 2017, 26, 373–380. [Google Scholar] [CrossRef]
- Townsend, C.R.; Scarsbrook, M.R.; Dolédec, S. Quantifying disturbance in streams: Alternative measures of disturbance in relation to macroinvertebrate species traits and species richness. J. N. Am. Benthol. Soc. 1997, 16, 531–544. [Google Scholar] [CrossRef]
- Kim, J.; Kim, A.R.; Kong, D. Classification of microhabitats based on habitat orientation groups of benthic macroinvertebrate communities. J. Korean Soc. Water Environ. 2017, 33, 728–735. [Google Scholar]
- Ministry of the Environment (MOE). Diagnosis for Impaired Stream Ecosystem; Ministry of the Environment Water Environment Policy Division: Sejong, Republic of Korea, 2022.
- Gerth, W.J.; Li, J.; Giannico, G.R. Agricultural land use and macroinvertebrate assemblages in lowland temporary streams of the Willamette Valley, Oregon, USA. Agric. Ecosyst. Environ. 2017, 236, 154–165. [Google Scholar] [CrossRef]
- Ruangpan, L.; Vojinovic, Z.; Di Sabatino, S.; Leo, L.S.; Capobianco, V.; Oen, A.M.P.; McClain, M.E.; Lopez-Gunn, E. Nature-based solutions for hydro-meteorological risk reduction: A state-of-the-art review of the research area. Nat. Hazards Earth Syst. Sci. 2020, 20, 243–270. [Google Scholar] [CrossRef]
- Eisenber, B.; Chiesa, C.; Flascher, L.K.; Jakstis, K.; Polcher, V.; Schwarz-v.Raumer, H.-G. Nature-Based Solutions Technical Handbook Factsheets; UNaLab URBAN NATURE LABS Institut fur Landschaftsplanung und Okologi—ILPO: Santa Cruz de la Sierra, Bolivia, 2022. [Google Scholar]
- Korte, T. Current and substrate preferences of benthic invertebrates in the rivers of the Hindu Kush-Himalayan region as indicators of hydromorphological degradation. Hydrobiologia 2010, 651, 77–91. [Google Scholar] [CrossRef]


| Classification | Variables | Mean | S.D. | Min. | Max. |
|---|---|---|---|---|---|
| Benthic Invertebrate communities | Total number of benthic invertebrate communities | 13.06 | 6.38 | 3.00 | 39.00 |
| Density ratio of EPT taxa (%) | 34.07 | 22.32 | 0.00 | 86.76 | |
| Density ratio of tolerant taxa (%) | 57.65 | 25.19 | 0.00 | 99.66 | |
| Density ratio of collector–gatherer taxa (%) | 73.12 | 18.86 | 4.68 | 100.00 | |
| BMI grade | 3.33 | 1.26 | 1.00 | 5.00 | |
| Hydrological Characteristics | Flow volume (m3/min) | 0.12 | 0.20 | 0.00 | 2.28 |
| Flow velocity (cm/s) | 5.11 | 1.75 | 0.03 | 10.00 | |
| Water Quality | BOD (mg/L) | 2.23 | 1.39 | 0.40 | 10.90 |
| COD (mg/L) | 4.54 | 2.82 | 1.20 | 26.30 | |
| TN (mg/L) | 3.66 | 2.19 | 0.17 | 12.90 | |
| TP (mg/L) | 0.09 | 0.08 | 0.01 | 0.50 | |
| Turbidity (NTU) | 26.09 | 63.82 | 0.00 | 520.00 | |
| Stream Substrate Composition | Substrate embeddedness (%) | 50.33 | 27.95 | 10.00 | 90.00 |
| Silty sand (%) | 46.93 | 31.34 | 0.00 | 100.00 | |
| Gravel (%) | 42.34 | 27.16 | 0.00 | 95.00 | |
| Bedrock (%) | 8.56 | 14.64 | 0.00 | 95.00 | |
| Land Use Proportion | Urban area (%) | 11.85 | 13.03 | 0.00 | 61.50 |
| Agricultural area (%) | 22.26 | 20.44 | 0.03 | 89.49 |
| Path | Beta | S.E. | C.R. | ||
|---|---|---|---|---|---|
| Stream substrate composition | → | Water quality | 0.28 | 0.02 | 0.495 |
| Stream substrate composition | → | Total number of benthic invertebrate communities | −0.51 * | 0.07 | −2.122 |
| Stream substrate composition | → | Density ratio of ETP taxa | −1.61 ** | 0.54 | −3.069 |
| Stream substrate composition | → | Density ratio of collector–gatherer taxa | 1.16 * | 0.35 | 2.841 |
| Stream substrate composition | → | Density ratio of tolerant taxa | 1.67 ** | 0.63 | 3.042 |
| Hydrological characteristics | → | Stream substrate composition | 0.40 *** | 2.59 | 3.436 |
| Hydrological characteristics | → | Water quality | −0.24 | 0.18 | −0.859 |
| Hydrological characteristics | → | Total number of benthic invertebrate communities | 0.61 ** | 1.22 | 3.253 |
| Hydrological characteristics | → | Density ratio of ETP taxa | 0.96 ** | 7.51 | 2.907 |
| Hydrological characteristics | → | Density ratio of collector–gatherer taxa | −0.86 ** | 5.21 | −3.189 |
| Hydrological characteristics | → | Density ratio of tolerant taxa | −0.71 * | 8.45 | −2.162 |
| Water quality | → | Total number of benthic invertebrate communities | −0.25 * | 1.04 | −2.35 |
| Water quality | → | Density ratio of ETP taxa | −0.06 | 7.04 | −0.293 |
| Water quality | → | Density ratio of collector–gatherer taxa | 0.13 | 4.61 | 0.839 |
| Water quality | → | Density ratio of tolerant taxa | −0.02 | 8.09 | −0.105 |
| Land use proportion | → | Stream substrate composition | −0.89 ** | 1.81 | −3.591 |
| Land use proportion | → | Hydrological characteristics | 0.12 | 0.05 | 0.735 |
| Land use proportion | → | Water quality | 0.66 | 0.14 | 1.045 |
| Land use proportion | → | Total number of benthic invertebrate communities | −0.73 ** | 0.68 | −2.296 |
| Land use proportion | → | Density ratio of ETP taxa | −2.01 * | 5.94 | −2.538 |
| Land use proportion | → | Density ratio of collector–gatherer taxa | 1.44 * | 3.78 | 2.43 |
| Land use proportion | → | Density ratio of tolerant taxa | 2.09 * | 7.28 | 2.434 |
| Total number of benthic invertebrate communities | → | BMI grade | 0.34 ** | 0.13 | 7.723 |
| Density ratio of ETP taxa | → | BMI grade | 0.26 ** | 0.05 | 4.357 |
| Density ratio of collector-gatherer taxa | → | BMI grade | −0.23 ** | 0.05 | −4.701 |
| Density ratio of tolerant taxa | → | BMI grade | −0.13 * | 0.04 | −2.377 |
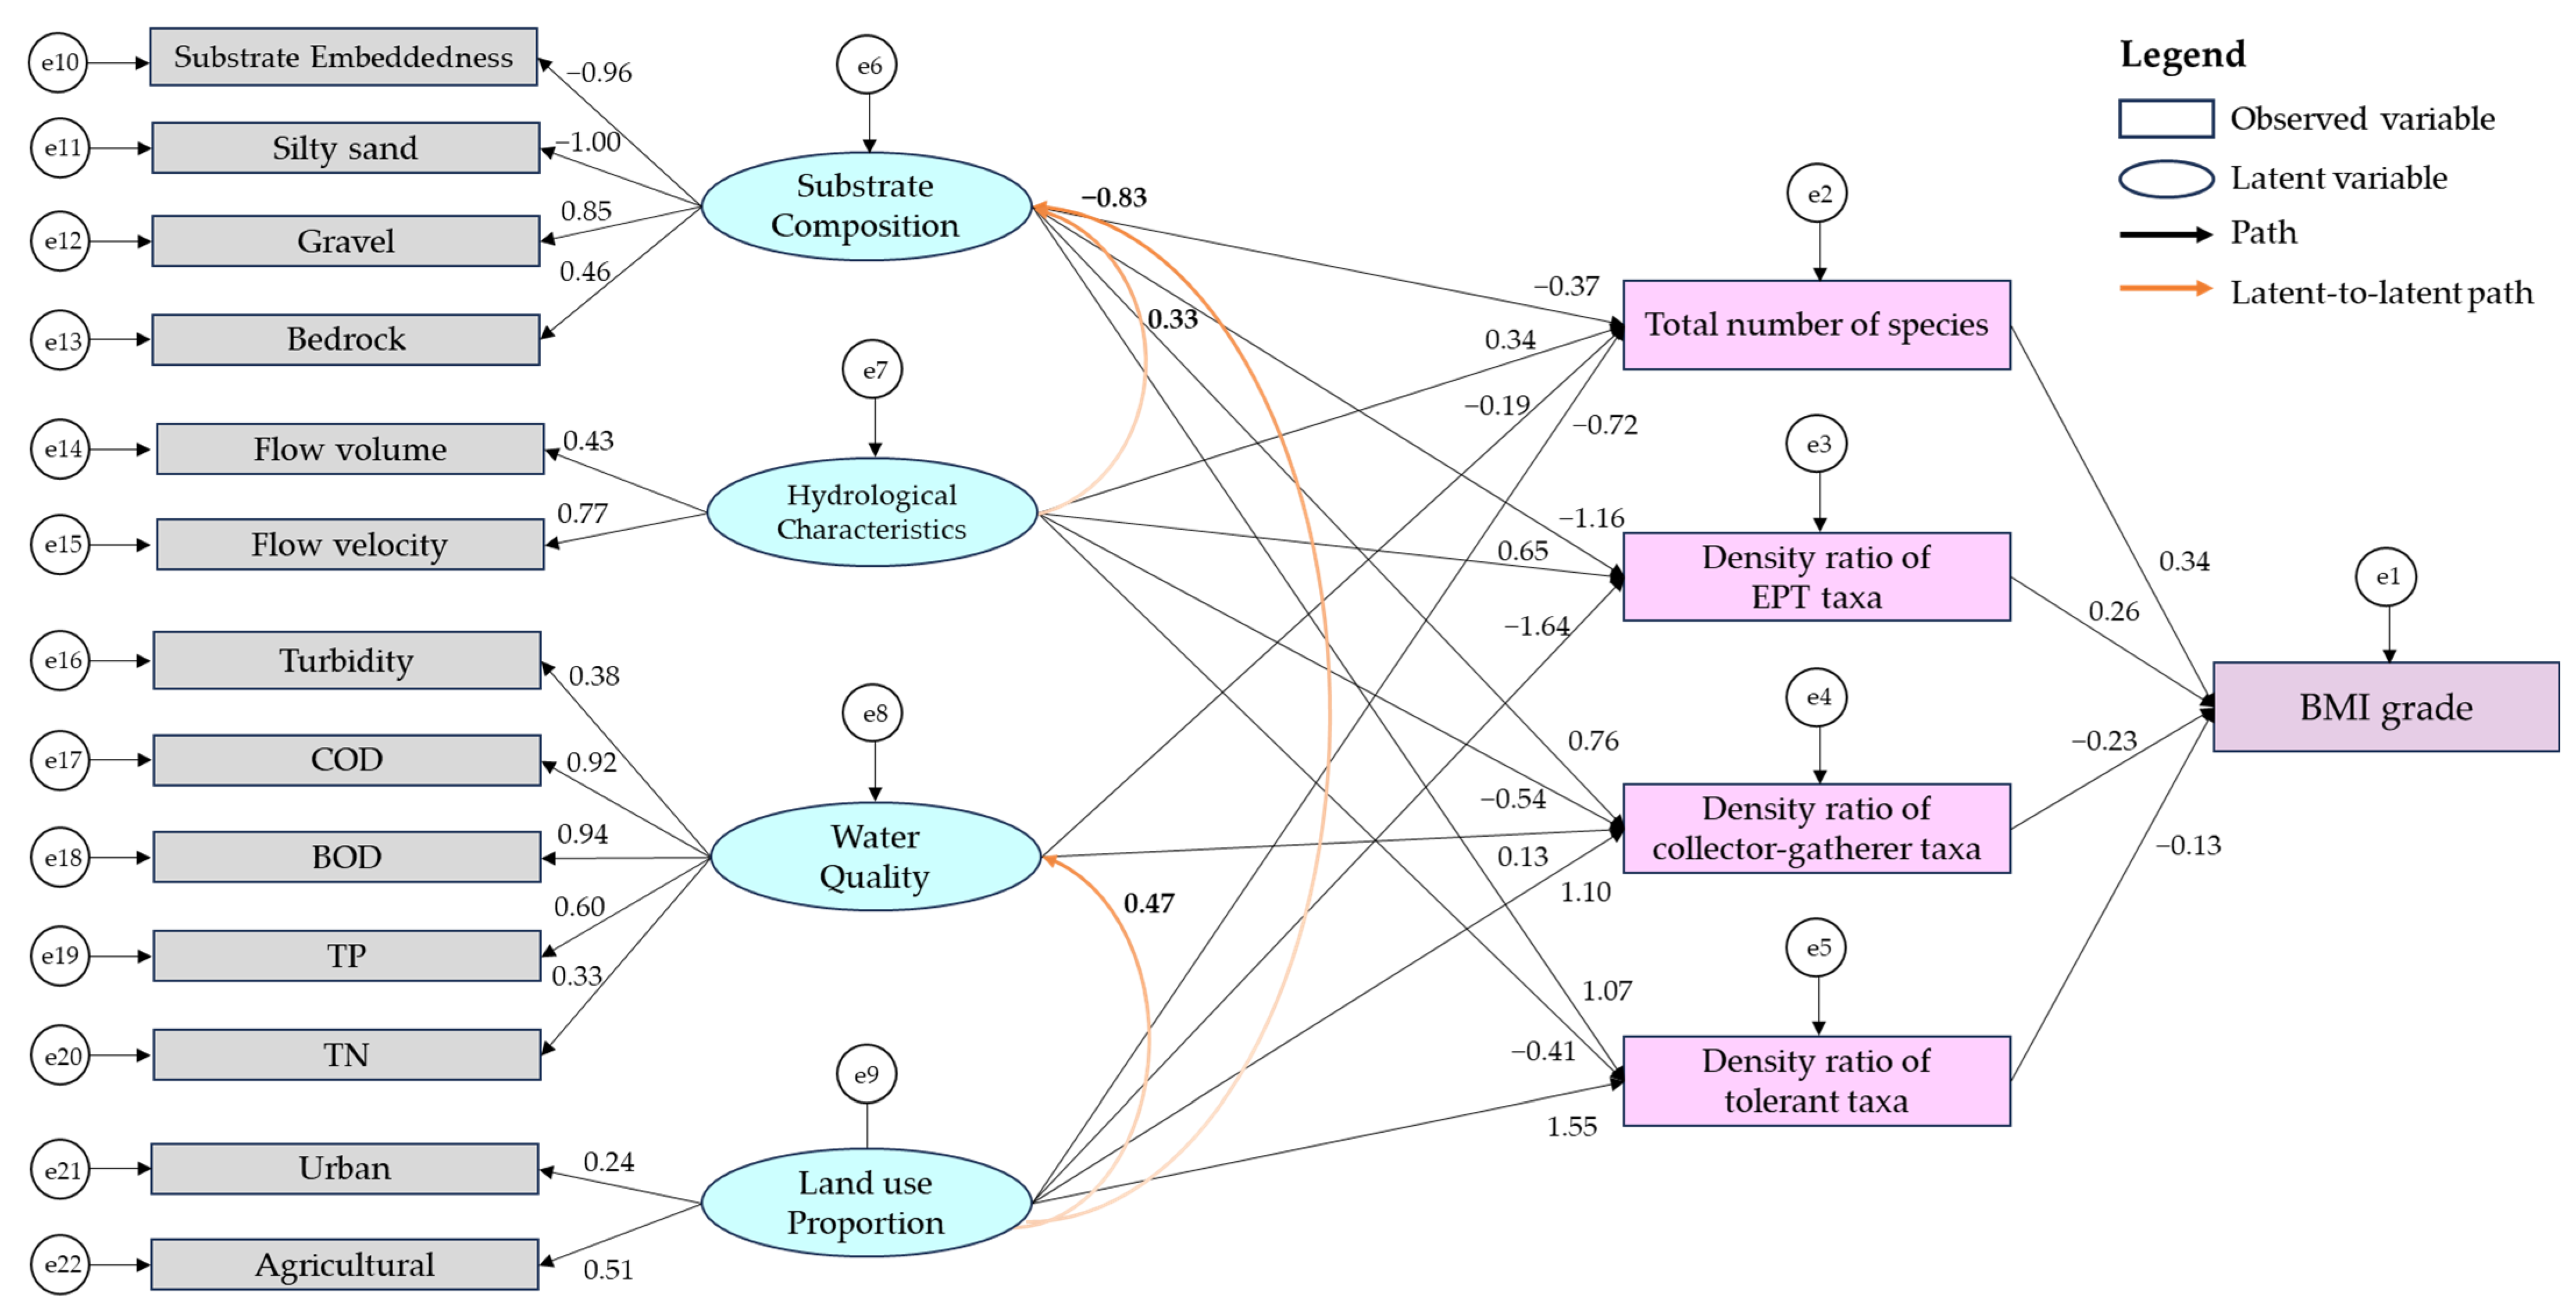
| Path | Beta | S.E. | C.R. | ||
|---|---|---|---|---|---|
| Stream substrate composition | → | Total number of benthic invertebrate communities | −0.37 ** | 0.16 | −2.174 |
| Stream substrate composition | → | Density ratio of ETP taxa | −1.16 ** | 1.05 | −3.733 |
| Stream substrate composition | → | Density ratio of collector–gatherer taxa | 0.76 ** | 0.66 | 3.287 |
| Stream substrate composition | → | Density ratio of tolerant taxa | 1.07 ** | 1.15 | 3.502 |
| Hydrological characteristics | → | Stream substrate composition | 0.33 ** | 0.47 | 3.483 |
| Hydrological characteristics | → | Total number of benthic invertebrate communities | 0.34 ** | 0.57 | 2.831 |
| Hydrological characteristics | → | Density ratio of ETP taxa | 0.65 ** | 3.08 | 3.532 |
| Hydrological characteristics | → | Density ratio of collector–gatherer taxa | −0.54 ** | 2.25 | −3.396 |
| Hydrological characteristics | → | Density ratio of tolerant taxa | −0.41 ** | 2.93 | −2.665 |
| Water quality | → | Total number of benthic invertebrate communities | −0.19 ** | 0.27 | −3.423 |
| Water quality | → | Density ratio of collector–gatherer taxa | 0.13 ** | 0.72 | 2.637 |
| Land use proportion | → | Water quality | 0.47 ** | 0.05 | 3.839 |
| Land use proportion | → | Stream substrate composition | −0.83 ** | 0.47 | −3.679 |
| Land use proportion | → | Total number of benthic invertebrate communities | −0.72 ** | 0.48 | −3.001 |
| Land use proportion | → | Density ratio of ETP taxa | −1.64 ** | 3.39 | −3.406 |
| Land use proportion | → | Density ratio of collector–gatherer taxa | 1.10 ** | 1.99 | 3.275 |
| Land use proportion | → | Density ratio of tolerant taxa | 1.55 ** | 3.66 | 3.36 |
| Total number of benthic invertebrate communities | → | BMI grade | 0.34 ** | 0.13 | 7.723 |
| Density ratio of ETP taxa | → | BMI grade | 0.26 ** | 0.05 | 4.357 |
| Density ratio of collector-gatherer taxa | → | BMI grade | −0.23 ** | 0.05 | −4.701 |
| Density ratio of tolerant taxa | → | BMI grade | −0.13 * | 0.04 | −2.377 |
| Model Fit Index | Criteria | Full Model | Optimized Model |
|---|---|---|---|
| NFI | ≥0.90 | 0.79 | 0.90 |
| PNFI | ≥0.60 | 0.59 | 0.66 |
| TLI | ≥0.90 | 0.75 | 0.90 |
| CFI | ≥0.90 | 0.81 | 0.91 |
Disclaimer/Publisher’s Note: The statements, opinions and data contained in all publications are solely those of the individual author(s) and contributor(s) and not of MDPI and/or the editor(s). MDPI and/or the editor(s) disclaim responsibility for any injury to people or property resulting from any ideas, methods, instructions or products referred to in the content. |
© 2025 by the authors. Licensee MDPI, Basel, Switzerland. This article is an open access article distributed under the terms and conditions of the Creative Commons Attribution (CC BY) license (https://creativecommons.org/licenses/by/4.0/).
Share and Cite
Park, S.-R.; Park, Y.; Lee, J.-W.; Kim, H.; You, K.-A.; Lee, S.-W. How Land Use and Hydrological Characteristics Impact Stream Conditions in Impaired Ecosystems. Land 2025, 14, 829. https://doi.org/10.3390/land14040829
Park S-R, Park Y, Lee J-W, Kim H, You K-A, Lee S-W. How Land Use and Hydrological Characteristics Impact Stream Conditions in Impaired Ecosystems. Land. 2025; 14(4):829. https://doi.org/10.3390/land14040829
Chicago/Turabian StylePark, Se-Rin, Yujin Park, Jong-Won Lee, Hyunji Kim, Kyung-A You, and Sang-Woo Lee. 2025. "How Land Use and Hydrological Characteristics Impact Stream Conditions in Impaired Ecosystems" Land 14, no. 4: 829. https://doi.org/10.3390/land14040829
APA StylePark, S.-R., Park, Y., Lee, J.-W., Kim, H., You, K.-A., & Lee, S.-W. (2025). How Land Use and Hydrological Characteristics Impact Stream Conditions in Impaired Ecosystems. Land, 14(4), 829. https://doi.org/10.3390/land14040829