Abstract
The present study was conducted in Extremadura, a region in southwestern Spain with a significant area dedicated to olive cultivation. An analysis of the olive growing climatology of its territory was conducted using bioclimatic indices that affect the development of olive cultivation, focusing on water requirements, thermal requirements, and leaf carbohydrate synthesis. The study revealed that very dry conditions during the olive growing season are the main characteristic of the Mediterranean climate in the region. A principal component analysis was performed to analyze the main sources of variability, revealing two main components, determined by annual rainfall, annual water requirement, mean annual temperature, degree days above 14.4 °C accumulated during the olive growing season, and the number of days with optimal temperatures for leaf carbohydrate synthesis. Three homogeneous groups were determined by cluster analysis, one of which had cooler thermal conditions and no water requirements. The study found that an increase in the olive growing season or a shortening of the dormant period could result in a higher water input during the growing season and a lack of accumulation of chilling hours during the dormant period, causing crop maintenance problems in warmer locations. Climate change is expected to have significant impacts on this crop where climatic conditions are already very hot and dry. In the future, it is possible that the current olive-growing areas in Extremadura will move to other areas where the temperature is cooler.
1. Introduction
The climate is a complex system that influences the growth and maturation of plants, which, in turn, affects the quality and yield of products. The Mediterranean region, for example, has specific climatic conditions, including a temperate and humid climate in winter and a hot and dry climate in summer [1], with considerable interannual variability. These conditions have a significant impact on vegetation, limiting the cultivation of certain crops such as vines and olive trees. The olive tree (Olea europea L.) is particularly important in the Mediterranean region in terms of area and economic importance [2], being mainly distributed between latitudes 30° and 45° in both hemispheres [3]. Climate is a crucial element in fruit growing, influencing the quality of the fruits produced and their relationship with the climatic variables and indices under which the species are grown. Temperature is the most important environmental factor limiting olive-growing areas, while water availability is the most important factor limiting plantation yields [4].
The relationship between climatic factors and woody crops, such as the olive tree, has been studied at different geographical levels, including research on continents [5,6,7], or in countries with a long tradition of olive growing such as Spain, Portugal, and Greece [8,9,10]. Other studies describe agricultural districts or regions [11,12] recognised as protected designations of origin (PDOs). For example, studies have been conducted by Honorio et al. [13] and Moral et al. [14] on olive cultivation and vineyards, respectively. These studies endeavor to elucidate the intricate and interwoven relationship between the biological processes of plants or crops and climate, employing algorithms and mathematical expressions to encapsulate the data through the use of indices. The mathematical models entail parameters or variables encompassing climatic, hydric, and physiological elements [8,13,14,15]. Climate exerts a significant influence on the formation of the fruit and on the quality and characteristics of the resulting processed products. In the case of the olive tree, environmental variability can be more important than genetic variability with regard to biological processes, influencing the growth rate at any stage of the olive tree and the composition and organoleptic characteristics of the oil produced from its fruits [16]. For instance, the synthesis of carbohydrates in olive leaves is a crucial process for their growth and development. This process can impact the production cycle of the olive tree, modifying growth, yield, and resistance to adverse conditions [17].
Areas deemed suitable for this crop have an average annual temperature of 15–20 °C, with a minimum of 4 °C and a maximum of 35–40 °C [18,19]. In general, the optimum temperature for vegetative growth is between 10 °C and 30 °C. The minimum winter temperature should not fall below −7 °C, as this can cause significant damage below −12 °C [20] and jeopardize the viability of the crop [21,22]. Spring frosts and temperatures below 10 °C affect shoots and inflorescences [23,24].
The water requirements of the olive tree are largely determined by temperature and precipitation, which affect the balance between evapotranspiration and precipitation [25]. In general, water deficit has a negative effect on yield, fruit dry mass, and oil accumulation [26,27]; however, 500 mm per year represents the minimum level of precipitation required for commercial rainfed olive production [28]. Water-stressed olive trees show higher leaf carbohydrate concentration, assuming a better environmental adaptation [29,30]. Winter temperature has a direct influence on phenology and cold accumulation during the winter dormancy period [31]. In a study under controlled conditions, it was identified that the olive tree enters the winter dormancy period when the temperature drops below 14.4 °C [32]. Paniagua et al. [33] use this threshold temperature to calculate the growing period of the olive tree in regions of Spain.
The growing degree day (GDD) index, one of the most effective agroclimatic indices, consists of the accumulation of heat above a specific base temperature (Tbase) [34] as a thermal integral, and has been used to understand the thermal needs of crops [35] and characterize their development [36,37,38,39,40,41]. In the case of olive, it has been used to predict flowering, with the base temperature ranging, according to different studies, between 5 and 13 °C [42,43,44,45,46,47,48,49,50]. Another study revealed that the threshold temperature depended on both the area and the varieties grown, ranging from 16 °C in Perugia (Italy) to 18–22 °C in Cordoba and Jaen (Spain) [51].
The use of multiple indices can lead to information saturation and inconvenient data management, leading to redundant information and uncertainty in selecting the most appropriate index [52]. The characterization of a territory and the crops grown there may be compromised by the use of a single index, which may lack the necessary detail to provide a comprehensive representation.
Principal component analysis (PCA) is a fundamental statistical technique in scientific research, reducing the dimensionality of data while retaining the majority of the original variability [53]. By identifying linear combinations of variables that explain the majority of the variability in a dataset, PCA assists in the revelation of underlying patterns and structures that may not be evident in a univariate analysis [54]. It enables researchers to concentrate their efforts on the most pertinent variables, thereby enhancing the reliability of their conclusions [55].
However, the above relationship between bioclimatic variables and olive cultivation has not been adequately understood in important agricultural regions such as Extremadura in Spain, one of the most extensive olive-growing areas in Europe.
The objective of this study is to gain a deeper understanding of the climatic conditions that are conducive to olive cultivation in Extremadura. It aims to characterize the olive growing climatology of its territory by means of bioclimatic indices that affect the development of olive growing, as well as to propose a reduction of the indices studied, with the aim of explaining the greatest climatic variability observed with the smallest number of indices. The study employs a classification approach, delineating agricultural areas with homogeneous climatic properties, in order to detect the potential for occupying new areas for olive growing. Information on the climatic structure of olive cultivation in Extremadura makes it possible to examine trends and investigate possible alterations in its climatic variability and to identify new areas that are better adapted to the effect of climate change.
2. Materials and Methods
2.1. Study Region and Climatic Variables
Extremadura is situated in the southwestern region of Spain, between latitudes 37°57′ and 40°29′ N and longitudes 4°39′ and 7°33′ W, with Portugal forming its western border (Figure 1). The region is comprised of two major provinces, Cáceres and Badajoz, which encompass 19,868 km2 and 21,766 km2, respectively. These two provinces are the largest in Spain. In terms of topographical characteristics, the region has an average elevation of 425 m above sea level (a.s.l.), with a maximum of 2091 m and a minimum of 116 m. The majority of the region’s surface area is situated within the Tajo and Guadiana river basins (Figure 1). The region of Extremadura has a total reservoir water capacity of 14,447 hm3, which represents 25.7% of the total capacity in Spain [56]. As a consequence of the precipitation levels observed during the current hydrological period (2023–2024), the region currently has 68.52% of its total water capacity in reservoirs [56,57], with a portion of this water being allocated for the irrigation of crops. The region boasts a rich rural heritage, with olive cultivation representing a significant economic activity. Olive cultivation occupies an area of 271,404 ha, representing 10.30% of the total area of Spain. It is the third autonomous community in terms of surface area dedicated to olive cultivation and olive oil production and the second in terms of table olives [58].
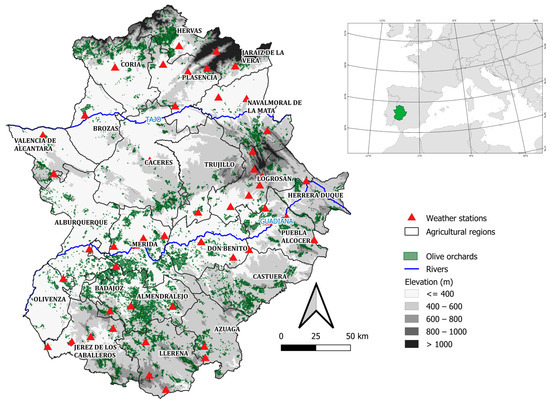
Figure 1.
Digital elevation model of Extremadura, showing olive groves and weather stations used in this study.
Extremadura is divided into 21 agricultural regions—10 in the province of Cáceres and 11 in the province of Badajoz. Olive cultivation is present in all agricultural regions, although they differ greatly in terms of cultivated area, production, and topographical and climatic variability [13]. Olive growing is experiencing a continuous increase in the area under cultivation, especially in super-intensive plantations and in areas where it was not present before. The surface area dedicated to olive cultivation is mainly located at altitudes ranging between 200–600 m a.s.l. The average annual temperature is 16.5 °C, ranging from 10.4 °C minimum to 22.5 °C maximum [17], with both temperatures being suitable for olive cultivation [59]. The interannual variability of rainfall can be a constraint on olive cultivation, since 50% of the olive-growing area receives less rainfall than is considered adequate for optimum production [17]. In the province of Badajoz, 81.2% of Extremadura’s olive-growing area is cultivated and the predominant cultivation system is extensive and rainfed. The Tierra de Barros region stands out with 23.5%. In recent years, there has been a notable increase in the area under irrigation and super-intensive plantations with mechanized harvesting, mainly located in the region of Vegas del Guadiana, with 26.1% of the total area of Extremadura [13]. Extremadura has three Protected Designations of Origin (PDO): Gata-Hurdes virgin olive oil, Monterrubio virgin olive oil, and Aceites Villuercas-Ibores-Jara.
The daily data on the climatological variables were obtained from the 47 meteorological stations of the Spanish State Meteorological Agency (AEMET) [60], which are located in the Extremadura region (Figure 1). The daily climatic variables analyzed were the mean temperature (Tavg), the mean annual maximum (Tx) and minimum (Tn) temperatures, and the annual precipitation (Rr) over the 32-year study period (1990–2021). The daily data were subjected to quality control procedures in accordance with the standards set forth by the World Meteorological Organization [61] and the Royal Netherlands Meteorological Institute (KNMI) [62]. To guarantee the quality of the data, any missing data were completed and a homogenization process was applied using the R package CLIMATOL 4.1.1 [63] (https://www.climatol.eu/, accessed 27 February 2024). The analysis was conducted using the statistical software SPSS 25.0.
The elevation data were obtained using Digital Elevation Model of Spain (DEM200) with a resolution of 200 m for the analysis of the topographic variables. The representation of the surface dedicated to the olive orchards (Figure 1) was obtained from the Spanish Land Use and Land Cover Information System (SIOSE) [14].
2.2. Bioclimatic Indices
In order to perform a bioclimatic assessment and characterize climate variability in the olive sector in Extremadura, a series of indices derived from meteorological variables have been employed. The application of these indices enables the delineation of areas exhibiting analogous climatic attributes, thereby facilitating their differentiation from other regions. Some of the indices employed in this study are based on temperature, as it is the primary variable regulating olive phenology, enabling the identification of vegetative growth and dormancy periods [34]. Furthermore, rainfall-based indices facilitate the characterization of the water requirements of the olive grove, as the availability of water at specific dates is crucial for enhancing yields [64]. The utilization of bioclimatic indices incorporating temperature and precipitation is of paramount importance in a region such as Extremadura, where aridity conditions are anticipated to fluctuate from Mediterranean to semi-arid by the end of the 21st century [65].
A total of 14 indices have been employed in this research, based on the climatic database, to calculate the annual average for the period under study (1990–2021) for each of the stations located in the agricultural regions. The indices encompass a range of categories.
The climatic indices calculated from the climatic database were Tn, Tx, Tavg, and Rr for the period under study. To account for the impact of low temperatures on olive trees, the number of days with minimum temperatures below 0 °C and −4.7 °C was calculated in accordance with the methodology proposed by Lodolini et al. [66]. This resulted in the frost days index (FD) and the severe frost days index (SF), respectively. The indices that account for the water requirements of the olive crop include the potential evapotranspiration (PET), which, in this study, is calculated (Equation (1)) using the Hargreaves method [67], and the annual crop water requirement (AWR), which is defined as the difference between crop PET and effective precipitation—rainwater actually used by a soil—according to USDA criteria [68]. The PET is calculated according to the following formula:
where PET refers to the daily evapotranspiration, Tmax and Tmin are the maximum and minimum daily temperatures, respectively, and Ra is the extraterrestrial radiation.
In order to apply the various bioclimatic indices, the olive growing cycle in Extremadura [69] was taken into account, which comprises the following phases:
The first phase, which commences with the onset of budbreak and concludes with stone hardening, spans from March to June. The second phase encompasses fruit growth from July to August, while the third phase extends from veraison to harvest, occurring from September to November. The resting period, designated phase 0, encompasses the months between December and February. Accordingly, the active growth period of the olive cycle encompasses phases 1, 2, and 3. To ascertain these periods, the study conducted by López-Bernal et al. [32] was consulted. This study determined the resting period of the olive tree when the mean daily temperature was below 14.4 °C, thus establishing that the active growth period occurs when the mean daily temperature is above this threshold. Two bioclimatic indices were employed to ascertain the resting period—the mean temperature of the number of days at rest (TagvRep14.4) and the number of days at rest when the mean daily temperature is below 14.4 °C (NDRep14.4)—by the following formula:
During the active growing period, the indices used were Olive Growing Season Temperature (OGST) [33], defined as the number of days with mean temperature above 14.4 °C (NOGST14.4), according to the formula described in Equation (3), and the mean temperature of the number of days in active growth (TavgOGS 14.4).
For the active growth period, an index of daily accumulation of heat units [70]—the growing degree days (GDDs)—has also been used to describe the growth suitability of crops in different climates (Equation (4)). In this case, it is applied to the olive tree as the olive growing degree day index (OGDD14.4), it is calculated by subtracting the average temperature recorded each day from the base temperature of the olive tree (14.4 °C), and summing the daily values during the active growth period, by the following formula:
GDD = ∑ (T daily mean temperature − T threshold)
In order to include a bioclimatic index that plays a significant role in plant nutrition and fruit fat formation, the index of the number of days with optimal temperatures for carbohydrate synthesis in leaves during the period of active growth period (NDCHS) has been established. The optimal range for this index is when the average daily temperature is between 20 °C and 30 °C [61]. It can be calculated as follows:
2.3. Analysis of the Variables
Multivariate information synthesis techniques are essential, especially in studies where climatological data are present [71]. In order to discriminate and synthesize the information coming from the 14 indices (Table 1), a multivariate analysis was carried out [72], for the purpose of better understanding the variations of these in the 47 meteorological stations (locations) located in Extremadura and to be able to identify the indices that differentiate them in order to later establish homogeneous groups in terms of these indices.
In the first stage, it was proposed to determine the minimum number of bioclimatic indices needed to explain the climatic variability of olive growing in Extremadura, among all the bioclimatic indices used, on the condition that they explain more than 90% of the variability found. Factor analysis was carried out using the method of principal component analysis (PCA). In order to eliminate the redundancy associated with the use of several indices, a varimax rotation was applied to the correlation matrix of the data from each meteorological station. Cluster analysis (CA) was performed using in second-stage K-means clustering, as this is the optimal technique for grouping cases into subgroups based on their similarity, in order to classify the sites and obtain homogeneous groups of sites that are similar to each other but different from others. The CA was carried out with the previous result of the PCA, with the purpose of reducing the number of variables, avoiding standardization and high correlations between them. Therefore, the PCA and CA results were used to assess the redundancy of the bioclimatic indices and to identify the most relevant components that explain the climatic pattern in Extremadura and to recognize areas with common climatic characteristics from the perspective of olive cultivation. The non-parametric Mann–Kendall test was used to determine the trends in the main components over time, as recommended by the World Meteorological Organization (WMO) [73], and Sen’s slope estimator [74] was used to determine the slope and its direction. The analysis was carried out using SPSS 25.0 statistical software.

Table 1.
Acronyms and definitions of the climatic and bioclimatic variables used in this research in the period 1990–2021.
Table 1.
Acronyms and definitions of the climatic and bioclimatic variables used in this research in the period 1990–2021.
| Variables | Definition of Variables | Source |
|---|---|---|
| Tx (°C) | Average maximum temperature | AEMET [62] |
| Tn (°C) | Average minimum temperature | AEMET [62] |
| Tavg (°C) | Average temperature for the period | AEMET [62] |
| Rr (mm) | Average annual precipitation for the period | AEMET [62] |
| FD (n° day) | Number of frost days: number of days with minimum temperature below 0 °C | García-Martín et al. [75] |
| SF (n° day) | Number of severe frost days: No. of days with minimum temperature below −4.7 °C | Lodolini et al. [66] |
| AWR (mm) | Annual water requirement | (USDA) [67] |
| ETO | Potential evapotranspiration | Hargreaves method [67] |
| NDRep14.4 | Number of days at rest, with average daily temperature below 14.4 °C | López-Bernal et al. [32] |
| (n° day) | ||
| TavgRep14.4 | Average temperature of the number of days at rest | López-Bernal et al. [32] |
| (n° day) | ||
| NOGST14.4 | Number of days of active growth, with average daily temperature above 14.4 °C | Paniagua et al. [33] |
| (n° day) | ||
| TavgOGS14.4 | Average temperature of the number of days in active growth | Paniagua et al. [33] |
| (°C) | ||
| GDD14.4 | Degree days during the olive tree growth period above 14.4 °C | McMaster et al. [70] |
| (degree days) | ||
| NDCHS | Number of days with optimal temperatures for carbohydrate synthesis in leaves during the active growth period when the average daily temperature is between 20 °C and 30 °C | Tombesi et al. [61] |
| (n° day) |
To enhance comprehension of the methodology, Figure 2 illustrates the steps followed in this study.
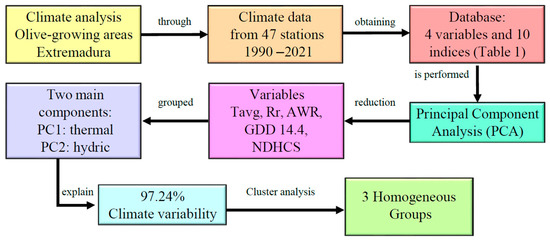
Figure 2.
Methodological diagram followed in this study.
3. Results and Discussion
3.1. Descriptive Analysis of Data
Descriptive statistics (Table 2) were used to analyze the distribution of the data. The bioclimatic indices showed similar values for the mean and median. Skewness values were negative for temperature-based indices, except for NDRep14.4, indicating some localities with lower data values. However, frost FD and SF values obtained positive and relatively high values, especially SF, indicating large differences between median and mean values. Rr and SF data fit a lognormal distribution, with higher skewness values indicating a positively skewed distribution.
Table 2.
Descriptive statistics of the climate variables from 47 weather stations in Extremadura and along its boundaries in period 1990–2021.
Statistical analysis showed that the mean values were higher than the median values for all bioclimatic indices, with the exception of SF and NDRep14.4, indicating that their distributions obtained higher values.
The same is also true for the indices with a hydric component, with the exception of Rr, indicating that there are localities where lower values are obtained with respect to rainfall. The coefficients of variation obtained low and positive mean values, except for Rr, FD, SF, and AWR, which obtained high values, indicating significant variability in terms of location, suggesting a potential for defining different groups. Specifically, the water requirement has been shown in different studies [76,77] to be a variable that discriminates between localities, showing differences in olive oil production.
The application of multivariate techniques led to the selection of five indices: mean temperature (Tavg), mean annual precipitation (Rr), annual water requirement (AWR), degree days in the olive growing season above 14.4 °C (GDD14.4), and number of days with optimal temperatures for carbohydrate synthesis in leaves (NDCHS). These indices explain 97.24% of the variability observed in the Extremadura localities.
The correlation coefficient between climatic variables is presented in Table 3. The correlation coefficient between climatic variables was found to be high, with the three bioclimatic indices based on temperature, Tavg, GDD14.4, and NDCHS, showing a strong correlation. The average annual precipitation of the period (Rr) is negatively related to all other variables, primarily with AWR. Consequently, areas with higher rainfall accumulate less heat (GDD14.4) and have a lower number of days for carbohydrate assimilation in leaves (NDCHS). In contrast, areas with higher average temperatures allow for a greater number of days for carbohydrate accumulation in leaves during the olive growth period [78]. However, a weaker correlation was found with AWR. The AWR index shows positive values with the temperature-based bioclimatic indices, indicating that the annual water requirements for olive cultivation are higher in regions where the bioclimatic indices Tavg, GDD14.4, and NDCHS have higher values. This relationship coincides with the study by Rongai et al. [79], using multivariate analysis, in which mean rainfall and mean temperatures were variables that geographically discriminated localities with differences in olive oil composition.
Table 3.
Correlation matrix between bioclimatic indices in Extremadura.
3.2. Extraction of Principal Component; Cluster Analysis; Description of Bioclimatic Groups
The result showed significant correlations between the bioclimatic indices, indicating that it was appropriate to perform a PCA to determine the main sources of variability in the data extracted from the weather stations. The results of the PCA (Table 4 and Figure 3) showed that the first two principal components explained 97.24% of the total variance, being 80.42% and 16.82% for principal component 1 (PC1) and principal component 2 (PC2), respectively. PC1 was mainly dominated by the three temperature-related indices (Tavg, GDD14.4, and NDCHS), with a small negative contribution of Rr and a positive median contribution of AWR, so it can be defined as a thermal component. PC2 is composed of the hydric variables, annual precipitation (Rr) and annual water requirement (AWR), with high negative and positive load contributions, respectively, and small negative contributions from the thermal bioclimatic indices. Therefore, component 2 (PC2) can be defined as the hydric component. Water variables were also part of the principal component in the study by Piñar-Fuentes et al. [80], in which they explained a large variability in olive tree production.
Table 4.
Results of the principal component analysis for the five bioclimatic indices derived from the 47 climate stations used in the analysis.
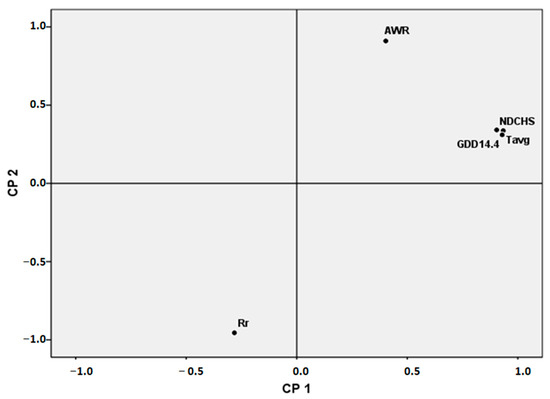
Figure 3.
Position of the five bioclimatic indices used in the study with respect to the principal components.
The main component, PC1, indicates that there are locations with high values in the bioclimatic indices; they are warm locations with high heat accumulation and a high number of days with optimal temperatures for carbohydrate synthesis but with low rainfall and a high deficit in the annual water requirement. On the contrary, the component PC2 indicates that there are locations with high levels of AWR and with an annual rainfall, Rr, higher than the hydric need for the good development of the olive tree.
A principal component analysis (PCA) was performed to find the main sources of variability in the data from the weather stations. Homogeneous groups were determined by PC1 and PC2. Three bioclimatic clusters were defined. The centroids of each cluster and the location of the weather stations in relation to the two principal components are shown in Figure 4. Cluster G1 is characterized by an intermediate position in the components PC1 and PC2, and consequently, by average values in the bioclimatic and hydrological indices. The differences between the other two groups are determined in G3 by a higher rainfall and no annual water requirement and also by lower values in the biothermal indices. The G2 group obtains values close in some stations to those of the G1 group for the PC1 component; however, this group is defined by presenting high values in the PC1 component and obtaining in the PC2 component negative values in Rr and positive values in AWR. Consequently, it presents locations with a high deficit in the water requirement and in the annual rainfall.
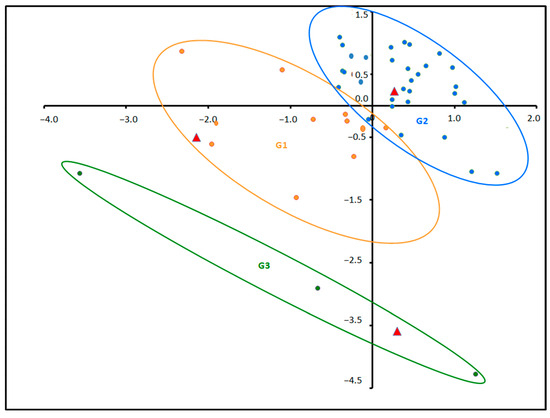
Figure 4.
Position of the climatic groups with respect to the first and second principal components; the centroids of each group are indicated with a triangle and the meteorological stations are indicated with a circle with a different color depending on their group.
The G3 group is characterized by the PC2 component, as it obtained in the studied period the values in AWR and Rr necessary to obtain good hydric conditions for the development of the olive tree. The relevant climatic characteristics were described for each group and differences were found for the climatic suitability for olive cultivation. Table 5 shows the descriptive statistics of the climatic indices of the three groups and the discrimination between means after Tukey’s test. Significant differences were found between the three groups for all indices, except GDD14.4. The groups G1 and G3 do not show significant differences for GDD14.4, so both of them obtain close values in heat accumulation, or thermal integral, during the vegetative period. On the other hand, there are no significant differences in altitude between groups G1 and G3 for GDD14.4.
Table 5.
Descriptive statistics of climatic indices of the three climatic groups in Extremadura for the period 1990–2021.
Figure 5 shows the spatial distribution in Extremadura of the weather stations of each climatic group. Group G1 is formed by 11 weather stations located in the areas with an intermediate elevation (mean elevation = 526 m a.s.l.), which are distributed both in the north and in the south of Extremadura in the foothills of the mountainous areas. This group presents locations with great variability in the values of the different indices, presenting climatic stations close to groups G2 and G3, thus indicating that it obtains values similar to the indices of this group (Table 5).
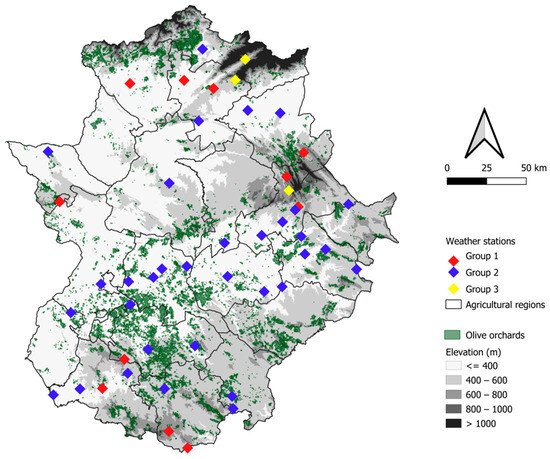
Figure 5.
Distribution in Extremadura of the weather stations for the three climatic groups.
Group G2 is the most numerous group, consisting of 33 climatic stations located mainly in the valley areas, occupying mainly the central area of Extremadura, and coincides for the most part with the area of Extremadura in which olive trees are grown (Figure 4). Consequently, these olive trees present the characteristics defined by the values of these indices in this group G2. The mean elevation of their locations is the lowest (mean elevation = 366 m a.s.l.) of the three groups. These areas have high Tavg values, but deficient AWR. It is recommended to provide water to cover water needs and obtain a good development of olive cultivation, coinciding with the work carried out by Moral et al. [14] in Extremadura. Another aspect to be taken into account in this group is the NDCHS, since the work carried out by Hueso et al. [29] shows that olive trees grown in Toledo (Spain) under the effect of deficit irrigation had higher carbohydrate contents in leaves.
Group G3 is composed of three localities at the highest altitude (maximum elevation = 750 m a.s.l.), where there is little area dedicated to olive cultivation (Figure 4). Altitude is another factor limiting the development of olive trees, with altitudes above 800 m a.s.l. being unsuitable for olive cultivation due to the incidence of frost and short growing seasons [18].This group is characterized by having the needs for olive cultivation covered in terms of the hydric component PC2, on the contrary, they present low thermal values, indicating that in these areas, olive cultivation does not cover the needs for heat accumulation (GDD14.4) nor the days for the accumulation of carbohydrates in leaves during the growing period. This may lead to a lower fat yield in the fruit, as shown by the work carried out by Mousa et al. [78], in which they showed that both the fatty acid composition and the phenolic content of the olives varied according to the altitude of the olive trees.
3.3. Trends of Principal Components
This study also examines the possible effects of climate change on the principal components CP1 and CP2 (Table 6). The results show a significant increase in the trend of the principal component PC1, while the principal component PC2 shows no significant value. The principal component PC1 increased its seasonal mean values, which led to an increase in the annual mean temperature, the heat accumulation index, and the NDCHS index during the growing season. In contrast, the component PC2 has a positive slope but a much lower value. Studies carried out by several authors in Italy [81,82,83] showed similar results, finding an increase in winter temperatures and, on the other hand, a reduction in the number of days for the development of phenological stages in the growth period.
Table 6.
Mann–Kendall test statistic for principal components for the 47 weather stations in Extremadura for the period 1990–2021.
Figure 6 shows an increase in the seasonal mean values for the main component PC1 during the study period, with a positive slope value (Q = 0.222). Consequently, the thermal indices underwent an increase in the mean annual temperature (Tvag), the heat accumulating index (GDD14.4), and the NDCHS index in the growing season. In contrast, the component PC2 (Figure 7) has a positive slope but with a much lower value (Q = 0.015). Therefore, it can be deduced that in the studied period, there has been a decompensation between the annual water requirement of the olive tree, AWR, the annual precipitation Rr, and the increase in the crop water needs caused by the trend of the temperature-based indices (Tavg, GDD14.4, NDCHS), creating a cumulative annual water deficit over the 32 years of study.
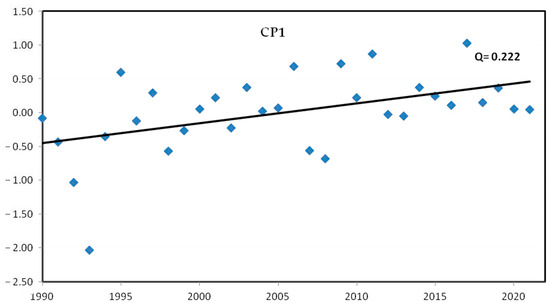
Figure 6.
Annual averages of the 47 climate stations (blue boxes) for the CP1 component in Extremadura in the period 1990–2021.
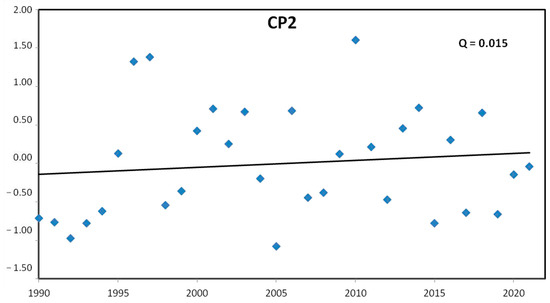
Figure 7.
Annual averages of the 47 climate stations (blue boxes) for the CP2 component in Extremadura in the period 1990–2021.
The biothermal index and the thermophysiological index show a positive trend during the study period, suggesting an increase in the olive growing period in Extremadura. This circumstance–which can occur with greater or lesser incidence, depending on the location, of passing days from the resting period to the growing period–can cause maintenance problems in the crop due to the need for a greater supply of water in the olive crop. On the other hand, it can cause a lack of cold accumulation in the resting period, producing an inadequate flowering, and consequently, a decrease in fruiting and a lack of yield, causing losses in production. This consequence coincides with studies carried out by several authors [44,45,46,47,48] in regions with a significant area of olive groves belonging to countries such as Italy and Spain. Therefore, in the future, there may be a possibility that olive-growing areas in Extremadura will move to other areas where the temperature is cooler [12,14].
4. Conclusions
This study analyzed the climatic structure of Extremadura for olive cultivation, a large region in southwestern Spain with numerous olive-growing areas. Initially, fourteen bioclimatic indices were considered for the period 1990–2021, covering water and biothermal requirements.
The main characteristic in many weather stations is very dry conditions during the growing period of the olive tree, typical of the Mediterranean climate of the region, except at higher elevations, where the potential water deficit is lower. There is a differentiation between localities due to an important variability of bioclimatic indices.
The result of the principal component analysis revealed that the main sources of variability are explained by two principal components: first, a biothermal component composed of mean annual temperature, degree days above 14.4 °C accumulated in the growing season, and the number of days with optimal temperatures for carbohydrate synthesis in leaves; the second component is characterized by the two water indices, mean annual precipitation and annual water requirement. These two components explain 97.24% of the observed variability.
Three homogeneous groups were determined by cluster analysis, one of them having cooler thermal conditions and no water requirements.
The trends for the first component showed significant increasing results, but for the water component, the trend was very low, revealing an increase in the growing period of the olive tree, or shortening of the dormancy period, which may result in higher water supply during the growing period and a lack of accumulation of chilling hours during the dormancy period. This may lead to crop maintenance problems in warmer areas.
This analysis represents one of the most robust temporal studies of the climatic structure of a region, providing a decision support tool for a better understanding of the climatic characteristics and potential of olive growing in Extremadura, and can be applied to any olive-growing region.
The effects of climate change can alter these conditions to which a crop has long adapted. Knowledge the climate structure makes it possible to determine future climate trends and to identifi new areas that are better adapted to the effects of climate change.
A future line of work is proposed that characterizes climate suitability through bioclimatic indices by employing multivariate analysis and geographic information systems, and their graphical representation will allow for the creation of a tool for decision-making in response to the effects of climate change.
Author Contributions
Conceptualization F.H.; methodology, F.H. and A.G.-M.; software, F.H., C.A. and L.L.P.; validation, F.H. and A.G.-M.; formal analysis, F.H., C.A. and L.L.P.; investigation, F.H., C.A., L.L.P. and A.G.-M.; resources, C.A. and L.L.P.; data curation, C.A. and F.H.; writing—original draft preparation, F.H. and A.G.-M.; writing—review and editing, F.H.; visualization, C.A. and F.H.; supervision, F.H.; project administration F.H.; funding acquisition, F.H. and A.G.-M. All authors have read and agreed to the published version of the manuscript.
Funding
This research was funded by the Junta de Extremadura and the European Regional Development Fund (ERDF) through the project IB20056 (“Impacto del cambio climático en el cultivo del olivo en Extremadura. Caracterización, zonificación y futuros escenarios”), and GR18088 (Research Group RNM028).
Data Availability Statement
The original contributions presented in this study are included in the article. Further inquiries can be directed to the corresponding author.
Acknowledgments
This study has been possible thanks to the collaboration of the Agencia Estatal de Meteorología (AEMET).
Conflicts of Interest
The authors declare no conflicts of interest.
References
- Giorgi, F.; Lionello, P. Climate change projections for the Mediterranean region. Glob. Planet. Change 2008, 63, 90–104. [Google Scholar] [CrossRef]
- Braudel, F. La Mediterranée et le Monde Mediterranéena L’époque de Philippe II, 4th ed.; tome premier; Armand Colin: Paris, France, 1979. [Google Scholar]
- Böhm, J.; Antunes, M.T. A evolução da espécie olea europaea. In O Grande Livro da Oliveira e do Azeite; Dinalivro: Lisboa, Portugal, 2013; pp. 89–175. [Google Scholar]
- Di Vaio, C.; Nocerino, S.; Paduano, A.; Sacchi, R. Influence of Some Environmental Factors on Drupe Maturation and Olive Oil Composition. J. Sci. Food Agric. 2013, 93, 1134–1139. [Google Scholar] [CrossRef]
- Andrade, C.; Fonseca, A.; Santos, J.A.; Bois, B.; Jones, G.V. Historic Changes and Future Projections in Köppen–Geiger Climate Classifications in Major Wine Regions Worldwide. Climate 2024, 12, 94. [Google Scholar] [CrossRef]
- Malheiro, A.C.; Santos, J.A.; Fraga, H.; Pinto, J.G. Climate change scenarios applied to viticultural zoning in Europe. Clim. Res. 2010, 43, 163–177. [Google Scholar] [CrossRef]
- Tscholl1, S.; Candiago, S.; Marsoner, T.; Fraga, H.; Giupponi, C.; Egarter, L. Assessing the climate change vulnerability of European winegrowing regions by combining exposure, sensitivity and adaptative capacity indicators. In Proceedings of the Terclim 2022, XIVth International Terroir Congress and Climate Wine Symposium, Bordeaux, France, 3–8 July 2022. [Google Scholar]
- Honorio, F.; García-Martín, A.; Moral, F.J.; Paniagua, L.L.; Rebollo, F.J. Spanish Vineyard Classification According to Bioclimatic Indexes. Aust. J. Grape Wine Res. 2018, 24, 335–344. [Google Scholar] [CrossRef]
- Fraga, H.; Santos, J.A.; Moutinho-Pereira, J.; Carlos, C.; Silvestre, J.; Eiras-Dias, J.; Mota, T.; Malheiro, A.C. Statistical modelling of grapevine phenology in Portuguese wine regions: Observed trends and climate change projections. J. Agric. Sci. 2016, 154, 795–811. [Google Scholar] [CrossRef]
- Grillakis, M.G.; Kapetanakis, E.G.; Goumenaki, E. Climate change implications for olive flowering in Crete, Greece: Projections based on historical data. Clim. Change 2022, 175, 7. [Google Scholar] [CrossRef]
- Adão, F.; Fraga, H.; Fonseca, A.; Malheiro, A.C.; Santos, J.A. The Relationship between Land Surface Temperature and Air Temperature in the Douro Demarcated Region. Portugal. Remote Sens 2023, 15, 5373. [Google Scholar] [CrossRef]
- Fraga, H.; Guimarães, N.; Freitas, T.R.; Malheiro, A.C.; Santos, J.A. Future Scenarios for Olive Tree and Grapevine Potential Yields in the World Heritage Côa Region. Portugal. Agron. 2022, 12, 350. [Google Scholar] [CrossRef]
- Honorio, F.; Aguirado, C.; Paniagua, L.L.; García-Martín, A.; Rebollo, L.; Rebollo, F.J. Exploring the Climate and Topography of Olive Orchards in Extremadura. Southwestern Spain. Land 2024, 13, 495. [Google Scholar] [CrossRef]
- Moral, F.J.; Rebollo, F.J.; García-Martín, A.; Paniagua, L.L.; Honorio, F. Spatial and Temporal Analysis of Water Resources in the Olive-Growing Areas of Extremadura, Southwestern Spain. Land 2024, 13, 1294. [Google Scholar] [CrossRef]
- López-Bernal, Á.; Morales, A.; García-Tejera, O.; Testi, L.; Orgaz, F.; De Melo-Abreu, J.P.; Villalobos, F.J. OliveCan: A Process-Based Model of Development. Growth and Yield of Olive Orchards. Front. Plant Sci. 2018, 9, 632. [Google Scholar] [CrossRef] [PubMed]
- Masmoudi-Charfi, C.; Ben Mechlia, N. Changes in olive tree height growth during the first years of cultivation. Adv. Hortic. Sci. 2008, 22, 8–12. [Google Scholar]
- Tombesi, A.; Tombesi, S. Orchard planning and planting. In Production Techniques in Olive Growing; Publisher International Olive Council: Madrid, Spain, 2007; pp. 17–40. [Google Scholar]
- Krishna, K.R. Agroecosystems. In Soils, Climate, Crops, Nutrient Dynamics and Productivity, 1st ed.; Apple Academic Press: New York, NY, USA, 2013. [Google Scholar] [CrossRef]
- Therios, I.N. Climatic and soil conditions. In Olives: Crop Production Science in Horticulture 18; CABI Publishing: Wallingford, UK, 2009; Volume 45, pp. 51–80. [Google Scholar] [CrossRef]
- Larcher, W. Temperature stress and survival ability of Mediterranean sclerophyllous plants. Plant Biosyst. 2000, 134, 279–295. [Google Scholar] [CrossRef]
- Bartolozzi, F.; Cerquaglia, L.; Coppari, G.; Fontanazza, G. Frost tolerance induced by cold acclimation in olive (Olea europaea L.). In Proceedings of the ISHS Acta Horticulturae 586_98: IV International Symposium on Olive Growing, Valenzano, Italy, 25–30 September 2000. [Google Scholar] [CrossRef]
- Petruccelli, R.; Bartolini, G.; Ganino, T.; Zelasco, S.; Lombardo, L.; Perri, E.; Durante, M.; Bernardi, R. Cold Stress, Freezing Adaptation, Varietal Susceptibility of Olea europaea L.: A Review. Plants 2022, 11, 1367. [Google Scholar] [CrossRef] [PubMed]
- Morettini, A. Olivicoltura; Ramo Editoriale degli Agricoltori: Roma, Italy, 1972. [Google Scholar]
- Griggs, W.H.; Hartmann, H.T.; Bradley, M.V.; Iwakini, B.T.; Whisler, J. Olive Pollination in California; UC California Agricultural Experiment Station: Berkeley, CA, USA, 1975. [Google Scholar]
- Tanasijevic, L.; Todorovic, M.; Pereira, L.S.; Pizzigalli, C.; Lionello, P. Impacts of Climate Change on Olive Crop Evapotranspirationand Irrigation Requirements in the Mediterranean Region. Agric. Water Manag. 2014, 144, 54–68. [Google Scholar] [CrossRef]
- Greven, M.; Neal, S.; Green, S.; Dichio, B.; Clothier, B. The effects of drought on the water use, fruit development and oil yield from young olive trees. Agric. Water Manag. 2009, 96, 1525–1531. [Google Scholar] [CrossRef]
- Fernandes-Silva, A.A.; Ferreira, T.C.; Correia, C.M.; Malheiro, A.; Villalobos, F.J. Influence of different irrigation regimes on crop yield and water use efficiency of olive. Plant Soil. 2010, 333, 35–47. [Google Scholar] [CrossRef]
- Ponti, L.; Gutierrez, A.P.; Basso, B.; Neteler, M.; Ruti, P.M.; Dell’Aquila, A.; Iannetta, M. Olive agroecosystems in the Mediterranean Basin: Multitrophic analysis of climate effects with process-based representation of soil water balance. Procedia Environ. Sci. 2013, 19, 122–131. [Google Scholar] [CrossRef]
- Hueso, A.; Tentacoste, E.R.; Ruiz, C.; De la Rosa, J.M.; Gómez-del-Campo, M. Effect of deficit irrigation during the oil synthesis period on carbohydrate content in olive “Arbequina” hedgerows. Acta Hortic. 2018, 1199, 75–79. [Google Scholar]
- García, J.M.; Hueso, A.; Gómez-del-Campo, M. Deficit irrigation during the oil synthesis period affects olive oil quality in high-density orchards (cv. Arbequina). Agric. Water Manag. 2020, 230, 105858. [Google Scholar] [CrossRef]
- Van der Schoot, C.; Rinne, P.L. Dormancy cycling at the shoot apical meristem: Transitioning between self-organization and self-arrest. Plant Sci. 2011, 180, 120–131. [Google Scholar] [CrossRef]
- Lopez-Bernal, A.; Garcia-Tejera, O.; Testi, L.; Orgaz, F.; Villalobos, F.J. Studying and modelling winter dormancy in olive trees. Agric. For. Meteorol. 2020, 280, 107776. [Google Scholar] [CrossRef]
- Paniagua, L.L.; García-Martín, A.; Aguirado, C.; Honorio, F.; Moral, F.J.; Rebollo, F.J. Temperature trends of the olive tree cultivation period in the producing areas of Spain (1981–2019). Acta Hortic. 2023, 1372, 209–214. [Google Scholar] [CrossRef]
- Ballesteros, R.; Ortega, J.F.; Hernandez, D.; del Campo, A.; Moreno, M.A. Combined Use of Agro-Climatic and Very High-Resolution Remote Sensing Information for Crop Monitoring. Int. J. Appl. Earth Obs. Geoinf. 2018, 72, 66–75. [Google Scholar] [CrossRef]
- Pérez-López, D.; Ribas, F.; Moriana, A.; Rapoport, H.F.; De Juan, A. Influence of Temperature on the Growth and Development of Olive (Olea europaea L.) Trees. J. Hortic. Sci. Biotechnol. 2008, 83, 171–176. [Google Scholar] [CrossRef]
- Qian, B.; Zhang, X.; Chen, K.; Feng, Y.; O’Brien, T. Observed Long-Term Trends for Agroclimatic Conditions in Canada. J. Appl. Meteorol. Climatol. 2010, 49, 604–618. [Google Scholar] [CrossRef]
- Kenealy, L.; Reighard, G.; Rauh, B.; Bridges, W., Jr. Predicting Peach Maturity Dates in South Carolina with a Growing Degree Day Model. Acta Hortic. 2015, 1084, 479–752. [Google Scholar] [CrossRef]
- Asseng, S.; Ewert, F.; Martre, P.; Rötter, R.P.; Lobell, D.B.; Cammarano, D.; Kimball, B.A.; Ottman, M.J.; Wall, G.W.; White, J.W.; et al. Rising Temperatures Reduce Global Wheat Production. Nat. Clim. Change 2015, 5, 143–147. [Google Scholar] [CrossRef]
- Zhang, S.; Tao, F.; Zhang, Z. Changes in Extreme Temperatures and Their Impacts on Rice Yields in Southern China from 1981 to 2009. Field Crops Res. 2016, 189, 43–50. [Google Scholar] [CrossRef]
- Liu, Y.; Su, L.; Wang, Q.; Zhang, J.; Shan, Y.; Deng, M. Chapter Six—Comprehensive and Quantitative Analysis of Growth Characteristics of Winter Wheat in China Based on Growing Degree Days. Adv. Agric. 2020, 159, 237–273. [Google Scholar] [CrossRef]
- Anandhi, A. Growing Degree Days—Ecosystem Indicator for Changing Diurnal Temperatures and Their Impact on Corn Growth Stages in Kansas. Ecol. Indic. 2016, 61 Pt 2, 149–158. [Google Scholar] [CrossRef]
- Bonofiglio, T.; Orlandi, F.; Sgromo, C.; Romano, B.; Fornaciari, M. Influence of temperature and rainfall on timing of olive (Olea europaea) flowering in southern Italy. N. Z. J. Crop Hort. Sci. 2008, 36, 59–69. [Google Scholar] [CrossRef]
- Lombardo, L.; Fila, G.; Lombardo, N.; Epifani, C.; Duffy, D.H., III; Godino, G.; Salimonti, A.; Zelasco, S. Uncovering Olive Biodiversity through Analysis of Floral and Fruiting Biology and Assessment of Genetic Diversity of 120 Italian Cultivars with Minor or Marginal Diffusion. Biology 2019, 8, 62. [Google Scholar] [CrossRef]
- Orlandi, F.; Lanari, D.; Romano, B.; Fornaciari, M. New model to predict the timing of olive (Olea europaea) flowering: A case study in central Italy. N. Z. J. Crop Hortic. Sci. 2006, 34, 93–99. [Google Scholar] [CrossRef]
- Orlandi, F.; Avolio, E.; Bonofiglio, T.; Federico, S.; Romano, B.; Fornaciari, M. Potential shifts in olive flowering according to climate variations in Southern Italy. Meteorol. Appl. 2013, 20, 497–503. [Google Scholar] [CrossRef]
- Orlandi, F.; Vazquez, L.; Ruga, L.; Bonofiglio, T.; Fornaciari, M.; Garcia Mozo, H.; Dominquez, E.; Romano, B.; Galán, C. Bioclimatic requirements for olive flowering in two Mediterranean regions located at the same latitude (Andalucia, Spain and Sicily, Italy). Ann. Agric. Environ. Med. 2005, 12, 47–52. [Google Scholar] [PubMed]
- De Melo-Abreu, J.P.; Barranco, D.; Cordeiro, A.M.; Tous, J.; Rogado, B.M.; Villalobos, F.J. Modelling olive flowering date using chilling for dormancy release and thermal time. Agric. For. Meteorol. 2004, 125, 117–127. [Google Scholar] [CrossRef]
- Alcalá, A.R.; Barranco, D. Prediction of flowering time in olive for the Cordoba olive collection. Am. Soc. Hort Sci. 1992, 27, 1205–1207. [Google Scholar] [CrossRef]
- Hackett, W.P.; Hartmann, H.T. Inflorescence formation in olive as influenced by low temperature, photoperiod, and leaf area. Bot. Gaz. 1964, 125, 65–72. [Google Scholar]
- Aguilera, F.; Ruiz, L.; Fornaciari, M.; Romano, B.; Galán, C.; Oteros, J.; Dhiab, A.; Msallen, M.; Orlandi, F. Heat accumulation period in the Mediterranean region: Phenological response of the olive in different climate areas (Spain. Italy and Tunisia). Int. J. Biomet. 2014, 58, 867–876. [Google Scholar] [CrossRef] [PubMed]
- Hidalgo Fernandez-Cano, L.; Hidalgo Togores, J. Tratado de Viticultura, 5th ed.; Mundiprensa: Madrid, Spain, 2019; pp. 135–176. [Google Scholar]
- Jolliffe, I.T.; Cadima, J. Principal component analysis: A review and recent developments. Math. Phys. Eng. Sci. 2016, 374, 2065. [Google Scholar] [CrossRef]
- Ringnér, M. What is principal component analysis? Nat. Biotechnol. 2008, 26, 303–304. [Google Scholar] [CrossRef] [PubMed]
- Zou, H.; Hastie, T.; Tibshirani, R. Sparse principal component analysis. J. Comp. Graph. Statis. 2006, 15, 265–286. [Google Scholar] [CrossRef]
- Sistema Nacional de Cartografía de Zonas Inundables, SNCZI. Available online: https://www.miteco.gob.es/es/agua/temas/gestion-de-los-riesgos-de-inundacion/snczi.html (accessed on 29 May 2024).
- Boletín Hidrológico Nacional. Ministerio Transición Ecológica y el Reto Demográfico, MITECO. Evaluación de Los Recursos Hídricos. Available online: https://www.miteco.gob.es/es/agua/temas/evaluacion-de-los-recursos-hidricos/boletin-hidrologico.html (accessed on 29 May 2024).
- Ministerio de Agricultura Pesca y Alimentación. Anuario de Estadística. Available online: https://www.mapa.gob.es/es/estadistica/temas/publicaciones/anuario-de-estadistica/2023/default.aspx?parte=3&capitulo=07 (accessed on 29 May 2024).
- Ministerio Para la Transición Ecológica y el Reto Demográfico, MITECO. Caracterización de las Comarcas Agrarias de España. Available online: https://www.miteco.gob.es/en/ministerio/servicios/publicaciones/comarcas_agrarias-tomos.html (accessed on 17 June 2024).
- AEMET. Agencia Estatal de Meteorología (AEMET). Available online: https://www.aemet.es/es/portada (accessed on 16 February 2024).
- WMO. World Meteorological Organization Annual Report of the World Meteorological Organization 1966; WMO: Geneva, Switzerland, 1967. [Google Scholar]
- KNMI Royal Netherlands Meteorological Institute. ECAD European Climate Assessment & Dataset; Algorithm Theoretical Basis Document; Royal Netherlands Meteorological Institute KNMI: Utrecht, The Netherlands, 2013. [Google Scholar]
- Guijarro, J. Homogenization of Climatic Series with Climatol; CLIMATOL. AEMET: Balearic Islands, Spain, 2018; Available online: https://climatol.eu/ (accessed on 8 April 2024).
- Sistema de Información Sobre Ocupación del Suelo de España, SIOSE. 2014. Available online: http://www.siose.es/web/guest/descargar (accessed on 16 October 2024).
- Moral, F.J.; Rebollo, F.J.; Paniagua, L.L.; García Martín, A.; Honorio, F. Spatial distribution and comparison of aridity indices in Extremadura, Southwestern Spain. Theor. Appl. Climatol. 2016, 126, 801–814. [Google Scholar] [CrossRef]
- Lodolini, E.M.; Alfei, B.; Cioccolanti, T.; Zucchini, M.; Neri, D. Comparison of Frost Damages in Eleven Olive Cultivars after Two Freezing Events in Central Italy. Acta Hortic. 2022, 1346, 161–168. [Google Scholar] [CrossRef]
- Hargreaves, G.H.; Samani, Z.A. Reference crop evapotranspiration from temperature. Appl. Eng. Agric. 1985, 1, 96–99. [Google Scholar] [CrossRef]
- United States Department of Agriculture (USDA). National Engineering Handbook; Irrigation Guide; United States Department of Agriculture (USDA): Washington, DC, USA, 1997. Available online: https://www.nrcs.usda.gov/sites/default/files/2022-11/WA-Irrigation-Guide_4.pdf (accessed on 14 October 2024).
- Pérez-Rodríguez, J.M.; Parras, J.; Lara, E.; Prieto, M.H. Manual Práctico de Riego Olivar de Almazara; Centro de Investigaciones Científicas y Tecnológicas de Extremadura, CICYTEX (Junta de Extremadura): Badajoz, Spain, 2014; Available online: https://cicytex.juntaex.es/manuales (accessed on 27 June 2024).
- McMaster, G.S.; Wilhelm, W.W. Growing degree-days: One equation, two interpretations. Agric. For. Meteorol. 1997, 87, 291–300. [Google Scholar] [CrossRef]
- Bretherton, C.S.; Smith, C.; Wallace, J.M. An intercomparison of methods for finding coupled patterns in climate data. J. Clim. 1992, 5, 541–560. [Google Scholar] [CrossRef]
- Moral, F.J.; Rebollo, F.J.; Paniagua, L.L.; García, A.; Martínez de Salazar, E. Application of climatic indices to analyse viticultural suitability in Extremadura, South-western Spain. Theor. Appl. Climatol. 2016, 123, 277–289. [Google Scholar] [CrossRef]
- World Meteorological Organization (WMO). Guide to Hydrological Practices. Volume II—Management of Water Resources and Application of Hydrological Practices, 6th ed.; WMO-No. 168; World Meteorological Organization: Geneva, Switzerland, 2009. [Google Scholar]
- Sen, P.K. Estimates of the Regression Coefficient Based on Kendall’s Tau. J. Am. Stat. Assoc. 1968, 63, 1379–1389. [Google Scholar] [CrossRef]
- García-Martín, A.; Paniagua, L.L.; Moral, F.J.; Rebollo, F.J.; Rozas, M.A. Spatiotemporal Analysis of the Frost Regime in the Iberian Peninsula in the Context of Climate Change (1975–2018). Sustainability 2021, 13, 8491. [Google Scholar] [CrossRef]
- Ayton, J.; Mailer, R.J.; Robards, K.; Orchard, B.; Vonarx, M. Oil concentration and composition of olives during fruit maturation in south-western New South Wales. Aust. J. Exp. Agric. 2001, 41, 815–821. [Google Scholar] [CrossRef]
- Rodrigo-Comino, J.; Senciales-González, J.M.; Yu, Y.; Salvati, L.; Giménez-Morera, A.; Cerdà, A. Long-term changes in rainfed olive production, rainfall and farmer’s income in Bailén (Jaén, Spain). Euro-Mediterr. J. Environ. Integr. 2021, 6, 58. [Google Scholar] [CrossRef]
- Orlandi, F.; Bonofiglio, T.; Romano, B.; Fornaciari, M. Qualitative and quantitative aspects of olive production in relation to climate in southern Italy. Sci. Hortic. 2012, 138, 151–158. [Google Scholar] [CrossRef]
- Mousa, M.Y.; Gerasopoulos, D.; Metzidakis, I.; Kiritsakis, A. Effect of Altitude on Fruit and Oil Quality Characteristics of ‘Mastoides’ Olives. J. Sci. Food Agric. 1996, 71, 345–350. [Google Scholar] [CrossRef]
- Rongai, D.; Sabatini, N.; Del Coco, L.; Perri, E.; Del Re, P.; Simone, N.; Marchegiani, D.; Fanizzi, F.P. 1H NMR and Multivariate Analysis for Geographic Characterization of Commercial Extra Virgin Olive Oil: A Possible Correlation with Climate Data. Foods 2017, 6, 96. [Google Scholar] [CrossRef]
- Piñar-Fuentes, J.C.; Peña-Martínez, J.; Cano-Ortiz, A. Integrating Thermo-Ombroclimatic Indicators into Sustainable Olive Management: A Pathway for Innovation and Education. Agriculture 2024, 14, 2112. [Google Scholar] [CrossRef]
- Aguilera, F.; Orlandi, F.; Ruiz-Valenzuela, L.; Msallem, M.; Fornaciari, M. Analysis and interpretation of long temporal trends in cumulative temperatures and olive reproductive features using a seasonal trend decomposition procedure. Agric. For. Meteorol. 2015, 203, 208–216. [Google Scholar] [CrossRef]
- Orlandi, F.; Rojo, J.; Picornell, A.; Oteros, J.; Pérez-Badia, R.; Fornaciari, M. Impact of Climate Change on Olive Crop Production in Italy. Atmosphere 2020, 11, 595. [Google Scholar] [CrossRef]
- Fornaciari, M.; Orlandi, F.; Tedeschini, E. Long term analysis on Olive flowering and climatic relationships in central Italy. Eur. J. Agron. 2025, 162, 127435. [Google Scholar] [CrossRef]
Disclaimer/Publisher’s Note: The statements, opinions and data contained in all publications are solely those of the individual author(s) and contributor(s) and not of MDPI and/or the editor(s). MDPI and/or the editor(s) disclaim responsibility for any injury to people or property resulting from any ideas, methods, instructions or products referred to in the content. |
© 2025 by the authors. Licensee MDPI, Basel, Switzerland. This article is an open access article distributed under the terms and conditions of the Creative Commons Attribution (CC BY) license (https://creativecommons.org/licenses/by/4.0/).