Article

Response of Ecosystem Services to Human Activities in Gonghe Basin of the Qinghai–Tibetan Plateau

1
Key Laboratory of Tibetan Plateau Land Surface Processes and Ecological Conservation (Ministry of Education), Qinghai Normal University, Xining 810008, China
2
Qinghai Provincial Key Laboratory of Physical Geography and Environmental Process, School of Geographical Sciences, Qinghai Normal University, Xining 810008, China
3
Academy of Plateau Science and Sustainability, Qinghai Normal University & Beijing Normal University, Xining 810016, China
4
School of Tourism and Hospitality Management, University of Sanya, Sanya 572000, China
5
Qinghai Provincial Institute of Economic Research, Xining 810008, China
6
State Key Laboratory of Remote Sensing Science, Beijing Normal University, Beijing 100875, China
*
Author to whom correspondence should be addressed.
Land 2025, 14(7), 1350; https://doi.org/10.3390/land14071350
Submission received: 9 May 2025 / Revised: 16 June 2025 / Accepted: 20 June 2025 / Published: 25 June 2025

Abstract

Gonghe Basin is an important frontier of resource and energy development and environmental protection on the Qinghai–Tibetan Plateau and upper sections of the Yellow River. As a characteristic ecotone, this area exhibits complex and diverse ecosystem types while demonstrating marked ecological vulnerability. The response of ecosystem services (ESs) to human activities (HAs) is directly related to the sustainable construction of an ecological civilization highland and the decision-making and implementation of high-quality development. However, this response relationship is unclear in the Gonghe Basin. Based on remote sensing data, land use, meteorological, soil, and digital elevation model data, the current research determined the human activity intensity (HAI) in the Gonghe Basin by reclassifying HAs and modifying the intensity coefficient. Employing the InVEST model and bivariate spatial autocorrelation methods, the spatiotemporal evolution characteristics of HAI and ESs and responses of ESs to HAs in Gonghe Basin from 2000 to 2020 were quantitatively analyzed. The results demonstrate that: From 2000 to 2020, the HAI in the Gonghe Basin mainly reflected low-intensity HA, although the spatial range of HAI continued to expand. Single plantation and town construction activities exhibited high-intensity areas that spread along the northwest-southeast axis; composite activities such as tourism services and energy development showed medium-intensity areas of local growth, while the environmental supervision activity maintained a low-intensity wide-area distribution pattern. Over the past two decades, the four key ESs of water yield, soil conservation, carbon sequestration, and habitat quality exhibited distinct yet interconnected characteristics. From 2000 to 2020, HAs were significantly negatively correlated with ESs in Gonghe Basin. The spatial aggregation of HAs and ESs was mainly low-high and high-low, while the aggregation of HAs and individual services differed. These findings offer valuable insights for balancing and coordinating socio-economic development with resource exploitation in Gonghe Basin.

Graphical Abstract

1. Introduction

Natural ecosystems generate a spectrum of ecosystem services (ESs), which include both tangible and intangible contributions to human well-being and societal functioning [1,2]. In turn, human society drives changes in ESs through its influence on ecosystems [3,4,5]. Studies have further shown that, as the global socio-economy and demographics expand rapidly, the disparity between human demands and the availability of ESs continues to grow [4]. Concurrently, human activities (HAs) exert significant influence on the capacity of ESs [5,6], in areas such as urban fringe, natural habitat fragmentation weakens the function of soil and water conservation [6,7]; nature reserves and national parks face ecological degradation caused by tourism pressure [8,9,10,11]; typical ecological functional zones are under the dual stress of climate change and HAs [12,13]; the intensive development of urban agglomerations [14] affects climate regulation services, leading to soil degradation and loss of biodiversity. The results establish a basis for crafting regional policies that promote both social and ecological sustainability [15,16,17].
In recent years, research on the interaction between human activities intensity (HAI) and ESs has shown a trend of multi-model fusion and multi-scale analysis in methodology [10]. In the aspect of quantifying HAI, nighttime light data, population density and land use change become the core indicators, and a comprehensive evaluation system is constructed by combining the entropy weight method and human footprint index [12]. In terms of ESs, the InVEST model is used to quantify water yield (WY), carbon sequestration (CS) [5,10], and other regulatory services, the SolVES model [18] is used to evaluate cultural services, and multi-scale geographically weighted regression is used to analyze the spatial and temporal evolution of ESs. These methods not only realize the multi-dimensional evaluation of ESs but also reveal their nonlinear response relationship with HAs.
The Qinghai–Tibet Plateau (QTP) serves as a critical ecological security barrier for East and South Asia. The stable functioning of its ESs is also of concern to scientists and social managers. For example, He et al. [19] and Hopping et al. [20] discussed the effects of climate and land use change on ecosystem regulation services in the QTP during 1990–2020; Wang et al. [21] and Li et al. [22] examined the spatiotemporal features related with the supply and demand for ESs such as WY, CS, and soil conservation (SC) on the QTP. These studies have shown that the ESs of the QTP are significantly affected by climate and land use changes, and present complex temporal and spatial characteristics. In this regard, the Chinese government has introduced multiple protection and restoration measures to improve the QTP ecosystem’s resilience and integrity, securing the enduring sustainability of its ecological functions, such as the Three-North Shelterbelt Forest Program, the Grazing Withdrawal and Grassland Restoration Program, and the Desertification Control Program [15,23]. In terms of the relationship between HAs and ESs on the QTP, Yang et al. [24] quantitatively assessed HAI and its spatio-temporal variability; and Fan [25] investigated the temporal and spatial variations in terrestrial cover and multiple ecosystem service indicators, along with their interrelationships—encompassing both trade-offs and synergies—in the ecologically vulnerable region of the upper Yellow River basin. However, it is unclear how ESs in this particular region will respond to the increasing exploitation of HAs, especially in local areas where HA are inherently intensive and resource and energy development and ecological conservation are combined. This may increase the difficulty of generating scientific and reasonable regional development plans, thus indicating the insecurity in the future collaborative optimization development of social economy and resource ecology.
This study selected Gonghe Basin as the study area and used remote sensing image data, land use data, meteorological data, soil data, DEM data, and socio-economic data from 2000, 2005, 2010, 2015, and 2020. First, changes in HAI from 2000 to 2020 were analyzed by revising the intensity coefficient of HA. Second, based on the InVEST model, WY, SC, CS, and habitat quality (HQ) were used as key indicators to assess ESs dynamics across the study region. Ultimately, this study aims to utilize a bivariate spatial autocorrelation model to analyze the responsiveness of ESs to HAs, in order to uncover the interconnectedness between HAs and ESs. The outcomes establish a scientific basis for guiding sustainable regional growth and ecological civilization initiatives.

2. Materials and Methods

2.1. Study Area

Gonghe Basin, located at the northeastern margin of the QTP, belongs to the transition zone of Kunlun Block and Qilian Block in terms of geostructure. It is a fault depression basin formed since the Mesozoic era and traversed by the Yellow River. It is administrated by Hainan Tibetan Autonomous Prefecture, Qinghai Province, China, the study area encompasses the counties of Gonghe, Guide, Xinghai, Guinan, and Tongde (Figure 1). The basin topography exhibits a northwest-to-southeast slope with inclinations ranging from 3° to 10°. The elevation of the region varies between 2124 and 5265 m. The region, with an average annual temperature of 5.7 °C and precipitation of 308.9 mm, falls within the arid to semi-arid climatic zone of the plateau. It is also the intersection of the three natural areas of the alpine region of the QTP, the arid region of the northwest and the eastern monsoon region, forming a unique ecological ecotone. The predominant soil types observed in the basin are chestnut calcareous, brown calcareous, and wind-blown sandy soils. The basin is distinguished by the presence of inland water systems, including the Shazhuyu, Dalianhai, and Gengga seas, as well as outflow water systems, such as the Yellow River and its tributaries. The application of various combinations of water, fertilizer, and heat has resulted in the emergence of diverse surface types, including mountains, rivers, forests, cultivated lands, lakes, grasslands, and sand. This makes it a typical area with relatively complex ecosystem types on the QTP, such as alpine meadow, alpine desert, desert steppe and valley shrub. Moreover, because of its special geological structure environment and rich and diverse ecological environment, Gonghe Basin is also one of the typical areas in the QTP and upper reaches of the Yellow River in which the ecosystem activities and HAs interact closely. This zone represents the focal point for agricultural and pastoral development, mineral resources and energy, and tourism services on the QTP are concentrated here. With continuous development, it has formed a modern compound industrial system with ecological animal husbandry as the basic industry, clean energy as the core pillar, and characteristic cultural tourism as the highlight. Therefore, exploring the response rules of its ESs to HAs has important reference value for ensuring the continuous promotion of the construction of ecological civilization and the formulation and implementation of high-quality development strategy decisions.

2.2. Data Sources and Preprocessing

The data used in this study mainly include remote sensing data, land use data, meteorological data, soil data, topographic and geomorphologic data, administrative boundary data, and socio-economic data. The detailed sources of data can be found in Table 1.
This study mainly relied on Landsat TM images as its primary remote sensing data source, acquired for the target region during five selected years (2000–2020 at 5-year intervals) [12], and the time phase was May to September when vegetation growth is relatively dense. After radiometric calibration, atmospheric correction, geometric correction and mosaic cloud removal, these data were used to modify the land use data.
Land use datasets employed in this study primarily consisted of remotely sensed classification products spanning the target region for five timepoints (2000–2020 at 5-year intervals) [19], and these data were employed to investigate the spatiotemporal dynamics of HAI. Combined with the actual and research purposes of the Gonghe Basin, the land cover was reclassified, including cultivated land, forest land, grassland, water bodies, construction land, and unused land. In this process, the classification results of the original data are also manually corrected based on remote sensing data.
Meteorological data with a spatial resolution of 1 km were obtained from the National Earth System Science Data Center, including precipitation and potential evapotranspiration in 2000, 2005, 2010, 2015 and 2020. The data are used to measure various ESs.
Soil data were acquired from the World Soil Database, mainly the soil data sets of 2000, 2005, 2010, 2015 and 2020. The soil erodibility factors are obtained by attribute assignment, including gravel, sand and clay, used to measure SC services.
DEM with a 30 m resolution, obtained from the Geospatial Data Cloud, were used to generate topographic and geomorphic data, and they were processed with mosaic, cropping, and depression filling to calculate various ESs.
Administrative boundaries were obtained from national fundamental geographic databases. To avoid the impact of administrative division adjustment, the 2020 version of the national basic geographic information database administrative division map is uniformly adopted. It is mainly used to determine the boundaries and internal administrative divisions of the study area.
The main socio-economic datasets came from the official statistical yearbooks and bulletins published by Hainan Tibetan Autonomous Prefecture and its counties, including the gross regional product, mineral resources and energy output value, and tourism income value from 2000 to 2020.
Last, to meet the research needs, the response relationship between HAs and ESs was processed into a 1 km×1 km grid for analysis [26]. Albers equal-area conic projection was used for the above spatial data.

2.3. Methodology

2.3.1. Human Activity Intensity Index

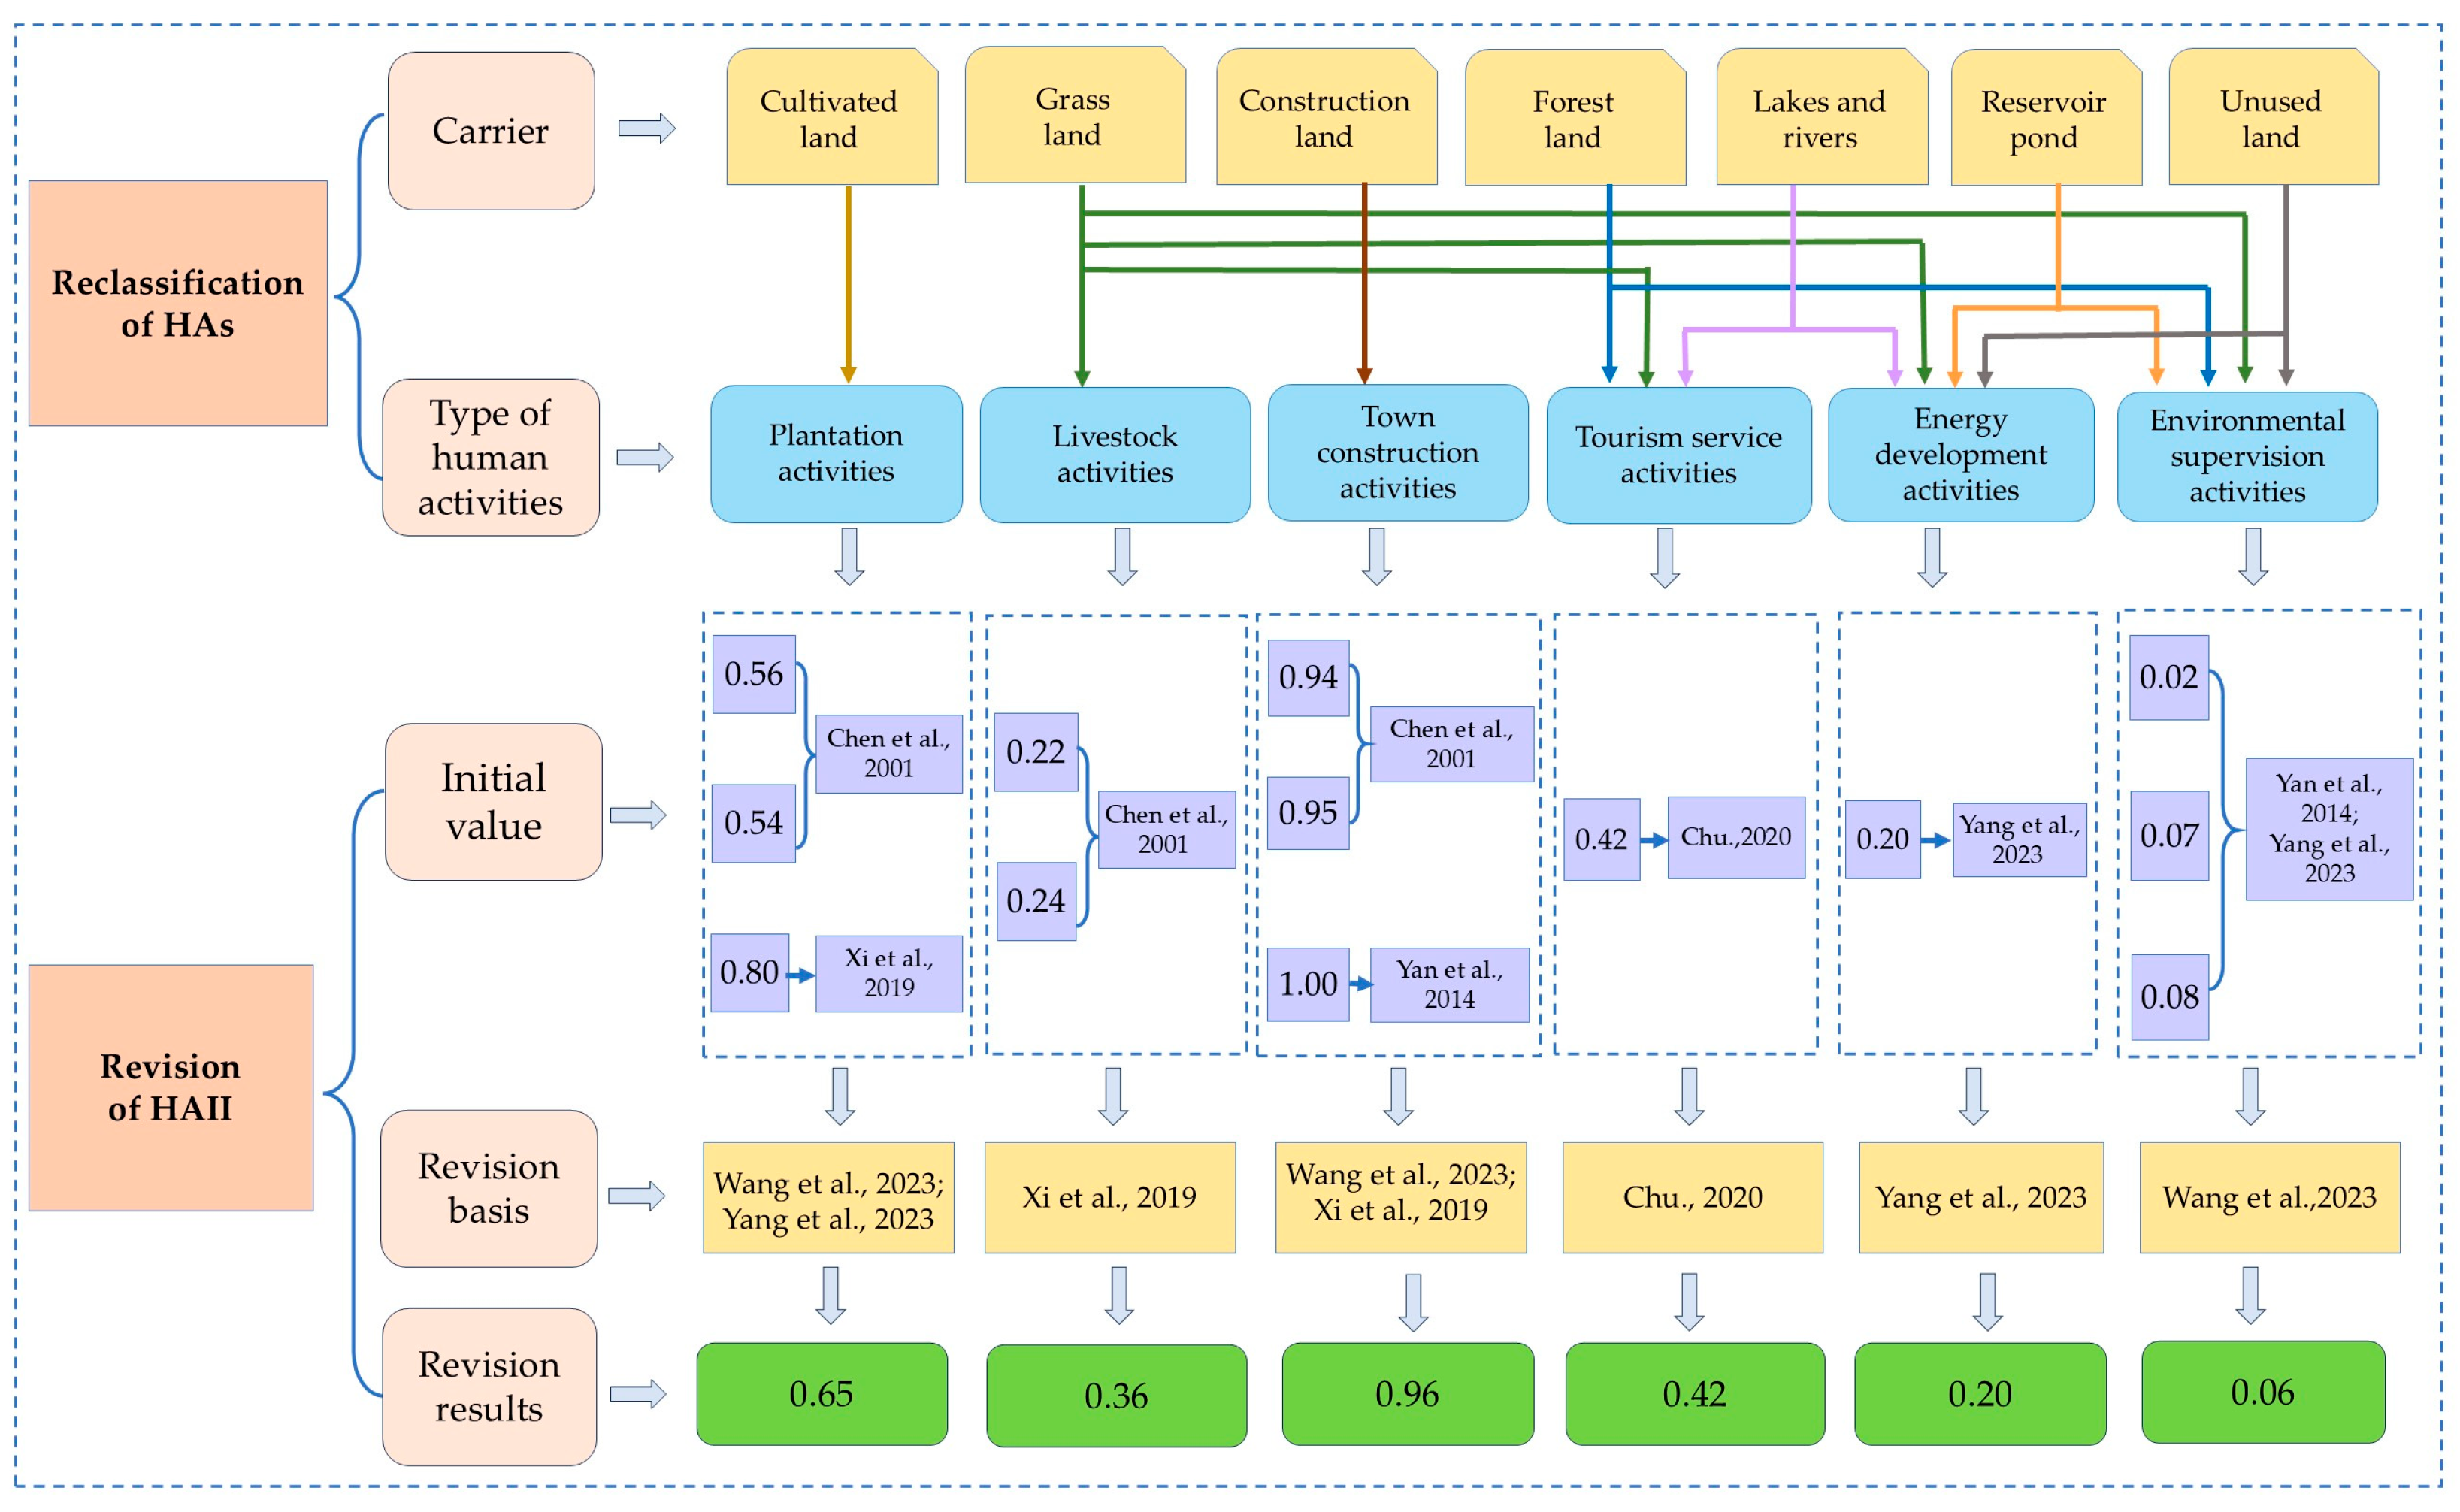
The human activity intensity index (HAII) proposed by Xu et al. [27] is comprehensive in nature and has been previously used to measure human activity intensity (HAI) [28]; thus, it was also used here. It is worth mentioning that due to the uniqueness of the resources, ecology, and human society in Gonghe Basin, the existing classification of HAI types and intensity coefficients [21,29] may not be reasonable for direct use. Therefore, based on preliminary investigations and referencing existing research [30,31], this study first classified HAs in the research area using land cover classifications as carriers. Includes plantation activities with cultivated land as the carrier; livestock activities with grassland as the carrier; town construction activities with construction land as the carrier; tourism service activities carried out on grassland, forest land, and lakes/rivers; energy development activities on grassland, reservoirs ponds, and unused land; and environmental supervision activities on grassland, forest land, lakes/rivers, reservoirs ponds, and unused land.
For the coefficients of HAII, based on the results of previous studies [6,26,27,32], combined with the characteristics of HAs in the Gonghe Basin and the existing studies of QTP [10,12,23,30], they were partially corrected. Specifically, as shown in Figure 2.
From Figure 2, the intensity coefficient for crop plantation activities was revised to 0.65 based on the average intensity in the high-altitude agricultural regions of the northeastern QTP [10,24] and the agricultural production capacity of the study area; the intensity coefficient for town construction activities was revised to 0.96, considering its auxiliary role in energy and resource development as well as tourism services [10,12]. For livestock activities, the intensity coefficient was revised to 0.36, which considers grassland carrying capacity and livestock density, and references the human footprint index in the Qinghai Lake Basin by Xi et al. [12]. The intensity coefficient for tourism service activities was revised to 0.42 by considering the tourist density, infrastructure disturbance, and ecological compensation measures and referencing the tourism economy and ecological environment coordination index for prefecture-level cities on the QTP by Chu [31]. For energy development activities, the intensity coefficient was revised to 0.20 based on the equivalent coefficients for translating construction land in various land use types on the QTP by Yang et al. [24], combined with an analysis of the current status of energy development activities in the Gonghe Basin. The intensity coefficient for environmental supervision activities was maintained at 0.06 [10], as the density of ecological ranger patrol paths in the study area is similar to that in the Qilian Mountain National Park.
For regional HAI(HAIR), the calculation adopted existing literature [10] using Equation (1). The final results were classified into five levels to evaluate the spatial patterns and changes in HAI throughout the study zone. Specifically, the levels were defined as follows: lower intensity (HAIR ≤ 0.2), low intensity (0.2 < HAIR ≤ 0.4), medium intensity (0.4 < HAIR ≤ 0.6), high intensity (0.6 < HAIR≤ 0.8), and higher intensity (0.8 < HAIR ≤ 1.0).
H A I R = i = 1 n A i P i T A
where n represents the number (class) of H A I R types; A i indicates the area corresponding to H A I R type i ; and T A is the total land area of the region.

2.3.2. Assess Ecosystem Services

At present, the methods for quantitative evaluation of ESs mainly include InVEST model [33], ARIES model [34], SolVES model [18], marginal cost model [35], passive model, governance model [36], Enviro Atlas model [37], EPM model [38]. Among them, the InVEST model is widely used because it can meet the evaluation of ecosystem services with different functions [33], has strong spatial and dynamic characteristics, and has obtained satisfactory results [39,40]. Here, this model was also selected, and four indicators of WY, SC, CS, and HQ were selected to estimate ESs, considering data availability and main ecological functions of the Gonghe Basin [41].
(1)
Water yield service (WY)
WY is the process of interception, absorption, storage, purification, regulation, distribution, and redistribution of precipitation through the ecosystem’s composition, processes, and interactions. It is a vital function in the ecosystem’s preservation and regulation of water resources. The InVest model employs the Water Yield module as a proxy for assessing water retention capacity [42,43], with higher WY scores indicating greater ecosystem service efficiency in water regulation. The details are as follows:
Y x i = 1 A E T x i P x × P x
where Y x i represents the annual WY (mm) for grid cell x under land use category   i ; A E T x i represents the yearly real evapotranspiration (mm) of land cover class i on grid x   (mm); P x indicates the yearly rainfall (mm) on the grid x ; and A E T x i P x is the fraction of precipitation that is lost as actual evapotranspiration. According to the improved method of Zhang et al. [44] based on the Budyko curve which was used to quantify the nonlinear relationship between precipitation, evapotranspiration, and potential evapotranspiration, the computational equation can be expressed as:
A E T x i P x = 1 + ω x + R x i 1 + ω x R x i + 1 / R x i
ω x = Z × P A W C x P x
R x i = K a b × E T 0 P x
where R x i represents the Budyko aridity index for land cover class i , in grid cell x, defined as the quotient of potential evapotranspiration over precipitation; ω x denotes the correction factor for the ratio between vegetation-accessible annual precipitation and climatologically expected precipitation; Z is the Zhang’s water balance coefficient [44], which characterizes the seasonal factors of precipitation; K a b denotes the plant evapotranspiration coefficient, which is the ratio of crop evapotranspiration to potential evapotranspiration; E T 0 denotes the reference evapotranspiration; and P A W C x is the available water of plants. Among them, the Budyko curve is a theoretical framework for describing the long-term water and heat balance relationship. It simplifies the complex hydrological process into the relationship between precipitation P x , potential evapotranspiration P E T x i and actual evapotranspiration A E T x i . It is proposed that A E T x i P x   mainly depends on P E T x i P x , which simplifies the prediction of long-term hydrological processes and can be used as a benchmark to test the rationality of hydrological models.
In the current study, the InVEST Water Yield module was implemented with the following primary inputs for the Gonghe Basin study area: rainfall patterns, actual ET values, effective root zone depth, available water capacity, land cover classification, the watershed boundary of the Gonghe Basin, biophysical parameters, and the seasonal constant Z value. The Z value, an empirical constant, was obtained through iterative calibration based on previous studies [42,43]. The biophysical parameters for the Gonghe Basin are presented in Table 2.
(2)
Soil conservation service (SC)
The SC service encompasses erosion prevention, maintains soil fertility, and maintains ecosystem health and productivity. The InVEST framework’s SDR module is computed based on USLE principles. The higher the SC, the stronger the soil retention serviceability [45,46]. The details are as follows:
S E D R E T x = R K L S x U S L E x
R K L S x = R x × K x × L S x
U S L E x = R x × K x × L x × S x × C x × P x
where S E D R E T x represents the soil retention (t) for the grid x; the potential soil erosion (t) is represented by R K L S x , while the actual soil erosion (t) is denoted by U S L E x ; R x denotes the rainfall erosivity; K x represents soil erodibility; L x pertains to the factors of slope length; S x is the slope gradient; C x corresponds to the vegetation management factor reflecting canopy interception capacity; P x conservation practice factor. In the present study, the SC module of the InVEST model was implemented incorporating precipitation data, soil data, land cover data, and DEM data to calculate the soil loss for each grid in the study area. Here, R x quantifies the rainfall-driven erosive potential, and K x indicates the difficulty of soil particles being hydraulically separated and transported at ease with which soil particles. Edaphic properties, including texture, organic matter concentration, structural integrity, hydraulic conductivity, and other physicochemical attributes, govern this erodibility factor. For specific calculation processes, refer to relevant literature [45]. The L x ,   S x were derived from DEM data. The C x ,   P x were obtained based on previous studies [46,47]. For various land use types, the C (cover management) and P (support practice) values are provided in Table 3.
(3)
Carbon sequestration service (CS)
The CS service is crucial to the regulation of atmospheric carbon and oxygen balance. In the InVest model, the Carbon module is used as a proxy indicator to quantify the assessment. Carbon sequestration efficiency correlates positively with ecosystem carbon stocks [48]. Details are provided below:
C = C a b o v e + C b e l o w + C s o i l + C d e a d
where C denotes the overall carbon stock present in an ecosystem (t); C a b o v e refers to the carbon stock found above the ground (t) and mainly includes carbon in all surviving vegetation above the soil; C b e l o w below represents subterranean biogenic carbon storage (t), specifically quantifying root-system CS; C s o i l signifies soil organic carbon reservoirs (t), primarily constituted by decomposed plant residues, faunal remnants, and microbial byproducts; and C d e a d denotes non-living organic matter carbon pools (t), comprising detrital carbon from senescent vegetation and necromass. The present research, to run InVEST’s Carbon Storage module, two primary inputs were necessary: land use data and a biophysical table of carbon density. The biophysical table must be formatted as a CSV file. Referencing previous studies [25], Table 4 presents the configured carbon pool values for this analysis.
(4)
Habitat quality assessment (HQ)
HQ denotes the environmental conditions where organisms or biotic communities reside, representing an ecosystem’s capacity to provide suitable conditions for species survival and reproduction. In the InVest model, the HQ index is usually used as a proxy indicator [49]. The higher the HQ, the better the survival and reproduction conditions provided by the ecosystem for organisms, and the stronger the biodiversity service capacity. The details are as follows:
Q x j = H j 1 D x j z D x j z + k 2
where Q x j refers to the HQ index for grid x within land use category j ;   H j signifies the habitat suitability index for category j , which spans from 0 to 1; D x j represents the index of habitat degradation; k denotes the half-saturation threshold; and z acts as the normalizing constant [50]. In the current study, the InVEST model’s HQ component demanded input parameters comprising land cover classification data, threat factor layers, the half-saturation constant, maximum threat distance, and decay parameters. Based on research results from similar regions [45], the maximum impact distances and weights of threat sources in the Gonghe Basin were determined (Table 5), coupled with HQ assessments across various land use categories and their susceptibility to environmental threats [50] (Table 6). The specific parameter settings are as follows:
(5)
Integrated ecosystem service capability
The comprehensive capacity of ESs refers to the overall ability of ecosystems to provide diverse services that benefit human societies, typically involving the integrated analysis of various indicators. In this study, it is derived from the combined overlay of WY, SC, CS, and HQ. Specifically, given the heterogeneity in the measurement scales of the four indicators, range standardization was applied to normalize each ES to a scale of 0–1. The standardized values were then summed to obtain the total ESs [51]. The details are as follows:
E S t = i = 1 n E S i , j E S ( i , m i n ) E S ( i , m a x ) E S ( i , m i n )
where   E S t denotes the integrated ecosystem service capability, E S i , j denotes the normalized magnitude of E S i , j , calculated using the i -th E S i , j minimum E S ( i , m i n ) and maximum E S ( i , m a x ) threshold values [52].

2.3.3. Response Relationship Evaluation

(1)
Spatial correlation analysis
Spatial correlation can reveal the similarities and differences in a certain attribute or phenomenon between different spatial units. The majority of existing studies utilize Spearman’s rank correlation coefficient to assess the dynamic interactions among various ESs components, particularly focusing on their trade-off and synergy patterns [53,54]. This research examines the interactions between HAs and various ESs in the Gonghe Basin. The methodological framework includes:
R a b = i = 1 N A i A ¯ B i B ¯ i = 1 N A i A ¯ 2 l ˙ = 1 N B B ¯ 2
where R denotes the correlation coefficient between HAs and ESs, taking values from −1 to 1. The strength of inter-ES correlation is directly proportional to the magnitude of R (| R |); A i   and   B i are the i raster values of HA (A) and ESs ( B ) ; A ¯ and B ¯ are the mean values of HA (A) and ESs (B); and N indicates the number of sampling units [55]. The values are derived from the calculation results of HAI and ESs.
(2)
Bivariate spatial autocorrelation analysis
Bivariate spatial autocorrelation analysis serves as a critical methodological framework for examining whether the attribute value of a specific geographic unit exhibits statistically significant associations with the attribute values of its neighboring spatial units. This analytical approach comprises two primary components: global (13) and local spatial autocorrelation (14). Specifically, global spatial autocorrelation quantifies the overall spatial dependence and attribute similarity among adjacent grid cells across the entire study area, whereas local spatial autocorrelation detects localized spatial associations and identifies statistically significant hot spots and cold spots. It is usually realized by bivariate Moran’s I index, LISA aggregation diagram, and LSA significance level diagram [55,56]. This study explores the response relationship between human activities and ecosystem services in the Gonghe Basin. This study explores the response relationship between HAs and ESs in the Gonghe Basin. The formula is:
I = n i = 1 n i = j n w i j y i m y ¯ m y i z y ¯ z i = 1 n j = 1 n w i j i = 1 n y i m y ¯ m y i z y ¯ z
J i = n x i x ¯ j = 1 n w i j x j x ¯ i = 1 n x i x ¯ 2
where I represents the bivariate global autocorrelation index, the value represents the correlation between HAs and ESs; n indicates the total number of grids; w i j signifies the spatial weight; y i m and y i z indicate the values of attribute m for grid cell i and attribute z for grid cell j ; y ¯ m and y ¯ z denote the mean values of attributes m and z ; J i is the local Moran’s index, and the value represents the trade-off and synergy between HAs and ESs; x i and x j are regional HAs and ESs [54].

3. Results

3.1. Analysis of Temporal and Spatial Evolution of HAI

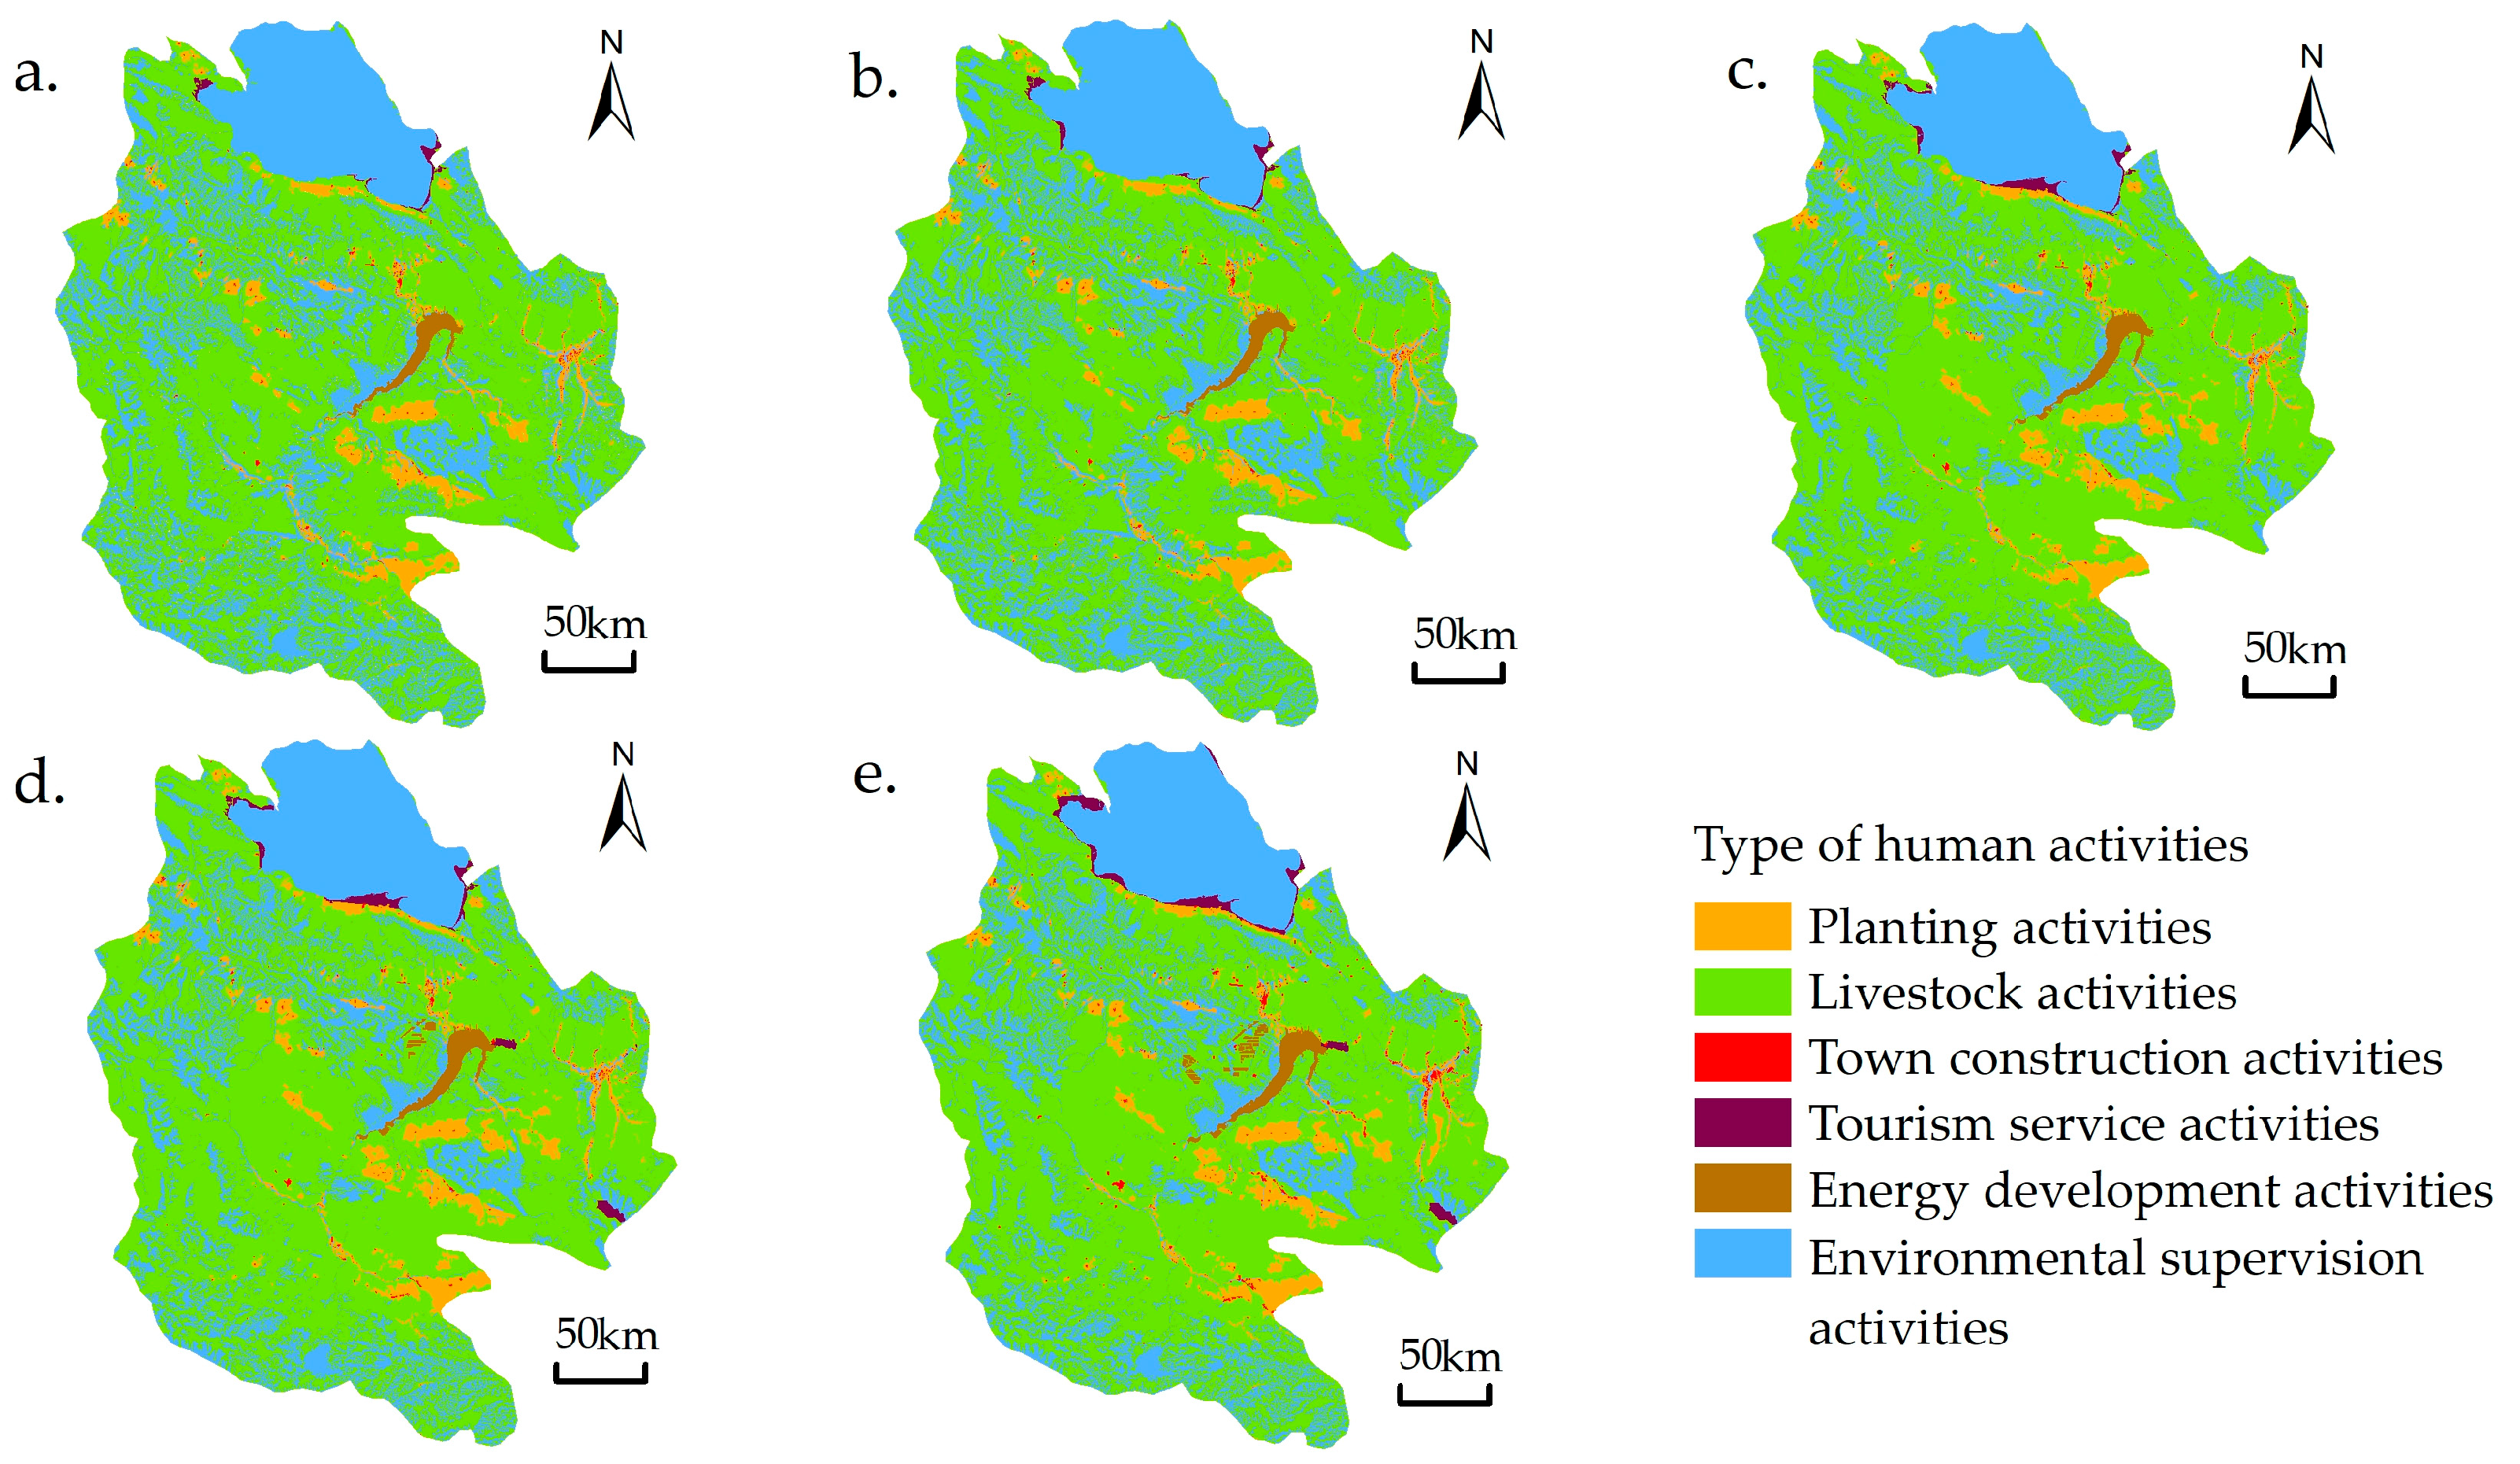
In Figure 3, the partitioning results of main HA space types are shown for the study area at five-year intervals from 2000 to 2020, using land use types as the classification criterion. It can be seen from the map that the grassland-based animal husbandry activities in the Gonghe Basin are widely distributed in the middle and low altitude areas; the mountainous areas with higher altitudes are interspersed with environmental supervision activities with forest land and unused land as the main carriers. The low-lying valley of the Yellow River system and the south bank of Qinghai Lake are interlaced with plantation activities, town construction activities, and tourism service activities. Energy development activities are distributed in Longyangxia and on both sides of the Yellow River.
In addition, the survey shows that different types of HAs in the Gonghe Basin still overlap in space. For example, tourism service activities on the south bank of Qinghai Lake overlap with plantation activities and livestock activities, while energy development activities on the shore of Longyangxia Reservoir overlap with animal husbandry activities. From the perspective of the temporal changes in the types of HAs, due to the overlapping of space, in addition to environmental supervision activities, other types of HAs showed an expansion trend from 2000 to 2020 (Table 7). Specifically, livestock activities exhibited fluctuating growth, with net expansion by 1519.72 km2 in 2020 compared with that in 2000; and the plantation activities initially increased and then stabilized, with the total activity area also increasing by 271.86 km2 compared with that in 2000. During the previous 20 years, although the total amount of town construction activities, tourism service activities, and energy development activities are small, they all show a continuous growth trend. Among them, the area of tourism service activities has the most significant change, with a growth rate of 33%. The total area of town construction activities and energy development activities in 2020 increased by 21% and 28%, respectively, compared with 2000. It shows that the HAI in the Gonghe Basin is gradually increasing, and the scope of influence is gradually expanding.
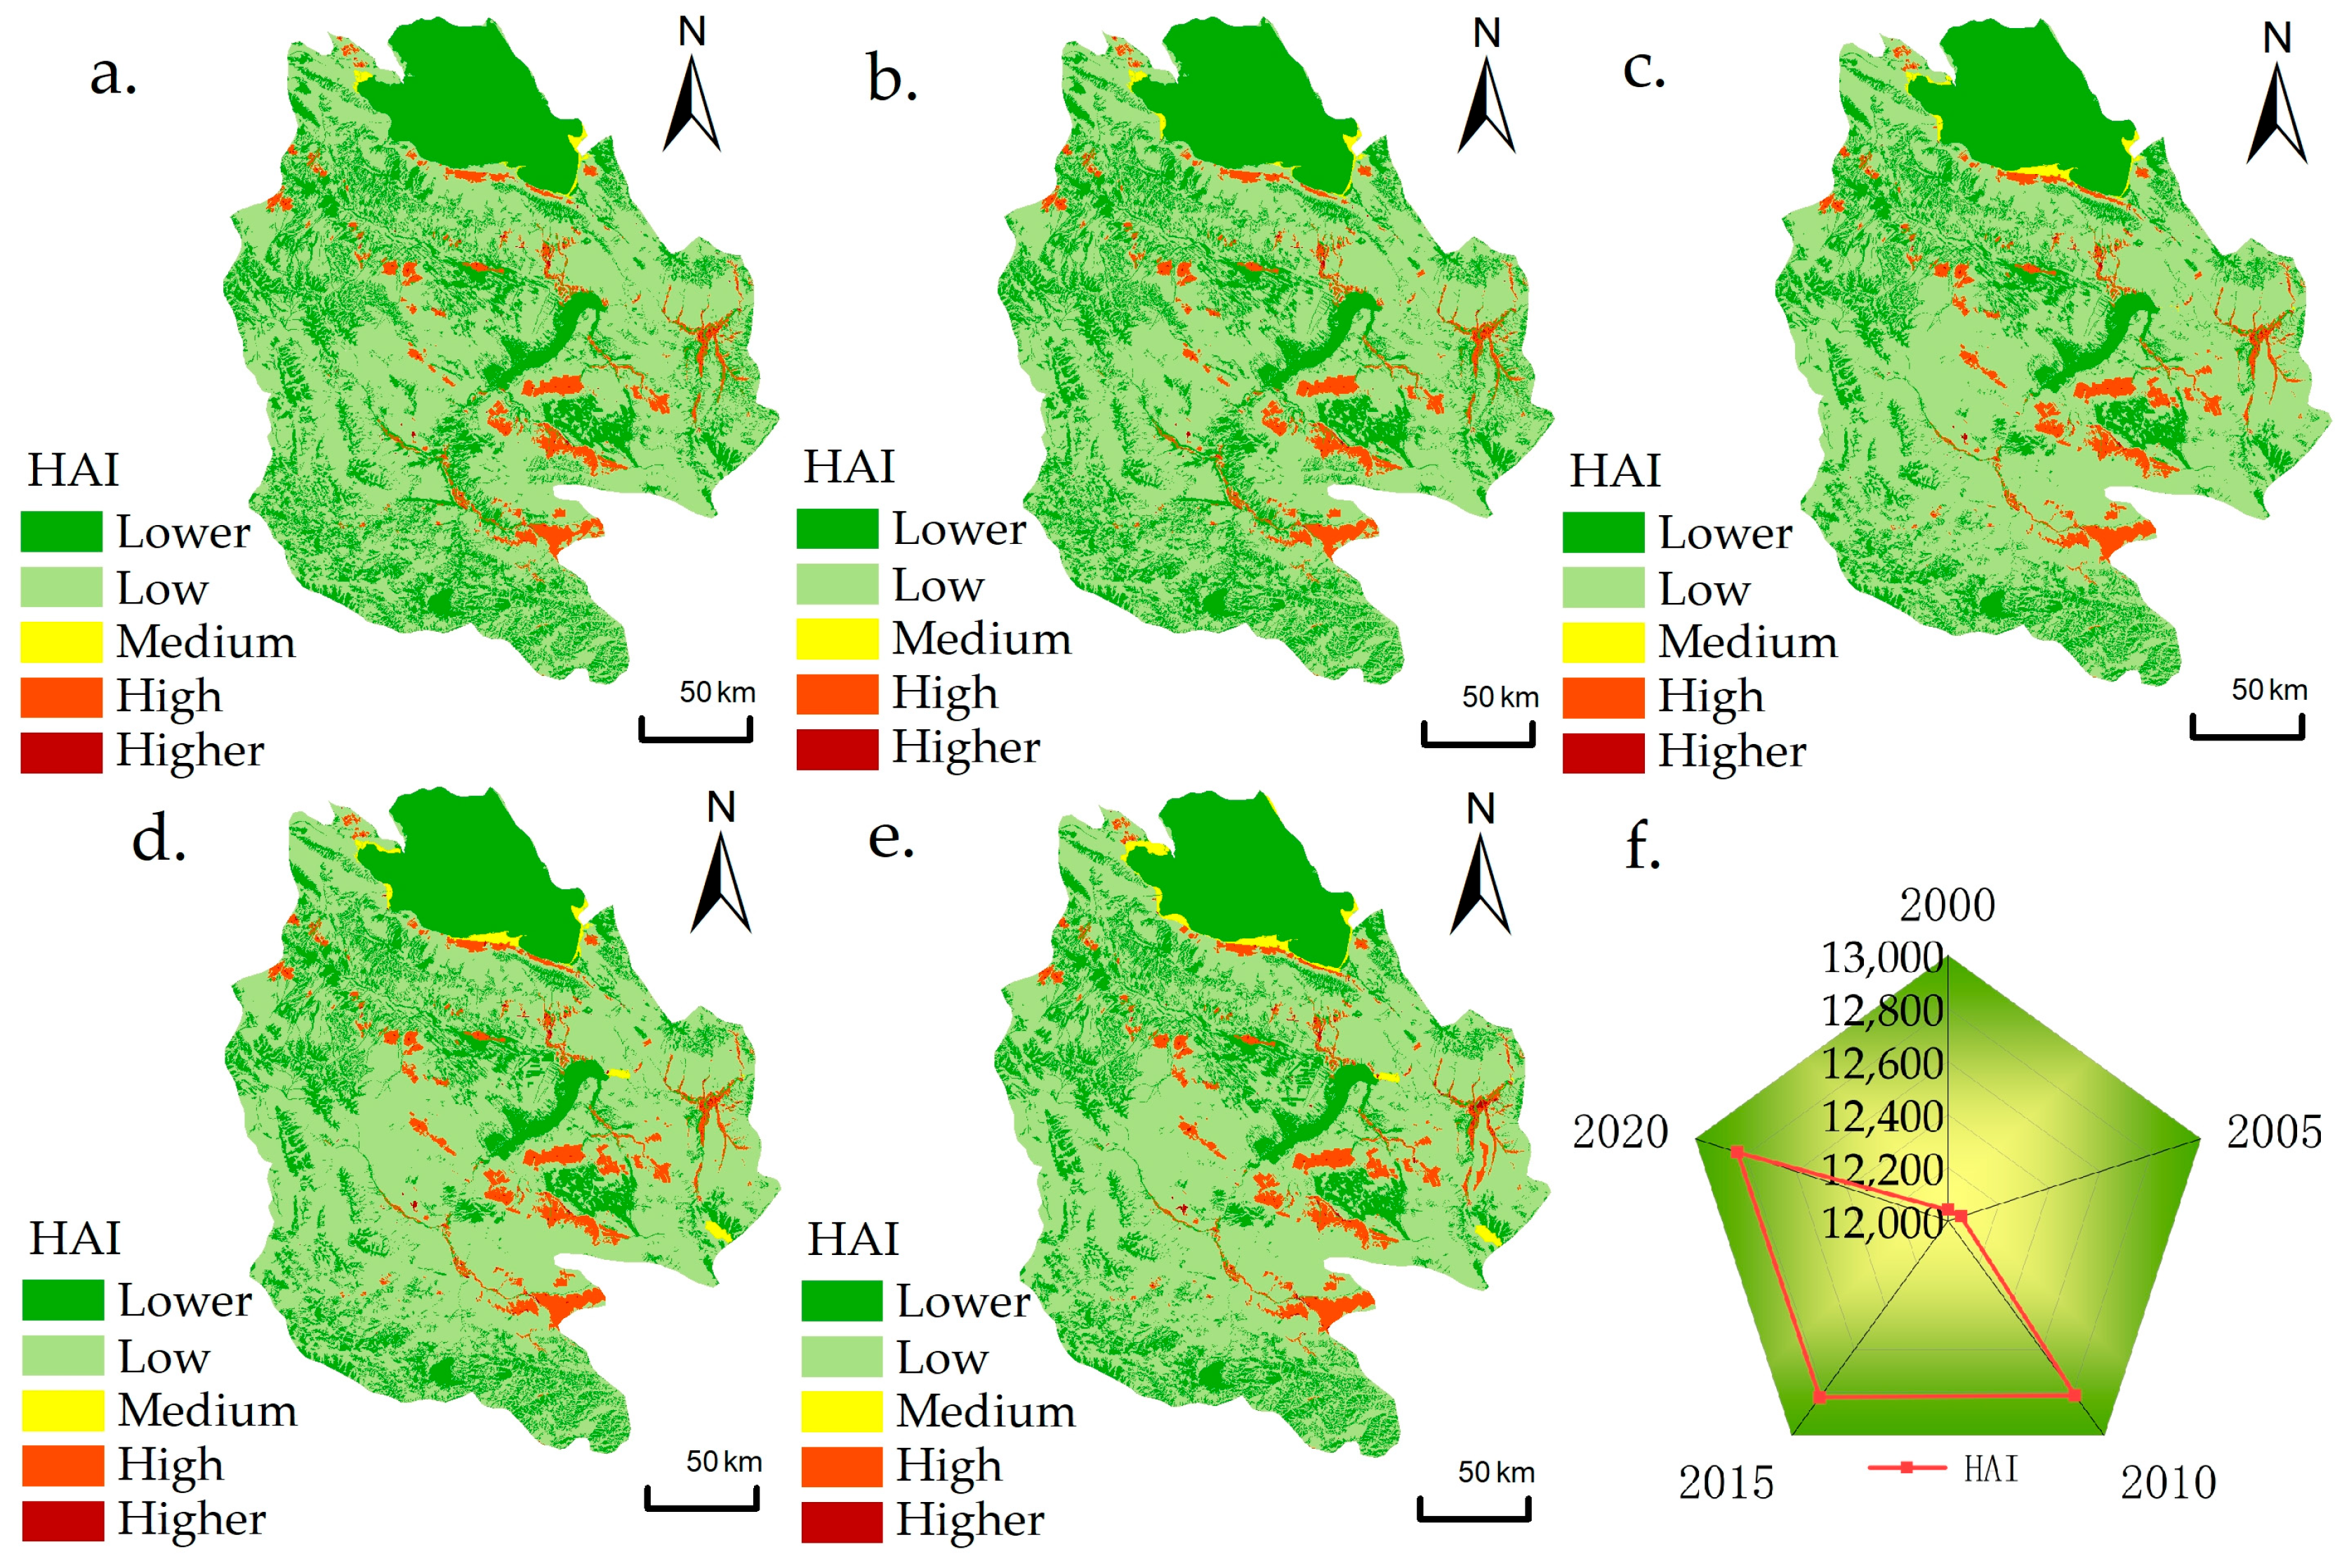
Temporal trends and spatial redistribution characteristics of HAI during 2000–2020 are demonstrated in Figure 4. According to Formula (1), the kilometer grid is used as the unit for quantification to better reflect the geographic distribution features of HAs in the Gonghe Basin, and the HAI is graded using the equal interval method. Restricted by the types of HA, the HAI in Gonghe Basin is mainly lower and low intensity and with comprehensive areal coverage of the whole study area. The corresponding types of HAs include environmental supervision activities, livestock activities, and energy development activities. The land types are mainly water area, forest land, grassland, and unused land. The areas of higher and high-intensity HAs are mainly consistent with the distribution of plant activities and town construction activities and are scattered in the valley lowlands on both sides of the axis of southeast to northwest. Areas with moderate HAI are centered on tourism service activities, which are mainly distributed around Qinghai Lake in Gonghe County, southeast bank of Longyangxia Reservoir, and central area of Guide County. From the perspective of time change, the moderate and above-intensity HAs in the Gonghe Basin showed an expansion trend, which increased by 293.85 km2 in 2020 compared with 2000. It shows again that the HAI in the Gonghe Basin is growing, and the scope of influence is expanding.

3.2. Characterization of Spatial and Temporal Changes in ESs

3.2.1. Water Yield Service (WY)

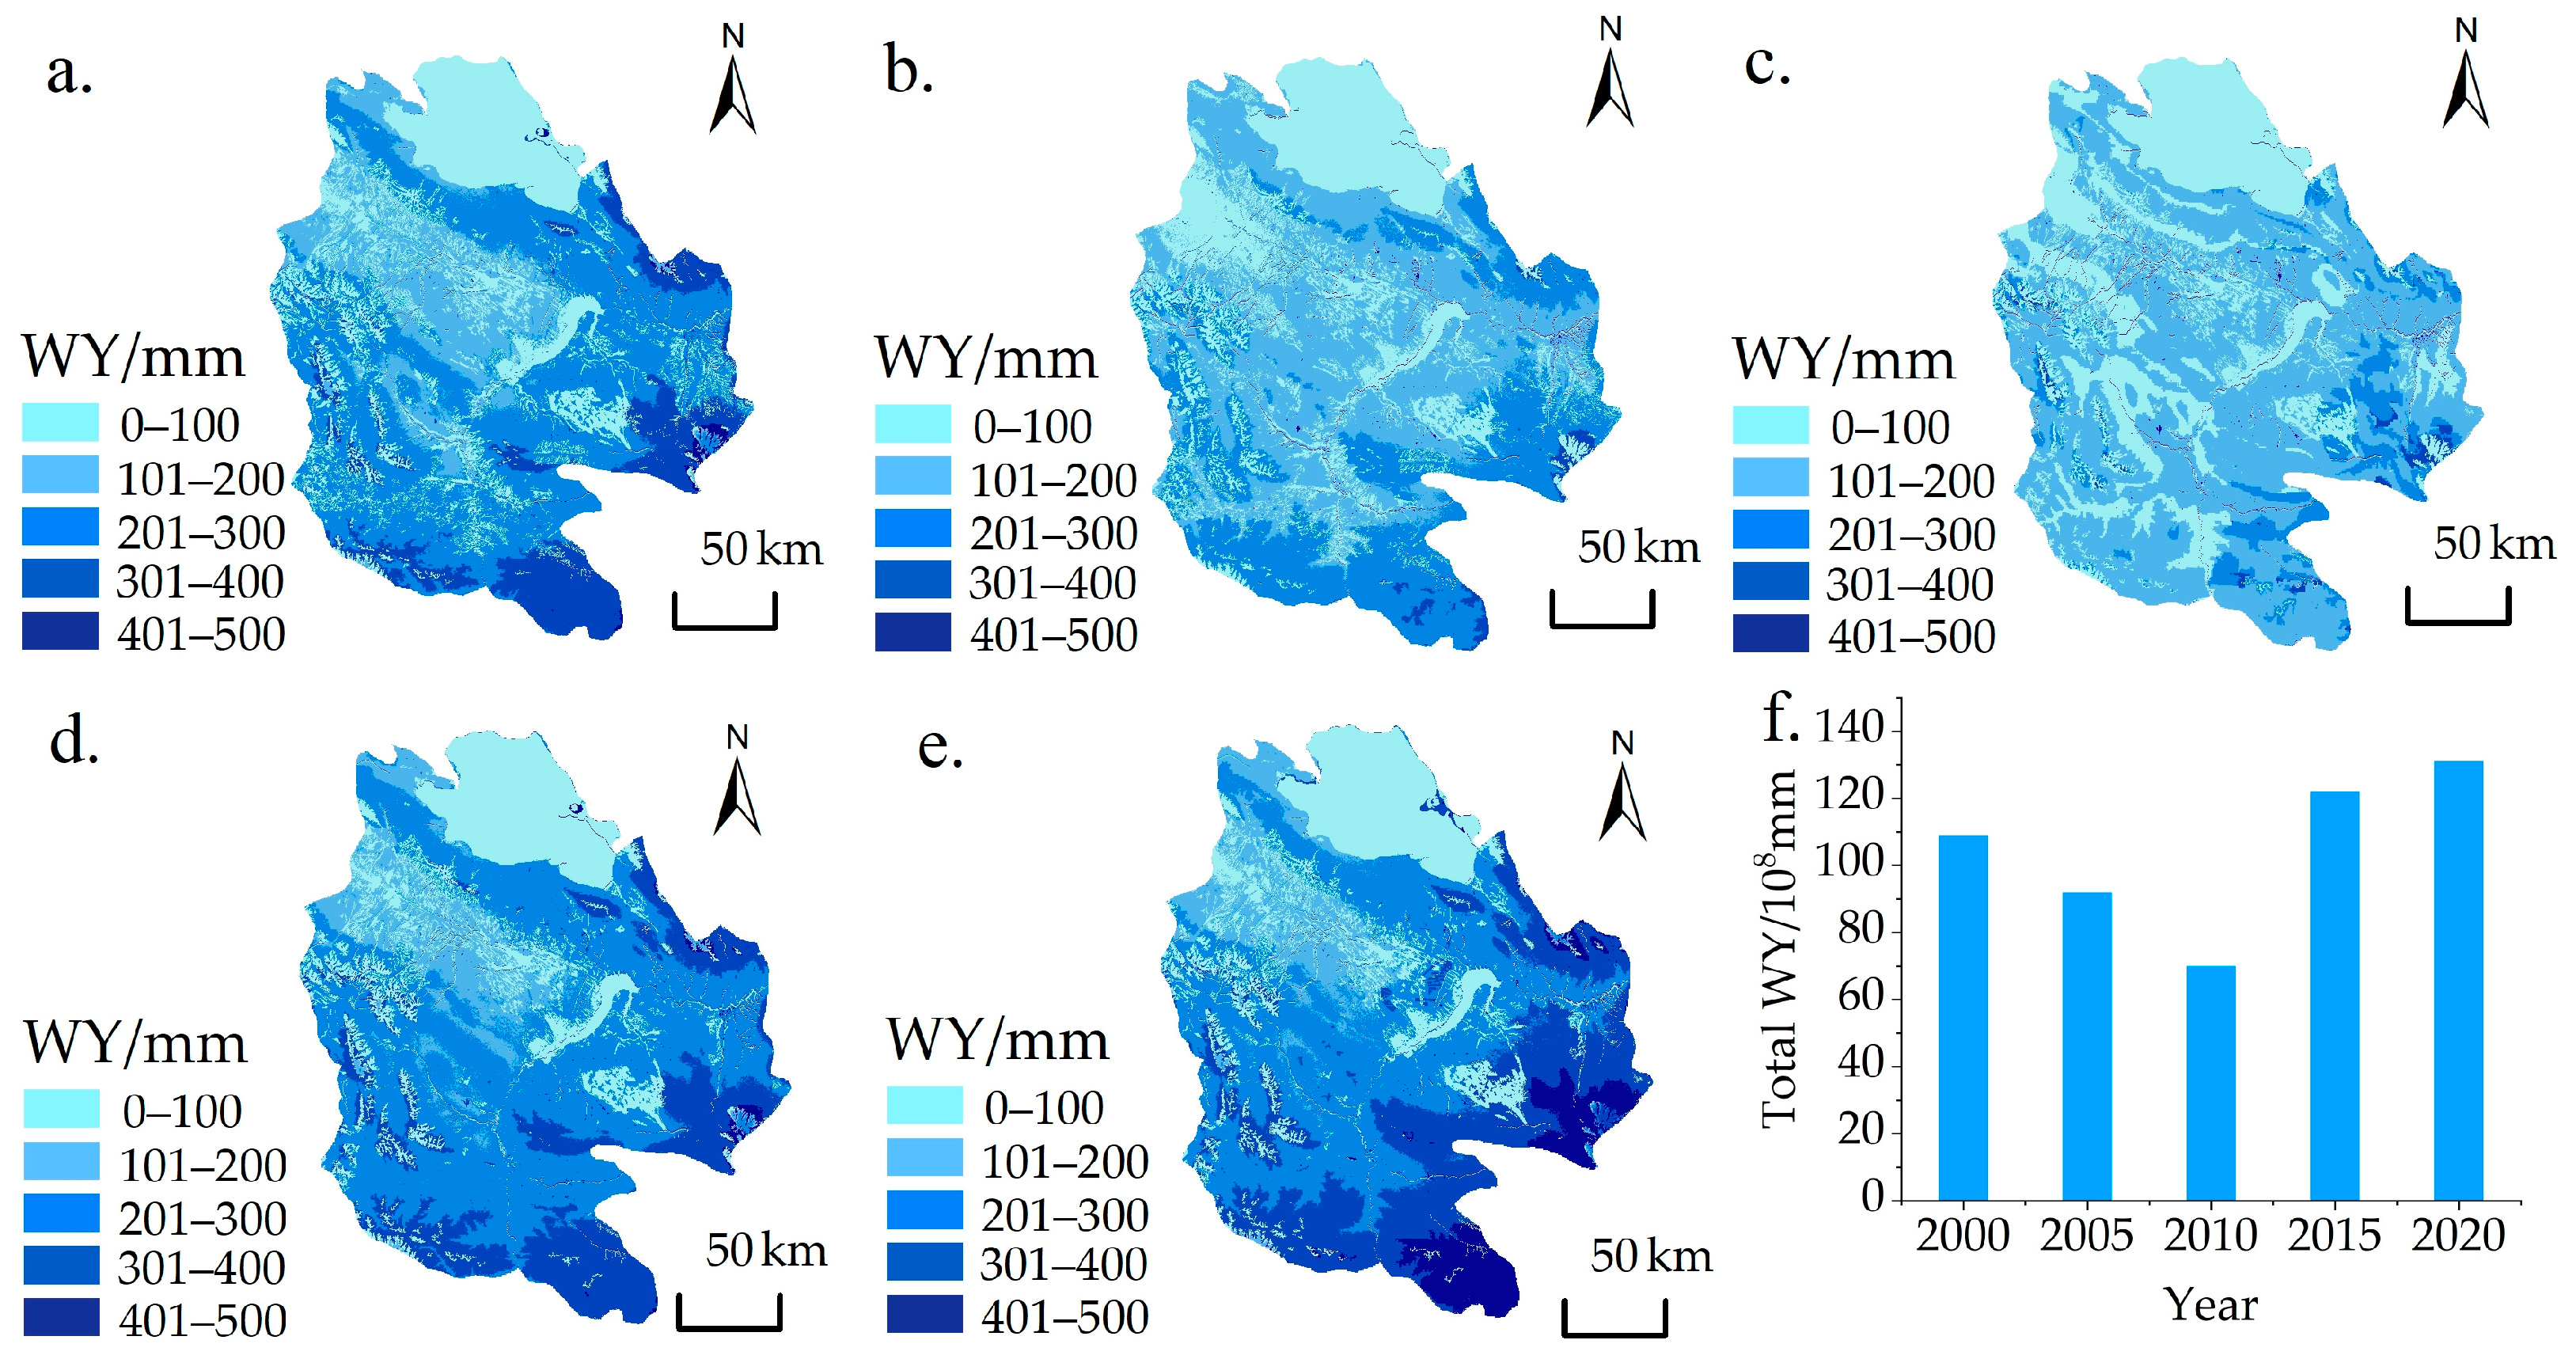
Figure 5 illustrates the spatiotemporal variations in WY capacity in Gonghe Basin from 2000 to 2020. Higher WY indicates stronger ecosystem capacities in precipitation interception, water retention, and runoff regulation. Under the combined influences of global change and large-scale climatic shifts on the QTP, the WY in the Gonghe Basin exhibited a decline-then-recovery trend at both local and regional scales during this period. Temporally, the WY capacity decreased significantly from 2000 to 2010, with the total amount declining from 74 × 108 mm to 50 × 108 mm, representing a decrease of 32%. Conversely, from 2010 to 2020, the WY increased, with the total amount increasing to 95 × 108 mm. Spatially, due to the determinants of the physiographic characteristics of the Gonghe Basin, the distribution pattern in the past 20 years was low in the northwest and high in the east and southeast. The low-value areas of WY are specifically predominated in the western part of Gonghe County, the central part of Guinan County, and the areas of Qinghai Lake and Longyangxia Reservoir, while the high-value zones aggregate predominantly in Xinghai County, southern Tongde County, and eastern Guinan County.

3.2.2. Soil Conservation Service (SC)

Figure 6 shows the change in SC in Gonghe Basin from 2000 to 2020 represented by the estimated SC amount. The higher the SC amount, the better the SC service. The SC service in the Gonghe Basin generally increased year by year and decreased after reaching its peak in 2015. The annual average SC amount was 243 × 106 t. Specifically, the total amount of SC increased from 212 × 106 t in 2000 to 292 × 106 t in 2015. In 2020, SC in the Gonghe Basin declined to 236 × 106 t, representing a 19% decrease. However, the spatial configuration of high- and low-value zones for soil conservation services in the Gonghe Basin demonstrates remarkable temporal stability, which is congruent with the spatial configuration of WY. The high-value zones predominantly aggregate in Xinghai, Tongde, and Guide County in the southwest of Gonghe Basin, and the low-value clusters primarily occur in the west and north of Gonghe County and the west of Guinan County.

3.2.3. Carbon Sequestration Service (CS)

Figure 7 shows the change in CS service in Gonghe Basin from 2000 to 2020, which is represented by the total amount of carbon in the ecosystem. On the whole, it is relatively stable, with an average annual CS of 688 × 106 t. In the period from 2000 to 2005, the overall CS remained fairly constant, totaling 674 × 106 t. However, from 2005 to 2010, the total CS increased from 674 × 106 t to 699 × 106 t, representing an increase of 3.67%. Over the subsequent decade, the CS capacity demonstrated a slight decline, with the total CS decreasing from 699 × 106 t in 2010 to 696 × 106 t in 2020, a decrease of 0.40%. Judging from the distribution pattern, high-value zones are primarily concentrated in Xinghai County, the southern portion of Tongde County, and the northwestern region of Gonghe County. Conversely, low-value zones dominate the western and central areas of the Gonghe Basin, demonstrating a dispersed distribution pattern along the northwest-southeast axis.

3.2.4. Habitat Quality (HQ)

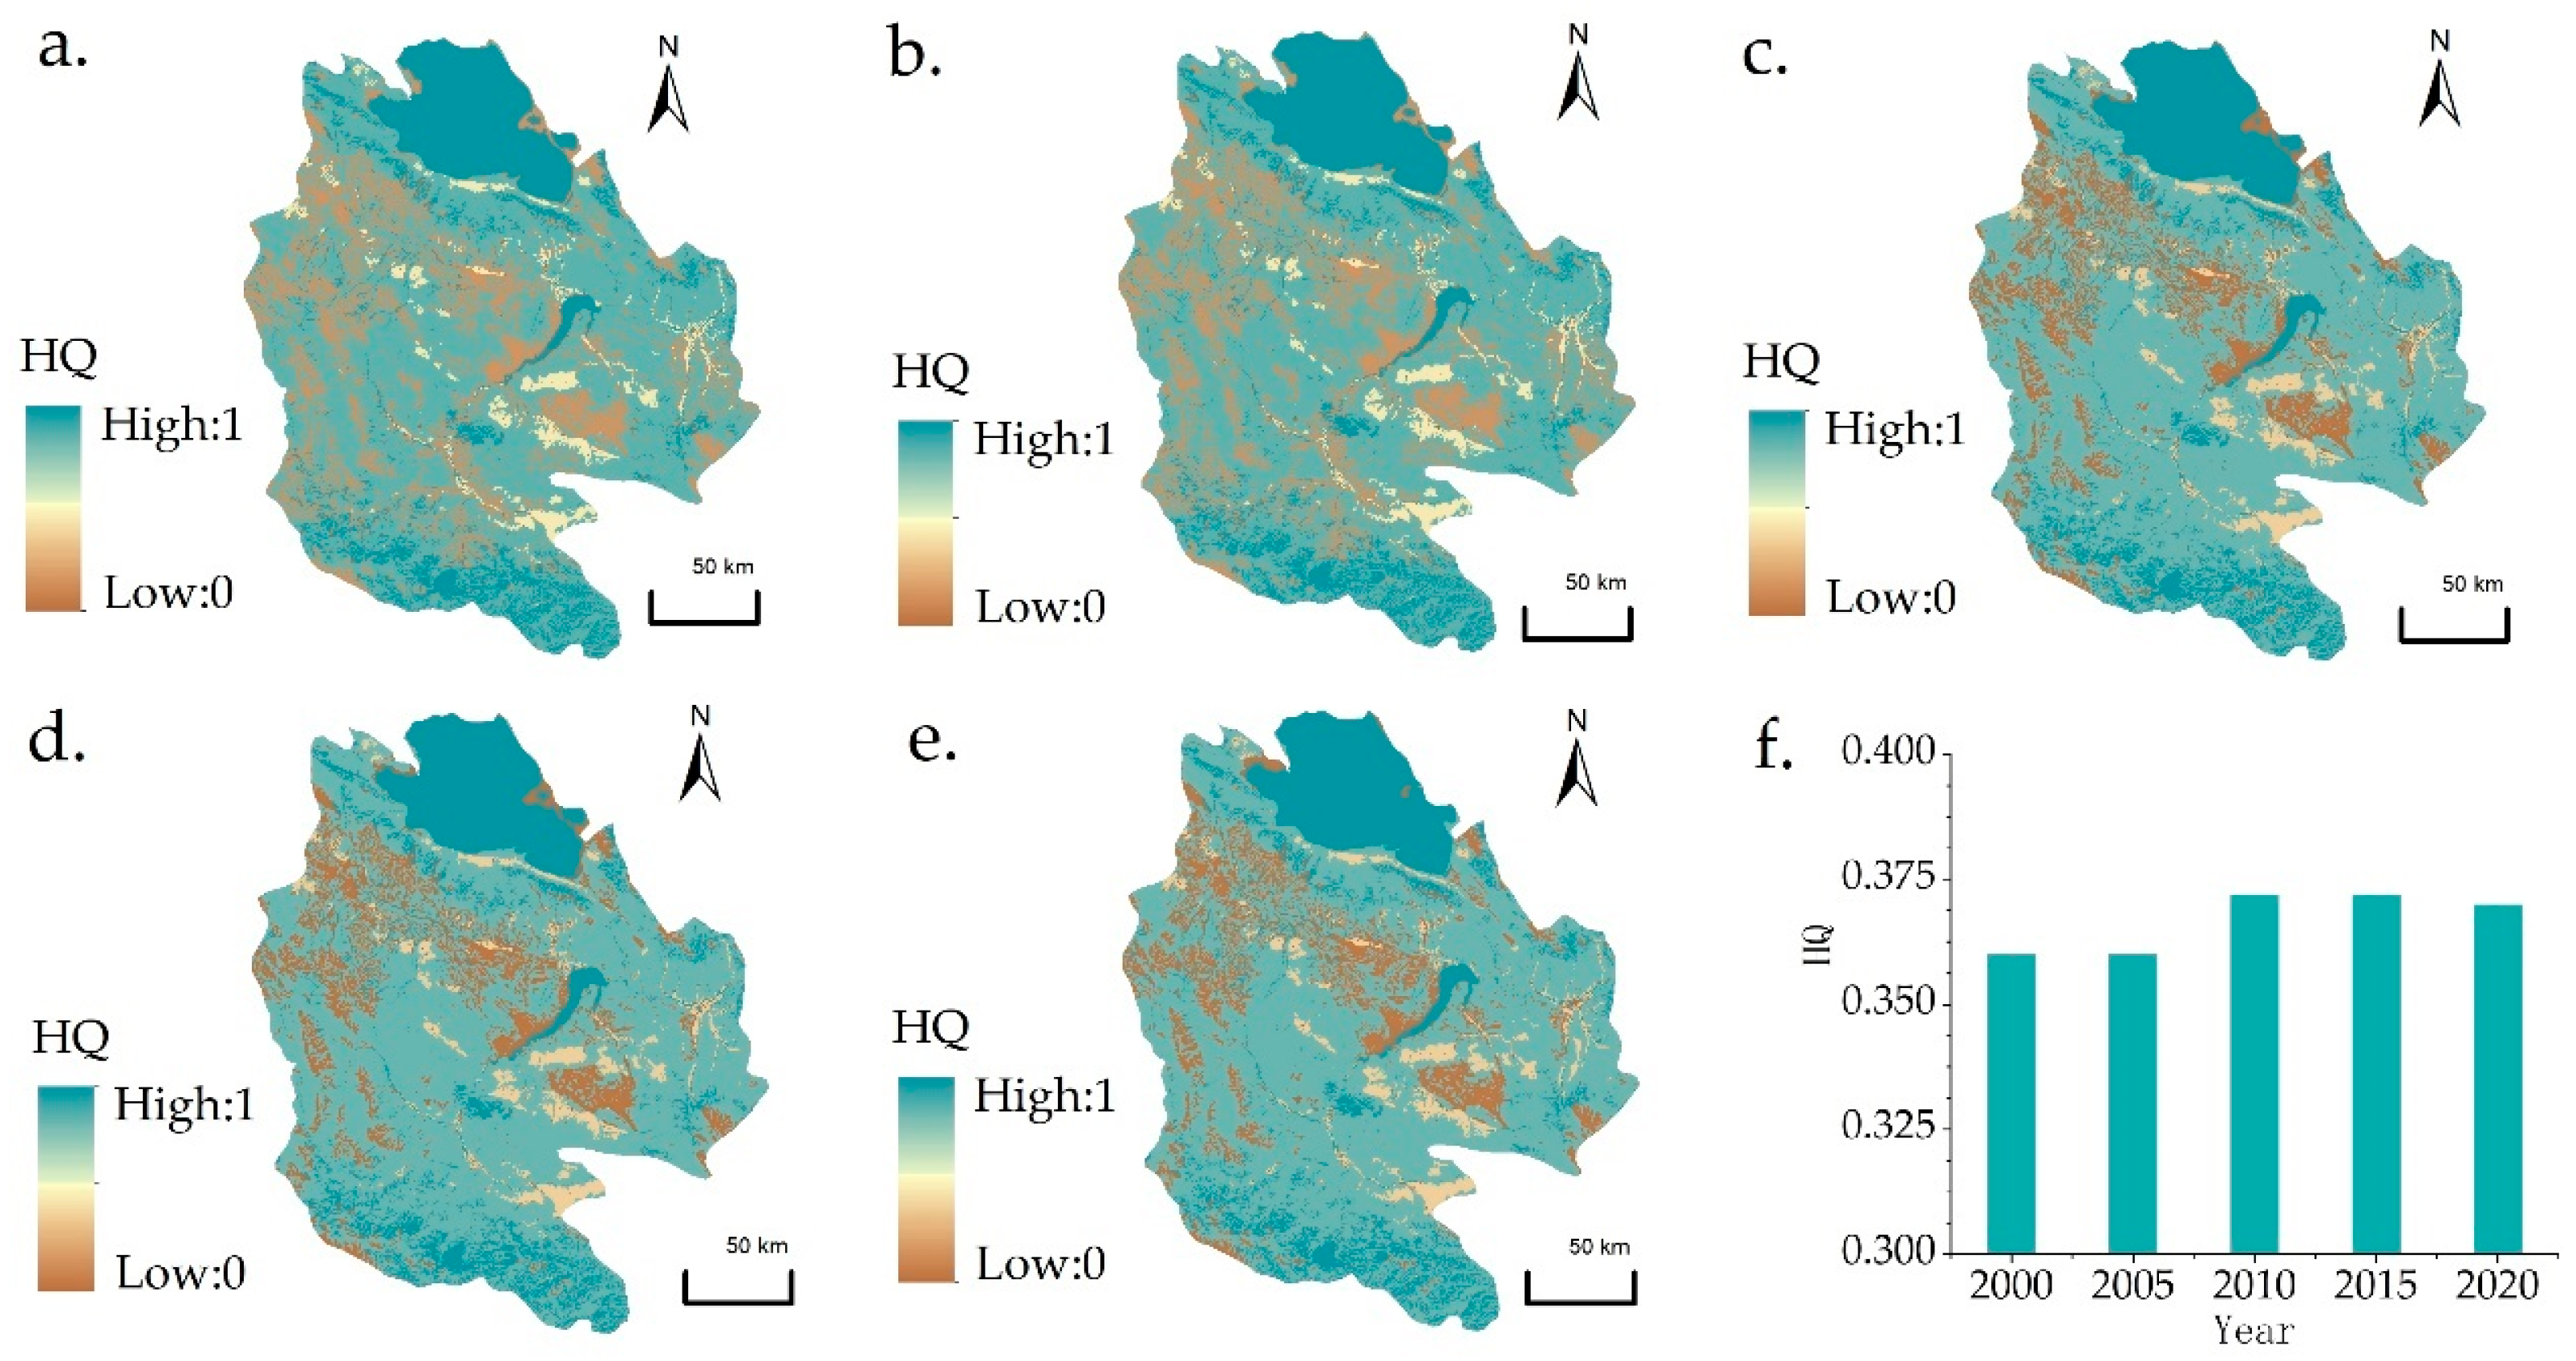
Between 2000 and 2020, the spatial distribution of HQ in Gonghe Basin showed a relatively stable distribution pattern of “high in the northeast and south, low in the middle”. High-value zones are primarily distributed in the northern part of Gonghe County and the Qinghai Lake region, the southern areas of Xinghai and Tongde County, and the southeastern regions of Guide and Guinan County (Figure 8), and the spatial distribution range of low-value areas of HQ showed a gradual narrowing trend. Regarding the total quantity, during 2000–2005, the HQ index of Gonghe Basin showed a slow decreasing trend, with a decrease of 0.03%. From 2005 to 2010, the HQ index of Gonghe Basin increased significantly, from 0.36 to 0.37, with an increase of 3.49%. The average HQ index of Gonghe Basin from 2015 to 2020 was 0.37, showing a slow decreasing trend. However, relative to 2000, the HQ value showed a fluctuating increase trend in 20 years, with an increase of 3.39%.

3.2.5. Ecosystem Services (ESs)

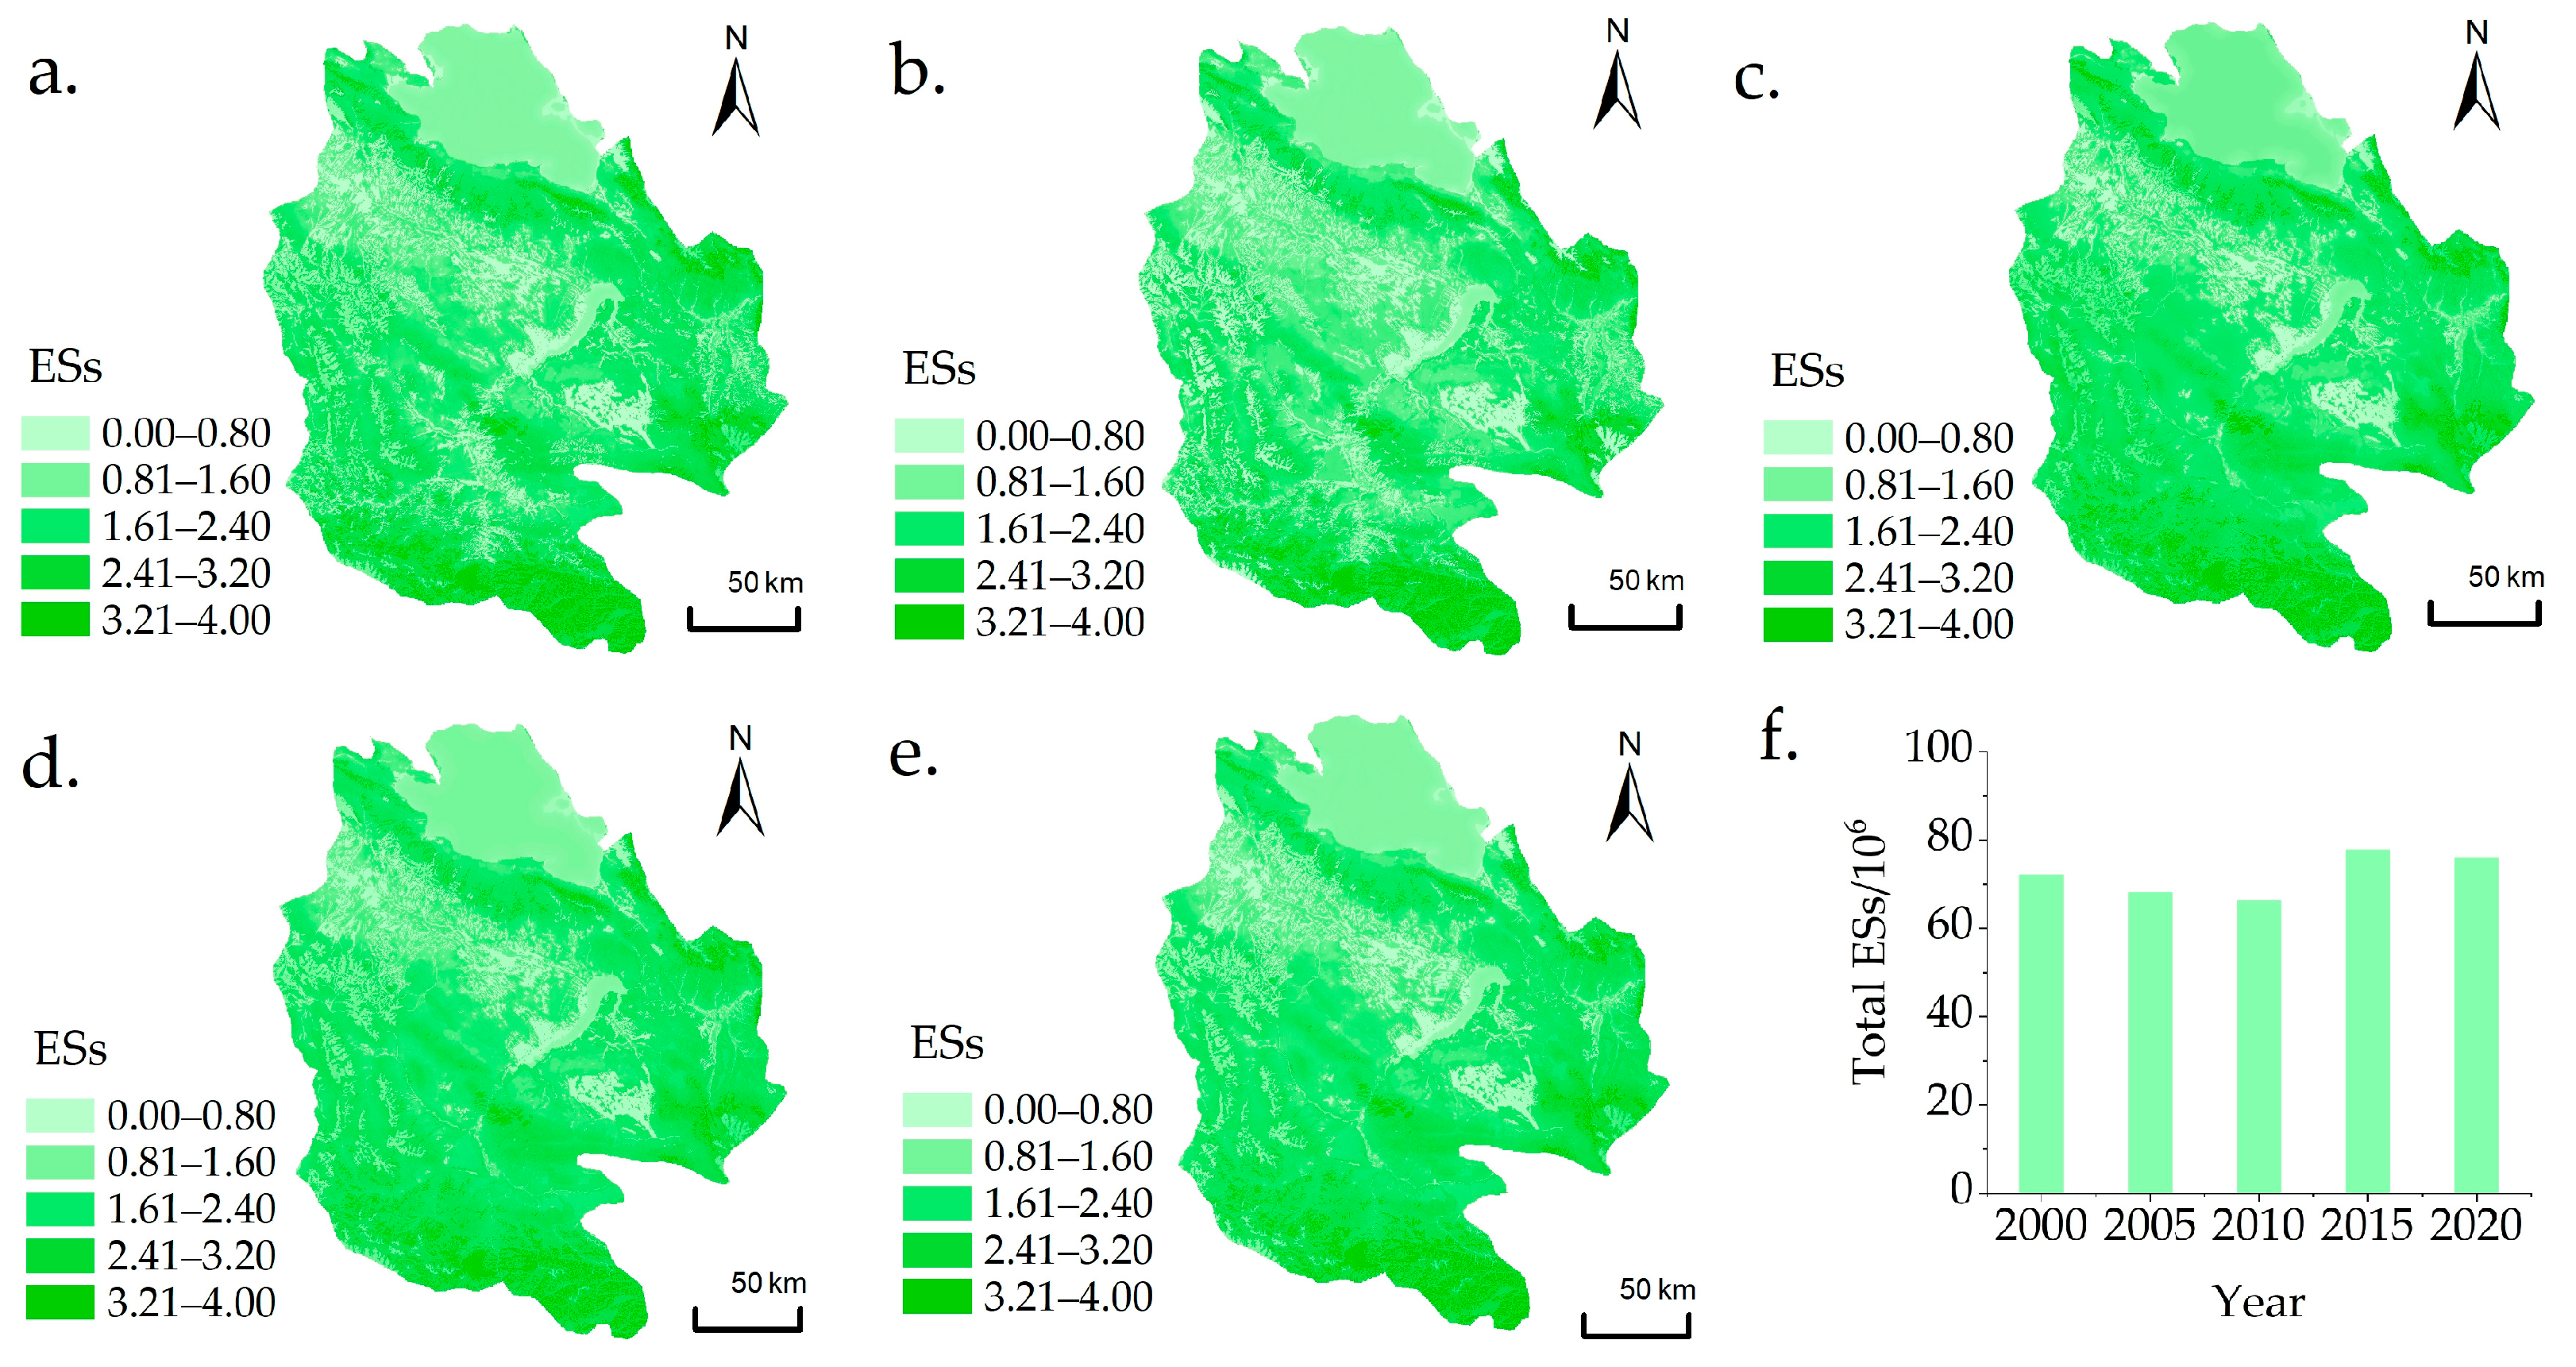
This study evaluates the spatiotemporal variation characteristics of ES functions in the Gonghe Basin through four dimensions: WY, SC, CS, and HQ, and the regional comprehensive ES capacity was expressed based on the superposition of four ESs. The results are shown in Figure 9. Between 2000 and 2020, the spatial distribution of ESs in the Gonghe Basin showed a distribution pattern of “high in the southeast and low in the northwest”. The high-value areas of ESs are mainly distributed in Xinghai, southern Tongde, northern Guide, and southeastern Guinan County; the low-value areas are mainly distributed in the southwest of Gonghe, the northwest of Xinghai and the central area of Guinan County. This spatial pattern is consistent with WY, SC, CS, and HQ. However, in terms of the change in comprehensive capacity, the period from 2000 to 2020 e displayed a downward-then-upward trajectory. The value of ESs showed the lowest value in 2010 and the highest value in 2015, which was similar to the trend of WY, indicating that WY may determine the trend of ESs in the Gonghe Basin.

3.3. Analysis of Response Relationships

3.3.1. Correlation Analysis Between HAs and Various ESs

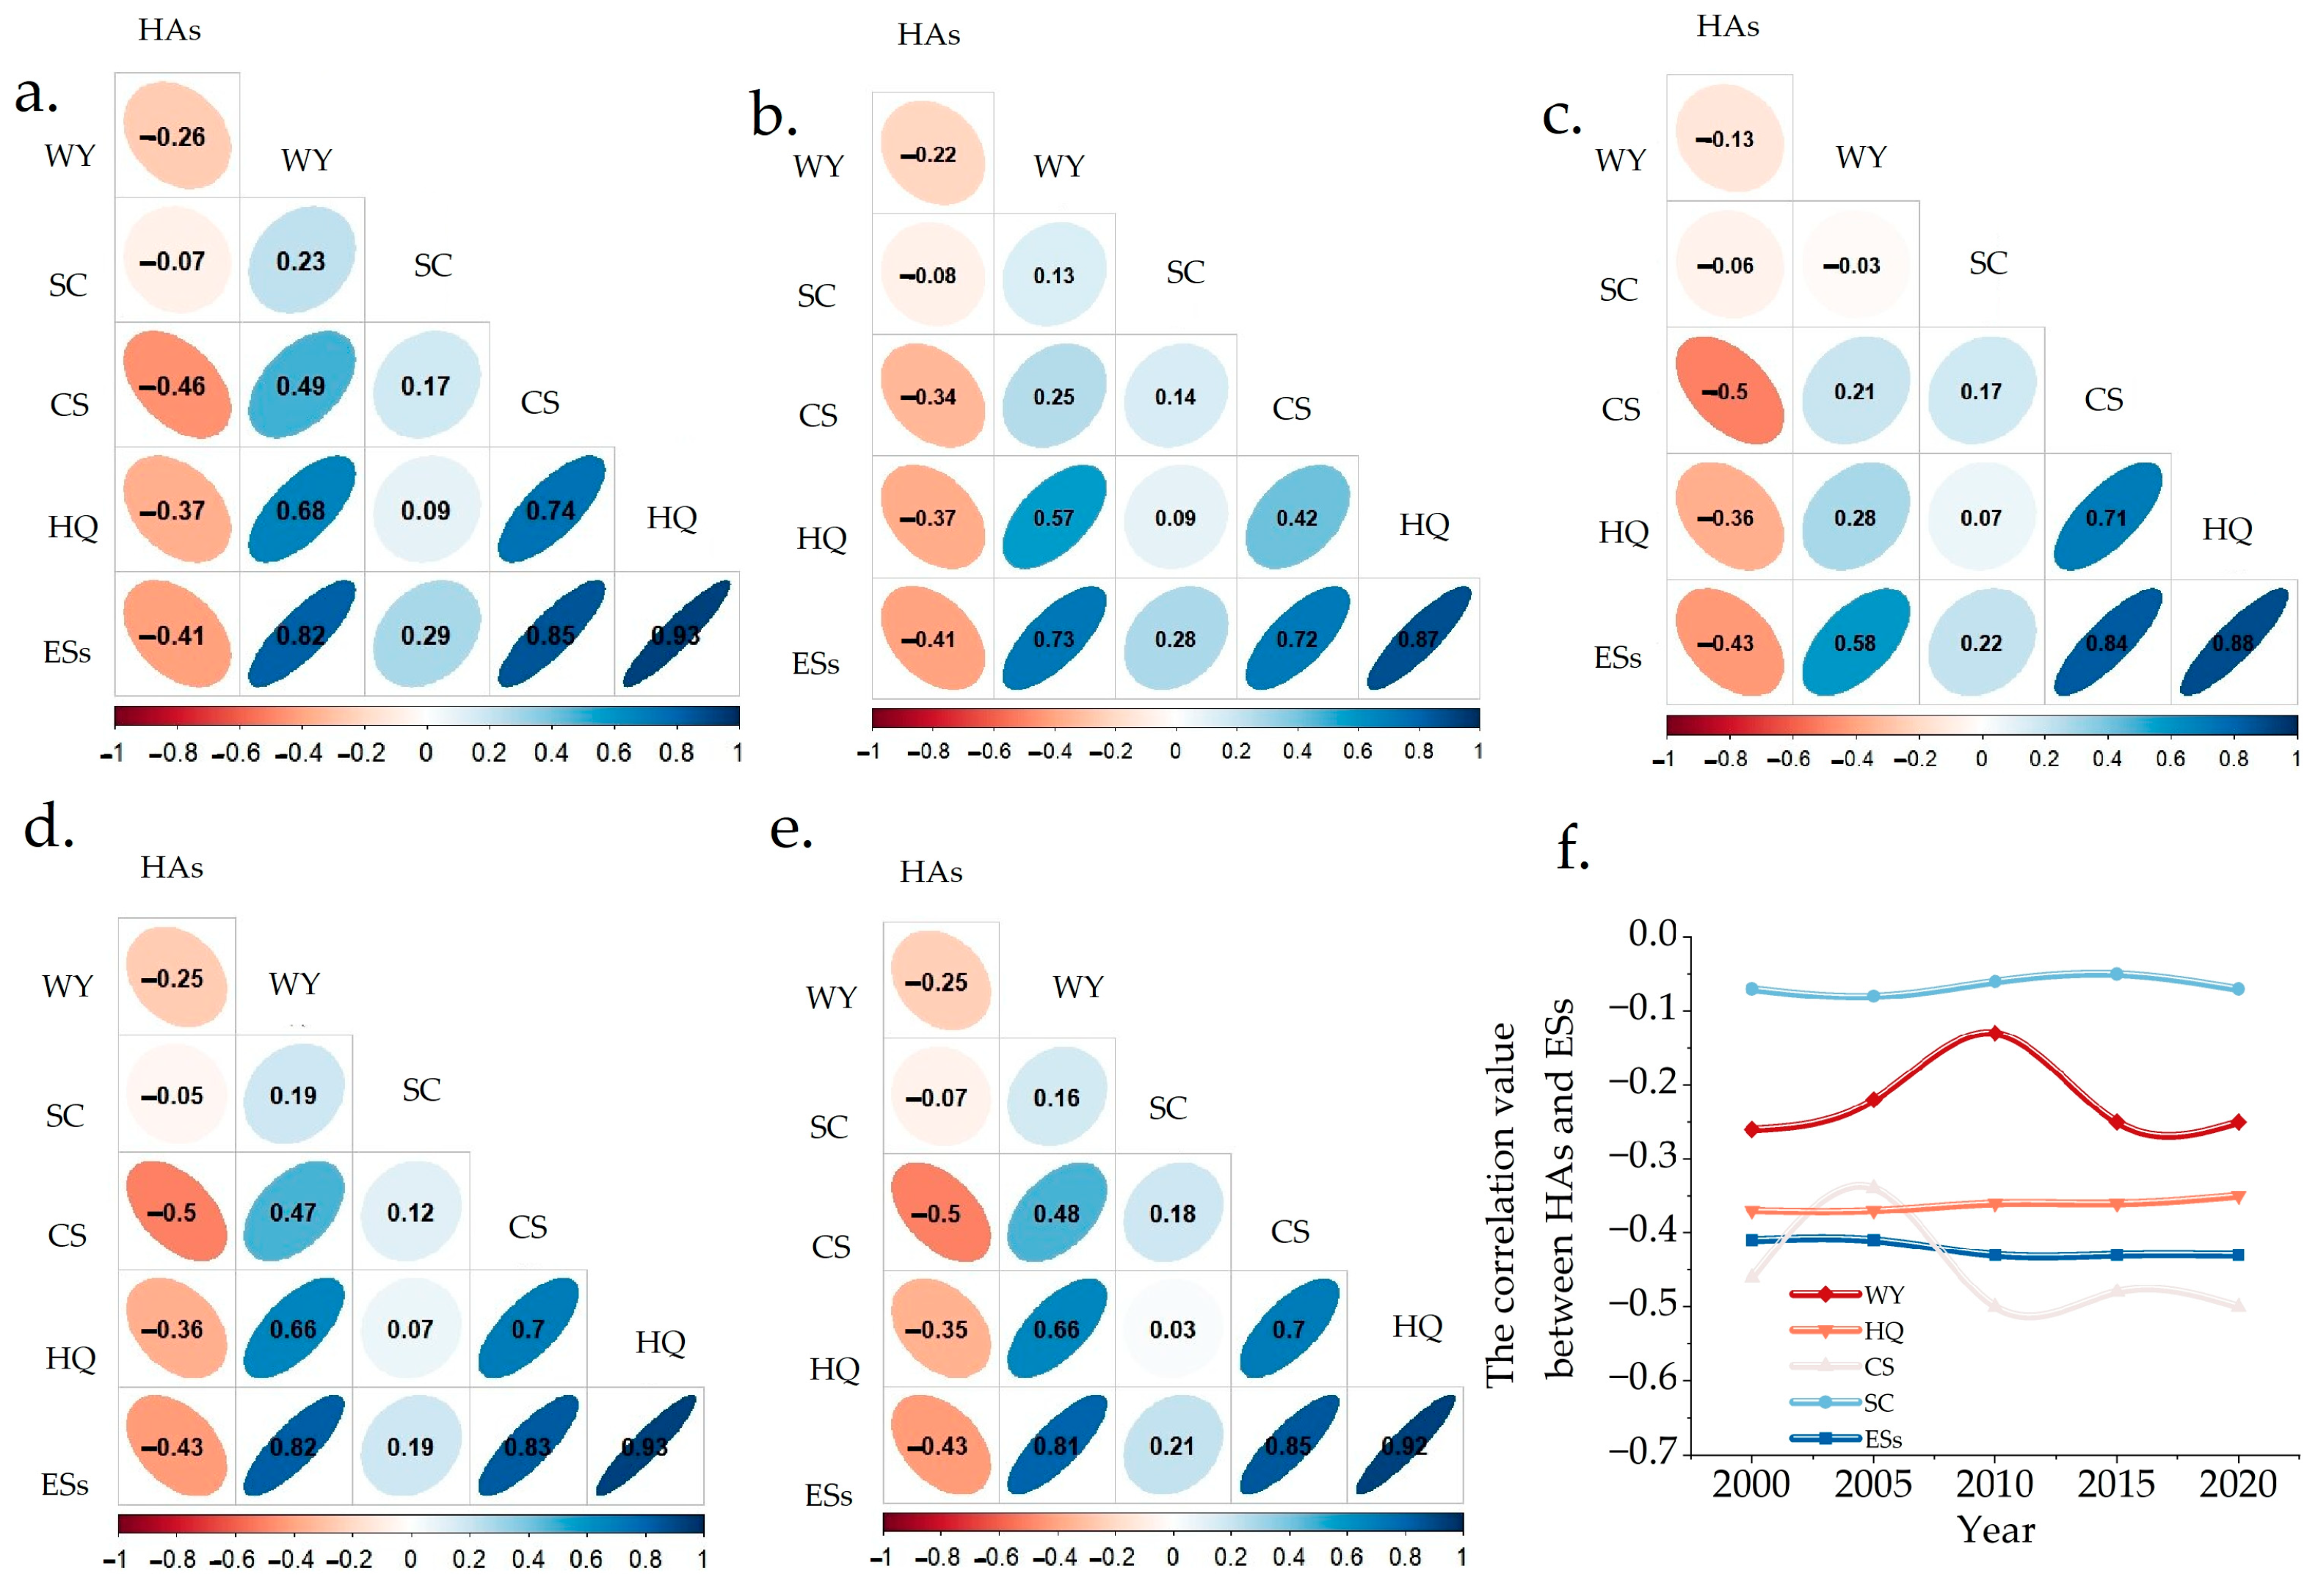
This study employed Spearman correlation analysis to explore the impact of HAs on key ESs in the Gonghe Basin, with HAI as the explanatory variable and WY, SC, CS, HQ, and ESs as response variables. The results are shown in Figure 10. From 2000 to 2020, both individual indicators and comprehensive ESs exhibited negative correlations with HAI, indicating trade-off relationships. Among these, the trade-off relationship of HAs versus CS was consistently the strongest, showing an overall trend of initial decline followed by growth, with the strength of the trade-off relationship on an upward trajectory. Other indicators exhibited varying trends in correlation due to different influencing factors. Specifically, the negative correlation between HAs and WY was lowest in 2010, following a biphasic temporal dynamic characterized by initial decline and subsequent augmentation across the study period. The negative relationships between HAs and SC, as well as HQ, remained relatively stable. Overall, the opposing changes in WY and CS, coupled with the stable background of SC and HQ, resulted in a generally stable response of ESs to HAs.

3.3.2. Bivariate Spatial Autocorrelation Analysis of HAs and ESs

Using the bivariate spatial autocorrelation model and the spatial analysis tool, a spatial weight matrix was established to conduct Moran’s I and LISA clustering analyses. First, the bivariate Moran’s I indices for ESs and HA intensity spanning 2000–2020 were −0.357, −0.358, −0.380, −0.383, and −0.353 (Figure 11). All five indices passed the significance test at a 99.9% confidence level (p < 0.001). It should be noted that due to the existence of spatial autocorrelation, the traditional p-value calculation may underestimate the true standard error, resulting in an overestimation of the significance level. In this study, 999 Monte Carlo permutation tests were used to correct the effect of spatial autocorrelation on the p-value to ensure the reliability of statistical inference. The negative values of Moran’s I indices across all five time periods indicate that ESs and HAs in the Gonghe Basin exhibited a negative correlation from 2000 to 2020, with the strength of the negative correlation first increasing and then decreasing, peaking in 2015. The weakening of the negative correlation coefficient between HAs and ESs by 2020 can likely be linked to the application of ecosystem preservation strategies, which have begun to show the positive effects of HAs on ESs. For example, since 2014, the Chinese government has implemented a multifaceted ecological governance strategy that integrates enhanced conservation of critical ecological zones, systematic expansion of protected area networks, and rigorous establishment of ecological protection boundaries. These coordinated measures collectively aim to improve the resilience and functional integrity of the QTP ecosystem [23]. Additionally, the construction of the Hainan Prefecture photovoltaic park has led to a reduction in average wind speed, decreased water evaporation, and a noticeable increase in air humidity within the park. The reduction in wind speed has also contributed to SC and vegetation recovery [57].
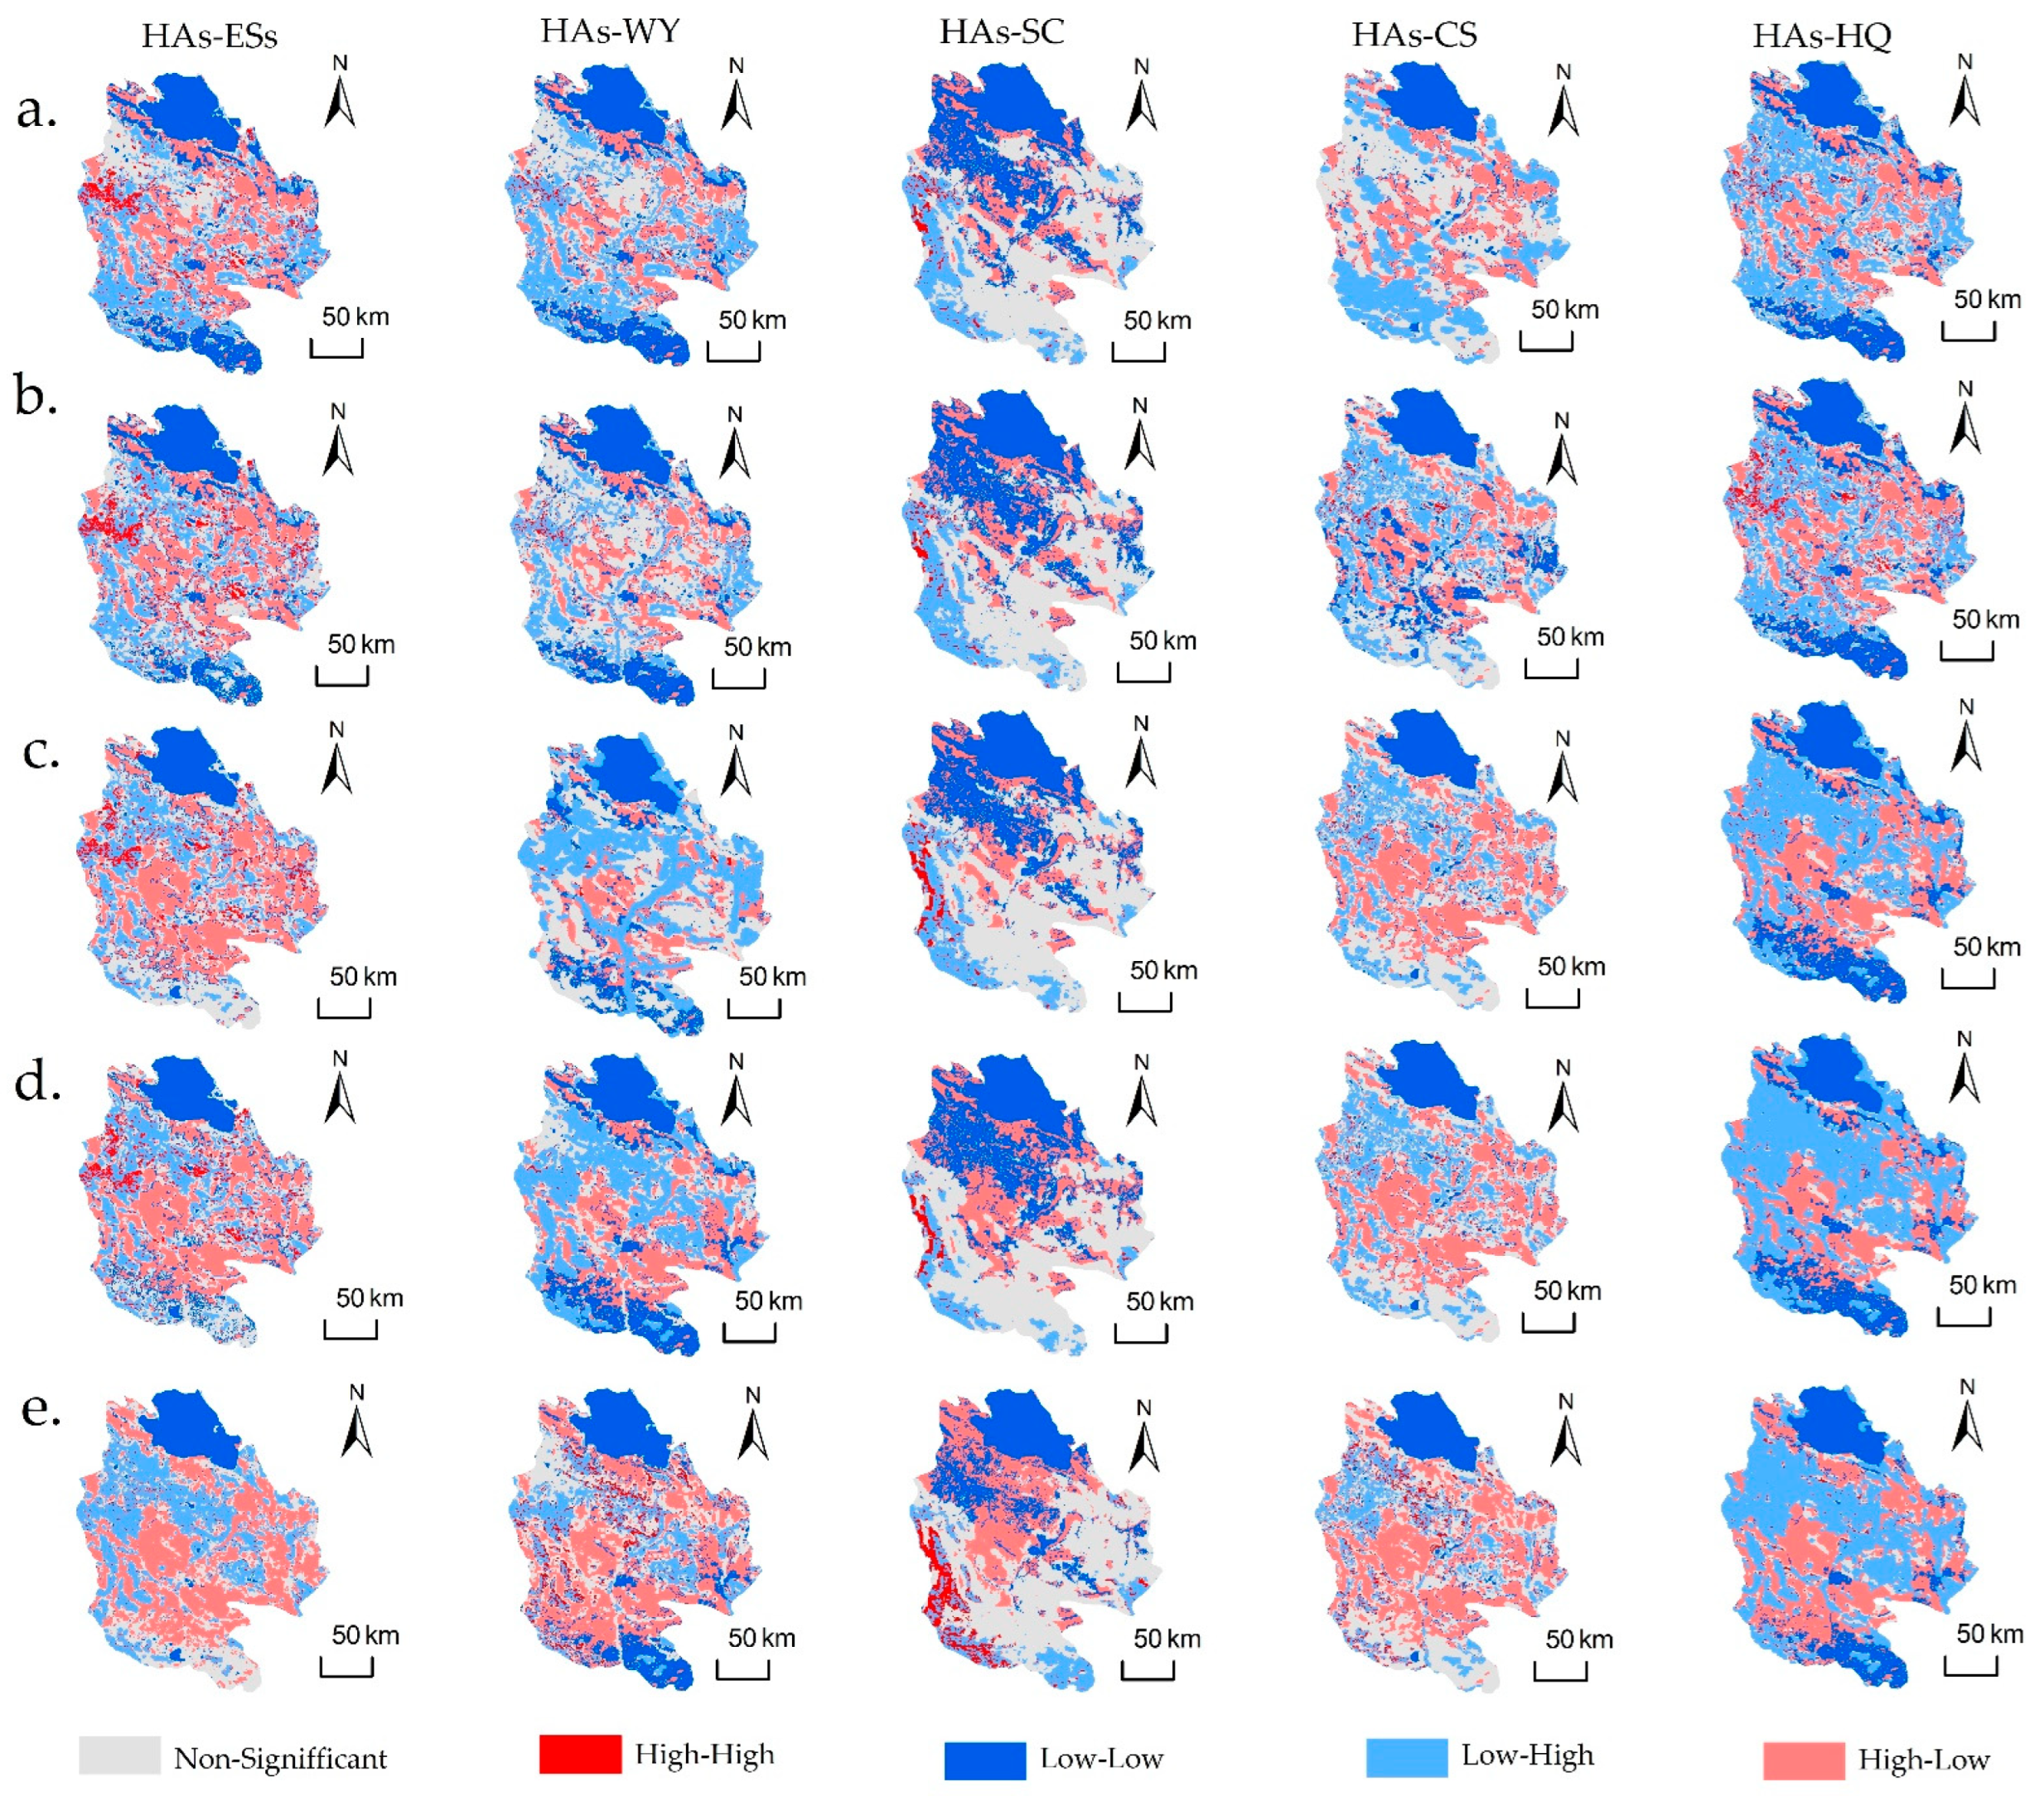
Figure 12 illustrates the local bivariate spatial autocorrelation clustering outcomes for HAs and ESs. From 2000 to 2020, the clustering relationships between HAs and ESs, excluding non-significant clusters, were primarily characterized by low-high (L-H) and high-low (H-L) clustering, with low-low (L-L) and high-high (H-H) clustering being less prominent. Specifically, L-H clustering primarily occurred in the southwestern part of Xinghai County, southern Guide County, and Gonghe County, reaching its minimum value in 2010 and showing a characteristic pattern of first decreasing and then rising. The land cover categories in these areas are predominantly grassland and unused land, reflecting the strong natural recovery capacity of the ecosystem and indicating that ESs in these regions are well-maintained under low HA interference. H-L clustering was mainly observed in the northern Qinghai Nanshan area of Gonghe County, northeastern Xinghai County, northern Tongde County, and central parts of Guide and Guinan counties. It reached its minimum value in 2010, peaked in 2015, and showed an overall increasing trend. Cultivated land, construction land, and forest areas constitute these locations’ main land use categories, revealing an intensifying negative impact of HAs disturbance on ecosystem functionality. This suggests that the capacity of ESs in these regions of the Gonghe Basin has not kept pace with the HAI, posing risks of ecological degradation and resource overexploitation. L-L clustering was concentrated in the Qinghai Lake area of Gonghe County and sporadically distributed in unused and degraded grassland areas of Guinan, Xinghai, and Tongde County, indicating that the capacity of ESs in these regions is largely constrained by natural conditions, with relatively minor impacts from HAs. H-H clustering was sporadically distributed in forest and grassland areas across various counties, reflecting a good balance between HAs and ESs, suggesting that both the demand from HAs and the capacity of ESs are improving simultaneously. Non-significant clustering was mainly observed in southwestern Gonghe County and southern Tongde County, indicating a relatively uniform spatial distribution of HAs and ESs without significant clustering or partitioning.
From the local bivariate spatial autocorrelation distribution between HAs and individual ESs, excluding non-significant clusters, the clustering relationships between HAs and WY, SC, CS, and HQ exhibit distinct characteristics and significant spatial heterogeneity. The clustering between HAs and WY is predominantly L-H, with these areas mainly distributed in southwest Gonghe County, west Xinghai and southern Guide County, where the primary terrestrial cover types are forest and grassland. The clustering between HAs and SC is predominantly non-significant clusters and L-L. The non-significant aggregation is primarily observed in the central part of Tongde County, the eastern part of Guinan County and the western part of Guide County, indicating a relatively uniform spatial distribution of HAs and SC. L-L clustering is mainly distributed in the northwest basin of Gonghe County and Qinghai Lake area, which is dominated by unused land and water area. HAs and CS services are mainly L-H aggregation and H-L aggregation. L-H aggregation is mainly distributed in the southwest of Xinghai County and the south of Tongde County. The area has high grassland and forest land coverage, less human activity interference, and strong carbon sequestration capacity. H-L aggregation is distributed in the southeast of Gonghe County, the middle of Guide County, Xinghai County and the north of Tongde County. The intensity of human activities in this area is high, the vegetation coverage is low, and the carbon sequestration capacity is weak. The non-significant aggregation was mainly distributed in Xinghai County, the south of Tongde County, and the northwest of Gonghe County. The clustering between HAs and HQ is predominantly L-H, predominantly located in lower elevation zones characterized by forest and grassland across various counties. In these regions, HAs and ESs are well-coordinated, resulting in higher HQ.
Based on the spatial clustering analysis of HAs and ESs in the Gonghe Basin from 2000 to 2020, this study obtained a differentiated management and control strategy for the partition: L-H aggregation area is divided into ecological core protection area; H-L aggregation area is used as an ecological restoration priority area; the L-L aggregation area is listed as an ecological conservation experimental area; and the H-H aggregation area is built as an ecological-economic coordination area. These results can provide a scientific basis for the sustainable development of social economy and the construction of ecological civilization in high-altitude basins.

4. Discussion

Gonghe Basin, characterized by its diverse and complex ecosystem types, is an ecologically significant priority region for biological diversity protection on the QTP and a significant region for the aggregation of industries such as plateau agriculture and animal husbandry, mineral resources and energy development, and tourism services. This study analyzed changes in HAI and characterized the spatial-temporal patterns of diverse ESs in the Gonghe Basin thus revealing the spatial clustering characteristics and interrelationships between HAs and ESs. The findings provide a scientific basis for the socioeconomically sustainable development and the construction of an ecological civilization highland in the high-altitude basins of the QTP.

4.1. Reconstruction of HA Types and Intensity

In response to the unique ecological and resource endowment characteristics of the Gonghe Basin, this study first proposed a composite carrier classification method for HA types, reconstructed localized HAI coefficients, and enhanced the regional adaptability of HAI assessment. This provides a reference for quantifying HAI on the QTP. Specifically, this study established a localized HA classification system, incorporating tourism service activities, energy development activities, and environmental supervision activities, thereby more comprehensively reflecting the multidimensional impacts of HAs. Compared to existing studies, this research breaks through the limitations of single-carrier classifications and introduces a composite carrier classification method for HA types, effectively highlighting the typological characteristics of HAs in the Gonghe Basin. For example, tourism service activities were defined as composite carriers of grassland, forest, and lakes/rivers; energy development activities were linked to grassland, reservoirs/ponds, and unused land; and environmental supervision activities were associated with forest, grassland, and water bodies. This classification better aligns with the interaction characteristics between HAs and natural resources in high-altitude regions, addressing the shortcomings of existing studies in regional applicability. Furthermore, this study localized the revision of HAI coefficients, constructing intensity coefficients suitable for high-altitude basins, thereby providing a reference for the quantitative assessment of energy development activities, tourism activities, and environmental supervision activities in such regions. For example, tourism service activities, centered around resource-rich areas such as the southern Qinghai Lake and central Guide County, have been promoted through policy guidance, forming medium- to high-intensity HA clusters and driving the continuous development of the tourism industry [31]. However, this may also have negative impacts on ecosystems. For instance, tourism infrastructure construction could lead to vegetation destruction and habitat fragmentation. In this study, areas with high tourism service activity intensity, for instance the southern shore of Qinghai Lake, partially overlapped with regions of low HQ, and the central part of Guide County experienced a decline in SC capacity from 2015 to 2020, both of which may be related to the increasing potential pressure of tourism development on ecosystems. The significant improvement in ESs such as SC, CS, and HQ from 2005 to 2015 is largely attributed to the ecological synergies of local energy development activities [58]. However, the construction of photovoltaic parks may occupy grassland and unused land, and the slight decline in CS and HQ after peaking in 2015. Due to the spatial overlap effect between photovoltaic panels and underlying land cover, it may affect the change in ecosystem services in the region, which in turn affects the CS service capability. Environmental supervision activities, characterized by multi-carrier collaborative management, protect the ecological environment through spatial control and dynamic monitoring [59]. For example, areas with high environmental supervision activity intensity, such as Xinghai County, southwestern Gonghe County, and southern Tongde County, overlap with regions of high CS and HQ, reflecting the positive impact of regulatory measures on ecosystems.

4.2. Analysis of ES Correlations and Influencing Factors

Ecosystem services provide direct or indirect benefits to humans, with systematic evaluation of these benefits carrying heightened importance in high-altitude fragile ecosystems such as the QTP. This study clarifies the spatial-temporal variations in ES distribution patterns and evolutionary trajectories while examining their interrelationships and synergies. Specifically, WY and SC in the Gonghe Basin exhibited consistency in spatial distribution but a complementary relationship in temporal changes. Between 2000 and 2010, the positive correlation between WY and SC gradually weakened, shifting to a weak negative correlation, which later turned positive again by 2020 (Figure 10). The decline in WY was attributed to reduced precipitation, while the increase in SC may be related to policies such as grazing prohibition and vegetation restoration. The recovery of WY from 2010 to 2020 was likely associated with increased precipitation and ecological restoration, whereas the decline in SC may have been caused by extreme climate events or localized development activities. Other ES indexes consistently showed positive correlations. In 2000, the maximal synergistic effect between CS and HQ, while in 2020, the minimal synergy was recorded between SC and HQ. High-value zones were mainly concentrated in areas with dense vegetation growth and low HA interference, such as Xinghai County, southern Tongde County, and eastern Guide County, indicating that areas with high vegetation coverage possess strong CS and biodiversity support capabilities (Figure 12). These changes may also be closely related to the application of ecosystem management policies such as grazing prohibition and vegetation restoration [51]. Through the analysis of the spatiotemporal evolution of four individual ESs in the Gonghe Basin, this study concludes that the dominant type of ES in the region is CS, which is likely strongly correlated with the current land use patterns, as the Gonghe Basin is predominantly covered by grassland and forest.

4.3. Regional Management Recommendations Based on Response Relationships

The study results of both the Spearman correlation analysis and bivariate spatial autocorrelation demonstrated an inverse relationship between HAs and ESs in the Gonghe Basin, with an overall increasing trend over time (Figure 10 and Figure 11). The difference lies in the fact that the absolute values of correlation coefficients derived from Spearman correlation analysis are generally higher than those from bivariate spatial autocorrelation. This is because Spearman correlation analysis focuses more on capturing the overall monotonic relationship between two variables, while bivariate spatial autocorrelation considers spatial interdependencies. The changes in negative correlation values between HAs and ESs from 2000 to 2020 suggest that the increase in HAs may be accompanied by overexploitation and utilization of natural resources, leading to changes in ES functions. The Gonghe Basin still faces challenges in achieving sustainable development, necessitating the formulation of effective policies and the implementation of precise management measures. Therefore, based on the spatial heterogeneity of ESs to HAs, this study proposes zonal collaborative management recommendations: L-H clustering areas (Figure 12) should be designated as ecological core protection zones to maintain the high value of ESs and prevent increased HA interference. For example, in southwestern Xinghai County and southern Guide County, strict grass-livestock balance policies should be implemented, limiting overgrazing and promoting rotational and seasonal grazing bans to enhance natural recovery [57,58]. H-L clustering areas (Figure 12) should be prioritized for ecological restoration, reducing HA intensity and rehabilitating degraded ecosystems. For instance, in the northern cultivated land concentration area of Gonghe County, water-saving irrigation technologies should be promoted, and the disorderly expansion of construction land should be restricted. In the central sandy area of Guinan County, photovoltaic sand control should be implemented, using photovoltaic panel coverage to reduce surface evaporation and promote natural vegetation recovery [59]. L-L clustering areas (Figure 12) should be designated as ecological conservation experimental zones to improve natural conditions and enhance the baseline service capacity of ecosystems. Drought-resistant shrubs should be planted in unused land to enhance surface resistance to wind erosion, and climate-adaptive restoration should be conducted while limiting disturbances. H-H clustering areas (Figure 12) belong to ecological-economic coordination zones, where the positive interaction between HAs and ESs should be maintained, and sustainable development models should be explored. For example, in the southern forest area of Tongde County, understory economies such as medicinal herb cultivation and mushroom farming could be developed to balance resource utilization and ecological protection. In the grassland areas of Xinghai County, the “pasture-photovoltaic complementarity” model should be promoted, integrating energy production with livestock farming [23]. In summary, regional management of the Gonghe Basin can achieve deep coordination between HAs and ESs through zonal control, ecological restoration, dynamic monitoring, and policy synergy.

4.4. Limitations

In terms of the connotation of HAI, the existing research does not cover some key HA types. For example, due to data availability limitations and research scale constraints, transportation activities were not included, which may lead to biases in HAI assessments. Future refined studies should incorporate factors such as transportation activities to continuously refine the evaluation of HAI. In terms of ES types, because of the availability of data, this study only selected four indexes—WY, SC, CS, and HQ—and thus did not comprehensively cover the multiple ESs in the Gonghe Basin. Current understanding of the interactions between various ecosystem services in the area is still partial and lacks exhaustive evaluation [60], and the omission of representative service types may lead to biased research results. Future studies should select more diverse service types based on regional characteristics for a more comprehensive analysis [61]. Considering the limitations in the time series and model, the current study on the interrelationships among ESs in the Gonghe Basin only analyzed data from five timepoints (2000, 2005, 2010, 2015, and 2020); thus, adynamic analysis of long-term continuous time series remains lacking. This may result in inaccurate trend assessments and interference from time-lag effects. In order to solve this problem, in this study, by comparing with the data results of similar studies in the eastern QTP, such as Fan 2022 [25] and Hou 2023 [42], it is found that the change trend is consistent, and its climate and policy background are also matched with the period studied, which verifies the reliability of the conclusions of this study. Future research should utilize long-term continuous data to reduce the impact of anomalies and time-lag effects. Additionally, the application of the InVEST model in specific regions has limitations, such as scale, data accuracy, and regional applicability, which may introduce biases. Future studies should integrate multi-source data, introduce other models, and strengthen comprehensive assessments to address the limitations of the InVEST model in specific regions [33]. In order to realize the localization of parameters in this study, by referring to the research results of similar regions in the relevant literature, the parameters were compared and analyzed during the experiment, and the most consistent and stable value was selected as the parameter of this study. Therefore, the existing parameters can meet the accuracy requirements of ecosystem service assessment. Furthermore, due to the influence of data resolution and scale effect, the influence of data resolution and scale effects may reduce the accuracy of analyzing regional internal differences, potentially masking small-scale ecological processes. Future research should adopt high-resolution data and conduct comparative analyses across different scales [61,62] to reveal the interrelationships between HAI and ESs at various scales in the Gonghe Basin. This will not only serve macro-level decision-making but also guide the implementation of specific projects [63]. From the analysis of climate change and comprehensive factors, HAs are conducted within the context of the natural environment, and climate change significantly impacts ESs [64]. However, assessing the impact of climate change on ESs may face technical problems, and the responses of different elements to climate change remain uncertain [65]. Consequently, future studies should comprehensively consider multiple factors, including climate, natural environment, and socio-economic conditions, to construct more specific indicators and delve deeper into the relationships among climate change, HAs, and ecosystems [66,67].

5. Conclusions

Building upon the reconstructed human activity type and intensity indices, this investigation assessed temporal variations in HAs and critical ESs across the Gonghe Basin from 2000 to 2020 while examining their mutual interactions. Key findings include:
(1)
From 2000 to 2020, the HAI in the Gonghe Basin was mainly low-intensity, but the scope of activities continued to expand. Among them, the area of plantation activities and town construction activities of medium and high intensity increased significantly and showed a trend of spreading along the northwest-southeast axis. Tourism service activities and energy development activities of medium intensity showed local growth characteristics, while environmental supervision activities showed low intensity and wide distribution patterns.
(2)
From 2000 to 2020, the four typical ESs in the Gonghe Basin presented diverse characteristics but were also interrelated. The spatial distribution of WY and SC services exhibited of high in the east and south and diminished levels in the northwest. CS services showed a pattern of high in the south, low in the central and western regions and scattered distribution. HQ showed a distribution pattern of high in the northeast and south and low in the middle. In terms of time change, WY service showed a trend of decreasing first and then increasing, while the SC service showed the opposite trend. CS services exhibited consistent growth service generally showed an increasing trend, and HQ showed a trend of increasing first and then decreasing slowly. In general, the spatial distribution of ESs showed a pattern of high in the southeast and low in the northwest, and CS was the dominant service function of ESs in the Gonghe Basin.
(3)
HAs were negatively correlated with ESs in the Gonghe Basin and showed a trade-off relationship, with the correlation showing a trend of initially increasing and then decreasing. Primary spatial association patterns between HAs and ESs predominantly exhibited L-H and H-L clustering configurations. L-H aggregation was mainly distributed in areas dominated by grassland and unused land. H-L aggregation was mainly distributed in areas dominated by cultivated land, construction land, and forest. HAs were also negatively correlated with individual ESs. In terms of spatial aggregation, HAs and WY were mainly L-H aggregation, HAs and SC were mainly non-significant clusters and L-L, HAs and CS were mainly L-H and H-L aggregation, HAs and HQ were mainly L-H aggregation.
This study focuses on the unique geographical area of the Gonghe Basin in the QTP by revised by HAs reclassification and intensity coefficient, elucidating the spatiotemporal differentiation law of the coupling of HAs-ESs in the Gonghe Basin. The proposed control strategy provides a decision-making basis for the coordinated promotion of ecological barrier construction and green development on the QTP. Although the research has regional uniqueness, data and model limitations, its HA classification and intensity coefficient revision method and HAs-ESs coupling analysis model can provide a reference for research of more refined ecosystems in other similar regions, and even globally. Future research should build a multi-source data fusion and multi-model coupling analysis system and focus on exploring the optimization path of ecological security pattern under the dual stress of climate change and HAs in the alpine ecologically vulnerable region.

Author Contributions

Conceptualization, A.S., X.M. and X.X.; methodology, X.X. and X.M.; software, A.S. and X.M.; validation, A.S., X.M. and X.X.; formal analysis, X.X.; investigation, A.S.; resources, X.M. and Y.P.; data curation, A.S. and Y.W.; writing—original draft preparation, A.S.; writing—review and editing, A.S. and X.X.; visualization, A.S.; supervision, Y.P., H.Z., D.F. and Q.C.; funding acquisition, X.X. All authors have read and agreed to the published version of the manuscript.

Funding

This research was funded by the Second Tibetan Plateau Scientific Expedition and Research (2019QZKK0603) and the National Natural Science Foundation of China (42201027).

Data Availability Statement

The data sources and their references have been included in the manuscript.

Acknowledgments

We sincerely appreciate the constructive comments and valuable suggestions provided by the editor and anonymous reviewers. Thank you for the free data provided by various data sources.

Conflicts of Interest

The authors declare no financial or personal relationships that could be perceived as influencing the research outcomes.

References

  1. Fu, B.J.; Zhang, L.W. Land-use change and ecosystem services: Concepts, methods and progress. Prog. Geogr. 2014, 33, 441–446. [Google Scholar]
  2. Harrison, P.A.; Berry, P.M.; Simpson, G.; Haslett, J.R.; Blicharska, M.; Bucur, M.; Dunford, R.; Egoh, B.; Garcia-Llorente, M.; Geamănă, N.; et al. Linkages between biodiversity attributes and ecosystem services: A systematic review. Ecosyst. Serv. 2014, 9, 191–203. [Google Scholar] [CrossRef]
  3. Borrelli, P.; Robinson, D.A.; Fleischer, L.R.; Lugato, E.; Ballabio, C.; Alewell, C.; Meusburger, K.; Modugno, S.; Schütt, B.; Ferro, V.; et al. An assessment of the global impact of 21st century land use change on soil erosion. Nat. Commun. 2017, 8, 2013. [Google Scholar] [CrossRef] [PubMed]
  4. Fang, Z.; Ding, T.H.; Chen, J.Y.; Xue, S.; Zhou, Q.; Wang, Y.; Wang, Y.; Huang, Z.; Yang, S. Impacts of land use/land cover changes on ecosystem services in ecologically fragile regions. Sci. Total Environ. 2022, 831, 154967. [Google Scholar] [CrossRef]
  5. Huang, A.; Xu, Y.Q.; Sun, P.L.; Zhou, G.; Liu, C.; Lu, L.; Xiang, Y.; Wang, H. Land use/land cover changes and its impact on ecosystem services in ecologically fragile zone: A case study of Zhangjiakou City, Hebei Province, China. Ecol. Indic. 2019, 104, 604–614. [Google Scholar] [CrossRef]
  6. Chen, F.; Ge, X.P.; Chen, G. Spatial Different Analysis of Landscape Change and Human Impact in Urban Fringe. Sci. Geogr. Sin. 2001, 3, 210–216. [Google Scholar]
  7. Spyra, M.; Caló, N.C.; Martínez Pastur, G.J.; Lencinas, M.V.; La Rosa, D. Ecosystem service trade-offs in peri-urban landscapes: Drivers, governance obstacles and improvements. Land 2024, 13, 1061. [Google Scholar] [CrossRef]
  8. Cao, W.; Huang, L.; Xiao, T. Effects of human activities on the ecosystems of China’s National Nature Reserves. Acta Ecol. Sin. 2019, 39, 1338–1350. [Google Scholar]
  9. Yang, H.J. Assessment and Adaptive Management of Ecosystem Services in Qilian Mountain National; Lanzhou University: Lanzhou, China, 2023; p. 000029. [Google Scholar]
  10. Wang, X.Q.; Zhao, X.Y. Impacts of human activities on ecosystem services in national parks: A case study of Qilian Mountain National Park. J. Nat. Resour. 2023, 38, 966–982. [Google Scholar] [CrossRef]
  11. Cao, W.; Wu, D.; Huang, L.; Liu, L. Spatial and temporal variations and significance identification of ecosystem services in the Sanjiangyuan National Park, China. Sci. Rep. 2020, 10, 6151. [Google Scholar] [CrossRef]
  12. Xi, L.H.; Qi, Y.; Wang, H.W. Spatial pattern of ecosystem services under the influence of human activities in Qinghai Lake watershed. Glaciol. Geocryol. 2019, 41, 1254–1263. [Google Scholar]
  13. Fu, Q.; Li, B.; Hou, Y. Effects of land use and climate change on ecosystem services in Central Asia’s arid regions: A case study in Altay Prefecture, China. Sci. Total Environ. 2017, 607–608, 633–646. [Google Scholar] [CrossRef]
  14. Liang, G.; Fang, F.; Lin, Y.; Zhang, Z. Spatiotemporal Characteristics of Typical Ecosystem Services and Their Spatial Responses to Driving Factors in Ecologically Fragile Areas in Upper Yellow River, China. Chin. Geogr. Sci. 2024, 34, 674–688. [Google Scholar] [CrossRef]
  15. Zhen, H.; Ouyang, Z.Y.; Zhao, T.Q. The impact of human activities on ecosystem services. J. Nat. Resour. 2003, 1, 118–126. [Google Scholar]
  16. Wang, X.C.; Dong, X.B.; Liu, H.M.; Wei, H.; Fan, W.; Lu, N.; Xu, Z.; Ren, J.; Xing, K. Linking land use change, ecosystem services and human well-being: A case study of the Manas River Basin of Xinjiang, China. Ecosyst. Serv. 2017, 27, 113–123. [Google Scholar] [CrossRef]
  17. Qiu, Z.; Guan, Y.; Zhou, K.; Kou, Y.; Zhou, X.; Zhang, Q. Spatiotemporal analysis of the interactions between ecosystem services in arid areas and their responses to urbanization and various driving factors. Remote Sens. 2024, 16, 520. [Google Scholar] [CrossRef]
  18. Zhang, H.J.; Gao, Y.; Hua, Y.W.; Li, Y.Y.; Zhang, Y.; Liu, K. Response of a SolVES model value transfer method to different spatial scales. Acta Ecol. Sin. 2019, 39, 9233–9245. [Google Scholar]
  19. He, Z.J.; Cheng, J.H.; Liu, Y.J. Impacts of land use and climate change on ecosystem regulating services in the Qinghai-Xizang (Tibet) plateau from 1990 to 2020. Glaciol. Geocryol. 2020, 45, 1616–1628. [Google Scholar]
  20. Hopping, K.A.; Knapp, A.K.; Dorji, T.; Klein, J.A. Warming and land use change concurrently erode ecosystem services in Tibet. Glob. Change Biol. 2018, 24, 5534–5548. [Google Scholar] [CrossRef]
  21. Wang, X.F.; Yao, W.J.; Feng, X.M. Changes and driving factors of ecosystem services supply and demand on the Tibetan Plateau. Acta Ecol. Sin. 2023, 43, 6968–6982. [Google Scholar]
  22. Li, G.Y.; Jiang, C.H.; Gao, Y.; Du, J. Natural driving mechanism and trade-off and synergy analysis of the spatiotemporal dynamics of multiple typical ecosystem services in Northeast Qinghai-Tibet Plateau. J. Clean. Prod. 2022, 374, 134075. [Google Scholar] [CrossRef]
  23. Zheng, G.Q.; Li, R.J.; Luo, J.; Li, C.X.; Li, M.Y.; Zhu, H.L.; Guo, L.C. Study on ecological protection and restoration strategies of Qinghai-Tibet Plateau in the New Era: Take Qinghai province as an example. J. Nat. Resour. 2024, 39, 2783–2797. [Google Scholar] [CrossRef]
  24. Yang, H.; Xu, Y.; Wang, L.J.; Xu, L. Spatio-temporal variation of human activity intensity and its driving factors on the Qinghai-Tibet Plateau. Acta Ecol. Sin. 2023, 43, 3995–4009. [Google Scholar]
  25. Fan, X. Land Use/Cover Change and the Tradeoff and Synergy of Ecosystem Services in Ecologically Fragile Regions of Upper Yellow River: A Case Study in Hehuang Valley; China University of Geosciences: Wuhan, China, 2022; p. 000140. [Google Scholar]
  26. Wang, T.H.; Wang, X.; Qin, Y.C. Spatial-temporal correlation analysis of ecosystem services value and human activities in Danjiangkou Reservoir area. Resour. Environ. Yangtze Basin 2021, 30, 330–341. [Google Scholar]
  27. Xu, Y.; Sun, X.Y.; Tang, Q. Human activity intensity of land surface: Concept, method and application in China. Acta Geogr. Sin. 2015, 70, 1068–1079. [Google Scholar] [CrossRef]
  28. Liu, S.L.; Liu, L.M.; Wu, X.; Hou, X.Y.; Zhao, S.; Liu, G.H. Quantitative evaluation of human activity intensity on the regional ecological impact studies. Acta Ecol. Sin. 2018, 38, 6797–6809. [Google Scholar]
  29. Zhao, Y.; Zhang, W.; Li, C.; Ma, S.; Zhang, X.; Jiang, H. Disturbances brought about by human activities in relation to the eco-environment of the main stream of the Tarim River, 2000–2020. Land 2022, 11, 424. [Google Scholar] [CrossRef]
  30. Xu, Y.; Tang, H.; Wang, B.; Chen, J. Effects of land-use intensity on ecosystem services and human well-being: A case study in Huailai County, China. Environ. Earth Sci. 2016, 75, 416. [Google Scholar] [CrossRef]
  31. Chu, X.Y. Study on the Eco-Environmental Effects of Tourism Development on the Qinghai-Tibet Plateau; Zhejiang Normal University: Jinhua, China, 2020; p. 000633. [Google Scholar]
  32. Yan, E.P.; Lin, H.; Wang, G.X. Analysis of evolution and driving force of ecosystem service values in the Three Gorges Reservoir region during 1990–2011. Acta Ecol. Sin. 2014, 34, 5962–5973. [Google Scholar]
  33. Zhang, X.; Li, Y.X.; Lv, C.J. Research progress on application of ecosystem service functions based on InVEST model. Ecol. Sci. 2022, 41, 237–242. [Google Scholar]
  34. Han, B.L.; Ouyang, Z.Y. The comparing and applying Intelligent Urban Ecosystem Management System (IUEMS) on ecosystem services assessment. Acta Ecol. Sin. 2021, 41, 8697–8708. [Google Scholar]
  35. Bai, Y.; Ali, M.; Zhou, Y.; Yang, S. Quantifying marginal utilities of ecosystem services for sustainable management. J. Clean. Prod. 2024, 470, 143353. [Google Scholar] [CrossRef]
  36. Meraj, G.; Singh, S.K.; Kanga, S.; Islam, M.N. Modeling on comparison of ecosystem services concepts, tools, methods and their ecological-economic implications: A review. Model. Earth Syst. Environ. 2022, 8, 15–34. [Google Scholar] [CrossRef]
  37. Pickard, B.R.; Daniel, J.; Mehaffey, M. EnviroAtlas: A new geospatial tool to foster ecosystem services science and resource management. Ecosyst. Serv. 2015, 14, 45–55. [Google Scholar] [CrossRef]
  38. Liu, Z.F.; Tang, L.N.; Gao, L.J.; Xu, T. Research of the Application of Ecosystem Services Model. Environ. Sci. Technol. 2016, 39, 387–392. [Google Scholar]
  39. You, C.; Zhang, S.; Liu, W.; Guo, L. Localized sustainable development goals changes and their response to ecosystem services—A case of typical Southern Hilly regions in China. Land 2024, 13, 919. [Google Scholar] [CrossRef]
  40. Feng, Q.; Zhao, W.W.; Hu, X.P.; Liu, Y.; Daryanto, S.; Cherubini, F. Trading-off ecosystem services for better ecological restoration: A case study in the Loess Plateau of China. J. Clean. Prod. 2020, 257, 120469. [Google Scholar] [CrossRef]
  41. Yi, S.; Wang, H.; Xie, L.; Wang, C.; Huang, X. Spatio-temporal dynamics and drivers of ecosystem service bundles in the Altay region: Implications for sustainable land management. Land 2024, 13, 805. [Google Scholar] [CrossRef]
  42. Hou, J.K. Assessment of Ecosystem Services in the Source Area of the Yellow River and Future Multi-Scenario Simulation; Guilin University of Technology: Guilin, China, 2023; p. 000158. [Google Scholar]
  43. Liu, M.J.; Zhong, J.T.; Wang, B.; Mi, W.B. Spatiotemporal change and driving factor analysis of the Qinghai Lake Basin based on InVEST model. Geogr. Sci. 2023, 43, 411–422. [Google Scholar]
  44. Zhang, L.; Dawes, W.R.; Walker, G.R. Response of mean annual evapotranspiration tovegetation changes at catchment scale. Water Resour. Res. 2001, 37, 701–708. [Google Scholar] [CrossRef]
  45. Wang, L.X.; Gao, J.X.; Sheng, W.M. Identifying important areas for soil and water conservation in China based on ecological donor-receptor theory. China Environ. Sci. 2020, 40, 5413–5421. [Google Scholar]
  46. Wu, C.Y.; Cao, G.C.; Chen, K.L. A soil conservation service dataset for Gansu-Yellow River Basin from 2001 to 2015. Plateau Meteorol. 2024, 3, 802–808. [Google Scholar]
  47. Chen, C.L.; Zhao, G.J.; Mu, X.M.; Tian, P.; Liu, L.K. Spatial-temporal change of soil erosion in Huangshui watershed based on RUSLE model. J. Soil Water Conserv. 2021, 35, 7. [Google Scholar]
  48. Jiang, Y.; Alifujiang, Y.; Feng, P.; Yang, P.; Feng, J. A simulated assessment of land use and carbon storage changes in the Yanqi Basin under different development scenarios. Land 2024, 13, 744. [Google Scholar] [CrossRef]
  49. Yan, L.; Cao, G.C.; Kang, L.G. Analysis of spatial and temporal changes in habitat quality and driving factors in Gonghe County using the InVEST Model. Arid Zone Res. 2024, 41, 314–325. [Google Scholar]
  50. Shang, Y.; Wang, D.; Liu, S.; Li, H. Spatial-temporal variation and mechanisms causing spatial differentiation of ecosystem services in ecologically fragile regions based on value evaluation: A Case study of western Jilin, China. Land 2022, 11, 629. [Google Scholar] [CrossRef]
  51. An, Q.; Yuan, X.; Zhang, X.; Yang, Y.; Chen, J.; An, J. Spatio-temporal interaction and constraint effects between ecosystem services and human activity intensity in Shaanxi Province, China. Ecol. Indic. 2024, 160, 111937. [Google Scholar] [CrossRef]
  52. Peng, J.; Tian, L.; Liu, Y. Ecosystem services response to urbanization in metropolitan areas: Thresholds identification. Sci. Total Environ. 2017, 607–608, 706–714. [Google Scholar] [CrossRef]
  53. Jing, H.C.; Liu, Y.H.; He, P. Spatial heterogeneity of ecosystem services and it’s influencing factors in typical areas of the Qinghai-Tibet Plateau: A case study of Nagqu City. Acta Ecol. Sin. 2022, 42, 2657–2673. [Google Scholar]
  54. Pang, C.Y.; Wen, Q.; Ding, J.M. Ecosystem services and their trade-offs and synergies in the upper reaches of the Yellow River basin. Acta Ecol. Sin. 2024, 12, 1–11. [Google Scholar]
  55. Xu, X.R.; Xu, Y. Analysis of spatial-temporal variation of human activityintensity in Loess Plateau region. Geogr. Res. 2017, 36, 661–672. [Google Scholar]
  56. Li, S.C.; Zhang, C.Y.; Liu, J.L. The tradeoffs and synergies of ecosystem services: Research progress, development trend, and themes of geography. Geogr Res. 2013, 32, 1379–1390. [Google Scholar]
  57. Wang, Y.W.; Ma, Y.Y.; Shi, P.J.; Zang, G.F. The impact of photovoltaic power plant operation on local ecological environments in arid areas. Arid Zone Res. 2024, 41, 1423–1433. [Google Scholar]
  58. Su, C.; Fu, B.; Wei, Y. Ecosystem management based on ecosystem services and human activities: A case study in the Yanhe watershed. Sustain. Sci. 2011, 7, 17–32. [Google Scholar] [CrossRef]
  59. Wang, Y.Q.; Xue, H.J.; Li, A.Q.; Ma, X.F.; Sun, A.L.; Zhang, J.H. Spatial-temporal differentiation and influencing factors of ecosystem health in Three-River-Source National Park. Ecol. Indic. 2025, 171, 113183. [Google Scholar] [CrossRef]
  60. Xia, H.; Yuan, S.; Prishchepov, A.V. Spatial-temporal heterogeneity of ecosystem service interactions and their social-ecological drivers: Implications for spatial planning and management. Resour. Conserv. Recycl. 2023, 189, 106767. [Google Scholar] [CrossRef]
  61. Lu, N.; Wang, M.; Ning, B.; Yu, D.; Fu, B. Research advances in ecosystem services in drylands under global environmental changes. Curr. Opin. Environ. Sustain. 2018, 33, 92–98. [Google Scholar] [CrossRef]
  62. Zhao, X.Y.; Ma, P.Y.; Li, W.Q. Spatioemporal changes of supply and demand relationships of ecosystem services in the Loess Plateau. Acta Geogr. Sin. 2021, 76, 2780–2796. [Google Scholar]
  63. Fang, J.; Song, H.; Zhang, Y.; Li, Y.; Liu, J. Climate-dependence of ecosystem services in a nature reserve in northern China. PLoS ONE 2018, 13, e0192727. [Google Scholar] [CrossRef]
  64. Torres, A.V.; Tiwari, C.; Atkinson, S.F. Progress in ecosystem services research: A guide for scholars and practitioners. Ecosyst. Serv. 2021, 49, 101267. [Google Scholar] [CrossRef]
  65. Shen, J.S.; Li, S.C.; Liang, Z. Research progress and prospect for the relationships between ecosystem services supplies and demands. J. Nat. Resour. 2021, 36, 1909–1922. [Google Scholar] [CrossRef]
  66. Cord, A.F.; Bartkowski, B.; Beckmann, M.; Dittrich, A.; Hermans-Neumann, K.; Kaim, A.; Lienhoop, N.; Locher-Krause, K.; Priess, J.; Schröter-Schlaack, C.; et al. Toward systematic analyses of ecosystem service trade-offs and synergies: Main concepts, methods and the road ahead. Ecosyst. Serv. 2017, 28, 264–272. [Google Scholar] [CrossRef]
  67. Li, T.; Feng, W.; Lü, Y.; Ma, L.; Liu, Y.; Luo, Y.; Liang, H. Quantifying impacts of livestock production on ecosystem services: Insights into grazing management under vegetation restoration. J. Clean. Prod. 2024, 470, 143359. [Google Scholar] [CrossRef]
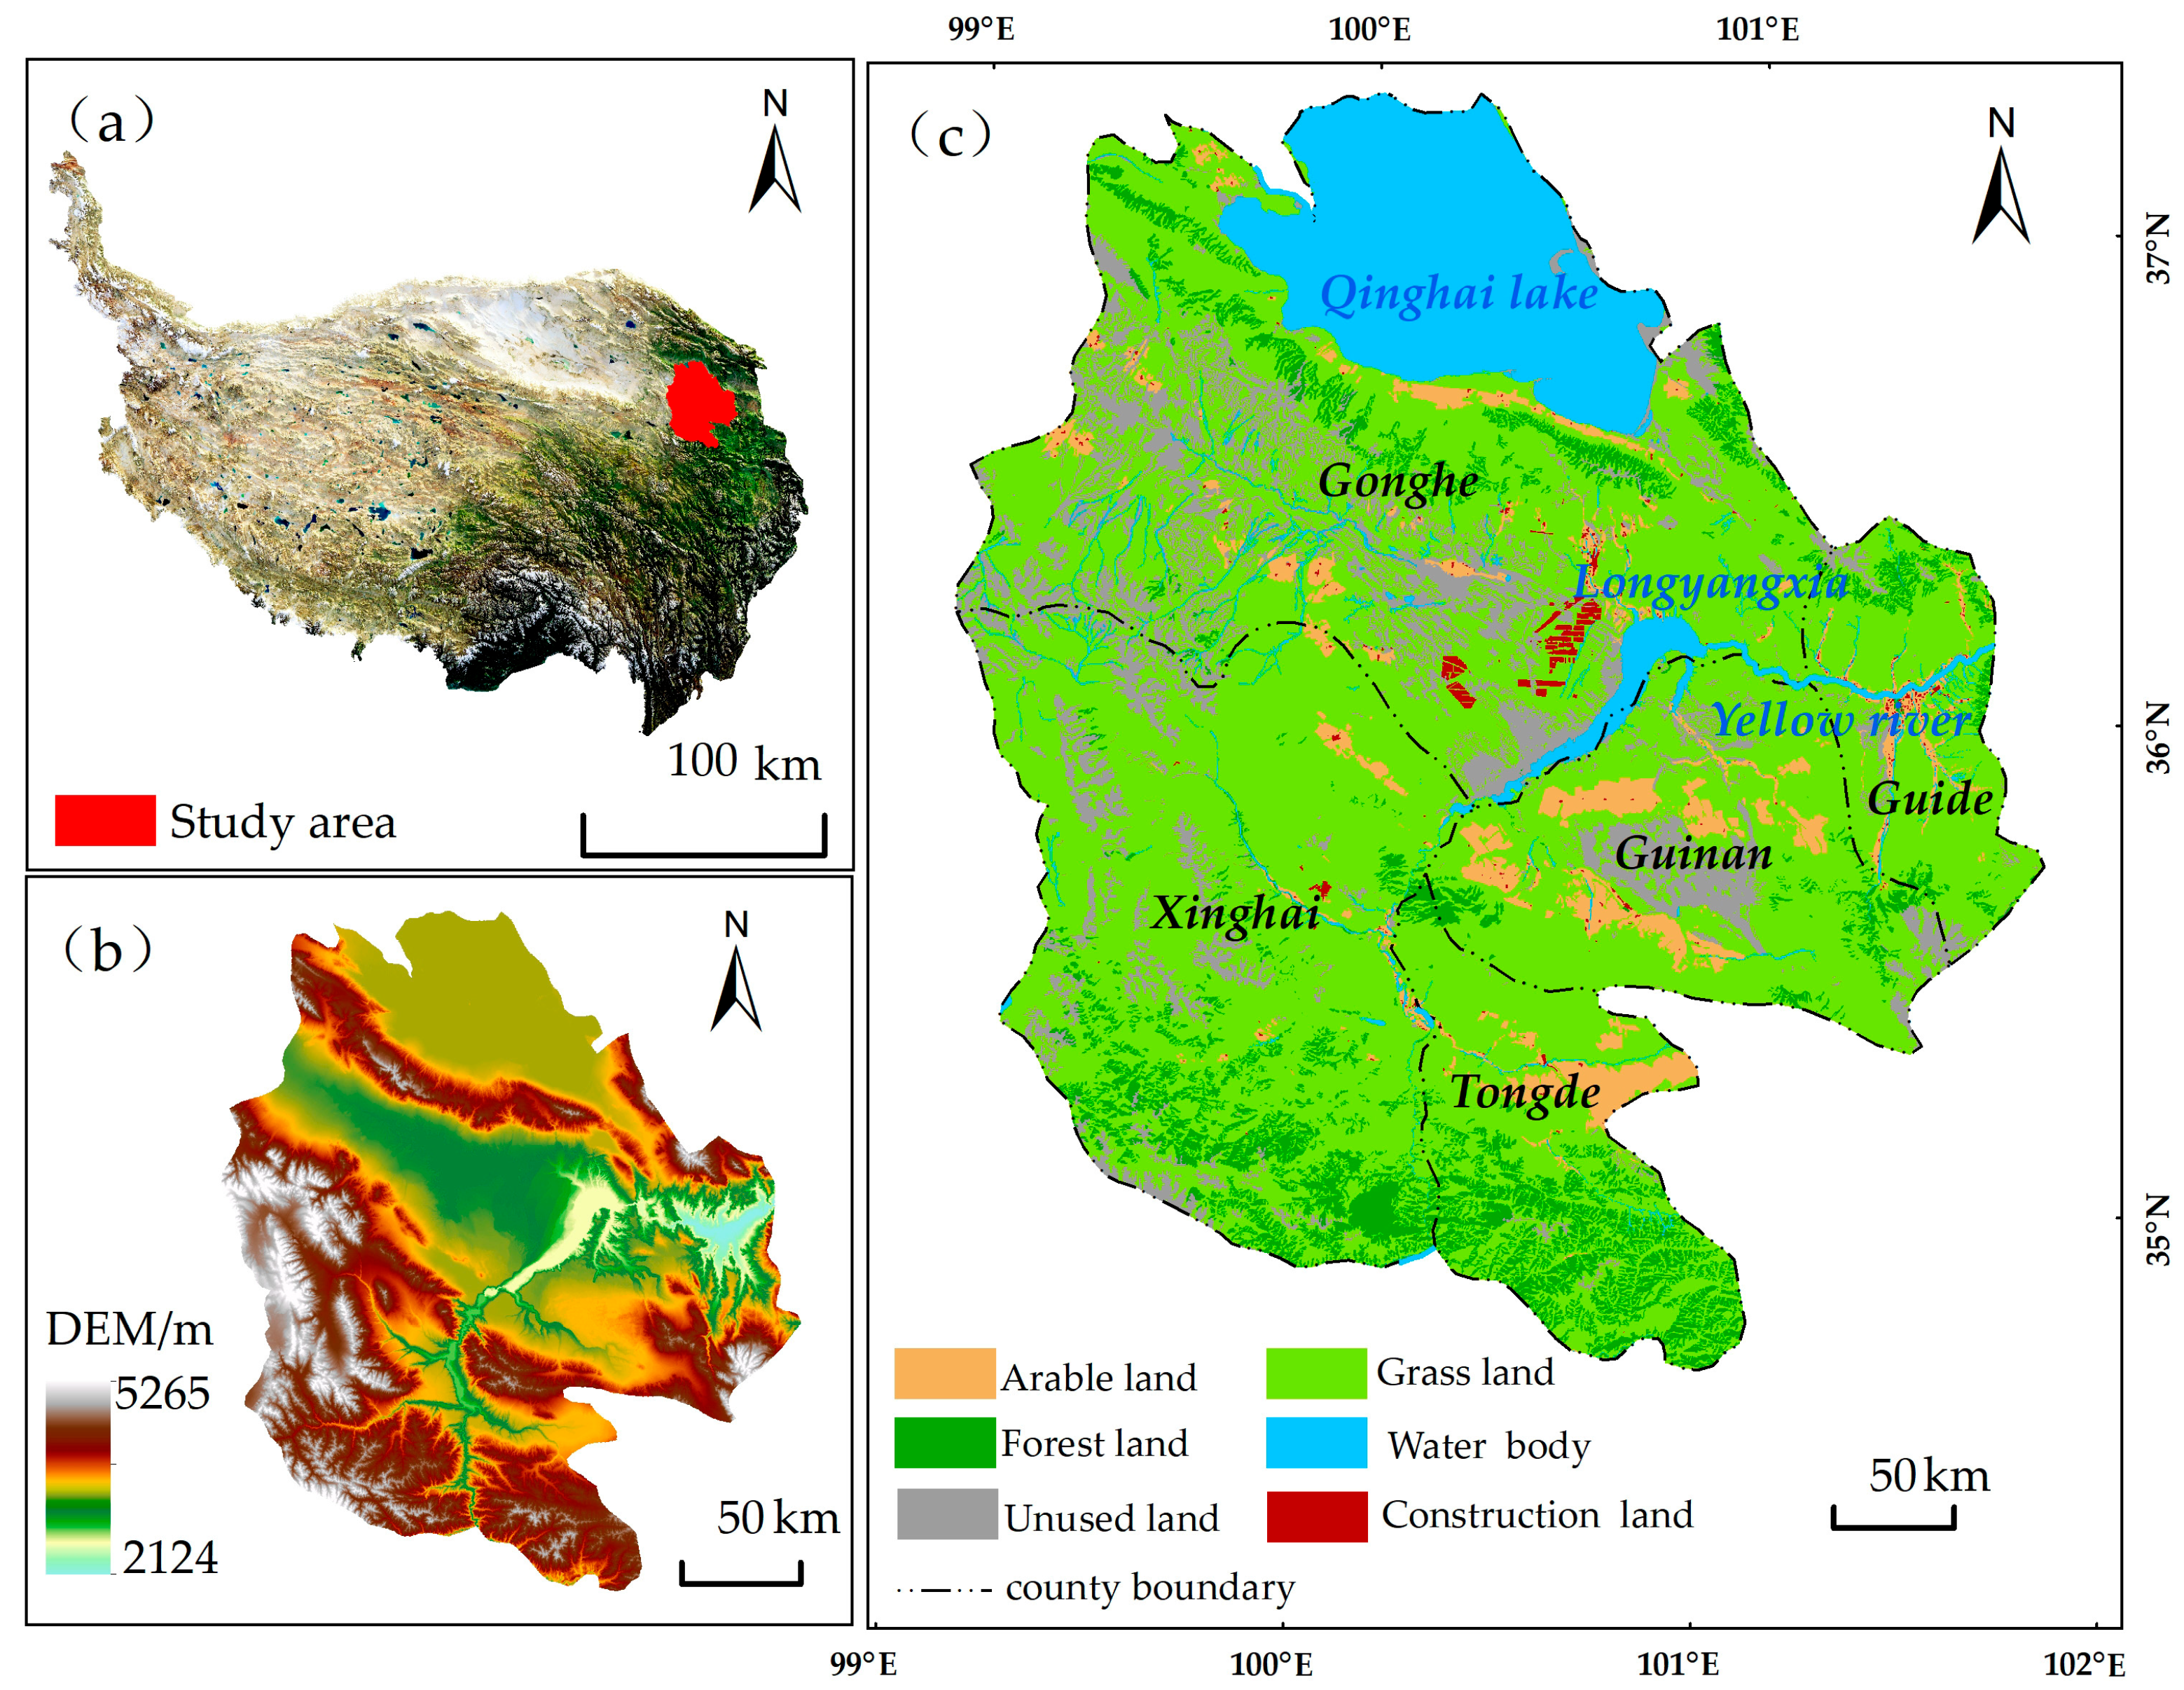
Figure 1. Overview of the study area. (a) Location of Gonghe Basin on the QTP. (b) Topography and geomorphology of Gonghe basin. (c) Land use type of Gonghe basin.
Land 14 01350 g001
Figure 2. Reclassification of HAs and Revision of HAII [6,10,12,24,31,32].
Land 14 01350 g002
Figure 3. Changes in the main human activity types in Gonghe Basin. (a) 2000. (b) 2005. (c) 2010. (d) 2015. (e) 2020.
Land 14 01350 g003
Figure 4. Temporal and spatial variation in HAI in Gonghe Basin. (a) 2000. (b) 2005. (c) 2010. (d) 2015. (e) 2020. (f) Total HAI change trend from 2000 to 2020.
Land 14 01350 g004
Figure 5. Temporal and spatial variation in water supply service in Gonghe Basin represented by WY. (a) 2000. (b) 2005. (c) 2010. (d) 2015. (e) 2020. (f) Total WY change trend from 2000 to 2020.
Land 14 01350 g005
Figure 6. Temporal and spatial variations in SC in Gonghe Basin. (a) 2000. (b) 2005. (c) 2010. (d) 2015. (e) 2020. (f) Total SC change trend from 2000 to 2020.
Land 14 01350 g006
Figure 7. Temporal and spatial variation in CS in Gonghe Basin. (a) 2000. (b) 2005. (c) 2010. (d) 2015. (e) 2020. (f) Total CS change trend from 2000 to 2020.
Land 14 01350 g007
Figure 8. Temporal and spatial variation in HQ in Gonghe Basin. (a) 2000. (b) 2005. (c) 2010. (d) 2015. (e) 2020. (f) Total HQ change trend from 2000 to 2020.
Land 14 01350 g008
Figure 9. Temporal and spatial variations in ESs in Gonghe Basin. (a) 2000. (b) 2005. (c) 2010. (d) 2015. (e) 2020. (f) Total ESs change trend from 2000 to 2020.
Land 14 01350 g009
Figure 10. Correlation between HAs and ESs, 2000–2020. (a) 2000. (b) 2005. (c) 2010. (d) 2015. (e) 2020. (f) HAs-ESs trend from 2000 to 2020.
Land 14 01350 g010
Figure 11. Bivariate autocorrelation of ESs and HAs, 2000–2020. (a) 2000. (b) 2005. (c) 2010. (d) 2015. (e) 2020. (f) 2000–2020 trend.
Land 14 01350 g011
Figure 12. Distribution and significance level of localized bivariate spatial autocorrelation of HAs and ESs. (a) 2000. (b) 2005. (c) 2010. (d) 2015. (e) 2020.
Land 14 01350 g012
Table 1. Data sources and descriptions.
Data TypeData NameData CharacteristicsSource of Data
Remote sensing imageLandsat TM imageryRasterGeospatial data cloud (http://www.gscloud.cn/ (accessed on 16 October 2024))
Land use/coverChina land cover raster dataRasterData Center for Resources and Environmental Sciences, Chinese Academy of Sciences (http://www.resdc.cn/ (accessed on 16 October 2024))
Meteorological
data
China’s 1 km resolution annual precipitation data
China’s 1 km resolution monthly potential evapotranspiration dataset
RasterNational Earth System Science Data Center (http://www.geodata.cn/ (accessed on 16 October 2024))
Soil dataSpatial distribution data of world soil typesRasterWorld Soil Database
(https://www.fao.org/soils-portal/ (accessed on 16 October 2024))
Topographic and geomorphologic data Digital Elevation Model (DEM)RasterGeospatial spatial data cloud
(http://www.gscloud.cn/ (accessed on 16 October 2024))
Administrative boundaries2020 edition of administrative division map of national basic geographic information databaseShpNational fundamental geographic databases (https://www.webmap.cn/ (accessed on 16 October 2024))
Socio-economic
data
Hainan Tibetan Autonomous Prefecture Statistical Yearbook
Hainan Tibetan Autonomous Prefecture Statistical Bulletin
TXTHainan Tibetan Autonomous Prefecture People’s Government (https://www.hainanzhou.gov.cn/ (accessed on 16 October 2024))
Hainan Tibetan Autonomous Prefecture Statistical Bulletin
Table 2. Parameters for the Water Yield module of the InVEST model by land use type.
Land Use TypeLand Use Code Vegetation Coefficient Root Depth Evapotranspiration Coefficient (Kc)
Arable land1121000.7
Forest Land2152000.9
Grassland3126000.6
Water body40−10.8
Construction land50−11
Unused land60−11
Table 3. C and P Factors for Different Land Use Types.
Land Use TypeArable LandForest LandGrasslandWater BodyConstruction LandUnused Land
C Factor0.30.160.05011
P Factor0.30.040.100.011
Table 4. Carbon storage values across land cover categories.
Land Use TypeC_AboveC_BelowC_Soil C_Dead
Arable land5.442.57123.831.24
Forest Land37.3615.60300.703.05
Grassland8.587.24205.220.36
Water body0.930.6682.201.23
Construction land3.292.1178.200.00
Unused land0.750.9856.500.00
Table 5. Weights, maximum impact distances, and decay types of threat factors.
Threat FactorMaximum Impact Distance (km)WeightSpatial Decay Type
Arable land40.7Linear
Construction land70.7Exponential
Unused land60.5Linear
Table 6. Habitat suitability of land use types and their sensitivity to threat factors.
Land Use TypeLand Use CodeSuitabilityArable LandConstruction LandUnused Land
Arable land10.30.10.60.3
Forest Land210.40.70.5
Grassland30.70.20.60.4
Water body40.90.20.70.4
Construction land50.10.10.10.2
Unused land60.20.30.60.1
Table 7. Changes in the type of human activities in the Gonghe Basin/km2.
Type of Human Activities200020052010201520202000–2020
Plantation activities1830.811854.782100.182094.652102.671996.62
Livestock activities26,981.1026,935.8328,866.1728,745.2828,500.8228,005.84
Town construction activities85.8286.7289.4899.56134.5399.22
Tourism service activities98.49123.76199.51286.85389.87219.7
Energy development activities313.11312.08369.11426.78511.08386.43
Environmental supervision activities15,843.2815,840.1213,528.8413,499.8013,514.3314,445.27
Disclaimer/Publisher’s Note: The statements, opinions and data contained in all publications are solely those of the individual author(s) and contributor(s) and not of MDPI and/or the editor(s). MDPI and/or the editor(s) disclaim responsibility for any injury to people or property resulting from any ideas, methods, instructions or products referred to in the content.