Article

Spatial Configuration and Layout Optimization of the Ecological Networks in a High-Population-Density Urban Agglomeration: A Case Study of the Central Plains Urban Agglomeration

1
School of Business, Xinyang Normal University, Xinyang 464000, China
2
School of Business Administration, Zhongnan University of Economics and Law, Wuhan 430073, China
3
Center for Land Economics, Zhongnan University of Economics and Law, Wuhan 430073, China
*
Author to whom correspondence should be addressed.
Land 2025, 14(4), 768; https://doi.org/10.3390/land14040768
Submission received: 18 February 2025 / Revised: 29 March 2025 / Accepted: 31 March 2025 / Published: 3 April 2025
(This article belongs to the Section Landscape Ecology)

Abstract

:
The construction of ecological networks and the optimization of ecological spatial layouts are essential for maintaining regional ecological security and promoting sustainable development, especially in high-population-density urban agglomerations. This study employs the Central Plains Urban Agglomeration (CPUA) as a case study to establish an ecological network through a quantitative assessments of land use/cover change (LUCC) and ecosystem service value (ESV), utilizing the morphological spatial pattern analysis (MSPA) methods and tools such as Linkage Mapper to further optimize ecological spatial layouts. The findings reveal the following: (1) The land use structure within the CPUA experienced notable shifts. The magnitude of land use changes ranked as follows: construction land > cultivated land > grassland > waterbody > forest > bare land. (2) The southwestern mountainous and hilly regions, designated as high ESV areas, primarily rely on water conservation and soil retention functions. In contrast, the central and western regions, characterized by low ESVs, are dominated by construction land and cultivated land, and are significantly influenced by urbanization and agricultural activities. (3) An ecological network system was developed based on the region’s natural geographic features, incorporating 20 ecological sources covering approximately 21,434.70 km2, and 36 ecological corridors with a combined length of around 2795.19 km. This network extends in a north–south direction through the central and western parts of the CPUA. (4) Considering the spatial changes in land use/cover and ESVs, an optimized ecological spatial layout of “five belts, six zones, multiple clusters, and corridors” was proposed, along with differentiated restoration strategies tailored to address specific ecological issues in different regions. This study aims to harmonize regional ecological protection with economic development, providing a scientific foundation and valuable reference for ecological conservation and sustainable spatial planning policies.

1. Introduction

As a significant driver of regional economic growth, the rapid urbanization process has resulted in the steady expansion of urban areas and increasingly frequent human activities [1,2]. However, propelled by both economic growth and spatial expansion, land use patterns have undergone profound changes. The unchecked expansion of production and residential areas has drastically encroached upon ecological spaces, resulting in varying degrees of harm to the urban ecosystem structure and function, and causing the gradual fragmentation or even disappearance of critical ecological habitats such as forests, grasslands, and waterbodies [3,4]. This process has intensified a series of environmental issues, including the exacerbation of the urban heat island effect, weakened landscape connectivity, sharp declines in biodiversity, high ecological fragmentation, and the degradation of ecosystem service [5,6,7]. These challenges have sharpened the conflict between economic expansion and ecological conservation, causing an additional imbalance between human activities and the urban ecosystem [8], thereby posing a severe threat to the stability and sustainability of the ecosystems.
To mitigate the ecological pressures brought by urbanization, restore harmony between humans and nature, and achieve dual improvements in both ecological and economic benefits, an integrated strategy for ecological protection and restoration is urgently needed. Specifically, urban ecosystem structure and function should be enhanced by increasing urban green spaces, protecting natural landscapes, and restoring ecological corridors [9,10]. Simultaneously, the spatial layout of ecological spaces at the national level should be optimized to strengthen ecological connectivity and enhance the overall resilience and resistance of ecosystems [11]. Through the construction and improvement of ecological corridors, discrete ecosystems, and habitat patches, the ecological infrastructure can be organically connected to lessen the ecological degradation caused by urban expansion and to promote a dynamic balance between urbanization and ecological protection [12]. Additionally, in line with the United Nations’ 2030 Agenda for Sustainable Development, strengthening the protection and restoration of terrestrial ecosystems is needed to reduce biodiversity loss. Moreover, building scientifically sound ecological networks is essential for safeguarding biodiversity and regional ecological security [13].
In this context, as a key economic growth pole and core area for ecological security strategy, the Central Plains Urban Agglomeration (CPUA) plays a pivotal role in advancing the national ecological civilization, optimizing land use, and sustaining connectivity within the regional ecological network [14]. Compared to other urban agglomerations domestically and internationally, the CPUA’s unique spatial configuration, characterized by dense population clusters and intensive land use, places significant pressure on ecological resources while presenting opportunities for innovative ecological network optimization. According to the 13th Five-Year Plan, the CPUA is defined by a spatial layout of “core-driven, axis-driven, node-enhanced, and peripheral-docking”, and is strategically positioned where the “two horizontal and three vertical” urbanization corridors. This unique location, positioned along the land bridge and Beijing-Guangzhou corridors, serves as a vital hub for connecting regional ecosystems and promoting biodiversity conservation [15]. Currently, the CPUA is in the critical phase of upgrading and accelerating regional development. However, with the rapid pace of economic growth, the region’s land use dynamics and ecosystem service functions are facing significant challenges [16]. Therefore, a systematic analysis of the CPUA’s ecological network structure is needed, along with targeted optimization strategies to improve ecosystem stability and achieve high-quality development.
In the 1930s, German geographer Carl Troll first introduced the concept of “landscape ecology”, merging ecology with geography to explore how landscape structures influence biodiversity distribution and ecological processes. He developed the “patch-corridor-substrate” structural model, laying a crucial foundation for the formation and systematic development of ecological network theory [17,18]. By the 1980s, the concept of an ecological network was first introduced in the Outdoor Environment Report, sparking global interest and a surge of research in ecological network planning [19]. This concept aims to enhance landscape connectivity and overall ecosystem functionality by establishing organic links among ecosystem cores, ecological corridors, and patches of ecological elements. Following the 1992 signing of the United Nations’ Convention on Biological Diversity (CBD), countries began constructing ecological networks within multi-level, multi-scale, and multi-objective frameworks to promote a deeper integration of biodiversity conservation and landscape connectivity. Since then, ecological network theory has matured significantly, gaining wide application in fields such as ecology, landscape science, and geography, and emerging as a key approach for addressing ecological and environmental challenges and advancing sustainable development [20,21].
Current studies on ecological networks primarily emphasize biodiversity conservation, expansion of ecological spaces, improvement of ESV, and spatial planning to optimize ecological security patterns. A key topic in this research is constructing ecological networks that are both scientifically robust and regionally practical [22,23,24]. Most studies adopt the “ecological source-resistance surface-corridor-node-ecological network”, which quantifies the connectivity and overall functionality of landscape elements to reveal ecological effects and network stability [25,26]. Within this framework, scientifically identifying ecological sources and delineating ecological corridors are critical components of ecological network construction. Earlier studies typically selected large ecological patches or nature reserves as sources and employed the least-cost path (LCP) method to calculate potential ecological corridors. However, this approach is influenced by subjective factors and has certain limitations [27,28]. To improve identification accuracy, recent studies have gradually introduced quantitative measures like habitat importance and landscape connectivity indices, combining these with methods like ecosystem function analysis and MSPA to identify and classify ecological sources from multiple dimensions [29,30]. For example, Wang et al. (2022) used a combination of ecological stability, landscape connectivity, and habitat quality assessments to identify key ecological patches in Nanchang City and applied circuit theory to determine essential ecological corridors [31]. Similarly, Wang et al. (2019) quantified the ESV based on priority and abundance indices, integrating these with the “source-sink” theory and the minimum cumulative resistance (MCR) model to determine ecological sources and corridors with varying safety levels [32]. Additionally, creating resistance surfaces is crucial for building ecological networks, as it requires integrating multiple influencing factors to accurately reflect the spatial distribution of ecological resistance [33]. Most studies model the resistance that organisms may encounter when traversing landscapes by integrating variables like land use, nighttime lighting, and human activities, revealing the complexity of ecological connectivity and interactions among ecological processes [34,35]. This enables a more systematic identification of the overall impact of human activities—such as habitat fragmentation and infrastructure development—on resistance factors. In summary, with the continuous improvement of research methods and models, identifying ecological sources has progressed from a simple patch selection to a systematic process based on multi-dimensional quantitative assessments. The development of resistance surfaces and approaches for identifying ecological corridors have also become increasingly diversified, providing a scientific basis for building and refining complex ecological networks [36].
An effectively designed ecological network is not only a key mechanism for promoting the flow of matter and energy within ecosystems, but also a crucial pathway for enhancing the ESV [37]. The scientifically planned and optimized ecological network structure helps maintain its functionality and stability, advancing regional sustainable development [38]. For optimizing ecological network layouts, some studies have proposed measures such as adding ecological sources and fragmentation points [39,40,41]. Additionally, gravity models have been applied to rank ecological corridors by relative importance, providing a scientific basis for subsequent layout optimization [42]. Existing research has extensively explored ecological network construction at various scales and contexts, including cities [43], regions [44], and nature reserves [45,46], and has gradually developed an analytical framework centered on the influence of LUCC. It has been found that LUCC is a key factor influencing ecological networks, and thus, LUCC-based analyses offer a scientific basis for understanding the structural changes in ecological networks and offer theoretical support for their construction and development [47]. However, research analyzing the impact of LUCC on ecological networks from the perspective of an ESV assessment remains relatively insufficient. Incorporating service value assessments can not only improve the accuracy of identifying key nodes in the ecological network but also provide valuable data for scientific planning and management, thereby more effectively optimizing ecological networks and achieving sustainable development goals.
Although significant progress has been made in ecological network research, further exploration is needed to refine methodologies and enhance practical applications. In response, this study distinguishes itself in several key areas. First, by employing a Morphological Spatial Pattern Analysis (MSPA) and Linkage Mapper, it optimizes the spatial layout of ecological networks at the urban agglomeration scale, improving ecological connectivity analysis. Additionally, integrating a landscape connectivity analysis with gravity modeling allows for a more precise identification of ecological sources and key corridors, providing a quantitative foundation for conservation planning. Second, this study uniquely incorporates population density as a resistance factor in constructing resistance surfaces, reflecting the high-density urban characteristics of the CPUA and addressing the dual challenge of enhancing connectivity while mitigating ecological pressures from intensive human activities. Third, it proposes a customized ecological network layout tailored to the geographic and socio-economic characteristics of the CPUA, introducing a “five belts, six zones, multiple corridors” structure, strategically adapted to LUCC and ESV variations, ensuring a balance between ecological integrity and economic development. Given the CPUA’s role as a key strategic location for establishing a green development demonstration zone in central China, this study provides scientific guidance for optimizing ecological networks, serving as a reference model for ecological planning in other high-density urban agglomerations. Therefore, this study aims to (1) construct an ecological resistance surface by integrating multiple environmental and human activity factors, ensuring a comprehensive representation of landscape resistance in the CPUA; (2) identify key ecological sources and corridors using an optimized ecological network modeling approach based on circuit theory and least-cost path analysis; (3) evaluate the effectiveness of the proposed ecological network by assessing changes in landscape connectivity and ecological stability before and after optimization; (4) provide data-driven insights and policy recommendations for ecological network optimization, supporting sustainable urban development and regional ecological conservation in the CPUA. The theoretical framework of this study is shown in Figure 1.

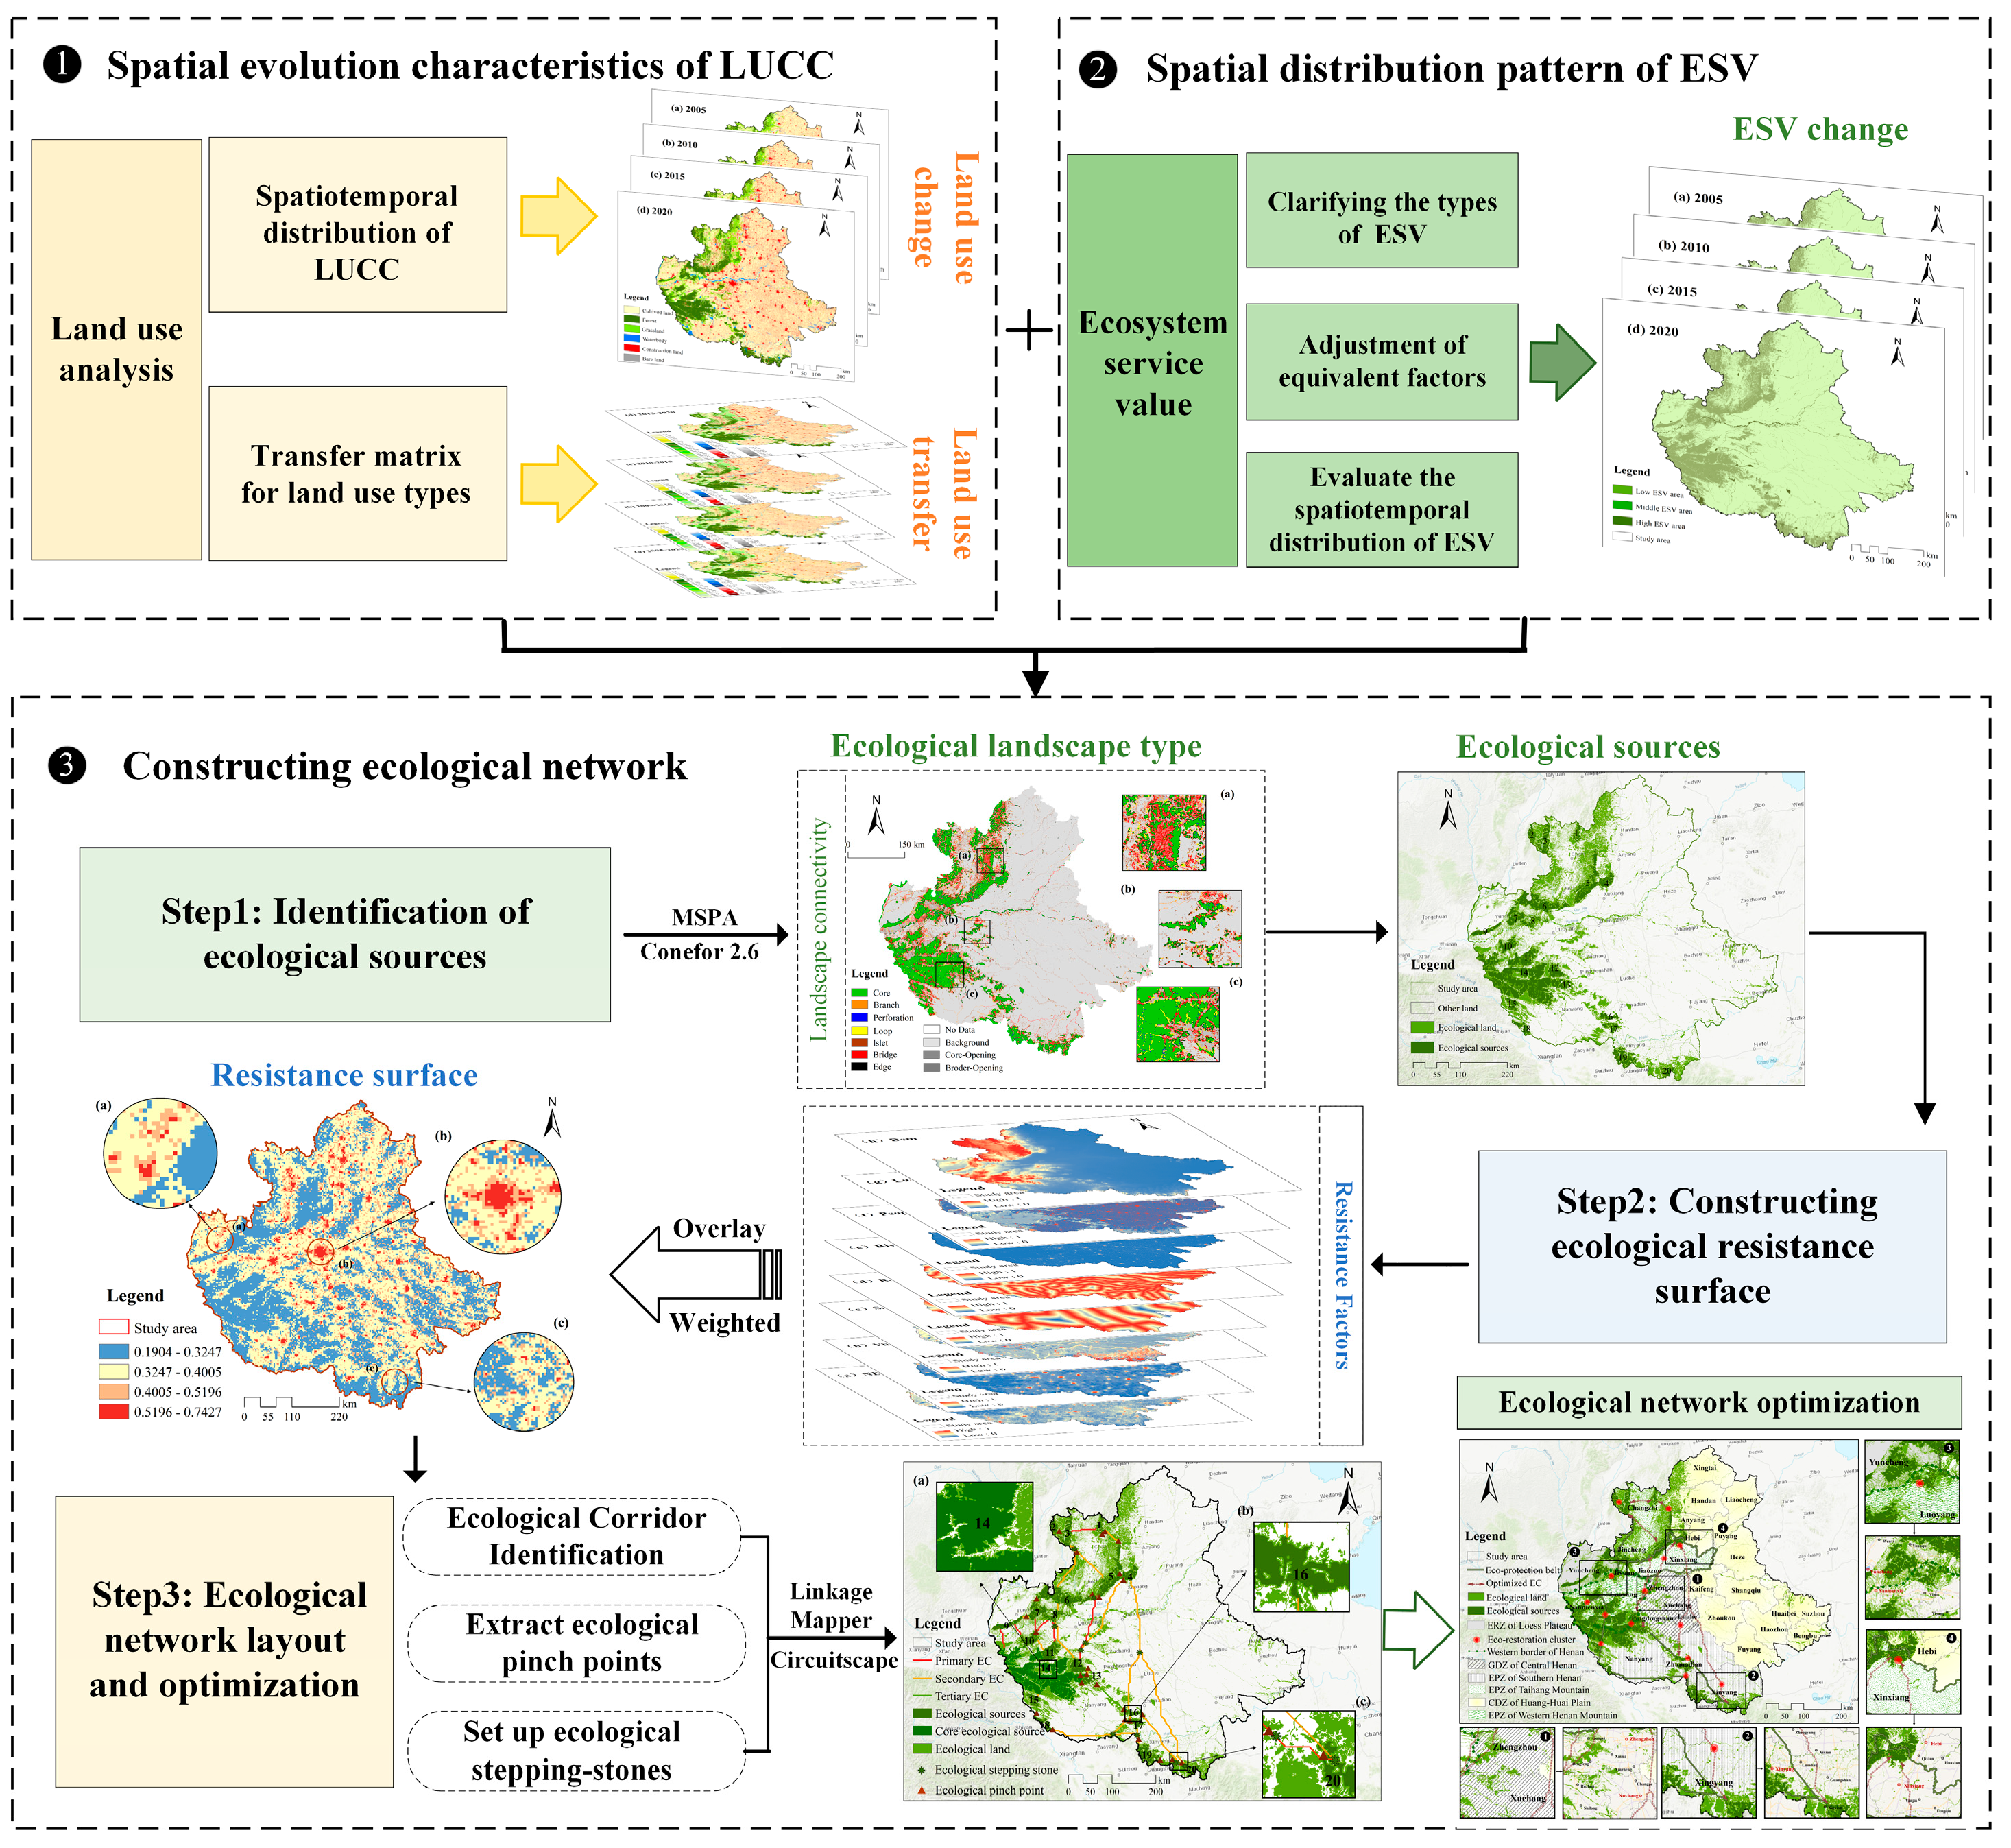
2. Materials and Methods

2.1. Study Area

The CPUA, situated in central-eastern China and spanning the middle to lower reaches of the Yellow River, is one of the largest and most promising urban agglomerations. As a critical growth pole for China’s economy, the CPUA is strategically positioned within the urbanization strategy, offering significant locational advantages. It serves as a key hub for facilitating industrial transfer from central areas and resource output from the western region. Moreover, it serves as a fundamental component in the spatial pattern of the “5 + 9 + 6” urban agglomeration system [48]. By 2020, the CPUA had a population exceeding 160 million, with a GDP reaching 1.17 trillion dollars, representing 13.9% of China’s population and 8.0% of its GDP (https://www.henan.gov.cn/2021/12-31/2375438.html, accessed on 10 September 2024). This makes the CPUA not only one of China’s most economically significant regions, but also a high-density urban agglomeration, where the intense population concentration poses challenges to land use, resource allocation, and ecological sustainability. According to the Central Plains Urban Agglomeration Development Plan (2016–2020), the CPUA spans the provinces of Henan, Hebei, Anhui, Shandong, and Shanxi, covering an area of approximately 287,000 km2, with geographic coordinates of 110°15′~118°04′ E and 31°46′~37°47′ N (Figure 2). The region features diverse landforms, including plains and mountains. It experiences a continental monsoon climate, which is ideal for growing biannual crops. Fertile soils and numerous rivers provide excellent conditions for agricultural production. Rational planning of the region’s natural geomorphology and land use layout can significantly enhance ecosystem connectivity and resilience, thereby promoting the region’s sustainable development.

2.2. Methodology

This study analyzes LUCC and its response to ESV and utilizes the MSPA–Linkage Mapper method to construct an ecological network. Based on this, an ecological spatial optimization layout is proposed to provide theoretical guidance for CPUA ecological space governance and optimization. The framework consists of three main components: (1) Analysis of LUCC and ESV response: Land use patterns evolve in response to changing demands from different stakeholders, leading to transformations across six land use categories: cropland, forest, grassland, water bodies, built-up land, and unused land. This study first employs land use transfer matrix analysis and GIS-based spatial analysis methods to examine the spatiotemporal evolution of land use patterns. Based on these land use changes, the ESV dynamics are further analyzed using an improved equivalent factor method, revealing spatiotemporal trends in ecosystem service values. (2) Ecological network construction: Identification of ecological sources: ESV classification results are integrated with MSPA to identify ecological source areas. Ecological Resistance Surface Construction: A comprehensive ecological resistance surface is developed by considering both natural environmental factors and socioeconomic influences to reflect the spatial distribution of ecological resistance. Extraction and classification of ecological corridors: The Linkage Mapper tool is used to extract ecological corridors and ecological nodes, ensuring connectivity between ecological source areas. Additionally, a gravity model is applied to classify ecological corridors based on their functional significance and intensity. (3) Ecological spatial optimization: Considering the natural geographical characteristics, land use changes, and spatiotemporal evolution of ESV in the study area, this study proposes a zoning management strategy from the perspective of ecological protection. This approach enables the optimization of ecological spatial layouts, ensuring balanced land use and ecological security while supporting sustainable regional development. This integrated approach provides a scientific basis for optimizing ecological spatial structures and supports sustainable land management and ecosystem conservation strategies at the CPUA.

2.2.1. Land Use Transfer Matrix

The land use transfer matrix quantitatively captures the dynamics of land use transformations in a specific region. It provides insight into the quantitative changes and spatial transfer patterns among various land use types [49]. The formula is as follows:
S i j = S 11     S 12    . . .    S 1 n S 21     S 22    . . .    S 2 n . . .      . . .     . . .     . . . S n 1    S n 2    . . .    S n n
where Sij denotes the area of the ith land use type transferred to the jth land type, i and j denote the number of land use types before and after the transfer, respectively, and n is the total number of land use types divided in the study area, in this study, n = 6.

2.2.2. Assessing the ESV

Currently, various methods are available for assessing the ESV, but no uniform standard has been established. Common valuation methods include the market value method, production cost method, contingent value method, and the equivalent factor method. Among these, the equivalent factor method is widely favored for its minimal data requirements, relatively simple calculations, and suitability for large-scale regional studies [50]. This method estimates different ESVs by using a set of standardized value coefficients introduced through equivalence factors, which facilitates a better understanding and quantification of ecosystem services’ contributions to regional sustainable development. Costanza et al. (1997) first proposed a global framework for ESV assessment and provided preliminary estimates at the global scale [51]. Building on this, Xie et al. (2015) developed a localized equivalent factor system tailored to China’s ecological and socio-economic conditions, categorizing ecosystem services into 11 types, including food production, climate regulation, water conservation, and biodiversity maintenance [52]. These categories capture the multifunctional role of ecosystems in maintaining ecological balance, supporting economic growth, and enhancing human well-being. Numerous subsequent studies have applied this method in regions with ecological and socio-economic conditions comparable to the CPUA, confirming its applicability and robustness in densely populated agricultural regions undergoing rapid urbanization [53,54,55].
We selected wheat, rice, and maize as the primary crops in the CPUA, and used the equivalent factor method to estimate the ESV. First, using the average production of these three crops and the national average purchase price from 2005 to 2020, we calculated the economic value of grain yield per unit area as 331.48 dollars/hm2 for the CPUA using Equation (2). Second, land use was divided into six categories: cultivated land, forest, grassland, waterbody, and bare land, corresponding to farmland, forests, grasslands, watersheds, and deserts, respectively. Since only natural ecosystem services were considered, construction land was assigned a value of zero, and the coefficient for ESV per unit area was determined accordingly (Table 1). Finally, the total ESV of the CPUA was estimated using Equation (2):
E c = 1 7 i = 1 n m i p i q i M
E S V = A k × V C k
where Ec denotes the economic value per unit area provided by farmland ecosystem service (dollar/hm2), i indicates crop type, M represents the total area for food crops, mi is the area allocated to ith food crop, pi stands for national average purchase price for ith food crop (dollar/kg), and qi indicates yield for ith food crop (kg/hm2). Ak is the area associated with kth land category (km2), and VCk denotes the ESV per unit area for the kth land category (dollar/hm2).

2.2.3. Ecological Source Identification

Ecological sources are key landscape patches with high ESVs, playing a crucial role in maintaining regional ecological security and ecosystem functionality. These areas not only provide essential ecological services, such as carbon sequestration, water conservation, and biodiversity support, but also contribute to the stability of landscape structures and functions. Given their significant ecological influence, they require targeted conservation efforts to ensure the long-term sustainability of the ecological processes [55,56,57]. To systematically identify and analyze these key patches, ESV evaluation results were directly integrated into the ecological network construction process, ensuring that areas with the highest ecological contributions were prioritized. Using the natural breaks method in ArcGIS, ESVs for the CPUA were classified into low, medium, and high categories [58]. Medium- and high-ESV areas were selected as foreground data, while low-ESV areas were designated as background data for MSPA. MSPA was conducted using Guidos Toolbox 2.8 software, applying image processing techniques such as erosion, expansion, and open/close operations to segment spatial patterns and classify landscape structures into core zones, branches, edges, and other components. This method effectively identifies critical ecological patches within the study area, with detailed ecological characteristics presented in Table 2. Among the extracted core areas, 45 large patches were identified as ecological sources based on their high ESV contributions, substantial patch size, and resilience to external disturbances. These ecological sources serve as the fundamental nodes in the ecological network, forming the foundation for regional conservation planning and connectivity enhancement.

2.2.4. Source Patch Significance Evaluation

According to landscape ecology theory, patch area and connectivity are critical factors for supporting ecological functions within a landscape [59]. Therefore, in this study, we focused not only on patch areas but also comprehensively considered the landscape connectivity index to identify the patches with critical connectivity to the ecological network. Using Conefor Sensinode 2.6 software, we calculated the Probability of Connectivity (PC) index and the Degree of Patch Connectivity (dPC) to assess each patch’s role in maintaining landscape connectivity. By setting a connectivity distance threshold of 5000 m and a connectivity probability of 0.5, we identified the top 20 patches with the highest connectivity as key ecological sources from the 45 alternative source sites, while classifying the remaining patches as ecological land. The formula is as follows:
P C = i = 1 n j = 1 n a i a j p i j * A L 2
d P C = P C P C P C × 100
where n represents the patch quantity, ai and aj refer to areas for patches i and j, indicating maximum dispersal probability within these patches, AL denotes the total regional landscape area, and PC denotes the probable connectivity index, ranging from 0 to 1—values closer to 1 indicate stronger connectivity across the landscape. It is used to assess the overall connectivity index of the remaining patches after removing a certain patch.   P C is used to assess the connectivity among remaining patches after the removal of a patch, dPC signifies the patch importance index, and its higher value indicates that the patch contributes more to maintaining the overall landscape connectivity.

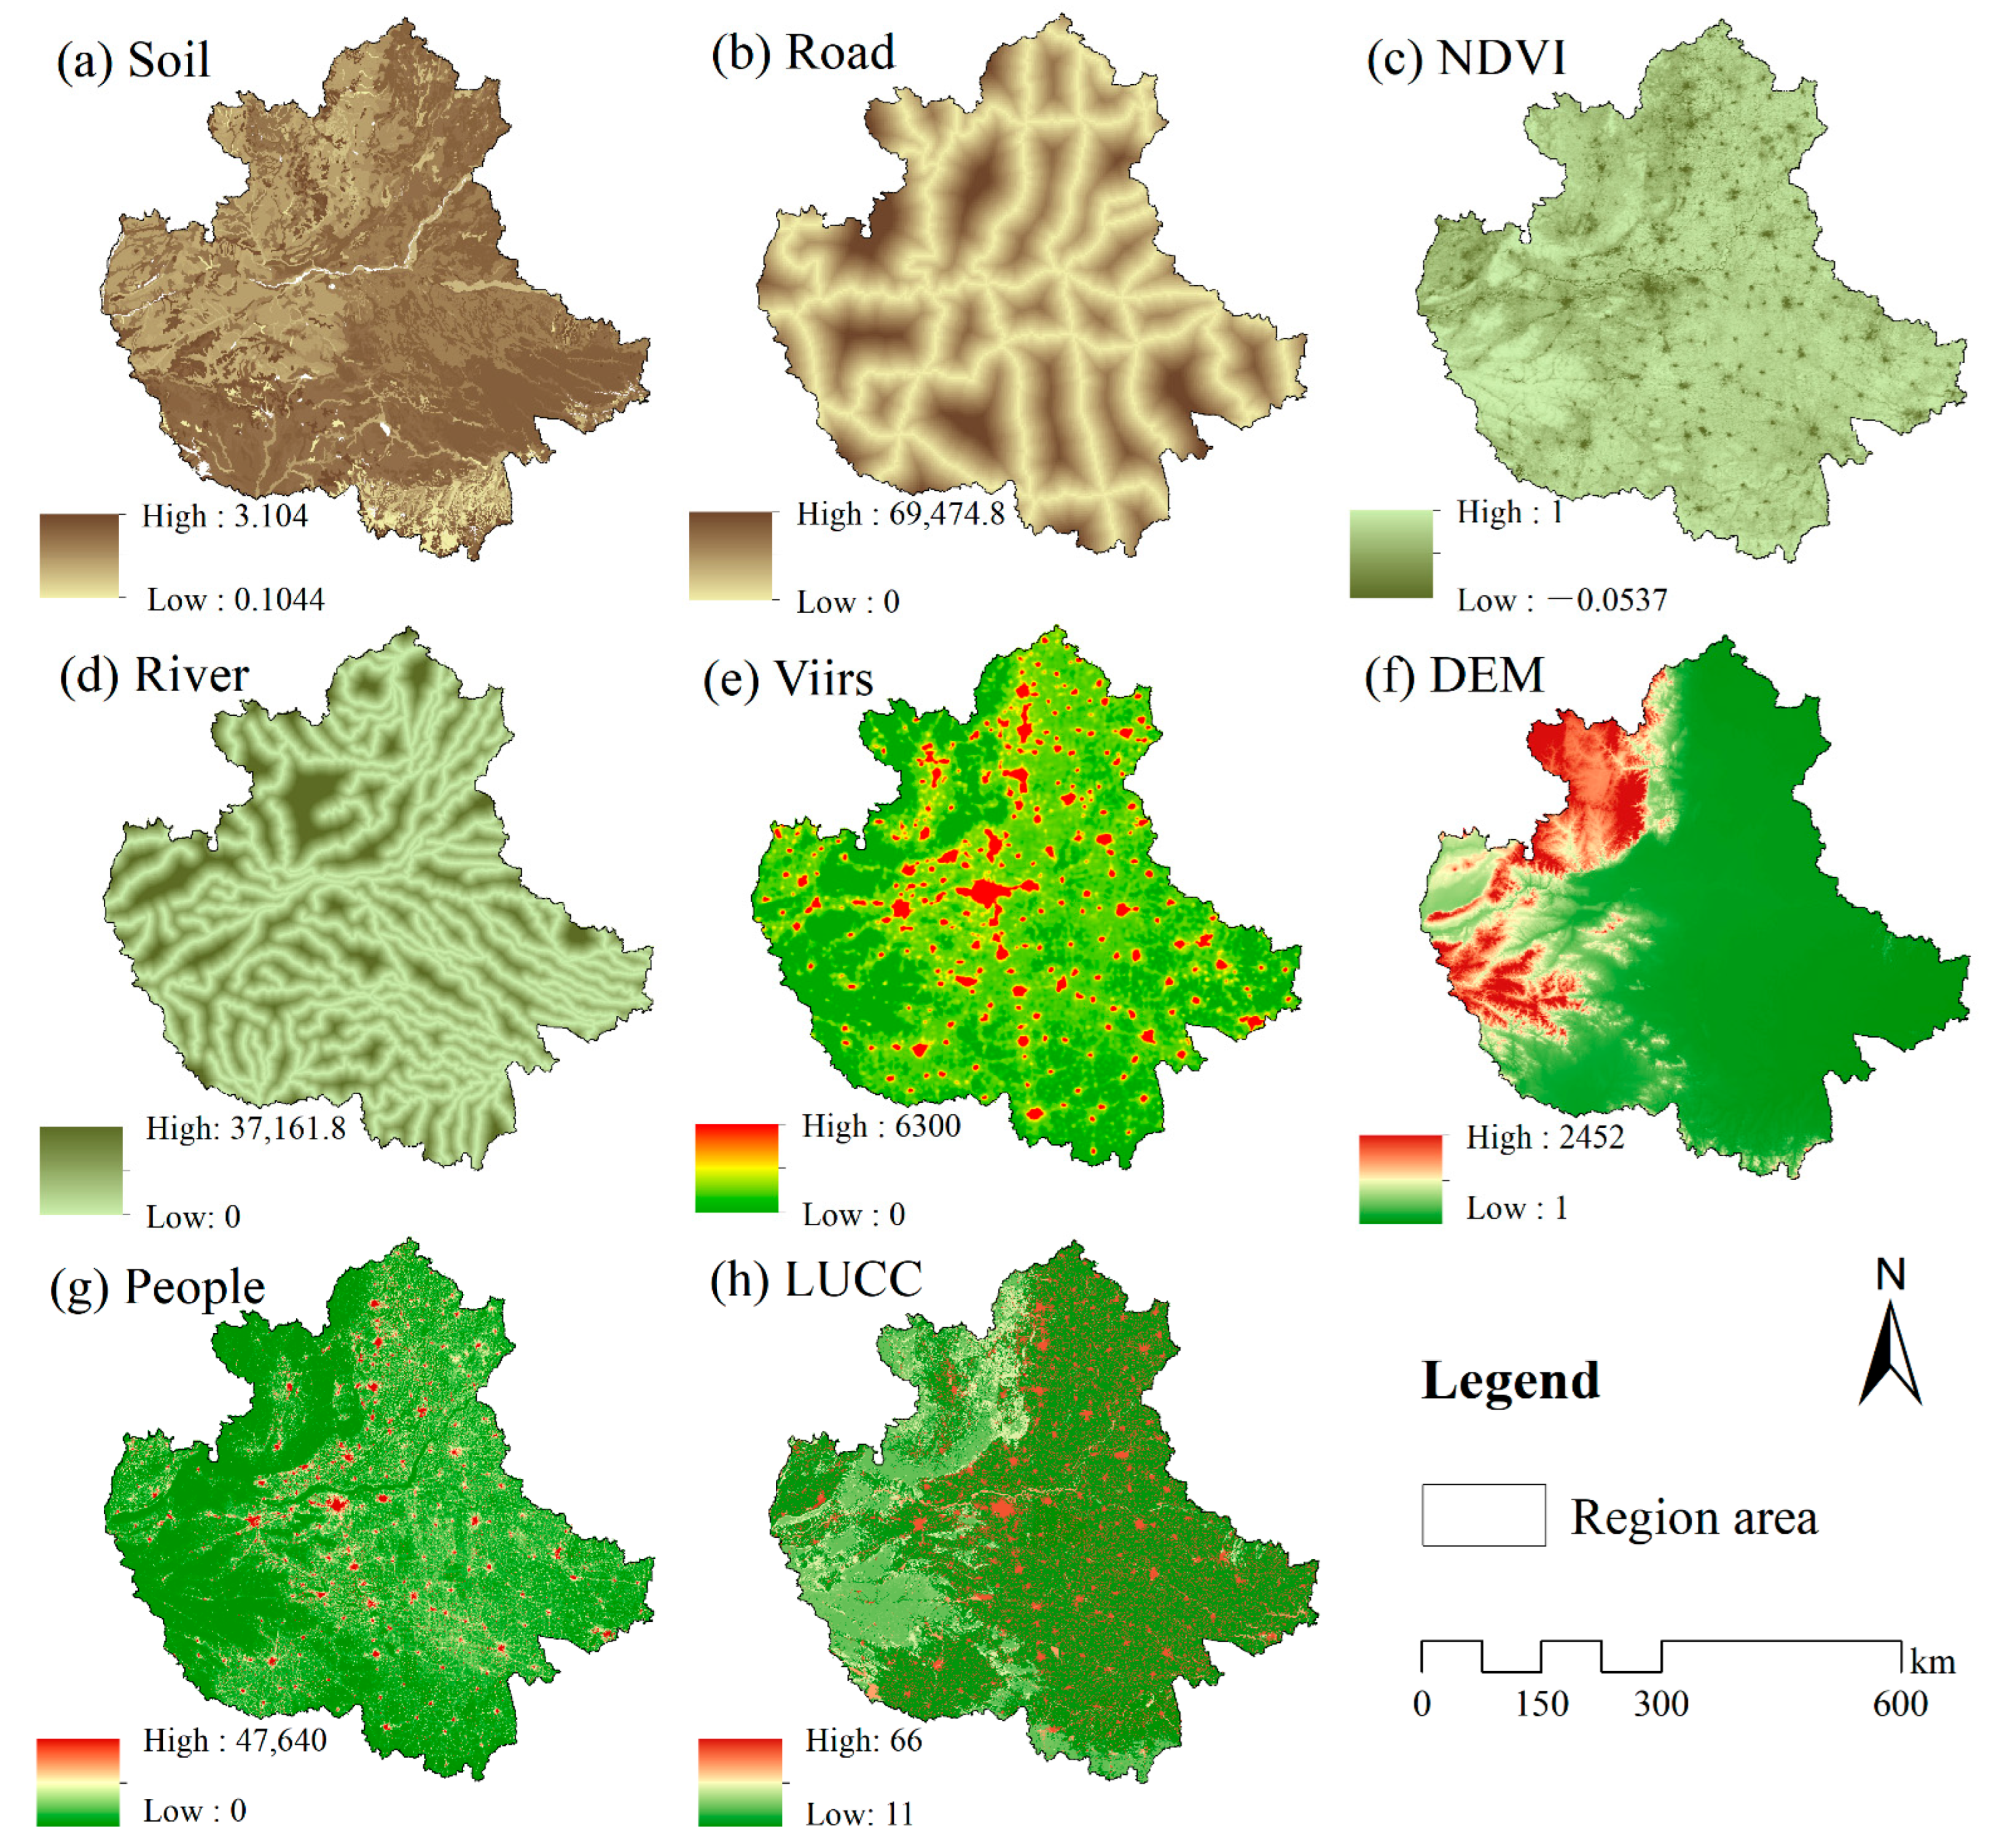
2.2.5. Building Ecological Resistance Surfaces

The ecological resistance surface is a conceptual model used to describe how environmental features influence species movement and gene flow. This model evaluates the distribution of resistance barriers encountered during the outward dispersal of species from ecological sources and illustrates the accessibility and obstruction effects of various landscape elements on species migration [33]. Drawing from the relevant literature and considering the economic and natural geographic characteristics of the CPUA, this study selected eight resistance factors, including NDVI, LUCC, distance to river, and elevation, among others (Figure 3) [60,61,62]. Among the eight resistance factors, LUCC was assigned resistance values directly based on land type characteristics, while the other factors were first classified as either positive or negative indicators of ecological resistance. These were then standardized using a normalized linear transformation to ensure comparability. Principal component analysis (PCA) was used to determine the weight of each resistance factor. Using ArcGIS’s Principal Components tool, we performed PCA on the raster data for each factor, obtaining the spatial loadings and cumulative contribution rates for each principal component. By analyzing the principal component loading matrix and the variance contribution rates, we calculated the weights for each resistance factor. The weights of each resistance factor used in the analysis can be found in Table 3. Finally, the Raster Calculator in ArcGIS was used to multiply each standardized layer of the resistance factors by its corresponding PCA-derived weight. Each factor was multiplied by its weight to ensure that its contribution to the ecological resistance surface was proportional to its significance as determined by PCA. The results from all layers were then summed together to generate the comprehensive ecological resistance surface.

2.2.6. Ecological Corridor Identification

Ecological corridors are pathways with multiple ecological functions that serve as important routes for species to inhabit, move, or migrate. These corridors promote and maintain connectivity between isolated habitat patches, allowing species to spread and migrate freely within fragmented habitats. Moreover, ecological corridors help integrate fragmented habitats into a cohesive ecological network, effectively maintaining ecosystem stability and functional coordination, which upholds regional ecological security [63]. Using circuit theory, we calculated the minimum resistance cost path with Linkage Mapper and Circuitscape tools. Subsequently, the gravity model was then applied to rank the corridors, filtering and mapping the overall importance distribution of these corridors. The formula is as follows:
G i j = N i N j D i j 2 = L m a x 2 l n S i l n S j L i j 2 P i P j
where Gij denotes the interaction intensity between i and j, Ni and Nj denote the respective weight values of i and j, Dij represents the normalized corridor resistance value between the sources, Lmax is the highest cumulative resistance among all potential corridors, Si and Sj denote the areas of source i and j, and Pi and Pj reflect the average resistance values of i and j.

2.3. Data Sources

The LUCC data used in this study include classification maps for the years 2005, 2010, 2015, and 2020, obtained from the Resource and Environment Science Data Platform (http://www.resdc.cn/ accessed on 11 September 2024), with a spatial resolution of 30 m. To ensure temporal consistency and spatial comparability, all land use datasets were reclassified into the following six standardized categories: cultivated land, forest, grassland, waterbody, bare land, and construction land, following a unified classification system. The datasets were further resampled, projected, and spatially aligned to maintain consistency in the coordinate reference system. To match the spatial and temporal characteristics of the LUCC data, the estimation of ecosystem service value (ESV) was conducted for the same four years (2005, 2010, 2015, and 2020), using the same 30 m spatial resolution. The ESV data were estimated based on the value equivalent coefficients developed by Xie et al. (2015) [52]. These coefficients were integrated with the reclassified LUCC data to calculate spatially explicit ESV for each time point. Socioeconomic data—such as grain prices, sown areas, and other relevant indicators related to cultivated land protection—were primarily collected from the China Statistical Yearbook, the China Urban Statistical Yearbook, the National Agricultural Products Cost–Benefit Compilation, and the Chinese government website (https://www.gov.cn/ accessed on 12 September 2024). Additionally, eight resistance factors were selected for the ecological corridor analysis, which is essential in constructing the ecological network model (Table 3).

3. Results

3.1. Spatio-Temporal Evolution in LUCC

3.1.1. Temporal Trend of LUCC

From 2005 to 2020, the primary land categories within the CPUA included cultivated land, forest, and construction land (Table 4). During this period, cultivated land accounted for more than 63% of the total land use area, experiencing an average yearly decline of 0.27%, reflecting a consistent downward trend. In contrast, construction land saw a notable expansion, showing an average yearly increase of 1.49%. This shift highlights changes in economic development patterns and adjustments in demand driven by population migration. The reduction in cultivated land stands in sharp contrast to the rise in construction land, reflecting changes in land use structure during urbanization. Overall, forest and grassland areas experienced little variation, with average annual growth rates of 0.04% and −0.35%, respectively, this suggests that the CPUA’s ecological protection policies were effectively implemented. Bare land initially expanded before declining, with an average annual growth rate of −3.62%. As a key region of the central China development strategy, the CPUA has received strong national policy support. By promoting intensive land use and optimal allocation, the government has encouraged the development of unutilized land while maintaining balancing industrial growth with ecological conservation.

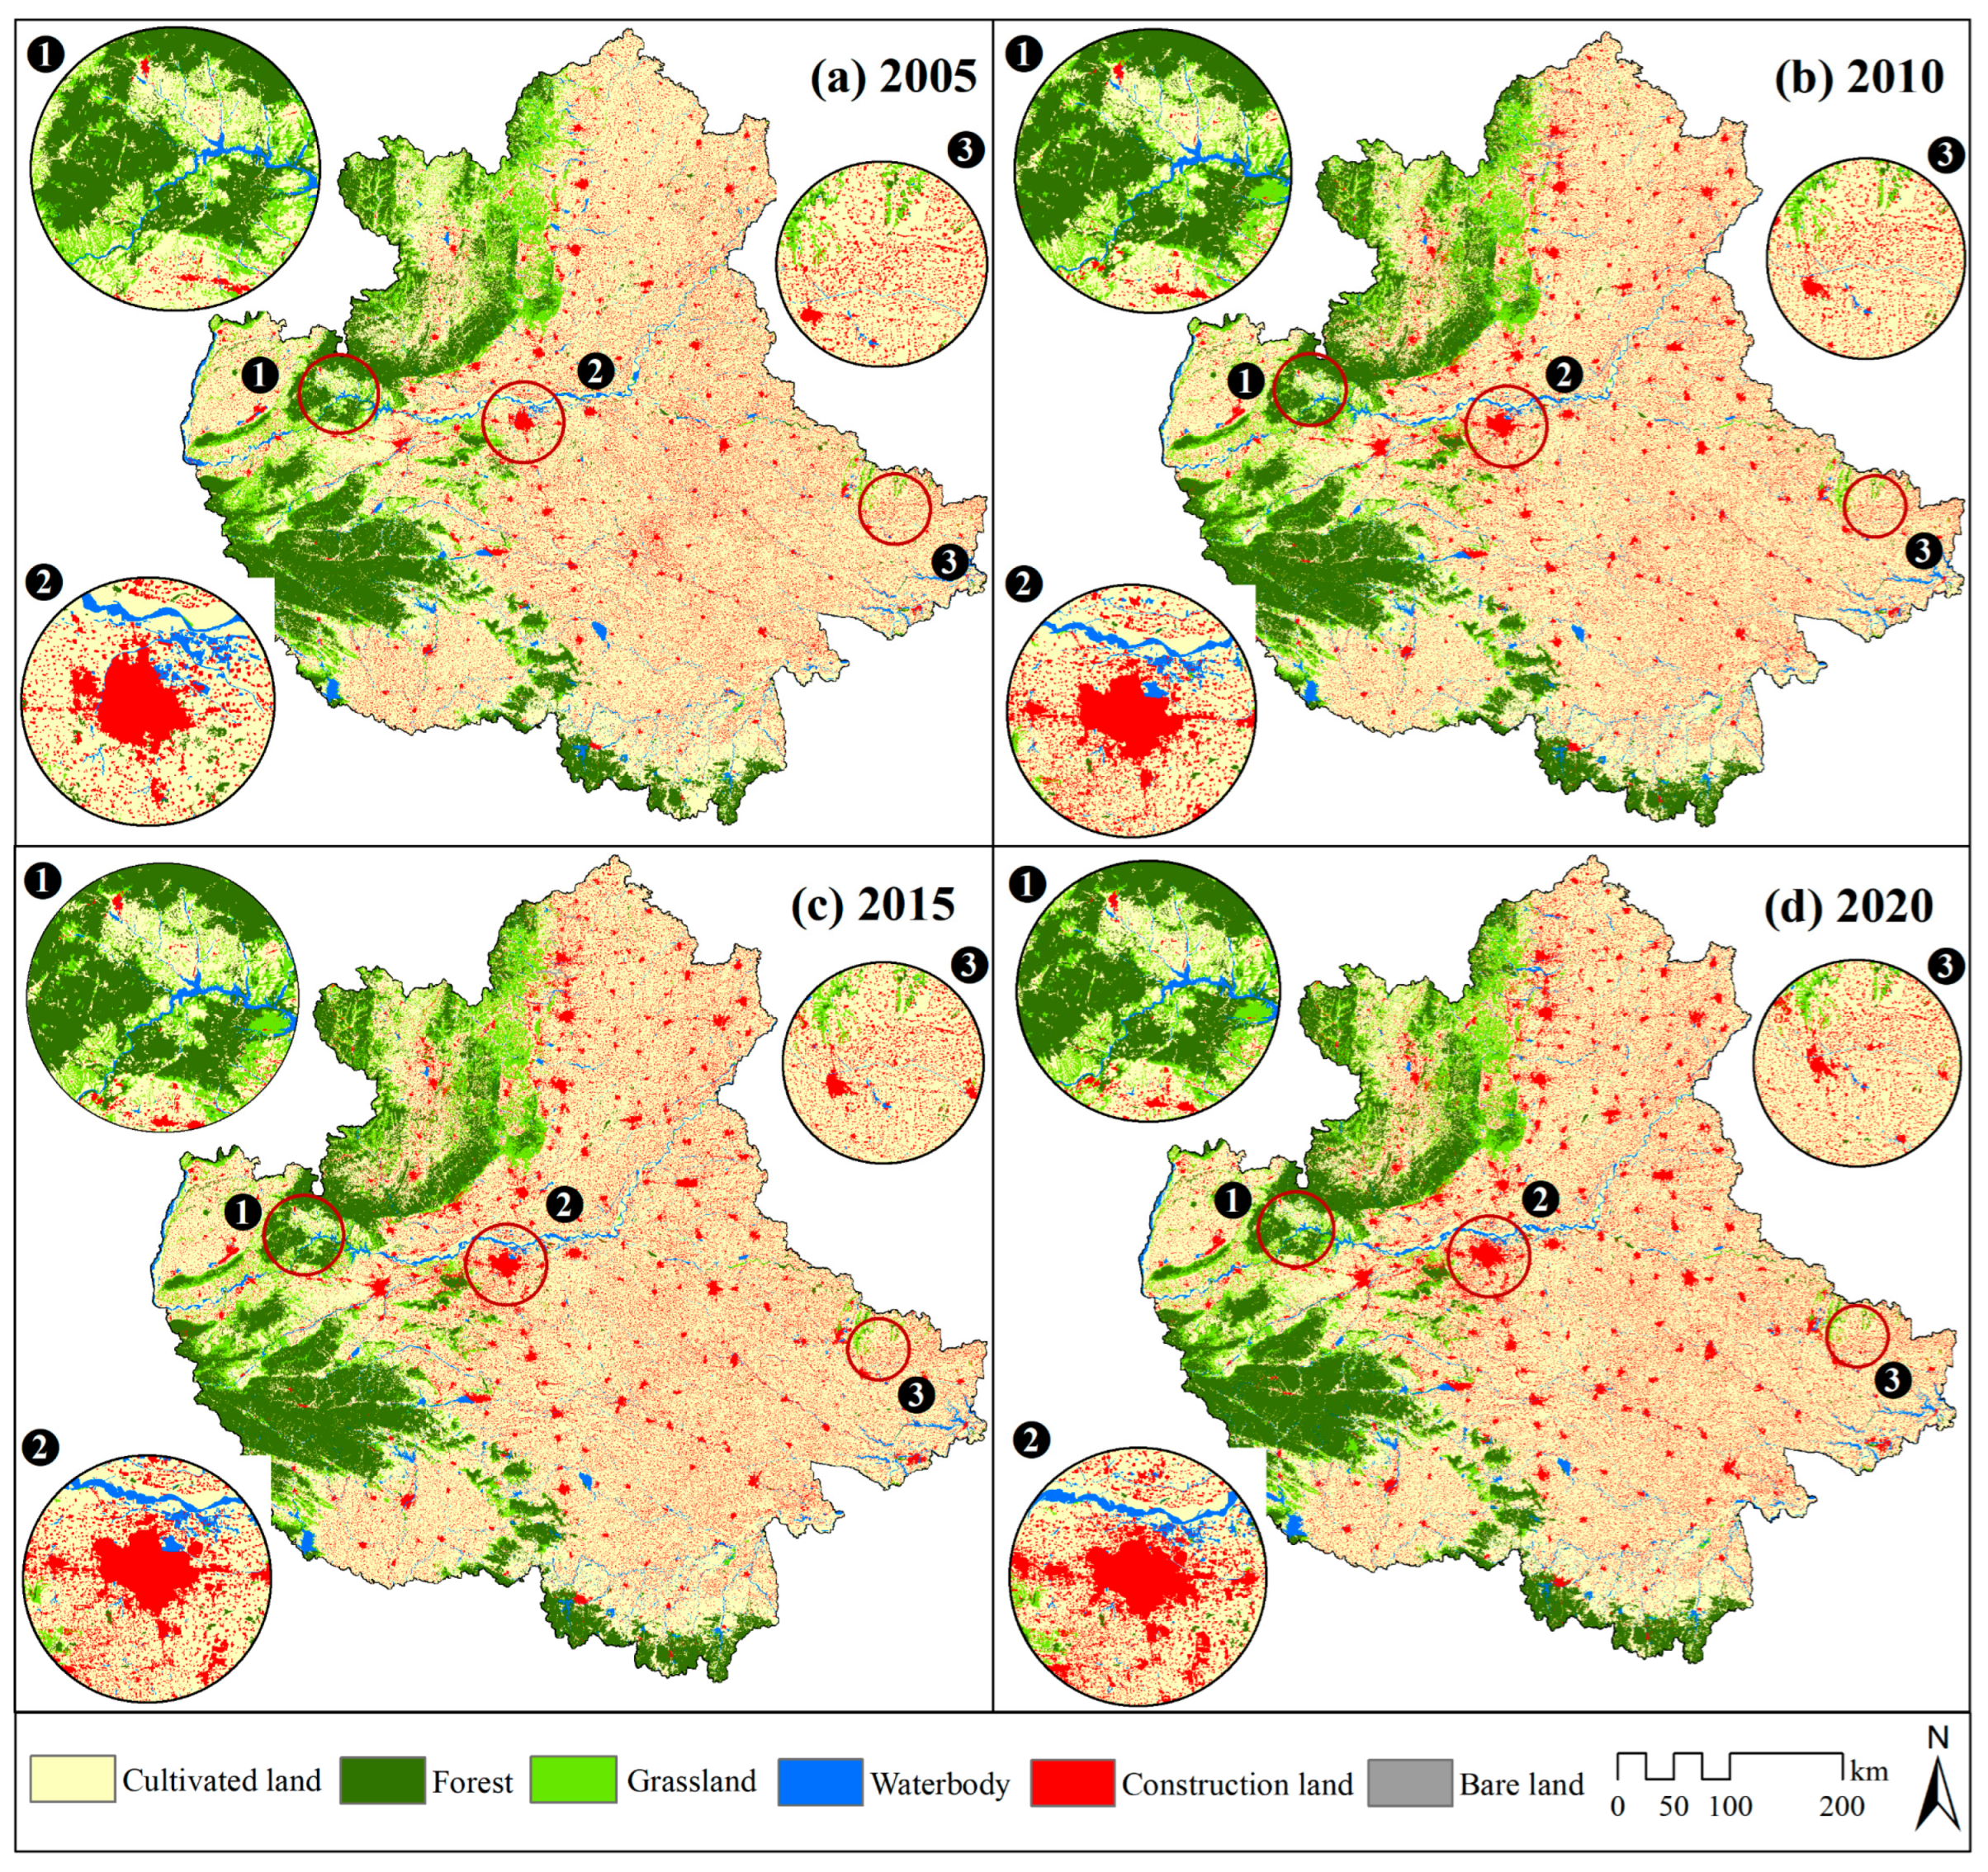
3.1.2. Spatial Distribution of LUCC

Utilizing land use data from 2005, 2010, 2015, and 2020 in ArcGIS 10.8, spatial distribution patterns of land use types were mapped for each period (Figure 4). As shown in Figure 4, it is clear that between 2005 and 2020, most of the CPUA was covered by cultivated land, while construction land was sporadically distributed across various cities and counties, exhibiting a point-block distribution pattern and showing a clear trend of expansion. Forest and grassland were predominantly concentrated in the mountainous regions along the CPUA’s northwestern and southwestern borders, with forests particularly concentrated in the western regions of Sanmenxia, Nanyang, and Xinyang, and grassland primarily distributed in Anyang, covering a smaller area, and Handan, as well as in areas adjacent to waterbody. Waterbodies formed a narrow belt extending from Yuncheng to Heze, with block-shaped watersheds primarily situated in the southern region of the CPUA. Bare land, occupying a smaller area, appeared in a scattered and fragmented distribution, mainly in the northwestern region of the CPUA.

3.1.3. Changes in Land Use Transfers

Land use transfers within CPUA varied across different periods during the study (Figure 5). Between 2005 and 2020, approximately 15,860.59 km2 of cultivated land was transferred out, with 12,235.19 km2 repurposed as construction land, representing 77.14% of the total area transferred. Forest, grassland, waterbody, construction land, and bare land were primarily transferred from cultivated land, with transfer proportions of 57.94%, 45.63%, 68.38%, 96.75%, and 63.53%, respectively. The total area transferred across all land use types amounted to 27,110.17 km2, with 8433.19 km2 transferred into cultivated land and 13,225.56 km2 into construction land. In general, the outflow of cultivated land exceeded its inflow, leading to a reduction in its total area. Conversely, the inflow of construction land exceeded its outflow, leading to a clear expansion in this category. The transfer patterns for forest and waterbody were similar, with inflow-outflow differences of 245.81 km2 and 337.00 km2, both indicating a rising trend. The outflows of grassland and bare land were larger than their inflows, resulting in an overall decreasing trend for both. Notably, some grassland was altered to forest and construction land, while minimal grassland was transferred from bare land, amounting to only 2.11 km2. This transformation is primarily attributed to various factors, such as rapid urbanization driving the increase in construction land, economic advancement prompting shifts in the industrial framework, ecological protection policies promoting increases in green spaces and waterbody, and land use management optimizing resource allocation.
From 2005 to 2010, cultivated land was primarily transferred to construction land, totaling 5502.71 km2, comprising 76.95% of the overall transferred cultivated land. The areas transferred to forest and grassland were 852.36 km2 and 423 km2, representing 11.92% and 5.92% of the total cultivated land transfer, respectively. The area transferred to bare land was minimal, amounting to just 12.38 km2. Other land types were mainly transferred from cultivated land, with forest, grassland, and waterbody transferring 644.26 km2, 607.43 km2, and 470.92 km2, respectively, to cultivated land. Construction land transferred to cultivated land accounted for the largest share, at 65.90%, while bare land had the smallest share, at just 1.29%. Between 2005 and 2015, shifts in land use were less pronounced. Cultivated land and construction land continued to be converted into each other, with 2408.56 km2 of cultivated land transformed into construction land, representing 84.08% of all conversions from cultivated areas, and 400.15 km2 of construction land was transformed into cultivated land, making up 95.53% of all changes from construction land. The overall area transferred to bare land across all categories was only 3.04 km2. The areas transferred to forest grassland, and waterbody were 189.52 km2, 191.13 km2, and 250.96 km2, respectively, with cultivated land being the predominant type transferred during this period. From 2015 to 2020, the primary land types transferred from cultivated land were forest and construction land, totaling 616.88 km2 and 1305.63 km2. These constituted 25.23% and 53.41% of all transferred cultivated land. A significant portion of cultivated land was transformed into construction land, with 3283.95 km2 transferred, representing 68.31% of the total transferred cultivated land. Forest and grassland were exchanged with each other, with a 388.96 km2 transition from forest to grassland, and a 341.37 km2 transition from grassland to forest. Bare land was primarily transferred from waterbody, with 105.56 km2 transferred, accounting for 88.60% of the total transferred bare land.

3.2. Spatio-Temporal Evolution of ESV

3.2.1. Temporal Trend in ESV

Using the equivalent factor method, the ESV for each land use category in the CPUA was evaluated (Table 5). From 2005 to 2020, the total ESV decreased by 1.27 billion dollars, reflecting significant LUCCs and their impact on ecosystem service functions. Forests consistently maintained the highest ESV, contributing the largest share of ecosystem services across all periods, with a total increase of 1.55 billion dollars. This growth aligns with LUCC trends indicating afforestation and improved vegetation cover, largely driven by ecological restoration policies and afforestation programs. In contrast, bare land, which had the lowest ESV just above built-up land, experienced a notable decline, particularly in 2020, indicating further land degradation and conversion to construction areas. Cultivated land ESVs exhibited an annual decline rate of 0.27%, correlating with ongoing cropland conversion to urban and industrial areas, leading to a reduction in soil retention, carbon sequestration, and biodiversity support. Grassland ESVs experienced the most substantial decline between 2005 and 2010, consistent with high grassland loss rates, but stabilized from 2010 to 2020 due to conservation initiatives. Meanwhile, waterbody ESV fluctuated but ultimately increased by 11.97 billion dollars, indicating wetland expansion and improved water management. Overall, ESV variations across different land categories illustrate the CPUA’s response to urbanization and land use transformation. The rising ESV of forests and waterbodies underscores the success of ecological protection measures, while the declining ESV of cultivated and bare land highlights the challenges of balancing land conversion with ecosystem service preservation.

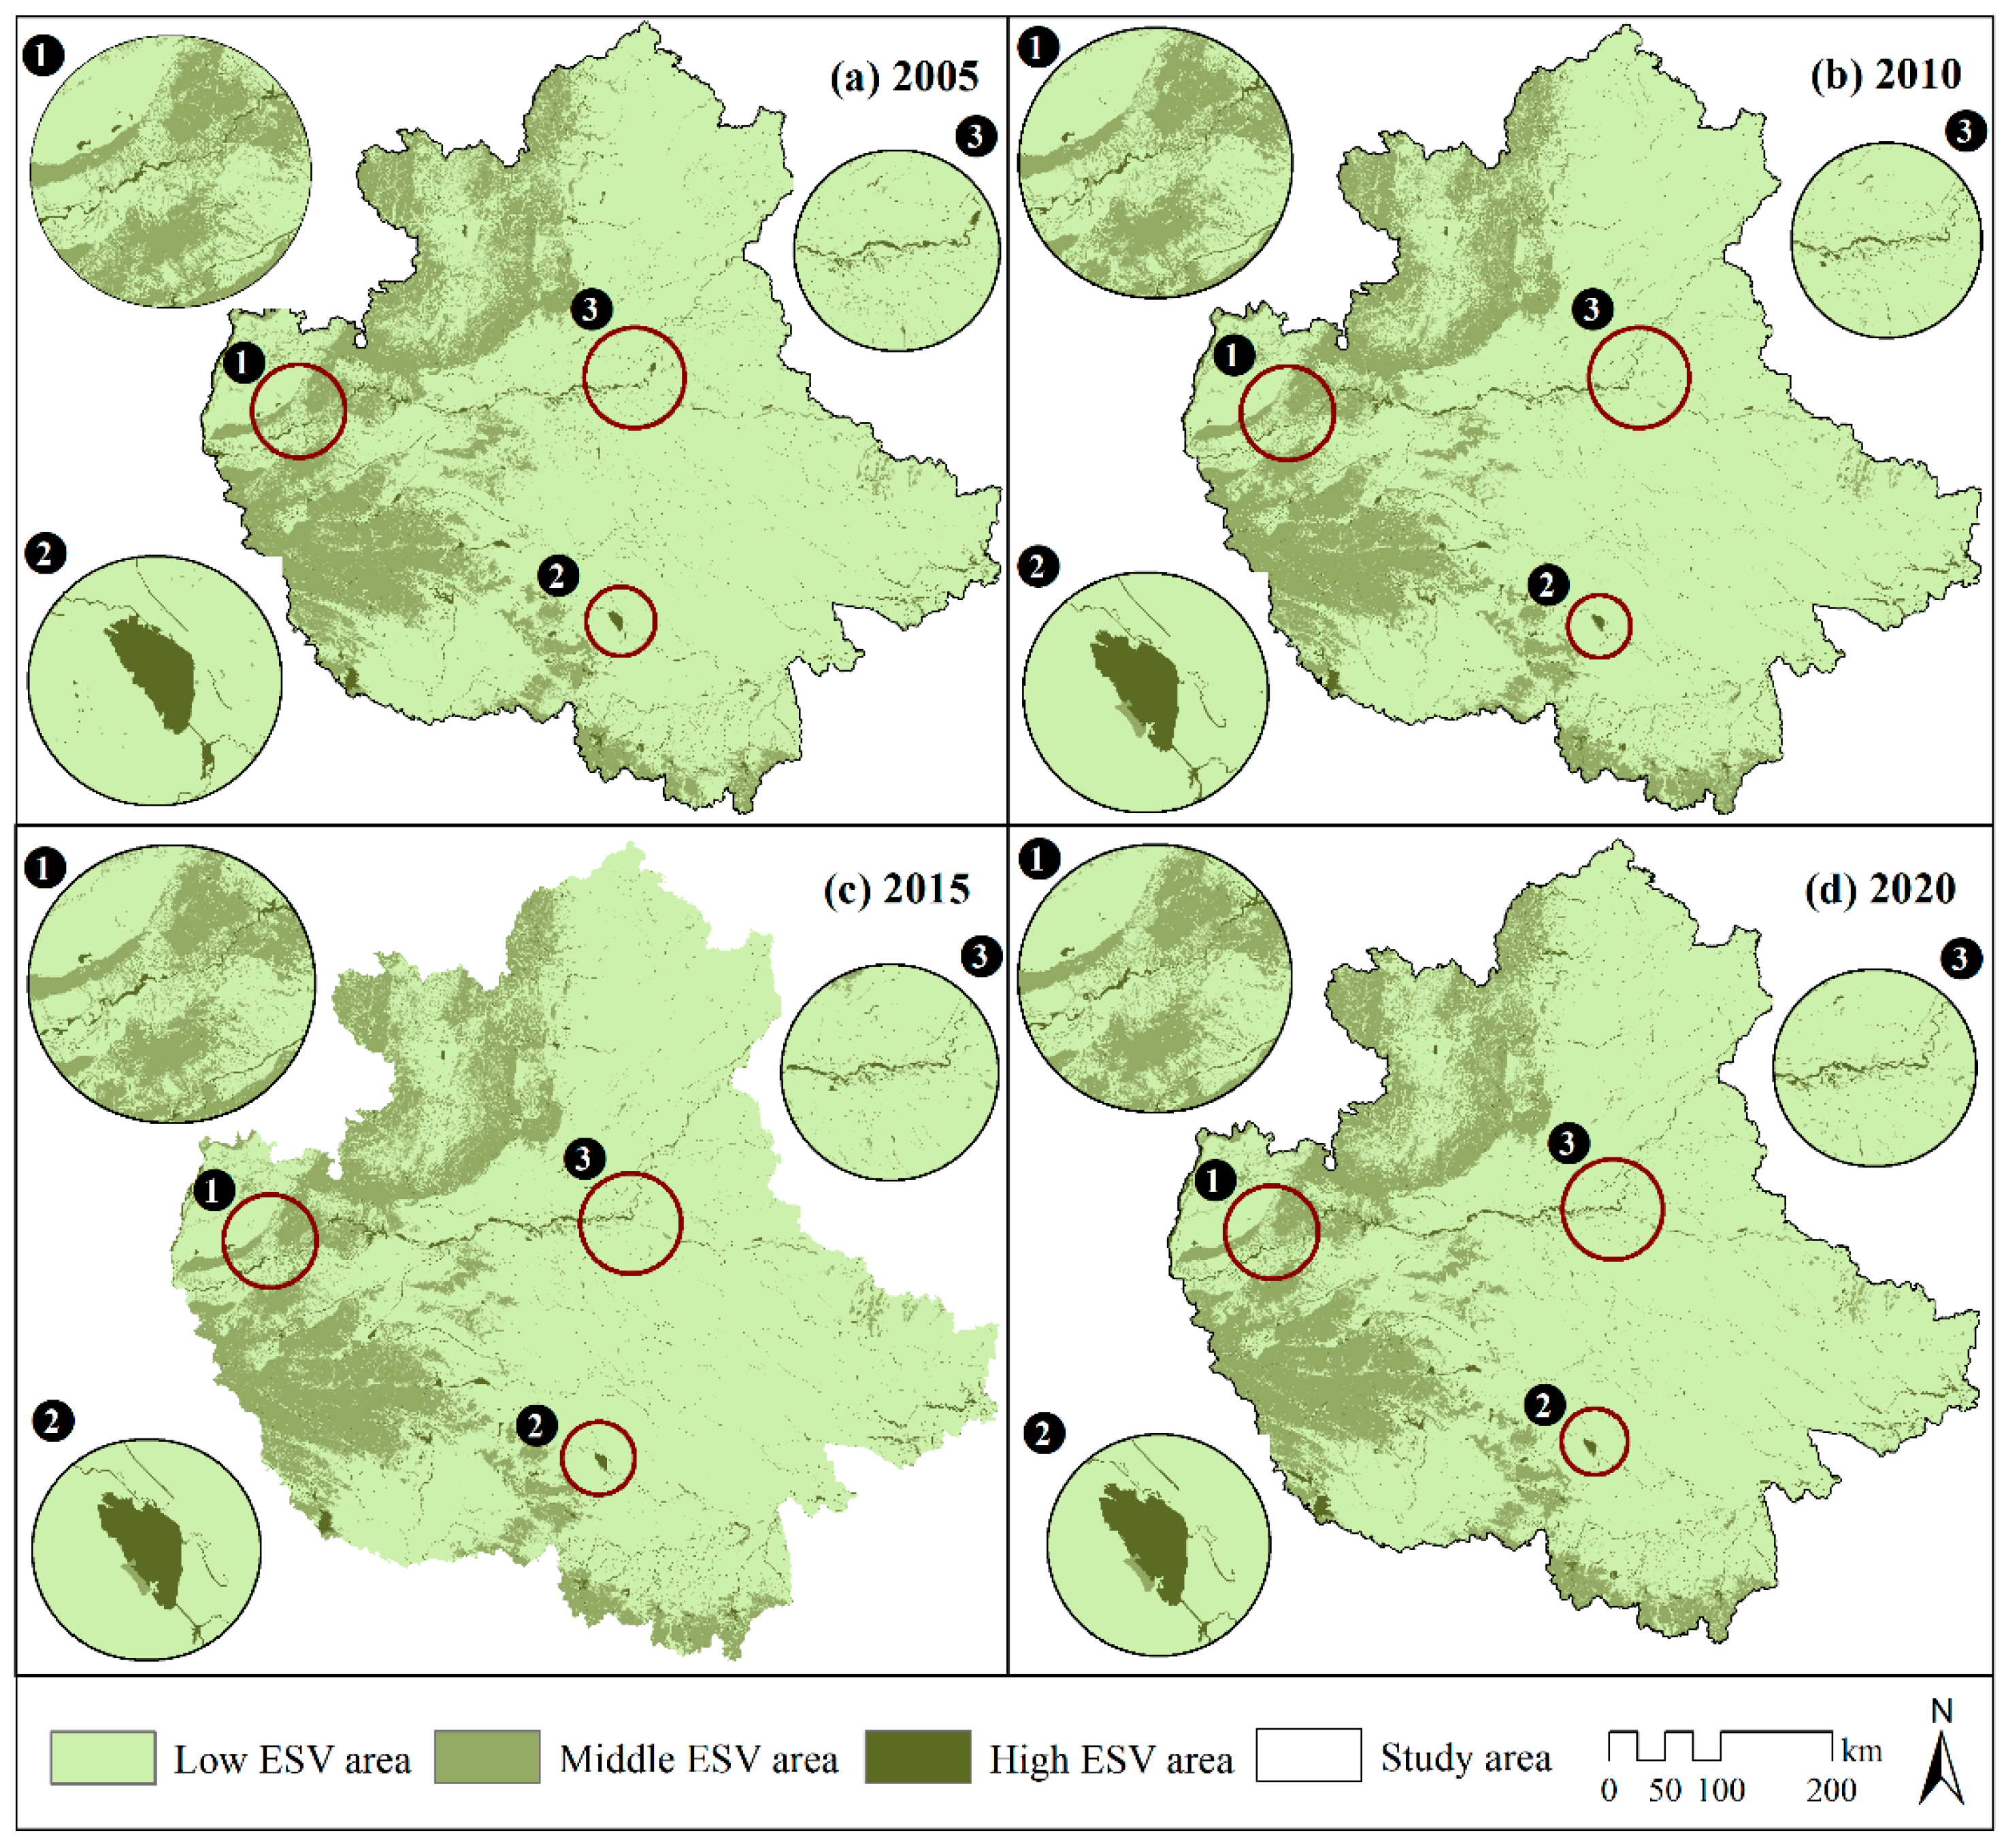
3.2.2. Spatial Distribution of ESV

This study applied ArcGIS 10.8 and the natural breakpoint method to classify ESV into three levels: low, medium, and high (Figure 6). From 2005 to 2020, LUCCs led to clear spatial differentiation in ESVs across the CPUA, reflecting the dynamic relationship between land use transformation and ecosystem service functions. High-ESV areas were limited in distribution, primarily concentrated in the southwestern cities of Nanyang, Xinyang, Pingdingshan, and Zhumadian, where forest and waterbody coverage remained dominant. These regions, characterized by relatively stable land use patterns and minimal anthropogenic disturbance, sustained key ecosystem services such as carbon sequestration, water conservation, and biodiversity maintenance, contributing to their consistently high ESVs. Conversely, low-ESV areas accounted for the largest proportion of the CPUA, predominantly distributed in the central and western regions, where rapid urbanization and large-scale agricultural production led to significant land use changes. The expansion of built-up areas and conversion of cropland reduced vegetation cover, fragmented habitats, and weakened ecosystem functions, resulting in lower ESVs. These transformations have particularly impacted soil retention, climate regulation, and habitat connectivity, further diminishing ecological service provision. Medium-ESV areas were mainly found in Sanmenxia, Yuncheng, and Jincheng, where a diverse land use structure—including a mix of agricultural land, forests, and undeveloped natural ecosystems—supported relatively stable ecosystem functions. The coexistence of productive land use and ecological conservation efforts allowed these regions to maintain moderate ESV levels, benefiting from both agricultural output and ecosystem services such as water retention and soil stabilization. Overall, the spatial differentiation of ESVs reflects the impact of LUCC-driven land transitions. While high-ESV areas correspond to regions with stable forest and water systems, the declining ESVs in urbanized and intensively cultivated areas highlights the ecological costs of land conversion. These findings underscore the need for balanced land management strategies that integrate urban expansion, agricultural efficiency, and ecological conservation to sustain long-term ecosystem service functions in the CPUA.

3.3. Ecological Network Construction

3.3.1. Landscape Pattern Analysis

In this study, the MSPA method was utilized to pinpoint and identify potential ecological sources, along with a detailed analysis of the landscape types and structure within the CPUA (Figure 7). The core landscape area covers 32,476.81 km2, making up approximately 11.36% of the CPUA’s total area and 81.30% of its forested area. These core areas are primarily concentrated in the mountainous and hilly regions of Xinyang, Luoyang, Sanmenxia, and Jincheng, providing critical ecosystem services, such as soil retention and biodiversity support. Thus, rigorous conservation and management measures are urgently needed in these areas to maintain their ecological functions. The bridging zone, a structural corridor within the landscape ecological pattern, spans 9951.89 km2, representing 24.91% of the forested area, and is closely connected to the core, playing a crucial role in linking different ecological units. In contrast, the islet zone is fragmented, accounting for 11.43% of the forested area, and faces a notable risk of habitat degradation. Serving as a buffer between forested and non-forested lands, the edge zone comprises 18.59% of the total forested area, indicating an edge effect that influences biodiversity in the CPUA. The branch zone covers 13.22% of the forested area with relatively limited connectivity, while the perforation zone, covering only 2.63% of the forested area, reflects the study area’s vulnerability to external disturbances, impacting ecosystem stability.

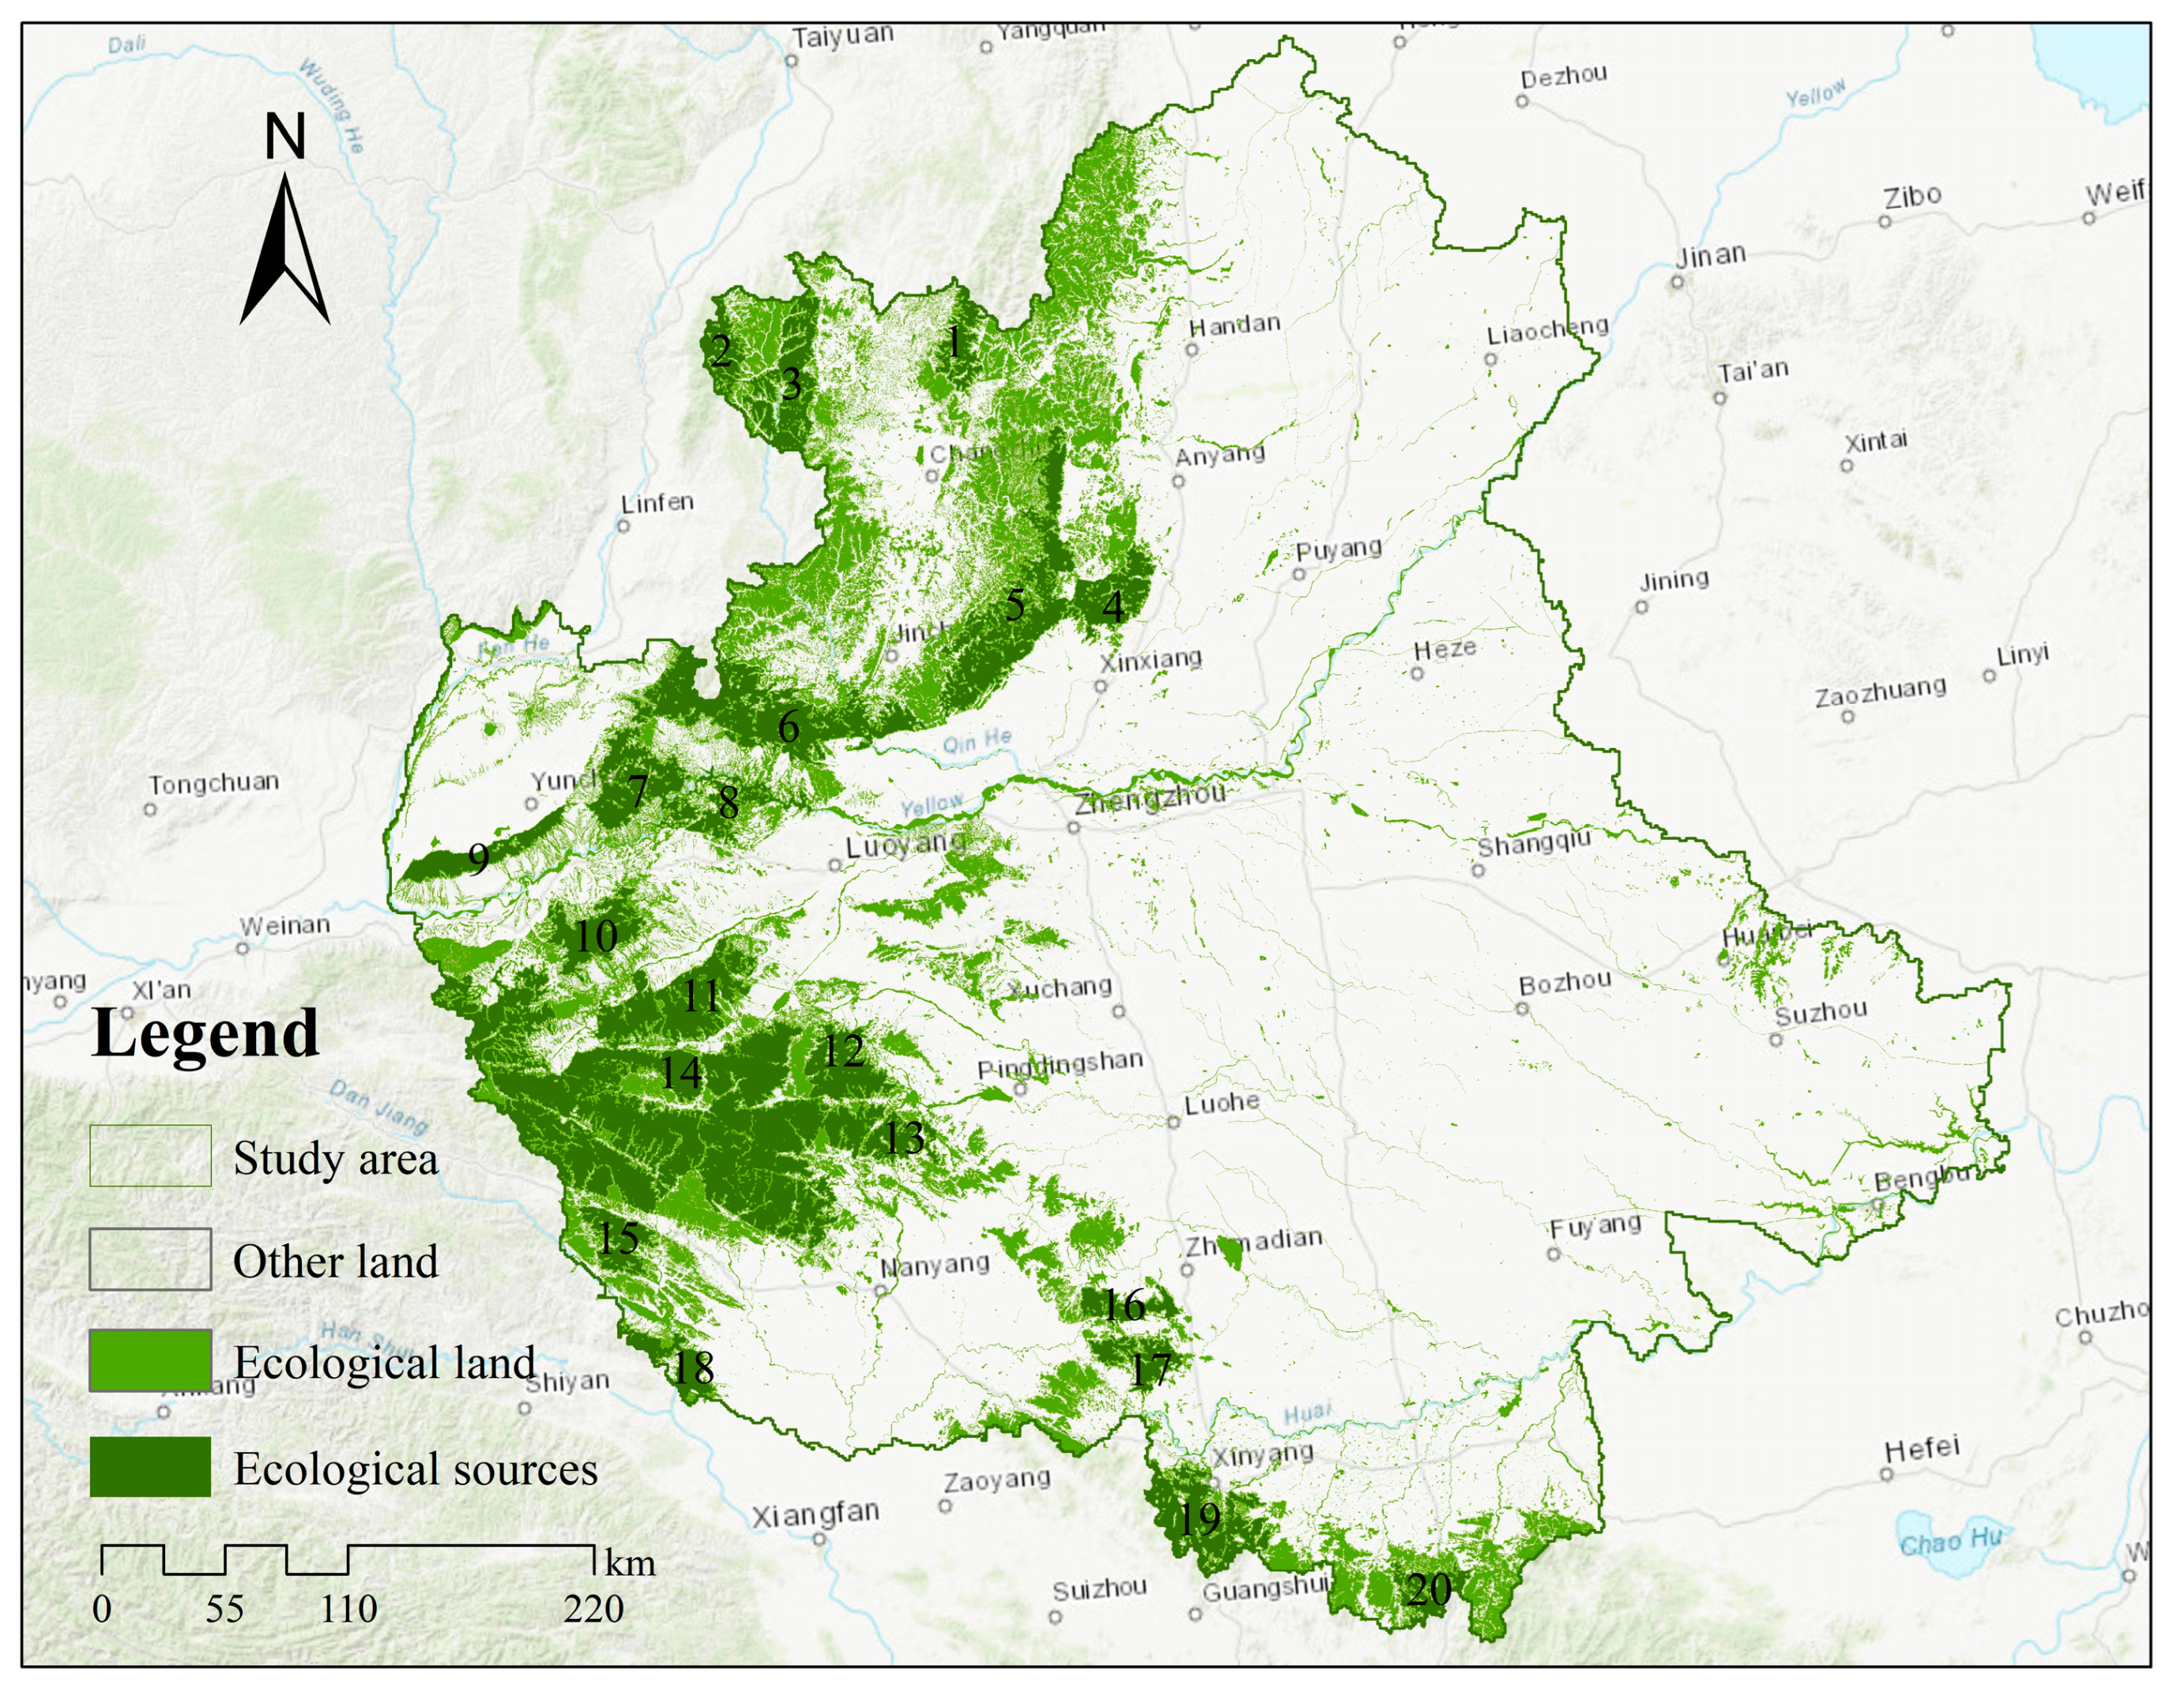
3.3.2. Identification of Ecological Sources

Through an in-depth analysis of landscape ecological patterns in the CPUA, this study identified 20 highly connected patches as ecological sources using Confor 2.6 software (Figure 8). The composition of these ecological sources is predominantly forest, covering 21,434.70 km2, primarily concentrated in the western region, where stable vegetation cover and minimal land conversion have contributed to higher ESV through carbon sequestration, water conservation, and biodiversity support. Among them, high-grade ecological sources span 8377.08 km2, mainly in Luoyang, Nanyang, and Pingdingshan, representing 39.08% of the total ecological sources. These areas have a dPC value of 84.25, indicating strong landscape connectivity and ecological stability, which play a crucial role in preserving regional ecosystem integrity and maintaining high ESV levels. Conversely, low-grade ecological sources are more widely dispersed, mainly across the northwest, southwest, and southern CPUA, where LUCCs, including urban expansion and intensified agriculture, have led to lower ESVs and increased habitat fragmentation. These areas, exhibiting weaker connectivity, primarily function as potential ecological corridors, contributing to biodiversity enhancement and future restoration efforts. The spatial distribution of ecological sources aligns with ESV variations, where regions with higher vegetation coverage and stable land use retain higher ecological value, while areas experiencing urban sprawl and cropland expansion show reduced connectivity and declining ecosystem functions. These findings highlight the importance of integrated land management strategies to strengthen ecological network connectivity, optimize ecosystem services, and enhance regional environmental resilience.

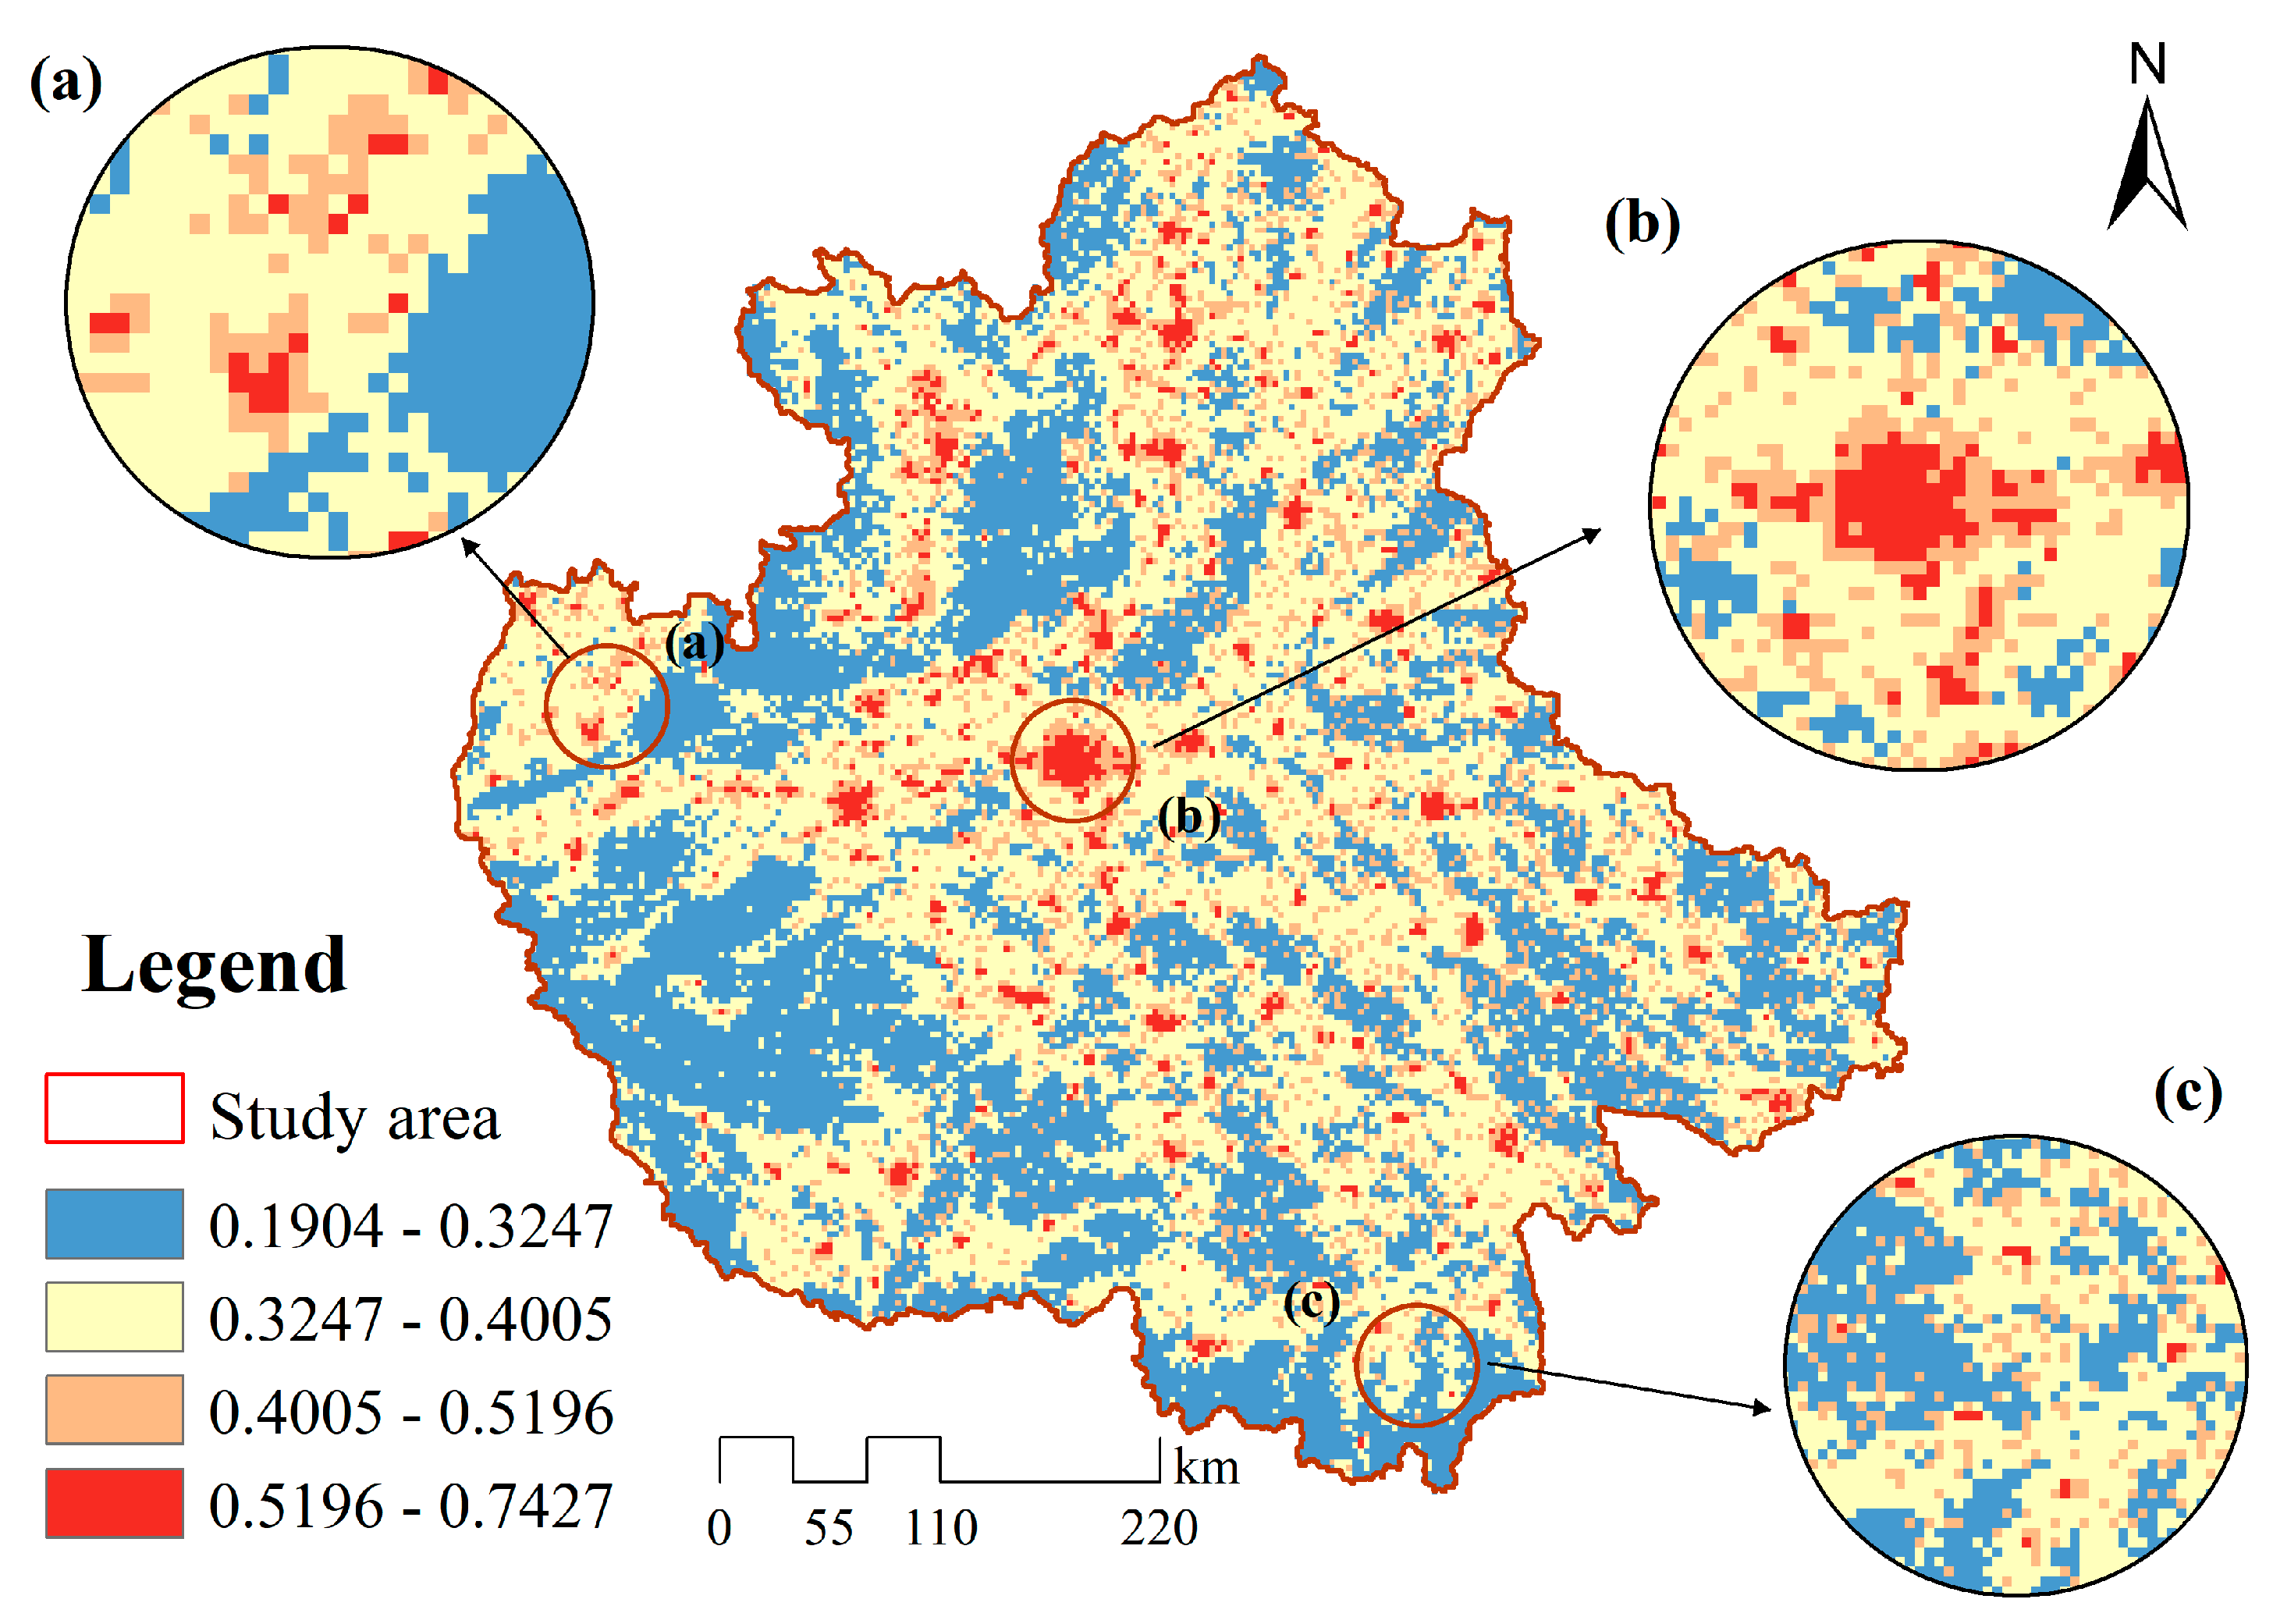
3.3.3. Construction of the Comprehensive Ecological Resistance Surface

Based on eight ecological resistance factors, including land use type, NDVI, and population density, a detailed ecological resistance map was created by using a weighted summation method after grading and normalization (Figure 9). The integrated ecological resistance values in the CPUA varied from 0.19 to 0.74, with higher resistance values indicating lower habitat resilience, and vice versa. The study results show that areas with high resistance values are primarily composed of construction land, significantly impacted by human activities. These areas are characterized by high-population-density, prolonged nighttime lighting, and low vegetation coverage, and are typically distributed in point-like or linear patterns with wide coverage. Zhengzhou City represents the largest concentrated area of high resistance values, while other large point-like distributions are mostly located in urban centers. Conversely, the western region of the CPUA, characterized by predominant forest and grassland, exhibits low resistance values. Due to lower levels of human interference, less developed transportation infrastructure, and higher vegetation coverage, these areas exert minimal influence on biomass and energy circulation within the ecosystem, resulting in lower ecological resistance and the smallest comprehensive resistance values.

3.3.4. Construction of the Ecological Network in the CPUA

In this study, 218 corridors with ecological potential were identified using the MCR model, derived from ecological sources and integrated resistance surfaces. Subsequently, 36 ecological corridors spanning a combined length of 2795.19 km were validated through the application of the Linkage Mapper tool (Figure 10). These corridors are crucial for linking diverse ecological sources and supporting biotic interactions within the regional ecological framework. To further assess the importance of the ecological corridors, a gravity model was applied to determine the interaction forces among the 20 ecological sources, prioritizing each corridor and refining the network’s hierarchical structure. The primary ecological corridors predominantly cluster in regions densely populated with ecological sources, such as Luoyang, Nanyang, and Xinyang, where ecosystems exhibit strong resilience and stability. In contrast, secondary ecological corridors primarily run in a north–south direction, passing through Xinxiang, Zhengzhou, Xuchang, and Luohe. These corridors are more widely distributed, with a narrow and elongated form, and serve as channels for biodiversity conservation and habitat connectivity. Additionally, the Circuitscape 4.0 software was utilized to pinpoint 26 critical pinch points mainly found in Zhumadian, Changzhi, and Pingdingshan—vital regions that support the uninterrupted flow of the ecological corridors. Furthermore, key nodes within the ecological network, known as “ecological stepping stones”, were recognized at the intersections of ecological corridors, providing temporary habitats and buffer zones for species migration and dispersal. Located primarily in Xinyang, Xuchang, Changzhi, and Sanmenxia, these stepping stones are crucial for preserving the overall ecological connectivity and biodiversity. Through rationalizing and protecting these nodes, we can greatly improve the robustness and adaptability of the regional ecological network, supporting the construction of a more resilient and comprehensive system.

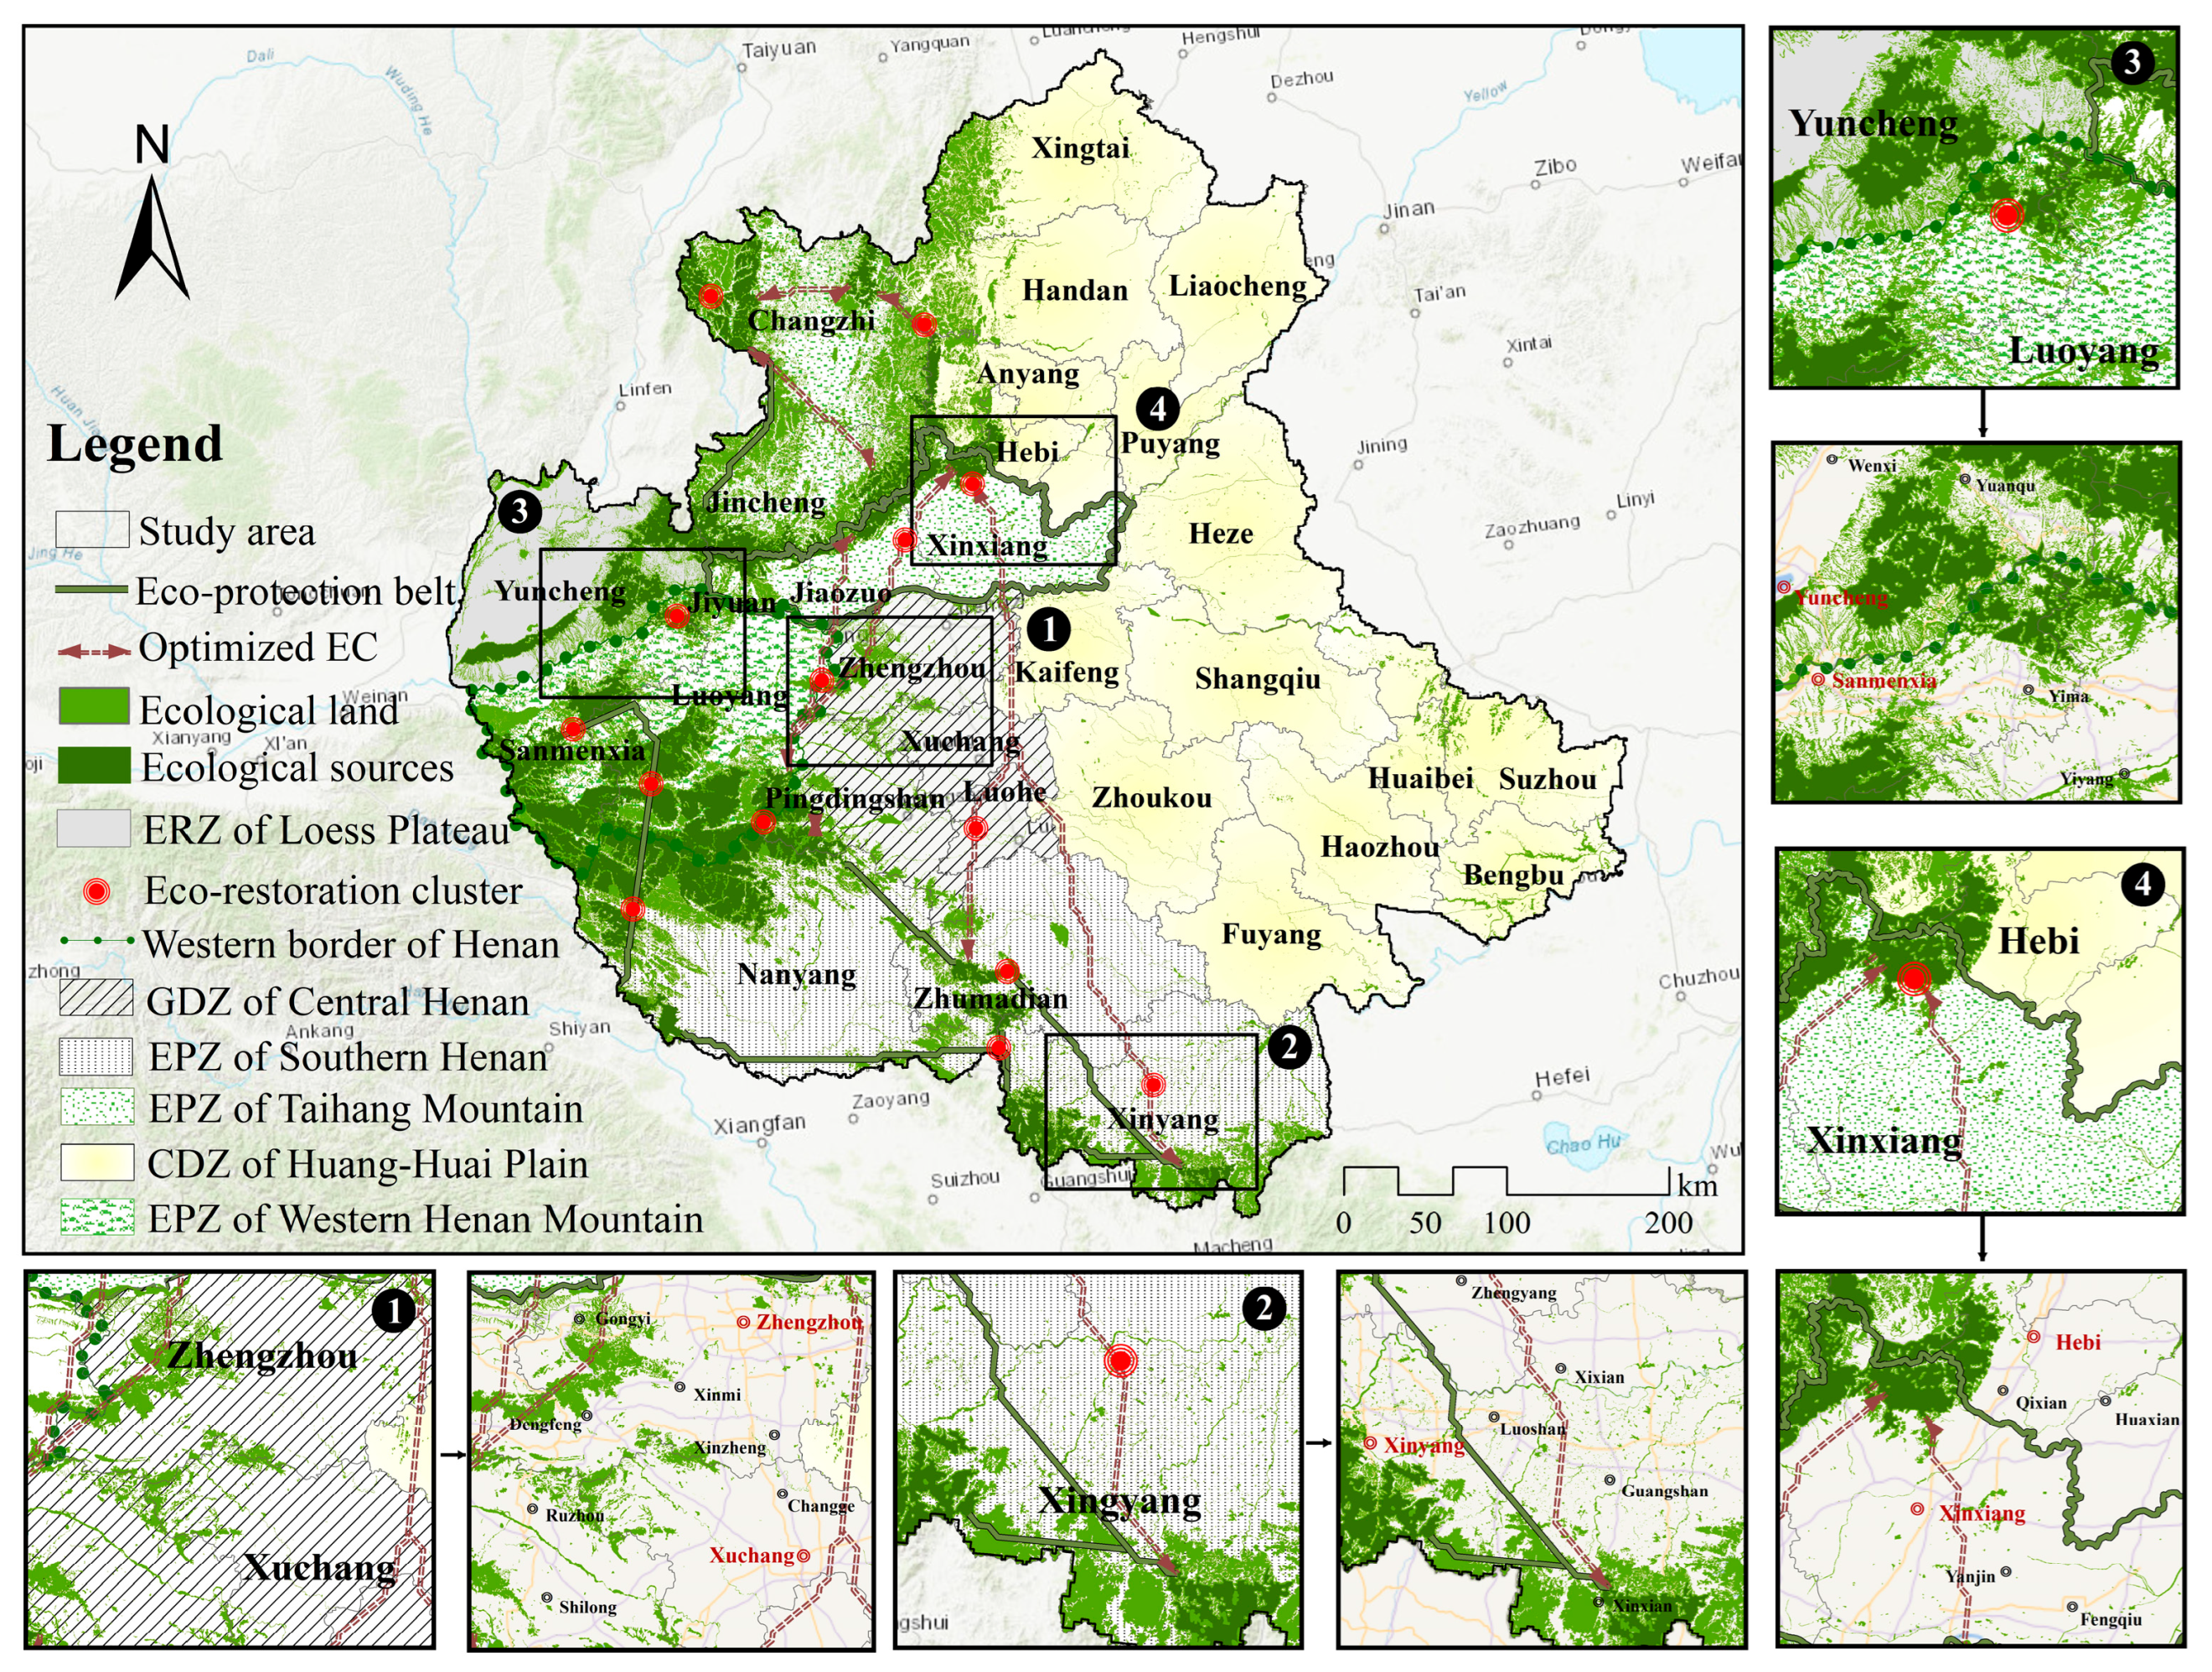
3.4. Optimized Spatial Layout of Ecological Spaces

Based on an integrated analysis of LUCC dynamics and ESV variations in the CPUA from 2005 to 2020, this study examined their implications for ecological network optimization. The findings indicate that LUCCs, particularly the expansion of construction land and the reduction in cultivated land and natural ecosystems, have significantly impacted ESV dynamics, leading to spatial disparities in ecological service supply and demand. These shifts, in turn, influenced the structural integrity and functional connectivity of the ecological network, necessitating a strategic optimization approach. To address these challenges, an optimized spatial framework—“five belts, six zones, multiple clusters, and corridors”—was developed, aiming to enhance ecological security and regional sustainability (Figure 11). Considering the CPUA’s geographic traits and the spatial evolution of ecological corridors and sources, five major ecological protection belts were delineated along the north–south axis: the Taihang Mountain, Yellow River water system, Qinling-Funiu Mountain, Dabie Mountain, and Southern Henan ecological protection belts. These belts function as critical ecological barriers, mitigating the fragmentation of key natural habitats and preserving essential ecological functions.
Furthermore, the CPUA was divided into six ecological functional zones, each tailored to its specific LUCC trends and ESV dynamics: the Loess Plateau Ecological Restoration Zone, the Huang-Huai Plain Comprehensive Development Zone, the Taihang Mountain Ecological Protection Zone, the Central Henan Green Development Zone, the Western Henan Mountainous Ecological Protection Zone, and the Southern Henan Ecological Protection Zon. Differentiated protection and restoration strategies were applied based on the dominant LUCCs and their ecological consequences. To strengthen inter-regional ecological connectivity, optimized secondary ecological corridors were incorporated, ensuring a functional linkage between fragmented ecological patches and reinforcing ecosystem resilience. Moreover, key ecological restoration clusters were established in areas where LUCC-driven disruptions weakened network connectivity, enhancing landscape-level ecological stability. This integrated approach ensures that the ecological network responds adaptively to land use transformation and ESV redistribution, forming a more resilient and sustainable ecological security pattern.

3.4.1. Construction of Ecological Protection Belts

As shown in Figure 11, the ecological protection belts in the CPUA are arranged not only east–west but also north–south, with a primary concentration in the western region. This layout is directly influenced by LUCCs and their impact on ESVs, ensuring that ecological network optimization effectively addresses regional environmental challenges. Specifically, urban expansion and agricultural intensification have significantly altered land cover, leading to habitat loss, increased soil erosion, and declining ecosystem service provision. These shifts have necessitated a strategic approach to ecological network planning, where the design of ecological protection belts serves to restore key services and enhance inter-regional connectivity. The Taihang Mountains–Yellow River Ecological Protection Belt, located along the urban fringe in Xinxiang, Jiaozuo (Henan), and Changzhi, Jincheng (Shanxi), acts as a crucial buffer between the North China Plain and the Loess Plateau. In this area, LUCC-driven land degradation has resulted in intensified soil erosion and a weakened water conservation capacity, exacerbating landscape instability. This belt is therefore designed to mitigate wind erosion, stabilize sand, and strengthen soil retention, ensuring long-term ecological stability. Similarly, the Qinling-Funiu Mountain Ecological Protection Belt, crossing Luoyang and Nanyang, contains highly diverse ecosystems that have been impacted by deforestation and land conversion. Given the declining biodiversity and climate regulation capacity in this region, the belt is strategically positioned to preserve ecological functions and enhance regional resilience to environmental disturbances. Further south, the Dabie Mountain and Southern Henan Ecological Protection Belts, spanning Xinyang, Nanyang, and Zhumadian, serve as key transition zones between northern and southern climates. Here, LUCC trends indicate increasing fragmentation of natural habitats due to agricultural expansion and infrastructure development, disrupting species migration pathways and weakening climate regulation services. To address these issues, the protection belts function as ecological corridors that strengthen north–south connectivity, regulate regional climate, and buffer extreme weather impacts on agriculture. Collectively, these ecological belts represent a LUCC-informed ecological network optimization strategy, ensuring that habitat degradation, soil erosion, and biodiversity loss are systematically mitigated to support long-term regional sustainability.

3.4.2. Delineation of Ecological Functional Zones

To implement targeted protection and development strategies, this study delineates the CPUA into six functional zones, considering each zone’s ecological vulnerability, resource characteristics, and development potential. These zones were designed based on LUCCs from 2005 to 2020, their corresponding impacts on ESVs, and the need to enhance ecological network connectivity. Land use transformation—such as urban expansion, agricultural intensification, and ecosystem degradation—has led to spatial shifts in ecosystem services, requiring an optimized spatial strategy to maintain ecological stability and improve functional connectivity. The Loess Plateau Ecological Restoration Zone, located in northwestern Yuncheng and surrounding areas, has undergone significant LUCC-driven vegetation loss and soil degradation, resulting in reduced water retention and increased erosion risks. These changes have weakened regional ecosystem resilience, making vegetation restoration and soil conservation critical for improving the ESVs related to climate regulation and land productivity. Similarly, the Huang-Huai Plain Comprehensive Development Zone, spanning Henan, Anhui, Hebei, and Shandong, has experienced expansion of croplands and urban areas, leading to alterations in food provisioning and water resource availability. To maintain the balance between agricultural productivity and ecological sustainability, this zone requires land use optimization, enhanced agricultural efficiency, and improved irrigation management to stabilize the ESVs while supporting economic growth. The Taihang Mountain Ecological Protection Zone, located between Henan and Shanxi (Xinxiang, Jiaozuo, Jincheng, Changzhi), functions as a natural ecological barrier, preventing LUCC-induced soil erosion and water loss. This zone is crucial for ESV maintenance, particularly in water conservation and habitat connectivity, as excessive land conversion has fragmented forests and weakened biodiversity corridors. In response, strengthening ecological corridors and reinforcing afforestation efforts will help reconnect fragmented habitats and stabilize ecosystem services. Likewise, the Central Henan Green Development Zone (Zhengzhou, Xuchang, Pingdingshan) has seen rapid urbanization, leading to a trade-off between economic growth and ecological functions. This area must prioritize low-carbon urban development, green industry promotion, and pollution control to enhance ecosystem resilience while maintaining economic productivity. The Western Henan Mountainous Ecological Protection Zone, covering Luoyang and Sanmenxia, contains high-altitude forests and critical water sources, making it a key area for ESV provision related to climate regulation and hydrological stability. LUCC analysis indicates increasing land conversion pressures, which threaten biodiversity and ecosystem stability. Protecting forested regions and regulating land use intensity will be crucial to safeguarding long-term ecological security. Finally, the Southern Henan Ecological Protection Zone (Xinyang, Zhumadian, Nanyang), encompassing the Dabie Mountains and surrounding hilly areas, acts as a transition zone between northern and southern climates. LUCC trends reveal a growing habitat fragmentation and shifting vegetation patterns, affecting species migration and biodiversity conservation. Establishing ecological reserves, strengthening conservation policies, and maintaining habitat connectivity will ensure the long-term stability of ecosystem services in this region.

3.4.3. Optimizing Connectivity of Ecological Corridors

The ecological restoration clusters in the CPUA primarily focus on addressing fracture points and blockage lines within ecological corridors, which have emerged as a result of LUCC-driven land fragmentation and ESV decline. These clusters are concentrated within the ecological restoration zones of the six functional zones, where bare land dominates, often accompanied by small patches of cultivated land. The conversion of natural ecosystems into urban and agricultural land has disrupted habitat continuity, increasing resistance to ecological flows and reducing critical ecosystem services such as biodiversity support, climate regulation, and soil retention. Thus, restoring and reconnecting these ecological fracture points is essential for enhancing landscape connectivity, stabilizing ecosystem functions, and ensuring long-term ecological resilience. As shown in Figure 11, central and southern Henan are particularly critical for ecological corridor optimization, given their intensive human activities, rapid urbanization, and infrastructure expansion. An LUCC analysis reveals that urban sprawl and land conversion have fragmented ecological corridors, resulting in low vegetation cover, insufficient connectivity nodes, and obstructed migration routes for wildlife. Consequently, the ESV assessment highlights significant declines in habitat provisioning and regulating services in these regions, further weakening ecological integrity. To counteract these disruptions, this study adopts a point-line-plane ecological network strategy, wherein ecological corridors serve as the backbone of an integrated network. By prioritizing corridor restoration, landscape connectivity can be significantly improved, facilitating the free movement of ecological elements and restoring ecosystem functionality. Future restoration efforts should be classified and prioritized based on regional geographic characteristics and the severity of LUCC-induced ecological degradation. Greening initiatives and habitat improvements along corridors should focus on increasing vegetation cover, reinforcing buffer zones, and restoring critical habitat patches. Additionally, integrated monitoring of ecological corridor breakpoints should be strengthened to ensure adaptive management of natural resources, thereby enhancing long-term ecosystem stability.

4. Discussion

Focusing on the ecological spatial pattern and its optimization at the urban-level is crucial for advancing green development, nurturing harmony between humans and nature, and achieving sustainable development goals. As urbanization accelerates, the rational planning and optimization of ecological spatial patterns not only serve as important strategies for addressing ecological and environmental pressures but also represent key pathways for enhancing urban resilience and fostering regional sustainable development. Through exploring the spatial layout of ecological networks within the CPUA, we identify both similarities and differences compared to previous studies, offering new insights and directions for further optimization of the ecological spatial pattern.

4.1. Spatial Structure Evolution in LUCC and ESV

Examining land use changes across various periods in the CPUA, we revealed a steady decline in urban cultivated land area, accompanied by a simultaneous rise in construction land. This spatial transfer reveals a clear shift from cultivated land to construction land. Rapid urbanization has significantly contributed to farmland loss, and it is projected that by 2030, 80% of global cultivated land reduction will be concentrated in developing regions, particularly in Asia and Africa [64]. Mu et al. (2023) evaluated vegetation net primary productivity (NPP) and found that urbanization-driven expansion in construction land largely replaced cultivated land, closely aligning with our findings [16]. However, Lei and Hai (2024) showed that in Lanzhou, grassland declined as construction land expanded, which contrasts with our conclusion regarding the decline in major cultivated land [65]. This discrepancy may be attributed to the ecological differences between the study areas; as a typical western city, Lanzhou relies more on grassland for its land use structure, whereas the CPUA primarily depends on cropland, resulting in varied impacts from urban expansion across land types.
Regarding the spatio-temporal distribution of ESVs, the CPUA exhibited an overall declining trend, primarily driven by the reduction in cultivated land. As urbanization progresses, productive and ecological areas, including cultivated land and grassland, are increasingly replaced by construction land. This transformation leads to a reduction in land that provides essential ecological services like food production, and carbon sequestration, thereby contributing to the overall decline in ESVs. However, the main factors driving the ESV change vary across regions. Zhang et al. (2024) identified watersheds as the key factor influencing the ESV change in Suzhou [66], while Yang et al. (2023) concluded that woodland and grassland were the leading contributors to ESV changes in the Qilian Mountains alpine region [67]. Additionally, this study found that forests had the greatest ESV compared to other land use categories and their value showed an increasing trend, in line with Feng et al. (2024) [68]. This increase stems from government policy support and growing ecological awareness, which have promoted forest restoration and expansion, further enhancing its ecological service functions. Looking forward, regional ecosystems’ structure and function can be optimized through reasonable land use planning and ecological protection strategies, thereby enhancing the CPUA’s overall ESV and fostering the harmonious development of urban and natural environments.

4.2. Value Assessment of Ecological Network Optimization

Building ecological networks can significantly enhance connectivity within urban ecosystems, promote biodiversity conservation, and improve system stability and resilience to disturbances. By identifying ecological sources, corridors, and nodes, this study proposes a spatial layout strategy of “five belts, six zones, multiple clusters, and corridors” aimed at optimizing the ecological spatial structure. Given the environmental differences across ecological zones and cities, differentiated protection and development strategies should be adopted in the future, tailored to the ecological vulnerability, resource characteristics, and development potential of each region within the CPUA [69]. Optimizing ecological spatial structures has proven to be an effective approach for strengthening regional ecological security while balancing development with environmental protection. For example, Liang et al. proposed a “three zones, four belts, and two clusters” strategy in the Suzhou-Southern Jiangsu region, integrating ecosystem service supply and demand to improve ecological connectivity while accommodating urban expansion [70]. Similarly, Zhang et al. introduced a “two zones, three belts, and four corridors” strategy for the Yellow River Estuary and its surrounding wetlands, which enhances ecological process circulation and meets human ecological demands [71]. In this study, the delineation of ecological protection zones, restoration zones, and green development areas—along with the establishment of ecological protection belts—follows similar approaches and aligns with the classification standards established in the existing literature [41,72,73,74]. In addition to spatial optimization, policy-driven land use change plays a critical role in shaping ecological network stability. For example, afforestation programs such as the “Grain for Green” initiative have contributed to vegetation recovery, improved ecological connectivity, and reduced soil erosion in fragile areas. Policies that encourage converting marginal farmland into forest patches or ecological buffer zones can significantly enhance habitat quality and expand the reach of ecological corridors, thereby reinforcing the integrity of the overall network. However, the ecological outcomes of such interventions are also influenced by implementation scale, land suitability, and regional ecological sensitivity-factors that must be integrated into spatial planning and governance design.
To address the distinct challenges of different ecological function zones within the CPUA, a series of governance strategies is proposed. First, interregional connectivity must be prioritized, and cross-boundary ecological protection and restoration mechanisms should be established to enhance overall ecosystem functionality [75]. Second, adaptive strategies should be developed based on the ecological characteristics and policy environments of each zone [76,77]. For instance, in the ecological restoration zone of the Loess Plateau, policy-supported efforts such as afforestation and grassland restoration continue to increase vegetation coverage and control soil erosion. In the comprehensive development zone of the Huang-Huai Plain, emphasis should be placed on cultivated land protection, land use optimization, agricultural efficiency, and integrating ecological safeguards into farmland policies. In the ecological protection zone of Taihangshan, its role as a natural barrier against erosion and a biodiversity refuge should be reinforced through strict land control and ecological compensation mechanisms. The green development zone of Central Henan should focus on the promotion of green industries and sustainable infrastructure development, aligning policy incentives with ecological goals. In Western Henan’s mountainous protection zone, continued farmland-to-forest conversion under national reforestation policy remains essential for restoring degraded slopes. In Southern Henan, the coordinated development of eco-agriculture and wellness industries can both comply with ecological zoning and stimulate local economic vitality. Through these region-specific and policy-responsive strategies, the CPUA can enhance ecosystem service values (ESVs), stabilize the ecological network, and address the spatial imbalances in ecological function. Looking ahead, optimizing ecological networks should not only prioritize improving habitat quality and reducing ecological resistance, but also integrate policy interventions more systematically—including land use regulation, ecological compensation, and reforestation planning—to mitigate ecological security risks. Furthermore, improving the planning and continuity of ecological corridors and watershed systems within urbanized areas remains essential to support long-term network resilience [78,79,80].

4.3. Limitations and Future Perspectives

This study provides important theoretical support and practical recommendations for the ecological spatial optimization of the CPUA. However, several limitations remain, which require further refinement in future research.
First, although the selection of ESV equivalent coefficients, ecological resistance factors, and their corresponding weights was based on existing studies and adjusted according to regional characteristics, it does not fully account for the dynamic variations in these thresholds over time and space. In the CPUA, a high-density urban agglomeration, rapid population concentration drives drastic land use changes and urban expansion, leading to significant differences in ecological foundations and economic development levels across cities and counties. This study does not make detailed adjustments to account for such regional heterogeneity, which may affect the precision of ecological network optimization. Future research should further integrate the socio-economic and ecological characteristics of each subregion and dynamically refine relevant parameters to improve the applicability of ecosystem service evaluation and ecological resistance surface modeling.
Second, this study does not sufficiently account for anthropogenic disturbance factors at the urban scale, such as transportation networks, hydrological conditions, and ecological risks, which are particularly pronounced in high-density urban agglomerations. Transportation infrastructure, including roads and railways, along with urban expansion and pollution emissions, can significantly impact the calibration of ecological resistance surfaces and consequently affect ecological network connectivity. However, this study does not fully quantify these variables in ecological network optimization, which may lead to an incomplete representation of human-ecosystem interactions. Additionally, this study does not incorporate social factors such as the local residents’ land use patterns and policy influences into the ecological network construction. In reality, agricultural expansion, urban green space development, ecological protection policies, and land use planning all play a crucial role in shaping ecological connectivity. For instance, ecological compensation policies may promote habitat restoration, while rapid urbanization can exacerbate habitat fragmentation. Neglecting these factors limits the applicability of the ecological network model in real-world spatial planning and policy decision-making. Therefore, future research should integrate socio-economic data, policy frameworks, and governance mechanisms into ecological network optimization to enhance its practical applicability and policy relevance.
Third, this study does not sufficiently assess the long-term stability of ecological networks under climate change. Current ecological network optimization primarily relies on existing land use and ecological connectivity data, without considering the impacts of extreme climate events, including heavy rainfall, droughts, and temperature variations, on network stability. For example, extreme precipitation may cause wetland expansion or shrinkage, altering habitat connectivity, while prolonged droughts could accelerate vegetation degradation, reducing the suitability of ecological corridors. These factors may weaken the stability and long-term sustainability of ecological networks. A key challenge in incorporating climate change into ecological network construction is the broad spatial scale and inherent uncertainties of long-term climate projections, making it difficult to accurately assess localized ecological responses. Future research should incorporate climate scenario simulations, such as CMIP6 datasets, alongside ecological modeling techniques like dynamic landscape models to evaluate the adaptability of ecological networks under varying climate conditions and develop targeted optimization strategies for mitigating climate change impacts.
Fourth, limitations in data and methodology constrain the accuracy and applicability of the study’s findings. This study primarily relies on existing datasets, which have limitations in spatial resolution, temporal update frequency, and data completeness. For example, remote sensing data may not capture real-time land use changes, while socio-economic datasets may fail to accurately reflect localized human activities affecting ecological network optimization. In MSPA, both grain size and edge width can affect the identification of ecological sources. Based on the relevant literature [81,82], this study adopted an edge width of 30 m to better capture core and bridge areas while preserving small but ecologically important patches. However, using a single edge width may limit the robustness of the results. Future research should assess the sensitivity of MSPA outputs to different edge widths to enhance the reliability of ecological source identification. Additionally, the estimation of ecosystem service value and the construction of ecological resistance surfaces are based on static assumptions, which do not fully account for the dynamic changes in environmental and socio-economic conditions. This limitation reduces the adaptability of the model to real-world complexities and policy-driven landscape transformations. Future research should improve data integration by incorporating multi-source datasets, including high-resolution remote sensing, socio-economic surveys, and spatial big data. Methodologically, adaptive modeling approaches should be employed to better reflect the dynamic ecological and human-environment interactions. Future research could improve data integration by incorporating higher-resolution spatial and socio-economic datasets. Refining modeling approaches to better account for temporal and spatial variations would also enhance the accuracy of ecological network assessments. Furthermore, considering policy-related factors, such as land use regulations and conservation incentives, may improve the practical relevance of ecological network optimization in urban planning and environmental management.
In conclusion, future research should refine ecological network optimization by (1) improving ESV estimation and ecological resistance surface construction by incorporating more socio-economic and ecological variables to enhance model accuracy; (2) strengthening the consideration of anthropogenic disturbance factors and leveraging high-resolution remote sensing and intelligent technologies for dynamic monitoring; (3) integrating climate change scenarios to assess the long-term adaptability of ecological networks; (4) enhancing data quality through multi-source integration, adaptive modeling, and multi-scales MSPA to improve the spatiotemporal accuracy of ecological network assessments. These improvements will enhance the adaptability and sustainability of the CPUA ecological network, enabling it to better respond to the challenges posed by urbanization and environmental changes.

5. Conclusions

Ecological networks are essential for upholding regional ecological security. The study constructs CPUA’s ecological network by integrating land use, ESV, and circuit theory, and proposes a step-by-step scheme for optimizing the ecological spatial layout. This scheme builds on the spatial distribution of the network’s components and the region’s ecological and environmental challenges. The key findings include:
(1)
The CPUA’s land use structure underwent significant changes. Cultivated land area steadily decreased, bare land followed a pattern of “increase, then decrease”, and construction land expanded rapidly. Meanwhile, forest and grassland areas remained stable, reflecting the effectiveness of ecological protection policies. Regarding land transfer, cultivated land transitioned to construction land, with a transfer area totaling 15,860.59 km2, making up 77.14% of all transferred land. Forest and waterbody transfers were roughly balanced, with a gradual increase over time. Grassland and bare land were mostly transferred to cultivated or construction land, resulting in an overall reduction in their area. These frequent transfers between land types reveal the dynamic balance between urban growth and ecological protection needs.
(2)
From 2005 to 2020, the ESV of the CPUA decreased by 1.27 billion dollars, exhibiting clear spatial differentiation. Areas with high ESVs are mainly found in the hilly regions of Nanyang, Xinyang, Pingdingshan, and Zhumadian in the southwest, where high levels of ecological services are maintained due to water conservation and soil retention functions. Medium-ESV areas are concentrated in Sanmenxia, Yuncheng, and Jincheng in the west, characterized by diverse land use types and relatively stable ecological functions. Low-ESV areas, which make up the largest portion, are mainly composed of construction and cultivated land, spread widely across the central and western regions of the CPUA. These areas exhibit weaker ecological service functions due to disturbances from urbanization and agricultural production. The changes in ESVs across different land types highlight the challenges of maintaining ecosystem balance amid rapid urbanization and land use restructuring in the CPUA.
(3)
Utilizing the natural features of the CPUA, this study constructed an ecological network comprising 20 ecological sources and 36 corridors. Ecological sources are approximately 21,434.70 km2, primarily located in the western region, extending across the Taihang, Dabie, and Funiu mountain ranges. The ecological corridors span approximately 2795.19 km, running predominantly in a north–south direction through the central and western regions of the agglomeration, involving major cities like Zhengzhou and Luoyang. By integrating spatial variations in LUCCs and ESVs, this study proposes an optimized ecological spatial layout of “five belts, six zones, multiple clusters, and corridors” and develops differentiated strategies to address regional ecological issues. These strategies aim to harmonize ecological protection and restoration efforts while promoting sustainable ecological and economic development across the CPUA.

Author Contributions

Conceptualization, T.Y. and S.J.; methodology, S.J. and B.D.; data curation, T.Y. and S.J.; writing—original draft preparation, T.Y., S.J. and B.D.; writing—review and editing, T.Y. and X.C.; visualization, S.J.; funding acquisition, T.Y. and X.C. All authors have read and agreed to the published version of the manuscript.

Funding

This work was supported by the National Social Science Fund of China (Grant No. 24BJY031).

Data Availability Statement

The datasets used and/or analyzed in this study are available from the corresponding author upon reasonable request.

Conflicts of Interest

The authors declare no conflicts of interest.

References

  1. Turok, I.; McGranahan, G. Urbanization and economic growth: The arguments and evidence for Africa and Asia. Environ. Urban. 2013, 25, 465–482. [Google Scholar] [CrossRef]
  2. Wang, C.; Wang, Q.; Liu, N.; Sun, Y.; Guo, H.; Song, X. The impact of LUCC on the spatial pattern of ecological network during urbanization: A case study of Jinan City. Ecol. Indic. 2023, 155, 111004. [Google Scholar] [CrossRef]
  3. Li, C.; Fang, S.; Geng, X.; Yuan, Y.; Zheng, X.; Zhang, D.; Li, R.; Sun, W.; Wang, X. Coastal ecosystem service in response to past and future land use and land cover change dynamics in the Yangtze river estuary. J. Clean. Prod. 2023, 385, 135601. [Google Scholar] [CrossRef]
  4. Ondik, M.M.; Ooi, M.K.J.; Muñoz-Rojas, M. Soil microbial community composition and functions are disrupted by fire and land use in a Mediterranean woodland. Sci. Total Environ. 2023, 895, 165088. [Google Scholar] [CrossRef]
  5. Xiong, X.; Zhou, T.; Cai, T.; Huang, W.; Li, J.; Cui, X.; Li, F. Land Use Transition and Effects on Ecosystem Services in Water-Rich Cities under Rapid Urbanization: A Case Study of Wuhan City, China. Land 2022, 11, 1153. [Google Scholar] [CrossRef]
  6. Tian, Y.; Jim, C.Y.; Tao, Y.; Shi, T. Landscape ecological assessment of green space fragmentation in Hong Kong. Urban For. Urban Green. 2011, 10, 79–86. [Google Scholar] [CrossRef]
  7. Sutton, P.C.; Anderson, S.J.; Costanza, R.; Kubiszewski, I. The ecological economics of land degradation: Impacts on ecosystem service values. Ecol. Econ. 2016, 129, 182–192. [Google Scholar] [CrossRef]
  8. Han, B.; Liu, H.; Wang, R. Urban ecological security assessment for cities in the Beijing-Tianjin-Hebei metropolitan region based on fuzzy and entropy methods. Ecol. Model. 2015, 318, 217–225. [Google Scholar] [CrossRef]
  9. Levis, C.; Flores, B.M.; Campos-Silva, J.V.; Peroni, N.; Staal, A.; Padgurschi, M.G.; Dorshow, W.; Moraes, B.; Schmidt, M.; Kuikuro, T.W.; et al. Contributions of human cultures to biodiversity and ecosystem conservation. Nat. Ecol. Evol. 2024, 8, 866–879. [Google Scholar] [CrossRef]
  10. Zhang, C.; Su, B.; Beckmann, M.; Volk, M. Emergy-based evaluation of ecosystem services: Progress and perspectives. Renew. Sustain. Energy Rev. 2024, 192, 114201. [Google Scholar] [CrossRef]
  11. Zhou, J.; Hou, Q.; Li, W. Spatial resilience assessment and optimization of small watershed based on complex network theory. Ecol. Indic. 2022, 145, 109730. [Google Scholar] [CrossRef]
  12. Yu, T.; Jia, S.; Zhang, Y.; Cui, X. How can urban expansion and ecological preservation be balanced? A simulation of the spatial dynamics of production-living-ecological spaces in the Huaihe River Eco-Economic Belt. Ecol. Indic. 2025, 171, 113192. [Google Scholar] [CrossRef]
  13. Yang, J.; Deng, W.; Zhang, G.; Cui, X. Linking endangered species protection to construct and optimize ecological security patterns in the National ecological Civilization construction Demonstration Zone: A case study of Yichang, China. Ecol. Indic. 2024, 158, 111579. [Google Scholar] [CrossRef]
  14. Wang, X.; Wang, C.; Shi, J. Spatial and temporal evolution of urban resilience and its transition mechanism in Zhongyuan Urban Agglomeration. Sci. Geogr. Sin. 2024, 7, 44. [Google Scholar] [CrossRef]
  15. Chen, Y.; Zhou, P.; Zhang, H. Analysis on Driving Forces and Evolution Process of Logistics in the Central Plains Urban Agglomeration. Int. J. Soc. Sci. Innov. Educ. Technol. 2021, 15, 56. [Google Scholar]
  16. Mu, W.; Zhu, X.; Ma, W.; Han, Y.; Huang, H.; Huang, X. Impact assessment of urbanization on vegetation net primary productivity: A case study of the core development area in central plains urban agglomeration, China. Environ. Res. 2023, 229, 115995. [Google Scholar] [CrossRef]
  17. Troll, C. Landschaftsökologie und Biogeographie. Stuttg. Geogr. Stud. 1939, 7, 179–188. [Google Scholar]
  18. Forman, R.T.T.; Godron, M. Landscape Ecology; John Wiley & Sons: New York, NY, USA, 1986; Volume 4, pp. 22–28. [Google Scholar]
  19. Qu, Y.; Lu, M. Research progress on development trend of ecological network planning. Urban Dev. Stud. 2016, 23, 29–36. [Google Scholar]
  20. Chauhan, S.; Yadav, G.; Babu, S. Ecological networks in urban forest fragments reveal species associations between native and invasive plant communities. Plants 2022, 11, 541. [Google Scholar] [CrossRef]
  21. Zhou, G.J.; Huan, Y.Z.; Wang, L.Q.; Zhang, R.Q.; Liang, T.; Han, X.X.; Feng, Z.H. Constructing a multi-leveled ecological security pattern for improving ecosystem connectivity in the Asian water Tower region. Ecol. Indic. 2023, 154, 110597. [Google Scholar] [CrossRef]
  22. Li, M.; Zhou, Q.; Meng, H.; Peng, C.; Liu, X.; Zhou, L. Ecological Security Layout Planning of Chongqing Section in the Three Gorges Reservoir Area Based on the Model of Minimum Cumulative Coefficient. Resour. Environ. Yangtze Basin 2021, 30, 1916–1926. [Google Scholar] [CrossRef]
  23. Fan, S.X.; Axmacher, J.C.; Shu, H.J.; Liu, Y.H. Ecological network design based on optimizing ecosystem services: Case study in the Huang-Huai-Hai region, China. Ecol. Indic. 2023, 150, 110264. [Google Scholar] [CrossRef]
  24. Yang, Q.; Wang, L.; Li, Y.; Qin, X. Urban spatial expansion mode based on the construction of landscape ecological security pattern: A case of the coastal area of Jiangsu. Sci. Geogr. Sin. 2021, 41, 737–746. [Google Scholar] [CrossRef]
  25. Zhang, S.; Xiong, K.; Qin, Y.; Min, X.; Xiao, J. Evolution and determinants of ecosystem services: Insights from South China karst. Ecol. Indic. 2021, 133, 108437. [Google Scholar] [CrossRef]
  26. Ye, X.; Zou, C.X.; Liu, G.H.; Lin, N.; Xu, M. Main research contents and advances in the ecological security pattern. Acta Ecol. Sin. 2018, 38, 3382–3392. [Google Scholar]
  27. Zhao, X.Q.; Xu, X.H. Research on landscape ecological security pattern in a eucalyptus introduced region based on biodiversity conservation. Russ. J. Ecol. 2015, 46, 59–70. [Google Scholar] [CrossRef]
  28. Aminzadeh, B.; Khansefid, M. A case study of urban ecological networks and a sustainable city: Tehran’s metropolitan area. Urban Ecosyst. 2010, 13, 23–36. [Google Scholar] [CrossRef]
  29. Liu, X.Y.; Wei, M.; Zeng, J.; Zhang, S. Ecological network analysis and construction: A case study of the urban agglomeration of the Min River Delta, China. Resour. Sci. 2021, 43, 357–367. [Google Scholar] [CrossRef]
  30. Wei, Q.Q.; Halike, A.; Yao, K.X.; Chen, L.; Balati, M. Construction and optimization of ecological security pattern in Ebinur Lake Basin based on MSPA-MCR models. Ecol. Indic. 2022, 138, 108857. [Google Scholar] [CrossRef]
  31. Wang, C.; Yu, C.; Chen, T.; Feng, Z.; Hu, Y.; Wu, K. Can the establishment of ecological security patterns improve ecological protection? An example of Nanchang, China. Sci. Total Environ. 2020, 740, 140051. [Google Scholar] [CrossRef] [PubMed]
  32. Wang, Y.; Pan, J. Building ecological security patterns based on ecosystem services value reconstruction in an arid inland basin: A case study in Ganzhou District, NW China. J. Clean. Prod. 2019, 241, 118337. [Google Scholar] [CrossRef]
  33. Ye, Y.; Su, Y.; Zhang, H.; Liu, K.; Wu, Q. Construction of an ecological resistance surface model and its application in urban expansion simulations. J. Geogr. Sci. 2015, 25, 211–224. [Google Scholar] [CrossRef]
  34. Wang, G.; Li, J.; Liu, X.; Li, B.; Zhang, Y. Social-ecological network of peri-urban forest in urban expansion: A case study of urban agglomeration in Guanzhong Plain, China. Land Use Policy 2024, 139, 107074. [Google Scholar] [CrossRef]
  35. Zhou, G.; Huan, Y.; Wang, L.; Lan, Y.; Liang, T.; Shi, B.; Zhang, Q. Linking ecosystem services and circuit theory to identify priority conservation and restoration areas from an ecological network perspective. Sci. Total Environ. 2023, 873, 162261. [Google Scholar] [CrossRef]
  36. Yang, T.R.; Kuang, W.H.; Liu, W.D.; Liu, A.L.; Pan, T. Optimizing the layout of eco-spatial structure in Guanzhong urban agglomeration based on the ecological security pattern. Geogr. Res. 2017, 36, 441–452. [Google Scholar] [CrossRef]
  37. Fath, B.D.; Asmus, H.; Asmus, R.; Baird, D.; Borrett, S.R.; de Jonge, V.N.; Ludovisi, A.; Niquil, N.; Scharler, U.M.; Schückel, U.; et al. Ecological network analysis metrics: The need for an entire ecosystem approach in management and policy. Ocean Coast. Manag 2019, 174, 1–14. [Google Scholar] [CrossRef]
  38. Huang, X.X.; Wang, H.J.; Shan, L.Y.; Xiao, F. Constructing and optimizing urban ecological network in the context of rapid urbanization for improving landscape connectivity. Ecol. Indic. 2021, 132, 108319. [Google Scholar] [CrossRef]
  39. Xu, D.; Peng, J.; Jiang, H.; Dong, J.; Liu, M.; Chen, Y.; Wu, J.; Meermans, J. Incorporating barriers restoration and stepping stones establishment to enhance the connectivity of watershed ecological security patterns. Appl. Geogr. 2024, 170, 103347. [Google Scholar] [CrossRef]
  40. Chen, W.; Gu, T.; Xiang, J.; Luo, T.; Zeng, J.; Yuan, Y. Ecological restoration zoning of territorial space in China: An ecosystem health perspective. J. Environ. Manag. 2024, 364, 121371. [Google Scholar] [CrossRef]
  41. Wang, H.Y.; Niu, W.H.; Song, M.; Zhang, B.B.; Jin, Y.Y. Construction and spatial optimization of ecological network in Shaanxi Province based on LUCC and its ESV response. Resour. Sci. 2023, 45, 1380–1395. [Google Scholar] [CrossRef]
  42. Wang, Y.; Qu, Z.; Zhong, Q.; Zhang, Q.; Zhang, L.; Zhang, R.; Yi, Y.; Zhang, G.; Li, X.; Liu, J. Delimitation of ecological corridors in a highly urbanizing region based on circuit theory and MSPA. Ecol. Indic. 2022, 142, 109258. [Google Scholar] [CrossRef]
  43. Li, Y.; Liu, W.; Feng, Q.; Zhu, M.; Yang, L.; Zhang, J.; Yin, X. The role of land use change in affecting ecosystem services and the ecological security pattern of the Hexi Regions, Northwest China. Sci. Total Environ. 2023, 855, 158940. [Google Scholar] [CrossRef] [PubMed]
  44. Mu, H.; Li, X.; Ma, H.; Du, X.; Huang, J.; Su, W.; Yu, Z.; Xu, C.; Liu, H.; Yin, D.; et al. Evaluation of the policy-driven ecological network in the Three-North Shelterbelt region of China. Landsc. Urban Plan. 2022, 218, 104305. [Google Scholar] [CrossRef]
  45. Luo, G.; Jin, T.; Zhang, H.; Peng, J.; Zuo, N.; Huang, Y.; Han, Y.; Tian, C.; Yang, Y.; Peng, K.; et al. Deciphering the diversity and functions of plastisphere bacterial communities in plastic-mulching croplands of subtropical China. J. Hazard. Mater. 2022, 422, 126865. [Google Scholar] [CrossRef]
  46. Yang, J.; Zeng, C.; Cheng, Y. Spatial influence of ecological networks on land use intensity. Sci. Total Environ. 2020, 717, 137151. [Google Scholar] [CrossRef]
  47. Fang, C.L. Progress and the future direction of research into urban agglomeration in China. Acta Geogr. Sin. 2014, 69, 1130–1144. [Google Scholar] [CrossRef]
  48. Li, S.C.; Gong, J.; Yang, J.X.; Zhang, Z.; Zhang, M. Characteristics of LUCC patterns of the Lanzhou-Xining urban agglomeration: Based on an intensity analysis framework. Resour. Sci. 2023, 45, 480–493. [Google Scholar] [CrossRef]
  49. Liu, Y.; Yuan, X.; Li, J.; Qian, K.; Yan, W.; Yang, X.; Ma, X. Trade-offs and synergistic relationships of ecosystem services under land use change in Xinjiang from 1990 to 2020: A Bayesian network analysis. Sci. Total Environ. 2023, 858, 160015. [Google Scholar] [CrossRef]
  50. Zhang, P.; Liu, L.; Yang, L.; Zhao, J.; Li, Y.; Qi, Y.; Ma, X.; Cao, L. Exploring the response of ecosystem service value to land use changes under multiple scenarios coupling a mixed-cell cellular automata model and system dynamics model in Xi’an, China. Ecol. Indic. 2023, 147, 110009. [Google Scholar] [CrossRef]
  51. Costanza, R.; d’Arge, R.; de Groot, R.; Farber, S.; Grasso, M.; Hannon, B.; Limburg, K.; Naeem, S.; O’Neill, R.; Paruelo, J.; et al. The value of the world’s ecosystem services and natural capital. Nature 1997, 387, 253–260. [Google Scholar] [CrossRef]
  52. Xie, G.D.; Zhang, C.X.; Zhang, L.M.; Chen, W.H.; Li, S.M. Improvement of the evaluation method for ecosystem service value based on per unit area. J. Nat. Resour. 2015, 30, 1243–1254. [Google Scholar] [CrossRef]
  53. Zhao, Y.; Zhang, X.; Wu, Q.; Huang, J.; Ling, F.; Wang, L. Characteristics of spatial and temporal changes in ecosystem service value and threshold effect in Henan along the Yellow River, China. Ecol. Indic. 2024, 166, 112531. [Google Scholar] [CrossRef]
  54. Wang, W.; Sun, T.; Wang, J.; Fu, Q.; An, C. Annual Dynamic Monitoring of Regional Ecosystem Service Value Based on Multi-source Remote Sensing Data: A Case of Central Plains Urban Agglomeration Region. Sci. Geogr. Sin. 2019, 39, 680–687. [Google Scholar] [CrossRef]
  55. Li, J.; Hu, D.; Wang, Y.; Chu, J.; Yin, H.; Ma, M. Study of identification and simulation of ecological zoning through integration of landscape ecological risk and ecosystem service value. Sustain. Cities Soc. 2024, 107, 105442. [Google Scholar] [CrossRef]
  56. Huang, L.; Chen, Z.; Yang, Z.; Chen, M.; Chen, X.; Zhai, T.; Qiu, T. Integrating “quality-risk-demand” framework and circuit theory to identify spatial range and priority area of ecological security pattern in a rapidly urbanizing landscape. Ecol. Inform. 2024, 82, 102673. [Google Scholar] [CrossRef]
  57. Gu, T.; Tong, Y.; Wang, S.; You, Z.; Li, D.; Jiang, Y.; Rafaqat, A.; Wang, C.; Zhang, Q. Identifying the priority areas for ecological protection considering ecological connectivity and ecosystem integrity: A case study of Xianyang City, China. Ecol. Indic. 2024, 163, 112102. [Google Scholar] [CrossRef]
  58. Huang, J.; Guang, P.; Gao, J.; Wang, X.; Guo, H. Multiscale spatiotemporal characteristics and influencing factors of ecosystem service value of groundwater in China. J. Environ. Manag. 2024, 368, 122196. [Google Scholar] [CrossRef]
  59. Tiang, D.C.F.; Morris, A.; Bell, M.; Gibbins, C.N.; Azhar, B.; Lechner, A.M. Ecological connectivity in fragmented agricultural landscapes and the importance of scattered trees and small patches. Ecol. Process. 2021, 10, 20. Available online: https://link.springer.com/article/10.1186/S13717-021-00284-7 (accessed on 30 March 2025).
  60. Han, Y.; Wang, J.; Yu, S.; Cheng, S.; Li, Y. Construction and optimization of ecological network in the Saihanba area. J. Arid Land Resour. Environ. 2023, 37, 112–121. [Google Scholar] [CrossRef]
  61. Cao, W.; Jia, G.; Yang, Q.; Sun, H.; Wang, L.; Svenning, J.C.; Wen, L. Construction of ecological network and its temporal and spatial evolution characteristics: A case study of Ulanqab. Ecol. Indic. 2024, 166, 112344. [Google Scholar] [CrossRef]
  62. Qian, M.; Huang, Y.; Cao, Y.; Wu, J.; Xiong, Y. Ecological network construction and optimization in Guangzhou from the perspective of biodiversity conservation. J. Environ. Manag. 2023, 336, 117692. [Google Scholar] [CrossRef]
  63. Liang, J.; He, X.; Zeng, G.; Zhou, M.; Guo, X.; Li, X.; Li, X.; Wu, H.; Feng, C.; Xing, W.; et al. Integrating priority areas and ecological corridors into national network for conservation planning in China. Sci. Total Environ. 2018, 626, 22–29. [Google Scholar] [CrossRef] [PubMed]
  64. Brend’Amour, C.; Reitsma, F.; Baiocchi, G.; Seto, K. Future urban land expansion and implications for global croplands. Proc. Natl. Acad. Sci. USA 2017, 114, 8939–8944. [Google Scholar] [CrossRef] [PubMed]
  65. Lei, X.; Hai, X. Assessing economic value of carbon storage and land use changes based on the coupled PLUS-InVEST model in Lanzhou City. Sci. Geogr. Sin. 2025, 2, 45. [Google Scholar] [CrossRef]
  66. Zhang, X.L.; Niu, C.H.; Ma, S.; Wang, L.J.; Hu, H.B.; Jiang, J. Exploring ecological compensation standards in the urbanization process: An ecosystem service value-based perspective. Ecol. Indic. 2024, 166, 112510. [Google Scholar] [CrossRef]
  67. Yang, H.; Gou, X.; Xue, B.; Ma, W.; Kuang, W.; Tu, Z.; Gao, L.; Yin, D.; Zhang, J. Research on the change of alpine ecosystem service value and its sustainable development path. Ecol. Indic. 2023, 146, 109893. [Google Scholar] [CrossRef]
  68. Feng, Z.; Sun, L. Response of spatial and temporal variations of ecosystem service value to land use/land cover transformation in the upper basin of Miyun Reservoir. Ecol. Indic. 2024, 160, 111819. [Google Scholar] [CrossRef]
  69. Jiang, H.; Peng, J.; Xu, D.; Tang, H. Constructing ecological security patterns with differentiated management intensity based on multifunctional landscape identification and multi-criteria decision-making. Glob. Ecol. Conserv. 2024, 50, e02862. [Google Scholar] [CrossRef]
  70. Liang, K.; Jin, X.; Zhang, X.; Song, P.; Li, Q.; Yong, S.; Qi, K.; Zhou, Y. Construction of ecological security patterns coupling supply and demand of ecosystem services: A case study of Southern Jiangsu Province. Acta Ecol. Sin. 2024, 44, 3880–3896. [Google Scholar] [CrossRef]
  71. Zhang, Z.; Wang, Q.; Feng, Y.; Sun, Y.; Liu, N.; Yan, S. The spatio-temporal evolution of spatial structure and supply-demand relationships of the ecological network in the Yellow River Delta region of China. J. Clean. Prod. 2024, 471, 143388. [Google Scholar] [CrossRef]
  72. Tian, H.; Wang, H.; Lyu, X.; Li, X.; Yang, Y.; Zhang, Y.; Liu, J.; Lu, Y.; Zhao, X.; Qu, T.; et al. Construction and optimization of ecological security patterns in Dryland watersheds considering ecosystem services flows. Ecol. Indic. 2024, 159, 111664. [Google Scholar] [CrossRef]
  73. Wang, T.; Huang, Y.; Cheng, J.; Xiong, H.; Ying, Y.; Feng, Y.; Wang, J. Construction and optimization of watershed-scale ecological network based on complex network method: A case study of Erhai Lake Basin in China. Ecol. Indic. 2024, 160, 111794. [Google Scholar] [CrossRef]
  74. Shuai, N.; Hu, Y.; Chen, J.; Liu, X.; Bai, Y. Does ecological network affect the construction land spatial development intensity? An empirical study based on the main urban area of Jinan, China. Ecol. Inform. 2024, 81, 102609. [Google Scholar] [CrossRef]
  75. Liu, M.; Peng, J.; Dong, J.; Jiang, H.; Xu, D.; Meersmans, J. Trade-offs of landscape connectivity between regional and interregional ecological security patterns in a junction area of the Beijing-Tianjin-Hebei region. Appl. Geogr. 2024, 167, 103272. [Google Scholar] [CrossRef]
  76. Li, Q.; Zhou, Y.; Yi, S. An integrated approach to constructing ecological security patterns and identifying ecological restoration and protection areas: A case study of Jingmen, China. Ecol. Indic. 2022, 137, 108723. [Google Scholar] [CrossRef]
  77. Xiang, K.; Chen, L.; Li, W.; He, Z. Construction and Optimization Strategy of Ecological Security Pattern in County-Level Cities under Spatial and Temporal Variation of Ecosystem Services: Case Study of Mianzhu, China. Land 2024, 13, 936. [Google Scholar] [CrossRef]
  78. Nie, W.; Shi, Y.; Siaw, M.J.; Yang, F.; Wu, R.; Wu, X.; Zheng, X.; Bao, Z. Constructing and optimizing ecological network at county and town Scale: The case of Anji County, China. Ecol. Indic. 2021, 132, 108294. [Google Scholar] [CrossRef]
  79. Wang, J.; Bai, Y.; Huang, Z.; Ashraf, A.; Ali, M.; Fang, Z.; Lu, X. Identifying ecological security patterns to prioritize conservation and restoration: A case study in Xishuangbanna tropical region, China. J. Clean. Prod. 2024, 444, 141222. [Google Scholar] [CrossRef]
  80. Cui, L.; Wang, J.; Sun, L.; Lv, C. Construction and optimization of green space ecological networks in urban fringe areas: A case study with the urban fringe area of Tongzhou district in Beijing. J. Clean. Prod. 2020, 276, 124266. [Google Scholar] [CrossRef]
  81. Lin, Y.; An, W.; Gan, M.; Shahtahmassebi, A.R.; Ye, Z.; Huang, L.; Zhu, C.; Huang, L.; Zhang, J.; Wang, K. Spatial grain effects of urban green space cover maps on assessing habitat fragmentation and connectivity. Land 2021, 10, 1065. [Google Scholar] [CrossRef]
  82. Shen, W.; Liu, Q.; Ji, M.; He, J.; He, T.; Huang, X. Impacts of urban forests and landscape characteristics on land surface temperature in two urban agglomeration areas of China. Sustain. Cities Soc. 2023, 99, 104909. [Google Scholar] [CrossRef]
Figure 1. Research Framework.
Land 14 00768 g001
Figure 2. The location of the CPUA.
Land 14 00768 g002
Figure 3. Individual ecological resistance factors in the CPUA.
Land 14 00768 g003
Figure 4. Spatial distribution of land use types.
Land 14 00768 g004
Figure 5. Land transfer area (note: Ⅰ: cultivated land; Ⅱ: forest; Ⅲ: grassland; Ⅳ: waterbody; Ⅴ: construction land; Ⅵ: bare land).
Land 14 00768 g005
Figure 6. The spatial distribution of the ESV.
Land 14 00768 g006
Figure 7. Landscape types in MSPA.
Land 14 00768 g007
Figure 8. Spatial distribution of ecological sources (note: 1–20 represent 20 ecological sources).
Land 14 00768 g008
Figure 9. Comprehensive ecological resistance surface.
Land 14 00768 g009
Figure 10. Ecological network of the CPUA (Note: EC refers to ecological corridors; 1–20 represent 20 ecological sources).
Land 14 00768 g010
Figure 11. Optimization of the ecological spatial layout (notes: ERZ: ecological restoration zone; GDZ: green development zone; EPZ: ecological protection zone; CDZ: comprehensive development zone).
Land 14 00768 g011
Table 1. ESV coefficient per unit area in the CPUA (dollar/hm2).
Primary ClassificationSecondary ClassificationCultivated LandForestGrasslandWaterbodyConstruction LandBare Land
Provisioning servicesFood production366.2882.65100.77241.1506.74
Raw materials81.21188.72148.5098.6108.84
Water supply−432.5897.9082.212275.58030.83
Regulating servicesGas regulation295.01623.17522.40348.88036.46
Climate regulation154.141865.541381.59867.64050.83
Environment purification44.75537.21456.111678.09090.60
Water regulation495.561068.231012.9927425.400295.90
Supporting servicesSoil conservation172.37758.86636.43422.63043.20
Nutrient cycling51.3858.1247.7332.3203.09
Nutrient cycling56.35690.57578.091286.120103.53
Cultural servicesLandscape esthetics24.86302.97254.57861.83059.44
Table 2. MSPA landscape structure types.
TypesCharacteristic
CoreCore in green vegetation cover areas
IsletRelatively isolated and small green patches
PerforationInternal patch edge areas with no ecological benefit
EdgeOuter edges of core areas
LoopNarrow areas with corridor characteristics connecting the same core area
BridgeCorridor-like areas in non-core zones that connect various distinct core sites
BranchEcological patches linked to only one section of the core site
Table 3. Data sources.
TypeNameWeightSources
Resistance factorNatural factorsLUCC0.15Resource and Environment Science Data Platform
(http://www.resdc.cn/ accessed on 11 September 2024)
DEM (m)0.09Geospatial Data Cloud
(https://www.gscloud.cn/ accessed on 11 September 2024)
NDVI0.20EARTHDATA SEARCH
(https://search.earthdata.nasa.gov/search accessed on 11 September 2024)
Soil total potassium content (g/kg)0.12Soil Science Database
(http://vdb3.soil.csdb.cn/ accessed on 12 September 2024)
Socio-economic factorsPopulation density (persons/km2)0.16LandScan Global
(https://landscan.ornl.gov accessed on 13 September 2024)
Viirs0.13National Tibetan Plateau Data Center
(https://data.tpdc.ac.cn/ accessed on 12 September 2024)
Distance to river (m)0.10National Catalogue Service for Geographic Information
(https://www.webmap.cn accessed on 15 September 2024)
Distance to road (m)0.05
Table 4. Land use type area (km2).
YearLand Use Types
Cultivated LandForestGrasslandWaterbodyConstruction LandBare Land
2005189,598.0239,698.1918,526.336004.2631,834.84186.05
2010186,697.8339,991.5517,642.175747.9935,573.45196.44
2015184,532.9639,979.1317,572.115910.3837,664.46188.78
2020182,161.0439,945.4917,569.126341.1139,713.29107.07
Table 5. The ESV of land use types.
Land Use TypesESV (Billion Dollar)
2005201020152020
Cultivated land248.24 244.45 241.61 238.51
Forest249.06 250.90 250.83 250.62
Grassland96.73 92.12 91.75 91.73
Waterbody213.38 204.27 210.04 225.35
Construction land0000
Bare land0.14 0.14 0.14 0.08
Disclaimer/Publisher’s Note: The statements, opinions and data contained in all publications are solely those of the individual author(s) and contributor(s) and not of MDPI and/or the editor(s). MDPI and/or the editor(s) disclaim responsibility for any injury to people or property resulting from any ideas, methods, instructions or products referred to in the content.

