Article

The Characteristics and Influencing Factors of Rural Industrial Integration Land in China: A Case Study in Qingdao, Shandong Province

1
School of Environmental Science and Engineering, Tiangong University, Tianjin 300387, China
2
Faculty of Geography, Yunnan Normal University, Kunming 650500, China
3
School of Economics and Management, Tiangong University, Tianjin 300387, China
*
Author to whom correspondence should be addressed.
Land 2025, 14(4), 774; https://doi.org/10.3390/land14040774
Submission received: 26 February 2025 / Revised: 1 April 2025 / Accepted: 1 April 2025 / Published: 3 April 2025

Abstract

:
Rural industrial integration land has emerged with the rise of new industries in rural China, exhibiting spatial distribution patterns distinct from traditional industrial land. However, research on this land use remains limited. This paper offers an exploratory definition of rural industrial integration land, takes three typical villages in Qingdao, Shandong Province as examples, establishes a model for measuring the diversity, complexity, and compatibility of land for industrial integration development based on the Hill numbers diversity measurement model, the information entropy index, and the mixedness index (WVMDIi) to explore the spatial layout characteristics of rural industrial integration land, and introduces the grey relational model to analyze its driving mechanism. The findings reveal that: (1) Rural industrial integration land is marked by structural diversity, multifunctionality, and compatibility in use. (2) From 2015 to 2023, the land’s diversity, complexity, and compatibility increased. The spatial layout characteristics of rural industrial integration land in the three villages, which integrates its diversity, complexity, and compatibility, increased from 1.3842, 1.5786, and 1.2127 to 1.8500, 1.9123, and 2.0224. (3) Between 2015 and 2019, key factors influencing spatial distribution included resource endowment, industrial foundation, and socioeconomic conditions. From 2019 to 2023, the most significant factors shifted to industrial foundation, farmers’ demand, and regional policies. Understanding the spatial distribution of rural industrial integration land is essential for guiding rural industrial spatial planning and promoting rural industrial revitalization.

1. Introduction

Rural industries in China are undergoing a process of integrated development, resulting in the emergence of numerous new industry forms and demonstrating strong growth [1,2]. These new industries, based on agricultural and rural resources, are integrated with agriculture and manifest in several forms, including the integration of primary and secondary industries (e.g., agricultural product processing), the integration of primary and tertiary industries (e.g., rural e-commerce), and the integration of primary, secondary, and tertiary industries (e.g., rural tourism) [3]. Rural industrial integration has broken the conventional classification of single-industry land use, giving rise to new types of mixed-use industrial land. This category, recognized by the Chinese government and academia as rural industrial integration land [4], includes land for integrating primary and secondary industries, land for integrating primary and tertiary industries, and land for integrating all three [5]. Such land is typically characterized by a small scale, dispersed layout and mixed use, exhibiting structural and spatial patterns that differ from traditional industrial land [6].
However, two significant challenges impede the development of rural industries. First, the scarcity of construction land in rural China [7]. Second, the traditional industrial land supply model is inadequate to accommodate the spatial requirements of emerging rural industries [8]. Thus, a thorough understanding of the spatial characteristics and evolutionary mechanisms of rural industrial integration land in China is imperative to provide a scientific basis for improving the supply of rural industrial land.
The concept of “rural industrial integration development” was first introduced in China’s 2015 No. 1 Central Document. In 2017, the 19th National Congress of the Communist Party of China proposed the rural revitalization strategy, with industrial prosperity as a central focus. To achieve this, the Chinese government has introduced various policies encouraging rural areas to develop industrial integration projects based on local resource endowments. Land policies have also been implemented to support these efforts, addressing challenges related to land use for rural industrial integration development [9]. For instance, the “Guiding Opinions on Promoting the Integration of Primary, Secondary, and Tertiary Industries in Rural Areas” (State Council Office Document [2015] No. 93) and the No. 1 Central Document from 2015 to 2024 encourage deep agricultural integration with other industries. Furthermore, the “Notice on Strengthening Village Planning to Promote Rural Revitalization” (Natural Resources Office Document [2019] No. 35) allows local authorities to reserve up to 5% of construction land quotas for flexible use in rural, spatial, and village planning, supporting scattered rural cultural tourism facilities and new rural industries. Additionally, the “Opinions of the Central Committee of the Communist Party of China and the State Council on Strengthening Key Work in the ‘Three Rural’ Areas to Ensure the Timely Achievement of a Moderately Prosperous Society” (2020 No. 1 Central Document) mandated that newly developed county- and township-level land spatial plans allocate at least 10% of construction land quotas for rural industrial development, and provincial authorities must allocate at least 5% of new construction land quotas annually for rural industries. It is evident that ensuring rural industrial integration land has become crucial to supporting China’s rural revitalization efforts.
However, academic research on this type of land remains limited. Existing studies primarily focus on policies and management aspects [10], emphasizing qualitative analysis and practical applications [11]. There is relatively little research on the intrinsic characteristics and driving factors of rural industrial integration land [12]. The insufficiency of theoretical research has led to a lack of guiding standards for land supply, spatial layout, and use in village planning, hindering the implementation of rural industries and rural revitalization efforts.
Meanwhile, international experience further highlights the specificity of China’s problems. South Korea’s new village movement integrates agriculture and rural industry through government investment in infrastructure, but its land use is still mainly based on functional zoning, which fails to address the need for flexibility in industrial integration [13]; Japan’s “one village, one product” movement relies on characteristic industries (such as shiitake cultivation in Oita Prefecture) to achieve tri-industrial integration, but it is limited by the aging of population, and the multi-functional use of land lacks systematic policy support [14]; the EU’s rural multifunctionality policy for villages encourages the compatibility of agricultural land with tourism and ecological functions, where strict zoning controls limit small-scale mixed use [15]. In contrast, China attempts to break the institutional rigidity through policy tools such as “use compatibility” and “indicator flexibility” stand in stark contrast to the rural transformation models of Western countries.
Rural industrial integration land is the spatial manifestation of multi-industrial integration, which is characterized by the coexistence of multiple uses and belongs to the content of micro-studies within rural settlements. The current micro research mainly studies the internal land classification [16,17], multi-functional identification [18,19], and mixed utilization of rural settlements. However, the existing micro-studies simplify the parcels within rural settlements into homogenized mapping units, while rural industrial integration land deconstructs the parcels into multifunctional composite heterogeneous spatial units, which is a further deepening of the micro-studies of rural settlements and can directly serve the access and spatial layout of rural industries.
Accordingly, this paper introduces the concept and analytical framework of rural industrial integration land and defines its connotation and characteristics. Using case studies of typical villages in Qingdao, China, it analyzes the spatial characteristics and driving forces behind this type of land. The goal is to refine the theoretical understanding of the concept and its evolution while providing practical decision-making support for land allocation and the implementation of rural industrial integration.

2. Theoretical Analysis

Guided by policy and practical needs, this paper defines rural industrial integration land as land based on agricultural resources, which extends agricultural multifunctionality by expanding and extending the industrial chain (including agricultural product production, processing, distribution, and local consumption). This land supports new industries such as agricultural product processing and distribution, rural leisure and tourism, and e-commerce. It is characterized by diversity, complexity, and compatibility [20].
The characteristic of diversity refers to the variety of new rural industries and land types. This arises from the integration of agriculture with secondary and tertiary industries, leading to heterogeneous new industries and land types [21]. Complexity refers to increasing diversity not only horizontally but also vertically, with land accommodating multiple industrial functions [22]. For example, a single parcel may feature commercial activities on the ground floor and rental spaces above. This phenomenon reflects the process of various types of industries being superimposed and integrated on the same land [23]. Compatibility refers to the interaction between industrial land used for different purposes within close proximity, with either positive or negative externalities [24,25]. It is a critical indicator of whether different land uses can coexist harmoniously [26].
Diversity emphasizes the integration of various types of industrial land, while complexity reflects the interwoven arrangement of industries and their functions. Compatibility pertains to the interactions and spatial complementarity between different land uses. As economic and social development progresses, and policy frameworks are refined, rural industrial integration land will increasingly evolve towards structural diversity, multifunctionality, and compatibility (Figure 1).

3. Study Area and Methodology

3.1. The Study Area

Qingdao, located in southeastern Shandong Peninsula between 119°30′–121° E and 35°35′–37°09′ N, spans a total area of 1293 square kilometers and administers seven districts and three county-level cities. By the end of 2022, Qingdao had a population of 10.34 million, with an urbanization rate of 77.32%. Qingdao is a major coastal center, international port city, and renowned seaside tourist destination. As of 2022, it is home to 987 high-standard modern agricultural parks, over 1300 agricultural processing enterprises, 289 leading agricultural industrialization firms, and 49 agricultural e-commerce companies with annual transactions exceeding 10 million RMB. Additionally, there are 60 specialized towns and villages under the national/provincial ‘One Village, One Product’ initiative, and 48 national-level demonstration villages for leisure and tourism agriculture. It can be seen that Qingdao has formed a significant advantage in the synergistic promotion of industrial integration and development, and there are various development modes such as cultural and tourism integration, industrial and agricultural integration, and rural tourism in the development of the villages, which provides a rich practice sample for the study of rural industrial integration land.
Based on different types of rural industry integration, this study selects three villages as case studies (Figure 2): Yujia village (integration of primary and secondary industries), Xintuannew village (primary and tertiary industries), and Houchenghai village (integration of all three). Given that the industry integration processes in the selected villages mostly began in 2015 and underwent transition development by 2019, the analysis covers three time points—2015, 2019, and 2023—to trace the evolution of rural industry integration land (Table 1).

3.2. Data Collection and Processing

Data on rural industry integration and land use were obtained through participatory rural assessment methods, surveys, and POI (Point of Interest) data collection. Fieldwork was conducted in April and August 2023, including 6 days in Yujia village, 2 times in Xintunnew village, totaling 5 days, and 7 days in Houchenghai village. Interviews and surveys recorded the status of rural industrial integration, land use and socio-economic data in each village. During the survey, questionnaires were distributed to the villagers at the standard of one per household, with a recovery rate of 100% and an effective rate of 94.12%. Meanwhile, combining the remote sensing image data from 2015, 2019, and 2023, the internal parcel distribution map of rural industrial integration land was drawn through field checking and labeling. The study utilized Geospider and the Gaode Map Open Platform to collect POI data for 2015, 2019, and 2023. A total of 10 distinct rural industry types were identified (Table 2), with additional socioeconomic data sourced from the 2022 Jiaozhou Statistical Yearbook. Remote sensing images were downloaded using “MapWorld”, and administrative boundary data were obtained from the Shandong Geographic Information Public Service Platform (shandong.tianditu.gov.cn). Land types in the three villages were vectorized, and industrial land patches were visually interpreted and cross-verified with field data for accuracy.
All data were registered using ArcGIS10.7 software, and attribute information for each land parcel was added to create a geospatial database for the study area. This yielded rural industrial integration land-use data for the three villages for 2015, 2019, and 2023. A classification system based on the Current Land Use Classification [27], standard was developed and tailored to the industrial types and land-use characteristics of the three villages (Table 3).

3.3. Measurement of the Spatial Layout Characteristics of Rural Industrial Integration Land

This paper establishes a measurement indicator system for the spatial layout characteristics of rural industrial integration land, focusing on three key dimensions: diversity, complexity, and compatibility.
(1)
Diversity
To evaluate diversity, the study applies Hill numbers diversity (qD) [28]. The formula is as follows:
D q = ( i = 1 n P i q ) 1 / ( 1 q )
Here, n represents the number of rural industrial integration land types; Pi denotes the frequency of occurrence of land type i; and the parameter q indicates the order range of diversity (0 to 2). When q = 0, q = 1, and q = 2, they respectively represent the richness, disorder, and concentration. Thus, this study evaluates the diversity (M) from three dimensions of richness (Ma), disorder (Md), and concentration (Mf):
M = Ma + Md + Mf
① Richness
Richness reflects the number of different industrial land types within a parcel, with higher values indicating greater richness. The calculation formula is as follows:
M a = i = 1 n P i 0
Here, Pi denotes the area of the i-th land-use type (similarly hereafter) and n is the number of land types (similarly hereafter).
② Disorder
When q = 1, Formula (1) becomes meaningless. However, as q approaches 1, the limit of the formula is the exponent of Shannon entropy. Thus, the disorder is represented using the power of the Shannon index, reflecting the evenness of the distribution of land types. A higher value indicates greater land-use diversity. The calculation formula is as follows:
M d = e x p ( i = 1 n p i ln p i   )
③ Concentration
The concentration index is represented by the reciprocal of the Simpson index. A higher value indicates greater land use diversity. The calculation formula is as follows:
M f = 1 i = 1 n p i 2
(2)
Complexity
The complexity reflects the spatial overlap of different types of rural industries, primarily represented by the POI types and quantities of individual industrial land. This study adapts the successful application of the information entropy index in land-use complexity assessment [29,30] to develop a quantitative method for assessing the complexity. The formula is as follows:
E I = k = 1 k p k ln p k ln k
p k   = x k k = 1 k x k
Here, EI represents the complexity index; k denotes the number of POI types; p k is the proportion of the k-th type in the industrial land; and x k is the number of the k-th type. The range of EI is from 0 to 1, indicating the degree of integration of different POI types within the rural industrial integration land.
A higher EI suggests a more even distribution and higher integration of POI types. To standardize the data and account for differences in POI magnitudes, the study employs deviation normalization, mapping values to a range between 0 and 1. The formula is as follows:
x * = x m i n m a x m i n
(3)
Compatibility
This study calculates the compatibility index by establishing a compatibility judgment matrix [31]. The compatibility is measured using a weighted vector-based mixed degree index WVMDIi. The calculation formula is as follows:
W V M D I i   = 1 j n ( C i j A i / A j ) j n ( A i / A j ) )
Here, WVMDIi represents the compatibility index and Cij is the compatibility value. The compatibility values are assigned using the Delphi method; compatibility values between different classes are shown in (Table 4), with the compatibility values ranging from [0, 1]. Full compatibility, conditional compatibility, and incompatibility are assigned values of 0, 0.5, and 1, respectively [32] (Table 4). Ai/Aj denotes the area ratio between land type i and j within rural industrial integration land.
(4)
The integration index
The integration index is calculated by combining diversity, complexity, and compatibility through a weighted sum, with the weights determined using the entropy method (Table 5). The calculation formula is as follows:
F = α M + β E I + γ W V M D I i
Here, F represents the integration index. The weights α , β , and γ correspond to the diversity, complexity, and compatibility, respectively.

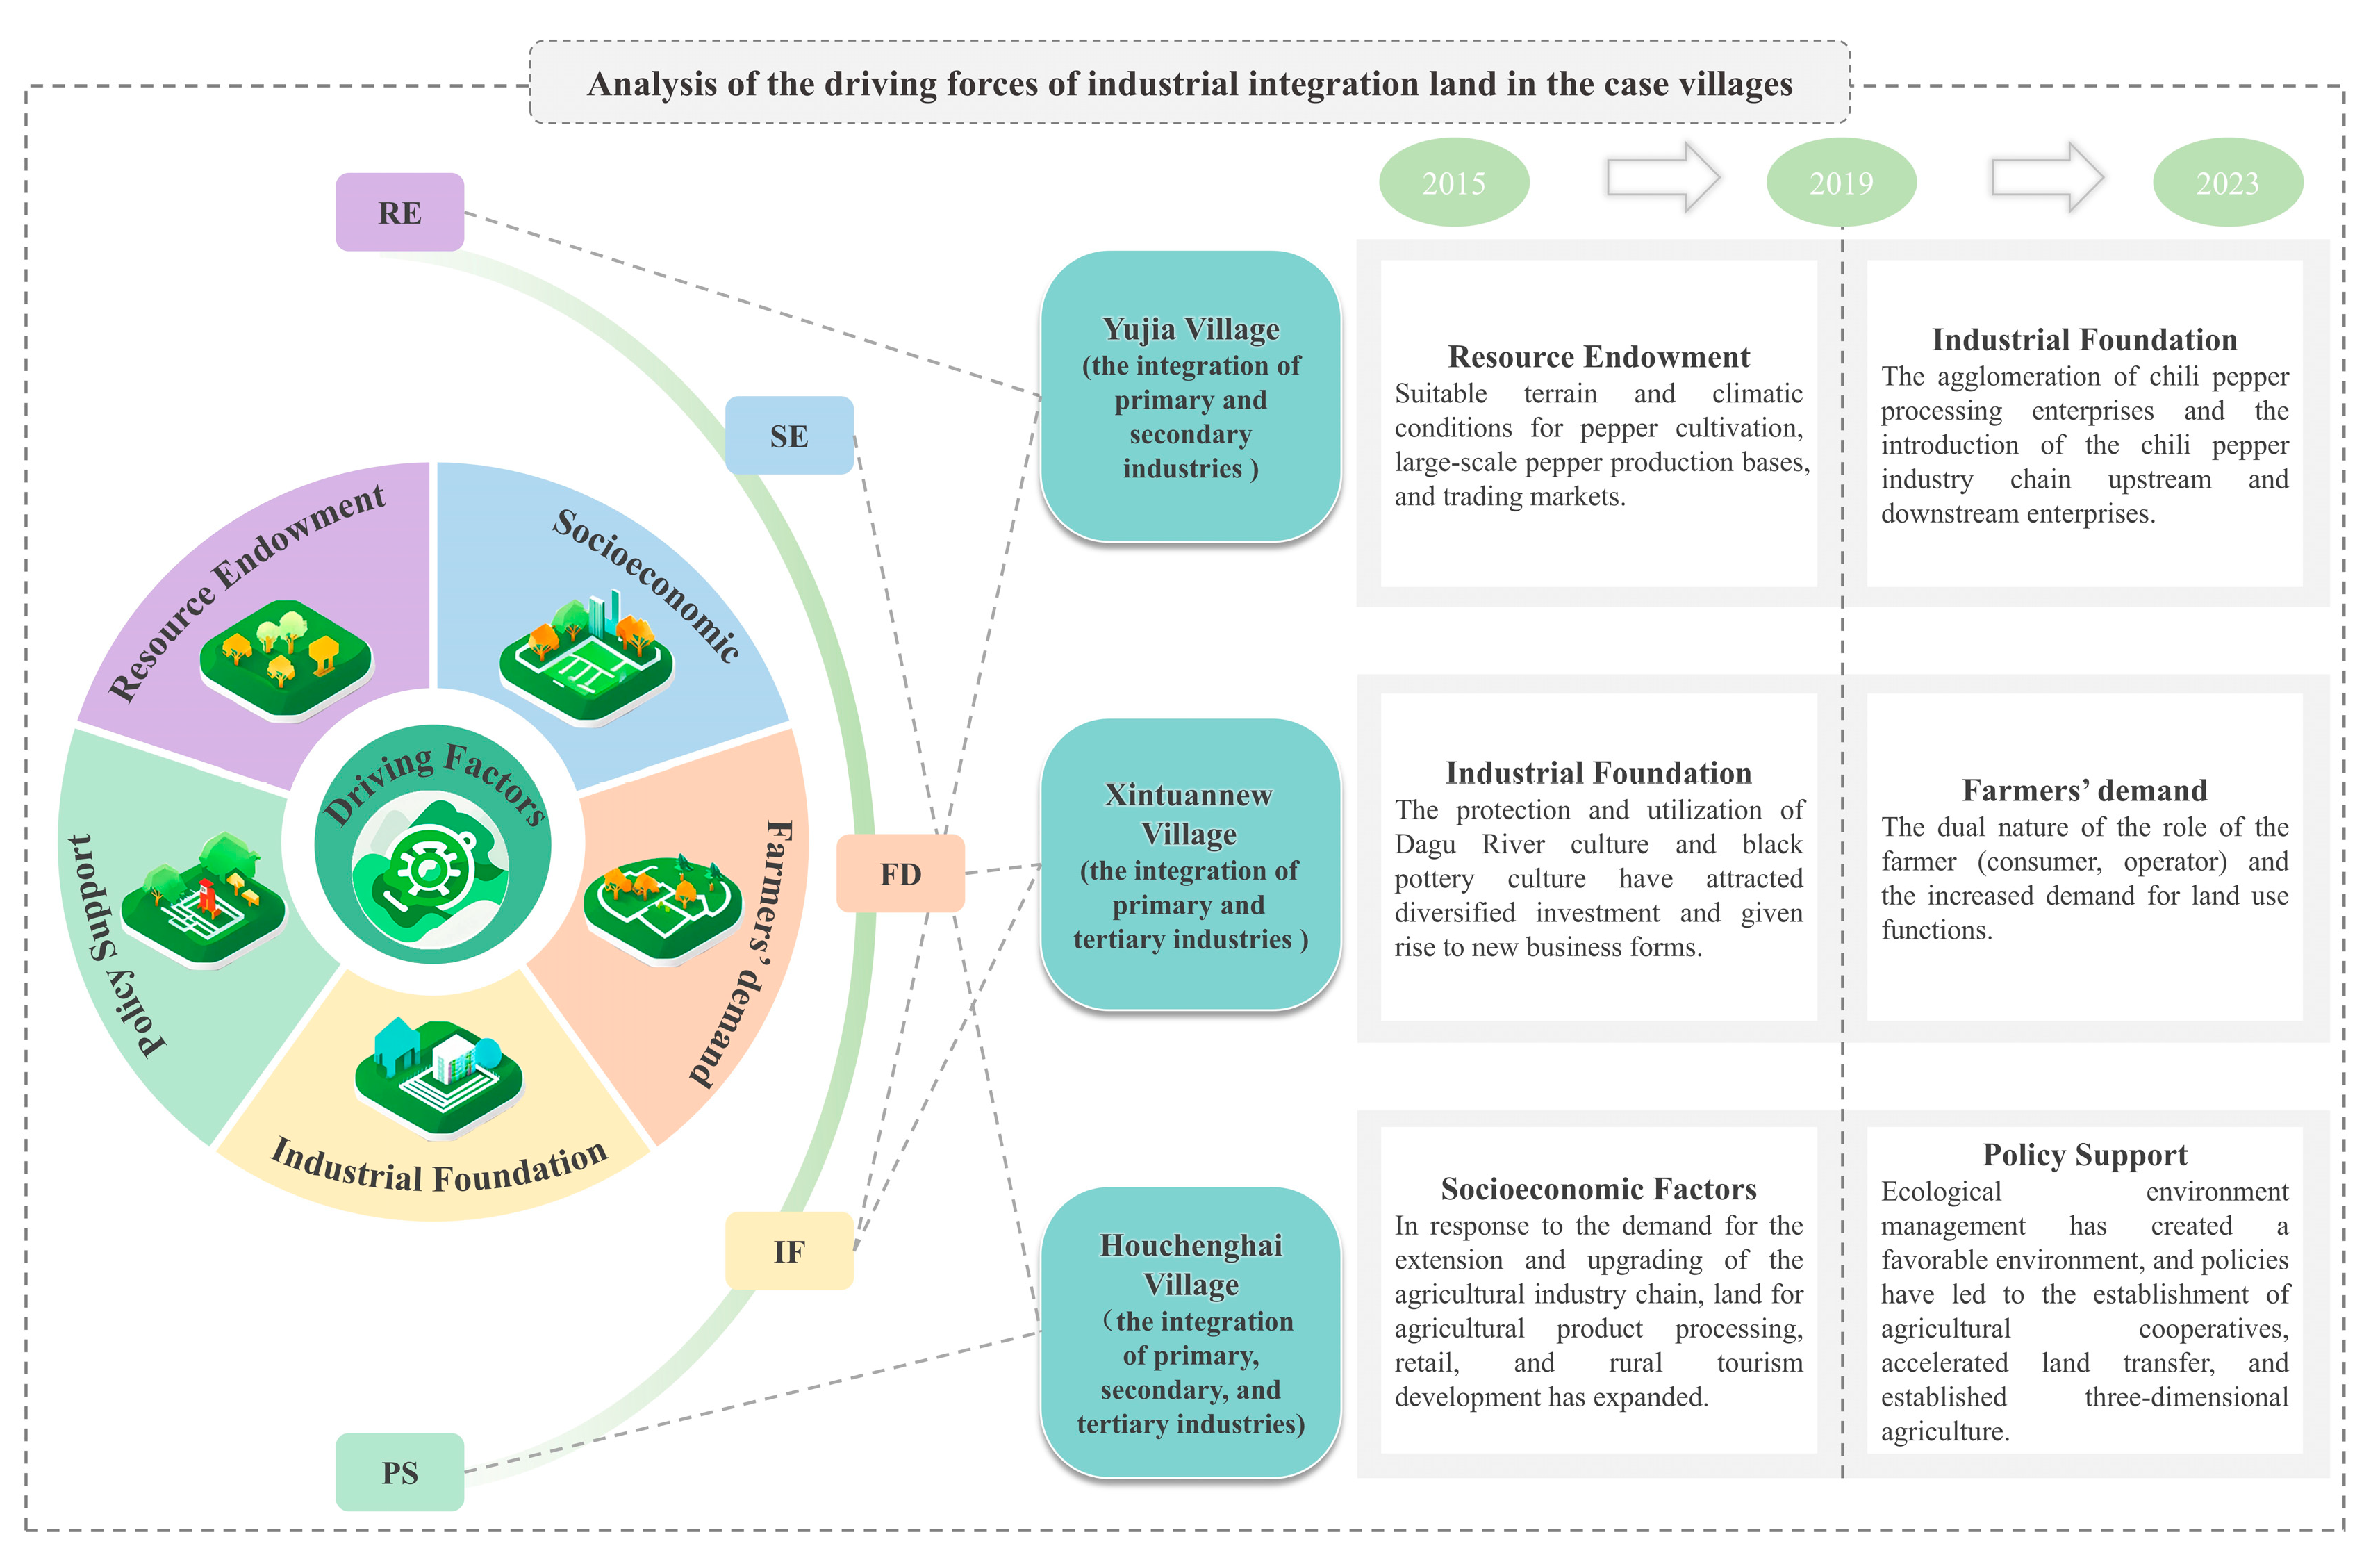
3.4. Driving Factors for the Spatial Layout of Rural Industrial Integration Land

The correlation between the evolution of rural industrial integration land and its influencing factors is evaluated using gray relational analysis. This method examines the geometric similarity of their curves, indicating the degree of influence each factor has on the spatial layout.
(1)
Construction of influencing factors
The layout of rural industrial integration land arises from a combination of internal and external multidimensional forces. Natural foundations and socioeconomic conditions jointly shape the structure and layout. In light of this, the evolution of rural industrial integration land is influenced by five key factors: resource endowments, socioeconomic conditions, farmers’ demands, industrial foundations, and policy support. Thirteen driving indicators were identified to assess these factors (Table 6).
(2)
Determination the reference sequence and the comparison sequence
This study uses the spatial layout characteristics indicators of rural industrial integration land as the dependent variables to establish the reference sequence θ   0 :
θ   0 ( x ) = θ   0 1 , θ   0 2 , , θ   0 ( x )
The data of each influencing factor sequence are as the comparison sequence Y   t (x):
Y   t ( x ) = Y t ( x ) | t = 1,2 , 3 m ; x = 1,2 , 3 n
(3)
Performance of the mean normalization on the raw data
Gray relational analysis data typically requires the use of the same units. To standardize data units, mean normalization was used, dividing all data by the average value to obtain mean-normalized results for the reference sequence θ   0 (x) and the comparison sequence Y   t (x), denoted as θ   0 (x) and Y t (x).
θ   0 ( x ) = θ   0 ( x ) θ ¯   0
Y   t ( x ) = Y   t ( x ) Y ¯   t )
(4)
Calculation of the relational coefficient δ
(1) First, the maximum difference Z and the minimum difference N at the two levels are calculated. The formulas are as follows:
Z = m a x ( t )   m a x ( x ) θ   0 ( x ) Y   t ( x )
N = m i n ( t )   m i n ( x ) θ   0 ( x ) Y   t ( x )
(2) Substitution into the correlation coefficient formula:
δ   t ( x ) = N + ρ × Z θ   0 ( x ) Y   t ( x ) + ρ × Z
ρ is the resolution coefficient, typically ranging between 0 and 1, with a usual value of 0.5. The closer the value of δ   t ( x )   is to 1, the stronger is the correlation.
(5)
Calculation of the degree of correlation
R = 1 x δ   t ( x )
(6)
Degree of correlation ranking
Correlation values (R) rank the degree of influence, with a higher R value indicating a stronger correlation. Empirical calculations show that when ρ = 0.5, correlations exceeding 0.6 are considered significant [33].

4. Results and Analysis

4.1. The Characteristics of Rural Industrial Integration Land

4.1.1. Diversity

In Yujia Village, the diversity of primary and secondary industry integration land increased over time (Figure 3). In 2015, the village’s economy was focused on agriculture and primary processing, with a limited variety of land types confined to facility agricultural land and agricultural product processing and manufacturing land, resulting in low diversity (3.13). By 2019, with the upgrading of the pepper industry and the promotion of industrial integration, more agricultural product processing and manufacturing land, mixed residential land, and agricultural product retail land emerged, significantly enhancing land diversity (4.08). However, by 2023, despite further integration, the diversity slightly declined (4.06) due to limited changes in land types (Figure 4).
In Xintuannew Village, the diversity of primary and tertiary industry integration land initially increased but then stabilized. In 2015, the village’s economy was dominated by traditional agriculture and small-scale commercial activities. The industrial land was dispersed and of a single type, primarily consisting of facilities agricultural land and agricultural product retail land, leading to low land diversity (3.01). The promotion of rural tourism strategies in 2019 activated the tourism and commercial sectors. New industries such as agritourism and homestays facilitated the expansion of mixed residential land and rural tourism industrial land, leading to a significant increase in the diversity (4.00). By 2023, with the maturation of the tourism industry and the balanced expansion of various land types, diversity remained stable (4.00).
In Houchenghai Village, primary, secondary, and tertiary industry integration land saw continuous growth in diversity. In 2015, traditional agriculture limited land diversity (3.36). By 2019, the Village had launched a modern agricultural park that integrated research, production, and sightseeing. The park emphasized the development of the fruit trees, tea, and flower industries while expanding into fruit picking, agricultural product processing, and retail and tourism services. This led to a significant increase in land diversity (4.05). By 2023, the introduction of science popularization and research centers, farmhouse dinners, and homestays led to a notable increase in rural tourism industrial land and agricultural product retail land, further enhancing land use diversity to 5.04.

4.1.2. Complexity

From 2015 to 2023, the complexity of primary and secondary industry integration land in Yujia Village increased from 0.58 to 0.87. In 2015, the complexity was low (0.58) due to a focus on agricultural processing and the early stages of non-agricultural industries. By 2019, with industrial transformation and upgrading, the complexity of industrial integration land saw a noticeable rise (0.76). By 2023, driven by the expansion of industrial parks, population growth, and the rise of commercial and accommodation activities along main roadways, the integration of residential and work functions enhanced the complexity further, reaching 0.87, indicating deep multi-industry integration.
In Xintuannew Village, the complexity of primary and tertiary industry integration land remained high, ranging from 0.95 to 0.99, ranking first among the three villages. Since 2015, leveraging its agricultural resources and solid industrial foundation, this village promoted the deep integration of multiple industrial functions, achieving high complexity (0.95). By 2019, the rise of tourism and integration of production, leisure, and commerce further increased complexity (0.97). In 2023, the addition of new projects, such as picking gardens and expanded commercial and leisure activities, boosted both the scale and complexity of industry integration land, reaching 0.99.
In Houchenghai Village, the complexity of primary, secondary, and tertiary industry integration land increased from 0.20 to 0.87, marking a shift from a single-industry to a diversified structure. In 2015, the village focused on traditional agriculture, with a small scale and single-use function of rural industrial integration land, resulting in low complexity (0.20). By 2019, watershed management and the promotion of facility agriculture, deep agricultural product processing, and tourism boosted land use complexity (0.79). By 2023, multi-business participation, infrastructure development, and village beautification efforts further enhanced the complexity of industrial land use, reaching 0.87.

4.1.3. Compatibility

From 2015 to 2023, the compatibility of primary and secondary industry integration land in Yujia Village initially increased, then slightly decreased, with an overall improvement of 0.21. In 2015, compatibility of this village was low (0.50), with only a small area of agricultural facilities and agricultural product processing and manufacturing land being conditionally compatible, due to pollution from production and processing activities. By 2019, improvements in compatibility among agricultural facility land, agricultural product processing and manufacturing land, and agricultural product retail land significantly improved. Additionally, the proportion of complete compatibility between mixed residential land and other land types increased, driving the growth in industrial land compatibility to 0.71. However, by 2023, the expansion of incompatible areas between agricultural product processing and manufacturing land and mixed residential land led to a slight decline of compatibility to 0.69.
In Xintuannew Village, the compatibility of primary and tertiary industry integration land remained relatively stable, fluctuating between 0.69 and 0.72. In 2015, the compatibility was relatively high (0.72), driven by the coordination between agricultural facility land, mixed residential land, and agricultural product retail land. However, by 2019, although the expansion of rural tourism industrial land improved compatibility with agricultural facility and agricultural product retail land, compatibility with mixed residential land was poor, leading to a decrease in compatibility (0.69). By 2023, the complete compatibility between mixed residential land and other land types increased, while the conditional compatibility of agricultural product retail land with rural tourism industrial land and agricultural facility slightly decreased. This resulted in a slight increase in compatibility (0.71).
In Houchenghai Village, the compatibility of primary, secondary, and tertiary industry integration land rose from 0.50 to 0.90. In 2015, the village primarily utilized agricultural facility land, and agricultural product processing and manufacturing land, resulting in relatively low compatibility (0.50). By 2019, the addition of agricultural product retail land and rural tourism industrial land improved the area of conditional compatibility with agricultural facility land. The area of conditional compatibility between agricultural product processing and manufacturing land, and agricultural facility land decreased, leading to a slight decrease in compatibility (0.48). By 2023, the introduction of mixed residential land and greater compatibility with agricultural product processing and manufacturing land, agricultural product retail land, and rural tourism industrial land significantly increased compatibility (0.90).

4.1.4. Integration Index

Based on the layout characteristic index formula for rural industrial integration land, the layout characteristic index in all three villages showed significant improvement (Table 7).

4.2. Driving Force Analysis

Using gray relational analysis, the integration degree of rural industrial integration land for 2015–2019 and 2019–2023 was analyzed as the reference sequence. The 13 driving factor indicators for the villages during these two periods were used as the comparison sequences. This analysis examined the evolution of rural industrial integration land and its driving forces, identifying the dominant driving factors (Figure 5).
By integrating the impact levels of the 13 driving factors across the secondary indicators, the average influence of each of the five dimensions—resource endowment, socioeconomic conditions, farmers’ demand, industrial foundation, and policy support—was calculated. Between 2015 and 2019, the primary drivers were resource endowment (0.8419), industrial foundation (0.9682), and socioeconomic conditions (0.9164). From 2019 to 2023, the dominant factors shifted to industrial foundation (0.7814), farmers’ demand (0.8237), and policy support (0.9386).
After that, the correlation coefficient method was applied to analyze the correlation of the driving factors. Its results show that resource endowment Y1 is significantly positively correlated with socioeconomic factors Y2 (0.7309), indicating that regions rich in natural resources are more likely to form economic agglomeration effects, but negatively correlated with farmers’ demand Y3 (−0.5952), reflecting the fact that abundant resources may reduce the farmers’ active demand for industrial integration; socioeconomic factors Y2 is negatively correlated with farmers’ demand Y3 (−0.1909), indicating that economically developed regions may have relatively weaker farmers‘ demand due to high marketisation, and positively correlated with policy support Y5 (0.4799), indicating that policy support is prone to be tilted towards economically active regions; farmers’ demand Y3 is negatively correlated with industrial foundation Y4 (−0.5381), indicating that farmers’ willingness to transform in regions with a better industrial base may be weaker; industrial foundation Y4 and policy support Y5 are negatively correlated (−0.1189), revealing that industrially mature regions may face diminishing marginal utility of policies (Figure 6).

5. Discussion

5.1. Driving Mechanisms Behind the Spatial Distribution of Rural Industrial Integration Land

The spatial distribution of rural industrial integration land is the result of multiple factors working in coordination (Figure 7). Between 2015 and 2019, Yujia Village leveraged its favorable resource endowments, particularly terrain and climate ideal for chili cultivation, to integrate agricultural production and processing. This led to a diversification of land use and laid the foundation for industrial integration. The construction of Jiaodong Airport further optimized logistics and boosted demand. Between 2019 and 2023, the industrial foundations became a key factor. By attracting upstream and downstream enterprises along the chili industry chain and promoting contract farming, the village achieved deep industrial integration. This further drove deeper integration, expanding the multifunctionality of land use, shifting from resource-driven to industry-driven primary and secondary industry integration.
From 2015 to 2019, Xintuannew Village capitalized on its strong industrial foundation and cultural resources, such as the Sijiaxiao Culture Museum, Dagu River Culture, and Black Pottery Culture. These efforts successfully attracted diversified investments, giving rise to a commercial and service industry cluster rooted in agriculture. This cluster encompassed integrated retail, life services, and agritourism, thereby establishing a system of primary–tertiary industry integration. The layout and structure of rural industrial integration land were significantly enriched. By 2019–2023, rural tourism growth made farmers’ demands the key driver, with a significant rise in demand for land with multifunctional uses, transforming the land allocation from primary–tertiary integration to one serving diverse consumer needs.
In Houchenghai Village, the socioeconomic conditions between 2015 and 2019 facilitated the expansion of land for agricultural product processing, retail, and rural tourism. Market-driven ventures into agritourism and e-commerce spurred the integration of primary, secondary, and tertiary industries. From 2019 to 2023, policy support became a key driving factor. The comprehensive management of the Wangshan small watershed, implemented by the government, significantly improved the ecological environment of the village, creating favorable conditions for the integration of ecological agriculture and tourism. The establishment of policy-supported agricultural cooperatives accelerated land transfers. Additionally, ecological tourism parks, agricultural product processing bases, and harvesting facilities were created, further promoting the functional optimization and compatible use of primary, secondary, and tertiary industry integration land.
It is worth noting that the enhancement of ecological environment quality through the management of the Wangshan sub-basin in Houchenghai Village, the demand for soil and water conservation arising from the agglomeration of the chili industry in Yujia Village, and the development of cultural tourism in Xintuannew Village to promote the conservation of the traditional cultural landscape are all examples of the potential constraints and guidance of ecological factors on land use. It can be seen that the sustainability of the ecological environment as a hidden driving factor runs through the whole process of rural industrial integration development. In the future, it is necessary to strengthen the evaluation of the ecological background in land-use planning, coordinate industrial development and environmental protection through the ecological compensation mechanism, and realize sustainable spatial reconstruction of rural–industrial integration.

5.2. Rural Industrial Integration Land Has Significantly Supported Rural Revitalization and Represents a New Direction for Future Studies

Rural industrial integration land exhibits distinct characteristics compared to traditional rural enterprise land. In 2023, the average plot sizes for industrial integration land in the three villages were relatively small and dispersed. For example, in Yujia Village, plots for agricultural facilities and processing land were 0.20 and 0.04 hectares, respectively. In Xintuannew Village, tourism industry land plots averaged 0.99 hectares, while in Houchenghai Village, plots for processing, retail, and tourism were 0.02, 0.02, and 0.17 hectares, respectively.
Securing rural industrial integration land has had multiple positive effects on rural revitalization. In the case villages, integration has stimulated economic growth and increased farmers’ incomes. For instance, Yujia Village saw a 108% increase in economic benefits from expanding facility-based agricultural land. Xintuannew Village and Houchenghai Village experienced significant increases in fixed asset investment per unit of land (25.00% and 321.43%, respectively), promoting economic diversification. From 2015 to 2023, per capita disposable income in Yujia Village, Xintuannew Village, and Houchenghai Village increased by 48.00%, 16.67%, and 10.53%, respectively. Rural industrial integration has also fostered green agricultural development and improved living environments. Yujia Village implemented modern agricultural technologies, reducing resource consumption and emissions while enhancing green agriculture. In Xintuannew Village and Houchenghai Village, agritourism, sewage treatment, infrastructure development, and beautification efforts have created vibrant, livable rural environments.
Currently, scholars have conducted extensive studies on various aspects of “rural industrial integration development”, including conceptual definitions [34,35] and measurement of integration levels [36,37] and driving factors [38,39], as well as policies supporting rural industrial integration land. However, limited theoretical research focuses specifically on the layout characteristics and driving mechanisms of such land. Policies concerning rural industrial integration land in China are progressively evolving. For instance, Ye et al. (2021) reviewed the development history of the “spot land supply” policy and analyzed local exploratory practices, summarizing the policy’s implications and its role in supporting rural industrial integration development [40]. Liu et al. (2022) suggest that multi-stakeholder collaboration, involving county-level promotion, township coordination, village collective leadership, and farmer participation, fosters policy innovation for the integrated management of rural industrial land [41,42]. Zhang (2020) examines the current issues surrounding rural industrial integration land in China and calls for research into institutional innovations for the integration of primary, secondary, and tertiary industries [43]. Despite these advancements, rural industrial integration land faces several significant challenges, including unclear classification, disordered demand growth, and imbalances between supply and demand [44,45]. There is a need to clarify the types, evolution, and driving mechanisms of this land through theoretical analysis to provide a scientific basis for its supply and planning [45]. Therefore, in the context of rural revitalization and rural industrial integration development, the connotations, classification, evolution, and driving mechanisms of rural industrial integration land represent new directions for future research.
In addition, most of the current studies on rural settlements regard their internal parcels as homogeneous mapping units, whereas the land for rural industrial integration presents the remarkable feature of multifunctional composite utilization due to the diversified intertwining and superposition characteristics of the industries it carries. Therefore, this study considers the internal plots of rural settlements as heterogeneous spatial units of multifunctional composite, which is a further deepening of the micro research on rural settlements, makes up for the insufficiency of multifunctional composite research on rural industrial land and has important theoretical significance.

5.3. Policy Recommendations

This study suggests addressing the demand for rural industrial integration development land and promoting new industries to advance rural industrial revitalization. Based on the layout characteristics of such land; it is recommended to implement a flexible classification and management system for rural industrial land [2], accommodating the needs of emerging sectors such as creative agriculture, leisure tourism, health and elder care, and education and scientific popularization. A “flexible land use” category could be introduced, allowing moderate land use conversions. On the one hand, detailed criteria for determining ‘flexible land use’ have been formulated to precisely define the scope and conditions of land that can be converted. On the other hand, an integrated online and offline service platform has been set up to make it easier for farmers to apply for land-use conversion, and for the relevant departments to receive and provide feedback in a timely manner, so as to promote the efficient implementation of the policy.
Furthermore, promoting vertical utilization and functional layering of rural industrial integration land is advisable. For example, incorporating essential commercial service facilities within agricultural parks can meet visitor needs without requiring additional construction land. It is recommended that technical guidelines for three-dimensional development be formulated to regulate the depth of development of three-dimensional space, construction standards, etc., to implement a policy of incentives for floor area ratio, and to establish a three-dimensional cadastral management system to clarify the ownership of space.
It is also essential to mitigate negative externalities arising from the mixing of different industries, particularly in managing the impact of industrial activities or high-pollution sectors on residential environments and agricultural production [46]. Establishing a rural industry admissions directory that clearly lists prohibited and restricted industries is recommended, through the establishment of a ‘positive list + negative list’ system, to promote the accurate supply of rural land. Establishing a rural industry admissions directory that clearly lists prohibited and restricted industries is recommended. The positive list focuses on the inclusion of deep processing of agricultural products, rural tourism complexes, intelligent agricultural demonstration parks and other integrated businesses; the negative list strictly restricts the transfer of highly-polluting industries, the expansion of inefficient production capacity and large-scale non-farming land occupation projects.
Given that rural industrial integration land often consists of small-scale, flexible parcels, traditional single-use land allocation methods should not be applied. Instead, mixed-use land provisions and flexible allocation methods, such as “spot-based land provision”, should be adopted to support the development of new industries. Moreover, in the process of implementing the policy, there may be potential risks, such as ‘real estate’ tendency, triggered by the flexible land use policy and local protectionist interference in the implementation of the industrial access catalogue, as well as compound regulatory problems under the mixed land supply mode. It is recommended to establish a post-evaluation system for the benefits of land use conversion and develop an intelligent monitoring platform for industrial land use, which dynamically tracks the consistency between the actual use of the land and the declared functions of the land use by means of remote sensing imaging. Through remote sensing image comparison and tax big data analysis, it dynamically tracks the consistency between the actual use of the land and the declared function, and implements graded warnings for violations.

5.4. Deficiency and Prospect

This paper is in the initial stage of research on measuring the characteristics of rural industrial integration land, is limited by the difficulty of obtaining data from field research and the subjectivity of participatory interviews (e.g., respondents’ level of cognition, memory, and degree of co-operation), and the incompleteness of rural POI data may affect the accuracy of quantitative analysis. Moreover, the characterization of use for rural industrial integration land is of great value in guiding the future direction of land use and requires long-term in-depth research. In this paper, three nodes, 2015, 2019 and 2023, were selected to balance the research time period and reduce the errors, but due to the late start of industrial integration in the case villages (before and after 2019), the research time period is shorter, which results in the presentation of the characteristic change is not significant enough, and the differentiation degree is lower. Furthermore, the limited classification of rural industrial integration land and the number of case villages selected for this study restricts the comprehensiveness of the classification of rural industrial integration land, with certain types, such as rural e-commerce, not yet represented. Additionally, the village-scale focus of the study may result in a somewhat coarse analysis of the layout characteristics of rural industrial integration land.
As new rural industries evolve, plot-scale land will increasingly shift toward multi-industry mixed-use, characterized by mixed industrial land use. Consequently, research on industrial land use at the plot scale will become more urgent. Using GIS and remote sensing technologies, in-depth analyses of the long-term impacts of rural industrial integration land should be conducted. By applying long-term data and large-scale perspectives, researchers can precisely elucidate the mechanisms driving rural industrial integration land evolution and forecast future trends.

6. Conclusions

Rural industrial integration has broken the conventional classification of single-industry land use, giving rise to new types of mixed-use industrial land. Rural industrial integration land is characterized by its structural diversity, multifunctionality, and compatibility in use. Empirical research based on three villages in Qingdao, China, indicates that from 2015 to 2023, rural industrial integration land in these case villages has shown increasing trends in diversity, complexity, and compatibility. In Yujia village, these metrics grew from 3.13, 0.58, and 0.50 to 4.06, 0.87, and 0.69, respectively. In Xintuannew village, they rose from 3.01, 0.95, and 0.72 to 4, 0.99, and 0.71, while in Houchenghai village, they increased from 3.36, 0.20, and 0.50 to 5.04, 0.87, and 0.90, exhibiting characteristics of mixed land use. The spatial evolution of rural industrial integration land results from the interaction of various factors, including natural resources, socioeconomic drivers, and policy influences; the interaction between the influencing factors is the key explanation for its spatial differentiation. This study outlines the characteristics of rural industrial integration land layouts, providing a theoretical basis for guiding village planning, strategically organizing village industries, and supporting rural industrial revitalization.

Author Contributions

Conceptualization, B.Z. (Bailin Zhang); Methodology, X.C. and B.Z. (Bingqian Zhai); Software, X.C.; Writing—original draft, B.Z. (Bailin Zhang) and B.Z. (Bingqian Zhai); Writing—review & editing, Y.Z. (Yan Zhou) and Y.Z. (Yining Zhang); Funding acquisition, B.Z. (Bailin Zhang) and Y.Z. (Yan Zhou). All authors have read and agreed to the published version of the manuscript.

Funding

This research was funded by the National Natural Science Foundation of China, grant number 42271260, 42101278, 41801193; Xing Dian Youth Talents Support Program of Yunnan Province, grant number XDYC-QNRC-2022.

Data Availability Statement

The original contributions presented in this study are included in the article. Further inquiries can be directed to the corresponding author.

Conflicts of Interest

The authors declare no conflict of interest.

References

  1. Chen, H.J.; Su, K.C.; Peng, L.X.; Bi, G.H.; Zhou, L.L.; Yang, Q.Y. Mixed land use levels in rural settlements and their influencing factors: A case study of Pingba village in Chongqing, China. Int. J. Environ. Res. Public Health 2022, 19, 5845. [Google Scholar] [CrossRef] [PubMed]
  2. Gu, X.K.; Xie, B.M.; Zhang, Z.F.; Guo, H. Rural multifunction in Shanghai suburbs: Evaluation and spatial characteristics based on villages. Habitat Int. 2019, 92, 102041. [Google Scholar]
  3. Huang, Y.; Zhao, J.Y.; Yin, S. Does digital inclusive finance promote the integration of rural industries? Based on the mediating role of financial availability and agricultural digitization. PLoS ONE 2023, 18, e0291296. [Google Scholar]
  4. Zhang, B.L.; Wang, Z.Y.; Zhu, M.J. Characteristics and driving forces of the mixed use of rural settlement land. Trans. Chin. Soc. Agric. Eng. 2022, 38, 267–275. [Google Scholar]
  5. Xu, W.Q.; Liu, S.; Tan, Z.M.; Wu, Z.D. Empowering rural industry integration with digital inclusive finance: Intrinsic mechanisms and threshold effects. Financ. Theory Pract. 2024, 2, 75–84. [Google Scholar]
  6. Nie, X.Y.; Wang, C.; Huang, W.Z. Evolution and spatial reconstruction of rural settlements based on composite features of agglomeration effect and ecological effects in the Hexi Corridor, Northwest China. PLoS ONE 2023, 18, e0294037. [Google Scholar]
  7. Zhang, Y.; Li, Y.C.; Tan, X.R. Land use guarantee for rural Three-Industry integration development under the perspective of agricultural spatial use control: The case of Pinggu district in Beijing Municipality. China Land 2022, 12, 12–15. [Google Scholar]
  8. Bao, J.H.; Xiu, C.B.; Liu, Y.C.; Li, J. Assessment of rural industry integration development, spatiotemporal evolution characteristics, and regional disparities in ethnic regions: A case study of Inner Mongolia Autonomous Region Counties. Sustainability 2024, 16, 6304. [Google Scholar] [CrossRef]
  9. Xu, F. Research on the dilemma and path of rural industry integration and internet revitalization driven by e-commerce. Appl. Bionics Biomech. 2022, 2022, 8665698. [Google Scholar] [CrossRef]
  10. Chen, M.Q.; Jiang, R.K.; Zhu, M.W.; Weng, Z.L. Policy options of rural industrial land use in rural revitalization: Based on “The symposium on rural revitalization and rural industrial land use policy innovation”. China Land Sci. 2018, 32, 90–96. [Google Scholar]
  11. Li, S.H.; Zhang, Y.N.; Guo, Y.X. Research on land use system innovation of integration of primary, secondary and tertiary industries in rural areas based on rural revitalization strategy: A case study of Gaochun district, Nanjing. J. Anhui Agric. Sci. 2022, 50, 252–254. [Google Scholar]
  12. Shen, Y.; Sargani, G.R.; Wang, R.; Jing, Y.X. Unveiling the spatio-temporal dynamics and driving mechanism of rural industrial integration development: A case of Chengdu–Chongqing Economic Circle, China. Agriculture 2024, 14, 884. [Google Scholar] [CrossRef]
  13. Abafita, J.; Abddisa, F.M.; Kim, K.R. Korea’s Saemaul Undong (New Village Movement): A model for rural development in Ethiopia? J. Korean Soc. Int. Agric. 2013, 25, 217–230. [Google Scholar]
  14. Hoang, L.T.; Ta, L.N.; Nguyen, H.D. One Village One Product (OVOP)—A rural development strategy and the early adaption in Vietnam, the case of Quang Ninh Province. Sustainability 2018, 10, 4485. [Google Scholar] [CrossRef]
  15. Marsden, T. Sustainable place-making for sustainability science: The contested case of agri-food and urban–rural relations. Sustain. Sci. 2013, 8, 213–226. [Google Scholar]
  16. Duan, Y.Q.; Chen, S.; Zhang, L.D. Spatial distribution characteristic and type classification of rural settlements: A case study of Weibei plain, China. Sustainability 2023, 15, 8736. [Google Scholar] [CrossRef]
  17. Zhou, T.; Jiang, G.H.; Ma, W.Q. Dying villages to prosperous villages: A perspective from revitalization of idle rural residential land (IRRL). J. Rural Stud. 2021, 84, 45–54. [Google Scholar]
  18. Chen, C.; Gao, J.L.; Cao, H. A literature review of spatial distribution and function of rural settlements and its research prospects: From urbanization to urban-rural integration in China. Geogr. Res. 2023, 42, 1480–1491. [Google Scholar]
  19. Zhou, G.H.; Dai, L.Y.; He, Y.H. Rural multifunctional evolution and rural settlements transformation. Trans. Chin. Soc. Agric. Eng. 2020, 36, 242–251. [Google Scholar]
  20. Zhu, F.K.; Zhang, F.R.; Li, C.; Zhu, T. Functional transition of the rural settlement: Analysis of land-use differentiation in a transect of Beijing, China. Habitat Int. 2014, 41, 262–271. [Google Scholar]
  21. Su, K.C.; Hu, B.Q.; Shi, K.F.; Zhang, Z.X.; Yang, Q.Y. The structural and functional evolution of rural homesteads in mountainous areas: A case study of Sujiaying village in Yunnan province, China. Land Use Policy 2019, 88, 104100. [Google Scholar] [CrossRef]
  22. Zhu, F.K.; Zhang, F.R.; Ke, X.L. Rural industrial restructuring in China’s metropolitan suburbs: Evidence from the land use transition of rural enterprises in suburban Beijing. Land Use Policy 2018, 74, 121–129. [Google Scholar] [CrossRef]
  23. Zhang, B.L.; Qian, J.C.; Cai, W.M. Discussion on mixed use of rural residential land research framework. J. Nat. Resour. 2020, 35, 2929–2941. [Google Scholar] [CrossRef]
  24. Taleai, M.; Sharifi, A.; Sliuzas, R.; Mesgari, M. Evaluating the compatibility of multi-functional and intensive urban land uses. Int. J. Appl. Earth Obs. Geoinf. 2006, 4, 375–391. [Google Scholar]
  25. Shi, H.C.; Zhao, M.X.; Simth, D.A.; Chi, B. Behind the land use mix: Measuring the functional compatibility in urban and sub-urban areas of China. Land 2021, 11, 2. [Google Scholar] [CrossRef]
  26. Shi, H.C.; Zhao, M.X.; Chen, P.Q. Measuring the functional compatibility of land from the perspective of land-use mix: A case study of Xiangtan. Trop. Geogr. 2021, 41, 746–759. [Google Scholar]
  27. GB/T21010-2017; Current Land Use Classification. Standards Press of China: Beijing, China, 2017.
  28. Hill, M.O. Diversity and evenness: A unifying notation and its consequences. Ecology 1973, 54, 427–431. [Google Scholar] [CrossRef]
  29. Ruben, M.; Antonio, P. Determinants of distance traveled with a focus on the elderly: A multilevel analysis in the Hamilton CMA, Canada. J. Transp. Geogr. 2009, 17, 65–76. [Google Scholar]
  30. Maoh, H.; Tang, Z.Y. Determinants of normal and extreme commute distance in a sprawled midsize Canadian city: Evidence from Windsor, Canada. J. Transp. Geogr. 2012, 25, 50–57. [Google Scholar] [CrossRef]
  31. Zhuo, Y.F.; Zheng, H.Y.; Wu, C.F.; Xu, Z.G.; Li, G.; Yu, Z.N. Compatibility mix degree index: A novel measure to characterize urban land use mix pattern. Comput. Environ. Urban Syst. 2019, 75, 49–60. [Google Scholar] [CrossRef]
  32. Bai, J.Z.; Zhou, Z.X.; Zou, Y.F.; Pulatov, B.; Siddique, K.H.M. Watershed drought and ecosystem services: Spatiotemporal characteristics and gray relational analysis. ISPRS Int. J. Geo-Inf. 2021, 10, 43. [Google Scholar] [CrossRef]
  33. Li, Z.T.; Yan, H.P.; Liu, X.X. Evaluation of China’s rural industrial integration development level, regional differences, and development direction. Sustainability 2023, 15, 2479. [Google Scholar] [CrossRef]
  34. Zhao, X.; Han, Y.J.; Jiang, N. Integration of three industries in rural areas: Connotation definition, realistic meanings and driving factors analysis. Issues Agric. Econ. 2017, 38, 49–57+111. [Google Scholar]
  35. Jin, S.S.; Zhong, Z.Q. Impact of digital inclusive finance on agricultural total factor productivity in Zhejiang Province from the perspective of integrated development of rural industries. PLoS ONE 2024, 19, e0298034. [Google Scholar] [CrossRef]
  36. Hao, H.; Liu, C.Y.; Xin, L. Measurement and dynamic trend research on the development level of rural industry integration in China. Agriculture 2023, 13, 2245. [Google Scholar] [CrossRef]
  37. Wang, R.; Shi, J.W.; Hao, D.Q.; Liu, W.X. Spatial-temporal characteristics and driving mechanisms of rural industrial integration in China. Agriculture 2023, 13, 747. [Google Scholar] [CrossRef]
  38. Tian, X.J.; Wu, M.H.; Ma, L.; Wang, N. Rural finance, scale management and rural industrial integration. China Agric. Econ. Rev. 2020, 12, 349–365. [Google Scholar] [CrossRef]
  39. Ye, S.; Zhao, S.; Li, M. Exploration and practice of “spot land supply” policy under the perspective of rural revitalization. China Land 2021, 7, 29–31. [Google Scholar]
  40. Liu, Q.; Lu, F.J.; Duan, R.F.; Chen, L.M. Policy innovation, path model and guarantee mechanism of land overall planning for the integrated development of rural industries: Case analysis based on Daxing district of Beijing. China Soft Sci. 2022, S1, 280–288. [Google Scholar]
  41. Zhang, X.Y. Research on the innovation of land use system for integration of rural primary, secondary and tertiary industries-based on the perspective of rural revitalization. China Place Name 2020, 5, 74–77. [Google Scholar]
  42. Qu, Y.B.; Zhao, W.Y.; Zhao, L.J. Homestead Withdrawal Mode of Hollowing Villages in Plain Agricultural Area Based on Farmer’s Perspective; Economic Science Press: Beijing, China, 2023. [Google Scholar]
  43. Jiang, G.H.; Ma, W.Q.; Zhou, D.Y.; Zhao, Q.L.; Zhang, R.J. Agglomeration or dispersion? Industrial land-use pattern and its impacts in rural areas from China’s township and village enterprises perspective. J. Clean. Prod. 2017, 159, 207–219. [Google Scholar] [CrossRef]
  44. Zhang, C.; Kuang, W.H.; Wu, J.G.; Liu, J.Y.; Tian, H.Q. Industrial land expansion in rural China threatens environmental securities. Front. Environ. Sci. Eng. 2020, 15, 299–319. [Google Scholar]
  45. Zhang, L.M.; Ge, D.Z.; Sun, P.; Sun, D.Q. The transition mechanism and revitalization path of rural industrial land from a spatial governance perspective: The case of Shunde District, China. Land 2021, 10, 746. [Google Scholar] [CrossRef]
  46. Tian, L.; Liang, Y.L.; Zhang, B. Measuring residential and industrial land use mix in the peri-urban areas of China. Land Use Policy 2017, 69, 427–438. [Google Scholar]
Figure 1. Theoretical framework diagram. Source: own study.
Land 14 00774 g001
Figure 2. Research area map. Source: ArcGIS Online, LocaSpaceViewer.
Land 14 00774 g002
Figure 3. Trends in rural industrial integration land in the Villages from 2015 to 2023. Source: Own study.
Land 14 00774 g003
Figure 4. Measurement results of the characteristics of the rural industrial integration land. Source: own study.
Land 14 00774 g004
Figure 5. Calculation results of the gray relational analysis. Source: own study.
Land 14 00774 g005
Figure 6. Analysis of the correlation coefficients of the driving factors. Source: own study.
Land 14 00774 g006
Figure 7. Driving mechanisms diagram of the rural industrial integration land. Source: own study.
Land 14 00774 g007
Table 1. Overview of the surveyed villages.
VillageGeneral OverviewCharacteristics of Industrial Integration DevelopmentField Survey Photos
Yujia villageLocated in the northwest of Jiaodong Town, Qingdao, with an area of 32.3 hectares. It has a total of 517 households and 1910 residents.The village holds the title of “China’s Pepper Processing and Trade Industry Base” and is the largest pepper distribution center in Qingdao, with 17 pepper processing enterprises. Before 2010, pepper cultivation and export were the primary industries. After 2019, the pepper industry continued to upgrade, developing an integrated industrial model combining breeding, cultivation, and processing, making it a typical village of primary and secondary industry integration.Land 14 00774 i001
Land 14 00774 i002
Xintuannew
village
Located in the northwest of Li Gezhuang Town, Qingdao, this village covers an area of 889.3 hectares and comprises 1950 households, with a total population of 4692.This village focuses on agricultural tourism and has established multiple agricultural ecological farms and flower viewing gardens. It has been designated as “Shandong Province Agricultural Tourism Demonstration Site” and “Shandong Province Rural Tourism Demonstration Site”. In 2019, it capitalized on the tourism resources of the Dagu River to develop a folk culture village and an ecological tourism village. This initiative promotes an integrated development model that combines tourism, ecological leisure, and cultural experiences, representing a typical example of the integration of primary and tertiary industries.
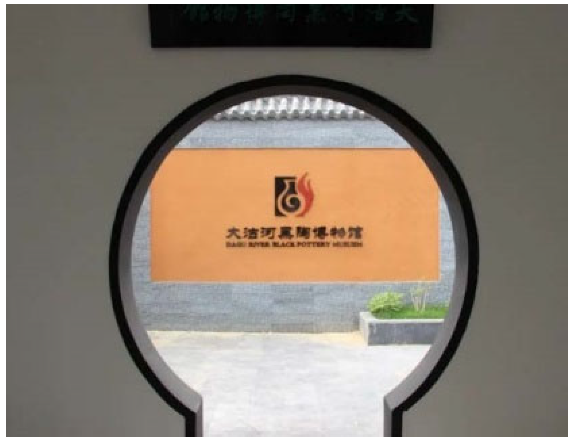
Land 14 00774 i003
Land 14 00774 i004
Houchenhai
village
Located in the central-eastern part of Yanghe Town, Qingdao, the village spans an area of 23.25 hectares and consists of 226 households with a total population of 1143.In 2019, the village established the “Jinchenghai Wangshan Plum Garden”, which focuses on facility-based agriculture for growing various economic crops, including plum and cherry trees. Additionally, the village extended its industrial chain by engaging in the deep processing of agricultural products such as cherries and blueberries, thereby developing the secondary industry. By integrating facility agriculture with rural tourism, the village has created a multifaceted industrial model that combines plum cultivation, deep processing, and tourism. This model exemplifies the integration of primary, secondary, and tertiary industries.
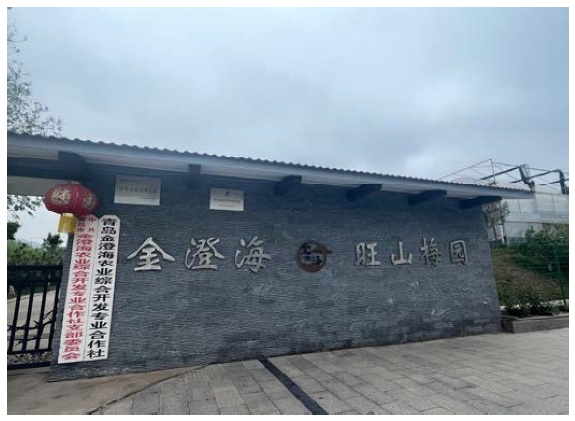
Land 14 00774 i005
Land 14 00774 i006
Source: own study based on field research.
Table 2. POI quantity and classification for the villages.
Types of POI DataQuantityType Description
Yujia
Village
Xintuannew VillageHouchenghai Village
201520192023201520192023201520192023
Dining and cuisine236111620022Fast food, restaurants, delicatessens, milk tea shops, coffee shops, etc.
Shopping and consumption12942024035Personal goods stores, beauty salons, convenience stores, general supermarkets, etc.
Factories and enterprises7131771333023Agricultural and by-products processing factories, packaging production facilities, agricultural trading companies, environmental technology companies, agriculture, forestry, animal husbandry, and fishery bases, flower gardens, green farms, etc.
Scientific, educational, and cultural services000239000Historical and cultural museums, exhibition halls, etc.
Accommodation services012124011Hotels, guesthouses, etc.
Daily life services4456822001Pharmacies, clinics, logistics points, telecommunications service centers, etc.
Scenic spots and attractions000224001Tourist attractions, temples, etc.
Leisure and entertainment112468024Pick-your-own farms, rural homestays, etc.
Public facilities01161012022Toilets, parks, etc.
Transportation facilities and services013489112Bus stops, parking lots, etc.
Source: own study, based on Geospider and Amap.
Table 3. Classification of the rural industrial integration land.
Land-Use TypesLand-Use FunctionsConnotation
Facility agricultural landAgricultural production functionUnder the condition of complying with national basic farmland protection requirements, the land for facilities directly used for commercial livestock and poultry farming, crop cultivation, or aquaculture, as well as the corresponding ancillary facility land.
Agricultural product
processing and
manufacturing land
Industrial production functionUsed for the development of primary and deep processing of agricultural products, as well as facilities for storing processed agricultural products and materials.
Mixed-use residential landProduction, scenic, and commercial service
functions
Developing cultural and sightseeing tourism, as well as specialized homestays, family workshops, farm restaurants, and agro-product stores, based on residential land.
Agricultural product retail landCommercial service functionUsed for wholesale and retail of agricultural products, as well as for other small-scale commercial uses, including marketplaces, restaurants, and similar venues.
Rural tourism industry landLeisure and
entertainment functions
Used for agritourism purposes, including scenic areas, picking gardens, traditional culture museums, and agricultural experience parks, along with supporting facilities such as parking lots and restrooms.
Source: own study, based on Current Land Use Classification (GB/T21010-2017) [27].
Table 4. Land use compatibility values.
Land Use TypesFacility Agricultural LandAgricultural Product Processing and Manufacturing LandMixed Residential LandAgricultural Product Retail LandRural Tourism Industry Land
Facility agricultural land-0.500.50.5
Agricultural product processing and manufacturing land -1/0.50.51
Mixed residential land -00
Agricultural product retail land -0.5
Rural tourism industry land -
Note: Since some residential land involves commercial and tourism activities, the compatibility values for mixed residential land are assigned based on the actual compatibility between residential land and other land use types.
Table 5. Weights for the integration index of the rural industrial integration land.
Measurement CharacteristicsYujia VillageXintuannew VillageHouchenghai Village
Diversity0.320.310.27
Complexity0.350.360.23
Compatibility0.330.330.50
Source: own study.
Table 6. Driving factors of the evolution of rural industrial integration land.
Primary IndicatorsSecondary IndicatorsUnits
Resource endowments
Y1
Facility agricultural planting area Y11hm2
Number of cultural landscapes Y12Unit
Number of laborers Y13Person
Socioeconomic conditions
Y2
Per capita disposable income of farmers Y21Ten thousand yuan per person
Total production of secondary and tertiary agricultural-related industries Y22Ten thousand yuan
Revenue from commercial and service industries Y23Ten thousand yuan
Farmers’ demands
Y3
Area of idle homestead land Y31hm2
Waste treatment rate Y32%
Proportion of commercial and service land Y33%
Industrial foundations
Y4
Number of agricultural-related secondary and tertiary industry enterprises Y41Unit
Number of commercial and service enterprises Y42Unit
Number of tourism industry types Y43Unit
Policy support
Y5
Fixed asset investment per unit of land Y51Ten thousand yuan
Source: own study.
Table 7. Measurement results of the integration index for rural industrial land.
YearYujia VillageXintuannew VillageHouchenghai Village
Integration DegreeGrowth RateIntegration DegreeGrowth RateIntegration DegreeGrowth Rate
20151.3842 -1.5786 -1.2127 -
20191.8248 31.83%1.8981 20.24%1.5232 25.60%
20231.8500 1.38%1.9123 0.75%2.0224 32.77%
Source: own study.
Disclaimer/Publisher’s Note: The statements, opinions and data contained in all publications are solely those of the individual author(s) and contributor(s) and not of MDPI and/or the editor(s). MDPI and/or the editor(s) disclaim responsibility for any injury to people or property resulting from any ideas, methods, instructions or products referred to in the content.

