Article

A Study on Spatial and Temporal Changes and Synergies/Trade-Offs of the Production-Living-Ecological Functions in Mountainous Areas Based on the Niche Width Model

1
The Faculty of Geography and Resources Sciences, Sichuan Normal University, Chengdu 610101, China
2
Key Evaluation and Monitoring in Southwest China, Ministry of Education, Sichuan Normal University, Chengdu 610066, China
*
Author to whom correspondence should be addressed.
Land 2025, 14(4), 743; https://doi.org/10.3390/land14040743
Submission received: 14 February 2025 / Revised: 27 March 2025 / Accepted: 28 March 2025 / Published: 31 March 2025
(This article belongs to the Section Land Planning and Landscape Architecture)

Abstract

:
As a typical ecologically fragile mountainous area, Liangshan Yi Autonomous Prefecture in Sichuan Province faces challenges of irrational land resource allocation and uncoordinated urbanization. This study employs an ecological niche width model to quantify the functional status of “production-living-ecological” functions (PLEFs) between 2010–2020. Methodologically, we integrated spatial autocorrelation analysis and Spearman’s correlation coefficients to systematically evaluate spatiotemporal synergies and trade-offs among PLEFs. Based on this, spatial clustering patterns were further analyzed using Maxwell’s triangle and K-means algorithms to delineate functional zones. Key findings include: (1) Production function (PF) and living function (LF) exhibit a “core-periphery” spatial pattern (high-value clusters in the south, low-value contiguous areas in the north), while ecological function (EF) displays a “high-low-high” ring-shaped pattern (high values in the northwest and southeast, declining in the central region due to development pressure); (2) synergy and trade-off relationships coexist in the study area. Synergies and trade-offs coexist among PLEFs. The synergistic effect between PF and EF strengthens significantly, the trade-off relationship between PF and LF weakens slightly, and the trade-off between LF and EF remains prominent; high-low (HL) clusters and low-high (LH) clusters exceed 55%; (3) based on synergy/trade-off relationships, the study area is divided into six functional zones (e.g., economic priority zones, ecological protection zones), with proposed optimization strategies such as “intensive valley development, eco-cultural tourism in border areas, and urban-rural coordination in central regions,” providing scientific support for sustainable territorial spatial utilization in mountainous areas.

1. Introduction

With industrialization and population concentration in cities, spatial conflict phenomena occur frequently. Land use is faced with waste of resources, irrational distribution, unbalanced development, and other problems, resulting in the deepening of the conflict between cities, agriculture, and the ecological environment [1]. How to rationally carry out land development [2] to promote the effective allocation of resources [3], as well as to coordinate the conflict of land use [4], and so on, has become an important issue for the world’s countries in the context of sustainable development. They are important issues faced by countries around the world. Mountainous areas play a crucial role in guaranteeing food security and biodiversity and maintaining the rural landscape [5] land use functions in mountainous areas are in conflict; it will affect the productivity of the region, its ecological security, and its ability to provide resources to the outside world [6]. The land in ethnic minority mountainous areas is still fundamental for the survival of the residents and a key resource to achieve poverty alleviation and spatial optimization of the land [7]. Hence, deeply understanding the intrinsic law of land use functions in mountainous regions and their inter-relationships is crucial for advancing the harmonious development of society and ecosystems, as well as achieving sustainable development [8].
Land use function (LUF) reflects the ability of land to provide a variety of material and nonmaterial goods and services and is an important tool for assessing land use changes and promoting the realization of sustainable development goals [9,10,11]. LUF is also a key factor in determining the regional spatial layout and its balance of functions, which is of great significance in easing the contradiction between human beings and nature and promoting regional development [8,12]. The study of the multifunctionality of land use focuses on the synergies and trade-offs between different land use types, which are manifested in the strategic optimization of the efficiency of land use in order to achieve a balance between limited land resources and the changing needs of socioeconomic development. Therefore, clarifying the interactions among LUFs and their mechanisms is essential to realize the coordinated development of LUFs and promote the goal of sustainable development. However, for the effective implementation of sustainable development and the “Beautiful China” strategy, in recent years, the “production-living-ecological” space (PLES) formulated by the Chinese government has been widely used in China’s national spatial planning system. This categorization effectively combines socioeconomic needs with the potential of natural landscapes to support decision-making. The reflection of these functions in geospatial space makes PLES a classification space based on multifunctional land use [13]. These spaces reflect the characteristics of human beings in different historical periods based on the interaction of needs and land resources [14]. The sustainable development of human society depends on the effective coordination among PLES [15]. In order to promote the sustainable development of population and resources, China proposes to build an intensive and efficient production space, an appropriately scaled residential space, and an environment that maintains ecological originality, which is highly consistent with the concept of PLE functional division and has strong feasibility. Identifying the synergies and trade-offs among land-use functions through the lens of PLEFs is central to promoting coordinated regional development and serves as a vital foundation for China’s territorial spatial planning.
The research on the PLES in China primarily emphasizes its theoretical framework and classification system [16], the quantitative change in the functions and their spatial distribution [17], the driving mechanism of the functions [18], and the spatial evolution law of the PLEFs over time [19,20]. The current research scope is mostly from a macroscopic perspective, focusing on provinces, cities, and other large and medium-sized administrative regions [15,21,22]. There is a lack of attention to counties, towns, villages, and other small administrative units, especially ecologically fragile areas, as a holistic research area [23]. In addition, the interconnections among the PLEFs are deeply influenced based on socioeconomic development levels and regional variance laws, showing obvious spatial and temporal differentiation [20]. However, previous studies have often focused on the assessment of the static pattern of the PLEFs [24], while the revelation of their dynamic evolution is insufficient, making it difficult to comprehensively depict the continuity and dynamic changes in the PLEFs [25]. Thus, to gain a clearer insight into the connection among the PLEFs and to identify their inherent principles, we try to introduce the ecological niche potential theory, which, as one of the basic theories of ecology, has been widely used in urban planning [26] and tourism [27]. Research on land use is still relatively small [28], which can be used to analyze the effects of different land use types on the environment. This theory can be used to analyze the position, function, and inter-relationship of different land use types in a specific ecosystem and can concurrently reflect the current state and forecast its developmental trajectory [29,30], thus providing a new perspective and method for analyzing the interaction of the PLEFs.
In view of this, this paper takes Liangshan Yi Autonomous Prefecture (hereinafter referred to as “Liangshan Prefecture”) as the research object and analyzes the types of synergistic/trade-off relationships and spatial and temporal changes in the PLEF terms of quantity and spatial distribution based on the grid scale (2000 m × 2000 m). The aim is to comprehensively reveal the spatial and temporal variability of the synergies and trade-offs among the PLEFs in Liangshan Prefecture and their dynamic interaction mechanisms. On this basis, a functional zoning optimization framework that takes into account ecological protection and socioeconomic development is proposed, and spatially differentiated management strategies and policy recommendations that suit the characteristics of mountainous regions are suggested. The research results are expected to provide a theoretical basis for the synergistic development of land space in ecologically fragile mountainous areas, in particular, implementable solutions for the coordination of poverty alleviation needs and ecological protection needs in national autonomous regions. It will provide theoretical support and scientific reference for promoting sustainable development and optimal adjustment of land use in mountainous areas.

2. Study Area and Data Sources

2.1. Study Area

Liangshan Prefecture, as the “bridgehead” of the Southwest Sichuan Southbound Channel connecting to ASEAN and the hinterland of the Pilot Zone for Innovative Development of Strategic Resources in West Panzhihua, possesses a lot of advantageous resources that are easy to develop; with its complex and varied topography, it is an important part of the ecological barrier on the upper reaches of the Yangtze River. Its complex natural conditions and human factors have made it an ecologically fragile area as well as a poverty-stricken area. Liangshan Prefecture is located at the Sichuan-Yunnan border, situated in the western zone of the Yangtze River Basin and the Hengduan Mountains, and is a key component of the border zone between Sichuan, Yunnan, and Guizhou Provinces, an area that is particularly prominent in the southwestern region of China [31]. As shown in Figure 1, the state covers an area of 60,290,000 km2, mainly dominated by mountainous areas, with a wide range of terrain heights, high in the northwest and low in the southeast, low vegetation cover, serious soil erosion, and frequent natural disasters. Recently, land utilization in this region is facing the problems of increasing pressure on arable land protection, prominent contradiction between supply and demand of building land, low land use efficiency, and inadequate ecological land safeguards. The incoherence of the PLEFs and the increase in ecological pressure in Liangshan Prefecture pose a serious challenge to its sustainable development. Therefore, this paper analyzes it as a research object with strong representativeness.

2.2. Data Sources

In this paper, 17 counties (cities) in Liangshan Prefecture are selected as the research unit, and the data required for the study mainly include two categories of socioeconomic data and spatial information data, with 2010, 2015, and 2020 as the time nodes, as shown in Table 1.

3. Methods

This study adopts a mixed-methods approach (Figure 2), combining quantitative analyses (e.g., ecological niche width modeling, spatial autocorrelation) with qualitative assessments of PLEFs and land use conflicts. By integrating socioeconomic data and spatial geographic information, we systematically mapped the spatial and temporal divergences of PLEFs and identified synergies/trade-offs between them. Based on these studies, we proposed an optimized zoning strategy that suits the characteristics of the region, providing actionable guidance for balancing sustainable development and ecological protection.

3.1. Construction of the PLEFs Indicator System

The essence of territorial spatial planning encompasses the organized categorization of productive, residential, and ecological aspects, collectively referred to as PLES. By optimizing the spatial layout, the goal is to achieve efficient resource utilization and sustainable development, promoting the integrated advancement of the economy, society, and environment. Therefore, constructing a comprehensive and scientific classification and evaluation system for the PLES is key to shaping a rational spatial layout.
Currently, there is no common standard for the classification system of the PLES in both domestic and international literature. This study references relevant sources [24,25,37,38,39], and combines the principles of the multiple interactions between PLES and land functions to deeply explore the inherent connections between urban land use structure and PLES. An evaluation index system for the multifunctionality of land use has been created based on the regional traits of Liangshan Prefecture (as shown in Table 2). This study selects 22 core indicators to comprehensively assess the “production-Living-Ecological” system. (1) The production function (PF) primarily focuses on the economic benefits and output capacity of land use. The economic development of Liangshan Prefecture relies heavily on agricultural production, industrial development, and fiscal contributions. Consequently, metrics like grain yield, land reclamation percentage, and agricultural output value ratio are chosen to represent the fundamental state of agricultural production. Additionally, indicators such as industrial output per unit of land, fiscal contribution rate, and industrial structure reflect the degree of industrial development and economic structure optimization. These indicators collectively form the core of the PF assessment for Liangshan Prefecture. (2) Living function (LF) mainly emphasizes residents’ quality of life and the standard of social services. When constructing the LF indicator system for Liangshan Prefecture, emphasis was placed on indicators that reflect residents’ income and living standards, such as per capita net income of farmers and the urban-rural income balance index, as well as indicators that reflect the level of urbanization and social services, such as the urbanization rate, traffic density, and per capita retail sales of social consumer goods. Additionally, indicators like population density and the number of hospital beds were considered to comprehensively assess residents’ quality of life and health care levels, establishing a foundation for developing pertinent policies. (3) Ecological function (EF) primarily focuses on the impact of land use on the ecological environment and the degree of environmental protection. Liangshan Prefecture is rich in natural resources and ecological environments, so the ecological function indicator system emphasizes indicators such as the irrigated area of farmland, the proportion of ecological land, and the forest coverage rate to reflect the quality of the ecological environment. Other factors, such as the amount of agricultural fertilizer applied, biodiversity index, and the proportion of water and wetland areas, were also considered to provide a comprehensive evaluation of land use effects on the ecological environment and the efficacy of conservation strategies. The selection of these indicators helps ensure the sustainable development of the ecological environment in Liangshan Prefecture.

3.2. Ecological Niche Width Model

Ecological niche width refers to the diversity of resources that a population or biological unit can utilize within its habitat, reflecting its adaptability to environmental demands and the degree of specialization [40]. Based on the ecological niche width model, the evaluation of land use function status and development trends quantifies the diversity of resources available to different land use functions, reflecting their functional richness. By analyzing the dynamic changes in ecological niche width, the current status, and the future potential of land use functions can be revealed.
Within the PLEFs, ecological niche width is considered a key indicator for measuring the advantages of production, living, and EF. Over time, the ecological niche “state” and “potential” of each function will exhibit different fluctuation patterns. A larger ecological niche width for a given function indicates greater advantages for that function, and vice versa [41]. Therefore, the ecological niche width model, constructed based on “state and potential” theory, can accurately describe the current state and developmental potential of land use functions at specific time points. By conducting a thorough analysis of this model, the main factors that affect the performance of different functions can be systematically determined, providing a theoretical basis for formulating scientifically sound land use optimization strategies and fostering the long-term sustainability of regional functions.
This study draws on calculations on ecological niche “status” and “potential” [42]. By comparing the actual ecological niche with the ideal ecological niche under maximum function, the “state” of functional status is quantified. Through the previous calculation of the index factor, the maximum values of the standardized functional indicators are set as the reference for the ideal ecological niche. The percentage similarity formula is then applied to assess the “state” of each function, calculating its proximity to the ideal state.
C q i j = X q i j X q i o p t
where q = 1, 2, …, n, n represents the total number of functions; i = 1, 2, …, m, m is the number of factors; j = 1, 2, …, t, t is the number of evaluation units; C q i j is the “state” of the ecological niche of the first factor in the qth function of the evaluation unit j; X q i j is the realistic value of the ith factor in the qth function of the evaluation unit j; Xqiopt represents the ideal value of the ith factor in the qth function.
The “potential” in the research unit is calculated by the following formula:
P q i j = j = 1 n X q i j X q i o p t n
The ecological niche of the study unit is:
I qij = C q i j + A q i j P q i j m = 1 n C q i m + A q i m + P q i m
In Equation (3), the meaning of q, j, i is the same as in Equations (1) and (2); m = 1, 2, …, n, n is the number of evaluation units; I q i j is the ecological position of the first factor in the qth function in the evaluation unit j; A q i j and A q i m are the scale conversion coefficients.
The calculation of the ecological niche width model for national territorial space based on “state and potential” is as follows:
Z qi = j = 1 n I qij 1 / n i = 1 n w q j I q i j
where is the ecological niche width of the qth homeland spatial function of the evaluation unit i; I q i j is the same as the above equation, W q i j denotes the weight of the jth factor of the qth function.

3.3. Spatial Correlation

When using SPSS SPSS Statistics V26 for data analysis, Spearman’s rank correlation analysis becomes a powerful tool for evaluating the quantitative relationships between land use functions. This method quantifies the strength of monotonic relationships between variables by calculating the ρ value, which ranges from −1 to 1. When the ρ value is extremely positive (i.e., close to 1), it reveals a strong positive synergy between the two land use functions. Conversely, when the ρ value is extremely negative (i.e., close to −1), it indicates a clear negative trade-off relationship. Additionally, the consideration of the significance level of PPP helps to validate the statistical reliability of these relationships.
Exploratory Spatial Data Analysis (ESDA), an extension of Exploratory Data Analysis (EDA) in the geographic domain, is used to uncover spatial patterns and inter-relationships in geographic data. This study presents the analysis of the quantitative relationships between the synergy/trade-offs of the PLEFs. Based on the spatial statistics module of the Geoda platform, this study used the local spatial autocorrelation local Moran’s I index to measure the spatial dependence of geographic elements, using a z-test, and the significance level was set at p = 0.05. When the calculated value approaches 1, it indicates that the spatial autocorrelation is stronger. Based on this, the factor agglomeration characteristics are obtained: spatial homogeneous cluster (HH area/LL area) and spatial heterogeneous cluster (HL area/LH area). The latter reflects the discrete characteristics of elements [43]. The resulting LISA (Local Indicators of Spatial Association) distribution map visually and effectively reveals the spatial interaction characteristics and patterns between adjacent functions within the region, thereby deepening the understanding of the dynamic relationships among the PLES. It also provides theoretical support for the subsequent functional area division.

3.4. Land Use Functional Zoning

3.4.1. Maxwell’s Triangle

When defining the zoning units, it is important to consider that multiple trade-offs between functions may coexist within the same grid unit, making it difficult to effectively assess their relative advantages and disadvantages. Additionally, using grids as zoning units presents practical challenges in land use management and regulation. Therefore, to ensure better spatial continuity and integrity in land use functional zoning, the grid units are scaled up and transformed into level units. As a more senior administrative division, it is better suited to meet the needs of the overall land use planning and regional coordinated development, making it a more appropriate unit for defining functional zoning.
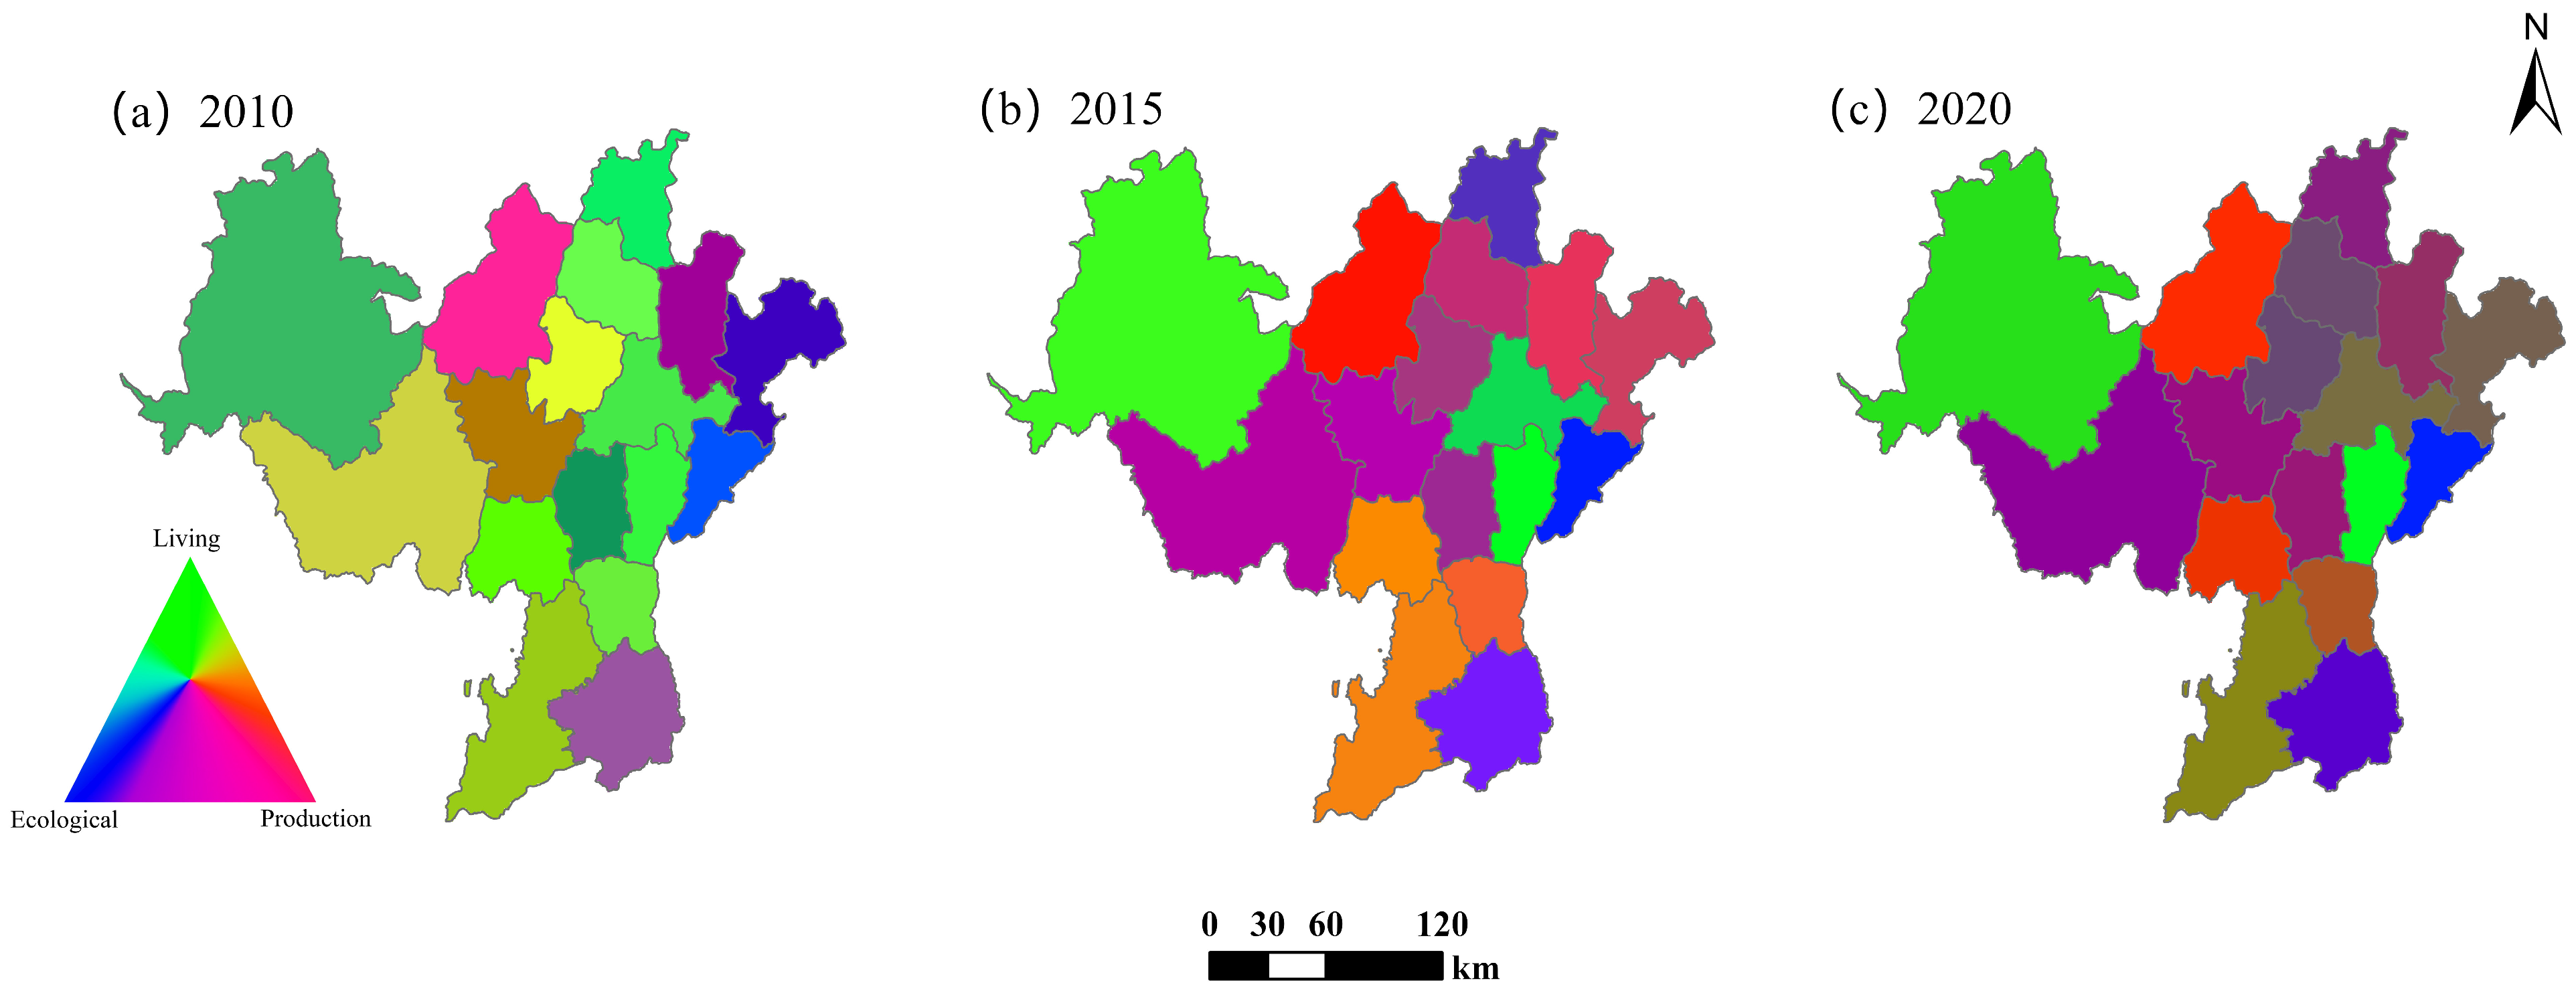
Maxwell’s triangle offers a visual representation of the interaction between three variables through the RGB color model, presenting the data in spatial graphics. In this study, the triangle is used to depict the combined contributions of the three primary land functions, with PF, LF, and EF represented by red, green, and blue, respectively. This allows for the determination of the chromaticity coordinates for each evaluation unit i within the triangle, as can be seen below:
x i y i z i = P i / P i + L i + E i L i / P i + L i + E i E i / P i + L i + E i
where P i , L i , and E i represent the evaluation scores for PF, LF, and EF of unit i, respectively. x i , y i , and z i represent the contribution rates of PF, LF, and EF to land multifunctionality, i.e., the value of the dominant functions, with their sum equal to 1. In the triangle, the closer a point is to the vertex, the larger the proportion of a single function in the overall functions. If a point lies between two vertices, it indicates that the area is primarily dominated by two functions. For instance, the magenta region, located between the blue and green vertices, indicates that the area is dominated by ecological LFs. The functional combination pattern obtained based on Maxwell’s triangle can directly reflect the trade-offs or synergistic relationships among multiple objectives in each county, thus providing a basis for the determination of the clustering parameters of the subsequent functional partitioning.

3.4.2. K-Means Clustering

K-means clustering is often used for the identification and partition of ecosystem service clusters. In this study, each county unit can be regarded as a service cluster; because there is also some correlation between neighboring counties, a deeper cluster analysis is needed. Therefore, the K-means clustering algorithm was used to divide the land-use functions. The algorithm assigns samples to the nearest class clusters by calculating the Euclidean distance between the samples and the initial clustering center and iteratively updates the center until convergence [44], which is computationally efficient and widely applicable [45]. The method generates the initial partition based on the dominant functional values and thus determines the optimal number of clusters. The Euclidean distance between the spatial cell normalized functional vectors ( P i , L i , E i ) and the cluster is first computed. The algorithm of Equation (7) minimizes the sum of the variance within the cluster by iteratively optimizing the cluster center and repeats the iteration until the clustering process is terminated when the iteration is terminated.
d x i , x j = r = 1 p | x i r x j r | 2 1 2
C I = arg min 1 1 k d x i , v I , i = 1 , 2 , , N
v l = arg min v i c l d x i , v , i = 1 , 2 , , N
where d ( x i , x j ) represents the Euclidean distance calculated for this sample upon clustering; x i for the ith sample; x i r for the ith sample; In Equation (7), C(l) is the set of samples included by class l; v l is the center of gravity of the l class.

4. Results

4.1. Evaluation Results of the PLEFs in Liangshan Prefecture

The spatial differences in the width of the niche of the PLEFs of the 17 county units in Liangshan Prefecture are obvious, with significant changes over time, and the characteristics of each region are prominent, as shown below (Figure 3). (1) The PF in Liangshan Prefecture shows the characteristics of the core-marginal distribution in the spatial distribution, with the spatial gradient differences of the north-low-south-high, central core, and margins. Weak spatial gradient differences, overall, with 2020, as the nodes appear to have significant changes. Xichang City is the core area of PF, and the value of PF in Xichang is at the highest level and continues to grow during 2010–2020, reflecting its comprehensive advantages in agriculture, industry, infrastructure and policy support, etc. The PF in the northwest is low and stable, and Muli and Yanyuan counties are located in high mountains and valleys, with fragile ecology and located in the important EF protection zones, and the development of PF is restricted; the northeastern border counties have a weak ecological position width, and the limitations of the natural environment lead to inconvenient transportation and shortage of resources, thus restricting economic development and effective use of land resources, and are far away from the functional core area, lack of external driving force, and the phenomenon of overdevelopment and ecological degradation, with an overall contiguous distribution, after 2020. The southern medium-high value area extends, while the functional value in the north and east increases. Regions such as Yanyuan and Dechang are boosting the production function through the development of modern agriculture, eco-tourism, and other specialized industries. However, the difference between the north-south gradient is still significant, and it is necessary to further promote the balanced development of the north-south region in the future. (2) The distribution of LF is similar to that of PF, showing a gradient distribution pattern of “high in the southwest and low in the northeast”, with a trend of gradual improvement in spatial equalization, with the middle- and high-value areas expanding in the northeast and the low-value areas shrinking. Overall, there is a significant change in 2015 in the node. During 2010–2020, the areas with higher values of LF in Liangshan Prefecture are mainly concentrated in the south and have been stable for a long time. These areas belong to the resource development type, rich in mineral resources, relatively perfect public services and infrastructure, and the LF have been prioritized for development; the central area has higher values of LF, which is mainly due to the radiation effect of the state capital and the agglomeration of transportation and resources; the central area has higher values of LF and the agglomeration of transportation and resources; the northern border region has a perennial low level of LF, due to its relatively backward economy, single industry, lack of support for infrastructure and LF, in addition to the sparse and scattered population, lack of scale effect, frequent natural disasters, and slow improvement of LF. The value of LF in some counties declined by 2015, reflecting the limitations of the stage of socioeconomic development and factors such as poverty, lagging infrastructure, and unbalanced urban and rural development as the key factors restricting the performance of LF in these counties. The value of LF in the contiguous poor areas improved significantly after 2015, but there is still a gap with the high-value areas, so in the future, we can focus on the investment of resources and industrial planning in the border counties and comprehensively improve the level of LF by making up the short boards in education, medical care, transportation, and other areas. (3) The overall performance of the “high-low-high” ring-shaped spatial distribution has a gradient distribution pattern from the edge to the center. The northwestern areas, such as Muli and Yanyuan, always maintain high functional values, forming a relatively stable ecological high-value area, which is related to rich natural resources and less human interference; the central area has a higher population density, strong agricultural and infrastructure development, and higher ecological pressure, forming a strip-shaped low-value area; some areas in the southeast have higher functional values, steeper topography, and lower ecological development, and the growth of urban and rural construction land is comparatively slow. The increase in urban and rural construction land occurs at a relatively slow pace. During 2010–2015, the functional value of the central region (e.g., Zhaoguo and Puge) declined, indicating that economic development exerted a certain pressure on the ecological environment. During 2015–2020, due to the ongoing implementation of the farmland-to-forest conversion project and the strengthening of environmental monitoring by resource development, the functional value of some low-value areas (e.g., Huili and Ningnan) rebounded. Overall, the spatial distribution pattern of EF values and county differences in Liangshan Prefecture reflects the diversity of resource endowments and the unevenness of development intensity. In the future, the EF level of the whole state should be improved by promoting regionally coordinated development and implementing precise ecological protection measures.

4.2. Analysis of Changes in the Number of Synergies/Trade-Offs

The results of the synergy/relationship between the number of individual functions are shown in the figure below (Figure 4):
The correlation between PF and LF generally shows a fluctuating upward trend, increasing from 0.703 in 2010 to a peak of 0.890 in 2015, before falling back to 0.748 in 2020. This indicates that targeted poverty alleviation, relocation projects, and the development of specialty agriculture have significantly enhanced the support of production for LF. However, due to the overexploitation of resources in certain areas and the widening urban-rural gap, synergy has weakened. The correlation between PF and EF has remained negative, but the correlation coefficient increased from −0.566 in 2010 to −0.485 in 2020. This reflects that policies promoting ecological civilization (examples include projects like converting farmland to forest and implementing ecological compensation) have alleviated the pressure of production on the environment, although ecological restoration remains slow due to the constraints of traditional economic models. The negative correlation between LF and EF decreased from −0.642 in 2010 to −0.498 in 2015, but rose again to −0.522 in 2020. This highlights the growing occupation of ecological space driven by urbanization and excessive exploitation of LF. Overall, the synergy between PF and LF remains strong, while EF still exhibits a significant trade-off relationship with both, indicating the need to optimize functional layout, promote green development, and achieve synergy and sustainable development of the PLEFs.

4.3. Analysis of Spatial Variation in Synergies/Trade-Offs

Through bivariate local spatial autocorrelation analysis, we obtained LISA distribution maps for 2010, 2015, and 2020, which can better reflect the spatial interaction between the two functions.
As shown in Table 3, according to the results of the bivariate Moran’s I index, the PF-LF had a significant positive spatial correlation in three years, indicating a strong synergistic relationship. The correlation coefficient rises sharply from 0.470 in 2010 to 0.749 in 2015 and then decreases to 0.723 in 2020; PF-EF and LF-EF are both significantly negatively correlated, indicating the existence of trade-offs and the fluctuating rise of Moran’s I, with the most significant trade-offs in 2010 and then decreasing in some regions in 2015. The most significant trade-off was in 2010, and the trade-off effect weakened in some regions in 2015, and the correlation coefficient decreased in 2020, indicating that the trade-off effect rebounded (Table 3).
Local spatial autocorrelation analysis was performed for the three sets of functions. (1) PF-LF: In 2010, the synergy relationship showed a scattered distribution. The HH areas were primarily distributed in the central and southern regions, whereas the LL areas were concentrated in the northern and eastern areas, covering 56% of the total area. The trade-off relationship was mostly found along the borders, including Mianning and Ningnan (Figure 5a). In 2015, the HH areas slightly shrunk but were still mostly located in the south. The LL areas expanded in the northeast, and the HL areas were primarily distributed in Mianning and Dechang (Figure 5b). By 2020, the HH areas remained largely unchanged, while the LL areas spread somewhat in the eastern and western regions. The HL areas showed little change (Figure 5c). (2) PF-EF: In 2010, the synergy/trade-off relationship showed a scattered distribution. LL areas were concentrated in the northeastern region. HL areas were mainly found in Muli, and LH areas formed a continuous distribution in the central and southern regions (Figure 5d). In 2015, HH areas emerged in Ningnan, LL areas expanded to Dechang and Mianning, and HL areas increased, covering Muli, Yanyuan, and Jinyang (Figure 5e). By 2020, the synergy/trade-off relationship remained scattered. HH areas significantly increased, mainly including Dechang, Mianning, Zhaojue, and Leibo. Muli and Yanxian transitioned from HL areas to LL areas, while LH areas expanded, especially around Xichang (Figure 5f). (3) LF-EF: In 2010, the trade-off relationship was prominent, with HL areas primarily located in Muli and LH areas mainly in Xichang, Dechang, Huili, and Huidong (Figure 5g). In 2015, the trade-off relationship gradually strengthened, with both HL and LH areas expanding. The synergy also increased, as indicated by the appearance of HH areas mainly in Ningnan (Figure 5h). By 2020, both synergy and trade-off effects weakened to varying degrees. HH areas disappeared, LL and HL areas decreased, and LH areas remained relatively unchanged (Figure 5i).
From 2010 to 2020, the synergy between PF and LF in Liangshan Prefecture was consistently stronger than the trade-off relationship, with the trade-off relationship being almost nonexistent. The proportion of HH areas with a synergistic relationship decreased from 36.3% to 25%, while the LL areas continuously increased from 45.5% to 62.5%. The proportion of LH areas with a trade-off relationship decreased by approximately 5.6% (Figure 6A). The relationship between PF and EF shifted from trade-off to synergy, with the proportion of synergistic areas increasing by 16.2% and the proportion of trade-off areas decreasing by 16.67% (Figure 6B). LF and EF are dominated by trade-off relationships, with an overall increase of 17.78% in the number of trade-off types and a significant increase in the proportion of HL trade-offs to 55.56% in 2020, suggesting that the trade-off relationship between high LF regions and EF has further intensified and needs to be targeted to optimize the layout, and the proportion of synergistic relationships (HH and LL) has declined as a whole, especially LL, which declines to 22.22% in 2020 (Figure 6C), indicating that the optimization of LF and EF in LF regions needs to be strengthened.
In summary, the PLEFs in Liangshan Prefecture show significant spatial and temporal differentiation, with both synergy and trade-off relationships coexisting. The imbalance in regional development remains a major issue. In the future, internal changes should be analyzed in depth in a specific way, and the spatial layout of PF and EF as well as LF and EF should be further optimized on the basis of guaranteeing the EF to promote the synergistic development and achieve the goal of sustainable development in the region.

4.4. Synergy/Trade-Off Based on Functional Zoning and Optimization of Land Use

4.4.1. Dominant Function Analysis

According to the color legend, the colors of different county units correspond to the compositional characteristics of their three main functions, so as to analyze their dominant land functions. As shown in the following figure, in 2010, the distribution was dominated by single-function dominance and was relatively decentralized. The green areas are predominantly located in the eastern region of Liangshan Prefecture in a north-south direction, indicating that these areas are dominated by LF. EF-dominated areas are mainly distributed along the northeastern border. PF-dominated areas are mainly distributed in Coronation County, and Yanyuan County is dominated by PF-LF (Figure 7a), with 2015 as the nodal point. The dominant functional areas change significantly (Figure 7b), and the distributions of 2015 and 2020 are roughly the same, with the green areas being dominated by the three functions (Figure 7b), and the distributions of 2015 and 2020 are roughly the same. The distribution is roughly the same in 2015, accompanied by a notable reduction in green spaces and a gradual shift to magenta in certain regions (Figure 7c), indicating that LF has contracted while synergies between PF and EF have begun to emerge, and the PF-EF functional area has expanded significantly, mainly concentrated in the state capital and adjacent counties, and the increase in more mixed-function areas indicates that synergistic relationships among the three functions are further strengthened, and that multifunctionality is evident, but some areas still exhibit single-function dominance, and functional synergy should be further promoted in the future to strengthen regional linkages and achieve coordinated economic, social and ecological development.

4.4.2. Land Use Functional Zoning and Optimization Proposals

PLEFs collaborative/spatial heterogeneity of space makes each county in space present different clustering characteristics [46], so using the K-means clustering method to analyze the three typical functions of the study area, get the final land use function partition according to the “functional synergy-spatial clustering-policy adaptation” principle and the Liangshan land use multifunctional partition (Figure 8), and provide relevant optimization suggestions for each area.
Zone 1: Economic Priority Area. This area includes Dechang and Mianning, where the PF is dominant, and economic activities are relatively active. Land use is concentrated in agriculture, industry, and other sectors, with a focus on resource development, industrial innovation, and efficient utilization. It is also a key base for the strategic application of rare earth resources. In the future, attention should be given to economic growth and industrial upgrading, with a focus on the strategic direction of building a “green mineral” industry and a “resource-conserving society.”
Zone 2: Residential Priority Area. This area includes Muli and Butuo, where the LF has reached a high level. Muli is rich in ecological resources, offering both conservation value and tourism potential. Butuo boasts unique natural landscapes and distinct cultural and ethnic characteristics, making it suitable for the development of niche tourism. In the future, based on the strategic requirements of Liangshan Prefecture, efforts should focus on integrating ecology, culture, and health tourism industries to promote the rise of the tourism economy, enhance infrastructure, and improve residents’ living standards.
Zone 3: Ecological Protection Area. Dominated by EF, Jinyang serves as a vital ecological barrier in the upper Yangtze River and is a core area for national key EF protection. It also plays an essential role in safeguarding water sources in the downstream regions of the Jinsha River. In Huidong, forest coverage reaches 47.4%, while grassland coverage stands at 84.2%. EF dominates, although agricultural production is also of significant value. Future development should prioritize ecological protection while promoting pollution-free and organic agriculture to increase the added value of agricultural products.
Zone 4: Urban-Rural Coordination Area. Located primarily in the southern region, this zone includes Huili, which functions as a central city in the region, and a pioneer area for the integration of primary, secondary, and tertiary industries in rural areas. Ningnan focuses on developing specialty agriculture, balancing living service functions, and integrating modern agriculture, health tourism, and small-town construction. In the future, both regions need to emphasize urban-rural integration and ecological protection, promoting the green development of agriculture and tourism, and striving to become key nodes for regional economic development.
Zone 5: Green Industry Area. This area includes Yanyuan, Xichang, Puge, Ganluo, and Meigu. These areas are characterized by a balance between production and EF. The designation of the green industry area takes full advantage of geographic location, such as the agricultural climate in Yanyuan, the central role of Xichang, and the ecological resources of Puge, Ganluo, and Meigu. Future development should focus on achieving sustainable economic growth through eco-agriculture, health tourism, and green resource development.
Zone 6: Ecologically Livable Area. This area includes Yuexi, Xide, Zhaojue, and Leibo, which are designated as living-ecological function areas. The rich ecological resources (forests, wetlands, rivers, etc.) are the main advantages of these areas. The terrain is predominantly hilly and mountainous, limiting large-scale industrialization but providing opportunities for ecological protection and the development of LF. These regions, with a focus on ecological livability, are suitable for the promotion of eco-tourism, green town development, and agricultural ecological transformation. Future efforts should include continuous improvements in urban infrastructure, emphasizing low-carbon, environmentally friendly practices, and creating green, livable towns.

5. Discussion

Exploring the synergy/trade-off mechanism of territorial spatial PLEFs is an important scientific proposition for the Liangshan Yi Autonomous Prefecture to crack the contradiction of resource mismatch in ecologically fragile areas, to coordinate the conflict of the human–land relationship in the process of urbanization, and to promote the sustainable development of ethnic areas.
From the point of view of the rationality of the research theory. Based on the ecological niche width model, this paper quantitatively measures the characteristics of the “state” and “potential” of PF, LF, and EF at the county scale in 2010, 2015, and 2020 and analyzes their different spatial and temporal evolution laws, which can comprehensively reflect the dynamic changes in production, life, and ecological functions. Ecological niche theory originated from the study of biological communities, population distribution, and regional environmental systems [47]. In recent years, its application scope has gradually expanded to the socioeconomic field, becoming an innovative tool for resolving the complex ecological-social associations in land use evolution, effectively compensating for the limitations of traditional models [48]. For example, scholars have achieved multiobjective optimization of land structure, environmental vulnerability evaluation, and synergistic zoning of spatial functions by defining the natural-economic-social composite ecological attributes of arable land, construction land, and other types of land use [49], or achieving multiobjective optimization of land structure, environmental vulnerability evaluation, and synergistic zoning of spatial functions based on the theory [50]. The theory provides a more systematic analytical framework for the dynamic simulation and sustainable management of land systems through the integration of multidimensional ecological niche parameters.
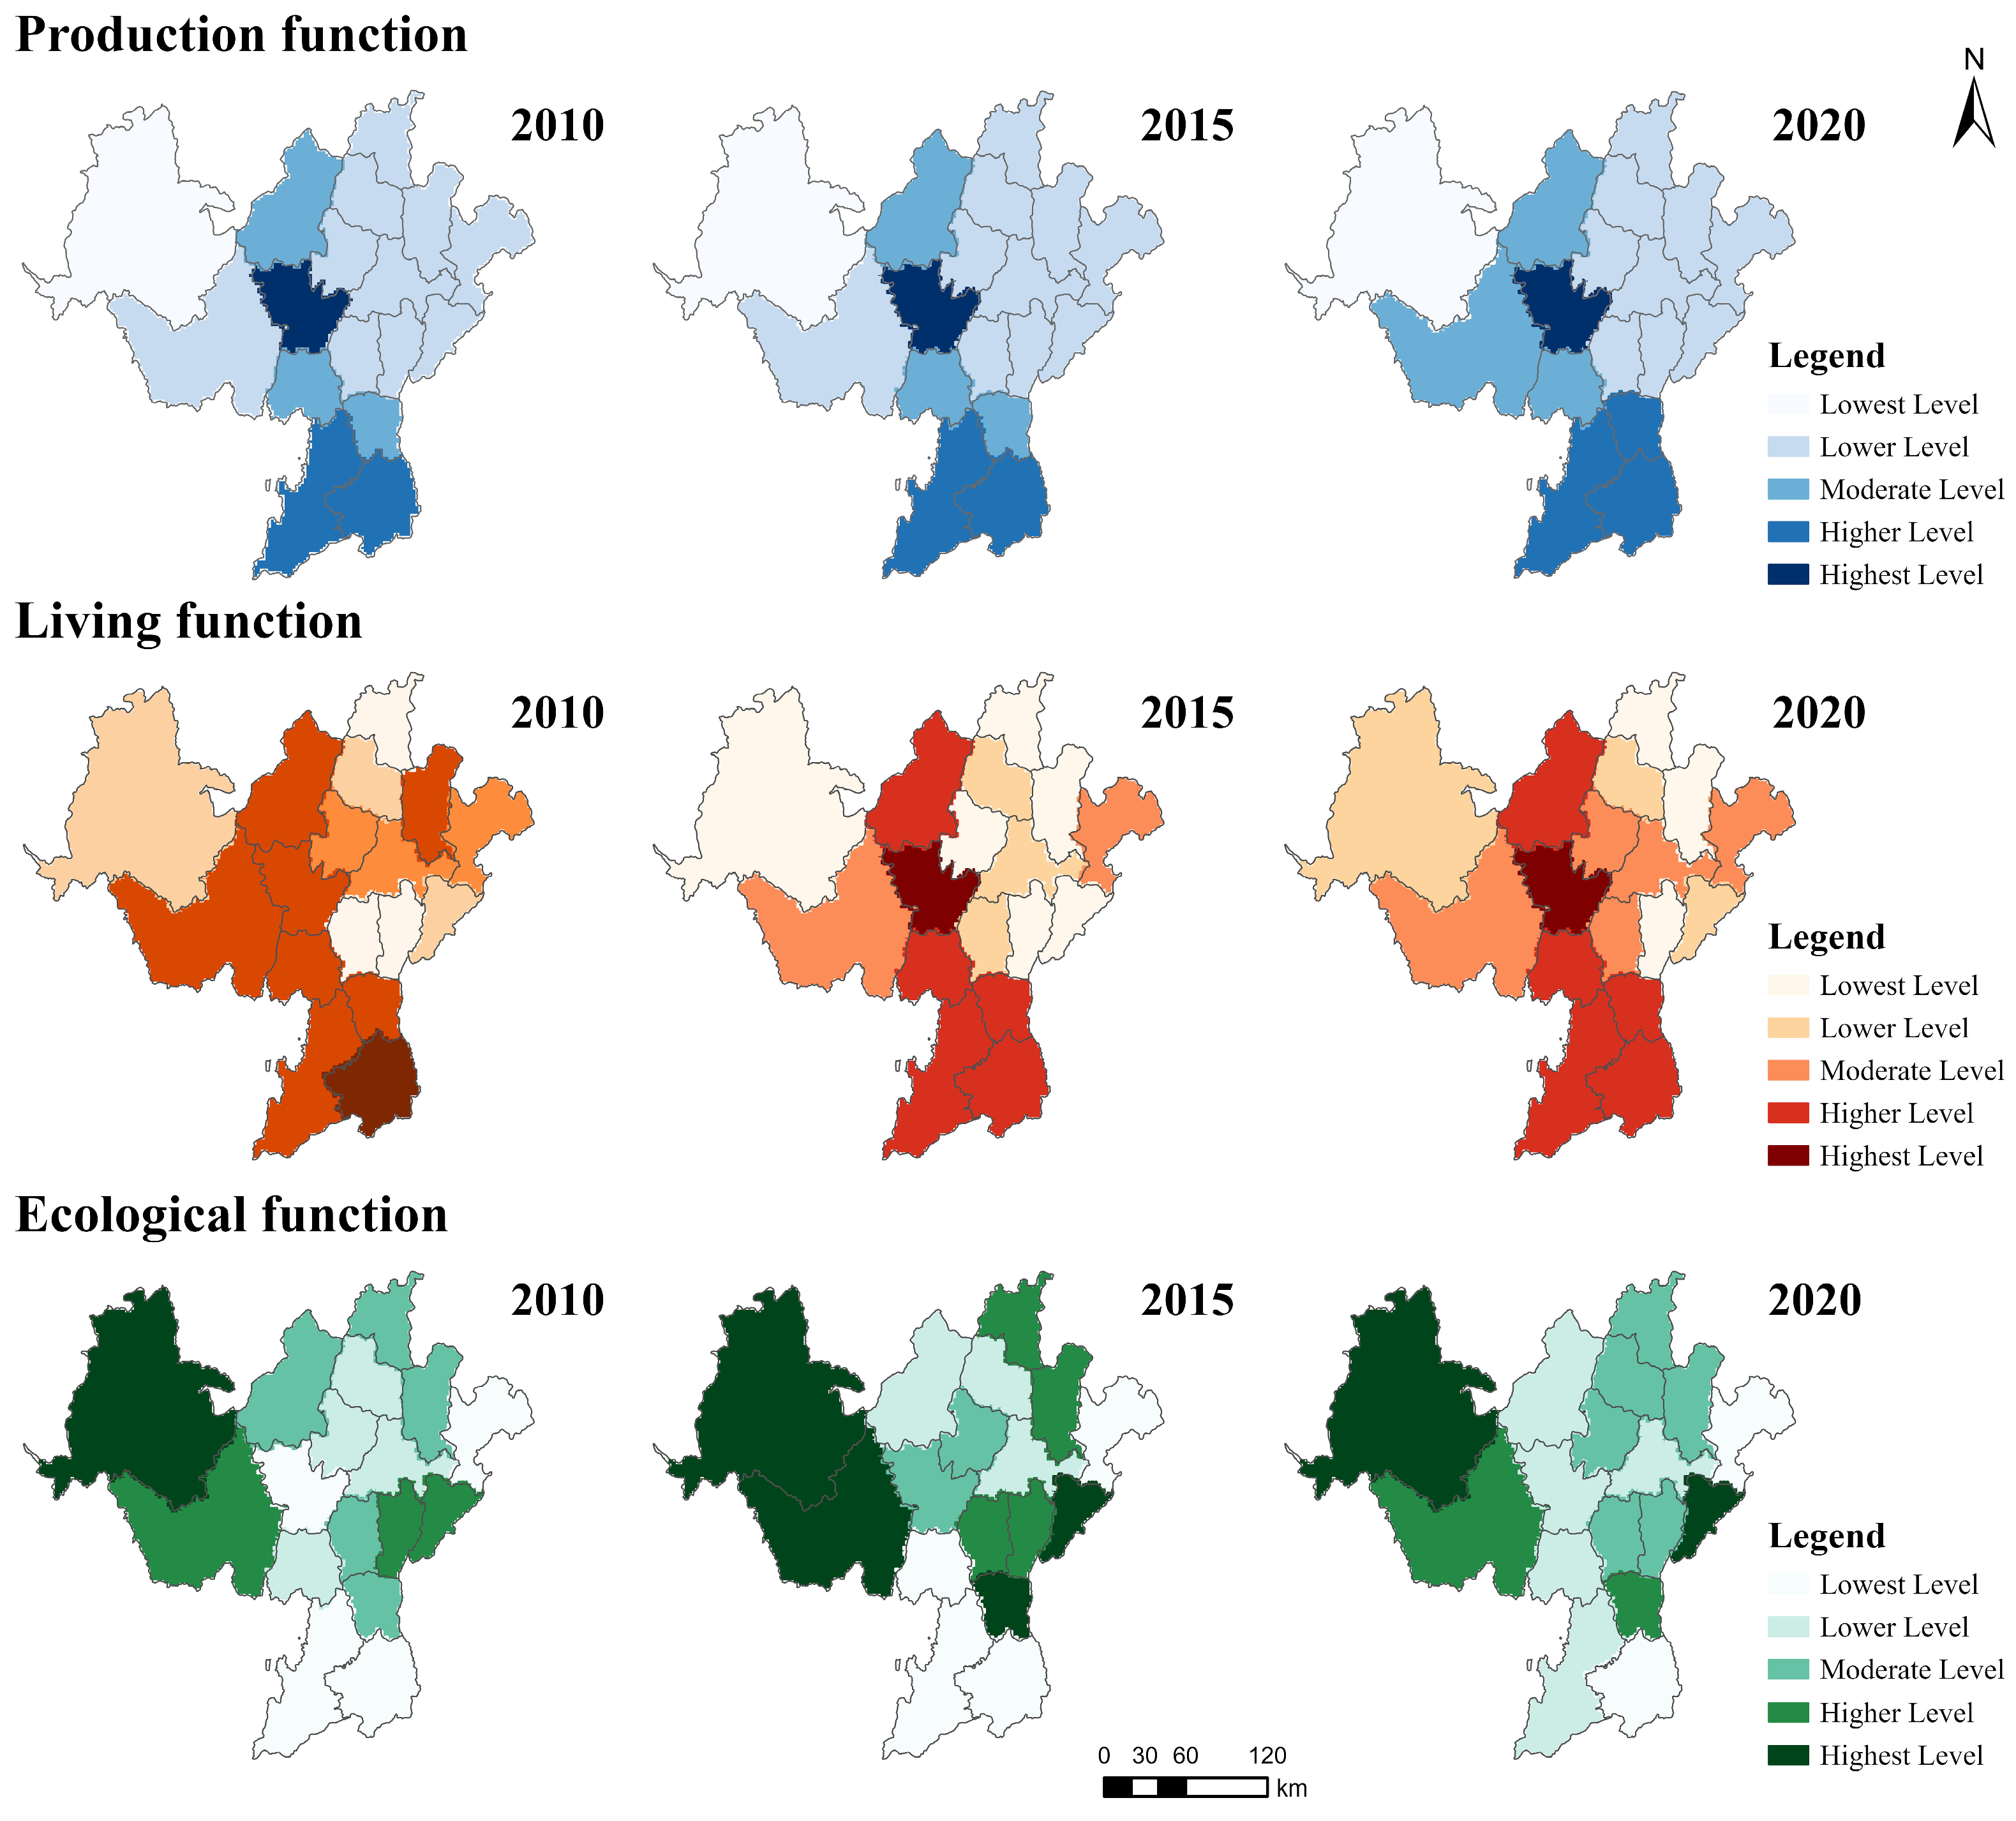
The spatial and temporal variability of PLEFs in Liangshan Prefecture is the result of the long-term interaction between natural geographical conditions and economic and social development. This is in line with previous studies of ’three lives’ by scholars in the Hengduan Mountains and the Three Gorges area [51,52]. In terms of natural geographic conditions, the state is located in the southern section of the Hengduan Mountains, with high terrain in the northwest and low terrain in the southeast, and significant topographic differentiation. The river valley basins in the east and the south have a gentle topography (Figure 1b), which provides a natural basis for agricultural production and town construction, and forms the high-value agglomeration area of the PF (Figure 3); whereas, the high mountainous areas of the northwestern part of the state, such as Muli and Yanyuan, are constrained by the steep topography and the fragile ecology, and have fewer interferences from human activities, and have become the dominant EF area, but its spatial distribution is relatively scattered. The subtropical climate further strengthens the advantages of agricultural production in the southern river valleys, while the low temperature and rainfall in the high-altitude areas support the ecological barrier function. In terms of socioeconomic drivers, Xichang, the capital of the state, as the core of the region, has the highest ecological niche widths of PF and LF with its perfect infrastructure, transportation network, and economic agglomeration effect, and shows the characteristics of decreasing radiation from the core to the periphery, but the high intensity of development in the central area has also led to the intensification of ecological pressures (
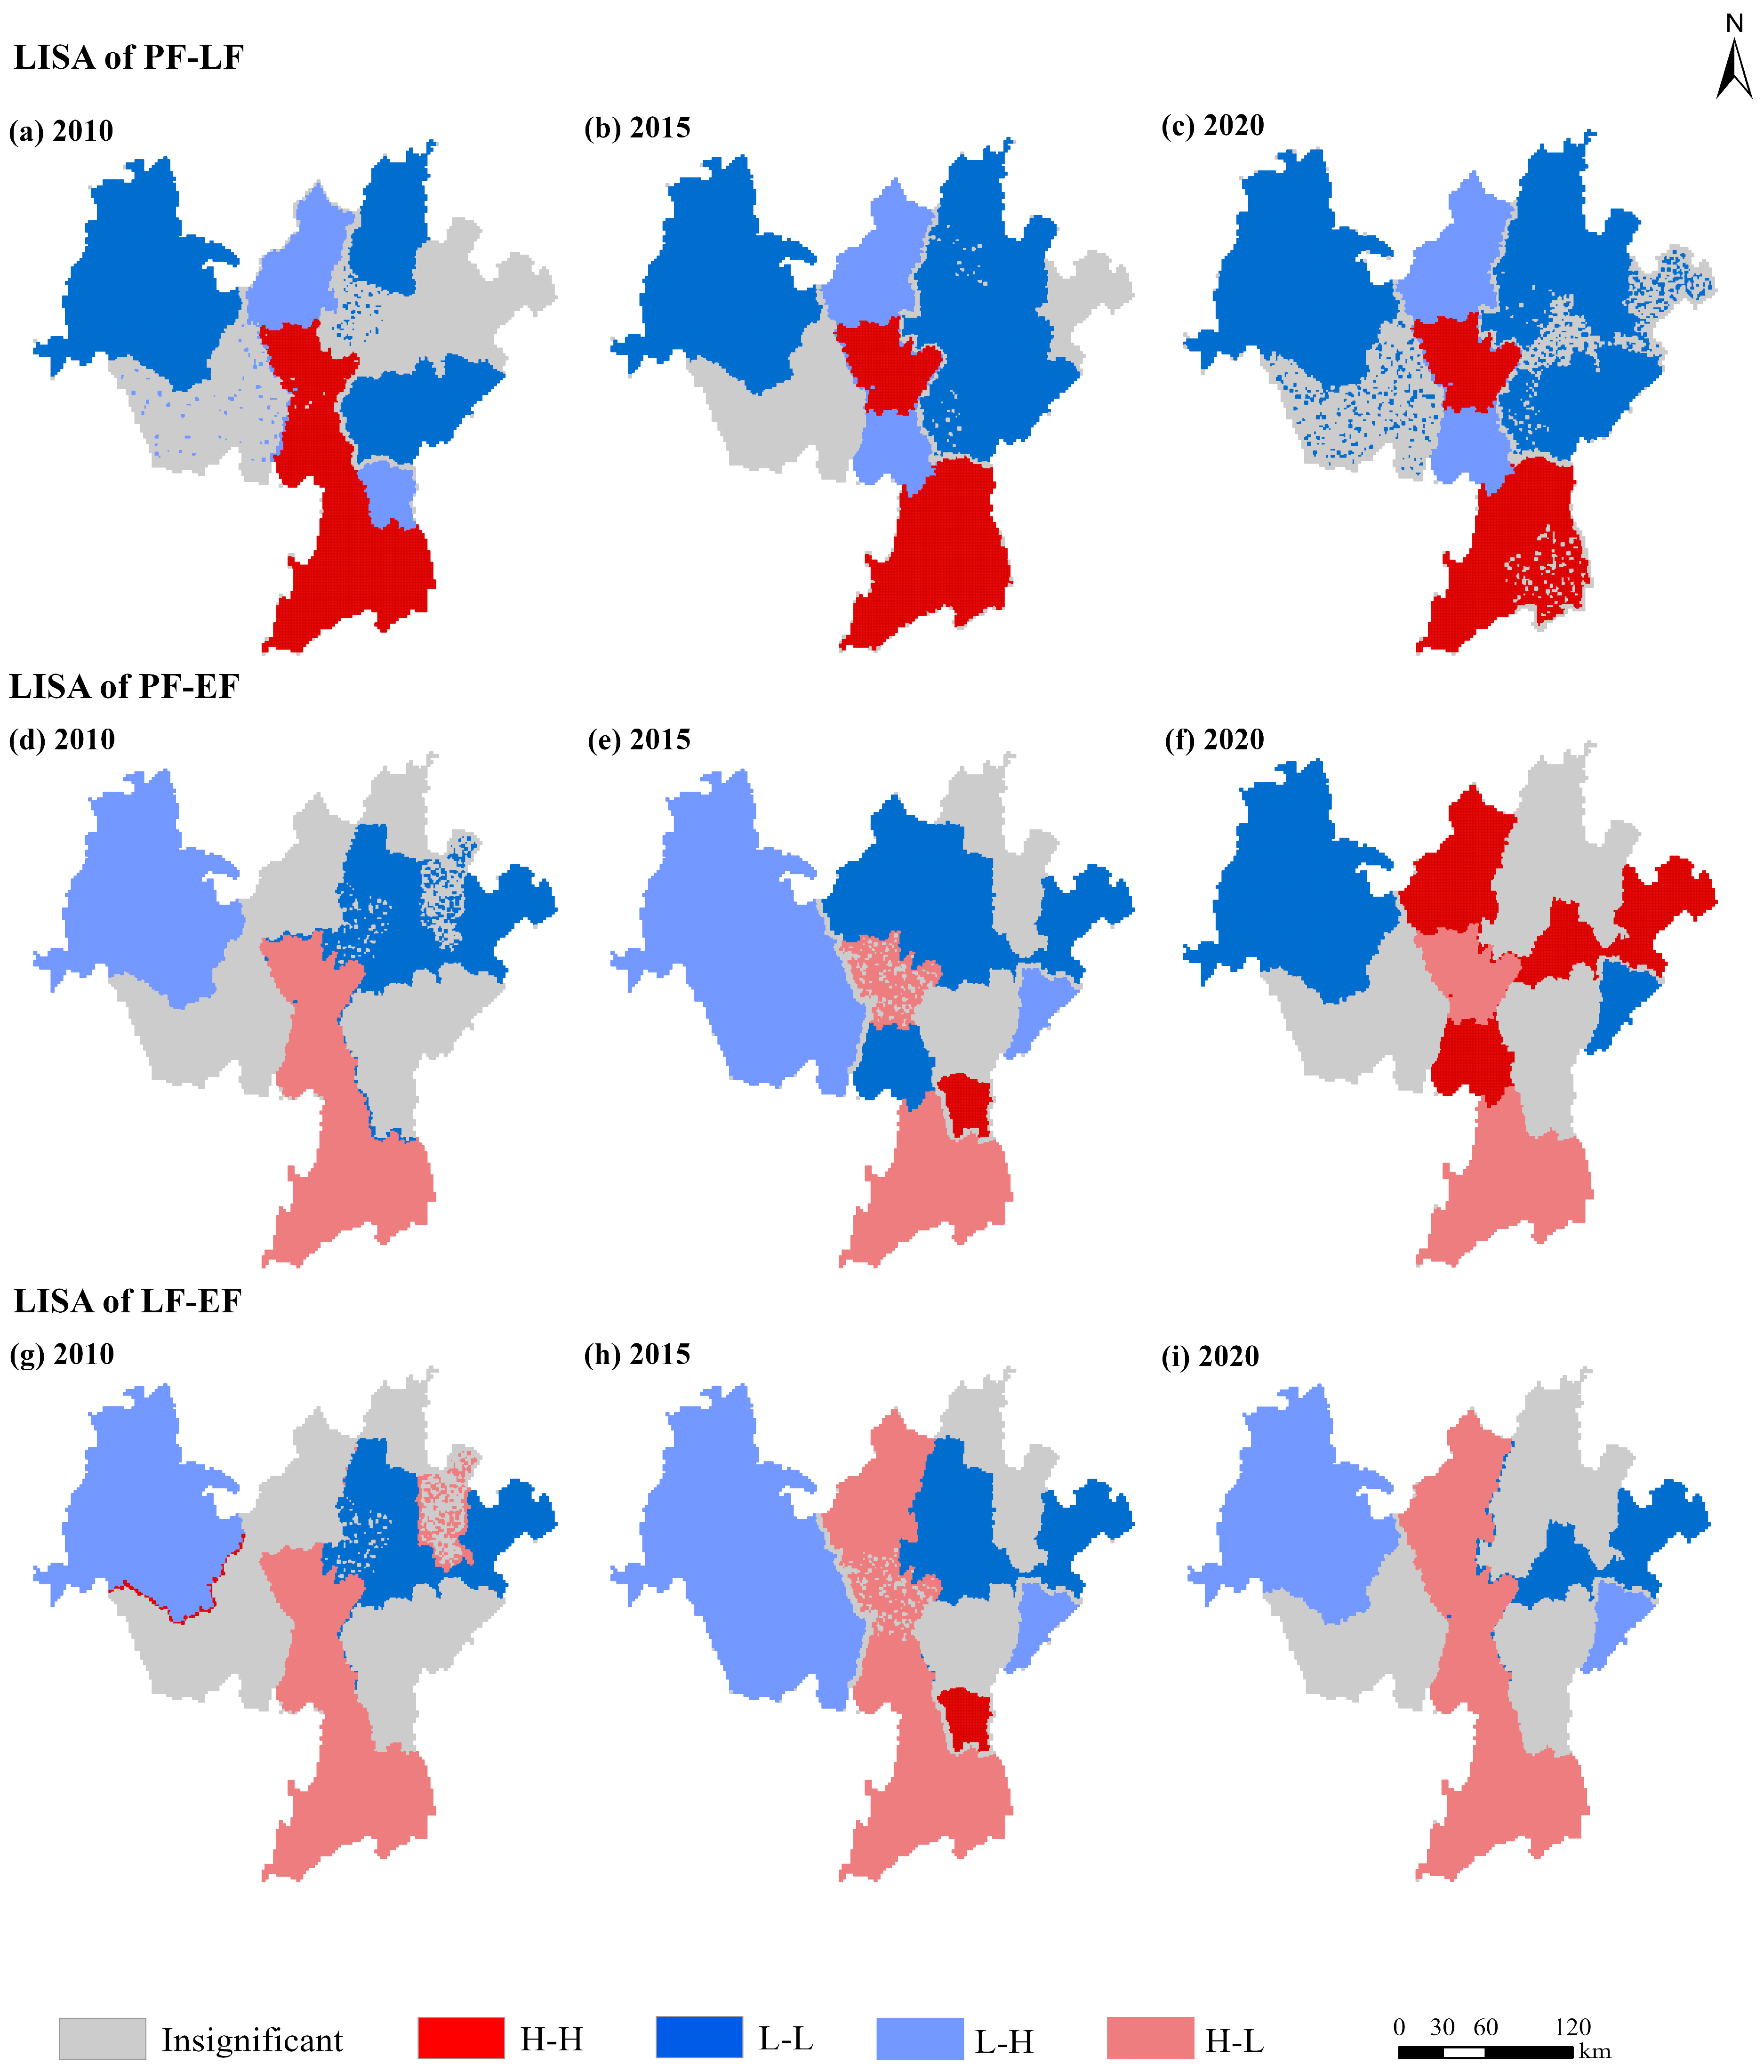
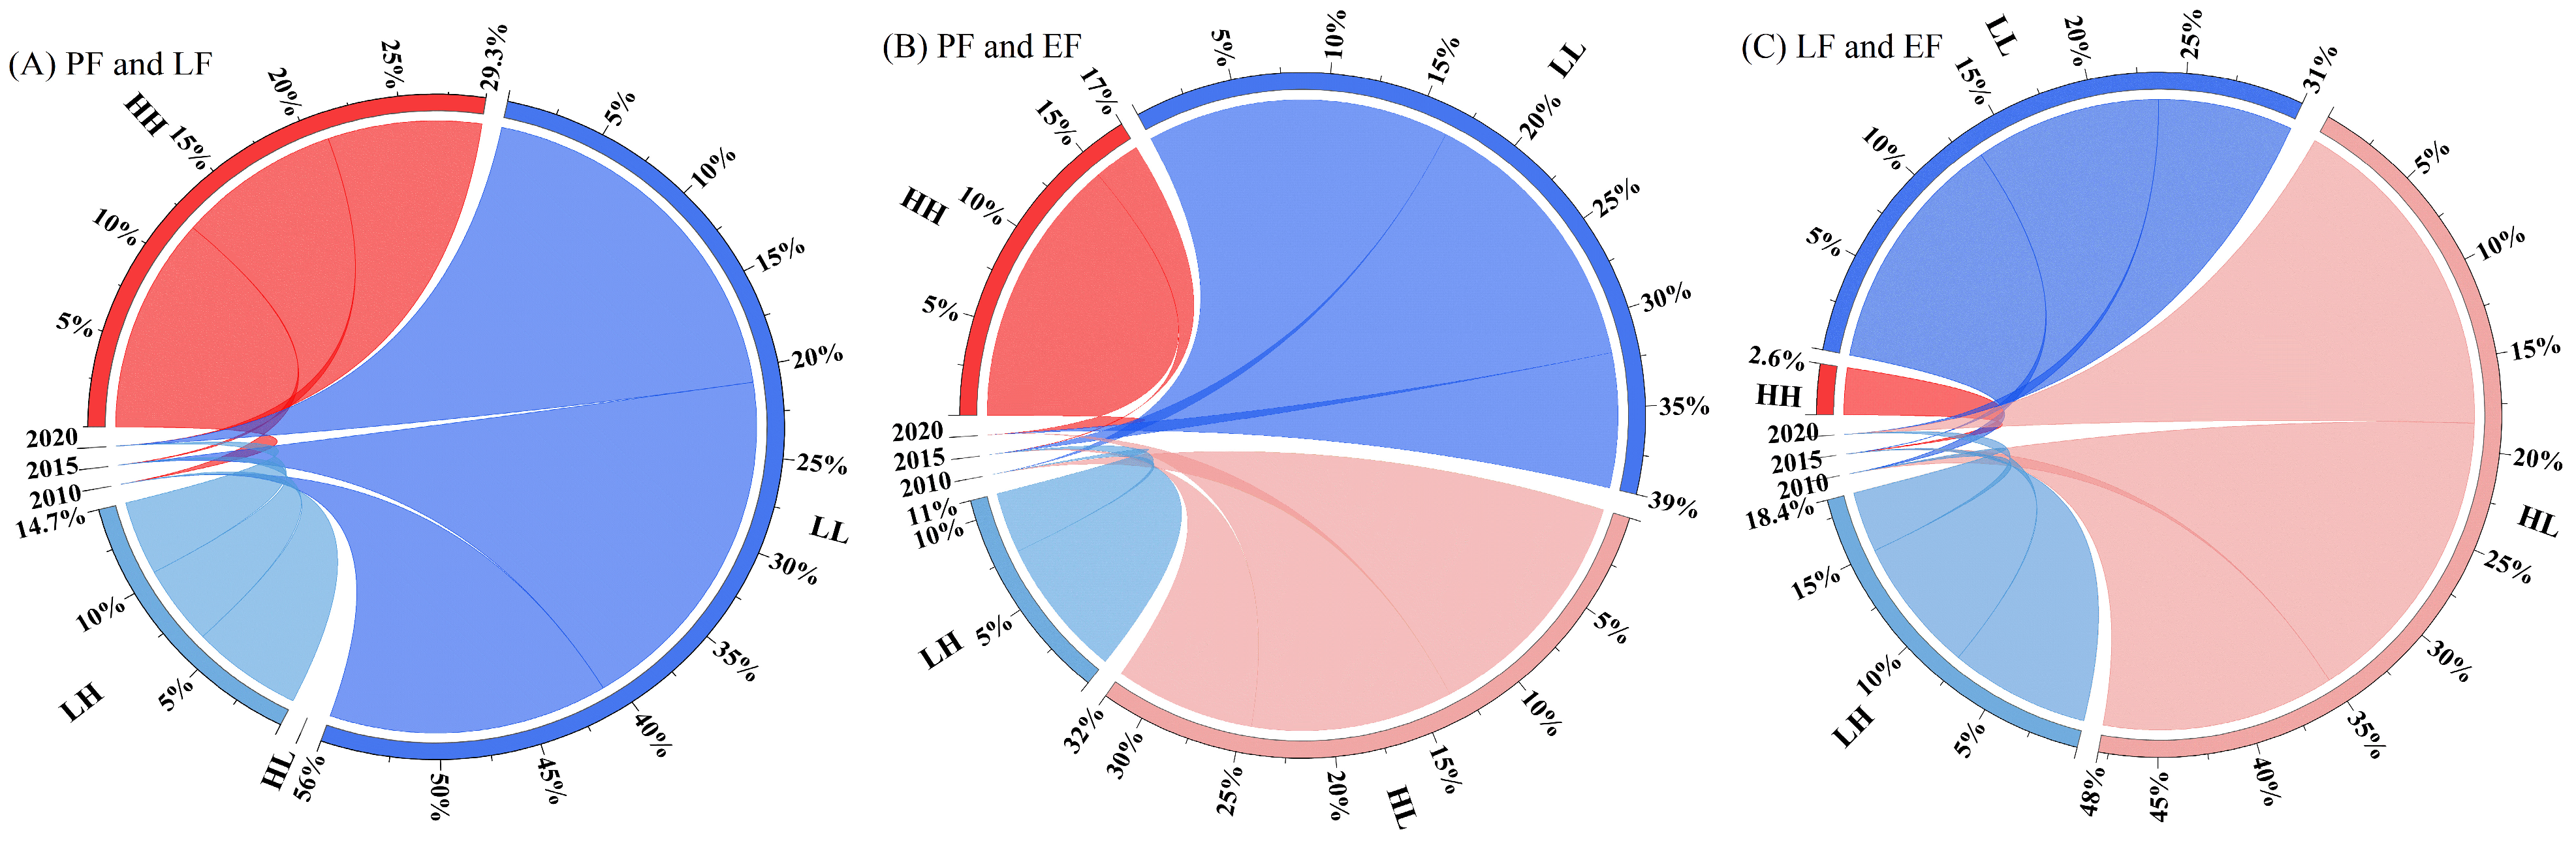
Figure 3). Second, the results of spatial autocorrelation and Spearman correlation analyses (Figure 4, Figure 5 and Figure 6) also highlighted the socioeconomic drivers behind the synergistic effects of the functions. Xichang, as the capital of the state, has the highest niche widths of PF and LF, but also important HH synergies concentrated in the periphery of Xichang (Figure 5a–c), which, however, have exacerbated the ecological pressures in the central region, such as the expanding LF niche width. Pressure, such as the expanding LH trade-off area (Figure 5d–f), i.e., remote areas, still face a more prominent contradiction between resource exploitation and ecological protection. In addition, functional zoning based on synergistic/trade-off relationships using K-means clustering (Figure 8) provides a policy-relevant framework to address nature-socioeconomic interactions. For example, “ecological reserve” corresponds to EF high-value areas in remote mountainous regions (
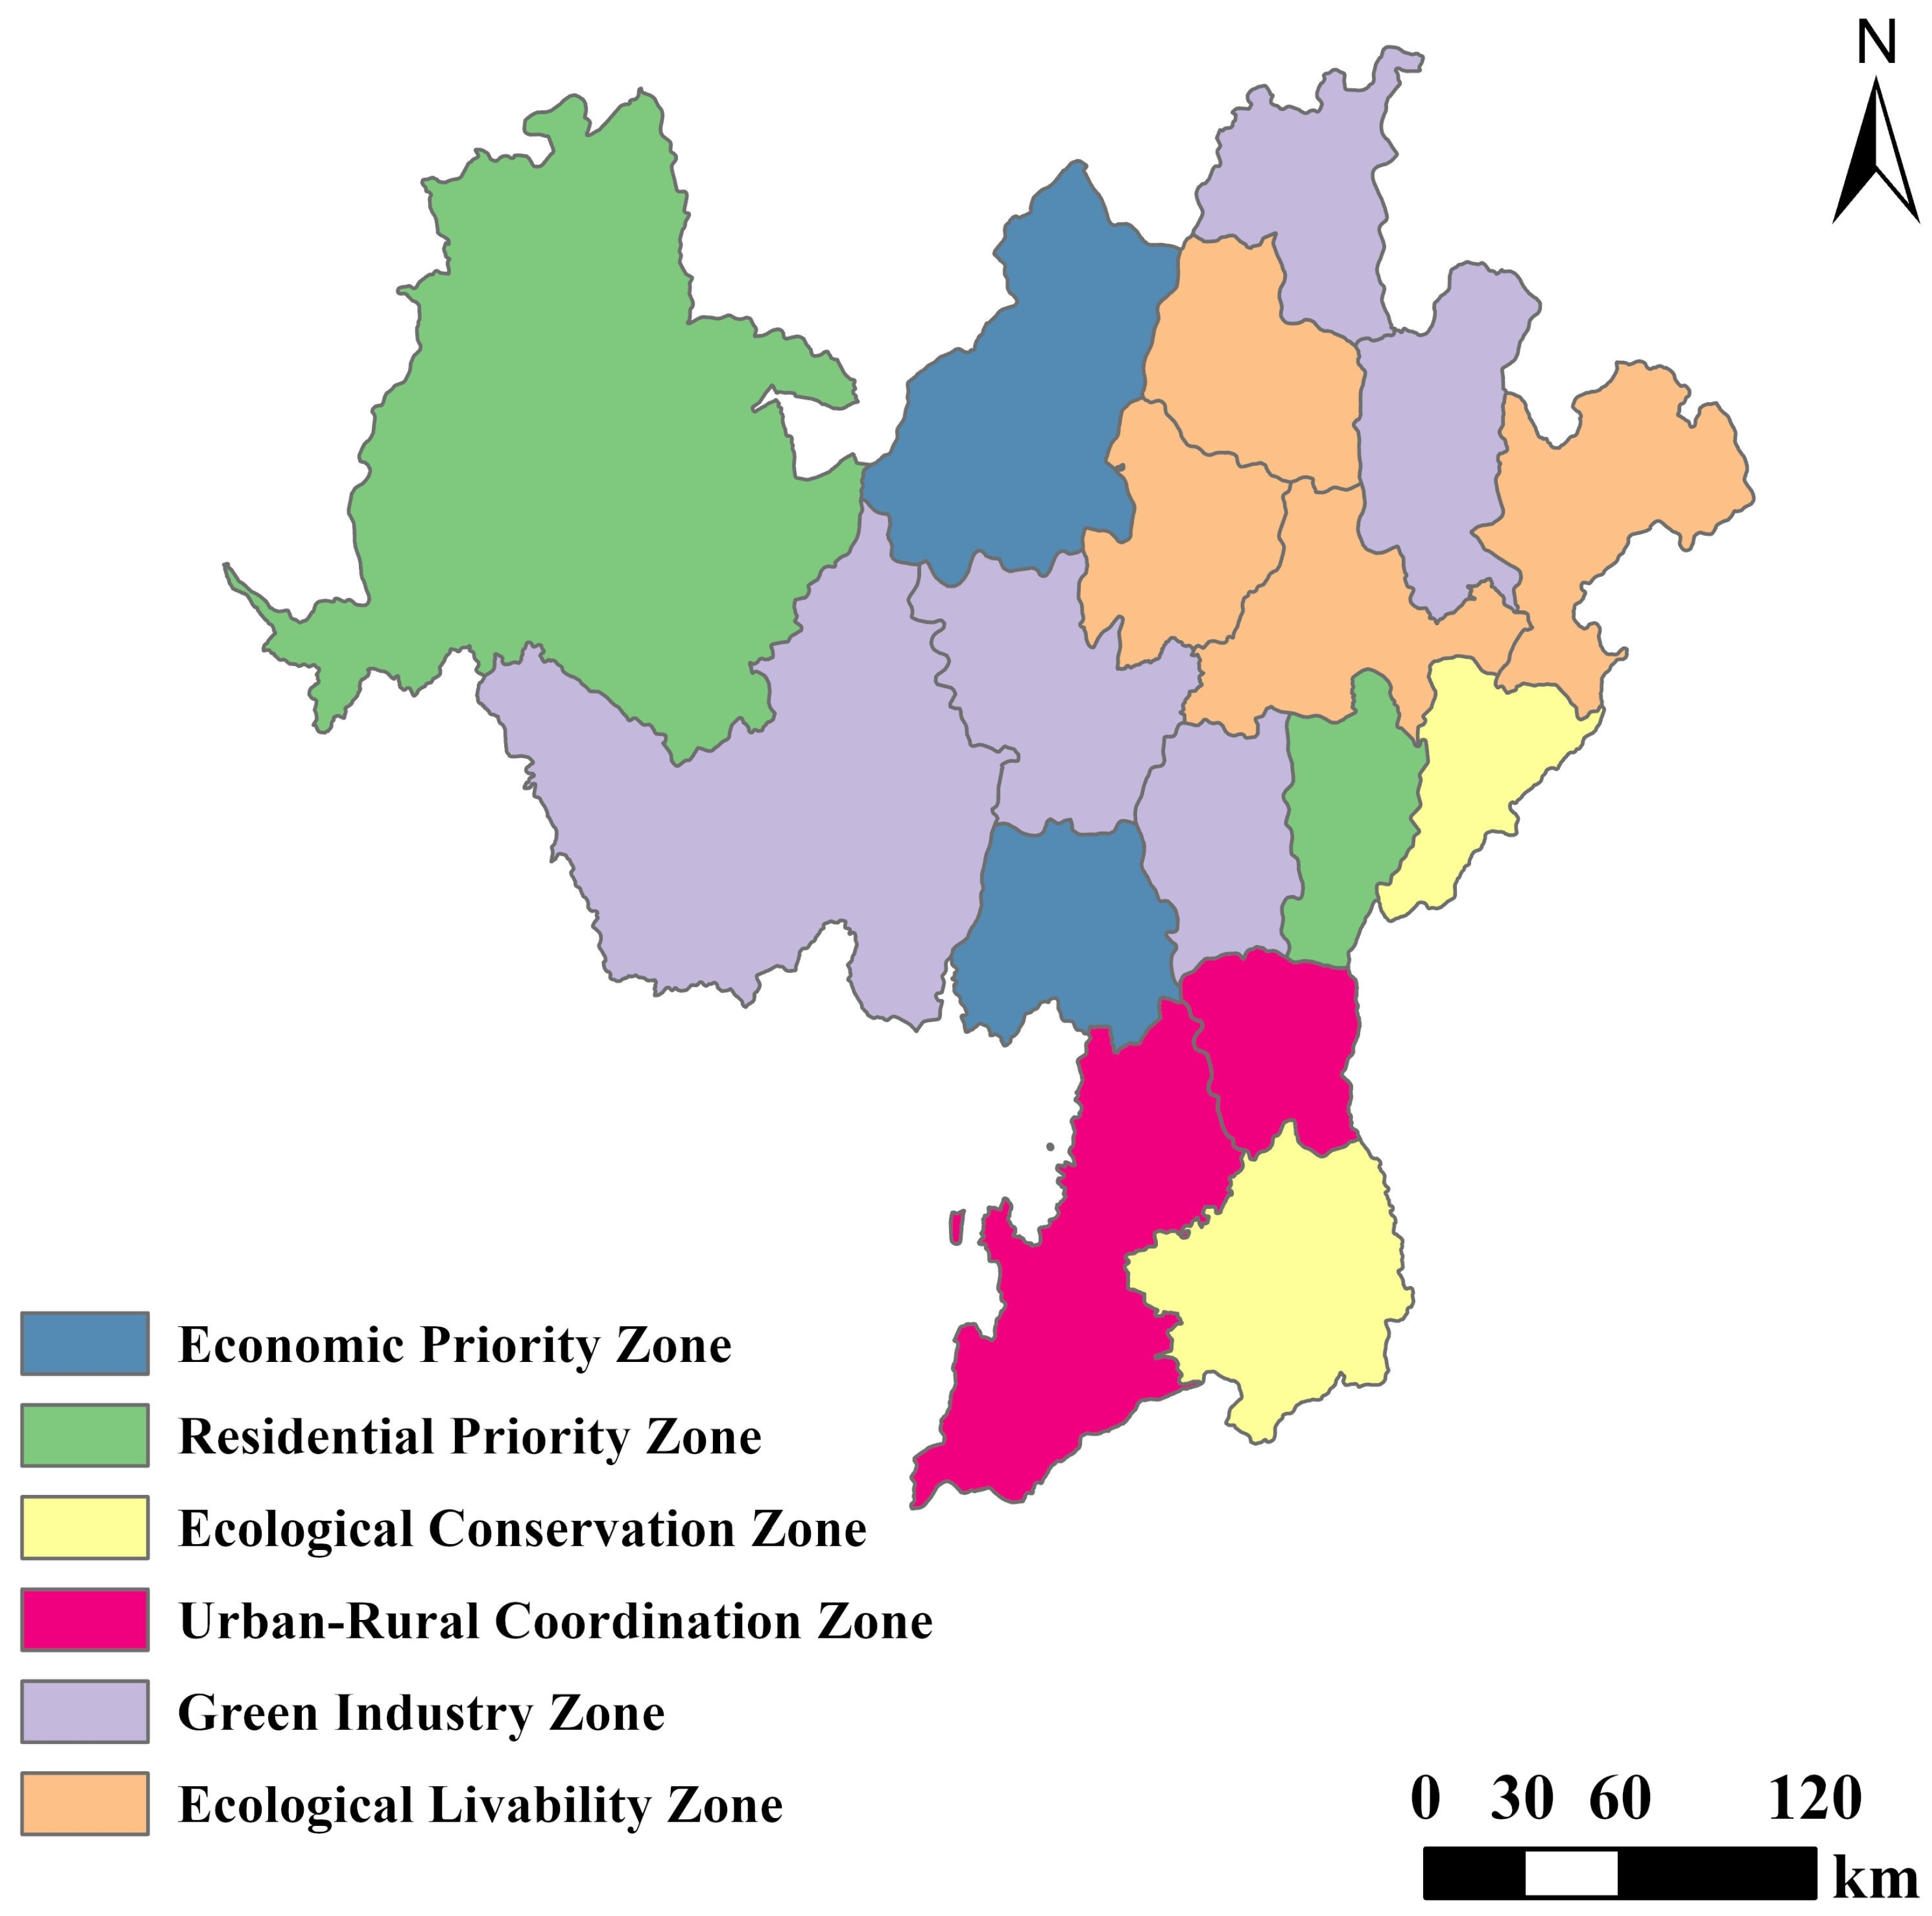
Figure 3), where niche width values are low and human interference is low. In contrast, Dechang and Mianning are in “economic priority zones” consistent with synergistic areas of PF and LF, which are supported by indicators of industrial output and fixed asset investment. This integration of ecological niche theory and clustering methods directly informs the optimization proposal, ensuring that the functional layout balances development needs with ecological resilience.
In recent years, national policies have gradually shifted to green development, ecological civilization construction, and sustainable development, especially the implementation of poverty eradication and rural revitalization strategies in western regions. Liangshan Prefecture, as an ethnic minority area, has been protected and developed, and the ecological environment has gained a certain degree of improvement along with the coordinated development of production and living functions, but the contradictions are still prominent. Liangshan Prefecture is located in the southwestern part of Sichuan Province, belonging to the typical mountainous terrain, resulting in Liangshan Prefecture facing a complex relationship between production, life, and ecological functions, and there is a strong trade-off between ecological functions and production and life functions, and the HL area in the south indicates that it faces a greater ecological and environmental pressure when carrying out economic development, and the future needs to pay attention to the optimization of the ecologically fragile areas and avoid overdevelopment while advancing economic development. Optimizing the regional functional layout and rationally planning the relationship between production and ecological protection is the key to achieving sustainable development. The ecologically fragile areas, which are also manifested as LH, also face problems such as limited resource development due to the constraints of natural conditions. This suggests that Liangshan Prefecture should prioritize the maintenance and enhancement of ecological functions in such areas and, at the same time, introduce eco-friendly economic activities (e.g., ecotourism, green agriculture) so as to realize the moderate enhancement of production functions on the basis of ecological environment protection and thus promote the coordinated development of ecological and economic benefits. In the future, it is necessary to optimize the land use layout based on “functional synergy”—strictly limiting the development intensity in ecological barrier zones, promoting green industries and ecological compensation mechanisms, promoting industrial upgrading and urban-rural integration in river valley economic zones, and at the same time promoting cross-regional ecological linkages through the “core-periphery” approach. At the same time, through cross-regional ecological linkages, it will balance the development gap between the core and the periphery and ultimately achieve the goal of sustainable spatial development in mountainous and fragile areas.
In view of the limitations of data acquisition and research methodology, this study focuses on the analysis of the interactions among the three core functions of land use, i.e., production function, living function, and ecological function, but the detailed classification of the functions needs to be deepened, and the exploration of the complex correlation among the indicators needs to be strengthened. Future research should further promote the refinement of functions, improve the data system, analyze relevant influencing factors, explore the interrelationships between land use functions at multiple scales, and further improve the relevant theoretical framework and practical guidance to ensure the comprehensiveness and foresight of the study.

6. Conclusions

Liangshan Prefecture’s PLEFs show significant spatial and temporal variations and regional characteristics. During 2010–2020, the ecological niche width advantage of the PF continued to increase, with Xichang City as the core in an obvious “core-edge” distribution, with the higher-value zones mainly distributed in the south, the northwestern and northeastern parts remaining low-value agglomerations due to natural conditions, with block-like distribution. The higher-value areas are mainly distributed in the south, while the northwestern and northeastern parts of the city are still low-value agglomeration areas due to natural constraints, and are distributed in the form of a block, with the problem of regional development imbalance being prominent; although the LF has been improved partially, the trend of its ecological niche width being compressed constantly indicates that the “Matthew effect” of resource distribution in the urbanization process has intensified, and further expansion of the urban-rural gap needs to be guarded against in the future. The distribution of high and low values of EF is consistent with the topography, and the overall trend of narrowing ecological niche widths reveals the continuous pressure on ecosystems caused by rapid development, while the partial improvement confirms the effectiveness of ecological restoration policies.
During the study period, the relationship between PF and LF in Liangshan Prefecture has gradually shifted from a trade-off to a synergistic one, but it is still dominated by a trade-off relationship; the conflict between LF and EF has intensified, especially as the pressure on the environment has increased in the areas of high-value LF. Moreover, the proportion of coordination between LF and EF has declined in the areas of low value, which needs to be targeted to the optimization of the region. The strong synergistic effect of PF and LF highlights the role of economic growth in the improvement of people’s livelihoods. The strong synergy between PF and LF highlights the role of economic growth in improving people’s livelihoods, but the significant trade-off between the two and EF exposes the environmental costs of the traditional development model. It is worth noting that the trade-off between PF and EF is particularly prominent in the southern industrial agglomeration, and although ecological compensation policies partially alleviate the conflict. The expansion of high-value synergistic zones (HH) still relies on green technological innovations and industrial transformations. The northeastern concentration and dynamic volatility of the LF and EF trade-offs suggest that there is a deep-seated conflict between the livelihood needs of the regions with lagging infrastructures and ecological protection, which needs to be precisely regulated through differentiated policies. Policies need to be differentiated to achieve precise regulation.
From the perspective of synergies and trade-offs among the PLEFs, the land use functions of Liangshan Prefecture are divided into economic priority zones, residential priority zones, ecological protection zones, urban-rural coordination zones, and ecological livability zones, and optimization paths are put forward, including strengthening the function of ecological barriers, promoting urban-rural integration and green development, promoting industrial upgrading and integration, and constructing livable and beautiful spaces. It also proposes optimization paths, including strengthening the function of ecological barriers, promoting urban-rural integration and green development, promoting industrial upgrading and integration, and building livable and beautiful spaces. This provides a scientific basis for the construction of ecological civilization and the optimal development of national land space, as well as a new theoretical framework and methodological support for the synergistic path of national land space functions in mountainous ecological barrier zones, which is of practical significance to the realization of the strategic goal of “Beautiful China”.
In general, this study systematically reveals the spatial and temporal evolution rules and interaction mechanisms of PLEFs in ecologically fragile areas. While providing a localized spatial optimization scheme, the method and theoretical framework constructed in this paper have universal value for the sustainable spatial governance of similar areas worldwide. The niche width model, by introducing the “state” and “potential” theory, achieves a quantitative evaluation of multifunctional land-use dynamics, effectively bridging ecological principles with socioeconomic metrics. This methodology demonstrates strong generalizability for application in other regions confronting land-use competition conflicts. Combining local spatial autocorrelation and Spearman correlation analysis, exploring quantitative and spatial synergy/trade-off relationships, breaking the limitations of traditional one-scale analysis, and deepening the research paradigm of “pattern-process-mechanism” in geography. The partition optimization study using the Maxwell triangle and K-means clustering method provides a spatial tool for the interpretation of multidimensional interaction relationships. Its core value lies in transforming complex human-person interaction into operational management units through spatial expression and clustering optimization of the synergy/trade-off relationship, providing methodological innovation for global sustainable spatial governance. The empirical application of Liangshan Prefecture verifies the effectiveness of this framework, and the interdisciplinary and cross-scale research is of scientific significance to explore the relationship between humans and land in ecologically fragile areas. Its core value lies in the implementation of differentiated management through the spatial expression and clustering optimization of the synergy/trade-off relationship.

Author Contributions

All authors as follows: Y.L.: Conceptualization, Data Curation, Formal Analysis, Investigation, Methodology, Software, Visualization, Writing—Original Draft, Writing—Review and Editing. R.S.: Methodology, Supervision, Data Curation, Writing—Review and Editing. P.R. (Corresponding Author): Conceptualization, Funding Acquisition, Resources, Supervision, Validation, Writing—Original Draft, Writing—Review and Editing. All authors have read and agreed to the published version of the manuscript.

Funding

This research was funded by the Sichuan Science and Technology Program, grant number 2023NSFSC1979.

Data Availability Statement

The original contributions presented in this study are included in the article. Further inquiries can be directed to the corresponding author.

Acknowledgments

We extend our heartfelt thanks to all participants who provided assistance and advice.

Conflicts of Interest

The authors declare no conflicts of interest.

References

  1. Li, Q.; Zhou, Y.; Xu, T.; Wang, L.; Zuo, Q.; Liu, J.; Su, X.; He, N.; Wu, Z. Trade-offs/synergies in land-use function changes in Central China from 2000 to 2015. Chin. Geogr. Sci. 2021, 31, 711–726. [Google Scholar] [CrossRef]
  2. Lowe, P.; Murdoch, J.; Marsden, T.; Munton, R.; Flynn, A. Regulating the new rural spaces: The uneven development of land. J. Rural Stud. 1993, 9, 205–222. [Google Scholar] [CrossRef]
  3. Wu, F. Land financialisation and the financing of urban development in China. Land Use Policy 2022, 112, 104412. [Google Scholar] [CrossRef]
  4. Bax, V.; Francesconi, W.; Delgado, A. Land-use conflicts between biodiversity conservation and extractive industries in the Peruvian Andes. J. Environ. Manag. 2019, 232, 1028–1036. [Google Scholar] [CrossRef]
  5. Yu, M.; Li, Y.; Luo, G.; Yu, L.; Chen, M. Agroecosystem composition and landscape ecological risk evolution of rice terraces in the southern mountains, China. Ecol. Indic. 2022, 145, 109625. [Google Scholar] [CrossRef]
  6. Peng, J.; Liu, Y.; Li, T.; Wu, J. Regional ecosystem health response to rural land use change: A case study in Lijiang city, China. Ecol. Indic. 2017, 72, 399–410. [Google Scholar] [CrossRef]
  7. Liu, Y.L.; Liao, H.P.; Li, T.; Cai, J.; Li, J.; He, T.; Luo, G. Spatio-temporal diversity and influencing factors of multi-functionality of land use in mountainous regions. J. Agric. Eng. 2019, 35, 271–279. [Google Scholar]
  8. Liu, C.; Cheng, L.; Li, J.; Lu, X.; Xu, Y.; Yang, Q. Trade-offs analysis of land use functions in a hilly-mountainous city of northwest hubei province: The interactive effects of urbanization and ecological construction. Habitat Int. 2023, 131, 102705. [Google Scholar] [CrossRef]
  9. Frederiksen, P.; Kristensen, P. An indicator framework for analysing sustainability impacts of land use change. In Sustainability Impact Assessment of Land Use Changes; Helming, K., Pérez-Soba, M., Tabbush, P., Eds.; Springer: Berlin, Germany, 2008; pp. 293–304. [Google Scholar] [CrossRef]
  10. Paracchini, M.L.; Pacini, C.; Jones, M.L.M.; Pérez-Soba, M. An aggregation framework to link indicators associated with multifunctional land use to the stakeholder evaluation of policy options. Ecol. Indic. 2011, 11, 71–80. [Google Scholar] [CrossRef]
  11. Schößer, B.; Helming, K.; Wiggering, H. Assessing land use change impacts—A comparison of the sensor land use function approach with other frameworks. J. Land Use Sci. 2010, 5, 159–178. [Google Scholar] [CrossRef]
  12. Meng, J.; Cheng, H.; Li, F.; Han, Z.; Wei, C.; Wu, Y.; You, N.W.; Zhu, L. Spatial-temporal trade-offs of land multi-functionality and function zoning at finer township scale in the middle reaches of the Heihe river. Land Use Policy 2022, 115, 106019. [Google Scholar] [CrossRef]
  13. Liu, J.; Liu, Y.; Li, Y. Classification evaluation and spatial-temporal analysis of “production-living-ecological” spaces in China. Dili Xuebao Acta Geogr. Sin. 2017, 72, 1290–1304. [Google Scholar] [CrossRef]
  14. Huang, A.; Xu, Y.Q.; Lu, L.H.; Liu, C.; Zhang, Y.B.; He, J.M.; Wang, H. Research progress of the identification and optimization of production-living-ecological spaces. Prog. Geogr. 2020, 39, 503–518. [Google Scholar] [CrossRef]
  15. Fan, Y.; Jin, X.; Gan, L.; Jessup, L.H.; Pijanowski, B.C.; Yang, X.; Xiang, X.; Zhou, Y. Spatial identification and dynamic analysis of land use functions reveals distinct zones of multiple functions in Eastern China. Sci. Total Environ. 2018, 642, 33–44. [Google Scholar] [CrossRef] [PubMed]
  16. Zhu, Y.Y.; Yu, B.; Zeng, J.X.; Han, Y. Spatial optimization from three spaces of production, living and ecology in national restricted zones—A case study of Wufeng county in Hubei province. Econ. Geogr. 2015, 35, 26–32. [Google Scholar]
  17. Dang, L.J.; Xu, Y.; Gao, Y. Assessment method of functional land use classification and spatial system—A case study of Yangou watershed. Soil Water Conserv. Res. 2014, 21, 193–197+203. [Google Scholar] [CrossRef]
  18. Xu, N.; Chen, W.; Pan, S.; Liang, J.; Bian, J. Evolution characteristics and formation mechanism of production-living-ecological space in China: Perspective of main function zones. Int. J. Environ. Res. Public Health 2022, 19, 9910. [Google Scholar] [CrossRef]
  19. Wang, Y. Spatial–temporal evolution of “production-living-ecological” function and layout optimization strategy in China: A case study of Liaoning province, China. Environ. Sci. Pollut. Res. 2023, 30, 10683–10696. [Google Scholar] [CrossRef]
  20. Wang, C.; Tang, N. Spatio-temporal characteristics and evolution of rural production-living-ecological space function coupling coordination in Chongqing municipality. Geogr. Res. 2018, 37, 1100–1114. [Google Scholar]
  21. Zhu, C.; Dong, B.; Li, S.; Lin, Y.; Shahtahmassebi, A.; You, S.; Zhang, J.; Gan, M.; Yang, L.; Wang, K. Identifying the trade-offs and synergies among land use functions and their influencing factors from a geospatial perspective: A case study in Hangzhou, China. J. Clean. Prod. 2021, 314, 128026. [Google Scholar] [CrossRef]
  22. Liu, C.; Zhang, Z.; Ji, X.; Tang, N.; Hao, M. Identification and optimization of production-living-ecological spaces based on the comparison of strengths and weaknesses of land functions: A case study of Xiangyang city. Resour. Sci. 2023, 45, 1366–13679. [Google Scholar] [CrossRef]
  23. Ren, J.; Ma, R.; Huang, Y.; Wang, Q.; Guo, J.; Li, C.; Zhou, W. Identifying the trade-offs and synergies of land use functions and their influencing factors of Lanzhou-Xining urban agglomeration in the upper reaches of yellow river basin, China. Ecol. Indic. 2024, 158, 111279. [Google Scholar] [CrossRef]
  24. Zhao, J.; Zhao, Y. Synergy/trade-offs and differential optimization of production, living, and ecological functions in the Yangtze river economic belt, China. Ecol. Indic. 2023, 147, 109925. [Google Scholar] [CrossRef]
  25. Li, X.; Fang, B.; Yin, R.M.; Rong, H.F. Spatial-temporal change and collaboration/trade-off relationship of “production-living-ecological” functions in county area of Jiangsu province. J. Nat. Resour. 2019, 34, 2363–2377. [Google Scholar]
  26. Salvati, L. The ‘niche’ city: A multifactor spatial approach to identify local-scale dimensions of urban complexity. Ecol. Indic. 2018, 94, 62–73. [Google Scholar] [CrossRef]
  27. Pocheville, A. The ecological niche: History and recent controversies. In Handbook of Evolutionary Thinking in the Sciences; Heams, T., Huneman, P., Lecointre, G., Silberstein, M., Eds.; Springer: Dordrecht, The Netherlands, 2015; pp. 547–586. [Google Scholar] [CrossRef]
  28. Hong, Y.; Du, H.; Deng, Z. A framework of economic-social-natural sustainability evaluation based on multidimensional land-use ecological niche theory: Evidence in Shendong Cebs, China. Ecol. Indic. 2023, 155, 110967. [Google Scholar] [CrossRef]
  29. Tan, S.J.; Shao, J.A. Land consolidation project layout based on ecological suitability evaluation in hilly areas of Southwest China. Geogr. Res. 2018, 37, 659–677. [Google Scholar]
  30. Nie, X.Y.; Shi, P.J.; Lv, R.; Zhang, X.B.; Liang, B.B.; Wei, W. Ecological niche-based competition and cooperation relationships among county-level cities in Hexi corridor. J. Ecol. 2018, 38, 841–851. [Google Scholar]
  31. Liu, C.Y.; Zhang, J.F.; Zhao, Y.L.; Zhu, C.L. Significance evaluation for territorial functions based on niche theory: A canse study on Panxi area. China City Plan. Rev. 2018, 42, 84–93. [Google Scholar]
  32. Liangshan Statistics Bureau. Available online: https://tjj.lsz.gov.cn/ (accessed on 1 July 2024).
  33. China Statistical Information Network. Available online: http://www.tjcn.org/ (accessed on 1 July 2024).
  34. China National Knowledge Infrastructure (cnki). Available online: https://kns.cnki.net/kns8?db/ (accessed on 5 July 2024).
  35. Resources and Environ-Mental Science Data Cen-Ter. Available online: http://www.resdc.cn/ (accessed on 5 July 2024).
  36. Geospatial Data Cloud. Available online: http://www.gscloud.cn (accessed on 8 July 2024).
  37. Cheng, W.Y.; Zhao, Y.F. Spatial-temporal evolution of land use and its influencing factors from the perspective of production-living-ecological function in Gansu province. J. Gansu Agric. Univ. 2024, 59, 262–274+81. [Google Scholar] [CrossRef]
  38. Li, L.; Fan, Z.; Feng, W.; Yuxin, C.; Keyu, Q. Coupling coordination degree spatial analysis and driving factor between socio-economic and eco-environment in Northern China. Ecol. Indic. 2022, 135, 108555. [Google Scholar] [CrossRef]
  39. Yang, Y.; Bao, W.; Liu, Y. Coupling coordination analysis of rural production-living-ecological space in the Beijing-Tianjin-Hebei region. Ecol. Indic. 2020, 117, 106512. [Google Scholar] [CrossRef]
  40. Li, D.Z.; Shi, Q.; Zang, R.G.; Wang, X.P.; Sheng, L.J.; Zhu, Z.L.; Wang, C.A. Models for niche breadth and niche overlap of species or populations. Sci. Silvae Sin. 2006, 42, 95–103. [Google Scholar]
  41. Wang, W.; Nian, P.H.; Zhu, D.T.; Zhang, W.X. Analysis of regional multifunction evaluation and evolution based on niche breadth model—Taking Beijing as an example. World Reg. Stud. 2016, 25, 66–77. [Google Scholar]
  42. Ou, W.X.; Gong, J.Y.; Ye, L.F.; Sun, X.X. Evaluation of wetland ecological-economic functions based on the niche theory: A case study on Yancheng coastal wetlands. Resour. Sci. 2010, 32, 2107–2114. [Google Scholar]
  43. Qian, C.Y.; Gong, J.; Zhang, J.Q.; Liu, D.Q.; Ma, X.C. Change and tradeoffs-synergies analysis on watershed ecosystem services: A case study of Bailongjiang watershed, Gansu. Acta Geogr. Sin. 2018, 73, 868–879. [Google Scholar]
  44. Nicholson, D.; Vanli, O.A.; Jung, S.; Ozguven, E.E. A spatial regression and clustering method for developing place-specific social vulnerability indices using census and social media data. Int. J. Disaster Risk Reduct. 2019, 38, 101224. [Google Scholar] [CrossRef]
  45. Li, Y.; Xie, Y. A new urban typology model adapting data mining analytics to examine dominant trajectories of neighborhood change: A case of metro detroit. Ann. Am. Assoc. Geogr. 2018, 108, 1313–1337. [Google Scholar] [CrossRef]
  46. Wei, Y.P.; Yang, Y.C.; Xie, X.C.; Liao, L.P.; Tian, Y.; Zhou, J.Y. Quantifying ecosystem service trade-offs and synergies in Nanning city based on ecosystem service bundles. J. Ecol. Rural Environ. 2022, 38, 21–31. [Google Scholar] [CrossRef]
  47. Niu, H.P.; Zhang, A.L. Driving mechanisms of changes in quantity of cultivated land based on niche theory. Resour. Sci. 2008, 1533–1540. [Google Scholar]
  48. Gao, X.L.; Zhang, J.; Yang, D.W.; Liu, B. Evolution and driving forces of cultivated land quantity in Xiamen city using Niche theory. Chin. J. Eco-Agric. 2019, 27, 941–950. [Google Scholar] [CrossRef]
  49. Yu, Z.; Xiao, L.; Chen, X.; He, Z.; Guo, Q.; Vejre, H. Spatial restructuring and land consolidation of urban-rural settlement in mountainous areas based on ecological niche perspective. J. Geogr. Sci. 2018, 28, 131–151. [Google Scholar] [CrossRef]
  50. Bajocco, S.; Ceccarelli, T.; Smiraglia, D.; Salvati, L.; Ricotta, C. Modeling the ecological niche of long-term land use changes: The role of biophysical factors. Ecol. Indic. 2016, 60, 231–236. [Google Scholar] [CrossRef]
  51. Shi, Z.Q.; Deng, W.; Zhang, S.Y. Spatial pattern and spatio-temporal change of territory space in Hengduan mountains region in recent 25 years. Geogr. Res. 2018, 37, 607–621. [Google Scholar]
  52. Li, R.K.; Huang, Y.; Li, Y.B.; Liu, L.Q.; Ran, C.H.; Zu, L.L. Analysis of land function evolution and its driving forces in the hinterland of three gorges reservoir area. Resour. Environ. Yangtze Basin 2018, 27, 594–604. [Google Scholar]
Figure 1. Study area location. (a) Provincial administrative units in China; (b) topography of Liangshan Yi Autonomous Prefecture.
Land 14 00743 g001
Figure 2. Research framework diagram.
Land 14 00743 g002
Figure 3. Spatial distribution of ecological niche widths of PLEFs in Liangshan state.
Land 14 00743 g003
Figure 4. Correlation analysis of PLEFs in Liangshan Yi Autonomous Prefecture. Note: *, ** indicate significant correlation at the confidence level of 0.01 and 0.05 (two-sided), respectively.
Land 14 00743 g004
Figure 5. LISA for PLEFS in Liangshan Yi Autonomous Prefecture, 2010–2020.
Land 14 00743 g005
Figure 6. The number of trade-offs/synergies between LISA’s EPLFs in Liangshan.
Land 14 00743 g006
Figure 7. Multifunctional spatial distribution of land based on Maxwell’s triangle.
Land 14 00743 g007
Figure 8. Multifunctional zoning of land use in Liangshan State based on the K-means clustering method.
Land 14 00743 g008
Table 1. Data sources.
DataNameUseSource
Socioeconomic data«Langshan Statistical Yearbook» (2010, 2015, 2020)Indicator constructionLiangshan Statistics Bureau [32]
«Statistical data on the situation of counties in China» (2010, 2015, 2020)Indicator constructionChina Statistical Information Network [33]
Statistical Yearbook of Liangshan Prefecture Districts and Counties (2010, 2015, 2020)Indicator constructionChina National Knowledge Infrastructure (CNKI) [34]
«Sichuan Statistical Yearbook» (2010, 2015, 2020)Indicator construction
«China County Seat Construction Statistical Yearbook» (2010, 2015, 2020)Indicator construction
Statistical bulletins for 2010, 2015, 2020Indicator constructionCounty and municipal statistical offices
Spatial information dataAdministrative divisions vector dataClarify the study intervalResources and Environmental Science Data Center [35]
DEMAcquisition of terrain factor data
Landsat-8 remote sensing imageryAccess to land-use dataGSC loud [36]
Table 2. Indicator system for evaluating the PLEFs.
Target LevelIndicator LayerPolaritiesWeight (2010)Weight (2015)Weight (2020)
Production Function (PF)grain production (t)+0.0600.0540.065
land resettlement rate (%)+0.0130.0120.013
proportion of agricultural output (%)+0.0160.0160.011
financial contribution rate (%)+0.0730.1160.013
industrial structure (100 million CNY/km2)+0.0980.0980.081
GDP per capital (100 million CNY)+0.0470.0480.049
economic density (100 million CNY/km2)+0.0660.0740.077
per capita investment in fixed assets (100 million CNY/km2)+0.1120.0740.095
Living Function (LF)Per capita net income of farmers (CNY)+0.0660.0740.068
urban-rural income balance index (%)+0.0640.0610.057
traffic density (km/km2)+0.0260.0290.023
total retail sales of consumer goods per capita (CNY)+0.0560.0810.080
population density (person/km2)+0.0160.0150.016
number of beds in health-care facilities (sheets/thousand people)+0.0640.0380.032
percentage of built-up land (%)+0.0540.0640.075
Ecological Function (EF)percentage of ecological land area (%)+0.0300.0290.032
forest cover (%)+0.0160.0300.012
agricultural fertilizer application rates (kg)0.0220.0170.012
biological abundance index (BAI)+0.0330.0120.009
parkland area per capita (m2)+0.0140.0210.048
PM2.5 concentration (ug/m3)0.0180.0130.013
ratio of arable land to built-up land area (%)0.0330.0330.034
Note: “+” represents that the indicator has a positive effect, and “−” represents that the indicator has a negative effect; the habitat richness index is calculated as follows: AiBo × (0.35 × forestland + 0.21 × grassland + 0.28 × water wetland + 0.11 × cropland + 0.04 × building land + 0.01 × unutilized land)/total land area of the region.
Table 3. Moran’s I value of the bifunctional PLES ecological niche width in Liangshan Yi Autonomous Prefecture.
YearPairs of Functions
PF-LFPF-EFLF-EF
20100.470−0.501−0.637
20150.749−0.363−0.527
20200.723−0.442−0.563
Disclaimer/Publisher’s Note: The statements, opinions and data contained in all publications are solely those of the individual author(s) and contributor(s) and not of MDPI and/or the editor(s). MDPI and/or the editor(s) disclaim responsibility for any injury to people or property resulting from any ideas, methods, instructions or products referred to in the content.

