Article

Spatiotemporal Analysis of Photovoltaic Potential in Ordos City Based on an Improved CRITIC Method

1
International Research Center of Big Data for Sustainable Development Goals, Beijing 100094, China
2
Aerospace Information Research Institute, Chinese Academy of Sciences, Beijing 100094, China
3
School of Geosciences, Yangtze University, Wuhan 430100, China
4
Coll Informat & Commun, Guilin University of Electronic Technology, Guilin 541004, China
*
Author to whom correspondence should be addressed.
Land 2025, 14(4), 742; https://doi.org/10.3390/land14040742
Submission received: 28 January 2025 / Revised: 17 February 2025 / Accepted: 18 February 2025 / Published: 31 March 2025

Abstract

:
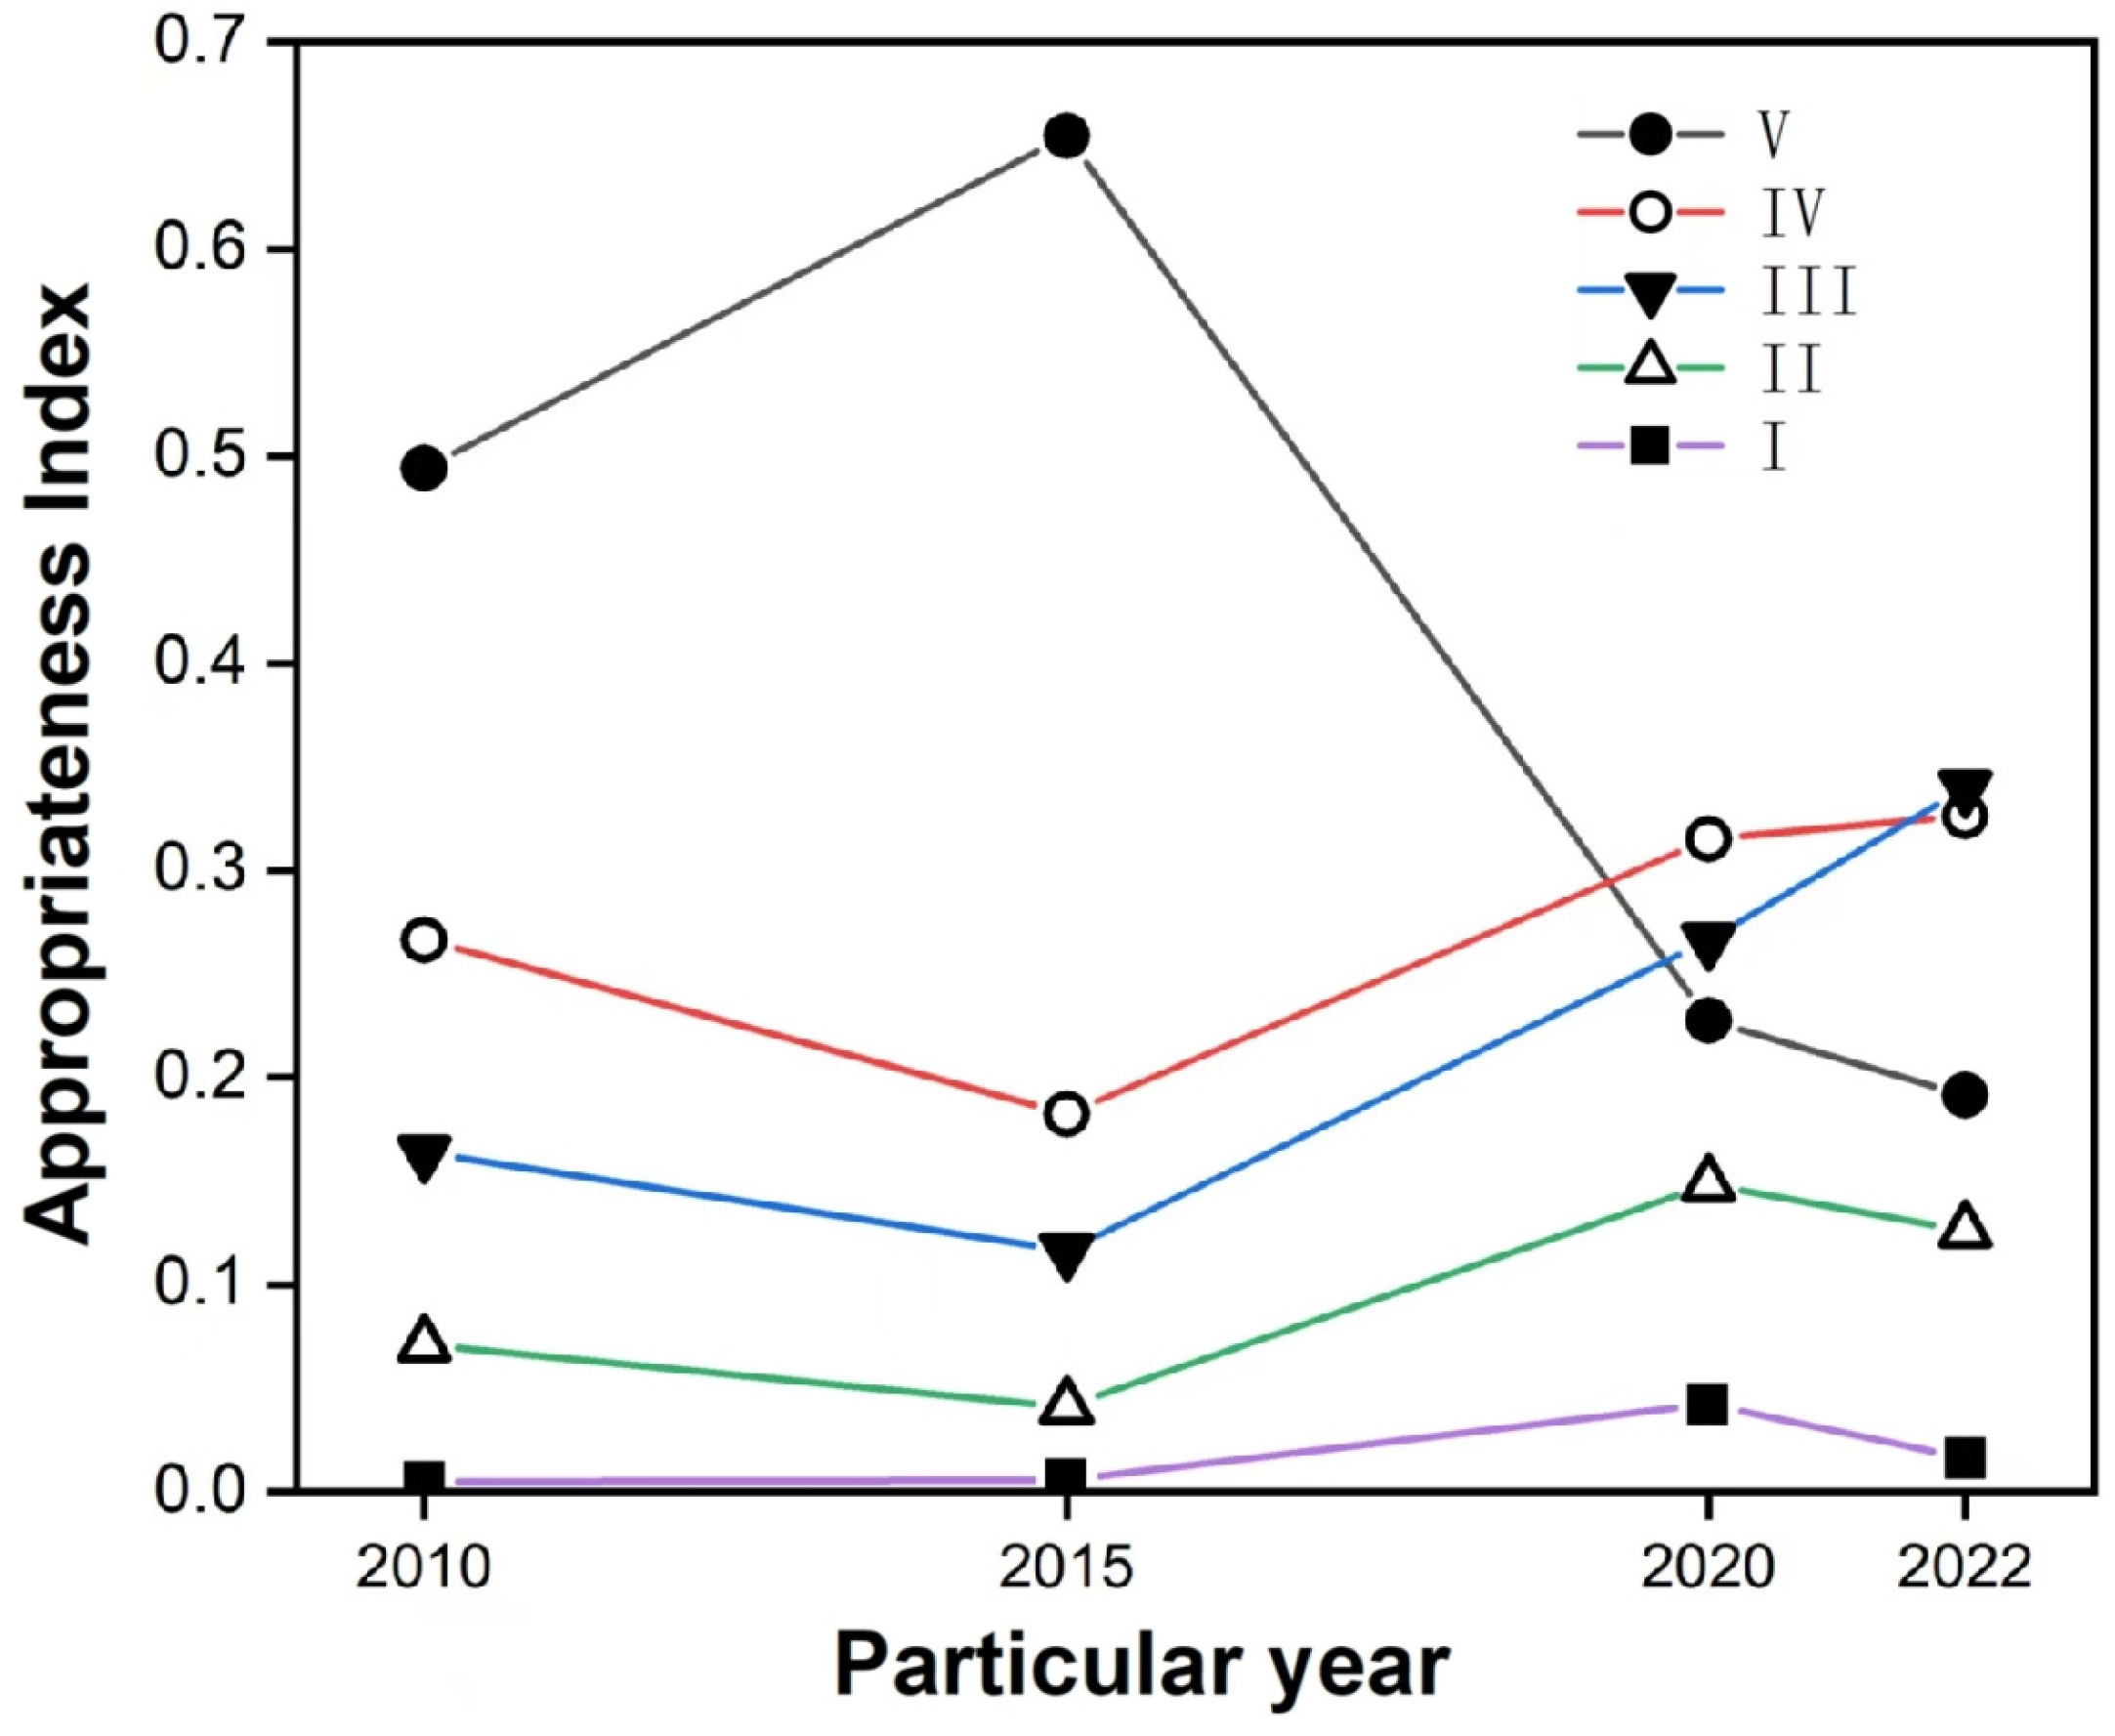
In view of the contradiction between the still-high energy consumption in Ordos and the increasingly urgent carbon-neutral goal, the adjustment of energy structures has begun, and strategic planning of photovoltaic facility construction critically supports the sustainable growth of local energy systems. Therefore, the author constructed the site selection evaluation system of photovoltaic suitability based on remote sensing, meteorological and topographic data. The improved CRITIC empowerment method is used to comprehensively consider the conflict and variability of the indicators for an objective and quantitative analysis of the spatial and temporal changes in suitable areas for photovoltaic development. Finally, the comprehensive evaluation results of the photovoltaic site selection are obtained. The results show that (a) the improved CRITIC method reduces the weight of ‘night light’ from 0.24 to 0.14, effectively reducing the weight bias caused by the extreme value and (b) since 2010, the regional area of suitable level and above has increased from 23.96% to 48.24%, and its spatial center of gravity shows a trend of moving first to northeast and then to southwest. This study overcomes the limitations of mainstream subjective evaluation methods. Additionally, it addresses the oversight of human factors’ impact on suitability in traditional assessment frameworks. This research provides decision-making support for regional energy allocation planning and spatial planning.

1. Introduction

The climate change crisis triggered by global warming is emerging as a critical challenge that threatens human survival. Building an environmentally friendly, low-carbon, and green energy system and reducing carbon dioxide emissions are crucial for stopping global warming and achieving regional energy sustainability [1]. In 2020, China proposed the “dual carbon” goals, further emphasizing the urgency of establishing a clean and efficient power system. Currently, China’s energy structure transformation has made significant progress: by the end of 2024, the installed capacity of new energy power generation reached 1.45 billion kw, surpassing thermal power for the first time. Among these, solar energy resources, due to their easy accessibility, wide distribution, and low pollution, have become a strategic emerging industry for promoting energy structure transformation and building a green energy system. Therefore, scientifically evaluating the influencing factors of PV power station construction and reasonably planning their location and construction are crucial [2,3].
With the development and popularization of geographic information technology, many researchers at home and abroad have used geographic information systems (GISs) combined with comprehensive evaluation methods to analyze the suitability and power-generation potential of PV development in different regions [4,5,6]. For example, Rios et al. used the Analytic Hierarchy Process (AHP) and expert scoring method, combined with GIS, to analyze 33 limiting factors and 7 criteria related to the site selection of large-scale PV solar projects, creating a suitability map for Peru. Noorollahi et al. used fuzzy logic combined with AHP, selecting climate, terrain, and economic indicators to study the suitability of PV development in Khuzestan Province, Iran, and determined the optimal site for PV power stations. Liu Licheng et al. constructed a PV development suitability evaluation index system based on remote sensing data, meteorological data, and basic geographic data, evaluated the suitability of PV development in the Beijing–Tianjin–Hebei region, and estimated the PV power-generation potential and emission reduction benefits [7]. Xu Wei et al. used AHP and the multi-criterion decision-making (MCDN) method to study the spatial suitability and emission reduction benefits of photovoltaic development in Inner Mongolia [8]. Zhang Qian et al. used remote sensing technology to obtain the spatial and temporal distribution of regional solar energy resources, combined with the five influence factors of total solar radiation, sunshine hours, the distance from road network, and the distance from town and slope [9].
In conclusion, most domestic and foreign scholars use the spatial weighted stacking analysis method for spatial suitability analysis, and this evaluation method is widely used in site selection and suitability model construction. But the above studies have constructed evaluation systems by considering resources, environment, and construction conditions whilst lacking an in-depth analysis of human factors. Moreover, the studies mostly use qualitative evaluation methods, which cannot exclude the influence of subjective evaluation on the results. The traditional CRITIC weighting method is highly sensitive to data distribution and can be affected by outliers, leading to biased weights. It is difficult to meet the refined and quantitative requirements of the municipal scale. Therefore, this paper improves the CRITIC weighting method to achieve objective evaluation while reducing the impact of outliers on the weighting process.
Ordos is an important energy, industrial, and resource city in northern China, and the construction of PV power stations there is of great significance for improving the new power system, reducing greenhouse gas emissions, and desert control [10]. This study integrates meteorological, topographic, and vegetation parameters to construct a PV development suitability system for Ordos City, uses an objective weighting method, focuses on the impact of human factors, reveals the spatiotemporal changes in PV construction suitability, and provides a scientific basis for urban PV development, improving resource and energy utilization efficiency.

2. Materials and Methods

2.1. Study Region

Ordos City is located in the southwest of Inner Mongolia Autonomous Region (Figure 1), in the hinterland of the Ordos Plateau, with a dry and semi-arid climate. The average annual temperature is 5.5–9.1 °C, and the average annual precipitation is 25–490 mm, with evaporation reaching 2000–3000 mm. The city spans approximately 400 km from east to west and 340 km from north to south, with a total land area of about 87,000 km2. The terrain of Ordos is complex, with the northwest being higher than the southeast, and the average altitude is 1000–1500 m. The city has two major desert areas, the Mu Us Desert and the Kubuqi Desert, which account for about 52% of the city’s total land area [11]. In 2022, Ordos City released the “14th Five-Year Plan for Comprehensive Energy Development”, planning to increase the proportion of renewable energy installed capacity to over 50% of the city’s total power installed capacity by 2025, with renewable energy power consumption accounting for more than 35%, aiming to build Ordos into a national modern energy economy demonstration city.

2.2. Data Sources

This study uses four types of data: remote sensing data, meteorological data, topographic data, and ground observation data. The time nodes for these data are 2010, 2015, 2020, and 2022.Specific data are explained in detail in Table 1.
From the perspective of PV power-generation characteristics and energy structure, the development of the PV industry is a comprehensive issue, involving not only the technical development of the PV industry itself but also environmental protection, social development, and other aspects [13]. Therefore, this paper selects 14 parameters, including remote sensing data, meteorological data, topographic data, and ground observation data, to assess the suitability for photovoltaic development. Remote sensing data are used to efficiently and extensively obtain land cover information, helping to identify areas suitable for photovoltaic development while avoiding ecologically sensitive areas or regions with land conflicts. Meteorological data are used to quantify solar energy resource potential, determining the photovoltaic system’s efficiency and economic feasibility, serving as the core basis for site selection. Topographic data are used to assess construction feasibility and engineering costs, directly influencing the project’s viability. Finally, using ground-based observation data as supplementary (e.g., wind speed). Moreover, this paper selects four time points: 2010, 2015, 2020, and 2022, aiming to align the research timeline with the five-year plans of Ordos City. It analyzes how the development and construction of each five-year plan impact the suitability of photovoltaic development. Based on the analysis of the current PV development foundation and energy structure transformation in Ordos, this study selected 14 parameters, including GHI, temperature, and precipitation, to evaluate the suitability of PV development in Ordos.
Meteorological parameters include solar radiation, temperature, precipitation, and wind speed. Solar radiation is closely related to the power generation of PV power stations and is an important indicator for suitability evaluation. Temperature and precipitation affect the stability of solar radiation, thereby influencing the efficiency of PV power generation. For every 1 °C increase in temperature, the output power of solar cells decreases by 0.35–0.45% [14,15], so temperature is treated as a negative indicator and normalized. Ordos has severe dust issues, and dust deposition on PV components increases cleaning costs and frequency. Therefore, appropriate rainfall has a positive impact on solar power generation. Since the precipitation in Ordos is below 500 mm and evaporation is high, the height of the PV panels should be at least 2 m to meet the conditions for PV facility construction. Thus, precipitation is treated as a positive parameter. Wind speed mainly affects the safety of PV panels. High wind speeds can damage PV panels, increasing operation and maintenance costs.
Topographic and POI data include slope, aspect, distance to roads, distance to rivers, and distance to residential areas. Steeper slopes will inevitably increase the development cost of PV power stations. Therefore, based on the “Land Use Control Indicators for PV Power Station Projects” issued by the Ministry of Land and Resources, this study classified the slopes in western Inner Mongolia. Distance to roads, rivers, and residential areas affects development costs. The proximity to rivers facilitates the cleaning of dust on PV panels, and the distance to residential areas affects local consumption capacity [16]. Therefore, based on the literature and the distribution of road networks, water networks, and residential areas in Ordos, the distance to roads is divided into five levels: 0–1 km, 1–5 km, 5–10 km, 10–20 km, and over 20 km. The distance to water bodies and residential areas is divided into five levels: 0–10 km, 10–35 km, 35–50 km, 50–80 km, and over 80 km.
Environmental and social data include NO2, PM2.5, NDVI, nighttime light, and land use type. Nighttime light and NO2 indicate human activity and industrial emissions in the area, with strong local consumption capacity, making them priority areas for PV development. PM2.5 affects the intensity of solar radiation received on the ground. Different land use types affect construction suitability [17]. Ordos has sparse vegetation and fragile ecology, so PV power stations should be preferentially built in areas with low vegetation coverage to fully utilize the sand control capabilities of PV facilities.

2.3. Research Methods

Existing studies on PV suitability mostly use or combine subjective weighting methods such as AHP and fuzzy logic [18,19,20], deliberately emphasizing the impact of total horizontal radiation (GHI) and slope (SLO) [21,22,23], which is highly subjective. Therefore, this study uses an improved CRITIC method combined with a weighted linear combination method to evaluate the spatiotemporal changes in suitable areas for PV development, enabling a completely objective assessment of regional PV development suitability. Since the variation in natural factors across the city is small, the improved CRITIC method can highlight the variability and conflict between parameters, reducing the impact of natural factors with small variations on the evaluation results, and focusing on the impact of construction costs and consumption levels on PV development suitability [24,25,26].
The research process is divided into three steps. First, the basic situation of the study area is analyzed, and data processing is performed. Fourteen parameters are selected to construct the PV development suitability evaluation system, and the parameters are normalized. Second, the improved CRITIC weighting method is used to calculate the parameter weights, and then the weighted linear combination method is used to calculate the preliminary evaluation results of PV development suitability. The preliminary evaluation results are then adjusted by removing restricted areas such as water bodies and built-up areas in Ordos City that are not suitable for PV power station construction, obtaining the spatiotemporal distribution of suitable areas for PV development. Finally, the evaluation results are divided into five levels (I–V), with level I being the most suitable and level V being the least suitable. Based on the spatial distribution of areas with different suitability levels, the driving factors of the spatiotemporal changes in suitable areas for PV development are analyzed [26,27,28].

2.3.1. Construction of PV Development Potential Evaluation System

The suitability evaluation of PV power stations needs to consider multiple factors. Based on the relevant literature and the characteristics of Ordos’s development, this study selects meteorological, topographic, environmental, and social dimensions, supplemented by POI data, and further subdivides them into 14 parameters to construct a PV development suitability evaluation system for evaluating the suitability of PV development in Ordos.

2.3.2. Improved CRITIC Method

The weight of indicators plays a crucial role in the results of PV potential evaluation. This study uses the CRITIC objective weighting method to assign weights to the evaluation indicators of PV development potential in Ordos [8,29].
Since traditional weighting methods such as entropy weight and standard deviation can only reflect the impact of the degree of variation in indicators on weight assignment and cannot reflect the impact of the correlation between indicators on weight [30,31,32], the CRITIC weighting method determines the objective weight of each indicator based on the variability and conflict of evaluation indicators. In the traditional CRITIC weighting method, standard deviation is often used as a parameter to measure the variability of indicators. However, the standard deviation is sensitive to extreme values. If there are outliers in a particular indicator, the standard deviation will be inflated, resulting in the indicator being assigned an excessively high weight, which may distort the actual information. To reduce the model’s sensitivity to outliers and eliminate the impact of inconsistent dimensionality among different indicators on the analysis results, this study uses the coefficient of variation to replace the standard deviation, in order to more accurately reflect the relative variability of each indicator. The correlation between multiple indicators varies, and the correlation coefficient can be positive or negative. The traditional CRITIC weighting method uses (1 − rij) to express the impact of conflict between indicators on weight. However, the sign of the correlation coefficient rij can lead to different impacts of the same correlation change on the correlation indicator. To address this issue, this study uses (1 − ∣rij∣) instead of (1 − rij) to reflect the strength of the correlation between indicators, reducing the impact of the sign of the correlation coefficient rij on weight assignment. This improvement not only retains the theoretical foundation of the CRITIC method but also enhances its rationality and reliability in practical applications. Finally, the combination of variability and conflict is changed from multiplication to the arithmetic square root of multiplication to reduce the data deviation caused by large differences between variability and conflict.
w j = δ j j = 1 m ( 1 r i j ) i = 1 n [ δ j j = 1 m ( 1 r i j ) ]
δ j = i = 1 n ( x i j x ¯ j ) 2 n 1 / x ¯ i
where w j is the index weight; δ j is the variability index; the coefficient of variation is taken; r i j is the conflict index; and the correlation coefficient is taken.

2.4. Validation

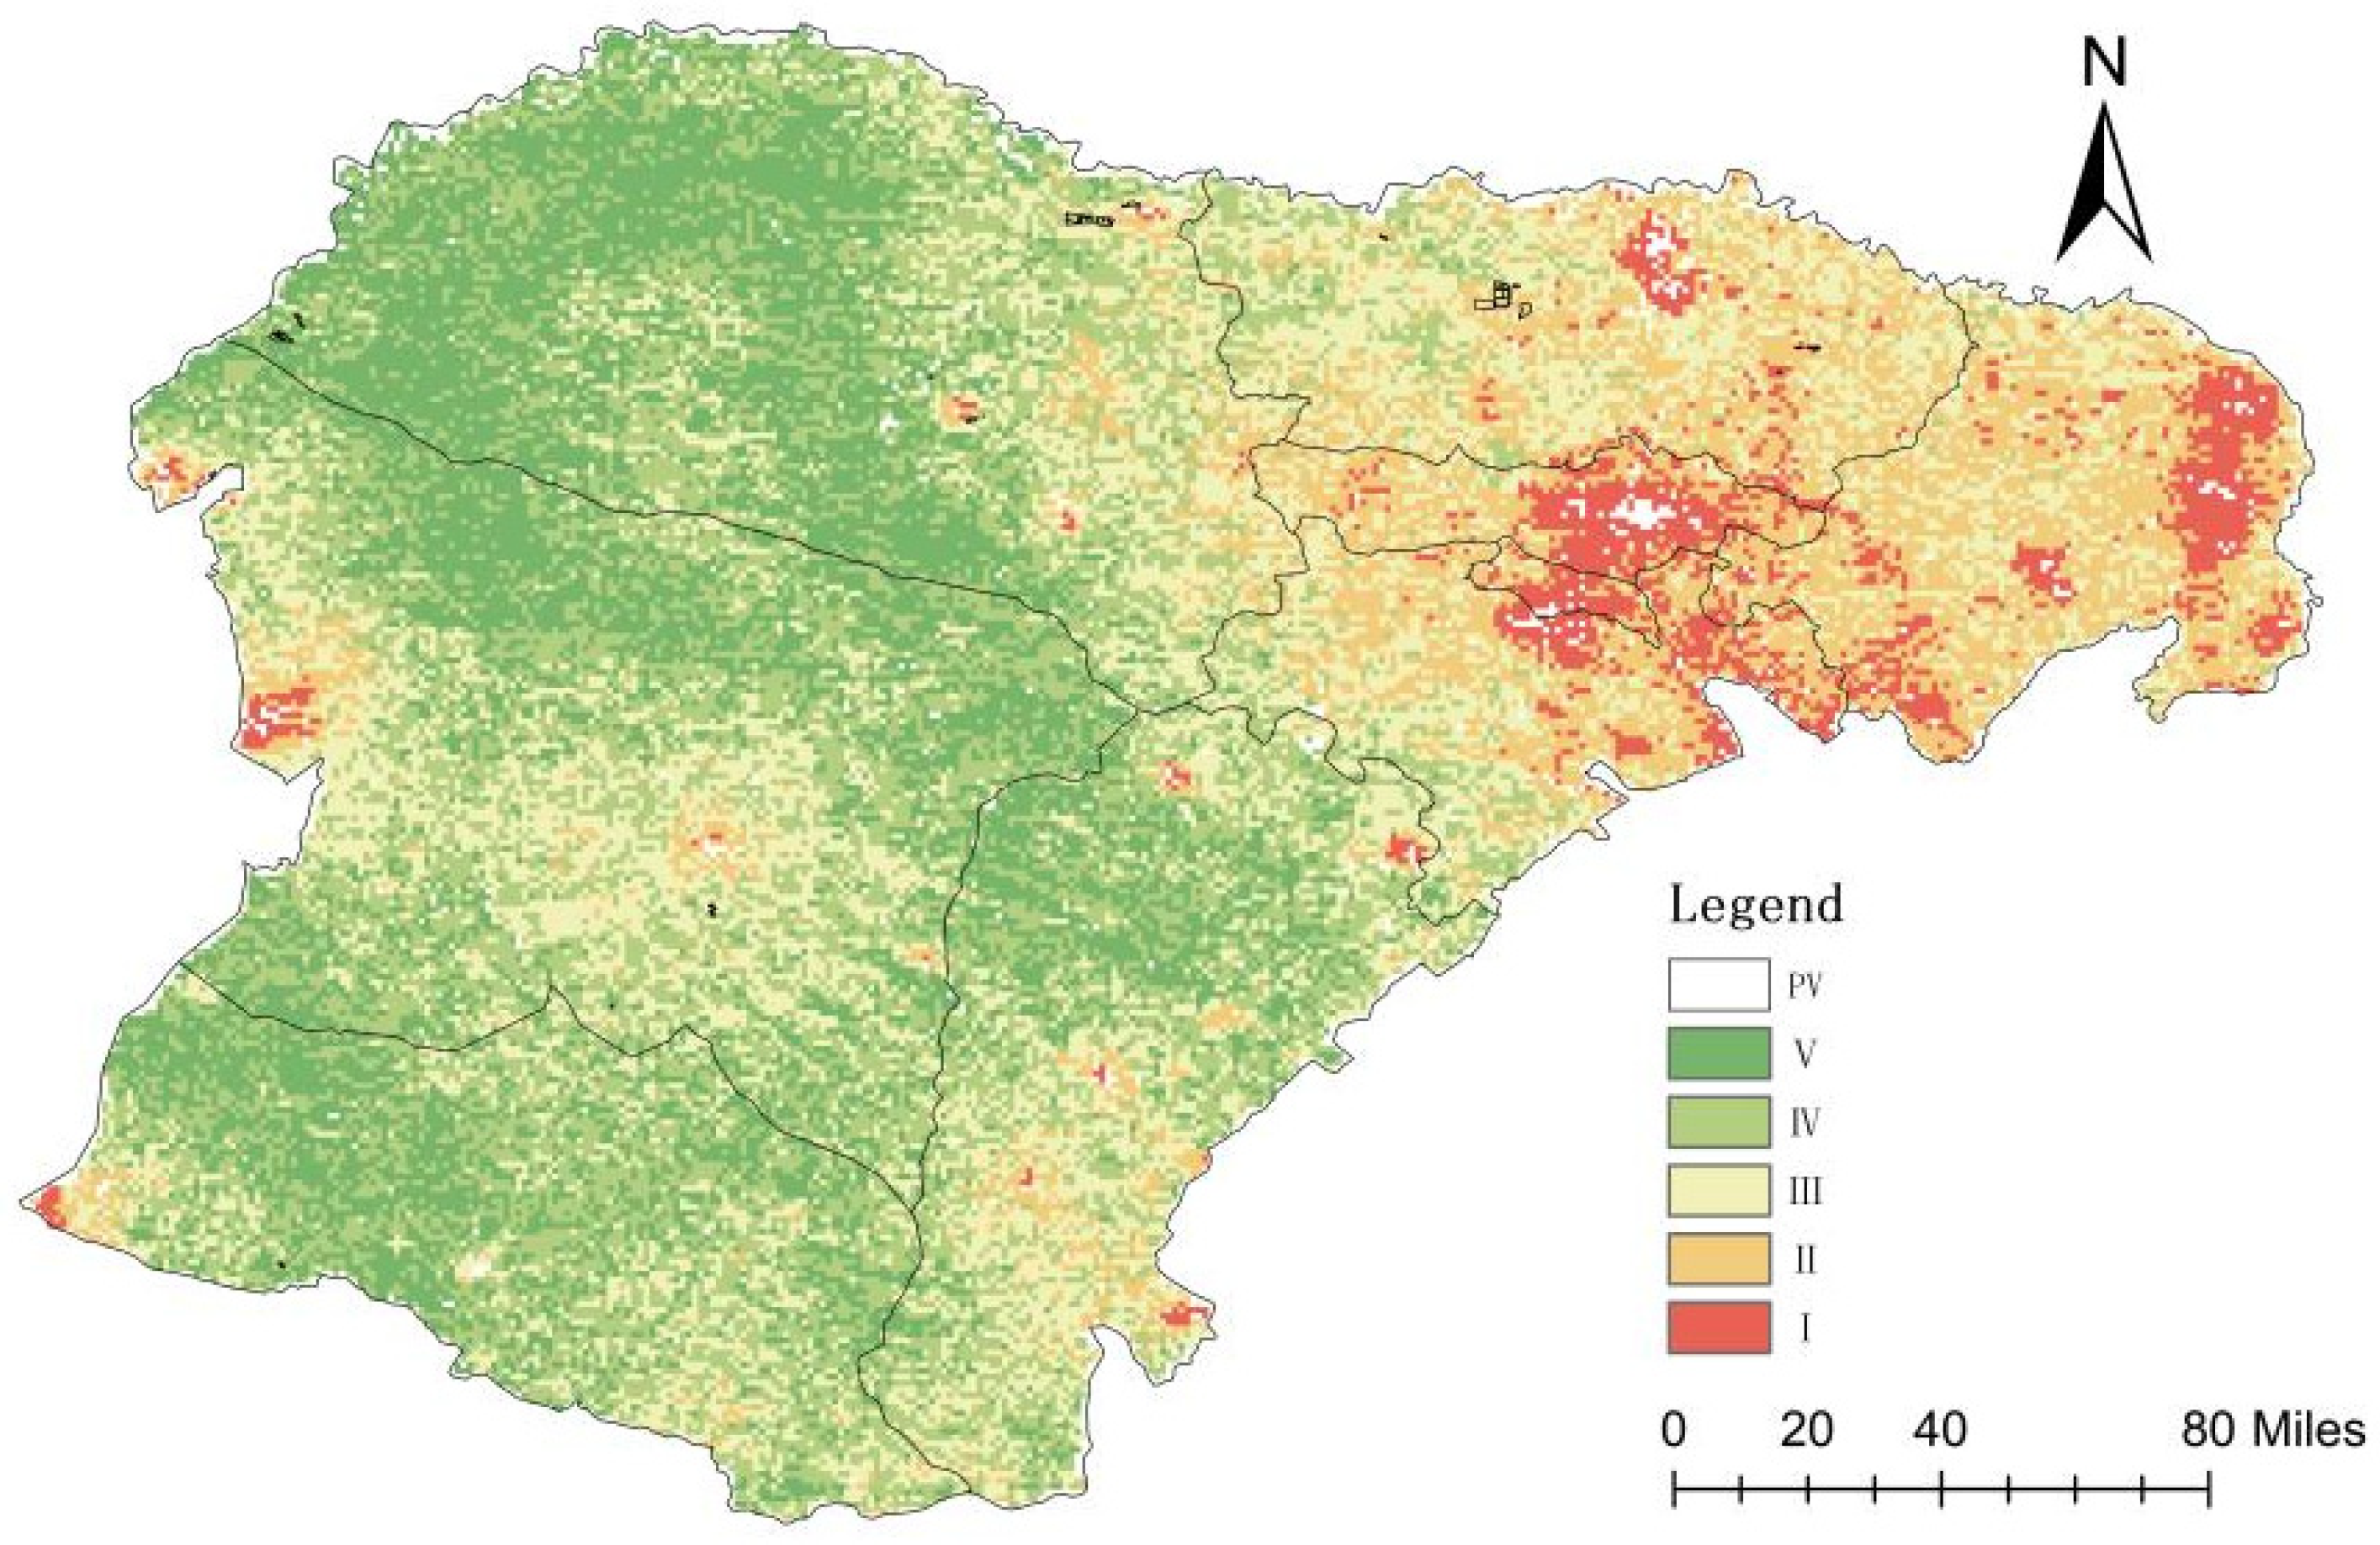
The parameters for 2020 are normalized, and the improved CRITIC method is used to calculate the weights, obtaining the parameter weights. The weights and parameters are then calculated using the weighted linear combination method to obtain the 2020 PV development suitability distribution map for Ordos City. The calculated PV suitability evaluation results are divided using the natural breaks method [33,34], combined with the 42.5% of the total land area proposed by the Ordos government for PV power generation, to classify the suitability levels of PV development in the city. The classification thresholds are 0.418–0.494, 0.495–0.553, 0.554–0.576, 0.577–0.631, and 0.632–0.791, corresponding to levels V, IV, III, II, and I, respectively. Finally, the results are compared with existing PV power stations for validation.
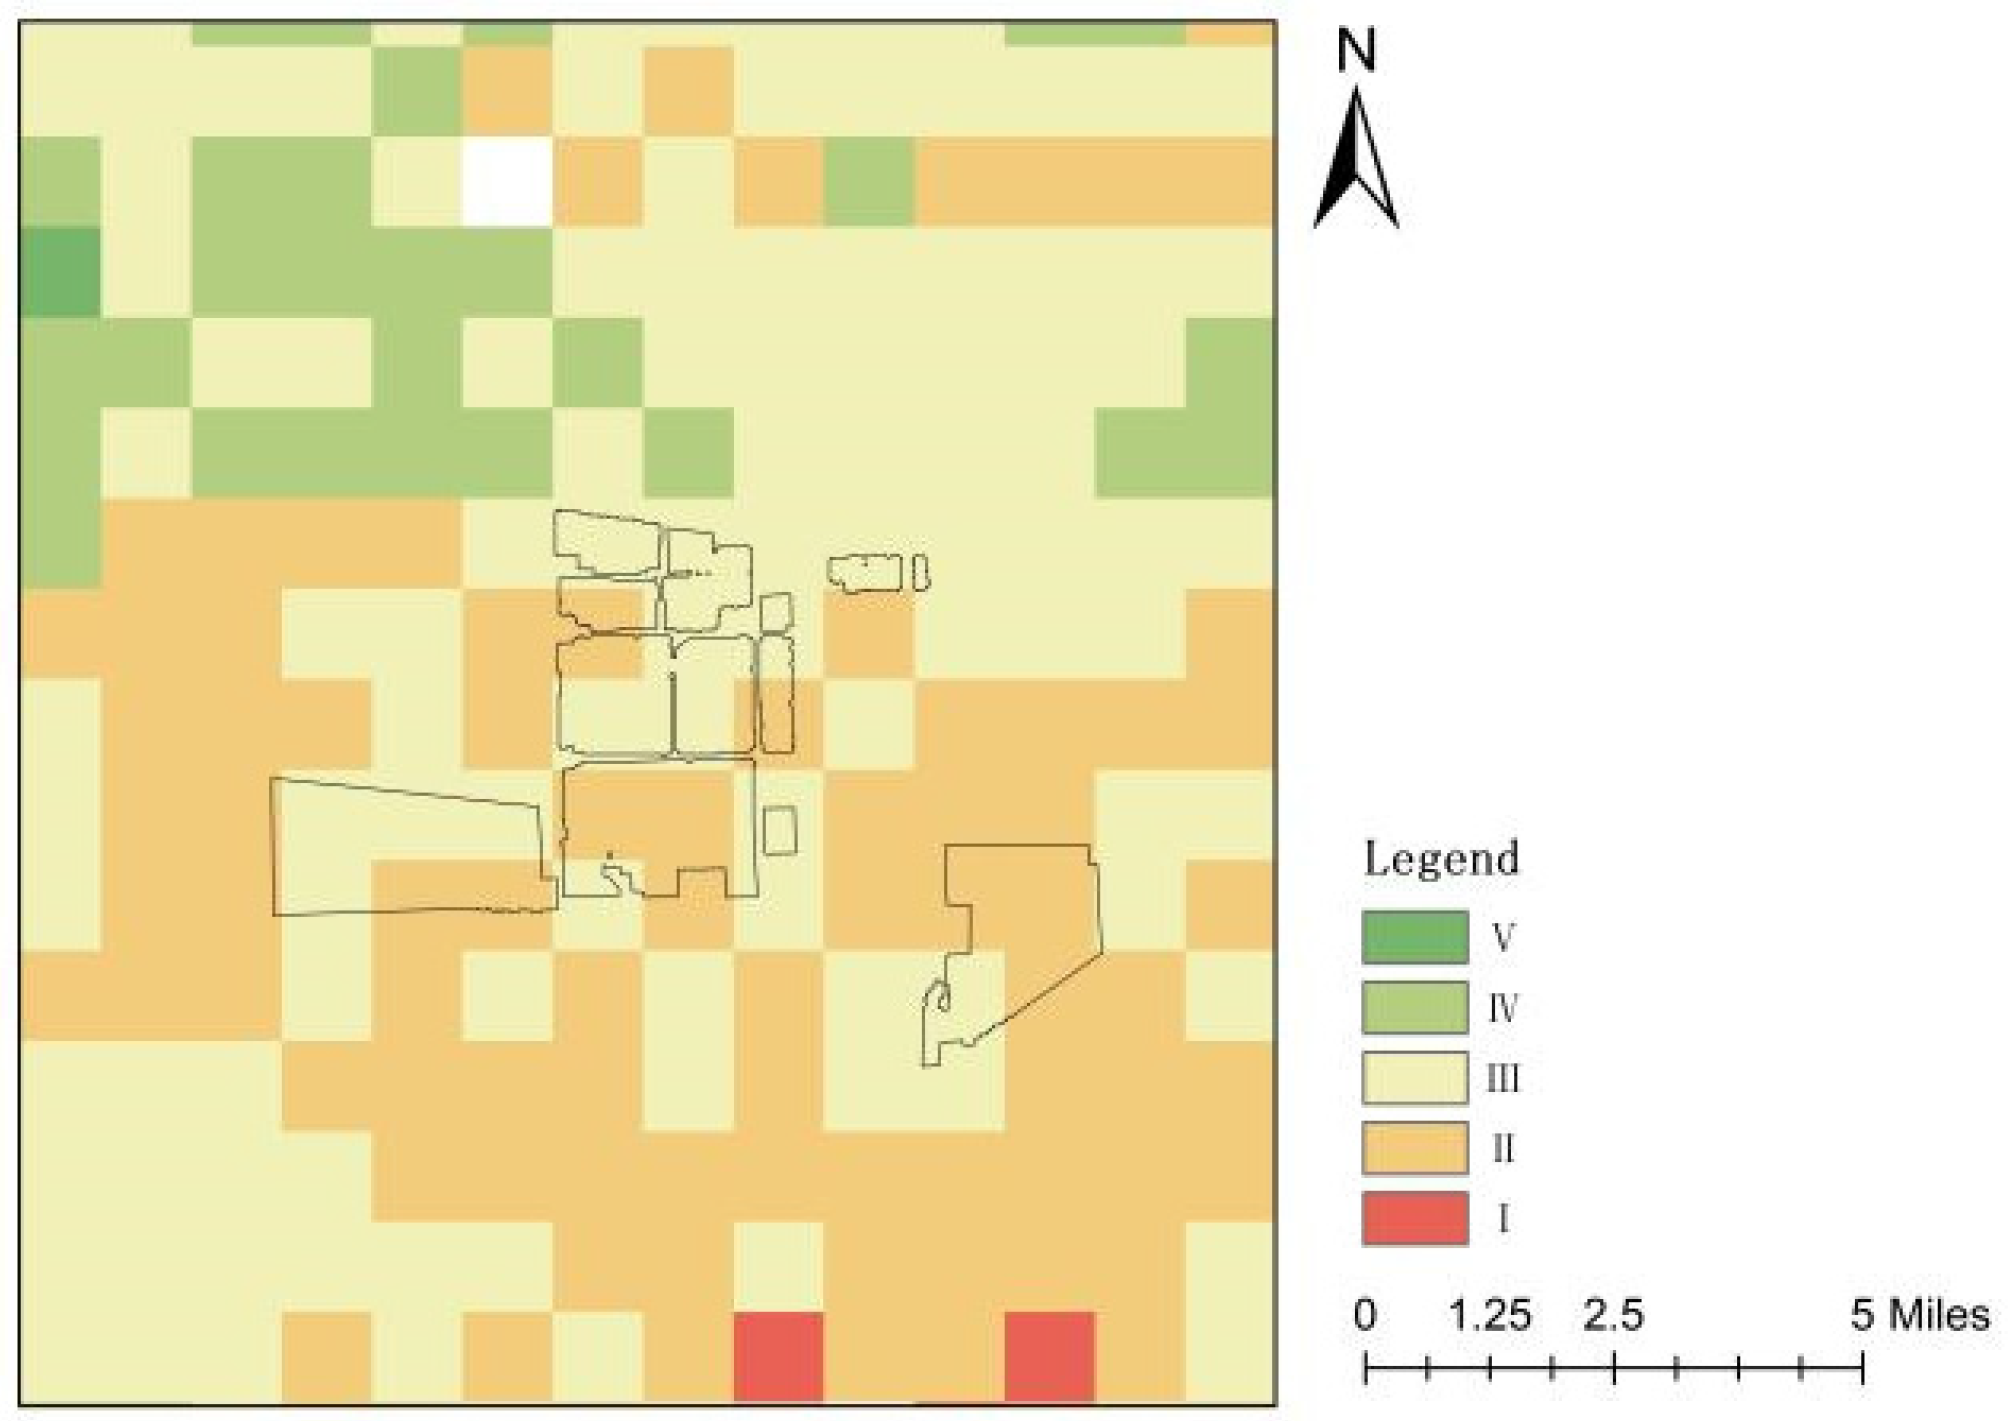
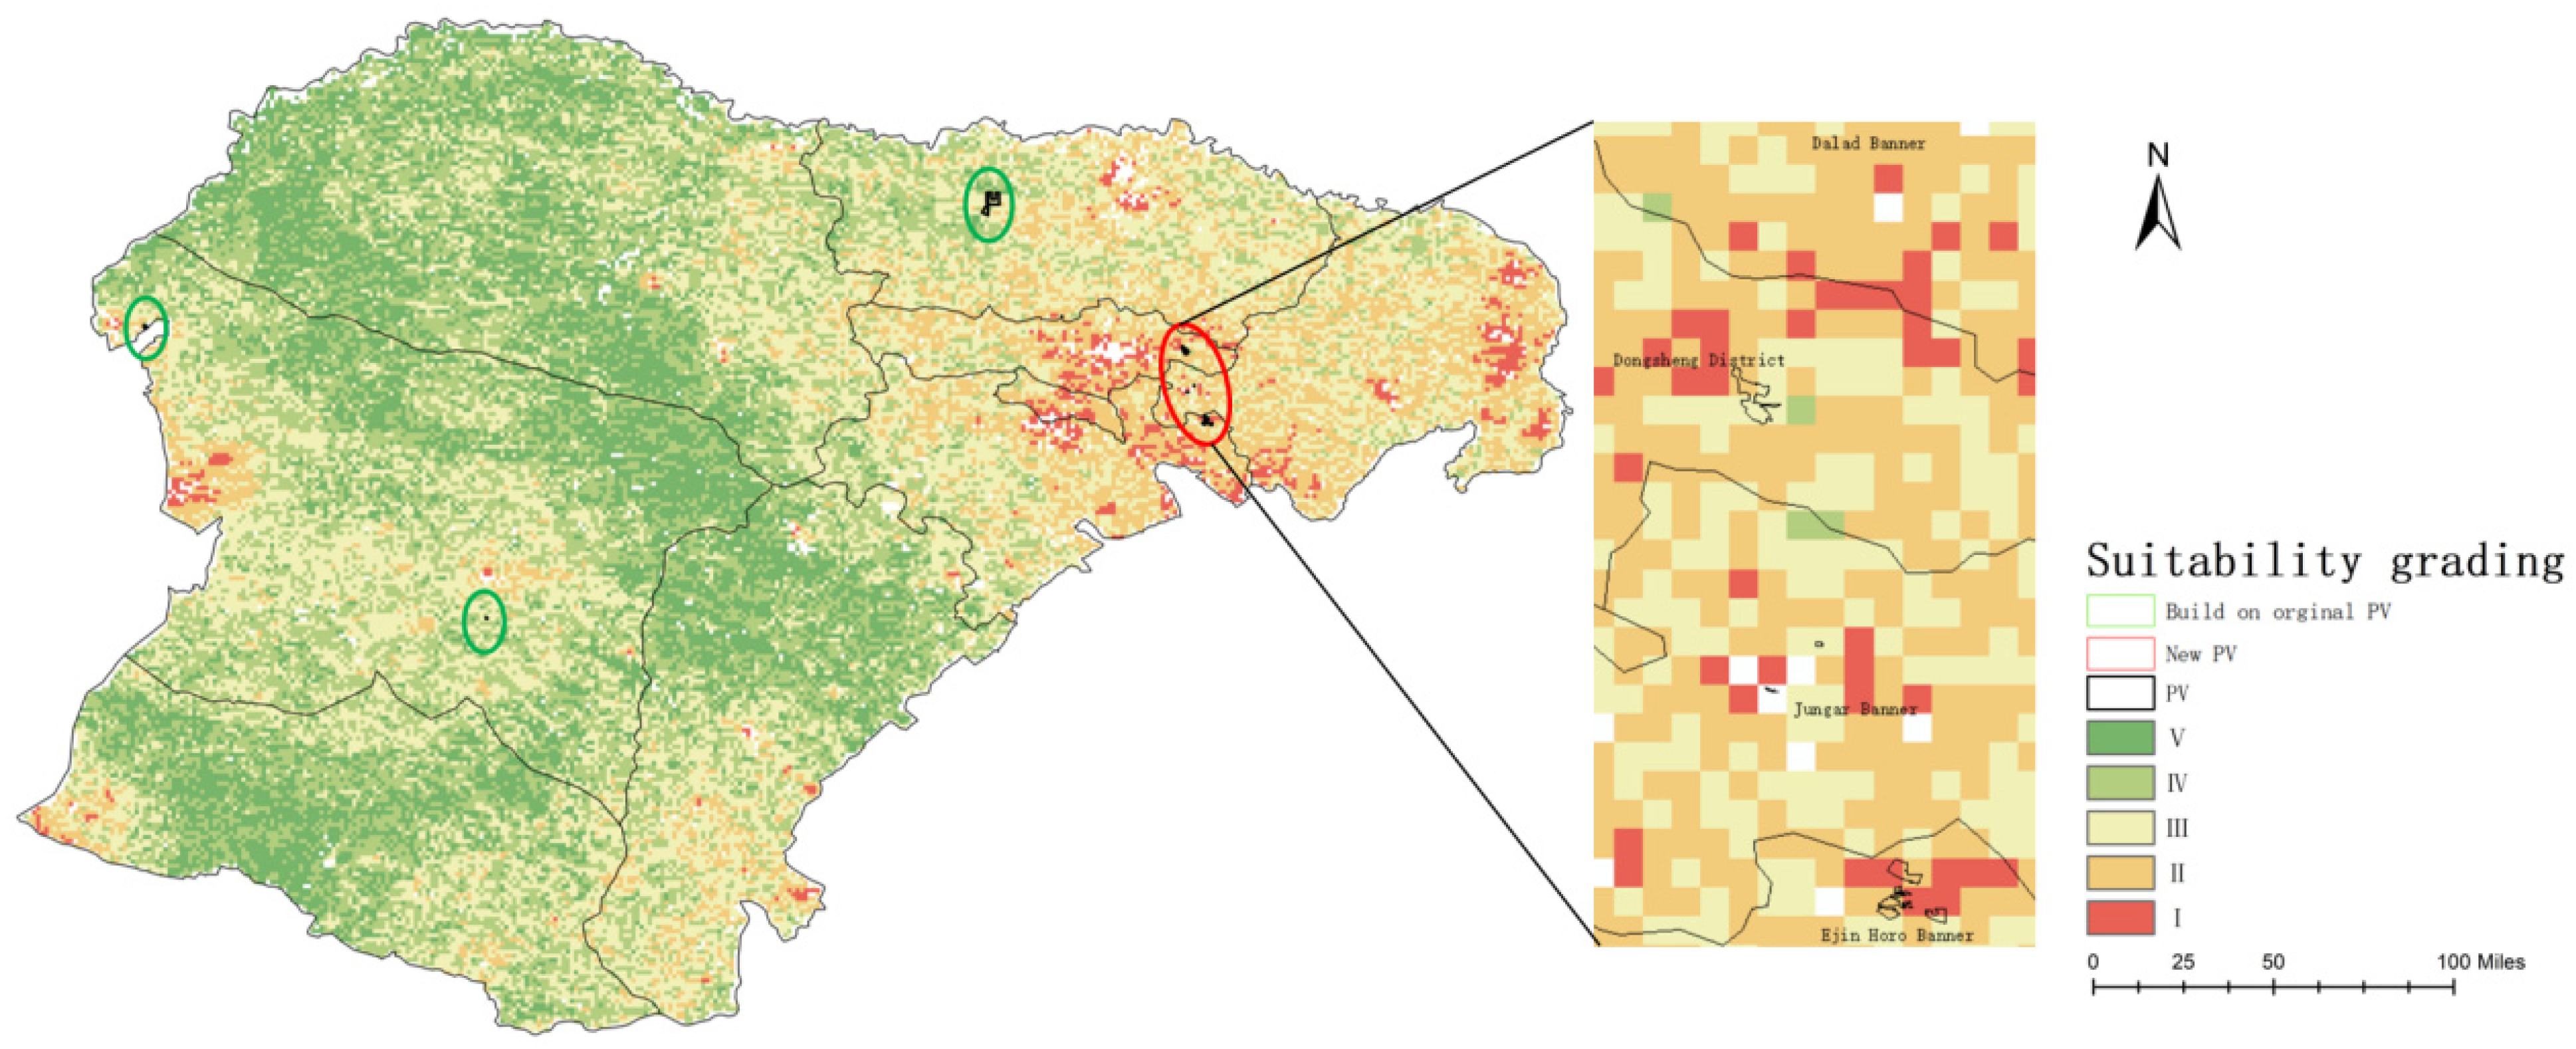
The consistency analysis between the current PV land use and the development suitability results can clearly reflect the rationality of the suitability evaluation and the current PV land use layout. Therefore, the 2020 China PV Power Station Distribution Dataset is compared with the PV development suitability evaluation results (Figure 2).
The existing photovoltaic (PV) land in Ordos City is predominantly distributed in areas with suitability levels III and II, accounting for 42.63% and 35.77% of the total existing PV land, respectively (Figure 3). The area of existing PV land distributed in regions with suitability levels III and above accounts for 79.87% of the current PV land use. This indicates that the PV land development suitability evaluated in this study is largely consistent with the current PV land layout, and the evaluation grading results meet the conditions for subsequent research.

2.5. Analysis of Method Optimization Effects

The improved CRITIC weighting model effectively avoids the problem of the excessive impact of indicator variability on information entropy (Table 2). Since Ordos is sparsely populated, with the population concentrated in Dongsheng District and Kangbashi District, the nighttime light data have large extreme values and a small mean. The standard deviation of nighttime light is 0.20, and the mean is 0.13, resulting in a coefficient of variation of 1.55, much higher than other parameters. This leads to a significant overestimation of the weight of nighttime light, reaching 0.24, when using the traditional CRITIC weighting method. The improved CRITIC weighting model calculates the arithmetic square root of the original information entropy, reducing the weight deviation caused by large differences between variability and correlation parameters. After improvement, the weight of nighttime light is reduced to 0.14, effectively avoiding the weight deviation caused by extreme values.

3. Results

3.1. Temporal Change Characteristics of PV Development Suitability

To visually show the changes in suitability over different years, the changes in the proportion of suitable areas over a 12-year period are statistically analyzed, as shown in Figure 4.
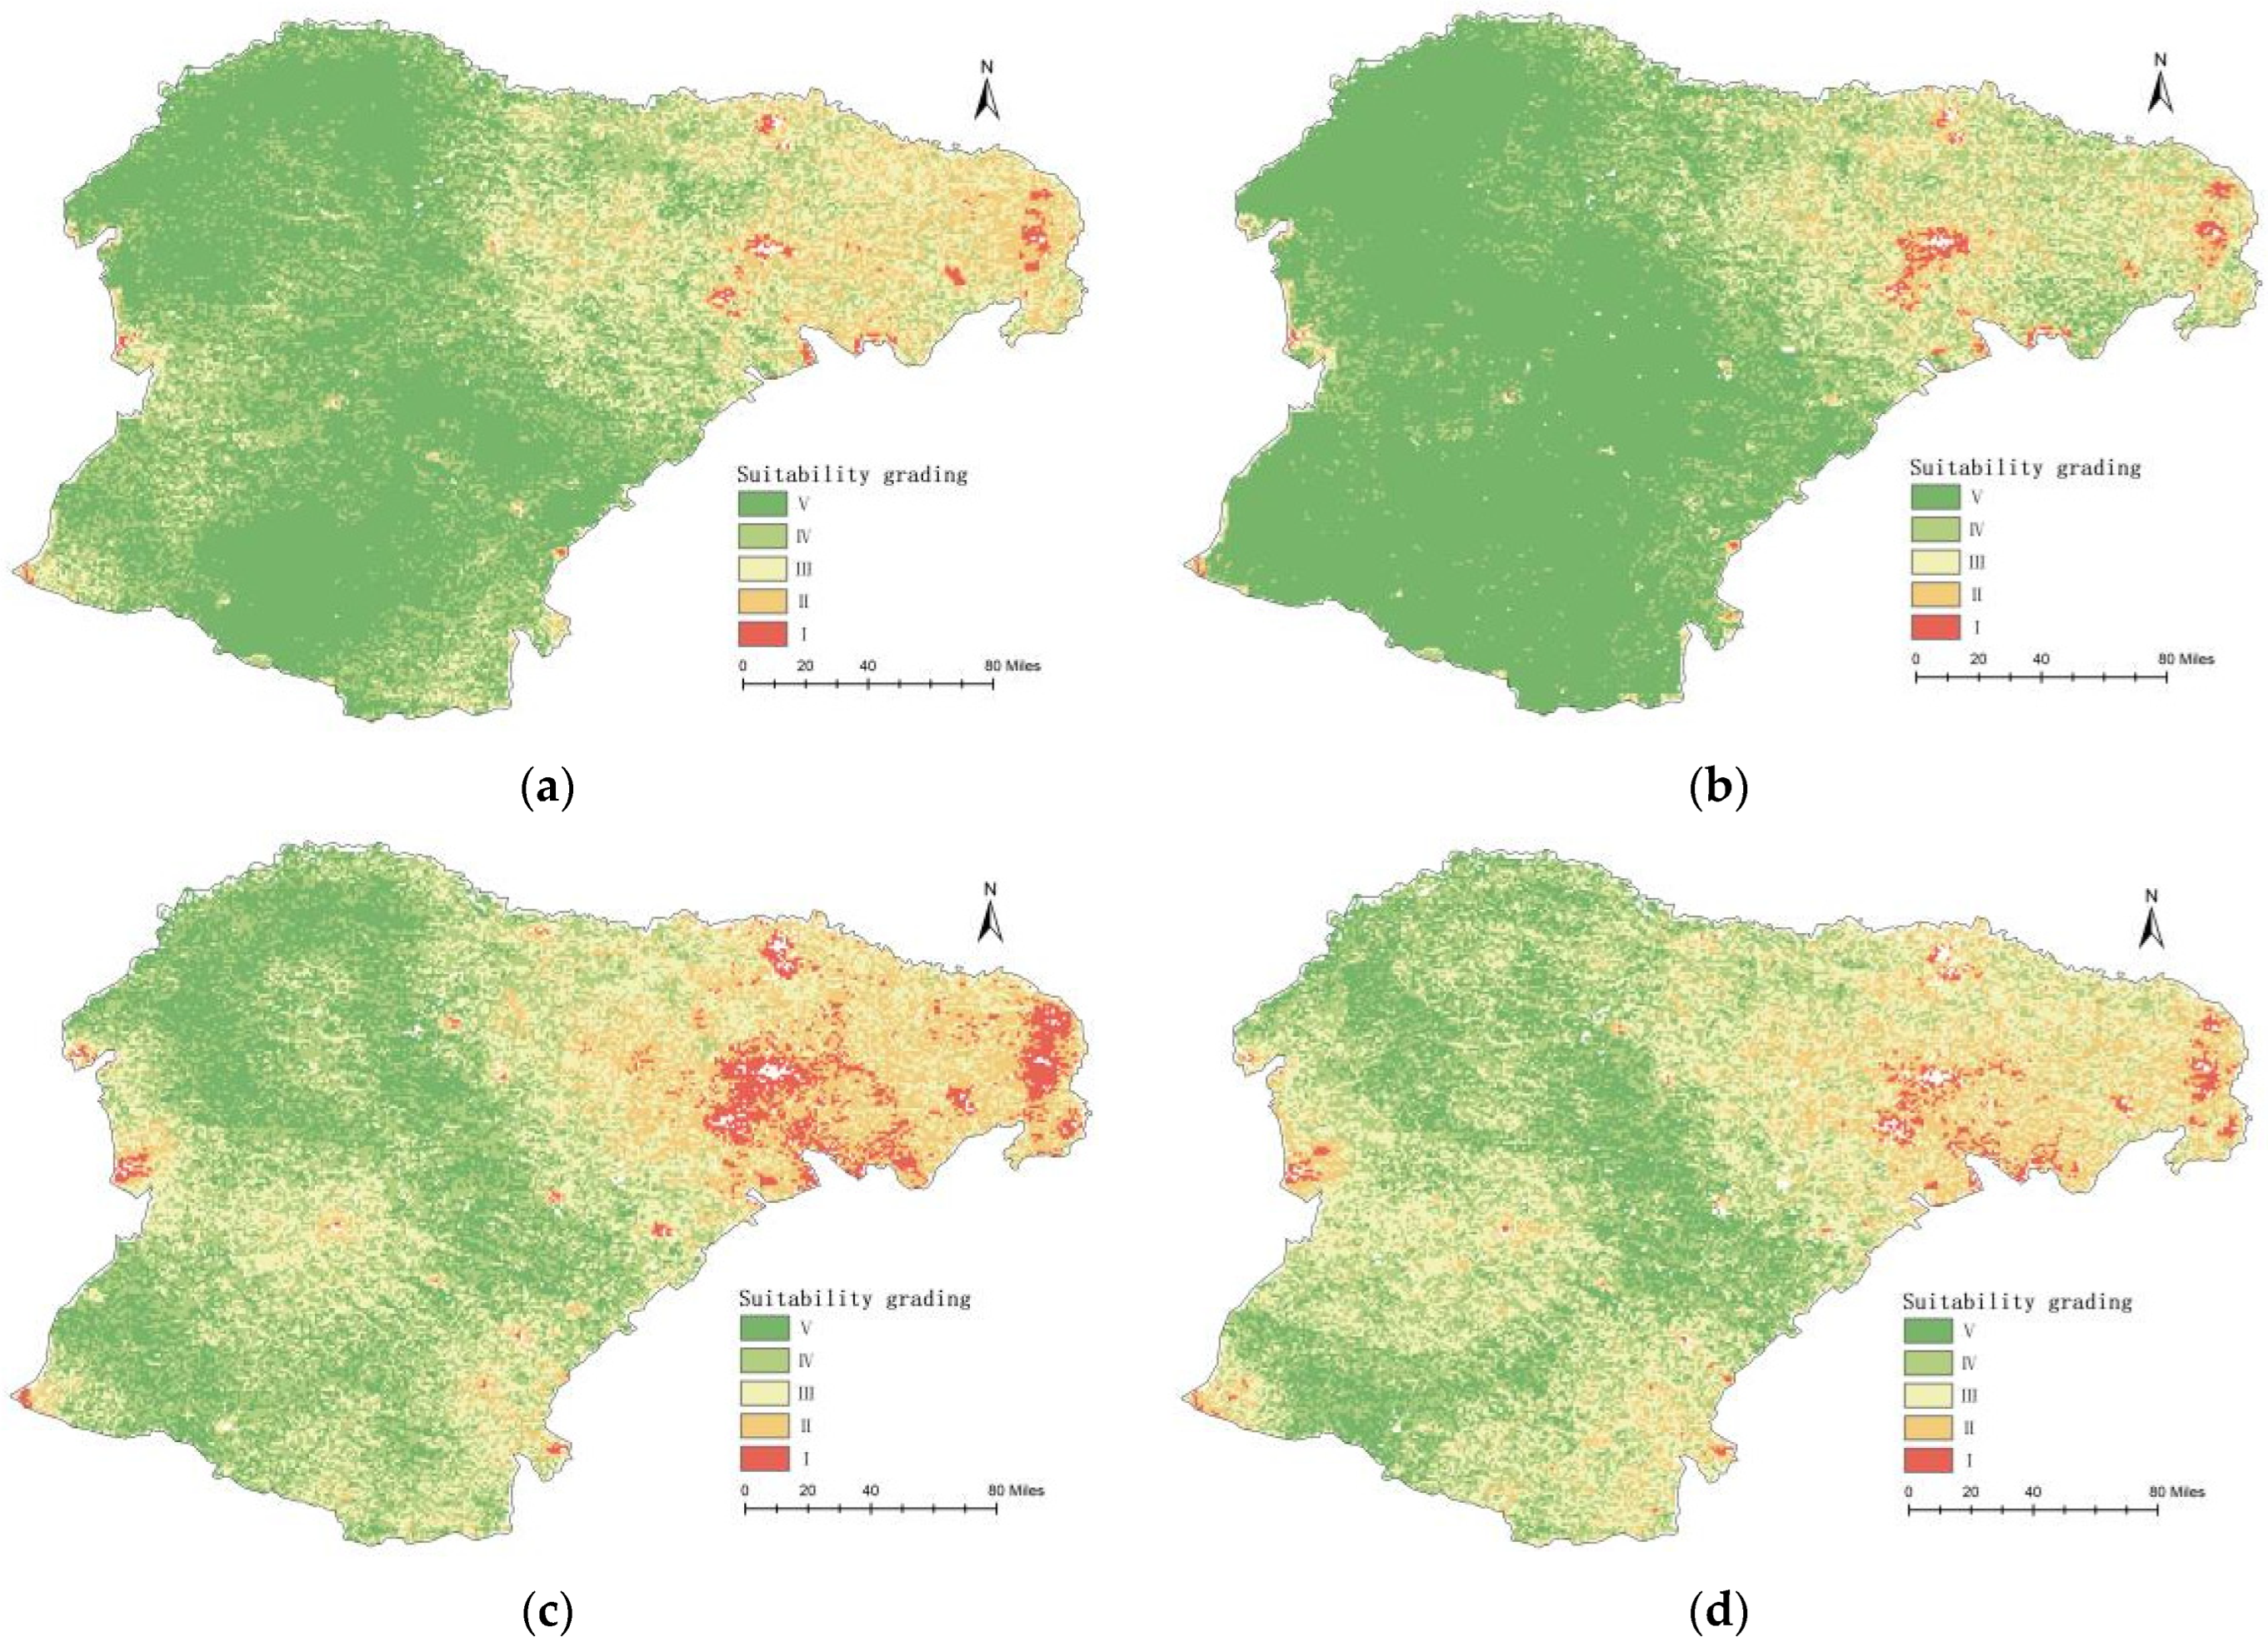
From the suitability evaluation results of the four years (Figure 5), the area with suitability levels of III and above in Ordos shows an overall trend of first decreasing and then increasing. Compared to other years, the average temperature and wind speed in Ordos in 2015 were significantly higher, increasing by 10.05% and 11.48%, respectively, compared to 2010, and the annual precipitation was only 297.72 mm, a decrease of 1.2% compared to 2010, resulting in a lower overall suitability score for PV development in Ordos in 2015. Since 2015, residential areas have significantly increased, with nighttime light brightness increasing by 277.32%, and electricity demand has greatly increased. Additionally, infrastructure construction has accelerated, with the road network becoming denser, and the average distance to roads decreasing from 5.83 km to 2.80 km, creating excellent transportation conditions for PV development and significantly reducing PV development costs. As a result, the suitability of PV development has shown a rapid upward trend since 2015, mainly manifested as a shift from level V to levels IV and III.
Compared to 2020, the suitability of PV development in Hangjin Banner in 2022 has shifted from level V to levels IV and III. This area has abundant solar radiation and slopes below 3°, but its geographical location limits its electricity consumption capacity. Since 2020, the road network has become denser, with the average distance to roads decreasing from 45.66 km in 2020 to 38.65 km in 2022. Additionally, nighttime light brightness in 2022 increased by 276.04% compared to 2020, increasing electricity consumption capacity to some extent, leading to an overall improvement in PV development suitability in the area, with an average increase of 37.03%. The upward trend in PV development suitability in the Kubuqi Desert has been particularly noticeable since 2020, consistent with the concept of coordinated development of PV development and desert control.
Since 2020, in addition to the expansion and improvement of existing PV power stations, new PV construction areas have been distributed in areas with suitability levels of III and above (Figure 6). With the introduction of policies for mining area transformation and green mine construction, open-pit mines have been rapidly transformed into PV power stations and farmland. Therefore, new PV facilities are concentrated in the eastern part of Ordos, close to residential areas with strong PV power consumption capacity, enabling efficient peak shaving of new energy.
The spatial center of gravity of areas with suitability levels I and II has shown a trend of shifting from northeast to southwest (Figure 7). The spatial center of gravity of areas with suitability level III and above has shown a trend of first moving northeast and then southwest, with a decreasing trend of moving south in the north–south direction. The natural conditions in the western region, such as horizontal radiation and slope, are more suitable for PV power generation. The shift in the PV development spatial center of gravity to the west indicates the gradual improvement of infrastructure, helping to allocate resources to the more potential western region, thereby improving the power generation efficiency and economic benefits of PV power stations.

3.2. Spatial Distribution Characteristics of PV Development Suitability

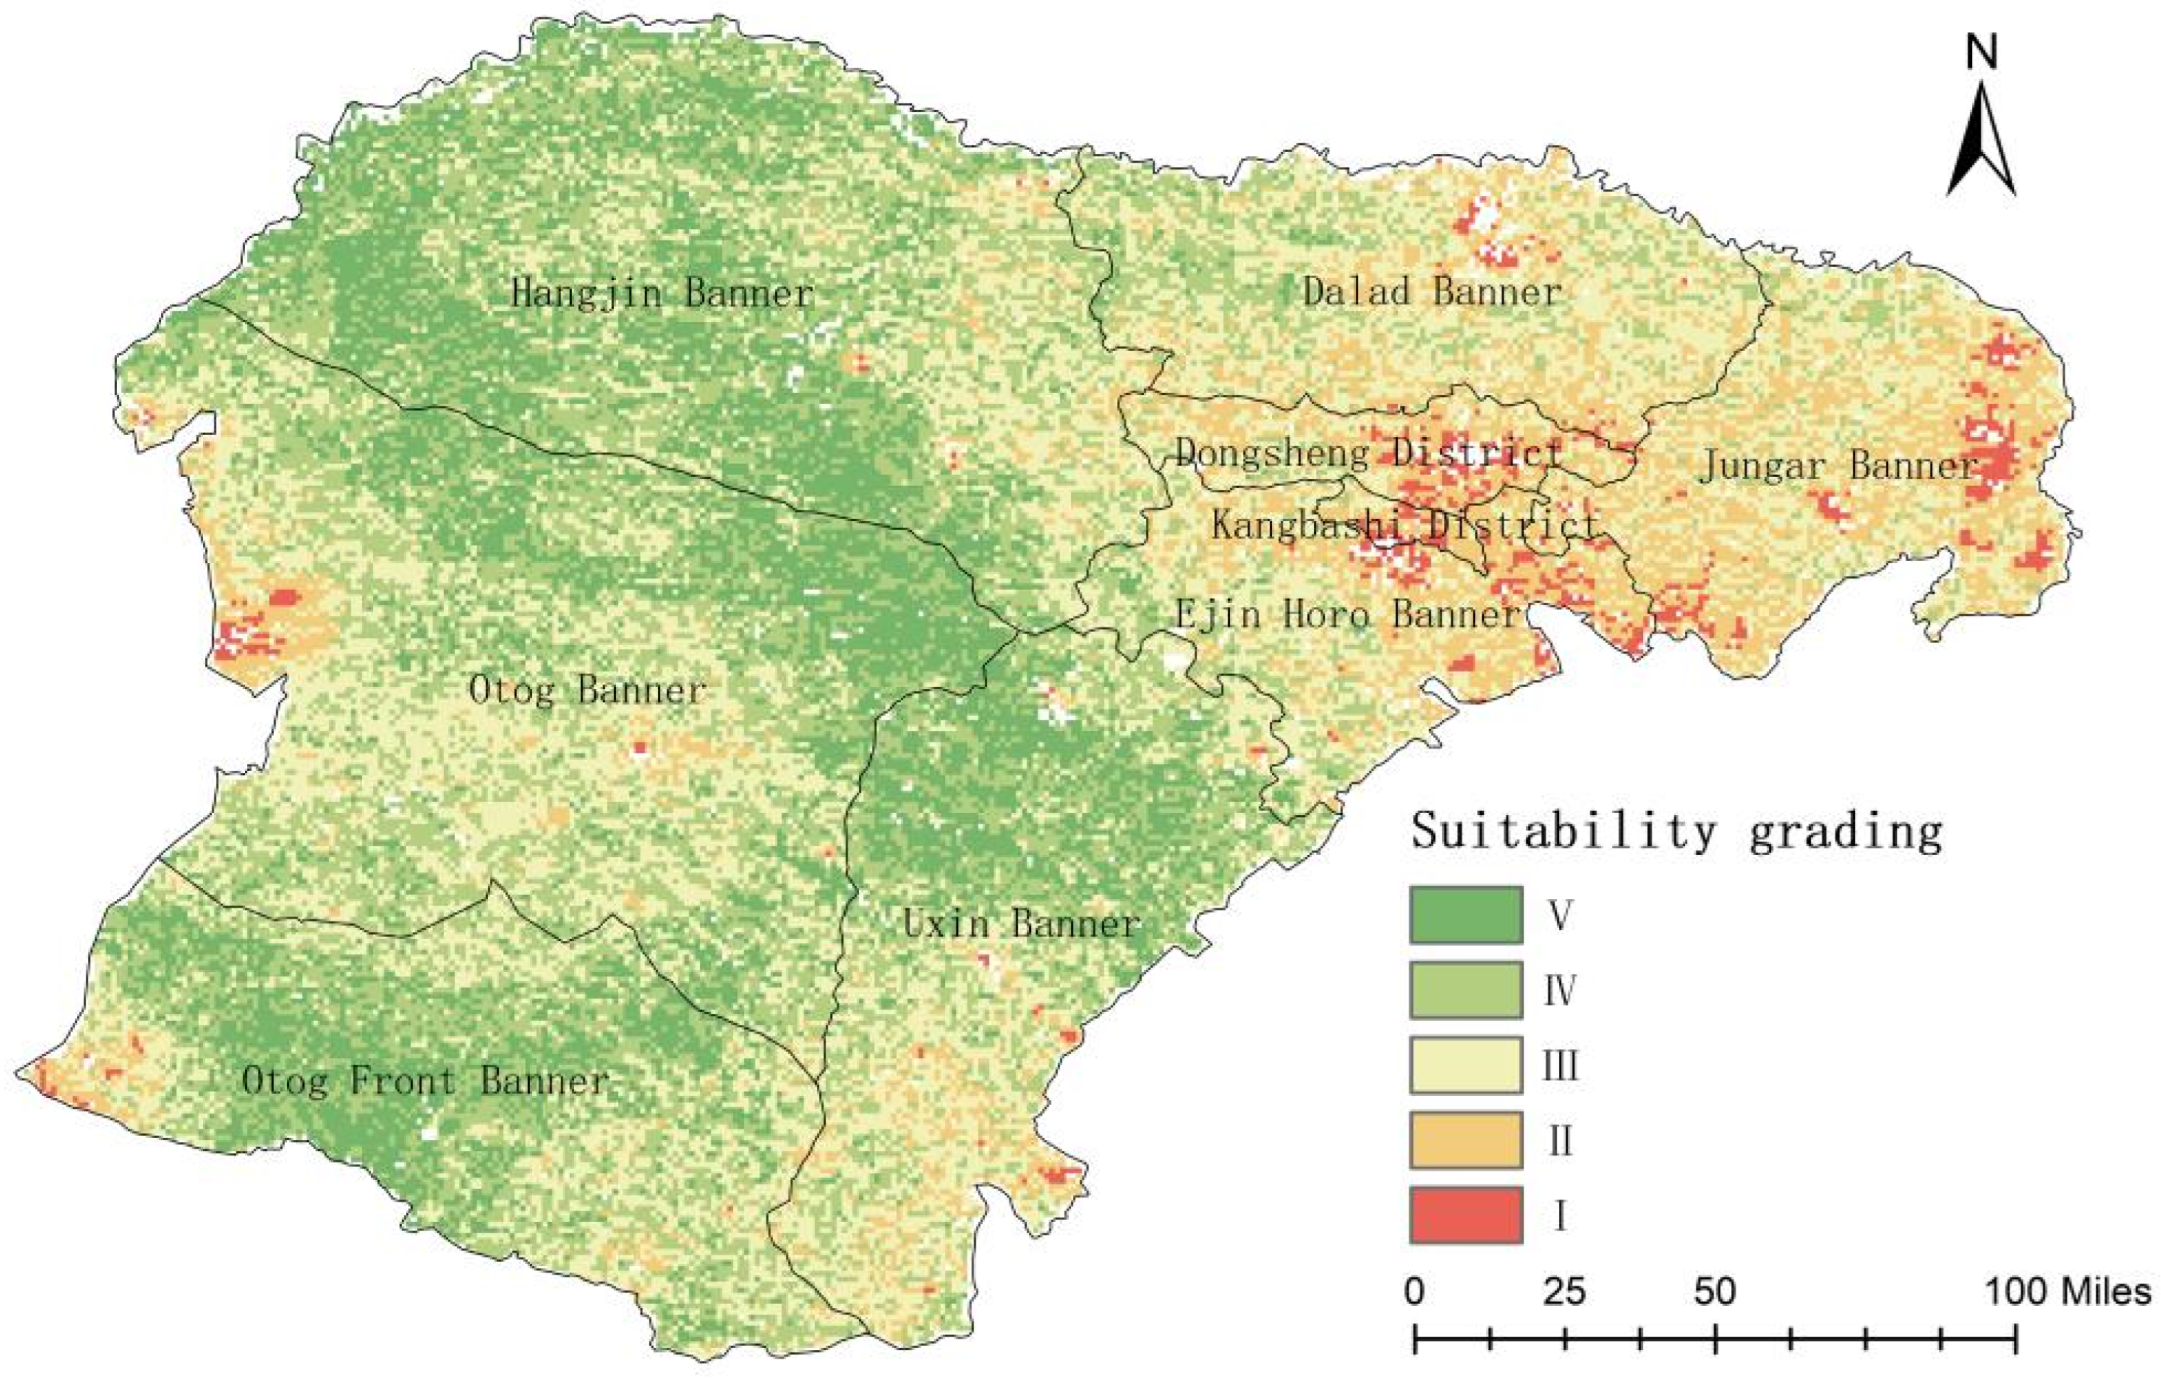
The suitable areas for PV development in Ordos City generally show a spatial distribution characteristic of low suitability in the west and high suitability in the east (Figure 8).
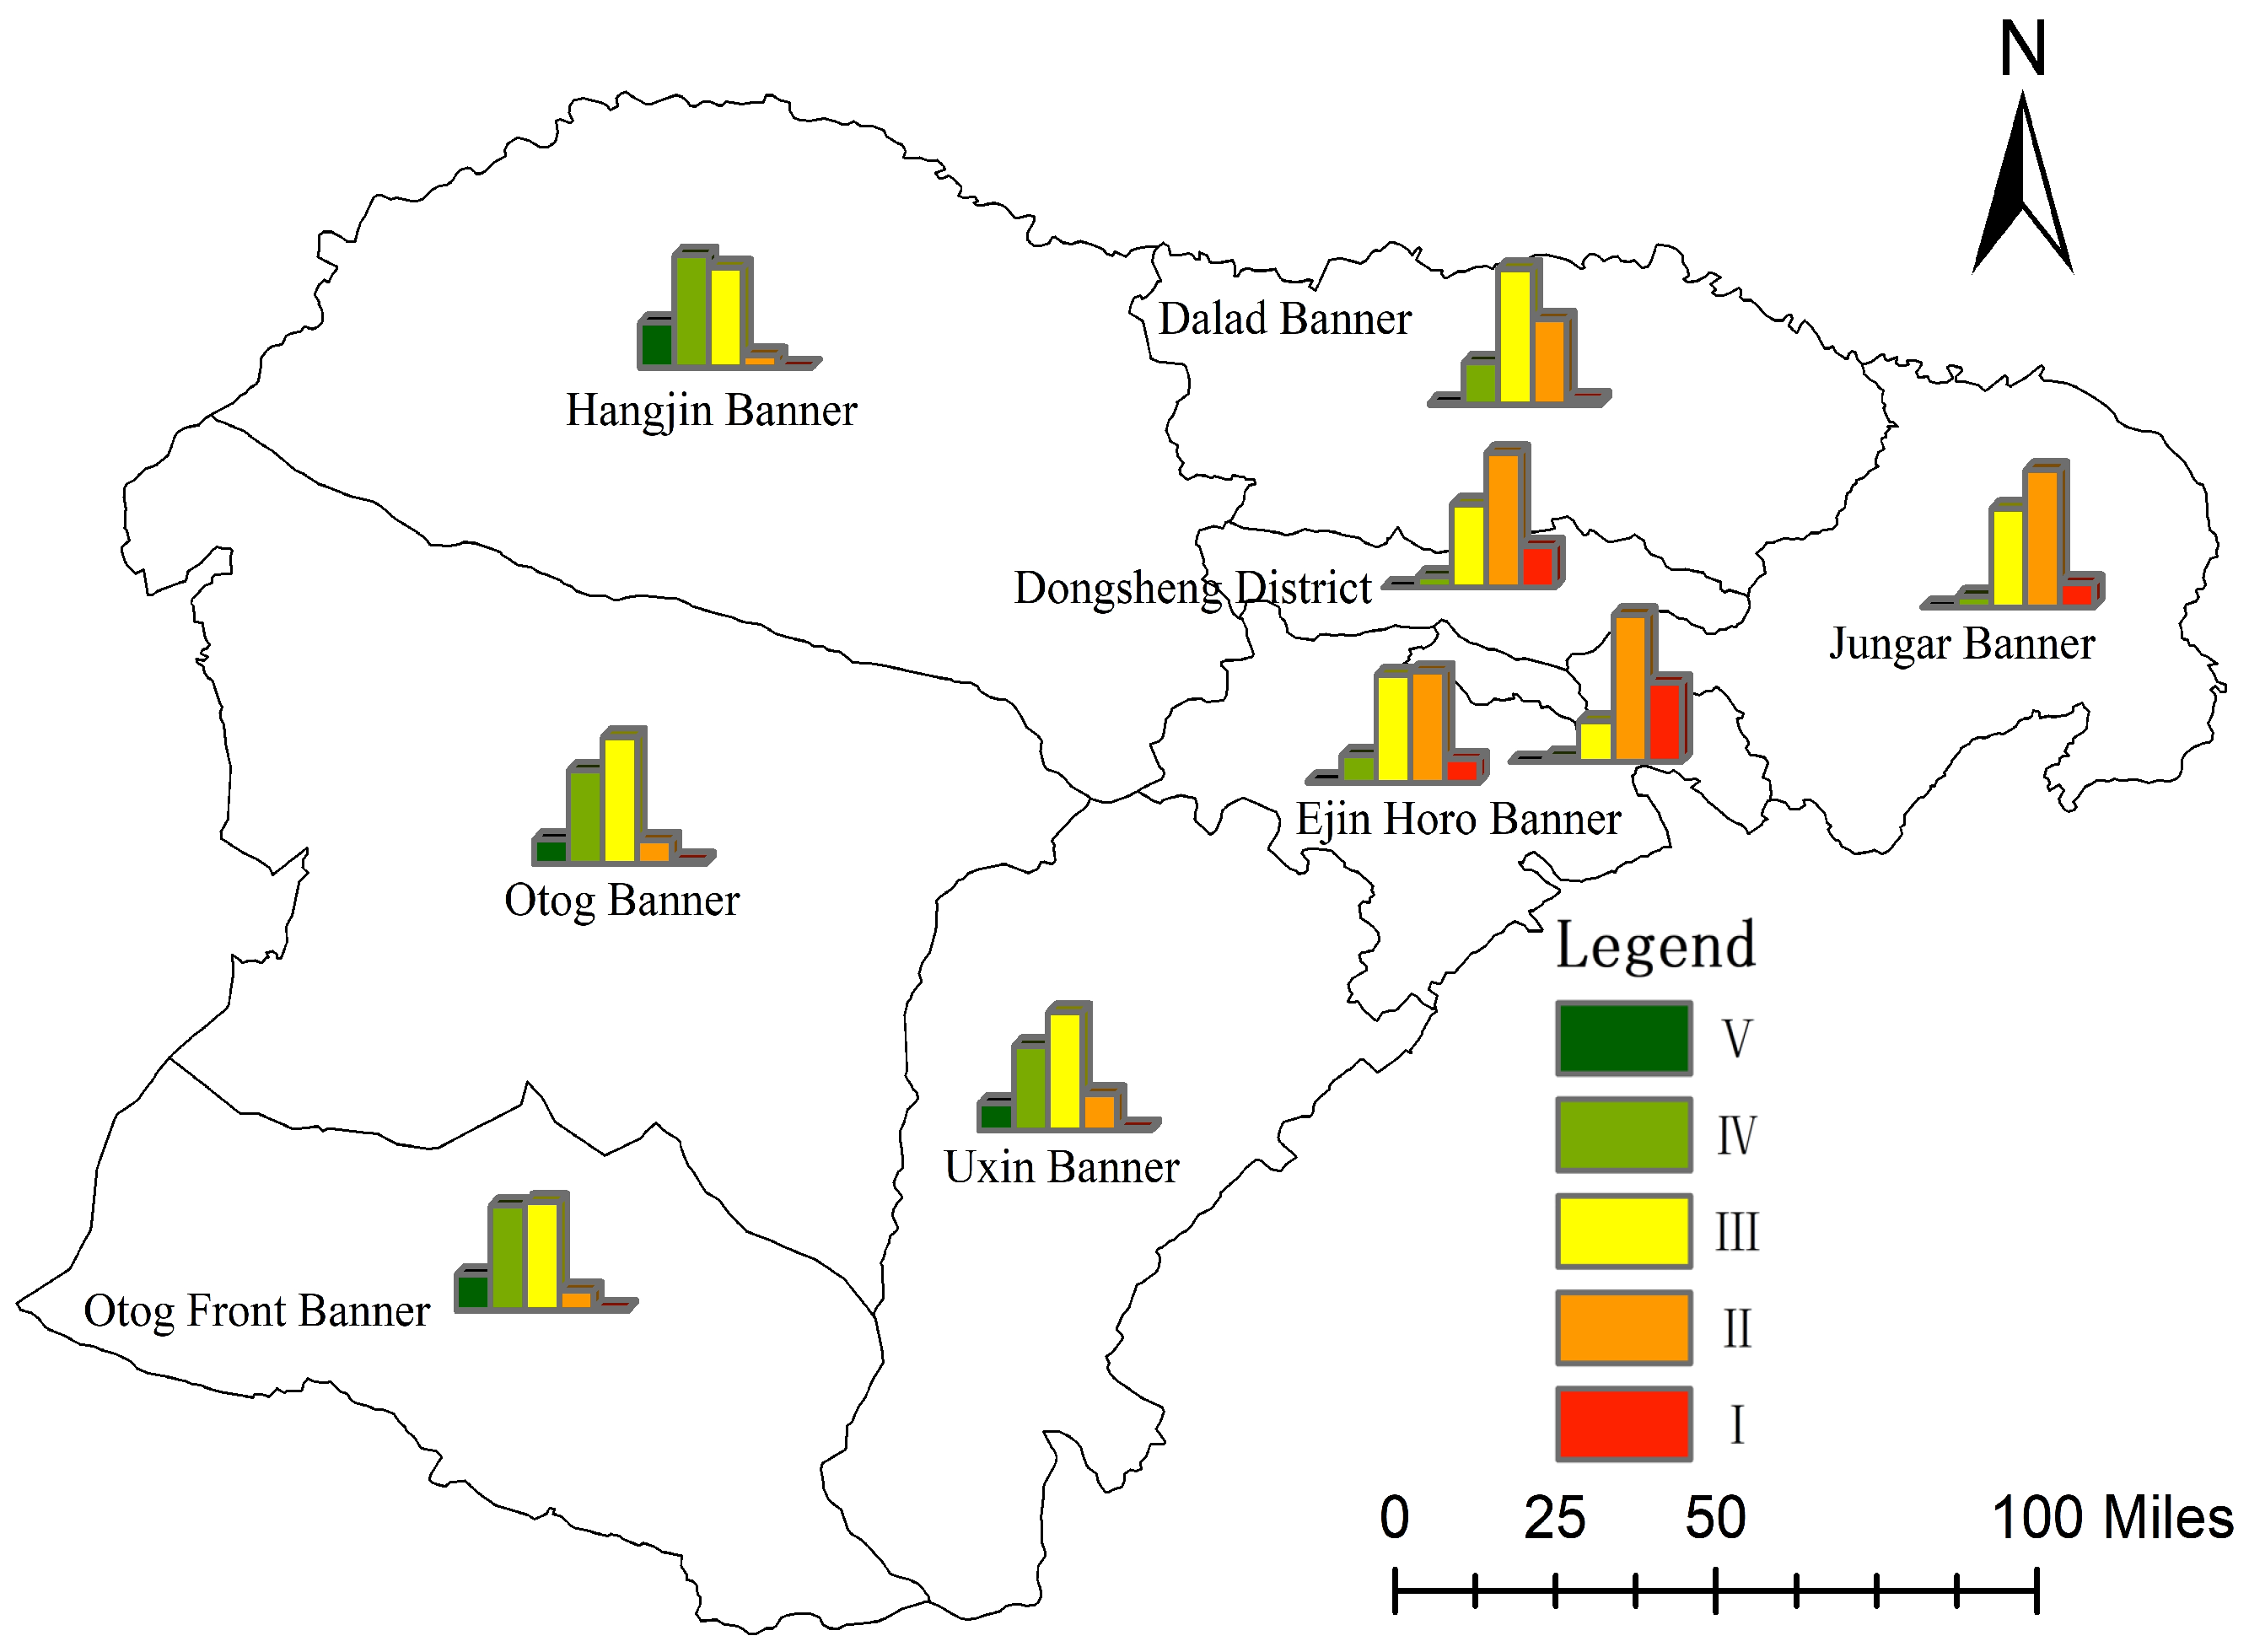
Areas with suitability level I are mainly distributed in the east, particularly around Kangbashi District and the eastern part of Jungar Banner (Figure 9). This area is mostly grassland and has sparse vegetation, accounting for 69.27%, with scattered bare land, providing excellent construction conditions. From the perspective of construction costs, this area has a dense road network, significantly reducing PV development transportation costs. The population is concentrated, and the area has a strong industrial base, with nighttime light indices 2.99 times and 10.7 times higher than those of areas with suitability levels II and III, respectively, indicating excellent local consumption capacity. From the perspective of later operation and maintenance, this area has relatively high precipitation, with an annual precipitation of about 346 mm, and dense water bodies, with the Yellow River and other rivers passing nearby, significantly reducing the maintenance and cleaning costs of PV panels. In addition to the dense road network and strong local consumption capacity, the land cover type in this area is bare land, and the total horizontal radiation (GHI) is high, so some areas in the western part of Otog Banner also have suitability level I.

4. Discussion and Conclusions

This study improves the CRITIC weighting method to optimize parameter weights, considering both the correlation and conflict between parameters during the weight calculation process. It selects multi-dimensional parameters such as meteorology, topography, environment, and society to study the spatial pattern and temporal change characteristics of PV development suitability in Ordos City. The main aim is to draw the following conclusions:
(1)
Methodological Advancement: The improved CRITIC method effectively mitigated weight bias from extreme values (e.g., reducing nighttime light weight from 0.24 to 0.14) by incorporating coefficient of variation and absolute correlation, demonstrating higher robustness in sparse-population regions.
(2)
Spatiotemporal Patterns: The proportion of suitable areas (Level III+) increased from 23.96% (2010) to 48.24% (2022), with center of spatial shifting southwestward, aligned with infrastructure upgrades and urbanization-driven energy demand.
(3)
Spatial Optimization: Level I areas clustered in eastern Ordos, benefiting from flat terrain and proximity to high-consumption zones, while western deserts exhibited potential for PV-desertification control synergy.
The suitability maps provide actionable insights for Ordos’s renewable energy zoning, facilitating its goal of achieving 50% renewable installed capacity by 2025. However, there is still room for improvement:
(1)
This study improves the CRITIC weighting method and uses it to optimize parameter weights. Based on the characteristics of the CRITIC weighting method, under the premise of a limited study area and small changes in natural conditions, it emphasizes the impact of the correlation and conflict between parameters on PV construction suitability from the perspectives of construction costs and consumption capacity.
(2)
This study only considers the impact of local consumption capacity on PV development suitability and discusses the contribution of PV power generation to power peak shaving. Given that PV power is currently mainly consumed locally and the impact of power transmission on this study is small, with high power storage costs, this study does not include the impact of power transmission and storage on PV suitability. With the restrictions on surplus power grid connection policies and the continuous improvement of power transmission lines, future research should consider the impact of such parameters on PV suitability.

Author Contributions

Investigation, L.D.; Data curation, M.W.; Methodology, Y.H.; Writing—original draft, Y.G.; Writing—review & editing, L.Z. All authors have read and agreed to the published version of the manuscript.

Funding

The primary funding for this paper is the National Natural Science Foundation of China (Grant No. W2412136). The second funding source is the National Key R&D Program of China (Project No. 2022YFC3800700).

Data Availability Statement

Data is contained within the article.

Conflicts of Interest

Author Yifei Guo was employed by Aerospace Information Research Institute, The remaining authors declare that the research was conducted in the absence of any commercial or financial relationships that could be construed as a potential conflict of interest.

References

  1. Qiang, H.; Yi, G.; Jianhua, J.; Bo, M. “Dual Carbon” Goals and China’s Clean Electricity Development Path. J. Shanghai Jiao Tong Univ. 2021, 55, 1499–1509. [Google Scholar]
  2. Sun, Y.; Gao, W.; Lu, J. New Opportunities for Photovoltaic Development under the “Dual Carbon” Goals and Its Application in Energy Networks. Digit. Commun. World 2023, 70, 124–126. [Google Scholar]
  3. Bai, R. Research and Application of “PV + Land Comprehensive Management” Model. Sol. Energy 2022, 7, 10–13. [Google Scholar]
  4. Bao, Z.; Shi, R.; Huang, Y.; Song, X. Photovoltaic Generation Potential and Developmental Suitability in Southern Hebei. Energy Rep. 2023, 9 (Suppl. S7), 795–805. [Google Scholar] [CrossRef]
  5. Miharu, N.; Takeshi, O. Assessment of Suitability for Photovoltaic Power Generation in Periurban Seminatural Grasslands: Toward the Coexistence of Seminatural Grasslands and Photovoltaic Power Generation. Discov. Sustain. 2024, 5, 141. [Google Scholar]
  6. Alexandra, V.; Monica, D.; Gheorghe, K. Site Suitability for Photovoltaic Farms and Current Investment in Romania. Renew. Energy 2022, 187, 320–330. [Google Scholar]
  7. Liu, L.; Sun, Z.; Wu, F.; Zhang, X.; Zhang, Q. Spatial Suitability and Emission Reduction Benefits of Photovoltaic Development in the Beijing-Tianjin-Hebei Region. Acta Geogr. Sin. 2022, 77, 665–678. [Google Scholar]
  8. Xu, W.; Liu, Z.; Liu, S. Suitability of Photovoltaic Development and Emission Reduction Benefits Based on Geographic In-formation Sensing and Multi-Criteria Decision Making Method—An Example from Inner Mongolia Autonomous Region. Front. Energy Res. 2023, 11, 1222306. [Google Scholar] [CrossRef]
  9. Zhang, Q.; Xin, X.; Zhang, H.; Li, Y.; Li, X.; Yi, C. Suitability Analysis of Photovoltaic Power Plants in China Using Remote Sensing Data and Multi-criteria Evaluation. J. Geo-Inf. Sci. 2018, 20, 119–127. [Google Scholar] [CrossRef]
  10. Liu, W.; Guo, D.; Xu, Y.; Cheng, R.; Wang, Z.; Li, Y. Reliability Assessment of Power Systems with Photovoltaic Power Stations Based on Intelligent State Space Reduction and Pseudo-Sequential Monte Carlo Simulation. Energies 2018, 11, 1431. [Google Scholar] [CrossRef]
  11. Miao, X.; Li, J.Y.; Liu, Y.M.; Song, X.Y. Evaluation and attribution analysis of ecological vulnerability in Ordos City. J. Northwest Coll. For. 2023, 38, 168–173. [Google Scholar]
  12. Liu, L. GLC_FCS30D: 1985-2022 Global 30 m Fine Land Cover Dynamic Monitoring Dataset; International Research Center of Big Data for Sustainable Development Goals: Beijing, China, 2023. [Google Scholar]
  13. Louwen, A.; van Sark, W.G.J.H.M.; Faaij, A.P.C.; Schropp, R.E.I. Re-assessment of net energy production and greenhouse gas emissions avoidance after 40 years of photovoltaics development. Nat. Commun. 2016, 7, 13728. [Google Scholar] [CrossRef] [PubMed]
  14. Modi, V.V.; Patel, K.S. Performance evaluation of agrivoltaic system for the synergy among greengram (Vigna radiata L. Wilczek) production and solar electric power generation. Energy Sci. Eng. 2024, 12, 5385–5397. [Google Scholar] [CrossRef]
  15. Marrou, H.; Wery, J.; Dufour, L.; Dupraz, C. Productivity and Radiation Use Efficiency of Lettuces Grown in the Partial Shade of Photovoltaic Panels. Eur. J. Agron. 2013, 44, 54–66. [Google Scholar] [CrossRef]
  16. Aydi, A. Evaluation of groundwater vulnerability to pollution using a GIS-based multi-criteria decision analysis. Groundw. Sustain. Dev. 2018, 7, 204–211. [Google Scholar] [CrossRef]
  17. Peng, S.; He, J.; Liu, T.; Li, B.; Su, S.; Zhuang, J. Evaluation of Distributed Photovoltaic Potential on Urban Roofs Based on Satellite Images. Acta Energiae Sol. Sin. 2024, 45, 517–526. [Google Scholar] [CrossRef]
  18. Li, Y.; Zhou, J.; Feng, Z. Location of Mountain Photovoltaic Power Station Based on Fuzzy Analytic Hierarchy Process—Taking Longyang District, Baoshan City, Yunnan Province as an Example. Sustainability 2023, 15, 16955. [Google Scholar] [CrossRef]
  19. Bahaa, E.; Mamdooh, A.; Reda, A.H.M.; Zalhaf, A.S. A Suitability Mapping for the PV Solar Farms in Egypt Based on GIS-AHP to Optimize Multi-Criteria Feasibility. Ain Shams Eng. J. 2022, 13, 101618. [Google Scholar]
  20. Foad, M.; Masoud, M.; Ioannis, K.; Shafizadeh-Moghadam, H.; Hosseini, S.A. Rural Electrification in Protected Areas: A Spatial Assessment of Solar Photovoltaic Suitability Using the Fuzzy Best Worst Method. Renew. Energy 2021, 176, 334–345. [Google Scholar]
  21. Magalhães, I.B.; de Barros Nogueira, G.C.C.; Alves, I.S.L.; Calijuri, M.L.; Lorentz, J.F.; Alves, S.D.C. Site Suitability for Photovoltaic Energy Expansion: A Brazilian’s High Demand States Study Case. Remote Sens. Appl. Soc. Environ. 2020, 19, 100341. [Google Scholar] [CrossRef]
  22. Liang, L.; Chen, Z.; Chen, S.; Zheng, X. Evaluation of Site Suitability for Photovoltaic Power Plants in the Beijing-Tianjin-Hebei Region of China Using a Combined Weighting Method. Land 2023, 13, 40. [Google Scholar] [CrossRef]
  23. Hassim, L.; Coetzee, S.; Rautenbach, V. Electricity Infrastructure Planning: Evaluating Solar Potential Assessments for Informal Settlements Using GRASS and Freely Available Data. Int. Arch. Photogramm. Remote Sens. Spatial Inf. Sci. 2018, XLII-4/W8, 69–76. [Google Scholar] [CrossRef]
  24. Salah-Eddine, A.; Ahmed, M.A.; Samir, T.; Dekhissi, H. A Multi-Scenario Site Suitability Analysis to Assess the Installation of Large Scale Photovoltaic-Hydrogen Production Units. Case Study: Eastern Morocco. Energy Convers. Manag. 2023, 295, 117615. [Google Scholar]
  25. Hübl, F.; Welscher, F.; Scholz, J. Multi-Criteria Decision Analysis to Evaluate the Geographic Potential of Alternative Photovoltaic Types. ISPRS Int. J. Geo-Inf. 2024, 13, 269. [Google Scholar] [CrossRef]
  26. Xu, W.; Liu, Z. Research on Spatial Suitability and Emission Reduction Benefits of Photovoltaic Development in Inner Mongolia. Arid Land Geogr. 2024, 47, 684–694. [Google Scholar]
  27. Hinestroza-Olascuaga, L.M.; Carvalho, P.M.S.; Jesus, C.M. Using a Multi-Criteria Model to Assess the Suitability of Potential Sites to Implement Off-Grid Solar PV Projects in South America. Sustainability 2021, 13, 7546. [Google Scholar] [CrossRef]
  28. Yi, S. Spatial Distribution of Solar Energy in China and Comprehensive Potential Evaluation of Regional Development and Utilization. Master’s Thesis, Lanzhou University, Lanzhou, China, 2014. [Google Scholar]
  29. Wu, W.; Chen, H.; Li, C.; Lu, G.; Ye, D.; Ma, C.; Ren, L.; Li, G. Assessment of the ecological and environmental effects of large-scale photovoltaic development in desert areas. Sci. Rep. 2024, 14, 22456. [Google Scholar] [CrossRef] [PubMed]
  30. Gel, M. Research on Low-Carbon Development Potential in Western Mongolia Based on the Suitability of Photovoltaic Land Development. Master’s Thesis, Inner Mongolia Normal University, Hohhot, China, 2023. [Google Scholar] [CrossRef]
  31. Kawase, M.; Okajima, K.; Uchiyama, Y. Evaluation of Potential Geographic Distribution for Large-Scale Photovoltaic System in Suburbs of China. J. Renew. Energy 2013. [Google Scholar] [CrossRef]
  32. Zhou, Q.; Zhou, T. Comprehensive Evaluation Model and Application of Provincial Ground Photovoltaic Development Potential. Electr. Power Sci. Eng. 2024, 40, 28–38. [Google Scholar]
  33. Qu, Z.; Yang, S.; Xiao, J. Current Status and Potential Analysis of Photovoltaic Power Station Construction in Northwest China under the Dual Carbon Background. Arid Zone Resour. Environ. 2024, 38, 20–26. [Google Scholar] [CrossRef]
  34. Zhang, H.; Tian, P.; Zhong, J.; Liu, Y.; Li, J. Mapping Photovoltaic Panels in Coastal China Using Sentinel-1 and Sentinel-2 Images and Google Earth Engine. Remote Sens. 2023, 15, 3712. [Google Scholar] [CrossRef]
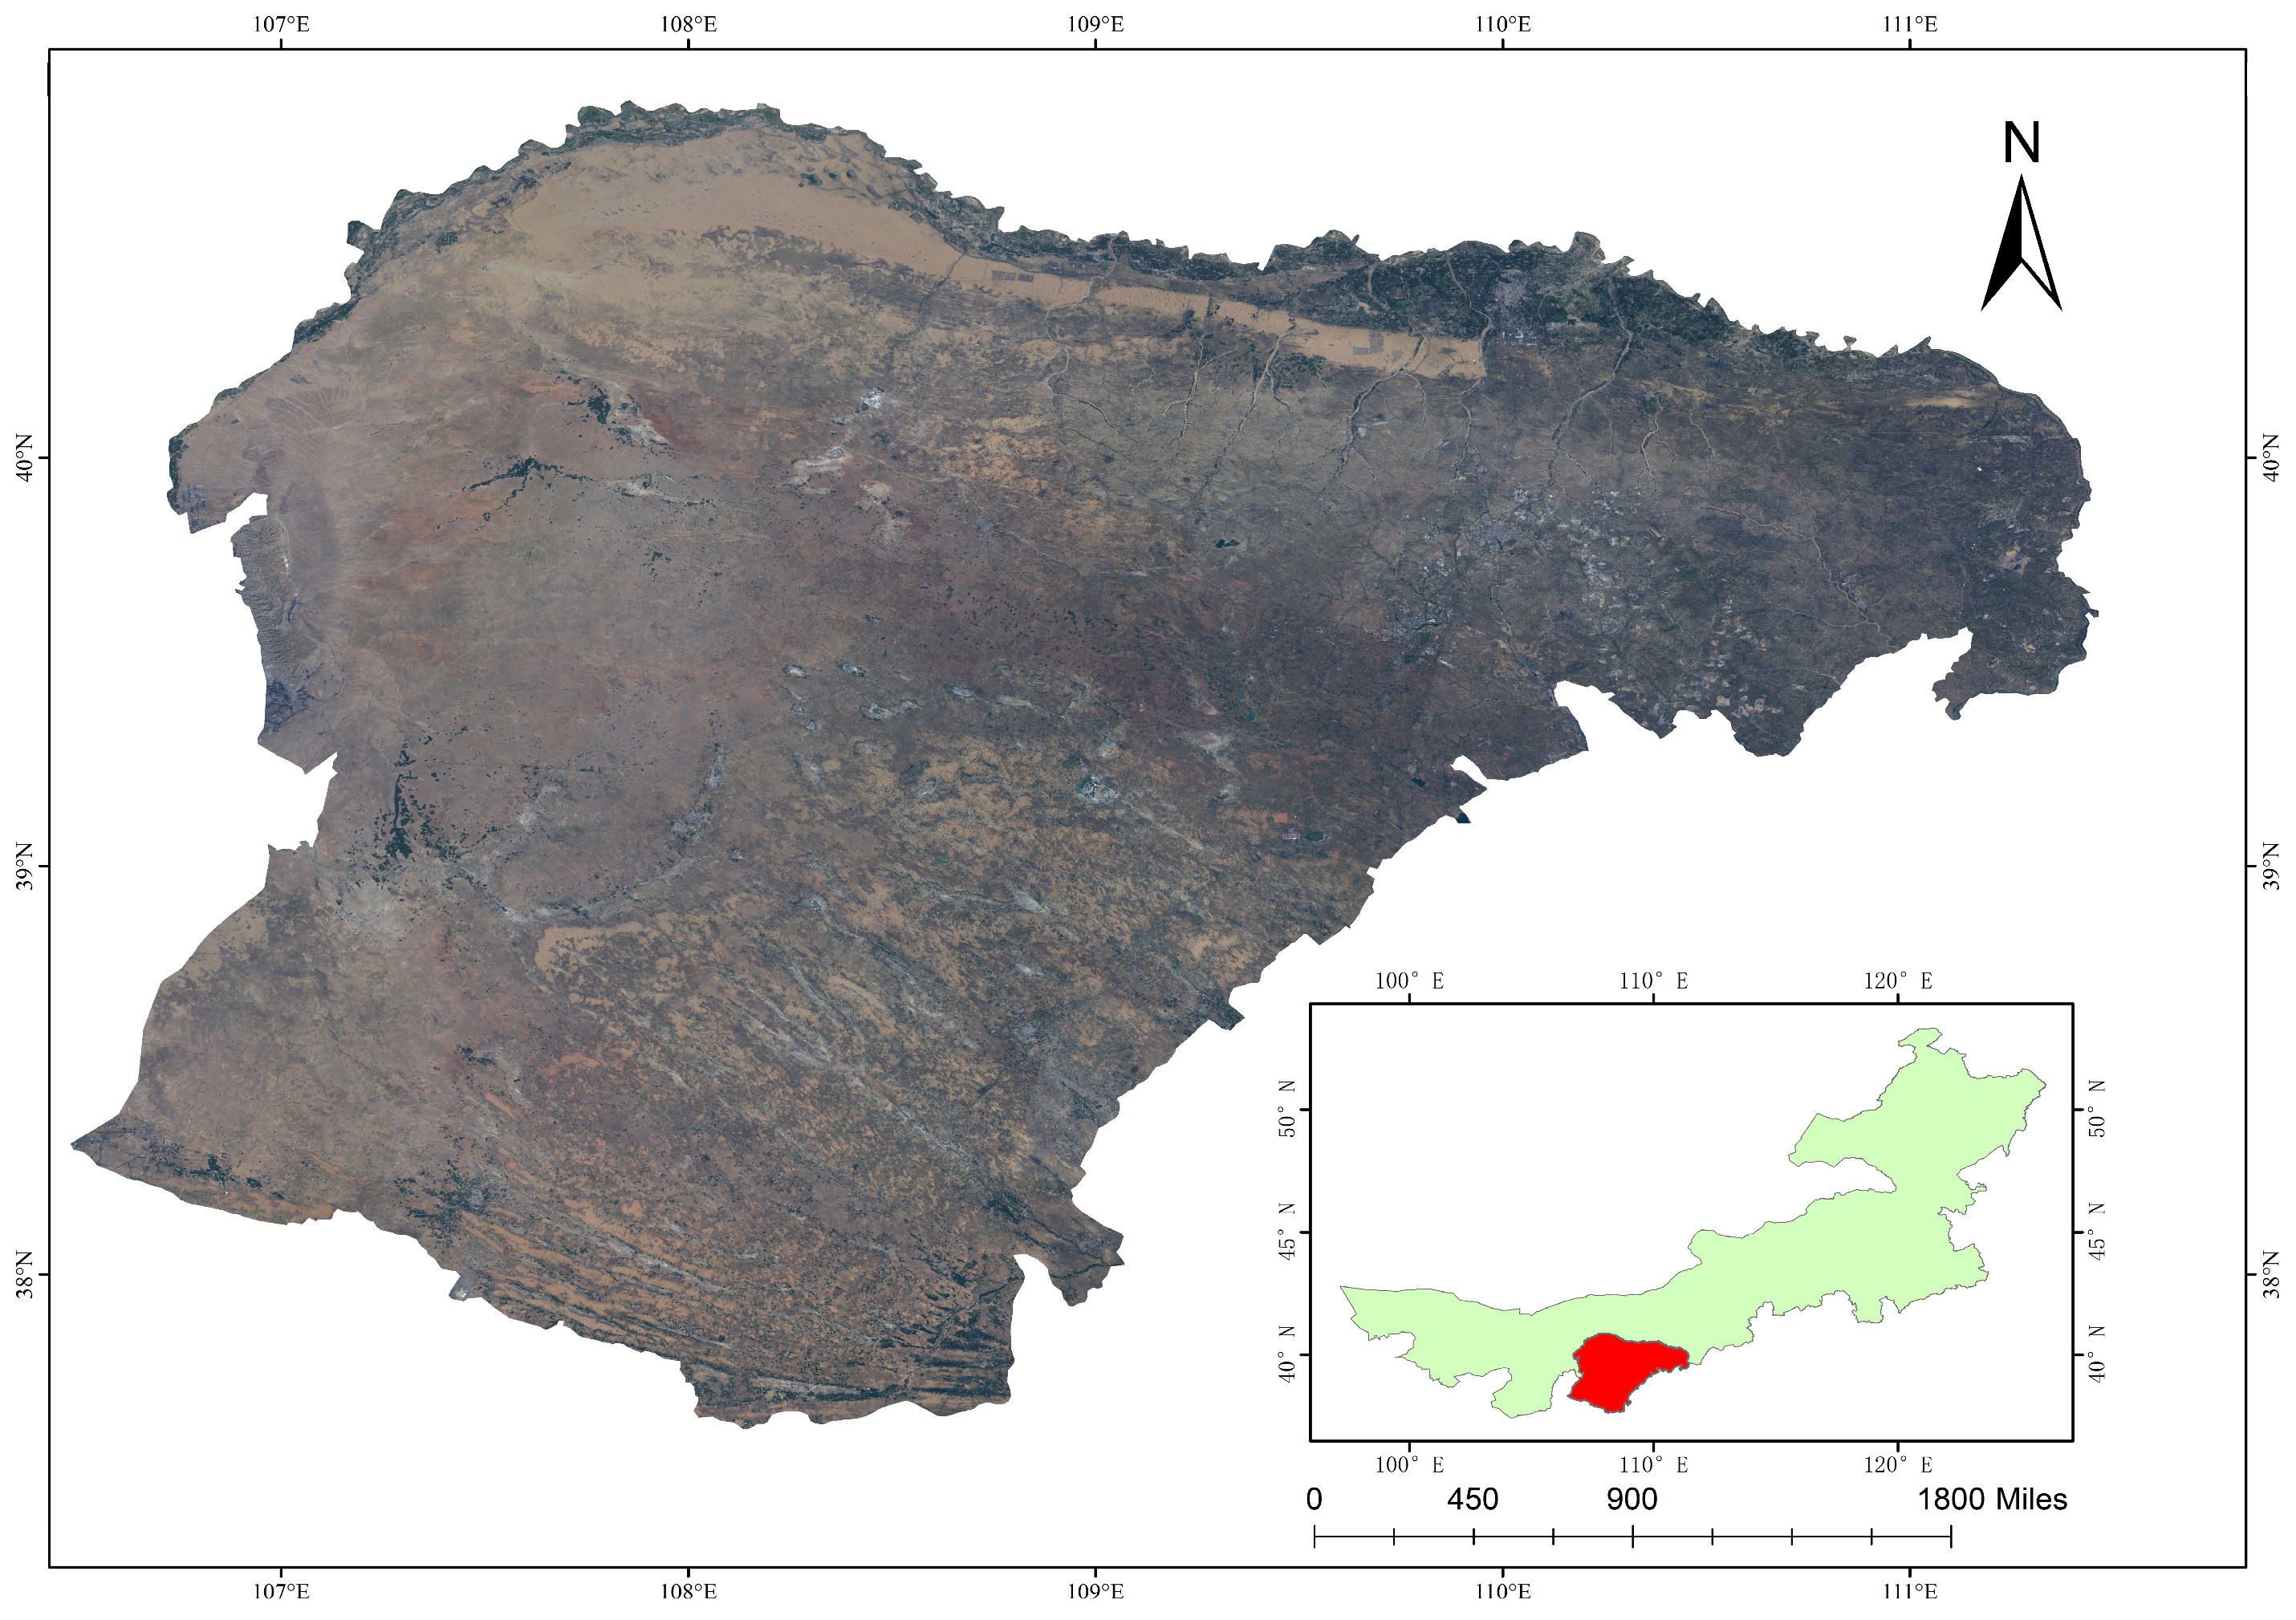
Figure 1. Landsat8 remote sensing image of Ordos City in 2022 (Band 2/3/4).
Land 14 00742 g001
Figure 2. The suitability of photovoltaic development and the current situation of photovoltaic land use are relatively well verified.
Land 14 00742 g002
Figure 3. The suitability of photovoltaic development and the distribution of existing photovoltaic power stations in Ordos in 2020.
Land 14 00742 g003
Figure 4. Change in the proportion of suitable areas for photovoltaic development from 2010 to 2022.
Land 14 00742 g004
Figure 5. The (ad) is the distribution map of photovoltaic development in Ordos in 2010, 2015, 2020, and 2022.
Land 14 00742 g005
Figure 6. Location of new photovoltaic facilities after 2020.
Land 14 00742 g006
Figure 7. Transfer trend of the suitable spatial center of gravity of photovoltaic construction in Ordos.
Land 14 00742 g007
Figure 8. Spatial distribution map of the suitability of photovoltaic land development in Ordos City in 2022.
Land 14 00742 g008
Figure 9. Spatial distribution bar chart of the suitable area of photovoltaic development in each district flag of Ordos in 2022.
Land 14 00742 g009
Table 1. Data sources and preprocessing methods.
Data NameProcessing MethodResolutionData Source
Slope, AspectGenerated from DEM90 MGeospatial Data Cloud
GHIMasked and resampled to raster data250 MWorld Bank Group
Land Cover TypeMasked and extracted from raster data30 MInstitute of Remote Sensing and Digital Earth, Chinese Academy of Sciences [12]
PM2.5, NO2Masked and resampled to raster data1000 MNational Tibetan Plateau Data Center
Distance to Roads, Rivers, Residential AreasEuclidean distance analysis using OSM data250 MOpen Street Map Database
Precipitation, Wind Speed, TemperatureKriging interpolation using ArcGIS500 MNational Centers for Environmental Information
Nighttime LightMasked and resampled to raster data1000 MHarvard Dataverse
NDVICalculated using LANDSAT5, 830 MGoogle Earth Engine
Table 2. Weight comparison of the CRITIC method calculation before and after improvement.
Data NameWeights (Pre-Improvement/Post-Improvement)Data NameWeights (Pre-Improvement/Post-Improvement)
Aspect0.09/0.08Distance to Roads0.02/0.04
Slope0.04/0.05PM2.50.07/0.07
Temperature0.08/0.08NO20.11/0.09
GHI0.07/0.08Distance to Residential Areas0.03/0.05
Precipitation,0.07/0.07Land Cover Type0.04/0.05
Wind speed0.06/0.07Nighttime Light0.24/0.14
Distance to Rivers0.06/0.07NDVI0.04/0.05
Disclaimer/Publisher’s Note: The statements, opinions and data contained in all publications are solely those of the individual author(s) and contributor(s) and not of MDPI and/or the editor(s). MDPI and/or the editor(s) disclaim responsibility for any injury to people or property resulting from any ideas, methods, instructions or products referred to in the content.