Abstract
Accurate, real-time, and multi-scale soil water content (SWC) monitoring is crucial for understanding terrestrial energy, water, and nutrient cycles. This study assesses the potential of a portable cosmic-ray neutron sensor (CRNS) backpack for measuring SWC in a Mediterranean mountain agroforestry system. Seven field surveys were conducted in northern Spain, covering nine control points under woodland and cropland. CRNS data were compared with in situ SWC measurements from an SM-200 field probe and the NDMI index derived from Sentinel-2 imagery. The results show that the CRNS backpack effectively captures spatial and temporal SWC variations. The CRNS method demonstrated advantages over point-scale sensors by providing integrated measurements at an intermediate scale, while Sentinel-2 data offered valuable insights into moisture variability through vegetation response. The moderate correlations observed among the three methods highlight the complementarity of these approaches for soil moisture monitoring in heterogeneous landscapes. This work underscores the potential of mobile CRNS sensor as a practical tool for field-scale SWC assessment in Mediterranean mountain agroforestry systems, offering new opportunities for cropland and water management in similar landscapes.
1. Introduction
Currently, approximately two thirds of freshwater use by humans are devoted to agricultural production. As such, an expansion of agricultural activity will place additional pressure on freshwater resources. The incorporation of novel soil moisture sensing technologies into agricultural practices adds the potential to make agriculture more precise, thus increasing water use efficiency.
Soil water content (SWC) plays a key role in the decline in soil functions, including productivity and stability, leading to loss of nutrients, soil compaction, and soil productivity. Sustaining agricultural productivity requires the efficient management of agricultural water resources, which involves a clear understanding of the temporal dynamics and spatial variability in the SWC. As our climate changes, SWC availability is becoming more variable [1]. Accurate information of spatial and temporal variations in SWC is central for understanding land surface processes and their management.
The water content stored in soils is determined by climate (precipitation and temperature), soil physical properties, the type of vegetation cover, or the topography position within the landscape, among other factors [2]. Antecedent soil moisture, defined as the amount of water present in the soil before a precipitation event, can be one of the most important factors controlling hydrological response and erosive processes, affecting runoff and soil loss in agroforestry systems [3].
The field measurements of SWC are restricted to discrete data at specific locations. However, since the representative volume of point-scale SWC measurements is very small, which may affect spatial variability assessments, multiple measurements must be collected within a given area to minimize spatial and temporal variations and obtain a valid SWC estimate, making it costly and time-consuming. In recent years, developments in remote sensing satellite technology have offered a number of techniques for estimating SWC across a wide area continuously over time, providing an advantage over conventional data collection methods [4]. However, the depth measurement of many of these methods is still limited to the upper soil and the spatial and temporal resolution is rather coarse, e.g., [5].
Remote sensing techniques utilize different wavelengths of the electromagnetic spectrum, including thermal infrared, near infrared, and microwave radiation, offering unique advantages and limitations for soil moisture assessment [6]. In the past two decades, microwave radiation remote sensing has proven successful for inferring soil moisture information by estimating the dielectric properties of soil particles based on land surface emissivity [7], as dielectric permittivity increases with soil moisture [8]. Remote sensing does not measure SWC directly; therefore, mathematical models that describe the association between the measured signal (index) and SWC need to be derived [9]. Several remote sensing instruments, satellite radiometers, and radars were placed in orbit in the recent years for the global monitoring of near-surface SWC (0–5 cm). The Soil Moisture Active Passive (SMAP) and Soil Moisture and Ocean Salinity (SMOS) products are currently providing data related to soil moisture at a global scale at 2–3-day intervals; however, the resolution is still coarse (from 35 to 60 km). Recent satellite missions from the ESA (European Space Agency) Copernicus program have led to an enormous increase in the available Earth observation data. This introduces new opportunities for analyzing data with a higher spatial and temporal resolution for different applications, e.g., [10].
Recently, a technique that intends to bridge the scale gap between point measurements of SWC and remote sensing is the use of cosmic-ray neutron sensors as indicators of soil moisture, e.g., [11,12,13,14,15]. The SWC information derived from cosmic-ray neutron sensors (CRNSs) provides unrivalled advantages for the effective measurement of SWC at the field scale, being more representative than in situ point data. This is a unique and increasingly accepted method with low maintenance, non-invasiveness, and continuous measurements. The method uses the information of neutrons induced by cosmic radiation, which are very sensitive to hydrogen. In addition, other proximal sensing techniques, such as gamma-ray spectroscopy, have been increasingly applied to soil moisture estimation in recent years, showing promising potential to complement CRNSs.
The cosmic-ray neutron sensing method promises to close the gap between point-scale field sensors and remote sensing observations [16]. However, further research is needed to improve SWC assessment. While CRNSs offer significant advantages for intermediate scale estimation, it also has some limitations. It is sensitive to hydrogen from all sources, including soil organic matter, vegetation, and atmospheric water, which can introduce uncertainties. Local calibration is necessary to account for variations in soil composition, bulk density, and environmental conditions. Studies in semiarid and Mediterranean environments [14] highlight how soil properties and land use influence neutron moderation. In Spain, CRNS research remains limited [15,17,18], and further studies are needed to refine calibration strategies particularly in landscapes with complex topography, heterogeneous land cover, and variety of soil types as those found in some Mediterranean mountain agroecosystems.
This research examines the potential use of portable CRNSs for estimating soil water content, exploring the factors related to the temporal and spatial variations in SWC. We aim to derive SWC and evaluate the effectiveness of this cutting-edge technology in a representative Mediterranean mountain agroforestry system. To this purpose, seven field surveys are conducted under wet and dry conditions along a hillslope in nine control points with different soil characteristics and land use. In addition, in situ SWC data are measured with a field probe and multi-temporal remote sensing products are derived from Sentinel-2 to infer information related to soil moisture at the study site. This study uses the state-of-the-art CRNS technique [14] to obtain SWC at the intermediate scale not applied before in Spain.
2. Materials and Methods
2.1. Study Area, Sampling Design, and Analysis
The study site is located in a representative Mediterranean mountain agroforestry system in northern Spain (UTM 31T 295336.63 m E, 4656517.31 m N). The area presents a heterogeneous landscape combining rainfed croplands, shrublands, and Mediterranean woodlands, resulting from long-standing traditional land management. Croplands are mainly cultivated with winter barley using traditional tillage. The climate is Mediterranean continental, with a mean annual precipitation of 460 mm, mostly concentrated in spring and autumn with dry summers. A south-facing slope with different land use and soil types was selected to conduct a total of seven field surveys with a portable ‘backpack’ cosmic-ray neutron. The field-work extended from May to August 2018, to capture the most contrasting soil moisture conditions, as spring and summer exhibit the strongest wet and dry variations in the study area. For each field survey, nine control points were strategically selected along a toposequence transect following the maximum slope gradient to capture variations in land use and topographic conditions. According to land use, five points were under woodland (points 1, 2, 3, 4, and 6) and four were in croplands (points 5, 7, and 9) (Figure 1). Soils under woodlands, developed on Muschelkalk limestones, are mainly Leptosols, while soils of croplands are mainly Regosols, developed on marls and claystone formation (Keuper facies).
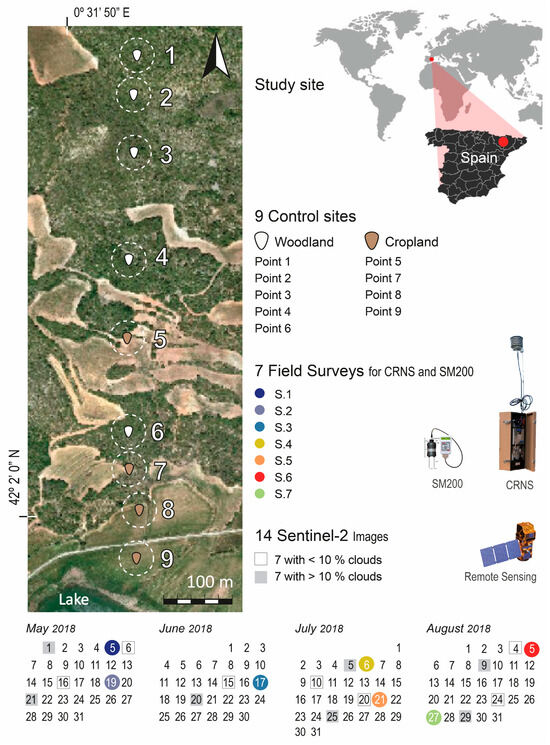
Figure 1.
Study area and location of the 9 control sites and dates of the 7 surveys of CRNSs, SM200, and of 14 images collected from Seninel-2.
The first three CRNS surveys took place during spring with very wet soils in May (surveys S1 and S2) and June (S3). The following four surveys were performed in summer, under very dry conditions in July (S4, S5) and August (S6), while the last survey was in the second half of August (S7) after few days of isolated storms. Daily precipitation records (mm) were obtained from a meteorological station located in Benabarre, which is approximately 5 km northern direction from the study area. In addition, soil properties such as soil organic carbon (SOC), grain size, lattice water, and bulk density were measured to characterize the soil profile at each control point and process the neutron counts recorded with the CRNSs. SOC was determined using a LECO RC612 carbon analyser (LECO Corporation, St. Joseph, MI, USA), the lattice water content was determined by weight loss after heating at 1000 °C in a muffle furnace following prior drying steps to remove free water and organic matter, and grain size distribution was analyzed using a Beckman Coulter LS 13 320 laser diffraction particle size analyzer (Beckman Coulter, Miami, FL, USA).
For each field survey, additional information of volumetric soil water content measurements was taken using a field sensor Theta probe SM-200 (Soil Moisture, Delta-T Devices Ltd., Cambridge, UK) to record the site variability in SWC over 0 to 5 cm depth around each control point. Triplicate measurements in 10 different points randomly distributed within a 5 m radius circumference around each control point were recorded during six surveys, obtaining 1620 in situ SWC data, since in the last survey (S7: 24 August 2018) these data could not be collected due to technical problems of the Delta-T field probe.
A total of 63 data of SWC(CRNS) were obtained from the 7 surveys and different statistical analysis were performed. After an exploratory analysis of the spatial and temporal variations in SWC, a generalized linear model (GLM) was used to identify the main factors that significantly affect SWC variability, and ANOVA tests to analyze the difference between the mean of SWC in different land use (woodland and cropland), as well as in wet–dry conditions. To analyze the response of the additional information obtained with the field probe and Sentinel-2 data, which is related to SWC information, the analysis of the correlation was conducted between them and the SWC obtained with CRNSs.
2.2. Portable CRNS Backpack
The CRNS backpack (Hydroinnova LLC, Albuquerque, NM, USA) was placed on the ground (1 m above surface) for 30 min at each of the nine control points, recording the site location and every minute the low-energy neutrons count, obtaining total of neutron counts higher than the minimum rate of 400 counts recommended for mobile CRNS sensors [19]. At this site, a 30-minute period resulted in approximately 900 total neutron counts, which has an uncertainty of ±30 counts (i.e., following Poisson counting statistics). A detailed description of the CRNS technique can be found in [12]. Cosmic-ray neutrons originate in space and enter the Earth’s atmosphere after penetrating through the Earth’s magnetic field and, once in the atmosphere, these primary cosmic-ray neutrons interact with atmospheric nuclei (mostly oxygen and nitrogen), which result in a cascade of secondary cosmic-ray neutrons (fast neutrons) [20,21]. These fast neutrons propagate through the atmosphere and reach the land surface, where they undergo elastic collisions with nuclei present in the soil, thereby losing energy [22]. Some of the fast neutrons are absorbed by the soil during the collision, whilst others will be scattered above the surface of the soil [23]. The cosmic-ray neutrons lose energy with each collision; therefore, high-energy neutrons become fast neutrons (in the atmosphere), which further lose energy and become thermal neutrons (in the soil).
Due to fast neutrons being strongly moderated primarily by hydrogen present in the environment, their measured intensities relate to changes in SWC as well as other hydrogen sources on the Earth’s surface [12,21]. Hydrogen, which is mainly present in water, is the most influential element in thermalizing and absorbing fast neutrons due to hydrogen’s elemental scattering cross-section [10]. The inverse relationship between neutron intensity and SWC is being used to monitor soil moisture dynamics at the field scale [11]. CRNSs have several operational advantages, which include being non-invasive, passive, and easily automated. Its applicability is not limited to estimating the content of water in soils and can be also used to measure snow depth and vegetation biomass [24]. The backpack is portable and it has minimal power requirements. The method allows for the continuous monitoring of SWC, requires low data processing, and can be used for soil moisture estimation across landscapes with only one instrument, which is essential in intricate landscapes with intermixed land uses where a rover sensor could not be used.
We applied the modified Desilets equation [25] to convert corrected neutron counts to volumetric soil water content [26]. Neutrons were corrected for variations in air pressure, high-energy intensity, atmospheric water vapor, and scaled by geomagnetic latitude [21]. The calibration function is:
where is gravimetric water content (g/g), is lattice water content (g/g), is soil organic carbon water content equivalent (g/g), N is the corrected neutron counts per hour (cph), and N0 is an instrument specific calibrated parameter that represents the count rate over dry silica soils (cph). The three constants were determined by Desilets et al. [25] from a semi-analytical solution of a neutron diffusion equation. The backpack detector used in this study was calibrated at two sites in Austria, following the procedures and with ten gravimetric surveys [19]. We note that soil bulk density and soil chemistry were only collected during the first calibration date. Using Equation (1), the backpack had N0 = 39.39 ± 1.62 cpm. This average N0 was used for the surveys in this work; however, local soil properties measured at the control points were used to estimate , and .
2.3. Satellite Imagery Data
Multispectral Sentinel-2 optical satellite data with a spatial resolution of 20 m were analyzed to obtain moisture indices at the study site over the 7 field surveys. The satellite imagery acquired is composed of 14 images available immediately before and after each of the 7 field surveys from the ESA Sentinel Scientific Data Hub (https://www.sentinel-hub.com/), which incorporates an innovative wide-swath with 13 spectral bands covering the visible, near-infrared (NIR), and short-wave infrared (SWIR) electromagnetic frequency domains, besides a high spatial and temporal resolution (10, 20, and 60 m, every 5 days in Europe). After removing the images with more than 10% of cloud cover, a total of 7 cloud-free images were selected, one image for each survey (Table 1). For this study, SENTINEL-2 Atmospheric Correction (S2AC) was selected, which is based on an algorithm proposed in Atmospheric/Topographic Correction for Satellite Imagery. The natural or real color images were obtained using bands 2 (blue), 3 (green), and 4 (red). We analyzed moisture information from optical remote sensing data using the SWIR bands of Sentinel-2, following the methodology proposed by Haubrock et al. [27], which employs a dimensionless parameter to quantify moisture data.

Table 1.
Acquisition dates and characteristics of the Sentinel-2 images selected.
The NDMI is a normalized difference moisture index that uses NIR (8A) and SWIR (11) bands to display moisture with 20 m spatial resolution [NDMI = (B8A − B11)/(B8A + B11)] calculated on the Sentinel Application Platform (SNAP) to analyze the spatial and temporal variations during the study period. The SWIR band reflects changes in both the vegetation water content and the spongy mesophyll structure in vegetation canopies, while the NIR reflectance is affected by leaf internal structure and leaf dry matter content but not by water content. The NDMI is used to monitor changes related to water content.
3. Results
3.1. Soil Properties
The nine control sites belong to two different sedimentary substrates with specific soil characteristics that define the land use. Differences in most soil properties were found between the sites under woodland and the cropland sites (Table 2). The woodland sites were generally shallow soils (27 ± 10 cm) compared to deeper cropland soils (47 ± 4 cm). Soils were stony (mean 30%) with a slightly higher content in woodland soils, which had a significantly higher mean content of soil organic carbon (SOC) (5.8%) compared to cropland soils (1.4%). The mean bulk density was 1.49 ± 0.30 g/cm3 with no significant differences but with a larger variation for Leptosols. The mean clay content was 20.5%, with a significantly higher content in cropland soils (24.4 ± 4.7%) than in woodland soils (17.4 ± 7.3%).
Table 2.
Soil properties for the 9 control points.
3.2. Rainfall Pattern
The accumulated rainfall during the study period (153 days) reached 378.2 mm. The precipitation distribution showed that most rainfall occurred at the beginning of the study period (May and first half of June), followed by 2 dry months in summer and a few isolated summer storms events in the second half of August. A total of 80% of the total rainfall amount was recorded during the prevalent wet conditions when the first three surveys were conducted (S1, S2, and S3). Dry conditions appeared during the first half of the summer, recording only 27.7 mm between surveys S4 and S6. However, in the middle of August, a total of 60 mm of rain was documented in three alternate days before the last survey (S7).
3.3. Cosmic-Ray Neutron Sensor Soil Water Content
The SWC data were bounded by a porosity estimation of approximately 0.55, based on the dry bulk density and assumed particle density = 2.65 g/cm3 (i.e., porosity = 1 bulk density/particle density). Values exceeding porosity should be bounded, as they are likely influenced by ponded water, neutron count variations, or parameter uncertainty. The effect of the small lake located at the end of the hillslope, approximately 100 m away, was rather minimal (3.2% contribution to neutron moderation for the closest site, S9) (Figure 2). To quantify this influence, the Wr function was integrated over the radio and the angle of the patch, as proposed by Schrön et al. [28]. This integration, illustrated in Figure 2, confirms that the influence of the lake is within the error range of our data and shows the decrease in sensitivity with the increase in the distance from the sensor. It is important to note that Wr accounts for reflected neutrons (i.e., neutrons with soil contact), while the sensor also detects 20–40% of direct/incoming neutrons. As a result, the actual signal drop due to the lake is even lower, at around 2%, leading to the application of a correction factor (C = 1.02). This correction was applied to neutron counts before soil water content (SWC) estimation, using the equation Ncorr = C × N. The presence of the lake within the sensor footprint moderates neutron intensity, and this correction ensures that SWC values remain accurate despite the lake’s small but measurable influence.
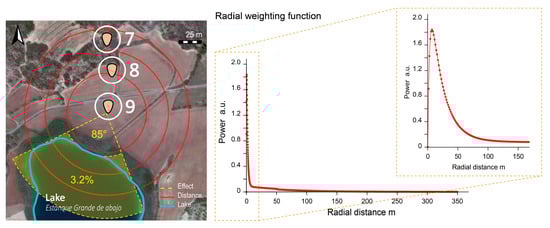
Figure 2.
Lake effect removal on the area-average measurement of cosmic-ray neutrons. Radial weighting function for the CRNS footprint. The x-axis represents radial distance (m), and the y-axis shows the weighting function (a.u.), indicating the contribution of each distance to the neutron count. The inset zooms in on the first 150 m, where most of the weighting is concentrated.
The first survey (S1: 5 May 2018) was particularly difficult, with very low counts for control points 7 and 8. The count rates were pretty low given the backpack and difficultly of site access (less than 500 counts, CV 5%). The most likely issue is the low neutron counts and uncertainty at this end of the calibration curve. A justifiable solution was to set the SWC to ~saturation (~0.55 cm3/cm3 seemed reasonable based on the bulk density). The soil water content estimated with the portable CRNS ranged from 0.06 to 0.55 cm3/cm3 (Figure 3, Table 3). The range and standard deviation of SWC were slightly lower for surveys S5, S6, and S7, in which higher counts per minute were recorded (Table 3). A general descriptive representation of SWC values for each of the nine sites along the seven surveys is presented in Figure 3.
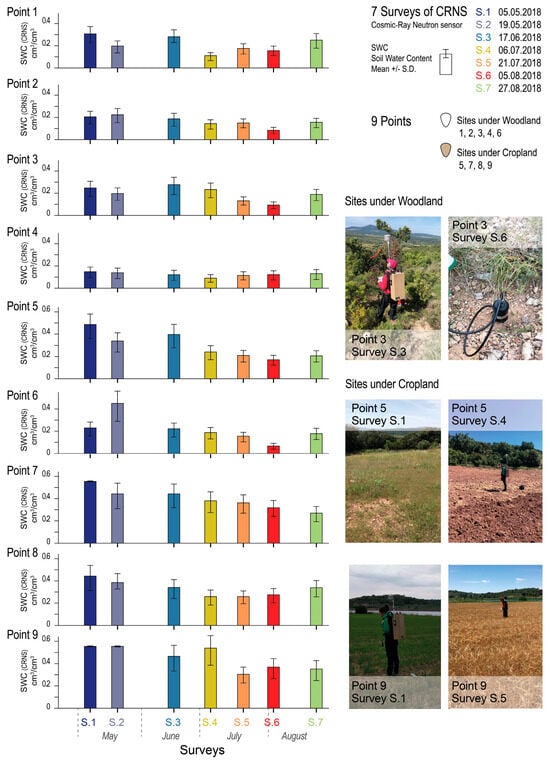
Figure 3.
Soil water content (SWC) estimated by CRNSs for each of 9 control points during 7 surveys.
Table 3.
Portable cosmic-ray neutron sensor surveys and soil water content (SWC) estimations.
Table 4 summarizes the results of the ANOVA tests assessing the temporal and spatial variability in SWC (CRNS). Table 4a evaluates SWC changes over time for each control point, identifying significant variations across surveys and between wet and dry conditions. Table 4b examines differences in SWC across control points for each survey, highlighting the influence of land use and site characteristics. Statistically significant differences (bold values) indicate the most relevant SWC variations, emphasizing the role of spatial and temporal factors in soil moisture dynamics. Overall, the SWC showed significant temporal changes for most of the sites, recording variable soil moisture fluxes over the seven surveys, although, in point 8, these variations were not significant (Table 4). The mean of SWC progressively decreased from surveys S1 to S6, to slightly increase in the last survey. However, a different behavior was observed in point 4, with an almost insignificant variation in SWC for the seven surveys. Furthermore, the high spatial variability in SWC between different sites was also observed. Soil water content in sampling points 5, 7, and 9 showed greater variability. Significant differences (p-value ≤ 0.05) were also found for SWC between the nine sites in each of the surveys (Table 4).
Table 4.
ANOVA tests of SWC(CRNS) (a) by survey date for each control point and (b) by point location for each survey. Bold numbers are significant at the 95% confidence level. Different letters indicate significant differences at the 95% confidence level.
Taking into account the spatial and temporal factors analyzed above, the generalized linear model (GLM) explained 84.4% of the SWC variance at the 95% confidence level, with a standard error of 0.07. Nearly 63% of the variation in SWC was explained by the location of the points, while the surveys explained 21% of the variance. The scatterplot graph of the observed versus predicted SWC produced by the model (Figure 4) showed a distribution in which SWC was lower for most of the points from surveys S4 to S7 and, conversely, higher for points 5, 7, 8, and 9 regardless of the survey. In addition, point 4 registered low SWC values in all surveys.
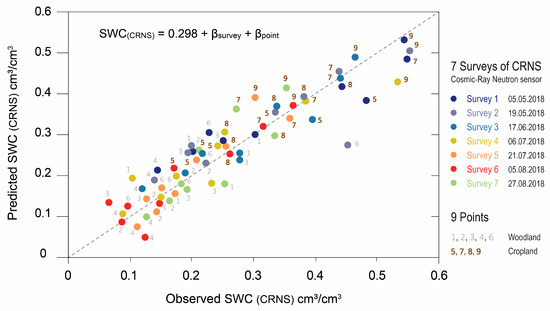
Figure 4.
Scatterplot graphs of the observed (ordinate axis) versus predicted (abscissa axis) SWC(CRNS) by the generalized linear model (GLM, 2 factors: survey date and point location). Black dotted line denotes the regression 1:1 (intercept = 0, slope = 1).
Analyzing each factor independently (Table 5), the location and characteristics of each point explained more than 80% of the SWC variability for surveys S1, S6, S4, and S2, while decreasing in surveys S5 and S3 to 69% in survey 7. On the other hand, the temporal factor represented by the seven surveys was a key factor in points 6 and 5, explaining 80 and 75% of the variance, respectively, progressively decreasing in points 1, 9, 3, and 7 below 70% until 56% in point 2. However, in points 4 and 8, the SWC was not satisfactorily explained by the temporal factor.
Table 5.
Analysis of variance of SWC(CRNS) by using the generalized linear model (GLM) for (a) each survey (factor: point location) and (b) for each control point (factor: survey dates). Bold numbers are significant at the 95% confidence level.
The control points had different land uses, which were closely related to the substrate and soil characteristics of the sites and controlled the variations in SWC. Therefore, the spatial variability in SWC between each site was examined in relation to land use. The SWC varied largely within the close distances of the sites (Figure 5). A higher variability in SWC for the seven surveys was recorded in cropland sites, while woodland sites varied less. The SWC means were significantly different between cropland sites, while apart from site 1, no significant differences were found within woodland sites. The mean value of SWC for woodland sites was significantly lower than in croplands.
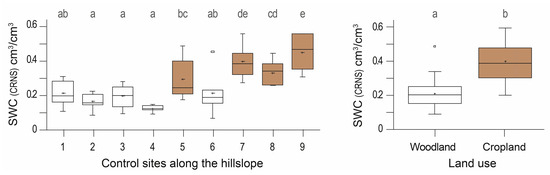
Figure 5.
Box plots showing SWC(CRNS) variations at each control site over the seven field surveys (left) and the overall SWC distribution grouped by land use (woodland: sites 1, 2, 3, 4, and 6; and cropland: sites 5, 7, 8, and 9) across all surveys (right). Different letters indicate significant differences at the 95% confidence level.
In addition, a higher SWC was recorded in all sites during the wet period. The CRNS measurements agreed with the rainfall distribution, which mostly occurred in the first part of the study period (Figure 6). The CRNS estimates clearly followed the weather pattern, showing a progressive decrease in SWC from spring to summer, though rise in SWC in survey S7 was related to the few small rainfall events that occurred before the last survey. Rainfall data were very useful for describing and complementing the changes in SWC. Significant differences in the SWC means were observed among the seven surveys. The mean of SWC was significantly higher for wet conditions against dry conditions. The SWC recorded a higher variation for surveys S1, S2, and S3, which correspond with wet conditions at the end of the spring, while a lower variability in SWC was observed for surveys S4, S5, and S6 during dry conditions in summer (Figure 6). Accounting for land use and rainfall conditions, a significantly higher SWC was recorded in cropland during the wet period, while a significantly lower SWC was observed in woodland sites compared to dry conditions.
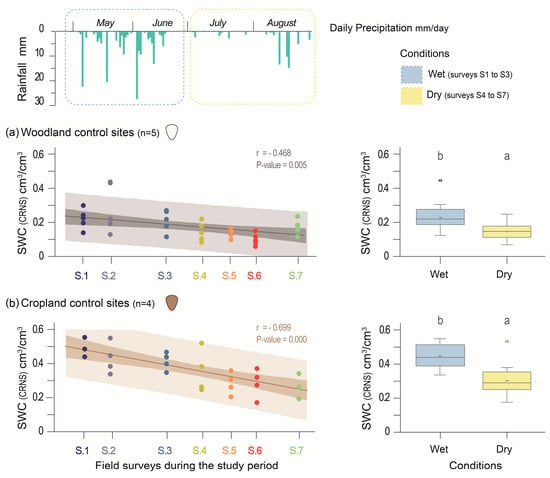
Figure 6.
Variation in SWC(CRNS) during the 7 surveys, linear regression trendline for woodland and cropland, and box and whisker plots of SWC(CRNS) between wet and dry conditions. Different letters indicate significant differences at the 95% confidence level.
3.4. Comparison of Soil Water Content Measurments
The satellite surface moisture product from Sentinel-2 was analyzed based on the spatial and temporal variations in the NDMI index (Figure 7). The Normalized Difference Moisture index was monitored during the study period, providing information for each of the seven surveys. The NDMI maps displayed many similarities to the SWC pattern estimated with CRNSs during the surveys. From survey S1 to S7, the NDMI index decreased, showing higher values during the wet period (S1 to S3) and lower ones during the dry period (S4 to S7). The relationships explored between NDMI index and the SWC estimated by CRNSs showed a low but significant correlation (r = 0.352). The results improve when distinguishing between dry and wet conditions, obtaining higher correlations between CRNS and NDMI (r = 0.485).
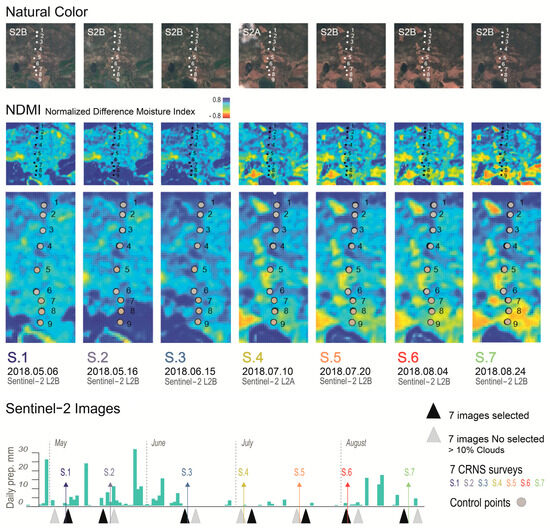
Figure 7.
Image comparison of the variations of the NDMI index between the 7 field surveys conducted during the spring and summer of 2018 at the study site.
For all sites and surveys, the soil water content estimated with the field probe (SM-200) ranged between 3 and 15%. There was a moderately strong agreement between SWC obtained with CRNSs and the SM-200 field sensor, with a relationship that was statistically significant at the 95% confidence level (r = 0.486). The graph of SWC from CRNSs (x-axis) versus SWC from SM-200 (y-axis) revealed that there were no extreme outliers and the majority of the points were above and below the 1:1 line (dotted) (Figure 8).
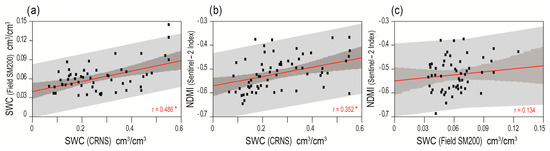
Figure 8.
Scatter plot and linear regression trendline: (a) SWC(CRNS) versus SWC (Field SM-200), (b) SWC(CRNS) versus NDMI (Sentinel-2 Index), and (c) SWC (Field SM-200) versus NDMI (Sentinel-2 Index). * indicates that the correlation is statistically significant at the 95% confidence level.
The positive y-intercept indicated that the SWC values obtained with the field probe were lower to those obtained with CRNSs. The correlations between the SWC obtained with CRNSs and the field probe (SM-200) improved for cropland soils during dry and wet conditions, up to 0.678 and 0.651, respectively, as well as for woodland soils during dry conditions (r = 0.603). However, the relationship between SWC estimated with CRNSs and the field probe (SM-200) was no significant for woodland soils during wet conditions (r = 0.226). In addition, 70% of the total variance of the surface SWC obtained with the field probe (SM-200) was explained by the location of the point and the survey dates. The results agree with the SWC values from CRNSs mentioned above, with the particularity that the point locations and survey dates explained similar percentages of the surface SWC variance (37 and 33%, respectively).
4. Discussion
The high SWC in croplands for all surveys is explained by the clayed substrate in these sites, which limits permeability and increases water retention. A higher clay content affects the distribution of water in soils since it significantly prevents water from rapidly moving down by gravity and moving up by capillarity through the soil profile. The clay content slows down not only downward water movement but also the variation in soil moisture in the profile because of its higher water holding capacity, as reported by Baskan et al. [29]. However, the position along the hillslope also plays a role, as seen in point 5, where a steeper slope resulted in a lower SWC compared to points 8 and 9, which are located at the bottom slope, where, besides receiving more runoff water, water accumulates in this flatter area. In contrast, woodland soils, which are shallower and developed on limestone, exhibit different dynamics of SWC. These soils are characterized by higher infiltration rates, lower bulk density, and greater organic matter content. As a result, in wet conditions, they can have a lower SWC than expected due to their rapid drainage capacity. Moreover, the high stone content further influences water movement in these soils [30].
The model explaining the SWC variation during the surveys (Figure 4, Table 5) highlights the dominant role of land use and rainfall intensity, confirming that soil properties linked to land cover strongly influence moisture retention. Temporal variations in SWC also respond to the precipitation input with higher values during the wet period (S1 to S3) and slow decrements in the absence of precipitation (S4 to S6). While most control points responded to rainfall inputs, site 4 exhibited minimal variation, suggesting that additional factors influence its water dynamics. This site, characterized by a stony surface, may experience enhanced infiltration due to the protective effect of surface stones, which prevent soil sealing and crust formation [31]. On the other hand, a preferential water circulation layer could be developed between the soil surface and the stone mantle favoring rapid water evacuation prior to infiltration. Besides these contrasted processes that could occur for different rainfall conditions, it is necessary to explore further the effect of the stony phase and how it would interfere on the neutron detection by the CRNS. However, in contrast, porous rocks such as limestones may have a high available water content [32]. It is likely that the response of stony soils will vary depending on the type of material and the arrangement of the stones, for instance, if they are embedded or not in fine material.
In general, an increase in SWC in sites above rock fragments leads to rapid topsoil saturation, ponding, and a decrease in soil cohesion, e.g., [33]. However, other authors [34] suggest that the soil evaporation that decreases in intensity with depth would induce a fast moisture reduction from the non-stony soil areas where the water is closer to the surface. Other studies indicate that rock fragments, especially on the soil surface can have a great but variable effect on soil water conservation, generally restricting evaporative water loss during periods of moderate drought but increasing evaporation during dry and hot summers [32]. Tetegan et al. [35] confirmed that the available water content of the stony soils, and thus of the soil water deficit, was strongly dependent on the value of the soil thickness.
A variety of operating processes could explain the low values of SWC estimated by CRNSs in point 4, independently of the rainfall amount. In Mediterranean environments, hillslopes are often characterized by poorly vegetated soils covered with rock fragments, but, to date, the effect of the surface rock fragments either resting on the soil surface or within the topsoil on the SWC measured with CRNSs has not been addressed.
The higher variability in SWC found during wet surveys confirms the important effect of land use/land cover (LULC) on soil water content, which in our study is conditioned by the different parental material, soil depth, and soil properties under woodlands and croplands. Deeper soils store more water that likely affects the variability in the wet period, while for drier conditions, the differences between woodlands and croplands sites are attenuated. The shallower woodland soils (Leptosols) (points 1, 2, and 3) have a more homogeneous soil depth in comparison to the deeper and more variable depth profiles of the cropland soils. This circumstance would lead to a larger variation in water content in variable deeper cropland soils, while for dry conditions, such differences would be attenuated. Another factor worth considering is the soil water dynamics registered by CRNSs in woodlands that might correspond more to the upper 5–10 cm, including the litter layer, whose wetting–drying dynamics are significantly faster than those of deeper soil layers [11].
However, the variability in SWC in survey 6 is slightly larger than in the other surveys during dry conditions, which responds to an increase in SWC in points 8 and 9. Despite the absence of precipitation between surveys 5 and 6, our results show a slight increase in SWC only for the last two cropland sites (points 8 and 9) against what could be expected. This behavior coincides with the barley harvest and could reflect both the lack of water consumption of the harvested plants along with the presence of crop residues on the soil surface after the harvesting that would reduce evapotranspiration.
The general increase in SWC observed in most of the control points for survey S7 responds to summer rainfall events that occurred in the second half of August. It is remarkable the different responses of cropland sites that evidence the importance of topographical factors like the slope gradient. This is the case of point 5, which registers a relatively lower increase in SWC because its steeper slope facilitates rapid runoff evacuation. This contrasts with the higher SWC increase observed at sites located in the lower part of the hillslope, where, besides accumulating more water from upslope, infiltration is promoted not only by the gentler slope but also by the presence of ridges favoring water retention at control points 8 and 9.
In terms of the absolute SWC comparison between the CRNS and the shallow field probe (SM-200) data, we found that all respond to the large heterogeneity in soil properties and composition within the control points and precipitation. Our results indicate that, for each of the eight control sites during the seven surveys, CRNSs were a good forecaster of soil water content, showing a comparable trend with the in situ data provided by the field probe. Despite the different depths of the sensors, the good correlation between them is comparable to that obtained in a variety of natural ecosystems of mixed forest and shrubland [36] as well as in other mixed agricultural systems [26]. Since the CRNS and field probes have different penetration depths, 0.5 and 0.05 m, respectively, this might introduce differences in the estimated SWC.
One of the main reasons for the lower SWC estimated with field probe (SM-200) compared to the data provided by CRNSs is the difference in measurement depth, along with the spatial resolution of both techniques. While the CRNS offers a more integrated measurement over a larger soil volume, the field probe provides a more localized measurement, which may not capture deeper moisture fluctuations accurately, leading to variations between the two methods. Furthermore, the high evaporation in the upper soil layers contributes to the lower SWC at the soil surface measured with the SM-200 field probe. In addition, stony soils are challenging, and the accurate performance of the field probe in profiles with high stone content is difficult, which could also explain the lower values of SWC with the field probe (SM-200) compared to the CRNS.
The Sentinel-2 index examined in this study, even though it provides moisture information based on vegetation response to soil moisture dynamics, offers a higher spatial and spectral resolution when compared to other remote sensing products that provide soil moisture with a coarser spatial resolution, but may result in the spectral mixing of individual pixels, thus diluting the signal at the sites. The results obtained with the NDMI index show the potential for the application of Sentinel-2 in the field of agricultural water monitoring, as other authors pointed out [37,38]. Our data highlight that Sentinel-2 products (10–20 m resolution) also provide information that aligns better with the data derived from the CRNS that integrates the SWC value over a representative area, compared to isolated data from the field probe. Despite remote sensing products referring to surface information, our results indicate the great potential of CRNSs to validate and calibrate remote sensing products, as other authors have recently suggested [16]. Recently, Sentinel-1 C band SAR data have become available to estimate near-surface SWC at a 17 m resolution [39], which will be promising for an inter-comparison with SWC obtained with CRNSs.
Our findings indicate that the placement of CRNSs in heterogeneous landscapes with mixed land uses and soil types must be carefully considered to capture the average volumetric water content representative of field conditions. This study demonstrates that the method is highly sensitive to variations in soil moisture, even in heterogeneous landscapes with complex topography and diverse land uses. The ability to capture both temporal, but also spatial variability confirms its suitability for fragmented agroecosystems where soil properties, topography, and vegetation cover vary significantly. A key advantage is that it effectively detects moisture changes at different scales, providing valuable information for environments with strong spatial heterogeneity. However, some limitations remain. One of the main challenges is the need for site-specific calibration, as general correction factors may not fully account for local conditions. In particular, the presence of surface water layers, highly stony soils, or dense Mediterranean vegetation could introduce uncertainties that require further investigation. Additionally, the current correction equations may not yet fully incorporate all relevant factors, and future studies should focus on refining these estimations.
Despite these challenges, this study highlights the potential of the method to provide accurate soil moisture estimates in complex environments. Its capacity to respond to different moisture conditions, even in steep and highly variable terrains, is a significant step forward. The results suggest that its sensitivity to diverse conditions is an advantage, reinforcing its relevance for improving soil moisture monitoring in challenging landscapes.
5. Conclusions
This work details the use of a mobile “backpack” CRNS device in Spain for the first time. The results demonstrate the effectiveness and potential of the CRNS for the field-scale monitoring of soil water content in Mediterranean landscapes. The surveys conducted captured the temporal and spatial variations in SWC at relatively short distances, which is relevant for monitoring the fine-scale variations in soil moisture that can occur within mixed land uses and compartmentalized configurations, which are typical in heterogeneous Mediterranean agroforestry systems. By capturing these variations, the data can help in better managing water resources and improving overall land productivity and sustainability.
The large variability in SWC found among sites and surveys relate to different soil characteristics and the response to rainfall occurrence for the specific physiographic conditions at each site. Crop sites clearly show greater variability, while the smaller differences between wet and dry conditions in forest sites also indicate the influence of soil properties and depth, and the effect of land uses on water storage capacity of these soils.
Land use and precipitation are the main factors of the SWC differences. Evidence of the main control of the land use and land cover, linked both with the lithology of the substrate and the soil types, on the variability in SWC was observed from the CRNS data. The SWC variability along the 4 months’ survey indicates that CRNSs are an efficient technique for capturing the effect of rainfall events on the soil moisture state in intricate landscapes with mixed land uses, involving shallow and stony soils.
This study demonstrates the potential of the CRNS for field-scale SWC monitoring and as a validation dataset for satellite-based products but also emphasizes the need for further research into the effect of vegetation water and soil stoniness. This promising information will help to better understand how the water content affects the process of soil degradation and soil loss due to water erosion.
Author Contributions
L.G.: Conceptualization, methodology, data curation, validation, investigation, visualization, writing—original draft preparation, writing—review and editing, funding acquisition. T.E.F.: Conceptualization, methodology, software, supervision, writing—review and editing, funding acquisition. A.N.: Investigation, methodology, writing—original draft preparation, writing—review and editing, funding acquisition. All authors have read and agreed to the published version of the manuscript.
Funding
This research was financially supported by the projects I+D+i PID2019-103946RJ-I00, PID2019-104857RB-I00 and PID2023-147193OB-I00 by the MCIN/AEI.
Data Availability Statement
The data presented in this study are available on request from the corresponding author. The data are not publicly available due to restrictions imposed by the research project’s data-sharing policy.
Acknowledgments
This contribution was made within the International Atomic Energy Agency (IAEA) Coordinated Research Project CRP_D1.20.14 (TC No: 24454). We thank Martin Schrön for his support with the lake correction analysis.
Conflicts of Interest
The authors declare no conflicts of interest.
References
- Konapala, G.; Mishra, A.K.; Wada, Y.; Mann, M.E. Climate change will affect global water availability through compounding changes in seasonal precipitation and evaporation. Nat. Commun. 2020, 11, 3044. [Google Scholar] [CrossRef]
- Crow, W.T.; Berg, A.A.; Cosh, M.H.; Loew, A.; Mohanty, B.P.; Panciera, R.; de Rosnay, P.; Ryu, D.; Walker, J.P. Upscaling sparse ground-based soil moisture observations for the validation of course-resolution satellite soil moisture products. Rev. Geophys. 2012, 50, RG2002. [Google Scholar] [CrossRef]
- Wei, L.; Zhang, B.; Wang, M. Effects of antecedent soil moisture on runoff and soil erosion in alley cropping systems. Agric. Water Manag. 2007, 94, 54–62. [Google Scholar] [CrossRef]
- Ahmad, S.; Kalra, A.; Stephen, H. Estimating soil moisture using remote sensing data: A machine learning approach. Adv. Water Resour. 2010, 33, 69–80. [Google Scholar] [CrossRef]
- Senanayake, I.P.; Yeo, I.Y.; Walker, J.P.; Willgoose, G.R. Estimating catchment scale soil moisture at a high spatial resolution: Integrating remote sensing and machine learning. Sci. Total Environ. 2021, 776, 145924. [Google Scholar] [CrossRef]
- Albergel, C.; De Rosnay, P.; Gruhier, C.; Muñoz-Sabater, J.; Hasenauer, S.; Isaksen, L.; Kerr, Y.; Wagner, W. Evaluation of remotely sensed and modelled soil moisture products using global ground-based in situ observations. Remote Sens. Environ. 2012, 118, 215–226. [Google Scholar]
- Mohanty, B.P.; Cosh, M.H.; Lakshmi, V.; Montzka, C. Soil Moisture Remote Sensing: State-of-the-Science. Vadose Zone J. 2017, 16, 1–9. [Google Scholar] [CrossRef]
- Mekonnen, D.F. Satellite Remote Sensing for Soil Moisture Estimation: Gumara Catchment, Ethiopia. Master’s Thesis, International Institute for Geo-Information Science and Earth Observation (ITC), Enschede, The Netherlands, 2009. [Google Scholar]
- Wang, S.; Chen, H.S.; Fu, Z.; Wang, K. Temporal stability analysis of surface soil water content on two karst hillslopes in southwest China. Environ. Sci. Pollut. Res. 2016, 23, 25267–25279. [Google Scholar] [CrossRef]
- Schönbrodt-Stitt, S.; Ahmadian, N.; Kurtenbach, M.; Conrad, C.; Romano, N.; Bogena, H.R.; Vereecken, H.; Nasta, P. Statistical exploration of SENTINEL-1 data, terrain parameters and in-situ data for Estimating the Near-Surface Soil Moisture in a Mediterranean Agroecosystem. Front. Water 2021, 3, 655837. [Google Scholar] [CrossRef]
- Bogena, H.R.; Huisman, J.A.; Baatz, R.; Hendricks Franssen, H.J.; Vereecken, H. Accuracy of the cosmic-ray soil water content probe in humid forest ecosystems: The worst case scenario. Water Resour. Res. 2013, 49, 5778–5791. [Google Scholar]
- Franz, T.E.; Zreda, M.; Rosolem, R.; Ferre, T.P.A. A universal calibration function for determination of soil moisture with cosmic-ray neutrons. Hydrol. Earth Syst. Sci. 2013, 17, 453–460. [Google Scholar] [CrossRef]
- Zhu, X.; Shao, M.A.; Zeng, C.; Jia, X.; Huang, L.; Zhang, Y.; Zhu, J. Application of cosmic-ray neutron sensing to monitor soil water content in an alpine meadow ecosystem on the northern Tibetan Plateau. J. Hydrol. 2016, 536, 247–254. [Google Scholar] [CrossRef]
- Baroni, G.; Scheiffele, L.M.; Schrön, M.; Ingwersen, J.; Oswald, S.E. Uncertainty, sensitivity and improvements in soil moisture estimation with cosmic-ray neutron sensing. J. Hydrol. 2018, 564, 873–887. [Google Scholar]
- Gaspar, L.; Franz, T.E.; Catalá, A.; Lizaga, I.; Ramos, M.C.; Navas, A. Combining cosmic-ray neutron sensor and fallout 137Cs to explore the connection of soil water content with soil redistribution in an agroforestry hillslope. Environ. Res. 2023, 233, 116451. [Google Scholar] [CrossRef] [PubMed]
- Montzka, C.; Bogena, H.R.; Zreda, M.G.; Monerris, A.; Morrison, R.; Muddu, S.; Vereecken, H. Validation of spaceborne and modelled surface soil moisture products with Cosmic-Ray Neutron Probes. Remote Sens. 2017, 9, 103. [Google Scholar] [CrossRef]
- González-Sanchis, M.; García-Soro, J.M.; Molina, A.J.; Lidón, A.L.; Bautista, I.; Rouzic, E.; Bogena, H.; Hendricks Franssen, H.J.; del Campo, A.D. Comparison of soil water estimates from cosmic-ray neutron and capacity sensors in a semiarid pine forest: Which is able to better assess the role of environmental conditions and thinning? Front. Water. 2020, 2, 39. [Google Scholar] [CrossRef]
- Bogena, H.R.; Schrön, M.; Jakobi, J.; Ney, P.; Zacharias, S.; Andreasen, M.; Baatz, R.; Boorman, D.; Duygu, B.M.; Eguibar-Galán, M.A.; et al. COSMOS-Europe: A European network of Cosmic-Ray Neutron Soil Moisture Sensors. Earth Syst. Sci. Data Discuss. 2021, 14, 1–33. [Google Scholar]
- Joint FAO. Soil Moisture Mapping with a Portable Cosmic Ray Neutron Sensor (No. IAEA-TECDOC-1845); Joint FAO/IAEA Division of Nuclear Techniques in Food and Agriculture: Vienna, Austria, 2018. [Google Scholar]
- Heidbüchel, I.; Güntner, A.; Blume, T. Use of cosmic-ray neutron sensors for soil moisture monitoring in forests. Hydrol. Earth Syst. Sci. 2016, 20, 1269–1288. [Google Scholar] [CrossRef]
- Zreda 2012 Zreda, M.; Shuttleworth, W.J.; Zeng, X.; Zweck, C.; Desilets, D.; Franz, T.; Rosolem, R. COSMOS: The cosmic-ray soil moisture observing system. Hydrol. Earth Syst. Sci. 2012, 16, 4079–4099. [Google Scholar] [CrossRef]
- Shuttleworth, W.J.; Zreda, M.; Zeng, X.; Zweck, C.; Ferré, T.P. The COsmic-ray Soil Moisture Observing System (COSMOS): A non-invasive, intermediate scale soil moisture measurement network. In Proceedings of the British Hydrological Society’s Third International Symposium: “Role of Hydrology in Managing Consequences of a Changing Global Environment”, Newcastle upon Tyne, UK, 19–23 July 2010. [Google Scholar]
- Jiao, Q.; Zhu, Z.; Du, F. Theory and application of measuring mesoscale soil moisture by cosmic-ray fast neutron probe. 35th International Symposium on Remote Sensing of Environment (ISRSE35). IOP Conf. Ser. Earth Environ. Sci. 2014, 17, 012147. [Google Scholar] [CrossRef]
- Jakobi, J.; Huisman, J.A.; Vereecken, H.; Diekkrüger, B.; Bogena, H.R. Cosmic-ray neutron sensing for simultaneous soil water content and biomass quantification in drought conditions. Water Resour. Res. 2018, 54, 7383–7402. [Google Scholar] [CrossRef]
- Desilets, D.; Zreda, M.; Ferré, T.P.A. Nature’s Neutron Probe: Land Surface Hydrology at an Elusive Scale with Cosmic Rays. Water Resour. Res. 2010, 46, W11505. [Google Scholar] [CrossRef]
- Franz, T.E.; Wahbi, A.; Vreugdenhil, M.; Weltin, G.; Heng, L.; Oismueller, M.; Strauss, P.; Dercon, G.; Desilets, D. Using cosmic-ray neutron probes to monitor landscape scale soil water content in mixed land use agricultural systems. Appl. Environ. Soil Sci. 2016, 2016, 4323742. [Google Scholar]
- Haubrock, S.N.; Chabrillat, S.; Kuhnert, M.; Hostert, P.; Kaufmann, H. Surface soil moisture quantification and validation based on hyperspectral data and field measurements. J. Appl. Remote Sens. 2008, 2, 023552. [Google Scholar] [CrossRef]
- Schrön, M.; Zacharias, S.; Womack, G.; Köhli, M.; Desilets, D.; Oswald, S.E.; Bumberger, J.; Mollenhauer, H.; Kögler, S.; Remmler, P.; et al. Intercomparison of cosmic-ray neutron sensors and water balance monitoring in an urban environment. Geosci. Instrum. Method. Data Syst. 2018, 7, 83–99. [Google Scholar]
- Baskan, O.; Kosker, Y.; Erpul, G. Spatial and temporal variation of moisture content in the soil profiles of two different agricultural fields of semi-arid region. Environ. Monit Assess. 2013, 185, 10441–10458. [Google Scholar] [PubMed]
- Gaspar, L.; Lizaga, I.; Navas, A. Spatial distribution of fallout and lithogenic radionuclides controlled by soil carbon and water erosion in an agroforestry South-Pyrenean catchment. Geoderma 2021, 391, 114941. [Google Scholar]
- Valentino, R.; Montrasio, L.; Losi, G.L.; Bittelli, M. An empirical model for the evaluation of the degree of saturation of shallow soils in relation to rainfalls. Can. Geotech. J. 2011, 48, 795–809. [Google Scholar] [CrossRef]
- Renard, K.G.; Foster, G.R.; Weesies, G.A.; McCool, D.K.; Yoder, D.C. Predicting soil erosion by water, a guild to conservation planning with the Revised Universal Soil Loss Equation (RUSLE). In USDA Agricultural Handbook; No. 703; U.S. Government Printing Office: Washington, DC, USA, 1997. [Google Scholar]
- Poesen, J.; Lavee, H. Rock fragments in topsoils: Significance and processes. Catena 1994, 23, 1–28. [Google Scholar]
- Van Wesemael, B.; Poesen, J.; Kosmas, C.S.; Danalatos, N.G.; Nachtergaele, J. Evaporation from cultivated soils containing rock fragments. J. Hydrol. 1996, 182, 65–82. [Google Scholar]
- Tetegan, M.; Nicoullaud, B.; Baize, D.; Bouthier, A.; Cousin, I. The contribution of rock fragments to the available water content of stony soils: Proposition of new pedotransfer functions. Geoderma 2011, 165, 40–49. [Google Scholar]
- Ly, L.; Franz, T.T.; Robinson, D.A.; Jones, S.B. Measured and Modeled Soil Moisture Compared with Cosmic-Ray Neutron Probe Estimates in a Mixed Forest. Vadose Zone J. 2014, 13, 1–12. [Google Scholar]
- West, H.; Quinn, N.; Horswell, M.; White, P. Assessing vegetation response to soil moisture fluctuation under extreme drought using sentinel-2. Water 2018, 10, 838. [Google Scholar] [CrossRef]
- McFeeters, S.K. The Use of the Normalized Difference Water Index (NDWI) in the Delineation of Open Water Features. Int. J. Remote Sens. 1996, 17, 1425–1432. [Google Scholar]
- Said, H.; Mbaye, M.; Heng, L.K.; Weltin, G.; Franz, T.; Dercon, G.; Toloza, A.; Strauss, P.; Rab, G. High-resolution soil moisture retrieval using C-band radar Sentinel-1 and Cosmic-ray neutron sensor data. In Proceedings of the 2021 IEEE International Workshop on Metrology for Agriculture and Forestry (MetroAgriFor), Trento-Bolzano, Italy, 3–5 November 2021; pp. 221–225. [Google Scholar]
Disclaimer/Publisher’s Note: The statements, opinions and data contained in all publications are solely those of the individual author(s) and contributor(s) and not of MDPI and/or the editor(s). MDPI and/or the editor(s) disclaim responsibility for any injury to people or property resulting from any ideas, methods, instructions or products referred to in the content. |
© 2025 by the authors. Licensee MDPI, Basel, Switzerland. This article is an open access article distributed under the terms and conditions of the Creative Commons Attribution (CC BY) license (https://creativecommons.org/licenses/by/4.0/).