Abstract
Madagascar’s protected areas (PAs) play a critical role in biodiversity conservation, yet deforestation continues to threaten both their integrity and surrounding landscapes. This study assesses deforestation patterns inside and within a 5 km buffer zone around terrestrial PAs from 2015 to 2023, using improved remote sensing data based on Landsat 8. We examine the influence of governance, PA category, proximity to infrastructure, and human population dynamics on deforestation rates. Our results illustrate that PAs categorized under IUCN I to IV generally experience lower deforestation rates inside their boundaries than PAs in categories V and VI. The latter often mirror the deforestation patterns observed in their surrounding buffer zones. Additionally, larger PAs, PAs with greater road accessibility, and areas experiencing migration-driven land-use changes exhibit higher amounts of deforestation. We highlight the role of buffer zones as deforestation absorbers and discuss the need for adaptive governance strategies that integrate local socio-economic realities to enhance conservation effectiveness. These findings offer critical insights for improving Madagascar’s PA management and broader land-use planning.
1. Introduction
Protected areas (PAs) are a cornerstone of global biodiversity conservation, covering approximately 16% of terrestrial and 8% of marine areas worldwide [1]. They play a critical role in safeguarding ecosystems, protecting endangered species, and maintaining essential ecosystem services [2,3]. However, despite their expansion, many PAs remain vulnerable to deforestation, habitat degradation, and resource extraction due to weak governance, insufficient funding, and socio-economic pressures. The effectiveness of PAs varies widely depending on management strategies, enforcement capacity, and local socio-political contexts [4,5]. While well-managed PAs have been shown to significantly reduce deforestation rates compared to unprotected areas, many still face external pressures, particularly in tropical regions where agricultural expansion, logging, and infrastructure development continue to drive habitat loss [6,7]. Conservation effectiveness is measured mostly within PAs. This does not consider the spillover effects that occur when forms of land use originally practiced in PAs are displaced to unprotected areas where they would not have occurred otherwise. Often, these are areas surrounding PAs which then serve as buffers for extractive land use [8] (Figure 1). Understanding how governance and management structures influence PA effectiveness is therefore critical for improving conservation outcomes.
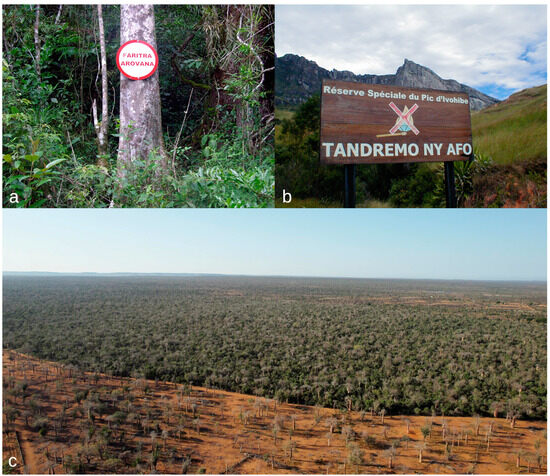
Figure 1.
Sign marking the boundaries of Andringitra National Park (a), some of which includes further information on restrictions, such as prohibiting fires (b). In some cases, borders are well respected as illustrated by the sharp boundary of Tsimanampetsotse National Park (c), with the upper part showing the National Park. Outside the National Park (lower part), the forest has been cleared except for baobabs (Adansonia rubrostipa) that cannot be used for firewood or construction (photo credit: a, b: O. Andrianambinina; c: L. Wilmé).
Madagascar is globally recognized for its unique biodiversity, with exceptional species richness and high levels of endemism. The island harbors over 11,500 vascular plant species, of which 82% are endemic, as well as diverse and highly specialized faunas, making it one of the world’s most critical biodiversity hotspots [9,10]. Protected areas (PAs) serve as a key conservation component, covering approximately 10.4% of the land and providing habitat for 97.1% of known terrestrial vertebrates and 67.7% of plant species [10]. Despite these efforts, Madagascar has lost 44% of its natural forest cover since 1953, with annual deforestation rates steadily increasing since 2005, reaching 99,000 hectares per year between 2010 and 2014. This forest loss is observed across protected and unprotected areas, highlighting the persistent threats to Madagascar’s ecosystems [11,12].
Deforestation rates across Madagascar vary based on PA governance, geographic context, and IUCN category. Older PAs, particularly those in IUCN categories I to IV, with well-defined boundaries and structured management, generally experience lower deforestation rates. In contrast, newer PAs, particularly those in categories V and VI, often face higher deforestation rates due to weaker governance and enforcement [12,13,14,15,16,17,18,19]. Since PAs of category V and VI were established in 2015, these phenomena have been described for several examples, but comparisons of the deforestation rates between PAs with different management schemes are lacking on the national level.
Multiple environmental and socio-economic factors contribute to deforestation in and around Madagascar’s PAs. Rainfall variability is a significant factor. Droughts increase deforestation by 7.6% in drier regions, as reduced rainfall drives forest conversion to agricultural land [20] and forces people to fall back on forest resources [21]. Drought is also a highly significant factor that initiates human migration towards areas that are more favorable than the drought-affected regions [22]. Apart from these push factors, substantial human migration is also initiated by pulling effects, such as mining [23]. Weak governance, external demand, and socio-economic pressures exacerbate these impacts, making forests vulnerable to illegal resource extraction and land-use conversion [16,17,24,25,26]. These patterns underscore the need to integrate buffer zones and land-use planning into PA management strategies.
The effectiveness of Madagascar’s PAs in reducing deforestation is influenced by governance, resource allocation, and community involvement. Some PAs, such as Masoala and Makira, have successfully reduced deforestation by maintaining strong governance structures and integrating local communities into conservation efforts [10,16,17,18]. However, external pressures such as population growth, resource extraction, and migration often contribute to forest loss near PAs, particularly in regions with weaker governance. From a biodiversity perspective, some regions, such as the northeast and northwest, are of particular interest due to their concentration of endemic species. Despite regional peculiarities, Madagascar’s conservation priorities extend across the island, and effective conservation efforts are needed across all ecosystems [11,18,27].
The role of park managers and community engagement is also key in reducing deforestation and preventing fires. For example, during the COVID-19 pandemic, Madagascar National Parks (MNPs) maintained its management and monitoring efforts while increasing local community involvement in PA governance. This engagement coincided with stable or lower deforestation rates in most PAs, supporting the idea that consistent management and local participation helps mitigate pressures [15,28].
Deforestation in Madagascar results from a combination of chronic and shifting pressures, influenced by climate variability, governance instability, economic demands, and demographic changes. Severe and increasingly frequent droughts have impacted forested regions, particularly in western and southern Madagascar, disrupting forest regeneration and intensifying land conversion for agriculture due to water and food scarcity [29,30]. These pressures have been exacerbated by political instability, notably following the 2009 coup d’état and the subsequent rule of the Haute Autorité de Transition (HAT). Established as Madagascar’s transitional government from 2009 to 2014, the HAT suspended democratic institutions and remained in power until elections were finally held in 2013. This prolonged transition, marked by international sanctions and failed power-sharing agreements, weakened law enforcement and contributed to a rise in illegal resource extraction [30,31,32,33]. During this period, a surge in illegal logging, particularly of rosewood in national parks, such as Masoala and Marojejy, was facilitated by corrupt networks and a lack of regulatory oversight [31,34]. These governance failures have long-term consequences, as weak institutional frameworks continue to hinder conservation policies.
Land scarcity and migration-driven deforestation further exacerbate pressures on forested landscapes. In northeastern and western Madagascar, new settlers clear forests for agriculture, often in areas bordering PAs. Expanding subsistence and commercial farming, particularly for cash crops, has contributed to habitat loss and land-use changes [35,36]. Agricultural expansion continues, particularly in regions where governance structures are weak, regulatory oversight is limited, and conservation policies are not effectively enforced [37]. Additionally, the illegal extraction of high-value resources, including rosewood and minerals, continues to contribute to forest loss, with logging and mining occurring inside of and adjacent to some PAs. These activities persist due to weak governance, corruption, and informal networks that facilitate unauthorized exploitation [38,39,40,41].
To generate insights that contribute to PA management and conservation planning while serving as a foundation for further research, this study examines deforestation trends in and around Madagascar’s protected areas (PAs) from 2015 to the end of 2023, with a focus on governance, management effectiveness, and external pressures. Specifically, it aims to accomplish the following:
- Assess spatial and temporal variations in PAs of different categories (Box 1) and their surrounding landscapes, identifying factors that may influence forest loss;
- Explore relationships between PA governance, socio-environmental factors, and deforestation patterns, considering aspects such as management structures, land-use dynamics, and accessibility;
- Evaluate the role of buffer zones and broader landscape interactions in shaping conservation outcomes, with implications for policy and management strategies.
Box 1. Protected areas in Madagascar governance and conservation framework.
The Code de Gestion des Aires Protégées (COAP), established under Madagascar’s Law No. 2015-005, reflects adaptations of the IUCN categories to the country’s unique biodiversity and socio-economic challenges. Categories I, II, and III prioritize strict conservation, large-scale ecological protection, and safeguarding natural features, respectively, often minimizing human intervention [42,43]. Category IV areas, which are typically smaller, focus on targeted management for specific taxa or habitats, requiring active interventions. Categories V and VI, in contrast, emphasize the coexistence of human activities and conservation goals, allowing for sustainable resource use alongside biodiversity protection. Additionally, Madagascar integrates locally relevant designations, such as Natural Monuments and Harmonious Protected Landscapes, which align biodiversity conservation with poverty reduction and sustainable development goals. PA governance involves diverse stakeholders, including the state, local communities, and private actors, fostering inclusive and sustainable management strategies [15,44,45].
2. Materials and Methods
2.1. Sample and Spatial Analyses
We consider the terrestrial protected areas with an IUCN conservation status, and those managed by an institution or community, i.e., not considering PAs that have not been assigned to any IUCN category or orphan PAs that do not have any official management at the site [19]. We considered 88 PAs including 44 within IUCN categories I to IV, and 44 PAs within IUCN categories V and VI (Figure 2; Table S1).
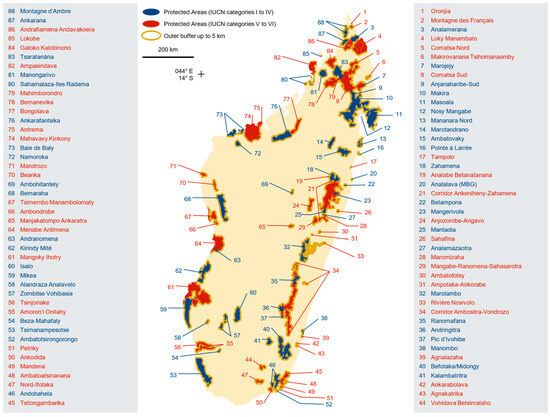
Figure 2.
Protected areas with IUCN conservation categories I to IV, and V and VI, and their outer buffers out to 5 km.
Official administrative boundaries were taken from Foiben-Taosarintanin’i Madagasikara (FTM), ensuring consistency with national cartographic standards. The delineation of Madagascar’s protected areas followed the Système des Aires Protégées de Madagascar (SAPM) dataset, as provided by the Ministère de l’Environnement et du Développement Durable (MEDD), ensuring precise PA limits. Using these sources resulted in somewhat different shapefiles than those provided by the World Database on Protected Areas [15,46].
2.2. Defining the Sizes of Zones Around PAs to Be Considered as Buffers
According to the Code de Gestion des Aires Protégées (COAP), PAs in IUCN categories I, II, and IV have a 2.5 km buffer as a “zone de conservation” where development activities are implemented to better protect the PA. This Zone de Conservation is proposed for PAs of categories V and VI, but does not seem to be implemented there. To assess possible deforestation around PAs, we used the PAs of IUCN categories I, II, and IV and defined zones around each PA of 0–2.5 km, 2.5–5 km, and 5–10 km. The only PA of category III is a mountain table. Nosy Mangabe (cat. II) was not considered as it represents an island that does not have outer buffers. For each zone, we calculated the percent of forest cover in 2015 and in 2023 using the method described below. We assessed possible differences in the deforestation rates between zones using the difference in the proportion of forest cover between 2015 and 2023 (% forest cover in 2015–% forest cover in 2023). These differences in the percent of forest cover between 2015 and 2023 in the three buffer zones were ranked per PA.
The differences in the proportion of forest cover between 2015 and 2023 differed significantly between the three buffer zones (Friedman two-way analysis of variance: χ2 = 25.33, df = 2, p < 0.001). The buffer zone from 0 to 2.5 km did not differ from the buffer zone of 2.5–5 km in the difference in the proportion of forest cover between 2015 and 2023, but both zones differed significantly (p < 0.05) from the zone between 5 and 10 km (pairwise comparisons were Bonferroni corrected; Figure 3). Based on this result, we merged the first two buffer zones and used the zone from 0 to 5 km around each PA for the comparisons of deforestation rates between within and outside PAs. The outer buffers of up to 5 km around PAs were adjusted to avoid overlaps with PAs or outer buffers from neighboring PAs [19].
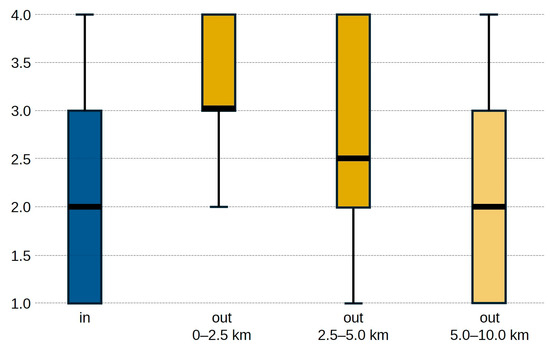
Figure 3.
Rank (y-axis) of differences in the proportion of forest cover between 2015 and 2023 (% forest cover in 2015–% forest cover in 2023) within PAs and in three buffer zones around PAs.
2.3. Forest Cover and Annual Deforestation from 2015 to 2023
We used the forest cover at the end of 2014 as the starting point for our analyses of deforestation. To calculate the forest cover at the end of 2014, we integrated annual forest loss data from 2001 to 2014 to generate an updated 2015 forest cover map, covering protected areas and their 5 km buffer zones.
The analysis of deforestation over the 2015–2023 period maintains methodological consistency, as it exclusively relies on Landsat 8 imagery. Since pre-2014 data were obtained from Landsat 7, mixing imagery from different sensors was avoided to ensure comparability and accuracy in the assessment of forest cover and deforestation trends. We used annual deforestation rates from 2015 to 2023 because we wanted to assess possible differences between the “old” protected areas, established prior to 2015, and the “new” protected areas established officially in 2015, though most of them were declared protected areas several years earlier.
We applied the methodology exemplified in the work of Rafanoharana et al. [19,47] to calculate the best Tree Canopy Density thresholds to estimate deforestation for each year since the expansion of the network in 2015. The standardized application of Tree Canopy Density (TCD), as used in global assessments of forest cover, assumes that vegetation cover above 30% in Landsat images represents forests and cover below 30% does not represent forests. This threshold yields erroneous estimates for different forest types in Madagascar. The standard TCD threshold of 30% overestimates humid and dry forests, but underestimates the globally unique dry spiny forests in Madagascar. The former is due to the misclassification of lush green non-forest vegetation, while the latter results from trees that do not have large crowns. To avoid these misclassifications, we compared local forest maps with TCDs derived from Landsat 8 imagery and used specific TCD thresholds for each PA which corresponds to “forest” according to the local forest maps [12,47,48]. Annual deforestation was then calculated as the difference in the area covered by forests between year x and year x − 1. Annual deforestation rates were calculated in relation to forest cover in the previous year. For the purpose of the present paper, we present the data on forest cover and deforestation between 2015 and 2023 for the PAs of different IUCN categories (Box 1).
2.4. Impact of Human Population and Migration
Regional human population densities were taken from the 2018 Recensement Général de la Population et de l’Habitation provided by INSTAT [49,50]. They were subdivided into estimates for rural and urban human populations.
Local human population estimates were derived using a weighting approach based on the presence of communal administrative centers (chefs-lieux). The geospatial data were cleaned, and the area of each zone was calculated. Strictly protected areas (IUCN Categories I, II, III, and IV) were distinguished from other categories (V and VI). Strictly protected areas without a communal center were excluded from the population calculation given that there is no human settlement in PAs in IUCN categories I to IV (with few exceptions).
For the rural population distribution, the total population was proportionally assigned based on the eligible land area, while urban populations were allocated exclusively to zones containing a communal center. Initial population densities were calculated without weighting, after which a coefficient was applied to adjust the distribution. A proportional correction was then performed to ensure that the sum of weighted populations did not exceed the total communal population.
To estimate population movements between regions, we analyzed the Men:Women ratio in each communal area relative to the national average and considered the average household size per region (all data adjusted from [20,49] and explained in more detail in Box S1). In times of resource scarcity, men typically migrate first in search of land, leading to a temporary gender imbalance. Other household members follow once land is secured in the new location. We also calculated the ratio of immigrating to emigrating men. Newly arriving men often engage in charcoal production and/or land clearing for agriculture. This measure reflects patterns of internal migration and land-use changes.
2.5. Impact of Road Infrastructures on the PA Ratio
The primary road network was obtained from OpenStreetMap (OSM), providing insights into infrastructure development and accessibility. The impact of road infrastructure on PAs was assessed by creating buffer zones around primary, secondary, and tertiary roads. Primary roads or Routes Nationales (RN) are major highways connecting cities, ports, and economic hubs. They are managed by the national government. They are generally paved, though some sections are in poor condition. Secondary roads or Routes Provinciales (RP) connect smaller towns and regional centers to the primary road network. They are often unpaved or partially paved. Their maintenance is shared between national and regional authorities. Tertiary roads or Routes Communales (RC) are local, linking rural villages. They are typically unpaved and poorly maintained, often impassable in the rainy season. They are managed by local municipalities or communities.
Buffers of 5 km, 10 km, and 20 km were generated around the roads. The definition of buffer zones was based on estimated walking distances from roads, reflecting the accessibility of PAs and the potential for human activities.
- The 0–5 km buffer represents areas that can be walked to and returned from within half a day, making them the most accessible for short trips such as resource collection or small-scale activities.
- The 5–10 km buffer includes areas that can be reached and returned from within a full day of walking, allowing for more extended activities without requiring an overnight stay.
- The 10–20 km buffer represents areas that can be reached within a full day of walking but would require an overnight stay at the destination before returning. These areas are more likely to be impacted by activities requiring longer stays, such as small-scale agriculture, hunting, or mining.
After verifying potential overlaps, these buffer zones were intersected with PAs to determine the extent of affected land. For each intersection, the impacted area was measured and expressed as a percentage of the total PA to quantify the influence of road networks on PAs. The final results were consolidated into shapefiles and Excel files to facilitate further analysis and integration into GIS tools for spatial visualization and decision-making, and to facilitate further analyses.
2.6. Data Harmonization and Statistical Analyses
Projections of spatial data were harmonized and spatially aligned to ensure consistency.
Samples with residuals deviating from normal distributions were analyzed with non-parametric statistics. Since our data are descriptive, we do not imply causalities from statistical tests but rather we describe differences and associations that can then possibly be tested by future studies. Statistical tests were run with SPSS 29.0.2.0.
3. Results
3.1. Deforestation in Relation to IUCN Categories
In total, we included 88 protected areas in our analyses (Table S1). Between 2015 and 2023, mean annual deforestation rates ranged from 0.00 to 4.64% (median = 0.19%) in PAs of IUCN categories I to IV and from 0.01 to 9.49% (median = 0.82%) in PAs of IUCN categories V and VI. Annual deforestation rates inside protected areas were significantly higher in protected areas of IUCN categories V and VI than in categories I to IV (Mann–Whitney U test: z = 2.929, p = 0.003; Table 1, Figure 4).

Table 1.
Surface of forest cover and forest loss between 2015 and 2023 in protected areas (PAs) and the buffer zones of 0–5 km around the 88 PAs considered here. Values are medians and quartiles: Q25–median–Q75; ranges in brackets.
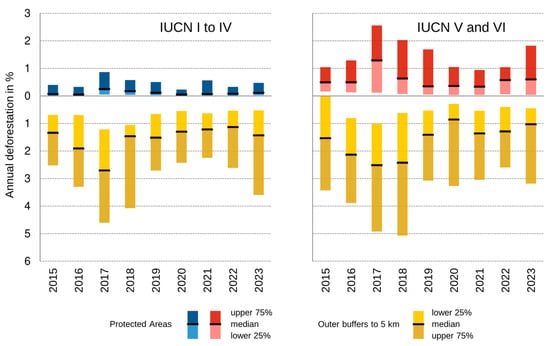
Figure 4.
Annual deforestation rates (as % of the forest cover of the year before) within protected areas (blue bars for PAs with an IUCN I to IV conservation status; red bars for PAs with an IUCN V and VI conservation status) and in the surrounding 5 km buffer zones (yellow bars) from 2015 to 2023. Deforestation rates are generally higher and more variable in buffer zones compared to protected areas. Stricter protection categories (I to IV) show lower deforestation rates than less restrictive categories (V and VI).
In the 5 km buffer zones outside the PAs, annual deforestation rates ranged from 0.00 to 6.11% (median = 1.96%) around PAs of IUCN categories I to IV and from 0.08 to 10.11% (median = 2.13%) around PAs of IUCN categories V and VI. Annual deforestation rates for the years 2015 to 2023 in the 5 km buffer zones around the protected areas did not differ significantly between the buffers around PAs of IUCN categories I to IV, and V and VI (Mann–Whitney U test: z = 0.159, p = 0.874).
3.2. Deforestation in and Ouside of PAs
At eight sites (categories I to IV: Baie de Baly, Ambohitantely, Ambatotsirongorongo and Tsaratanàna; categories V and VI: Manjakatompo Ankaratra, Analabe Betanatanana, Mahavavy-Kinkony and Ambondrobe), mean deforestation rates were higher inside than outside the protected areas, mostly due to the lack of forest surrounding the protected areas (but see [19] for Tsaratanàna). At Nosy Mangabe, no outer buffer was considered as the island is surrounded by the sea. On average, mean deforestation rates were higher outside than inside for PAs of all IUCN categories (Wilcoxon matched pairs signed ranks test for IUCN I to IV: z = 4.82, p < 0.001; IUCN V and VI: 5.05, p < 0.001; Table 1, Figure 4).
Mean deforestation rates within and outside of the protected areas were correlated significantly for PAs of both groups of IUCN categories (Spearman correlation; IUCN I to IV: rs = 0.382, p = 0.01, n = 44; IUCN V and VI: rs = 0.54, p < 0.001, n = 44). The stronger correlation for IUCN categories V and VI than for categories I to IV indicates that deforestation rates in and outside PAs are more similar in and around PAs V and VI than in and around PAs I to IV.
The relatively low mean annual deforestation rates should not hide that in some years, deforestation rates can reach very high values. Inside Pas, the highest deforestation rate measured for any given year was 49.29% for Mangabe-Ranomena-Sahasarotra in 2023. In the 5 km buffer zone around PAs, the highest deforestation rate was 21.11% around Manombo in 2017 (Table S1).
The median deforestation rate inside the 44 PAs of categories I to IV was 0.19% (quartiles: 0.05–0.71%) and 1.96% (quartiles: 0.79–3.34%) in the 5 km buffer around the PAs. For the PAs of categories V and VI, the median deforestation rate inside the 44 PAs was 0.82% (quartiles: 0.19–1.52%) and 2.13% (quartiles: 0.69–3.53%) in the 5 km buffer around the PAs.
3.3. Drivers of Deforestation Rates Inside Protected Areas
We correlated the mean deforestation rates of the years 2015 to 2023 with various possible drivers of deforestation.
For all protected areas, deforestation rates increased significantly with the increasing size of the protected area and the size of the forest area (Table 2). The percentage of forest cover in the 5 km buffer zone outside protected areas as a proxy of the amount of forest possibly available for legal exploitation was not correlated significantly with deforestation rates inside the PAs. Proximity to roads for the possible transport of wood products approached significance for protected areas of IUCN categories I to IV. These correlations were significant for IUCN categories V and VI. Here, the strength of the correlation between deforestation rates increased with increasing proportions of the PAs located within these buffer zones. Neither the rural nor urban human population sizes of the regions were correlated significantly with mean deforestation rates. Human settlements are not allowed in most protected areas of IUCN categories I to IV and therefore no correlations were calculated between deforestation rates and human population characteristics inside the protected areas of IUCN categories I to IV. For protected areas of IUCN categories V and VI, deforestation rates were positively correlated with the size of the human population inside the protected areas and with a higher proportion of immigrating males (Table 2).
Table 2.
Spearman correlations between the mean annual deforestation (mean of years 2015–2023 per protected area) and various drivers for protected areas of IUCN categories I to IV, and V and VI; Spearman correlations, with p-values two-sided; significant correlations (p < 0.05) marked in bold.
4. Discussion
Our nation-wide assessment of annual deforestation rates over nine years confirms previous findings that, on average, deforestation is higher in PAs managed almost entirely by communities (IUCN categories V and VI) than in PAs managed by institutions with the involvement of communities (IUCN categories I to IV) (e.g., [13,15,18]). Following this result, we support the conclusion that appropriate staffing is crucial to improve the protection of PAs [14]. While our dataset covers the whole island, it should be noted that we considered only 88 of the 114 terrestrial PAs of Madagascar. The 28 PAs not considered had either not been assigned to any IUCN category or were orphan sites without formalized or any conservation management. Most of these sites have very high deforestation rates, which were not included here.
Buffer zones, typically defined as areas extending a few kilometers outside of or inside a PA’s boundaries, serve as transitional areas that mediate human activity while enhancing the core conservation function of the PAs themselves [19]. The role of buffer zones in conservation has been increasingly recognized, particularly in Madagascar, where pressures on protected areas (PAs) are often concentrated near their boundaries (Figure 3), but formal comparative analyses have been lacking so far. While buffer zones are often designed to integrate conservation objectives with local land use and resource management, their effectiveness varies, often serving more to mitigate local opposition than to enhance biodiversity protection [51,52]. Therefore, their effectiveness remains uncertain, and land within buffer zones can be as degraded as in unprotected areas, limiting their role as protective barriers [53]. In contrast to Madagascar, where PA managers are responsible only within formal PA boundaries, buffer zones in other regions, such as Brazil, are often under park authority management. However, limited enforcement and resource allocation in these buffer zones have contributed to degradation, diminishing their intended protective function [52].
In Madagascar, the COAP defines a 2.5 km buffer zone around PAs, known as the zone de protection, which allows for regulated resource use to alleviate pressures on the protected areas. In our analyses, we considered a buffer zone of up to 5 km, as PA influence is often observed to extend beyond the legally defined bounds. On statistical grounds, deforestation in the zones of 2.5 to 5 km of distance around protected areas was more similar to that in the 2.5 km buffer zone around the PA than to that in the buffer zone extending from 5 to 10 km (Figure 3). Thus, while PAs effectively reduce deforestation within their boundaries, the surrounding areas absorb a significant proportion of forest loss. In northeastern Madagascar, agricultural land-use intensification is increasingly replacing shifting cultivation, particularly in landscapes surrounding Masoala and Makira National Parks. While large continuous forests remain intact within PAs, expanding cash crop production and other agricultural activities in adjacent areas are contributing to greater forest fragmentation [54,55]. This pattern suggests that while PAs help maintain core forests, their long-term effectiveness depends on the management of the surrounding landscapes. This pattern aligns with evidence from the Amazon, where deforestation is disproportionately concentrated near roads and rivers, and protected areas play a mitigating role in slowing forest loss [56]. This highlights the need to actively integrate buffer zones into PA management strategies rather than treating them as unmanaged spillover areas.
The deforestation patterns observed in PAs reveal distinct trends based on IUCN category. For PAs in categories I to IV, deforestation rates within their official boundaries were noticeably lower, indicating effective management and adherence to conservation goals compared to the buffers. For example, PA Manombo (IV), which consists of two non-contiguous parcels (one with a littoral forest and another with a rainforest), exhibited higher deforestation rates outside its second parcel, which is surrounded by an extensive forest. This trend aligns with other isolated PAs, such as Zombitse-Vohibasia (II) and Mananara-Nord (II), where the deforestation in outer buffers exceeds that within the PAs. These findings suggest that local populations recognize and adhere to PA boundaries, particularly in older PAs established nearly a century ago, such as Tsaratanàna (I) and Tsimanampetsotse (II; Figure 1). The expansion of these older PAs in 2015 into inhabited areas was generally accepted by local communities, highlighting the importance of participatory approaches in PA management.
For the vast majority of PAs, deforestation rates were higher in the 5 km buffers around PAs compared to inside the PAs in categories I to IV as well as in categories V and VI. This pattern underscores the effectiveness of well-defined PA boundaries and the historical involvement of local communities in conservation management. Notably, the establishment of large PAs in categories V and VI, such as Corridors Ankeniheny-Zahamena (VI) and Ambositra-Vondrozo (V), has enhanced the protection of older PAs by connecting them and incorporating their buffer zones. For instance, deforestation rates in the outer buffers of PAs in categories I to IV decreased when these buffers were included in the new PAs created in 2015, providing formal protection to these areas. Many of the older PAs in categories I to IV, such as national parks and Special Reserves, were initially isolated and lacked connectivity. However, the creation of newer PAs in categories V and VI, including corridors like Ankeniheny-Zahamena (VI) and Ambositra-Vondrozo (V), not only connected these areas [18] but also incorporated outer buffers within the new PA boundaries, offering additional protection and reinforcing conservation efforts. This further supports the argument that incorporating buffer zones into PA planning can enhance their long-term effectiveness.
Madagascar’s protected areas (PAs) are relatively small compared to those in the rest of Africa, yet they face significant deforestation challenges. Larger PAs with extensive forested areas often experience higher deforestation rates due to difficulties in effective monitoring and enforcement in such vast landscapes. This is consistent with findings by Spracklen et al. [57] and Wolf et al. [58], who highlight that deforestation pressures are greater in larger PAs because resource constraints and management challenges limit enforcement capacity. In Madagascar, smaller PAs, such as those managed by the Missouri Botanical Garden, benefit from higher staffing densities (≥0.5 staff/km2), which improve oversight and management [14]. In contrast, larger PAs like Masoala (II) and Tsimanampesotse (II), with staffing densities as low as 0.02 staff/km2, face significant challenges in effective management, underscoring the urgent need for adequate staffing and resource allocation to ensure successful PA conservation [14]. Globally, protected area staffing remains a challenge, with Appleton et al. [59] estimating an average of one staff member per 100 km2 across terrestrial PAs, which is far below the level required for effective management. Similar issues have been highlighted in other regions, such as South and Southeast Asia, where optimal ranger densities are estimated at 10 rangers per 100 km2 (0.1 rangers/km2), and East Asia, where the optimal density is 5 rangers per 100 km2 (0.05 rangers/km2) [60]. These examples emphasize the critical role of adequate staffing for the effective management of PAs, particularly in larger or more remote areas.
In contrast to categories I to IV, PAs in categories V and VI face distinct challenges, many of which can be related to the presence of people inside the protected areas. The highest annual deforestation rates were recorded in Mangabe-Ranomena-Sahasarotra (V) (49.3% inside in 2023) and Menabe-Antimena (V) (11.1% in 2017). A key issue with Mangabe-Ranomena-Sahasarotra is that it does not function as a true protected area according to IUCN standards. Instead, its governance framework resembles a Transfer of Natural Resource Management (TGRN) rather than a formally managed PA. A TGRN is a decentralized governance approach in Madagascar that grants local communities the legal authority to manage natural resources through contractual agreements, aiming to balance conservation with sustainable resource use under the GELOSE law (1996) [61]. This governance structure is reflected in its deforestation patterns, where forest loss inside the PA closely mirrors that of its outer buffer zone. Between 2015 and 2023 the PA lost 53.53 km2 of its forest, corresponding to 55.8% of its forest cover in 2015. At the same time, 45.20 km2 (63.4%) of forests were cleared in the 5 km buffer zone around the PA. By early 2024, only 42.03 km2 (corresponding to 15.5% of the protected area) of forest remained within its boundaries, compared to 26.16 km2 (5.7% of the area) of the outer buffer. Similarly, Menabe-Antimena (V) has faced intense deforestation, driven by governance weaknesses that are typical of category V PAs, with significant forest loss recorded in 2017. PAs with obvious governance deficits devaluate the merits of the various IUCN categories.
In contrast, well-managed PAs like Ankodida (IV), established with clear zoning and boundaries, demonstrate that local communities can respect and understand properly designed governance systems. The situation in Menabe-Antimena (V) is particularly alarming, as the PA has lost 307.41 km2 of forest (34.8% of its forest cover) over the past nine years despite numerous conservation initiatives. High deforestation rates in the Menabe-Antimena (V) region are driven by slash-and-burn agriculture for cash crops like maize and peanuts, fueled by demographic pressure, migration, weak governance, and the influence of corrupt intermediaries benefiting from unregulated markets [62]. These constraints are illustrated by the demographic measures, such as the number of men per women or the percentage of immigrating to emigrating males. Infrastructure expansion, particularly road networks, has been identified as a major driver of deforestation in tropical forests, facilitating access for logging, agriculture, and settlement, often undermining the integrity of protected areas [57,63]. These patterns reinforce the need for stronger governance mechanisms that incorporate land-use planning beyond PA boundaries, ensuring that buffer zones function as effective conservation tools rather than unmanaged transition zones.
Recent forest fires in Ambohitantely (IV) (starting 21 October 2023 and lasting for 19 days), Mantadia (II) (December 2024), Ambatotsirongorongo (IV) (December 2024/January 2015) and Ranomafana (II) (January 2025) have been initiated by people within the protected areas. These fires can destroy large portions of forest, compromising decades of conservation efforts within a few days. Thus, despite improvements in PA management over the years, these activities underscore the need for raising more awareness within neighboring communities, including better monitoring and response strategies. Climate change is a contributing factor, further exacerbating these challenges [29]. Given these ongoing threats, PA management must go beyond traditional boundary enforcement and consider broader land-use strategies that integrate adjacent landscapes into conservation planning. Improving land-use planning around PAs, addressing governance gaps, and improving conservation strategies remain critical steps in ensuring the resilience of Madagascar’s protected areas.
It is clear that there are PAs (mostly small PAs) with effective protection. Small PAs have less forest around them than large PAs (which is highly significant in terms of absolute values as well as the percent of forest cover; so far, we do not consider these correlations). But small PAs are better protected even though there are fewer forest resources around them. This means that people can substitute forest resources taken from PAs with resources obtained from elsewhere. This phenomenon is poorly studied but warrants further attention. The better protection of forests within protected areas I to IV also indicates that forest protection can result in the adaptation of people who now replace forest resources via other means. Though this conclusion is speculative for the time being, a more detailed comparison of the socio-economies of people around PAs with no or low deforestation rates with the socio-economies of people around PAs with high deforestation rates might provide clues on how to improve the situation of people without increasing deforestation rates inside PAs.
5. Conclusions
This study demonstrates a pronounced difference in deforestation rates between protected areas under different management schemes. PAs managed by institutional entities, such as Madagascar National Park or NGOs, have annual deforestation rates around 0.2% while annual deforestation rates in PAs under community management are about four times higher (0.8% per year). Buffer zones around the PAs are subject to even higher deforestation rates of about 2%, irrespective of the management of the PA. These buffer zones absorb deforestation, helping to mitigate forest loss and indirectly supporting the governance and management of Madagascar’s protected areas (PAs). By examining spatial deforestation trends and the role of buffer zones, the findings provide accessible and actionable insights for policymakers and practitioners in Madagascar. As previous summaries [44] and our analyses and examples show, no universal rule for mitigating deforestation can be identified. However, two key aspects stand out: the crucial role of park managers within PAs (see also [14]) and the buffering function of the areas surrounding formal PA boundaries. Various factors, linked not only to the socio-economic situation, but also to local governance and cultural background and identity [64], jointly influence forest cover change—both positively and negatively—making it essential to avoid a one-size-fits-all approach. Instead, governance and management interventions must be adapted to reflect and address local realities effectively.
Supplementary Materials
The following supporting information can be downloaded at: https://www.mdpi.com/article/10.3390/land14040698/s1, Table S1: Annual deforestation rates and population data for protected areas and buffer zones in Madagascar (2015–2023); Buffer: total in = inside protected areas; out to 5 km = 5 km buffer zone around PAs; IUCN lists IUCN conservation categories; Table S2: Surface of forest cover and forest loss between 2015 and 2023 in protected areas (PAs) and the buffer zone of 0–5 km around the protected areas considered here by IUCN category. Values are medians and quartiles: Q25–median–Q75 and ranges in brackets; Box S1: Household, population, and migration dynamics.
Author Contributions
Conceptualization, F.O.D.A. and L.W.; methodology, F.O.D.A.; software, F.O.D.A.; (spatial analysis was conducted by J.U.G. and L.W. using ESRI ArcGIS Pro 3.4.2, statistical analyses were performed with SPSS 29.0.2.0, and Python 3.11.4 was used for data processing and visualization); validation, F.O.D.A., J.U.G., P.O.W. and L.W.; formal analysis, F.O.D.A., J.U.G. and L.W.; investigation, F.O.D.A., J.U.G., P.O.W. and L.W.; resources, F.O.D.A., J.U.G. and L.W.; data curation, F.O.D.A., J.U.G. and L.W.; writing—original draft preparation, F.O.D.A., J.U.G., P.O.W. and L.W.; writing—review and editing, F.O.D.A., J.U.G., P.O.W. and L.W.; visualization, F.O.D.A., J.U.G. and L.W.; supervision, J.U.G. and L.W.; project administration, L.W. All authors have read and agreed to the published version of the manuscript.
Funding
This research received no external funding.
Data Availability Statement
The data used for the present manuscript are provided in the Supplementary Materials.
Acknowledgments
We would like to acknowledge the support of Serge C. Rafanoharana, who has contributed to previous analyses on protected areas and external buffers. We thank the anonymous reviewers and editors for their constructive help, comments, and suggestions.
Conflicts of Interest
The authors declare no conflicts of interest.
References
- Bingham, H.C.; Juffe Bignoli, D.; Lewis, E.; MacSharry, B.; Burgess, N.D.; Piero Visconti, P.; Deguignet, M.; Misrachi, M.; Walpole, M.; Stewart, J.L.; et al. Sixty years of tracking conservation progress using the World Database on Protected Areas. Nat. Ecol. Evo. 2019, 3, 737–743. [Google Scholar] [CrossRef] [PubMed]
- Zeng, Y.; Koh, L.P.; Wilcove, D.S. Gains in biodiversity conservation and ecosystem services from the expansion of the planet’s protected areas. Sci. Adv. 2022, 8, eabl9885. [Google Scholar] [CrossRef] [PubMed]
- Ana, S.L.; Rouyer, M.-M. Measuring the benefits of protected areas. Nature 2023, 622, 39–40. [Google Scholar] [CrossRef]
- Watson, J.; Dudley, N.; Segan, D.; Hockings, M. The performance and potential of protected areas. Nature 2014, 515, 67–73. [Google Scholar] [CrossRef] [PubMed]
- Geldmann, J.; Manica, A.; Burgess, N.D.; Coad, L.; Balmford, A. A global-level assessment of the effectiveness of protected areas at resisting anthropogenic pressures. Proc. Natl. Acad. Sci. USA 2019, 116, 23209–23215. [Google Scholar] [CrossRef]
- Eklund, J.; Arponen, A.; Visconti, P.; Cabeza, M. Governance factors in the identification of global conservation priorities for mammals. Philos. Trans. R. Soc. B Biol. Sci. 2011, 366, 2661–2669. [Google Scholar] [CrossRef]
- Symes, W.S.; Rao, M.; Mascia, M.B.; Carrasco, L.R. Why do we lose protected areas? Factors influencing protected area downgrading, downsizing and degazettement in the tropics and subtropics. Glob. Chang. Biol. 2016, 22, 656–665. [Google Scholar] [CrossRef]
- Fuller, C.; Ondei, S.; Brook, B.W.; Jessie, C.B. First, do no harm: A systematic review of deforestation spillovers from protected areas. Glob. Ecol. Cons. 2019, 18, e00591. [Google Scholar] [CrossRef]
- Antonelli, A.; Smith, R.J.; Perrigo, A.L.; Crottini, A.; Hackel, J.; Testo, W.; Andriamanohera, A.M.; Andriambololonera, S.; Bachman, S.P.; Bacon, C.D.; et al. Madagascar’s extraordinary biodiversity: Evolution, distribution, and use. Science 2022, 378, abf0869. [Google Scholar] [CrossRef]
- Ralimanana, H.; Perrigo, A.L.; Smith, R.J.; Borrell, J.S.; Faurby, S.; Rajaonah, M.T.; Randriamboavonjy, T.; Vorontsova, M.S.; Cooke, R.S.C.; Phelps, L.N.; et al. Madagascar’s extraordinary biodiversity: Threats and opportunities. Science 2022, 378, eadf1466. [Google Scholar] [CrossRef]
- Harper, G.J.; Steininger, M.K.; Tucker, C.J.; Juhn, D.; Hawkins, F. Fifty years of deforestation and forest fragmentation in Madagascar. Environ. Conser. 2007, 34, 325–333. [Google Scholar] [CrossRef]
- Vieilledent, G.; Grinand, C.; Rakotomalala, F.A.; Ranaivosoa, R.; Rakotoarijaona, J.-R.; Allnutt, T.F.; Achard, F. Combining global tree cover loss data with historical national forest-cover maps to look at six decades of deforestation and forest fragmentation in Madagascar. Biol. Conserv. 2018, 222, 189–197. [Google Scholar] [CrossRef]
- Rafanoharana, S.C.; Andrianambinina, F.O.D.; Rasamuel, H.A.; Waeber, P.O.; Wilmé, L.; Ganzhorn, J.U. Projecting forest cover in Madagascar’s protected areas to 2050 and its implications for lemur conservation. Oryx 2024, 58, 155–163. [Google Scholar] [CrossRef]
- Rakotobe, D.J.; Stevens, N.J. Closing staffing gaps in Madagascar’s protected areas to achieve the 30 by 30 conservation target. Conserv. Sci. Pract. 2024, 6, e13118. [Google Scholar] [CrossRef]
- Andrianambinina, F.O.D.; Rafanoharana, S.C.; Rasamuel, H.A.; Waeber, P.O.; Ganzhorn, J.U.; Wilmé, L. Decrease of deforestation in Protected Areas of Madagascar during the COVID-19 years. Madag. Conserv. Dev. 2023, 18, 15–21. [Google Scholar] [CrossRef]
- Zinner, D.; Wygoda, C.; Razafimanantsoa, L.; Rasoloarison, R.; Andrianandrasana, H.T.; Ganzhorn, J.U.; Torkler, F. Analysis of deforestation patterns in the central Menabe, Madagascar, between 1973 and 2010. Reg. Environ. Chang. 2014, 14, 157–166. [Google Scholar] [CrossRef]
- Eklund, J.; Blanchet, F.G.; Nyman, J.; Rocha, R.; Virtanen, T.; Cabeza, M. Contrasting spatial and temporal trends of protected area effectiveness in mitigating deforestation in Madagascar. Biol. Conserv. 2016, 203, 290–297. [Google Scholar] [CrossRef]
- Gardner, C.J.; Nicoll, M.E.; Birkinshaw, C.; Harris, A.; Lewis, R.E.; Rakotomalala, D.; Ratsifandrihamanana, A.N. The rapid expansion of Madagascar’s protected area system. Biol. Conserv. 2018, 220, 29–36. [Google Scholar] [CrossRef]
- Rafanoharana, S.C.; Andrianambinina, F.O.D.; Rasamuel, H.A.; Rakotoarijaona, M.A.; Ganzhorn, J.U.; Waeber, P.O.; Wilmé, L. Exemplifying deforestation processes in four protected areas in Madagascar. Forests 2021, 12, 1143. [Google Scholar] [CrossRef]
- Desbureaux, S.; Damania, R. Rain, forests and farmers: Evidence of drought-induced deforestation in Madagascar and its consequences for biodiversity conservation. Biol. Conserv. 2018, 221, 357–364. [Google Scholar] [CrossRef]
- Ralambomanantsoa, T.F.; Ramahatanarivo, M.E.; Donati, G.; Eppley, T.M.; Ganzhorn, J.U.; Glos, J.; Kübler, D.; Ratovonamana, Y.R.; Rakotondranary, J.S. Towards new agricultural practices to mitigate food insecurity in southern Madagascar. In Defining Agroecology; Dormann, C.F., Batáry, P., Grass, I., Klein, A.-M., Loos, J., Scherber, C., Steffan-Dewenter, I., Wanger, T.C., Eds.; Zenodo: Genève, Switzerland, 2023; pp. 187–204. [Google Scholar] [CrossRef]
- IOM (International Organization for Migration) Madagascar. Evidencing the Impacts of the Humanitarian Crisis in Southern Madagascar on Migration, and the Multisectorial Linkages that Drought-Induced Migration Has on Other Sectors of Concern; The UN Migration Agency: Antananarivo, Madagascar, 2017. [Google Scholar]
- Canavesio, R.; Pardieu, V. Rushing for gemstones and gold: Reflecting on experiences from the United States, Canada, New Zealand, Australia and Madagascar, 1848-present. Extr. Ind. Soc. Int. J. 2019, 6, 1055–1065. [Google Scholar] [CrossRef]
- Waeber, P.O.; Wilmé, L.; Ramamonjisoa, B.; Garcia, C.; Rakotomalala, D.; Rabemananjara, Z.H.; Kull, C.; Ganzhorn, J.U.; Sorg, J.-P. Dry forests in Madagascar, neglected and under pressure. Int. For. Rev. 2015, 17, 127–148. [Google Scholar] [CrossRef]
- Rasolofoson, R.A.; Ferraro, P.J.; Jenkins, C.N.; Jones, J.P.G. Effectiveness of community forest management at reducing deforestation in Madagascar. Biol. Cons. 2025, 184, 271–277. [Google Scholar] [CrossRef]
- Holloway, G.; Short, S. Towards a more adaptive co—management of natural resources–increasing social—ecological resilience in southeast Madagascar. Madag. Conserv. Dev. 2014, 9, 36–48. [Google Scholar] [CrossRef]
- Herrera, J.P. Testing the adaptive radiation hypothesis for the lemurs of Madagascar. R. Soc. Open Sci. 2017, 4, 161014. [Google Scholar] [CrossRef]
- Andrianambinina, F.O.D.; Waeber, P.O.; Schuurman, D.; Lowry II, P.P.; Wilmé, L. Clarification on protected area management efforts in Madagascar during periods of heightened uncertainty and instability. Madag. Conserv. Dev. 2022, 17, 25–28. [Google Scholar] [CrossRef]
- Almulhim, A.I.; Alverio, G.N.; Sharifi, A.; Shaw, R.; Huq, S.; Mahmud, M.J.; Ahmad, S.; Abubakar, I.R. Climate-induced migration in the Global South: An in depth analysis. Npj Clim. Action 2024, 3, 47. [Google Scholar] [CrossRef]
- Rigden, A.; Golden, C.; Chan, D.; Huybers, P. Climate change linked to drought in Southern Madagascar. Clim. Atmos. Sci. 2024, 41, 7. [Google Scholar] [CrossRef]
- Randriamalala, H.; Liu, Z. Rosewood of Madagascar: Between democracy and conservation. Madag. Conserv. Dev. 2010, 5, 11–22. [Google Scholar] [CrossRef]
- Randriamalala, H.; Waeber, P.; Wilmé, L. Les cyber-verts contre le trafic de bois de rose malgache. In Madagascar, le Coup d’État de Mars 2009; Randrianja, S., Ed.; Éditions Karthala: Paris, France, 2012; pp. 123–145. [Google Scholar]
- Waeber, P.O.; Wilmé, L.; Mercier, J.-R.; Camara, C.; Lowry II, P.P. How effective have thirty years of internationally driven conservation and development efforts been in Madagascar? PLoS ONE 2016, 11, e0161115. [Google Scholar] [CrossRef]
- Randrianja, S. Love me tender – Transition vers où? Madag. Conserv. Dev. 2012, 7, 9–16. [Google Scholar] [CrossRef][Green Version]
- Llopis, J.C.; Harimalala, P.C.; Bär, R.; Heinimann, A.; Rabemananjara, Z.H.; Zaehringer, J.G. Effects of protected area establishment and cash crop price dynamics on land use transitions 1990–2017 in north-eastern Madagascar. J. Land Use Sci. 2019, 14, 52–80. [Google Scholar] [CrossRef]
- Andriatsitohaina, R.N.N.; Laby, P.; Llopis, J.C.; Martin, D.A. Agroforestry in Madagascar: Past, present, and future. Agrofor. Syst. 2024, 98, 1659–1680. [Google Scholar] [CrossRef] [PubMed]
- Jones, J.P.G.; Ratsimbazafy, J.; Ratsifandrihamanana, A.N.; Watson, J.E.M.; Andrianandrasana, H.T.; Cabeza, M.; Cinner, J.E.; Goodman, S.M.; Hawkins, F.; Mittermeier, R.A.; et al. Madagascar: Crime threatens biodiversity. Science 2019, 363, 825. [Google Scholar] [CrossRef]
- Bodonirina, N.; Reibelt, L.M.; Stoudmann, N.; Chamagne, J.; Jones, T.G.; Ravaka, A.; Ranjaharivelo, H.V.F.; Ravonimanantsoa, T.; Moser, G.; De Grave, A.; et al. Approaching local perceptions of forest governance and livelihood challenges with companion modeling from a case study around Zahamena National Park, Madagascar. Forests 2018, 9, 624. [Google Scholar] [CrossRef]
- Randrianasolo, A.; Randrianasolo, A.A. Understanding the role of organizational legitimacy within the realm of the community-based conservation approach. Madag. Conserv. Dev. 2017, 12, 13–24. [Google Scholar] [CrossRef]
- Klein, B.I. Dina, domination, and resistance: Indigenous institutions, local politics, and resource governance in Madagascar. J. Peasant Stud. 2024, 51, 81–110. [Google Scholar] [CrossRef]
- Neugarten, R.A.; Rasolofoson, R.A.; Barrett, C.B.; Vieilledent, G.; Rodewald, A.D. The effect of a political crisis on performance of community forests and protected areas in Madagascar. Nat. Commun. 2024, 15, 2963. [Google Scholar] [CrossRef]
- Dudley, N. (Ed.) Guidelines for Applying Protected Area Management Categories; IUCN: Gland, Switzerland, 2008; pp. i–x + 1–86. Including: Stolton, S.; Shadie, P.; Dudley, N. IUCN WCPA Best Practice Guidance on Recognising Protected Areas and Assigning Management Categories and Governance Types; Best Practice Protected Area Guidelines Series No. 21; IUCN: Gland, Switzerland, 2013; Available online: https://portals.iucn.org/library/sites/library/files/documents/PAG-021.pdf (accessed on 15 January 2025).
- Dudley, N.; Parrish, J.D.; Redford, K.H.; Stolton, S. The revised IUCN protected area management categories: The debate and ways forward. Oryx 2010, 44, 485–490. [Google Scholar] [CrossRef]
- Goodman, S.M.; Raherilalao, M.J.; Wohlauser, S. (Eds.) The Terrestrial Protected Areas of Madagascar: Their History, Description and Biota; Association Vahatra: Antananarivo, Madagascar, 2018. [Google Scholar]
- Waeber, P.O.; Rafanoharana, S.; Rasamuel, H.A.; Wilmé, L. Parks and Reserves in Madagascar: Managing Biodiversity for a Sustainable Future. In Protected Areas, National Parks and Sustainable Future; Bakar, A.N., Suratman, M.N., Eds.; IntechOpen: London, UK, 2020; pp. 89–108. [Google Scholar] [CrossRef]
- Desbureaux, S.; Kabore, I.; Vaglietti, G.; Baghai, M.; Lindsey, P.; Robson, A.; Delacote, P.; Leblois, A. Collaborative management partnerships strongly decreased deforestation in the most at-risk protected areas in Africa since 2000. Proc. Natl. Acad. Sci. USA 2024, 122, e2411348121. [Google Scholar] [CrossRef]
- Rafanoharana, S.C.; Andrianambinina, F.O.D.; Rasamuel, H.A.; Waeber, P.O.; Ganzhorn, J.U.; Wilmé, L. Tree Canopy Density thresholds for accurate forest cover estimation in protected areas of Madagascar. Environ. Res. Commun. 2023, 5, 071003. [Google Scholar] [CrossRef]
- Hansen, M.C.; Potapov, P.V.; Moore, R.; Hancher, M.; Turubanova, S.A.; Tyukavina, A.; Thau, D.; Stehman, S.V.; Goetz, S.J.; Loveland, T.R.; et al. High-resolution global maps of 21st-century forest cover change. Science 2013, 342, 850–853. [Google Scholar] [CrossRef] [PubMed]
- INSTAT, CCER (Institut National de la Statistique, Cellule Centrale d’Exécution du Recensement). Troisième Recensement Général de la Population et de l’Habitation (RGPH-3). Résultats Globaux du Recensement Général de la Population et de l’Habitation de 2018 de Madagascar (RGPH-3). Tome 1; INSTAT: Antananarivo, Madagascar, 2020; pp. i–xxxii, 1–160. Available online: https://madagascar.unfpa.org/sites/default/files/pub-pdf/resultat_globaux_rgph3_tome_01.pdf (accessed on 12 November 2024).
- INSTAT, CCER (Institut National de la Statistique, Cellule Centrale d’Exécution du Recensement). Troisième Recensement Général de la Population et de l’Habitation (RGPH-3). Résultats Globaux du Recensement Général de la Population et de l’Habitation de 2018 de Madagascar (RGPH-3). Tome 2; INSTAT: Antananarivo, Madagascar, 2020; pp. 1–226. Available online: https://madagascar.unfpa.org/sites/default/files/pub-pdf/resultat_globaux_rgph3_tome_02.pdf (accessed on 12 November 2024).
- Martino, D. Buffer Zones Around Protected Areas: A Brief Literature Review. Electron. Green J. 2001, 15, 1. Available online: https://escholarship.org/uc/item/02n4v17n (accessed on 15 January 2025).
- Silwal, T.; Devkota, B.P.; Poudel, P.; Morgan, M. Do buffer zone programs improve local livelihoods and support biodiversity conservation? The case of Sagarmatha National Park, Nepal. Trop. Conserv. Sci. 2022, 15, 19400829221106670. [Google Scholar] [CrossRef]
- de Almeida-Rocha, J.M.; Peres, C.A. Nominally protected buffer zones around tropical protected areas are as highly degraded as the wider unprotected countryside. Biol. Conserv. 2021, 256, 109068. [Google Scholar] [CrossRef]
- Zaehringer, J.G.; Eckert, S.; Messerli, P. Revealing regional deforestation dynamics in North-Eastern Madagascar—Insights from multi-temporal land cover change analysis. Land 2015, 4, 454–474. [Google Scholar] [CrossRef]
- Zaehringer, J.G.; Hett, C.; Ramamonjisoa, B.; Messerli, P. Beyond deforestation monitoring in conservation hotspots: Analysing landscape mosaic dynamics in North-Eastern Madagascar. Appl. Geogr. 2016, 68, 9–19. [Google Scholar] [CrossRef]
- Barber, C.P.; Cochrane, M.A.; Souza, C.M., Jr.; Laurance, W.F. Roads, deforestation, and the mitigating effect of protected areas in the Amazon. Biol. Conserv. 2014, 177, 203–209. [Google Scholar] [CrossRef]
- Spracklen, B.D.; Kalamandeen, M.; Galbraith, D.; Gloor, E.; Spracklen, D.V. A global analysis of deforestation in moist tropical forest protected areas. PLoS ONE 2015, 10, e0143886. [Google Scholar] [CrossRef]
- Wolf, C.; Levi, T.; Ripple, W.J.; Zárrate-Charry, D.A.; Betts, M.G. A forest loss report card for the world’s protected areas. Nat. Ecol. Evol. 2021, 5, 520–529. [Google Scholar] [CrossRef]
- Appleton, M.R.; Courtiol, A.; Emerton, L.; Slade, J.L.; Tilker, A.; Warr, L.C.; Malvido, M.Á.; Barborak, J.R.; de Bruin, L.; Chapple, R.; et al. Protected area personnel and ranger numbers are insufficient to deliver global expectations. Nat. Sustain. 2022, 5, 1100–1110. [Google Scholar] [CrossRef]
- Gray, T.N.; Belecky, M.; Singh, R.; Moreto, W.D.; Chapman, S. Insufficient numbers and poor working conditions for rangers protecting tigers. Conserv. Sci. Pract. 2024, 6, e13157. [Google Scholar] [CrossRef]
- Ramamonjisoa, B.; Rakoto Ramiarantsoa, H.; Casse, T. La Loi Gelose et le transfert de gestion des ressources naturelles à Madagascar. Les Cah. Outre-Mer Rev. Géogr. Bordeaux 2012, 65, 5–10. [Google Scholar] [CrossRef]
- Vieilledent, G.; Nourtier, M.; Grinand, C.; Pedrono, M.; Clausen, A.; Rabetrano, T.; Rakotoarijaona, J.-R.; Rakotoarivelo, B.; Rakotomalala, F.; Rakotomalala, L.; et al. It’s not just poverty: Unregulated global market and bad governance explain unceasing deforestation in Western Madagascar. bioRxiv 2020. [Google Scholar] [CrossRef]
- Laurance, W.F.; Arrea, I.B. Roads to riches or ruin? Science 2017, 358, 442–444. [Google Scholar] [CrossRef]
- Scales, I.R. A brief history of the state and the politics of natural resource use in Madagascar. In Conservation and Environmental Management in Madagascar; Scales, I., Ed.; Routledge: London, UK; New York, NY, USA, 2014; pp. 129–145. [Google Scholar]
Disclaimer/Publisher’s Note: The statements, opinions and data contained in all publications are solely those of the individual author(s) and contributor(s) and not of MDPI and/or the editor(s). MDPI and/or the editor(s) disclaim responsibility for any injury to people or property resulting from any ideas, methods, instructions or products referred to in the content. |
© 2025 by the authors. Licensee MDPI, Basel, Switzerland. This article is an open access article distributed under the terms and conditions of the Creative Commons Attribution (CC BY) license (https://creativecommons.org/licenses/by/4.0/).