Article

Simulation of Multi-Scale Water Supply Service Flow Pathways and Ecological Compensation for Urban–Rural Sustainability: A Case Study of the Fenhe River Basin

1
Laboratory for Urban Future, Peking University Shenzhen Graduate School, Peking University (Shenzhen), Shenzhen 518055, China
2
Key Laboratory for Urban Habitat Environmental Science and Technology, School of Urban Planning and Design, Peking University (Shenzhen), Shenzhen 518055, China
3
Guangdong Overseas Chinese High School, Guangzhou 510030, China
4
Urban Planning & Design Institute of Shenzhen Co., Ltd., Shenzhen 518055, China
5
School of Economics and Management, Harbin Institute of Technology (Shenzhen), Shenzhen 518055, China
6
Key Laboratory for Earth Surface Processes, Ministry of Education, College of Urban and Environmental Sciences, Peking University, Beijing 100871, China
*
Author to whom correspondence should be addressed.
Land 2025, 14(4), 664; https://doi.org/10.3390/land14040664
Submission received: 1 March 2025 / Revised: 14 March 2025 / Accepted: 16 March 2025 / Published: 21 March 2025

Abstract

:
Neglecting ecosystem services has impeded sustainable urban–rural development, particularly in terms of the efficient flow of water supply services between urban and rural areas. This study focuses on the Fenhe River Basin, evaluating water supply and demand at the sub-basin, as well as county levels. Using the InVEST model to analyze basin-level geographic, meteorological, hydrological, and socio-economic data, the study reveals significant spatial and temporal mismatches between water supply and demand from 2010 to 2020. Through the calculated ecosystem services supply and demand ratio (0.3731 in 2010, −0.1555 in 2015, and −0.1063 in 2020), it is found although both supply and demand increased over the period, persistent deficits emerged, with water supply concentrated in upstream areas and demand primarily in downstream regions. The improved network connectivity by 2020, supported by water-saving policies and technological advancements, partially alleviated earlier imbalances. This research contributes a multi-scale framework to analyze ecosystem service flows and compensation mechanisms across grid, sub-basin, and county scales. Overall, the study underscores that research into ecological compensation plays a crucial role in enabling efficient resource flow, enhancing governance systems, and fostering an ecologically friendly urban–rural development model.

1. Introduction

As the foundation and support system for human activities, ecosystems are currently facing unprecedented challenges. Rapid urbanization has significantly impacted ecosystem resilience, leading to the degradation of ecosystem service supply (ESs) [1,2]. Additionally, population growth has dramatically increased the demand for water, energy, food, and other ESs [3,4]. Consequently, the balance between ES supply and demand is increasingly disrupted, giving rise to numerous ecological issues that severely affect human well-being [5,6]. These trends highlight the critical need for research to assess the losses in ecosystem services and evaluate mechanisms for human compensatory responses. Ecosystem services refer to the natural environmental conditions and benefits formed and maintained by natural ecosystems and their ecological processes, which are essential for human survival. They represent all the direct and indirect benefits that humans derive from natural ecological environments [7].
Ecosystem service flow integrates the supply of ecosystem services with human societal demand, considering both the direction and magnitude of flows. This enables it to effectively reveal dynamic patterns within coupled human-natural systems [8]. As an important link between natural ecosystems and human society, there are currently two mainstream understandings of ecosystem service flow. The first emphasizes the flow process [9,10]. For example, Fisher et al. [11], Jones et al. [12] divided ecosystem service flow into three types based on the spatial relationship of ecosystem service transmission: in situ service flow, omnidirectional service flow and directional service flow. The second stream of understandings emphasizes the final utility [13]. Methodologically, scholars have conducted a bunch of research on the formation process [13], potential mechanisms [14], social benefits [15], quantification [16], and spatial mapping [17] of ecosystem service flows. In particular, the research on the trajectory, direction and propagation process of ecosystem service flows has revealed the spatial mismatch between the supply and demand of ecosystem services. However, these understandings mostly focus on clarifying the path from ecosystem service generation to benefit and identifying the relationship between ecosystem service supply and demand [18]. Neglecting spatiotemporal coupling mechanisms between ecosystem service supply and demand remains a critical gap, hindering sustainable resource management.
To be more specific, water ecosystem services, as one of the crucial ecosystem services, have become a focal issue in current research on ecosystem service flows to alleviate water resource scarcity. Presently, studies on water ecosystem service flows primarily focus on two aspects: water supply service flows and flood regulation service flows. Identifying the supply and demand areas for water flow from a watershed perspective, along with quantifying supply and demand at multiple scales such as sub-basins and county administrative regions, is significant for the protection and restoration of watershed ecosystems as well as for the rational development and utilization of water resources [19,20].
Ecosystem compensation (EC) is an economic instrument designed to reconcile stakeholder interests by internalizing the costs and benefits of ecosystem use [21]. Grounded in the principle of “beneficiaries pay and polluters compensate”, EC establishes frameworks for compensating ecological damages, restoring degraded systems, and managing natural resources holistically. Amidst growing regional economic disparities and ecological imbalances, precisely identifying priority compensation zones and defining equitable standards have emerged as critical research priorities [22]. Quantifying compensation benchmarks is central to operationalizing EC, with four dominant methodologies: (1) total cost of ecological protection measures [23,24], (2) stakeholder willingness-to-pay [25,26], (3) ecosystem service valuation [27,28], and (4) ecological footprint analysis [29,30]. Recent advances propose that analyzing ecosystem service flows can refine compensation mechanisms, enhancing their equity, rationality, and alignment with sustainability goals [31,32]. However, socio-economic factors—such as population, land area, and GDP—profoundly influence compensation targets, beneficiaries, and thresholds. Overlooking these variables risks setting impractical standards, as seen in cases where compensation demands exceed regional fiscal capacities [27,33].
Research on watershed ecosystem service flows and ecological compensation often faces challenges in designing comprehensive compensation mechanisms due to administrative jurisdictional barriers. To address this, scholars have prioritized cross-regional analyses to uncover spatial patterns of ecosystem compensation. Many studies leverage land use patterns as proxies for spatially explicit compensation frameworks, enabling assessments of transboundary ecological obligations. However, current research on water-related ecosystem compensation remains limited in two key areas: (1) defining clear stakeholders (compensators and beneficiaries) for intra-regional environmental compensation, and (2) establishing transparent methodologies for revising compensation standards to reflect dynamic socio-ecological conditions.
To advance the scientific understanding of ecosystem service mechanisms, this study builds on prior work by adopting a watershed-scale approach. By integrating supply–demand dynamics across multiple spatial scales, we quantify water ecosystem service flows and their spatial-temporal dynamics. This methodology distinguishes between the potential supply capacity of ecosystems and the actual realized benefits for human populations, thereby preventing double-counting errors while establishing a robust foundation for precise compensation quantification.

2. Materials and Methods

This section provides a detailed overview of the study area, data sources, and research methodology. By analyzing the region’s natural geography and socio-economic conditions, it delineates the fundamental characteristics of the Fenhe River Basin. The required data encompass natural baseline data (e.g., topography, land use) and socio-economic data (e.g., water use, population density). The research focuses on assessing the supply and demand of ecosystem services, analyzing supply–demand matching relationships, constructing ecosystem service flow networks, and formulating and optimizing basin-wide ecological compensation strategies.

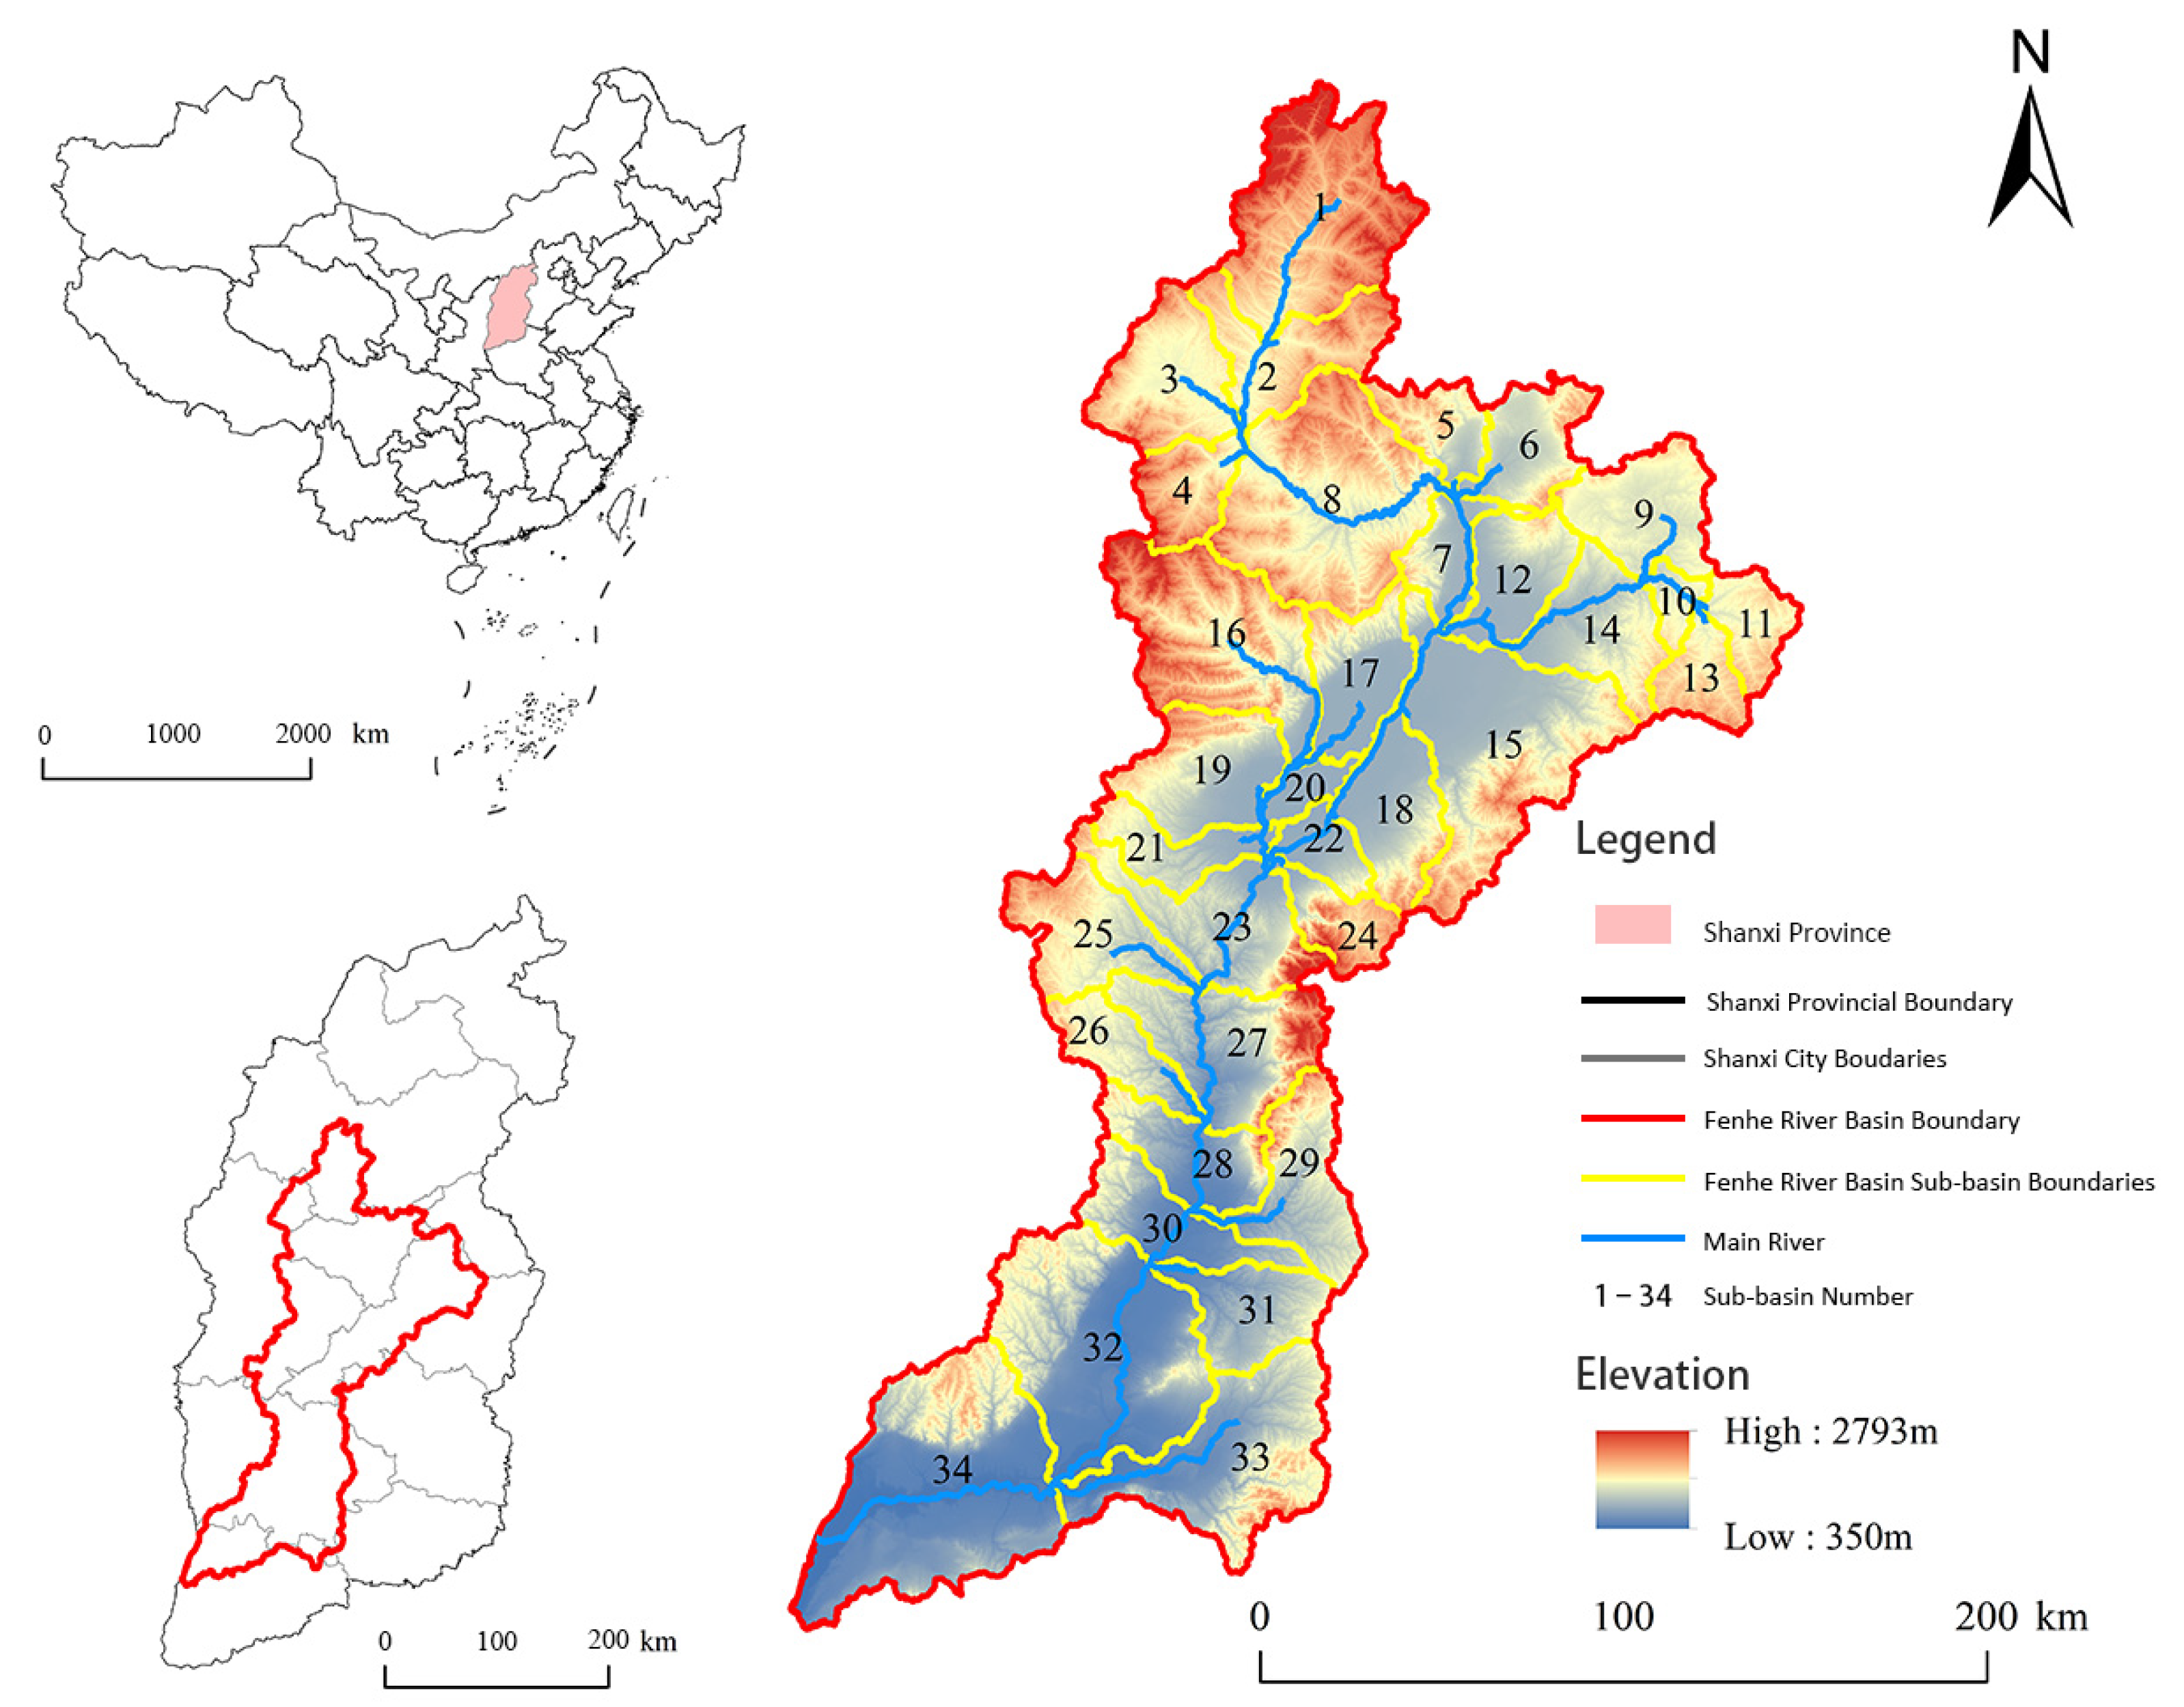
2.1. Study Area Overview

The Fen River Basin (35°20′–39°00′ N, 110°30′–113°32′ E), situated in central Shanxi Province on the eastern Loess Plateau, spans over 60 counties across nine cities. As the Yellow River’s second-largest tributary, it stretches 716 km before converging near Wanrong County, draining a 40,000 km2 watershed. Characterized by a temperate continental monsoon climate, the basin experiences low annual rainfall with high variability, concentrated heavily in summer. Topographically, the northern highlands transition to southern lowlands, marked by rugged mountains and sparse waterways. The erosion-prone upper reaches feature rocky soils, exacerbating sediment-rich floods. The middle Taiyuan Basin, a hub of economic activity, faces sedimentation and water scarcity despite its flat terrain. Downstream, the fertile Linfen and Yuncheng Basins benefit from ample water and optimal agroclimatic conditions, serving as Shanxi’s primary grain-producing regions.
By 2020, the total population of the Fen River Basin reaches 19.801 million, with a per capita GDP of 51,021 yuan, slightly higher than the average of 50,571 yuan in Shanxi Province; economic growth has surged from 247 billion yuan in 2010 to 1010 billion yuan in 2020, showing remarkable economic development. Taiyuan is not only the political and cultural center of Shanxi Province, but also the area with the highest concentration of economic activities. Overall, the economic performance of the Fen River Basin exceeds the average level of Shanxi Province, but there is an uneven economic development within the region.
This area is the economic core and ecological key area of Shanxi Province (see Figure 1). In recent years, due to population growth, over-exploitation and its unique geographical location, the problem of soil erosion in Fenhe River Basin has become increasingly serious, and the ecological environment is particularly fragile. Protecting the ecological security of Fen River Basin is the key goal of Fen River protection and management. At the same time as high-quality development of resource-intensive cities, how to carry out comprehensive ecological restoration from the perspective of broader and larger ecosystem functions has become an important issue to be solved at present [34].

2.2. Data

This study employs an ecosystem service flow network analysis to identify water ecosystem service supply and demand areas in the Fenhe River Basin for 2010, 2015, and 2020. The selection for 2010, 2015 and 2020 not only responds to the policy timeliness of watershed ecological governance of Fenhe River Basin, but also meets the technical feasibility of multidisciplinary data integration, and can reveal the evolution mechanism of the supply and demand of aquatic ecosystem services under the synergistic effect of rapid urbanization and climate change. It constructs flow networks, defines flow directions, and examines driving mechanisms and ecological compensation impacts. Data used include:
Basic Geographic Data: Administrative boundaries, water systems, and urban points from the National Basic Geographic Information Center; a 30 m-resolution DEM from the Geospatial Data Cloud; land use data (2010, 2015, 2020) from the China Land Cover Dataset (CLCD) [35]; soil type data (1:100,000), from the World Soil Database (HWSD); and vegetation root depth data, from the Chinese Surface Simulated Soil Database.
Meteorological and Hydrological Data: Evapotranspiration and rainfall data (1 km resolution) for 2010, 2015, and 2020. Precipitation data were sourced from Peng Shouzhang’s 1 km-resolution monthly precipitation dataset (1901–2022) [4], while evapotranspiration data were calculated using the Hargreaves formula based on temperature datasets from the National Tibetan Plateau Scientific Data Center [36].
Socio-Economic Data: Statistics on water use (agricultural, ecological, industrial, residential), GDP grid data, and population density grid data (2010–2020) [37].

2.3. Methods Applied

2.3.1. Ecosystem Service Supply Assessment

The InVEST model, designed for ecosystem management and decision-making, was used to assess water yield in the Fenhe River Basin for 2010, 2015, and 2020. The “Water Yield” module calculates water yield based on land use data, precipitation, plant transpiration, surface evaporation, root depth, and soil depth, excluding surface–groundwater interactions. Biophysical parameters for each land use type are detailed in Supplementary Materials Table S1.

2.3.2. Ecosystem Service Demand Assessment

Water ecosystem service demand was categorized into agricultural, industrial, residential, and ecological (forestry, livestock, fishery) uses. This classification scheme aligns with the FAO sectoral classification conventions, while decoupling ecological maintenance functions (e.g., shelter forest irrigation) from traditional agricultural practices. Data from the Shanxi Province Water Resources Bulletin were spatially allocated: industrial water to construction land, agricultural water to cultivated land, residential water to population density, and ecological water to forest, grassland, and water bodies.

2.3.3. Ecosystem Service Supply and Demand Matching

This study uses the ecosystem services supply and demand ratio (ESDR) to analyze the supply and demand of ecosystem services in a specific region and identify possible supply and demand contradictions. For water ecosystem services with actual quantitative indicators, the matching degree of supply and demand is calculated according to formula (1); By taking the logarithm of the ratio of supply and demand, the difference between supply and demand is amplified, and the coupling between supply and demand of ecosystem services is revealed more accurately.
E S D R = ln S D
In the formula, S and D represent the supply and demand of ecosystem services in the sub-basins of Fenhe River Basin, respectively. When the ESDR value is >0, it means that supply exceeds demand and is surplus. When the ESDR value is <0, it means that the supply is less than the demand, which is the deficit. When the value of ESDR is between 0 and 1, it indicates that supply and demand are in balance.

2.3.4. Ecosystem Service Flow Network Construction

Water Ecosystem Service Flow Network Construction

Due to terrain and gravity, water flows downstream along the river network. At the sub-basin scale, this study quantifies water ecosystem service flows using a network model. Network nodes, representing the centroids of 34 sub-basins extracted via ArcGIS 10.7, are weighted by the difference between supply and demand. Nodes are classified as supply nodes (supply > demand) or demand nodes (supply < demand), each with geographic coordinates and weights. Network edges are derived from the river network using ArcGIS 10.7. The model assumes that excess water from supply nodes flows downstream to adjacent nodes, while demand nodes interrupt flows. This accumulation-based flow continues until downstream demand can no longer be met.
Degree is a basic concept in network models that describes the activity and importance of nodes, quantified by the number of edges connected to a node. In a directed network, the number of edges starting from node m is called the outgoing degree, represented by ODm, and the number of edges ending at node m is called the incoming degree, represented by IDm. The degree of a node is the sum of ODm and IDm, and the calculation formula is shown in Equation (2):
D m = O D m + I D m
The flow of water ecosystem services depends on the supply–demand balance of sub-basins. Analyzing network connectivity reveals dynamic changes in these flows. Network density, calculated as the ratio of actual edges to the theoretical maximum (Equation (3)), measures connectivity: higher density indicates better connectivity.
D e n = E a E m
Den refers to the density of the network, E a refers to the actual number of edges in the network, and E m refers to the theoretical maximum number of edges. At the same time, in order to clarify the water flow in the network model, the color and thickness of the edge are used to represent the flow size, and the color depth of the sub-watershed is used to represent the amount of water ecosystem services received by the sub-watershed.

County-Level Analysis

For county-scale water ecosystem service flow simulation, the D8 algorithm in ArcGIS 10.7 was used to calculate flow direction at the grid scale. The D8 method, a widely used single-flow approach, assumes water flows to one of eight neighboring grids based on the steepest descent or maximum drop in elevation. Within a 3 × 3 DEM grid, the outflow grid is determined by calculating the distance-weighted drop between the center and adjacent grids, selecting the grid with the largest drop as the outflow point.
Next, the static water surplus—the difference between water production and consumption—was calculated for the Fenhe River Basin. Using Python programming (3.13.0), the dynamic water surplus was derived by simulating flow based on upstream–downstream relationships. If the dynamic surplus remains negative, it indicates a persistent water demand gap under natural flow conditions. Finally, county-level flow direction and discharge were calculated by aggregating grid-scale water quantity data, enabling the analysis of water supply services across administrative regions.

2.3.5. Ecological Compensation Policy

For water ecosystem services, assuming that the total ecological compensation fund is Q, the net ecological compensation fund Mi of a county or sub-basin is determined according to the difference between OUTi and INi, that is, the ratio of net expenditure to total net expenditure (N) (Pi) and the product of Q, where: if the value of a county or basin is positive, it means that the county or basin receives ecological compensation; if it is the beneficiary, it means that the county or basin is negative, it means that the county or basin is the payer. The calculation formula is shown in Formulas (4) and (5).
M i = Q × P i
P i = O U T i I N i N
Due to the imbalance of inter-regional economic development, the regional adjustment coefficient is added into the ecological compensation scheme by standardizing population density and socio-economic factors, and the ecological compensation standard is revised. The calculation formula is shown in Equation (6).
X i = X i X i m i n X i m a x X i m i n
X i is the normalization result of regional population density and GDP (dimensionless), and X i m i n and X i m a x are the minimum and maximum values of the two indicators. The estimation model of ecological compensation correction index is as follows, and the calculation formula is shown in Equation (7):
A i = a 1 × P O P i + b 1 × G D P i
A i   is the corrected index of regional ecological compensation, P O P i and G D P i are the results of population density and GDP normalization, a 1 and b 1   represent social adjustment factors and economic factors, and a 1 and b 1 are set to 0.5, respectively, in this study.
The payment standard simulation of ecological compensation is shown in Formula (8):
E i = M i × A i
In the formula, Ei is the allocation of ecological funds in Fen River Basin area i, and Ai is the regional ecological compensation correction index.

3. Results

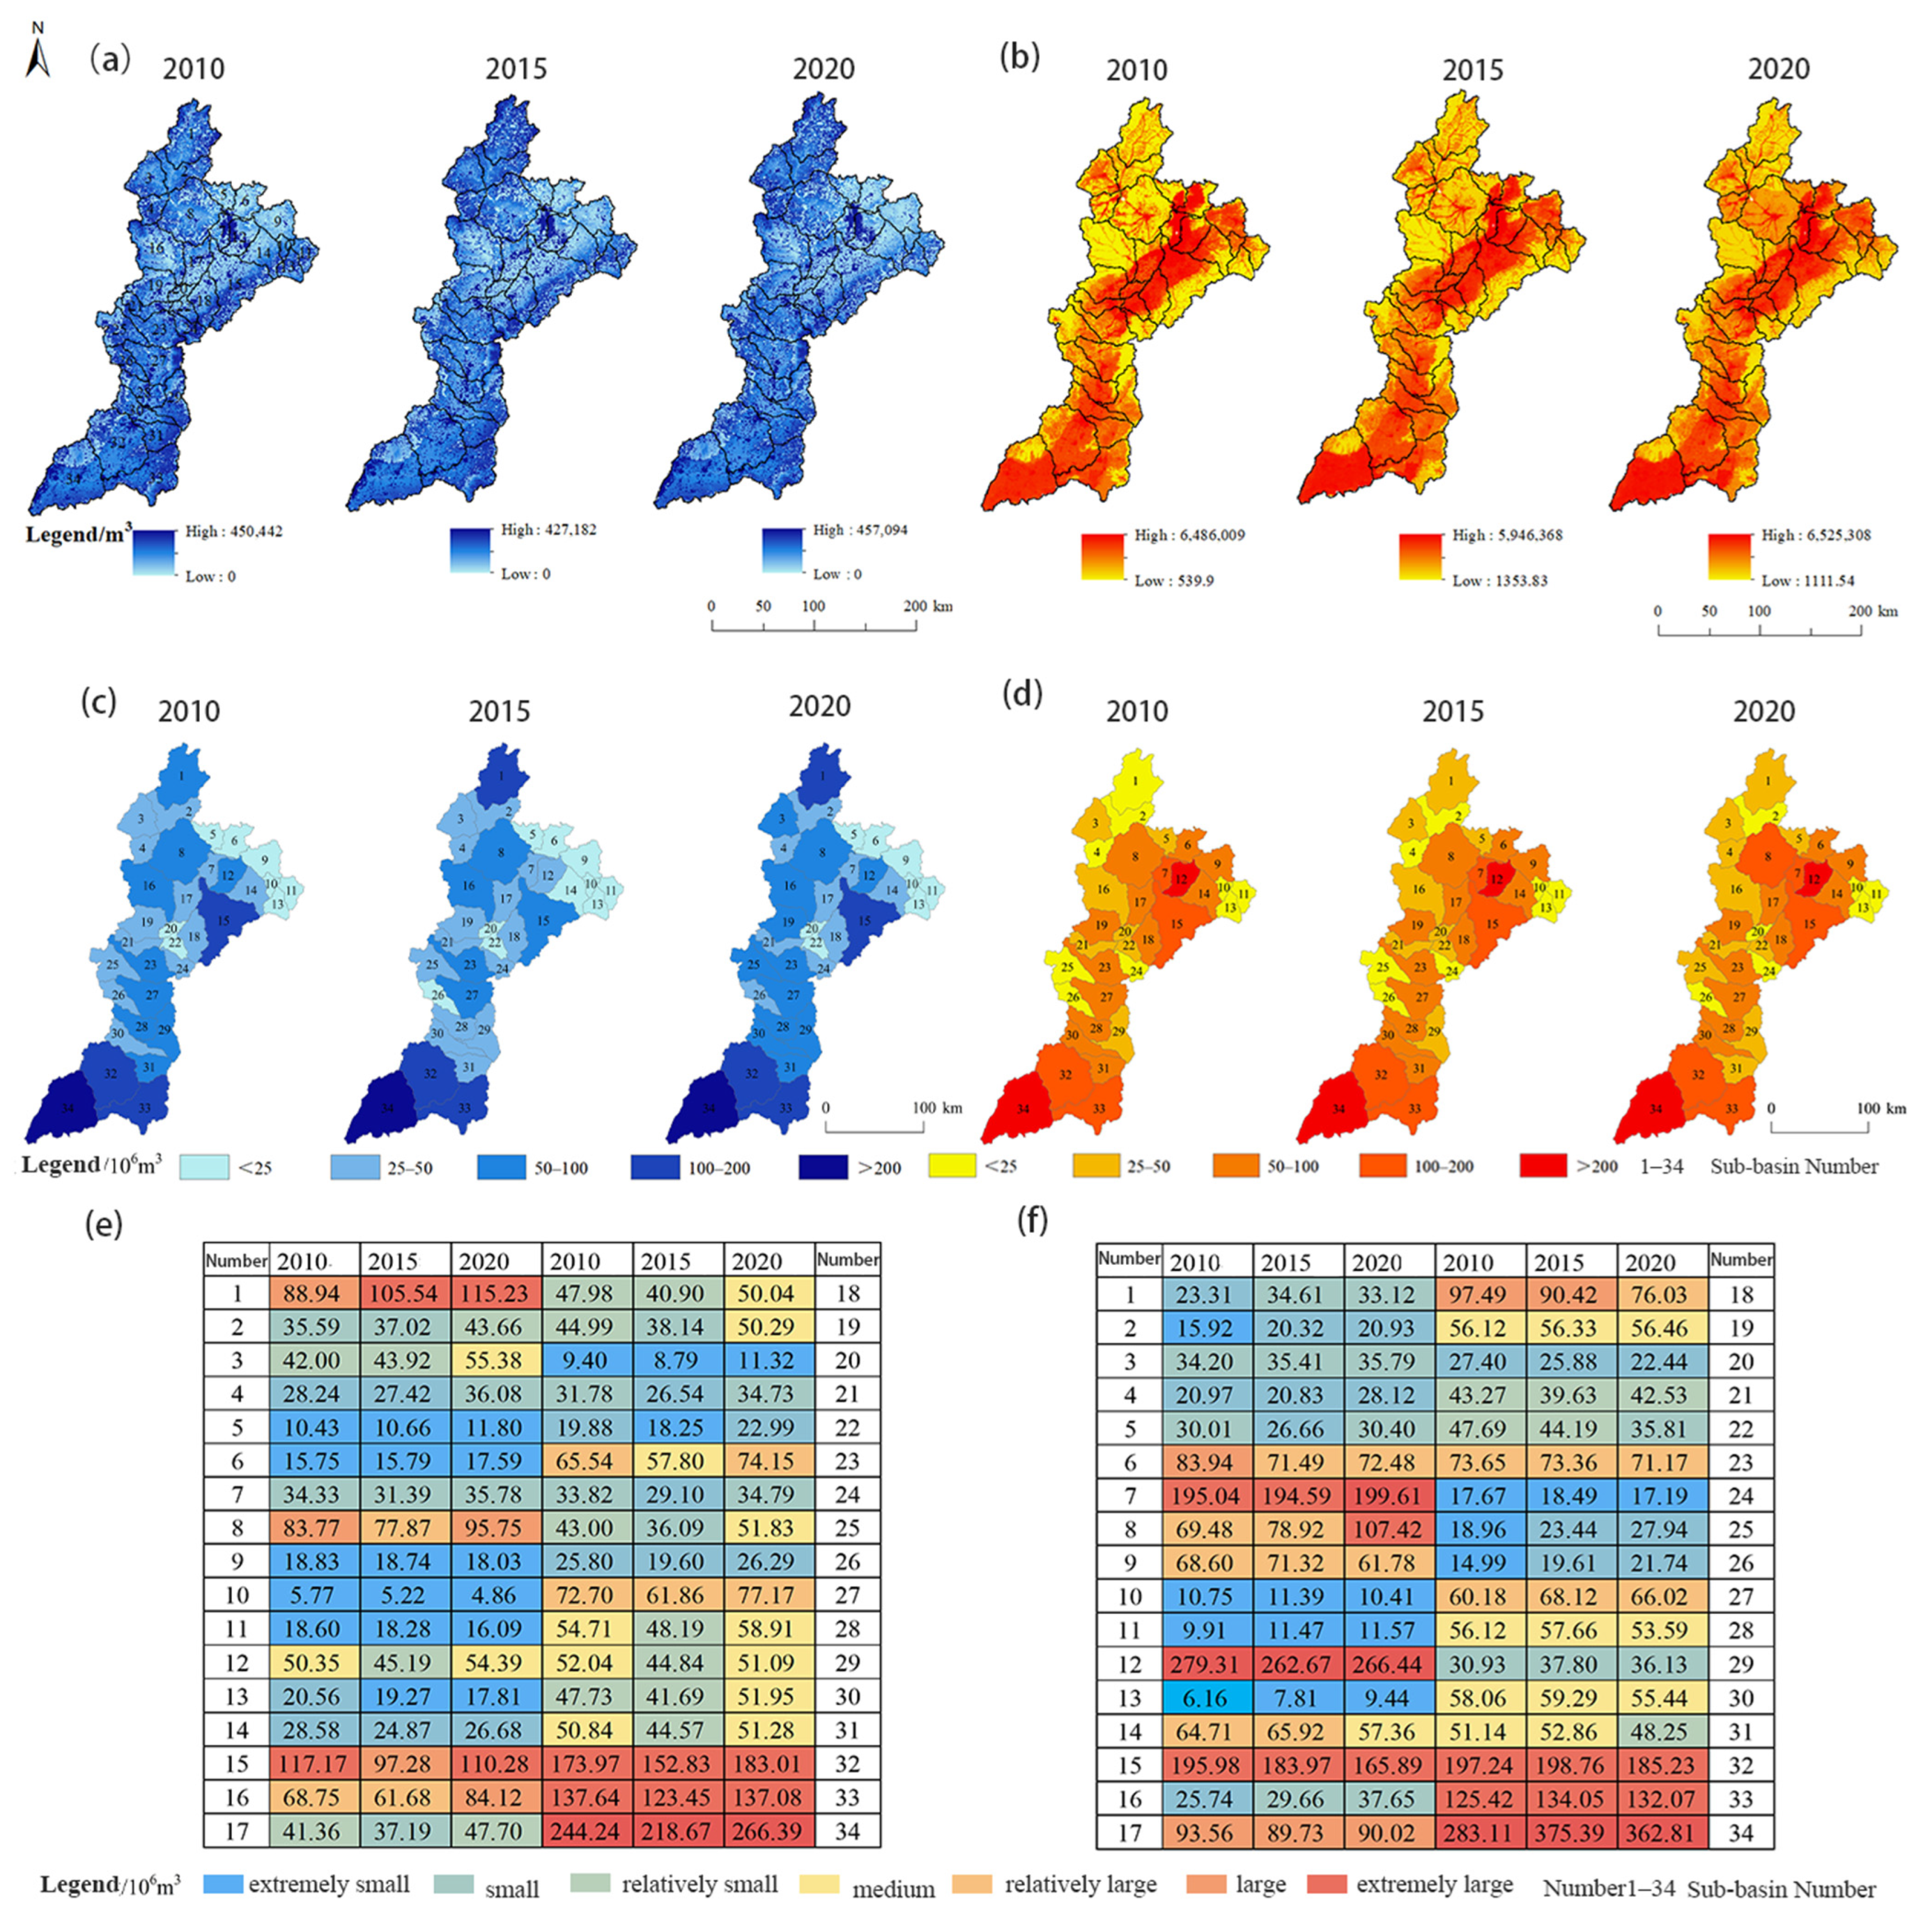
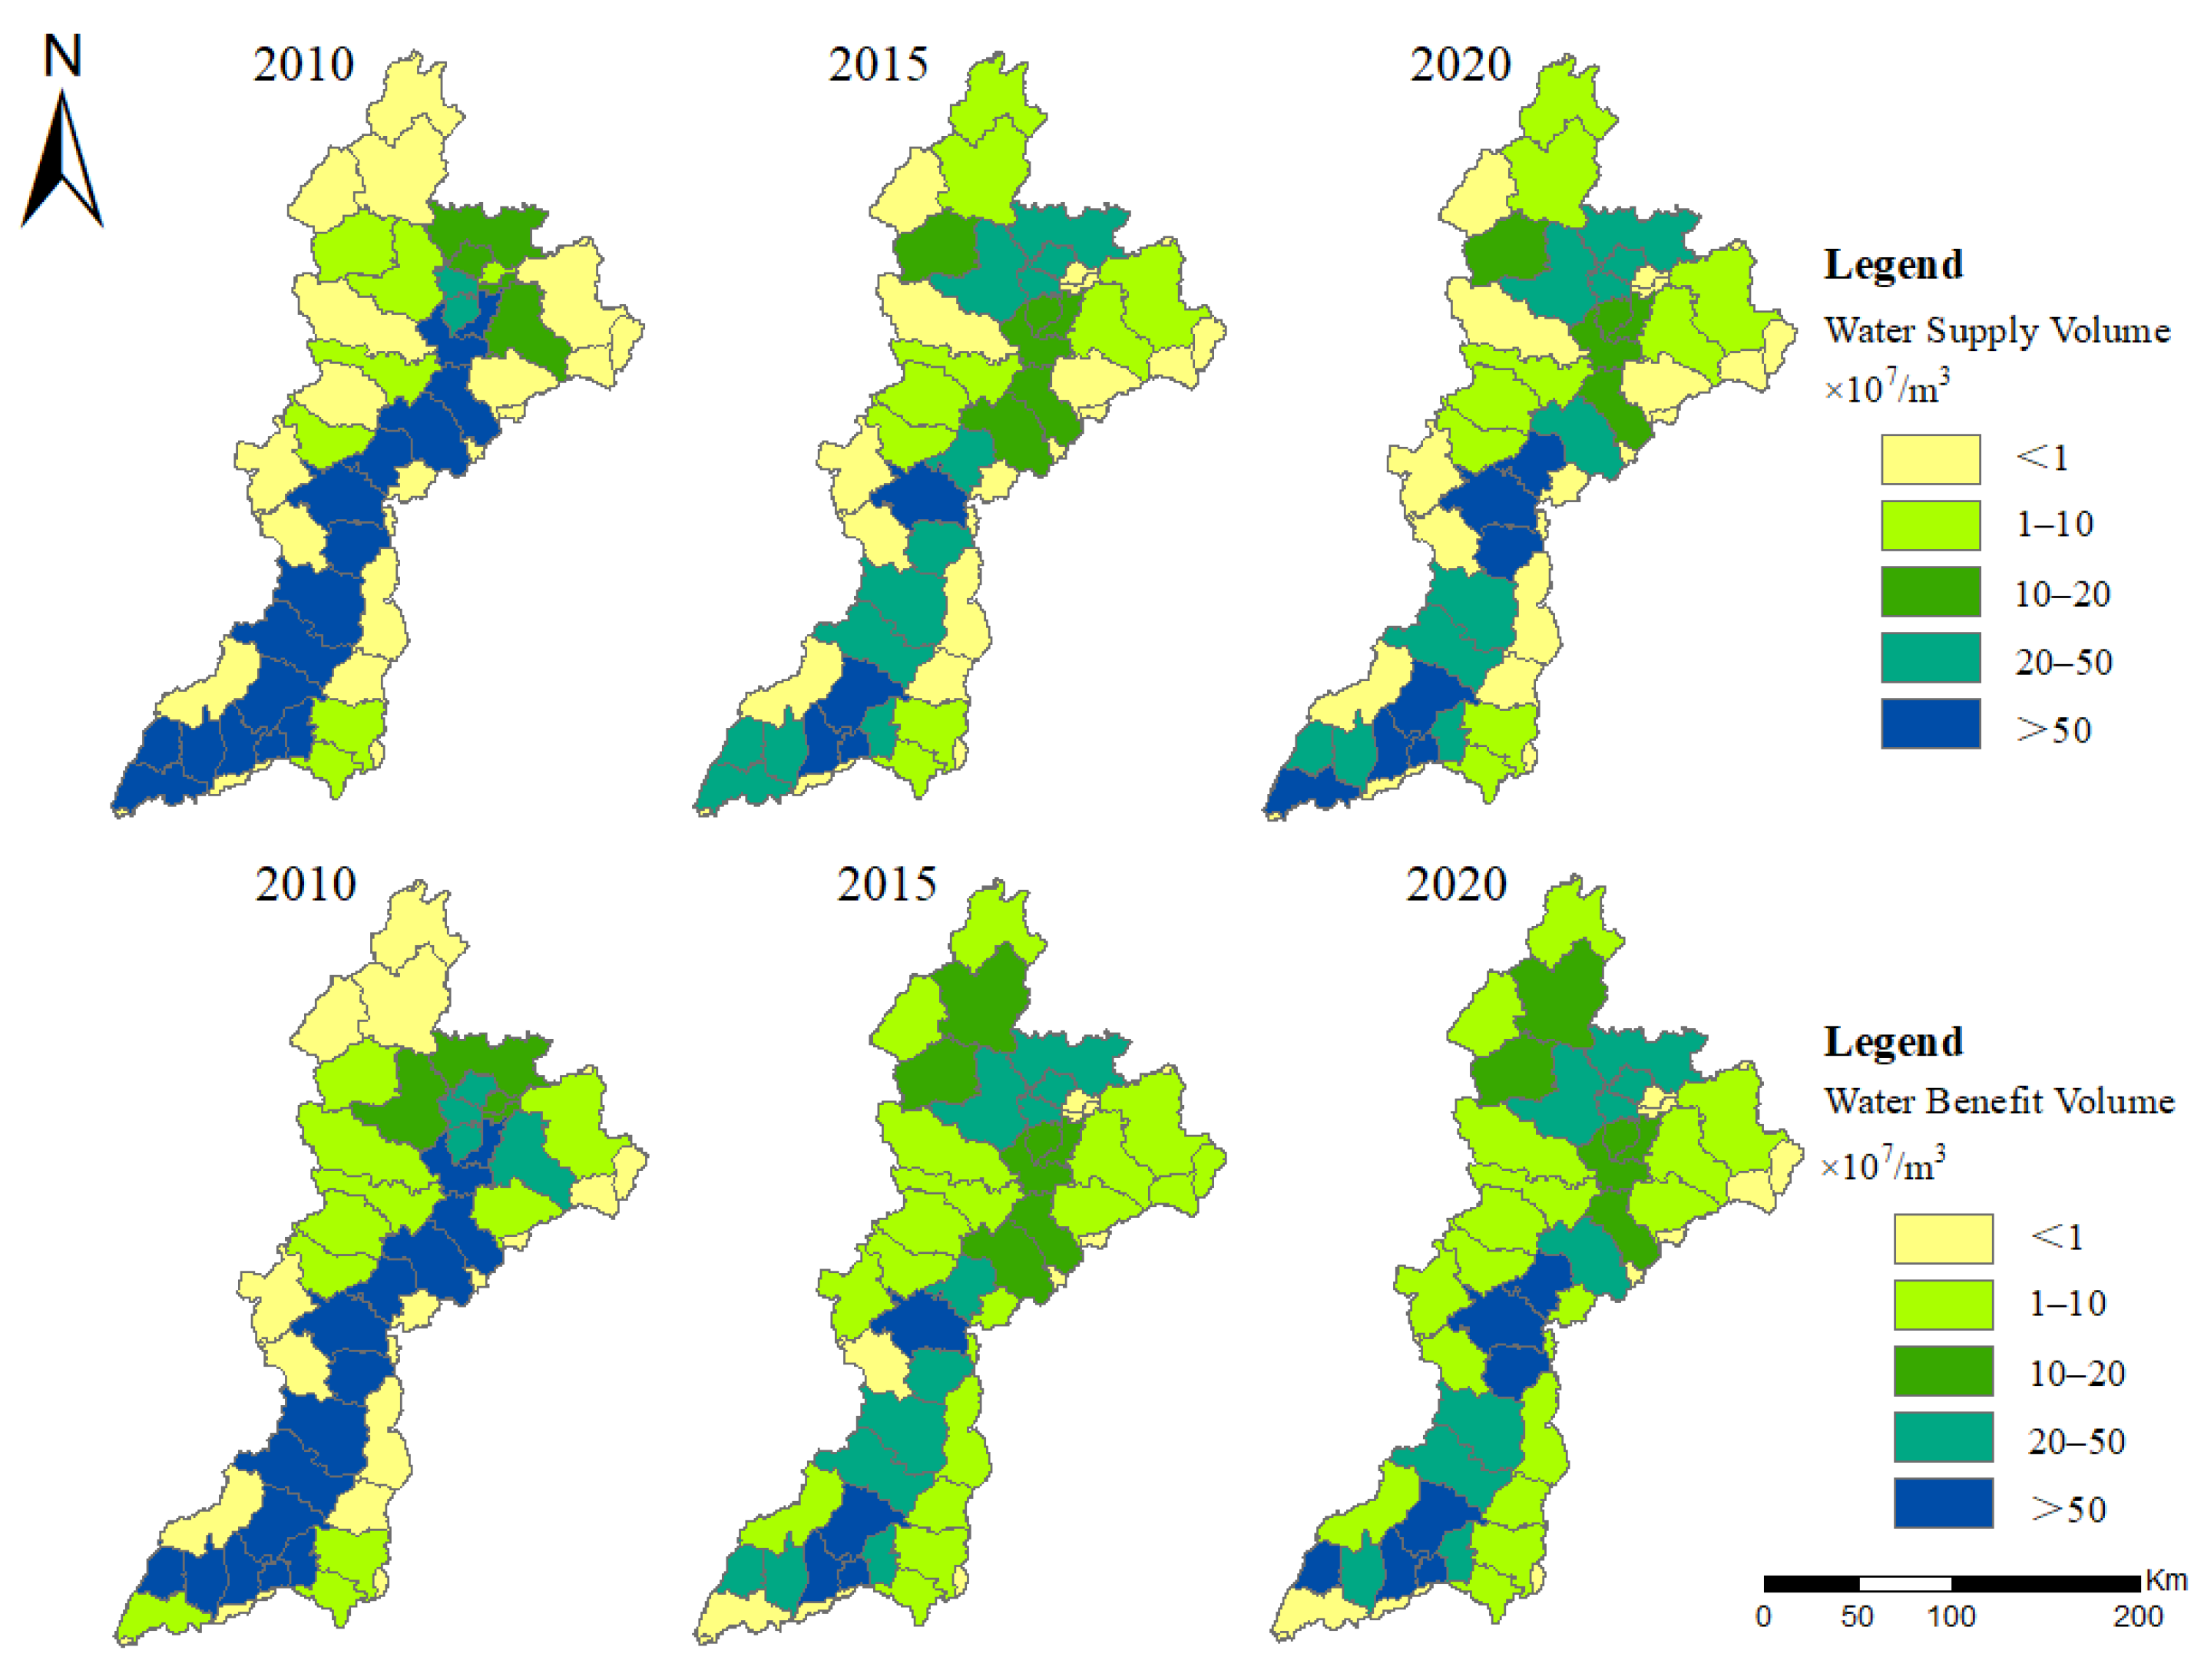
3.1. Supply and Demand of Water Ecosystem Services

The water ecosystem services in the Fenhe River Basin for the years 2010, 2015, and 2020 were calculated using the InVEST model (Figure 2a). To account for interannual variability in precipitation, this study utilized a three-year moving average of precipitation data, with interpolation applied to derive the mean values. The intermediate year of each three-year period is selected as the representative year for the final calculations. The total water supply for the Fenhe River Basin during the three periods is estimated at 1.865 billion m3, 1.689 billion m3, and 2.025 billion m3, respectively. The demand for water ecosystem services in the Fenhe River Basin for the same periods is calculated using multiple socio-economic indicators (Figure 2b). The results indicate that the water demand for the three periods was 2.487 billion m3, 2.592 billion m3, and 2.549 billion m3, respectively. This analysis highlights the disparity between water supply and demand in the Fenhe River Basin, underscoring the need for effective ecological compensation mechanisms to address the imbalance and ensure sustainable water resource management.
At the sub-basin scale (Figure 2c,d), water supply capacity in 2010, 2015, and 2020 is generally lower in the northeastern and central regions and higher in the northernmost and southwestern regions. Water demand, however, is lower in the northeastern and central sub-basins and higher in the central and southern sub-basins. In 2020, the average water supply peaks at approximately 595.46 × 10⁵ m3, with 18 sub-basins exceeding 500 × 105 m3, representing over half of the total sub-basins. Water supply is slightly lower in 2010 and lowest in 2015. Overall, water supply and demand in the Fenhe River Basin show interannual fluctuations, with supply increasing and demand rising initially before declining. Significant spatial heterogeneity highlights regional variability, emphasizing the need for region-specific strategies in ecological compensation and sustainable water management to address these disparities.

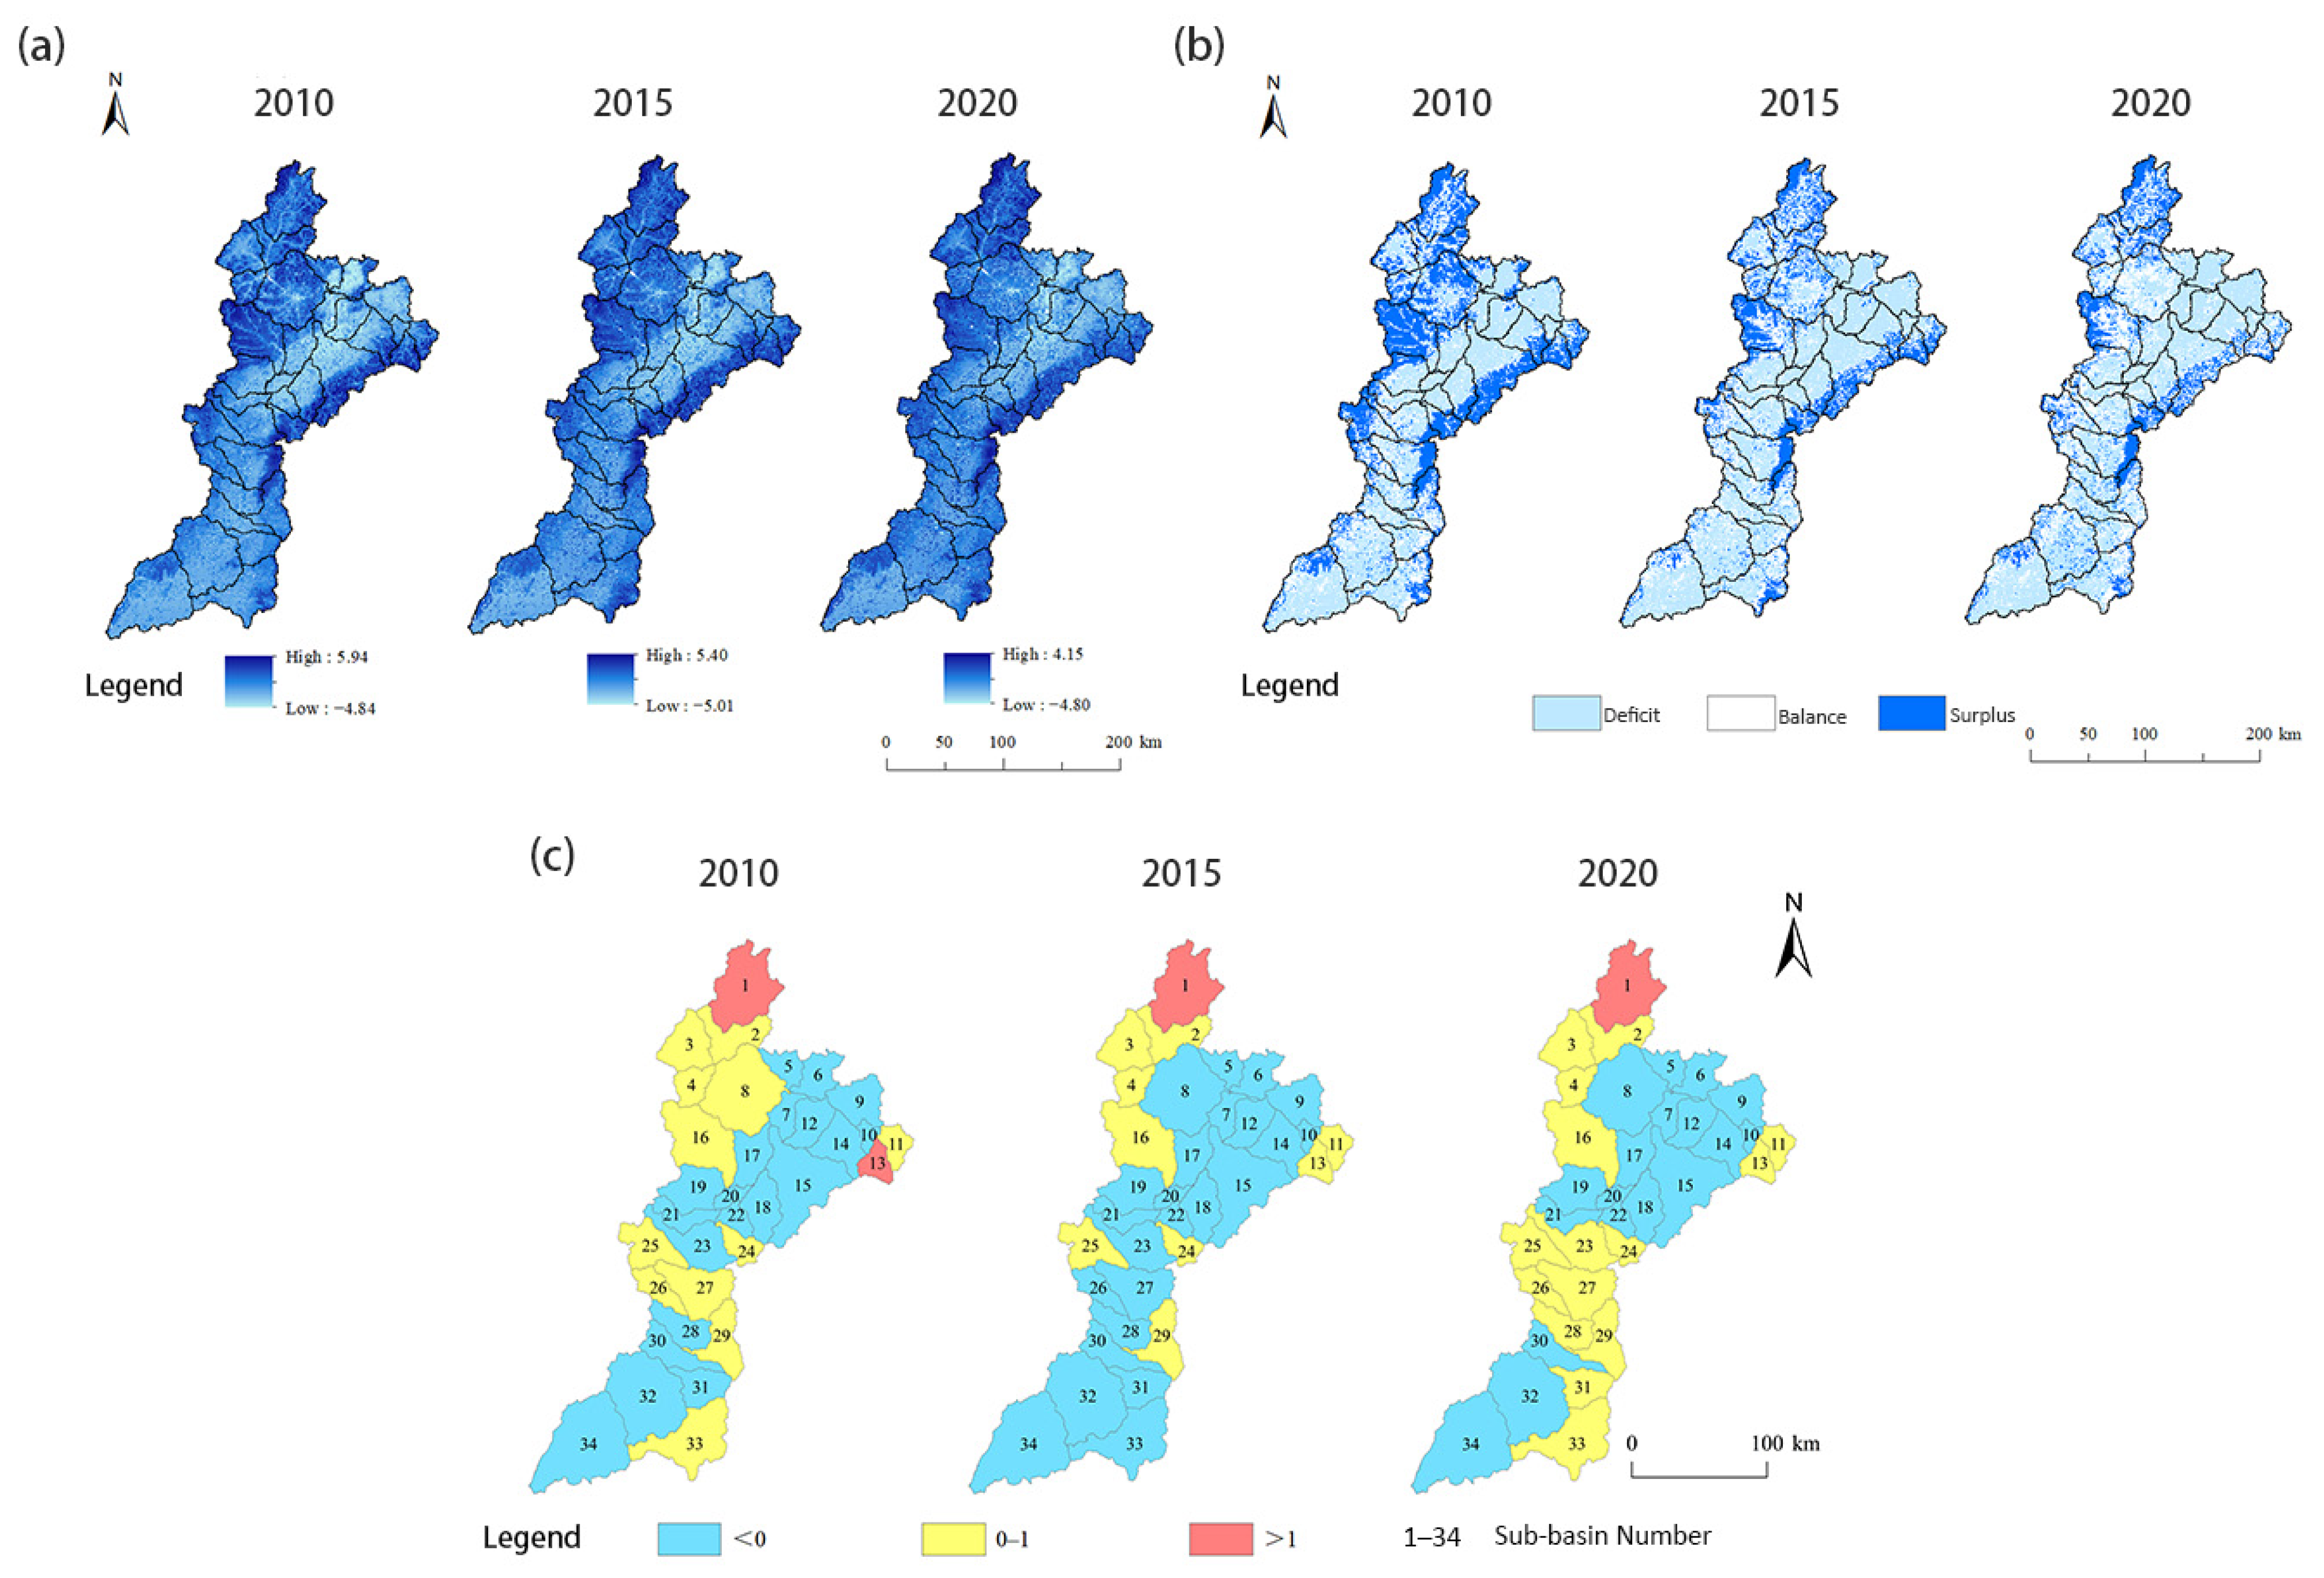
3.2. The Matching Relationship Between Supply and Demand of Water Ecosystem Services

The matching relationship between the supply and demand of water ecosystem services in the Fenhe River Basin was evaluated using the Ecosystem Services Supply–Demand Index (ESDI). This analysis was conducted at both the grid scale (Figure 3a,b) and the sub-basin scale (Figure 3c). The mean ESDI values for 2010, 2015, and 2020 were 0.3731, −0.1555, and −0.1063, respectively. These values indicate a shift from a surplus in 2010 (supply exceeding demand) to a deficit in 2015 (demand exceeding supply), followed by a partial alleviation of the deficit in 2020. However, the overall condition remained one of deficit, reflecting a persistent imbalance in water ecosystem services.
At the sub-basin scale, the ESDI exhibits significant temporal and spatial variability. Between 2010 and 2020, the number of sub-basins experiencing a deficit fluctuated, with 20 sub-basins in deficit in 2010, increasing to 24 in 2015, and decreasing slightly by 2020. Spatially, a small portion of the basin, primarily located in the upstream northwestern region (Sub-basin 1), maintains a surplus. In contrast, the midstream northeastern and southwestern regions, as well as a few areas in the downstream eastern region, showed localized surpluses. However, sub-basins encompassing major urban centers such as Taiyuan, Jinzhong, Lvliang, Linfen, and Yuncheng (Sub-basins 7, 12, 14, 19, 21, 30, 32, and 34) consistently experienced deficits throughout the study period.
These findings highlight the spatial heterogeneity and temporal dynamics of water ecosystem services in the Fenhe River Basin. The persistent deficits in key sub-basins underscore the need for targeted ecological compensation measures and adaptive management strategies to address regional imbalances and promote sustainable water resource utilization. Detailed numerical data for each sub-basin are provided in Supplementary Materials Table S2.

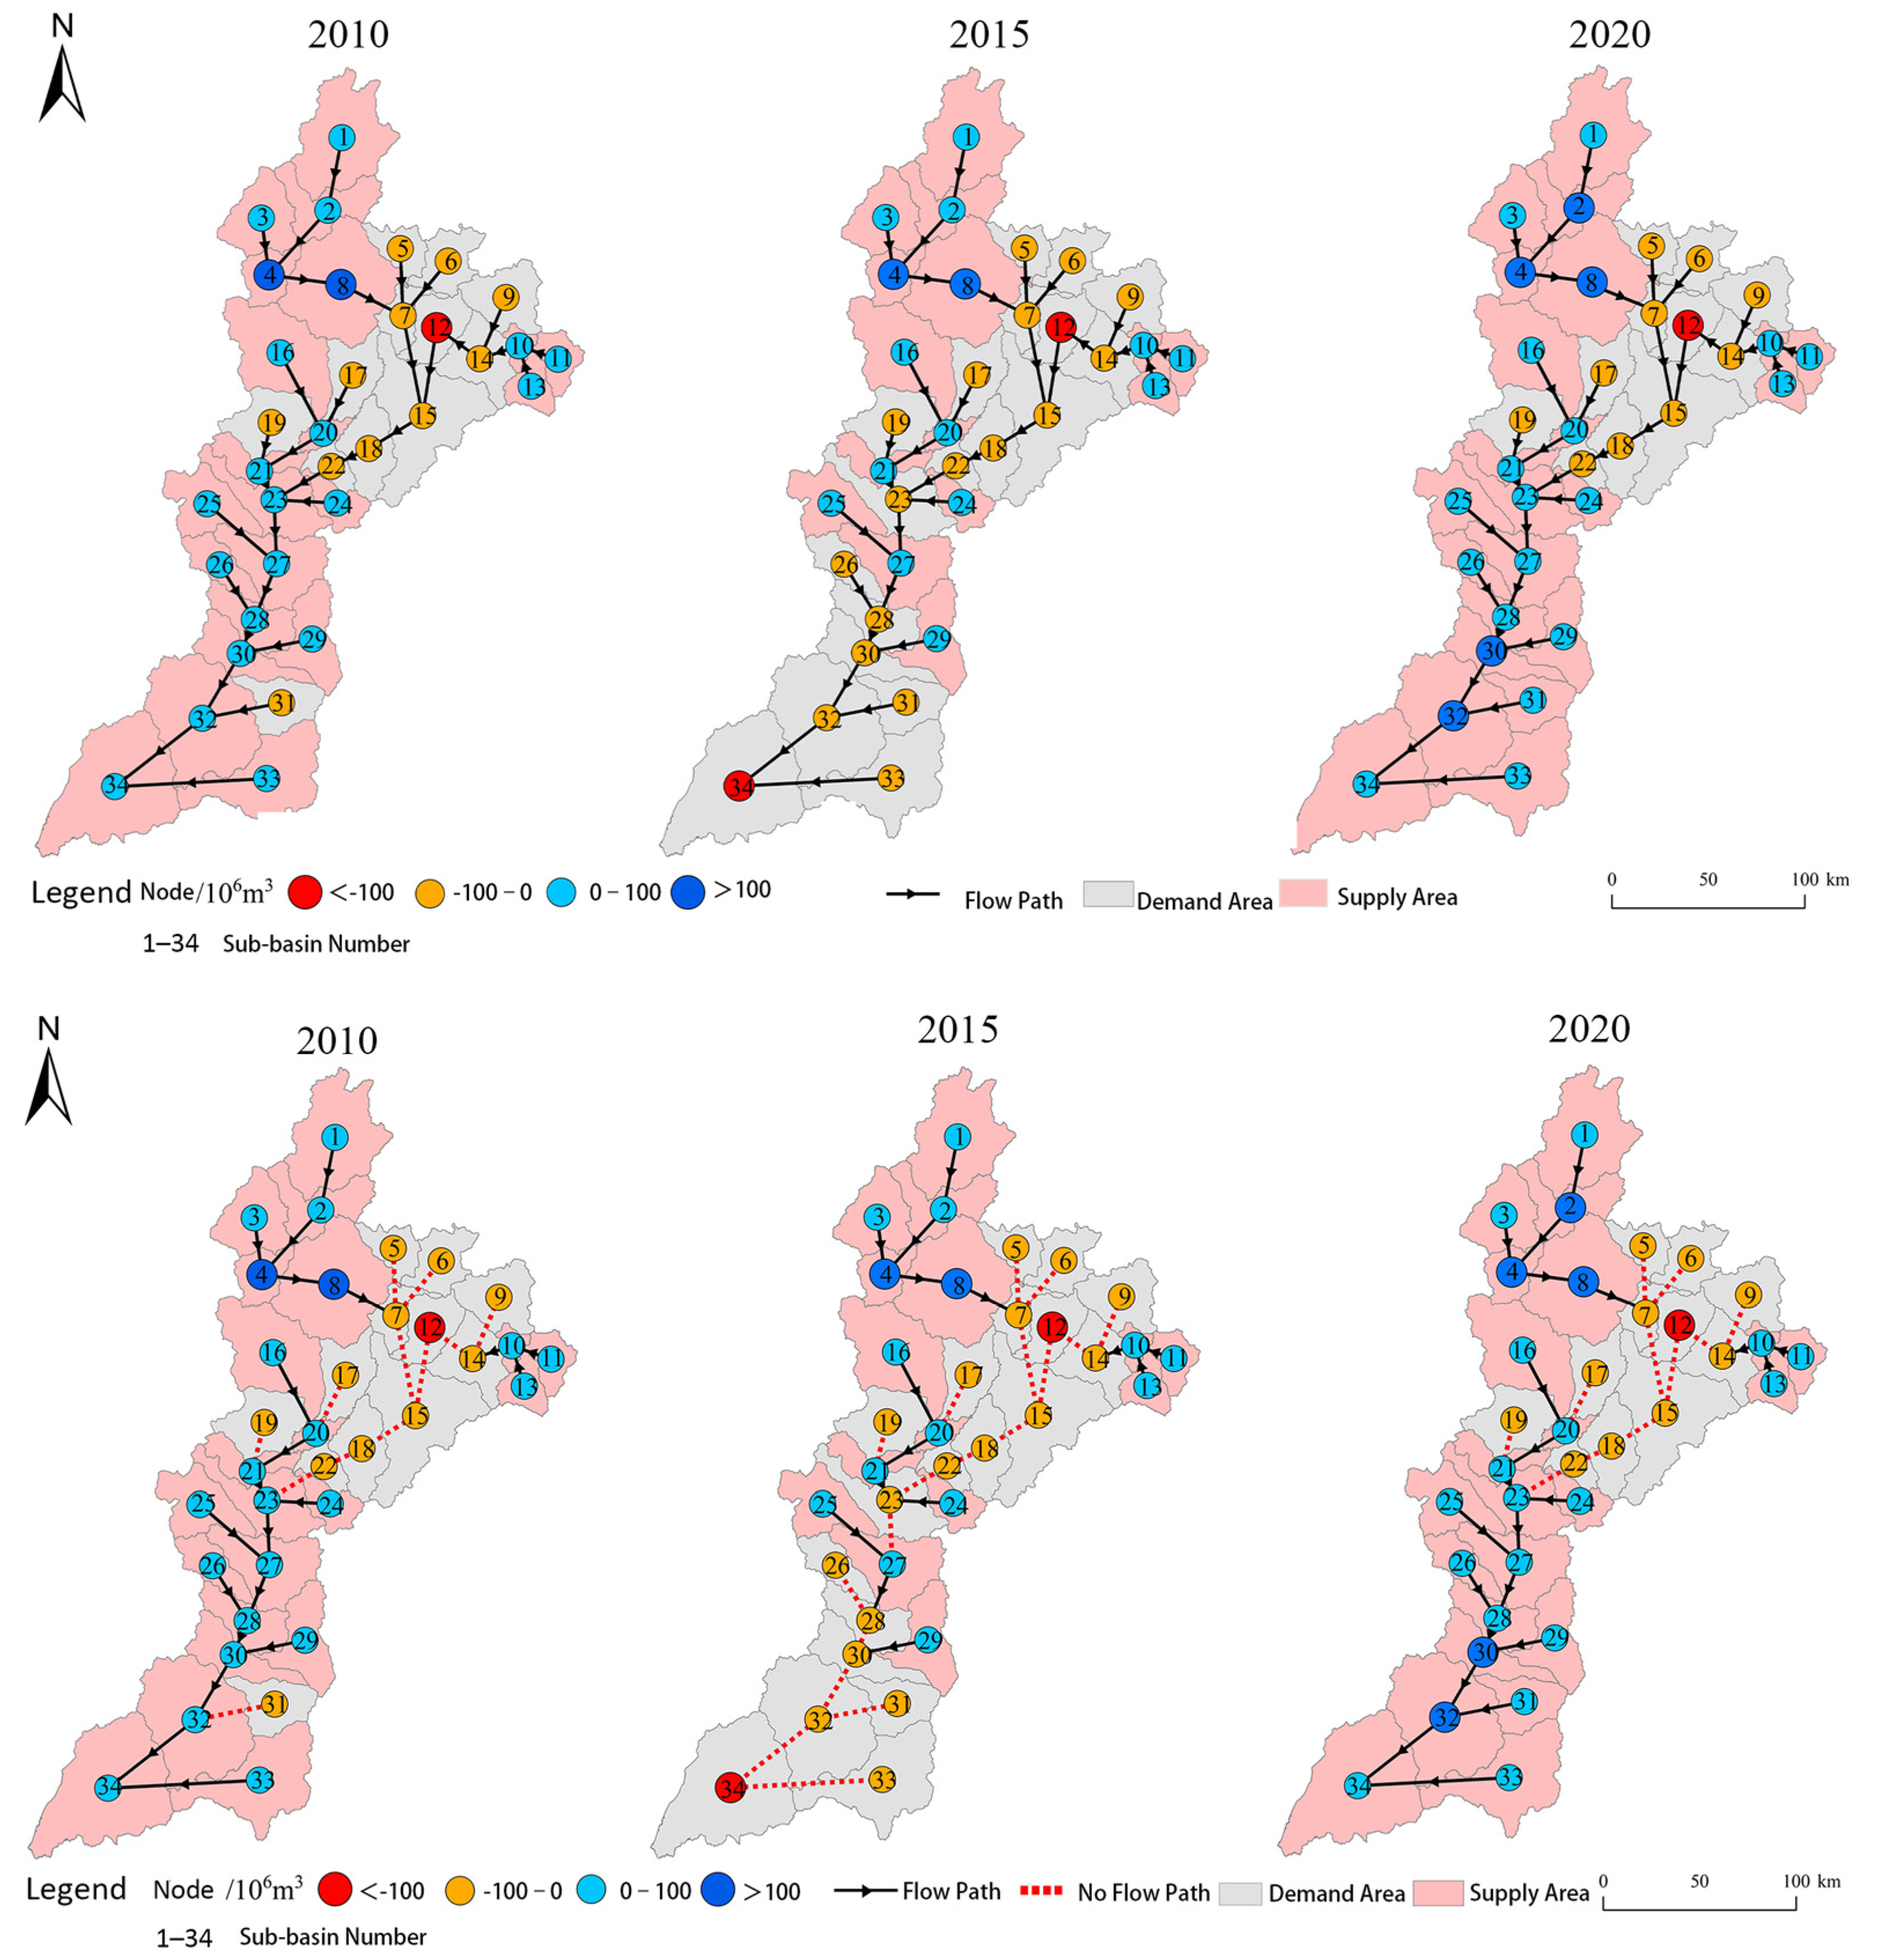
3.3. Simulation of Water Ecosystem Service Flows

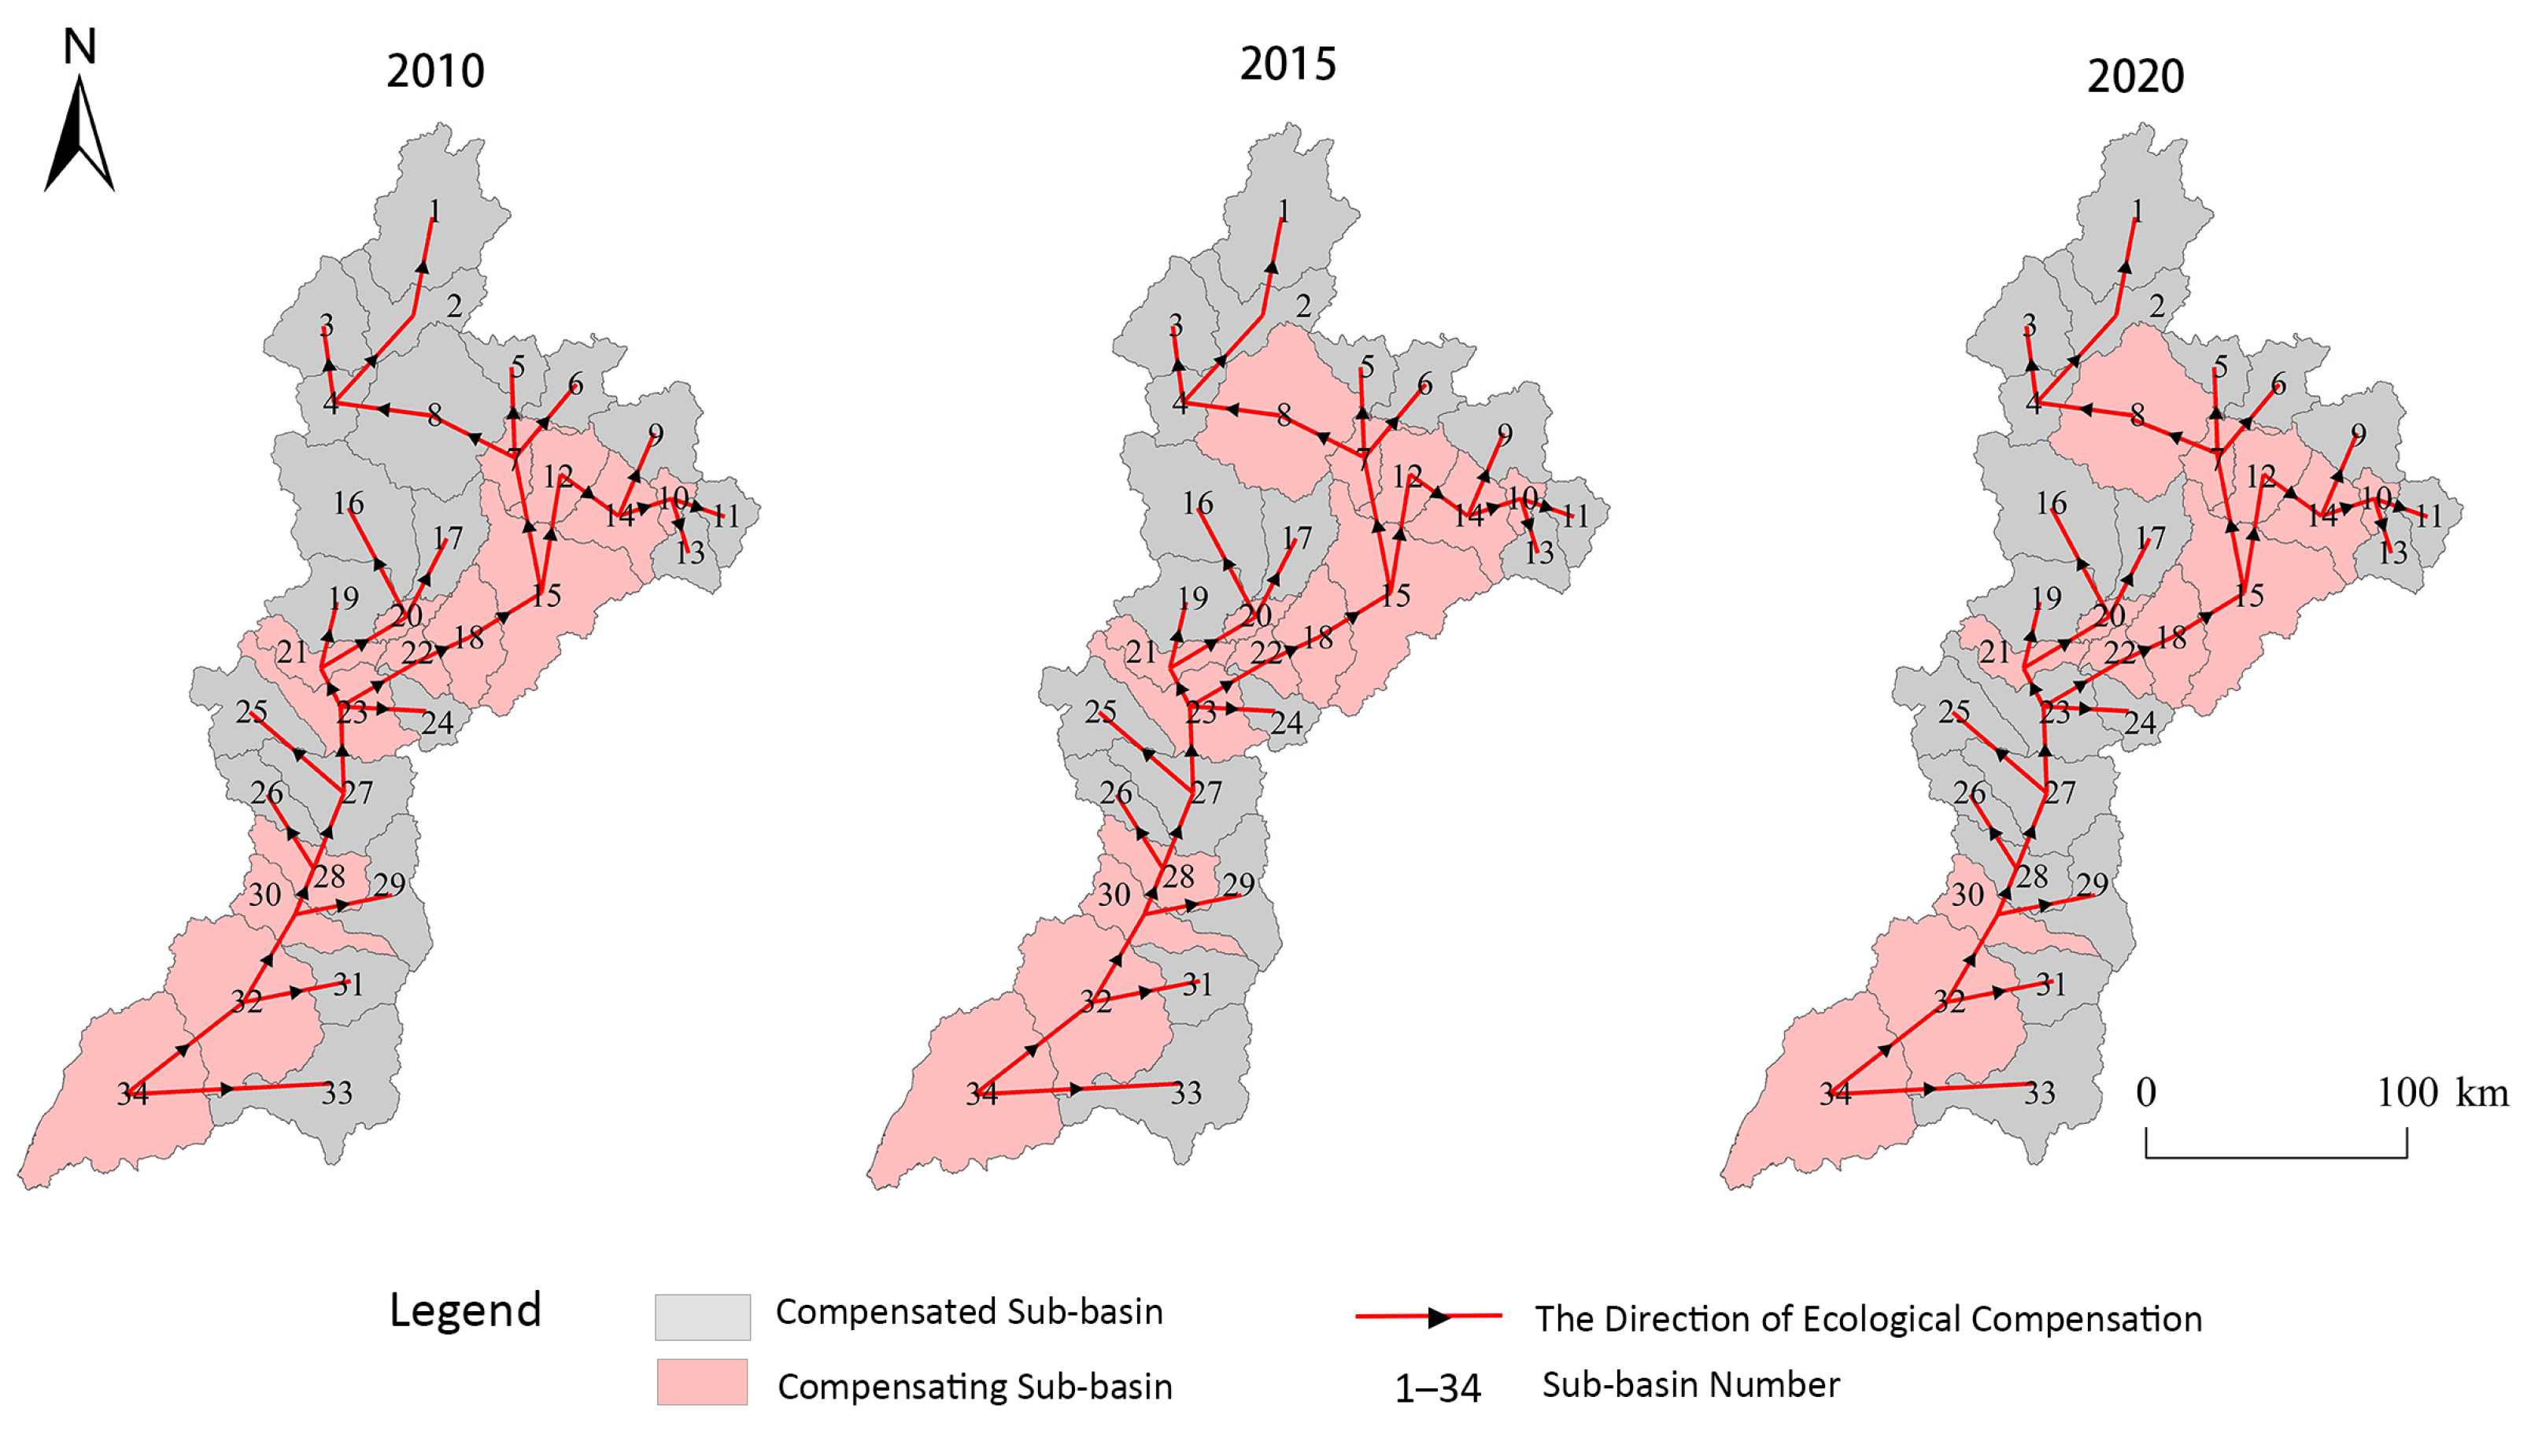
3.3.1. At the Sub-Basin Scale

By quantifying the attributes of nodes and edges in the Fenhe River Basin (see Table 1), this study constructs a water ecosystem service flow network for the basin (see Figure 4). The spatial locations, weights of nodes, and connectivity of edges at the sub-basin scale from 2010 to 2020 are detailed in Supplementary Materials Table S3. The network consists of 34 nodes, representing either water surplus (supply nodes) or deficit (demand nodes). The results show that the number of supply nodes initially decreases and then increases, while the number of demand nodes initially increases and then decreases from 2010 to 2020. This indicates a significant improvement in the water ecosystem services of the Fenhe River Basin by 2020 compared to 2010.
The theoretical flow of the Fenhe River Basin network is illustrated in the above part of Figure 4, while the actual flow is shown in the below part of Figure 4. Among the 34 nodes, Nodes 7, 14, and 23 have the highest in-degree values of 3, identifying them as critical nodes in the water ecosystem service flow network. In 2010, the network includes 20 demand nodes and is incomplete, with some edges unable to form due to insufficient water resources in certain sub-basins. By 2015, water scarcity worsens, particularly in upstream nodes, which cannot meet their own water ecosystem service demands, further reducing the flow of surplus water to downstream nodes. A chain reaction is triggered by the insufficient water supply in Sub-basin 28. By 2020, however, the number of demand nodes decreases to 18, and the network becomes more complete as upstream water ecosystem services are sufficient to meet downstream demands.
Additionally, the network density decreases from 0.64 in 2010 to 0.45 in 2015, indicating a decline in connectivity. However, from 2015 to 2020, the network density improves to 0.70, reflecting enhanced connectivity in the water ecosystem service flow network. These changes highlight the dynamic nature of water resource distribution and the importance of upstream water availability in sustaining downstream ecosystem services.
Land 14 00664 g004
Based on spatial distribution, this study categorizes the spatial flow patterns of the Fenhe River Basin into four distinct water ecosystem service flow relationships: (1) the upstream supply zone, represented by Sub-basins 1, 2, 3, 4, 8, and 16 in Gujiao City and its surrounding areas, which exhibit abundant water resource replenishment and a high surplus of water supply services; (2) the midstream flow zone centered on Sub-basin 12 in Taiyuan City, characterized by severe water deficits due to low supply and high demand; (3) the midstream direct supply zone in Lingshi County (Sub-basin 23), which relies on water from upstream Sub-basins 21 and 24 but faces intermittent connectivity due to extreme supply–demand imbalances in Sub-basins 18, 19, and 22 during 2010–2020, particularly in 2015, when Sub-basin 23 transitioned to a demand zone with no upstream replenishment; and (4) the downstream flow zone encompassing Sub-basins 30, 31, and 32 in Yaodu District, where network connectivity initially declines but improves by 2020. In 2015, downstream regions experience widespread water scarcity and flow interruptions due to supply deficits, but by 2020, water resources shift to a surplus state. These dynamics highlight the spatial and temporal interdependence of water flows, emphasizing the critical role of upstream water availability in mitigating midstream and downstream imbalances and the need for adaptive management strategies to enhance basin-wide resilience.

3.3.2. At the County-Level

At the county-level scale, the water ecosystem service flow networks of the Fenhe River Basin in 2010, 2015, and 2020 are illustrated in Figure 5. The analysis reveals that most county-level regions exhibit multiple bidirectional inflow and outflow relationships with adjacent areas. In the upper reaches of the basin, flow interactions are sparse and characterized by low volumes, while flow relationships gradually intensify from the midstream to the lower reaches, accompanied by increasing flow volumes. In 2010, flows from midstream to downstream county-level regions predominantly exceed 50 × 107 m3. By 2015, these volumes show a decline compared to 2010. However, the 2020 results indicate a resurgence in flow relationships within the upper reaches, with both connectivity and flow volumes increasing. Concurrently, midstream-to-downstream interactions expand further, with most flows exceeding 10 × 107 m3. These trends underscore the spatial-temporal evolution of water ecosystem service flows, reflecting enhanced upstream resource availability and progressively complex midstream–downstream redistribution dynamics over the study period.
Taking the 2020 flow relationships between Lingshi County and its neighboring counties as an example, Lingshi County exhibits inflow and outflow interactions with six adjacent counties. Notably, the outflow volume to Huozhou City (60.40 × 10⁷ m3) significantly exceeds the inflow volume (30.27 × 10⁷ m3). Similarly, the outflow to Jiaokou County (2.38 × 10⁷ m3) slightly surpasses its inflow (0.06 × 10⁷ m3), while the outflow to Fenxi County (0.06 × 10⁷ m3) approximates its inflow (0.04 × 10⁷ m3). In contrast, the outflow to Jiexiu City (25.02 × 10⁷ m3) is far smaller than its inflow (50.39 × 10⁷ m3), and interactions with Xiaoyi City and Qinyuan County are characterized solely by outflows.
From the spatial distribution of water supply and beneficiary areas at the county-level scale in the Fenhe River Basin (see Figure 5), it is evident that in 2010, counties such as Pingyao, Lingshi, and Xiangfen in the mid-to-lower reaches exhibited high water supply, while counties with lower supply were primarily located along the eastern and western peripheries of the basin. By 2015, water supply volumes decreased compared to 2010, followed by a recovery in 2020. High-beneficiary counties, such as Qingxu and Pingyao, are concentrated in the mid-to-lower reaches, aligning with natural water convergence processes. These patterns highlight the spatial mismatch between water supply and demand, with core urban areas experiencing persistent deficits despite improved upstream resource availability.

3.4. Allocation Ratios of Ecological Compensation Funds

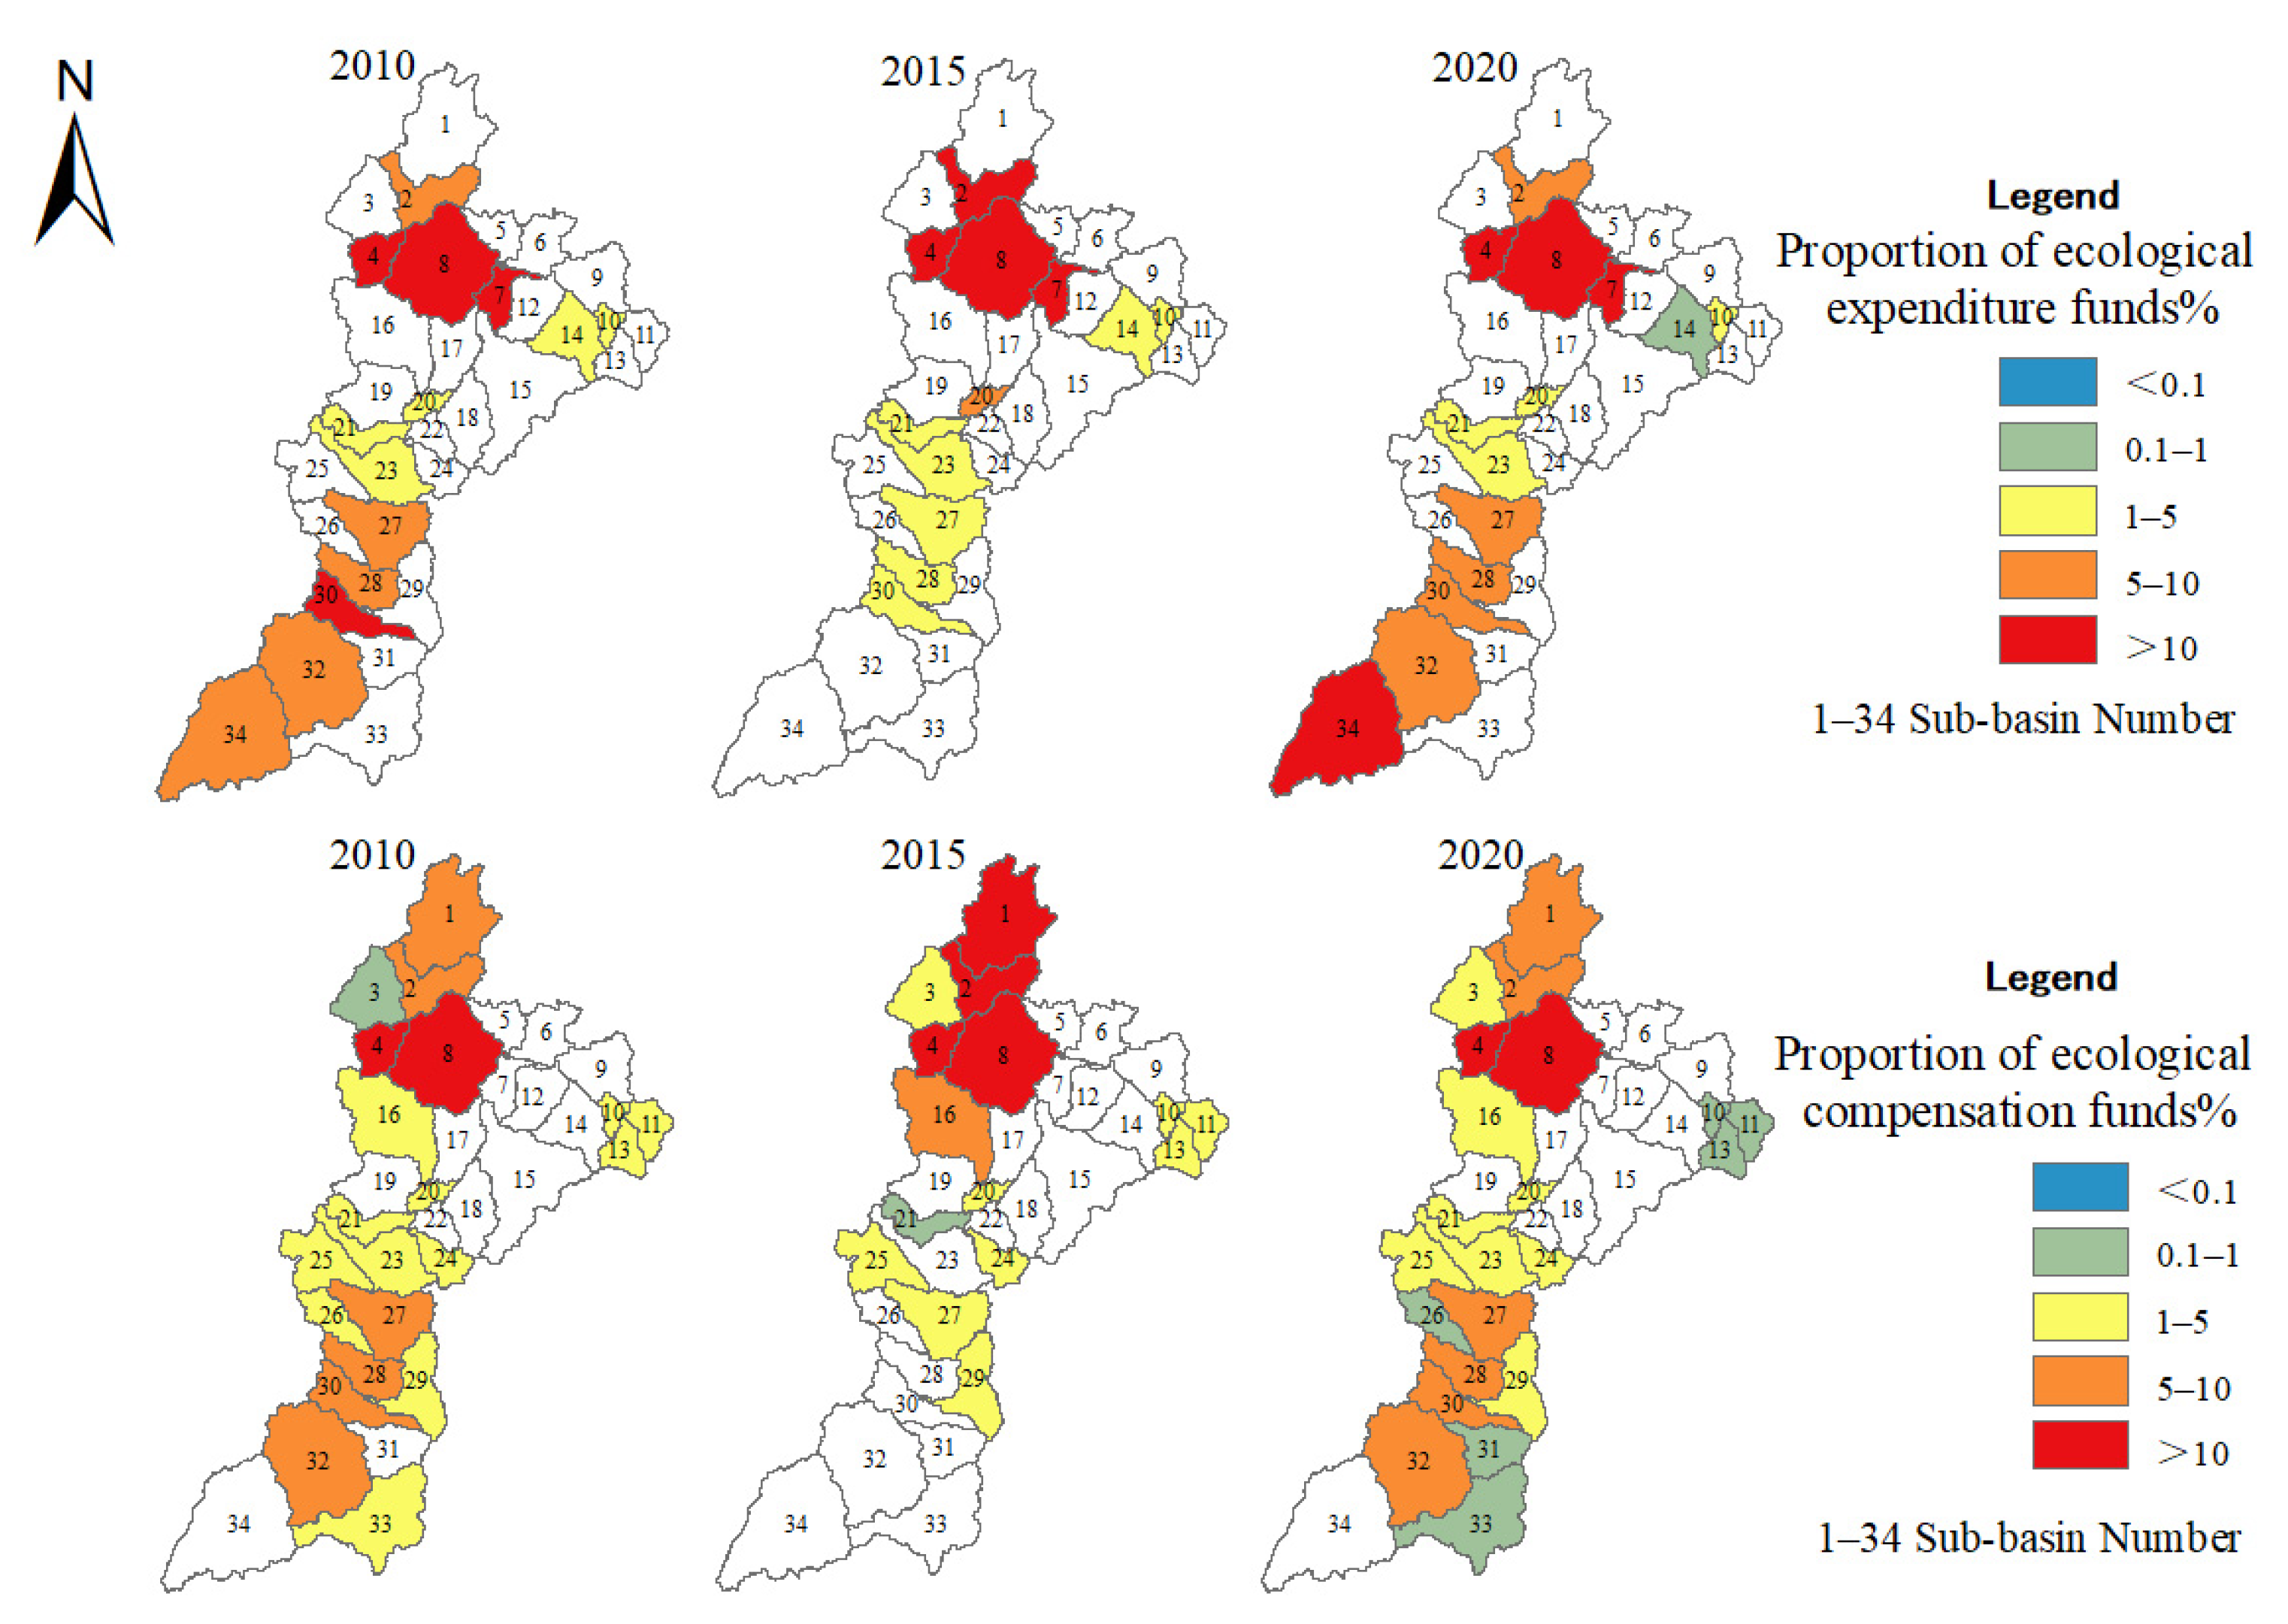
3.4.1. At the Sub-Basin Scale

Figure 6 shows the spatial distribution of water ecosystem service supply–demand zones and the direction of ecological compensation at the sub-basin scale. Compensated sub-basins are mainly in the upstream, southern midstream, and western downstream areas, while compensating sub-basins are concentrated in the downstream and eastern midstream regions. In 2015, the number of compensated sub-basins peaked, with Sub-basins 8, 23, and 28 added compared to 2010 and 2020. Ecological compensation flows upstream, opposite to the natural water flow direction. Based on water flow relationships, the expenditure and allocation ratios of ecological compensation funds for each sub-basin in 2010, 2015, and 2020 are determined (Figure 6).
Sub-basins with expenditure ratios exceeding 10% vary annually, totaling 4 each year, while those below 0.1% include 20, 22, and 20 sub-basins in 2010, 2015, and 2020, respectively (see Figure 7). Sub-basins with compensation ratios above 10% number 2, 4, and 4 across the three years, while those below 0.1% total 13, 19, and 12. Sub-basins with high expenditure ratios, such as Sub-basins 2, 4, and 8 in the upstream and mid-to-lower confluence zones, also receive significant compensation, reflecting their dual role as providers and recipients of water resources. Sub-basin 34 (downstream outlet) has a high expenditure ratio but low compensation, while Sub-basin 1 (upstream inlet) shows the opposite trend.
These results highlight the spatial heterogeneity and interdependencies in the Fenhe River Basin’s ecological compensation framework, emphasizing the need for adaptive fiscal policies to balance resource provision and financial equity across sub-basins.

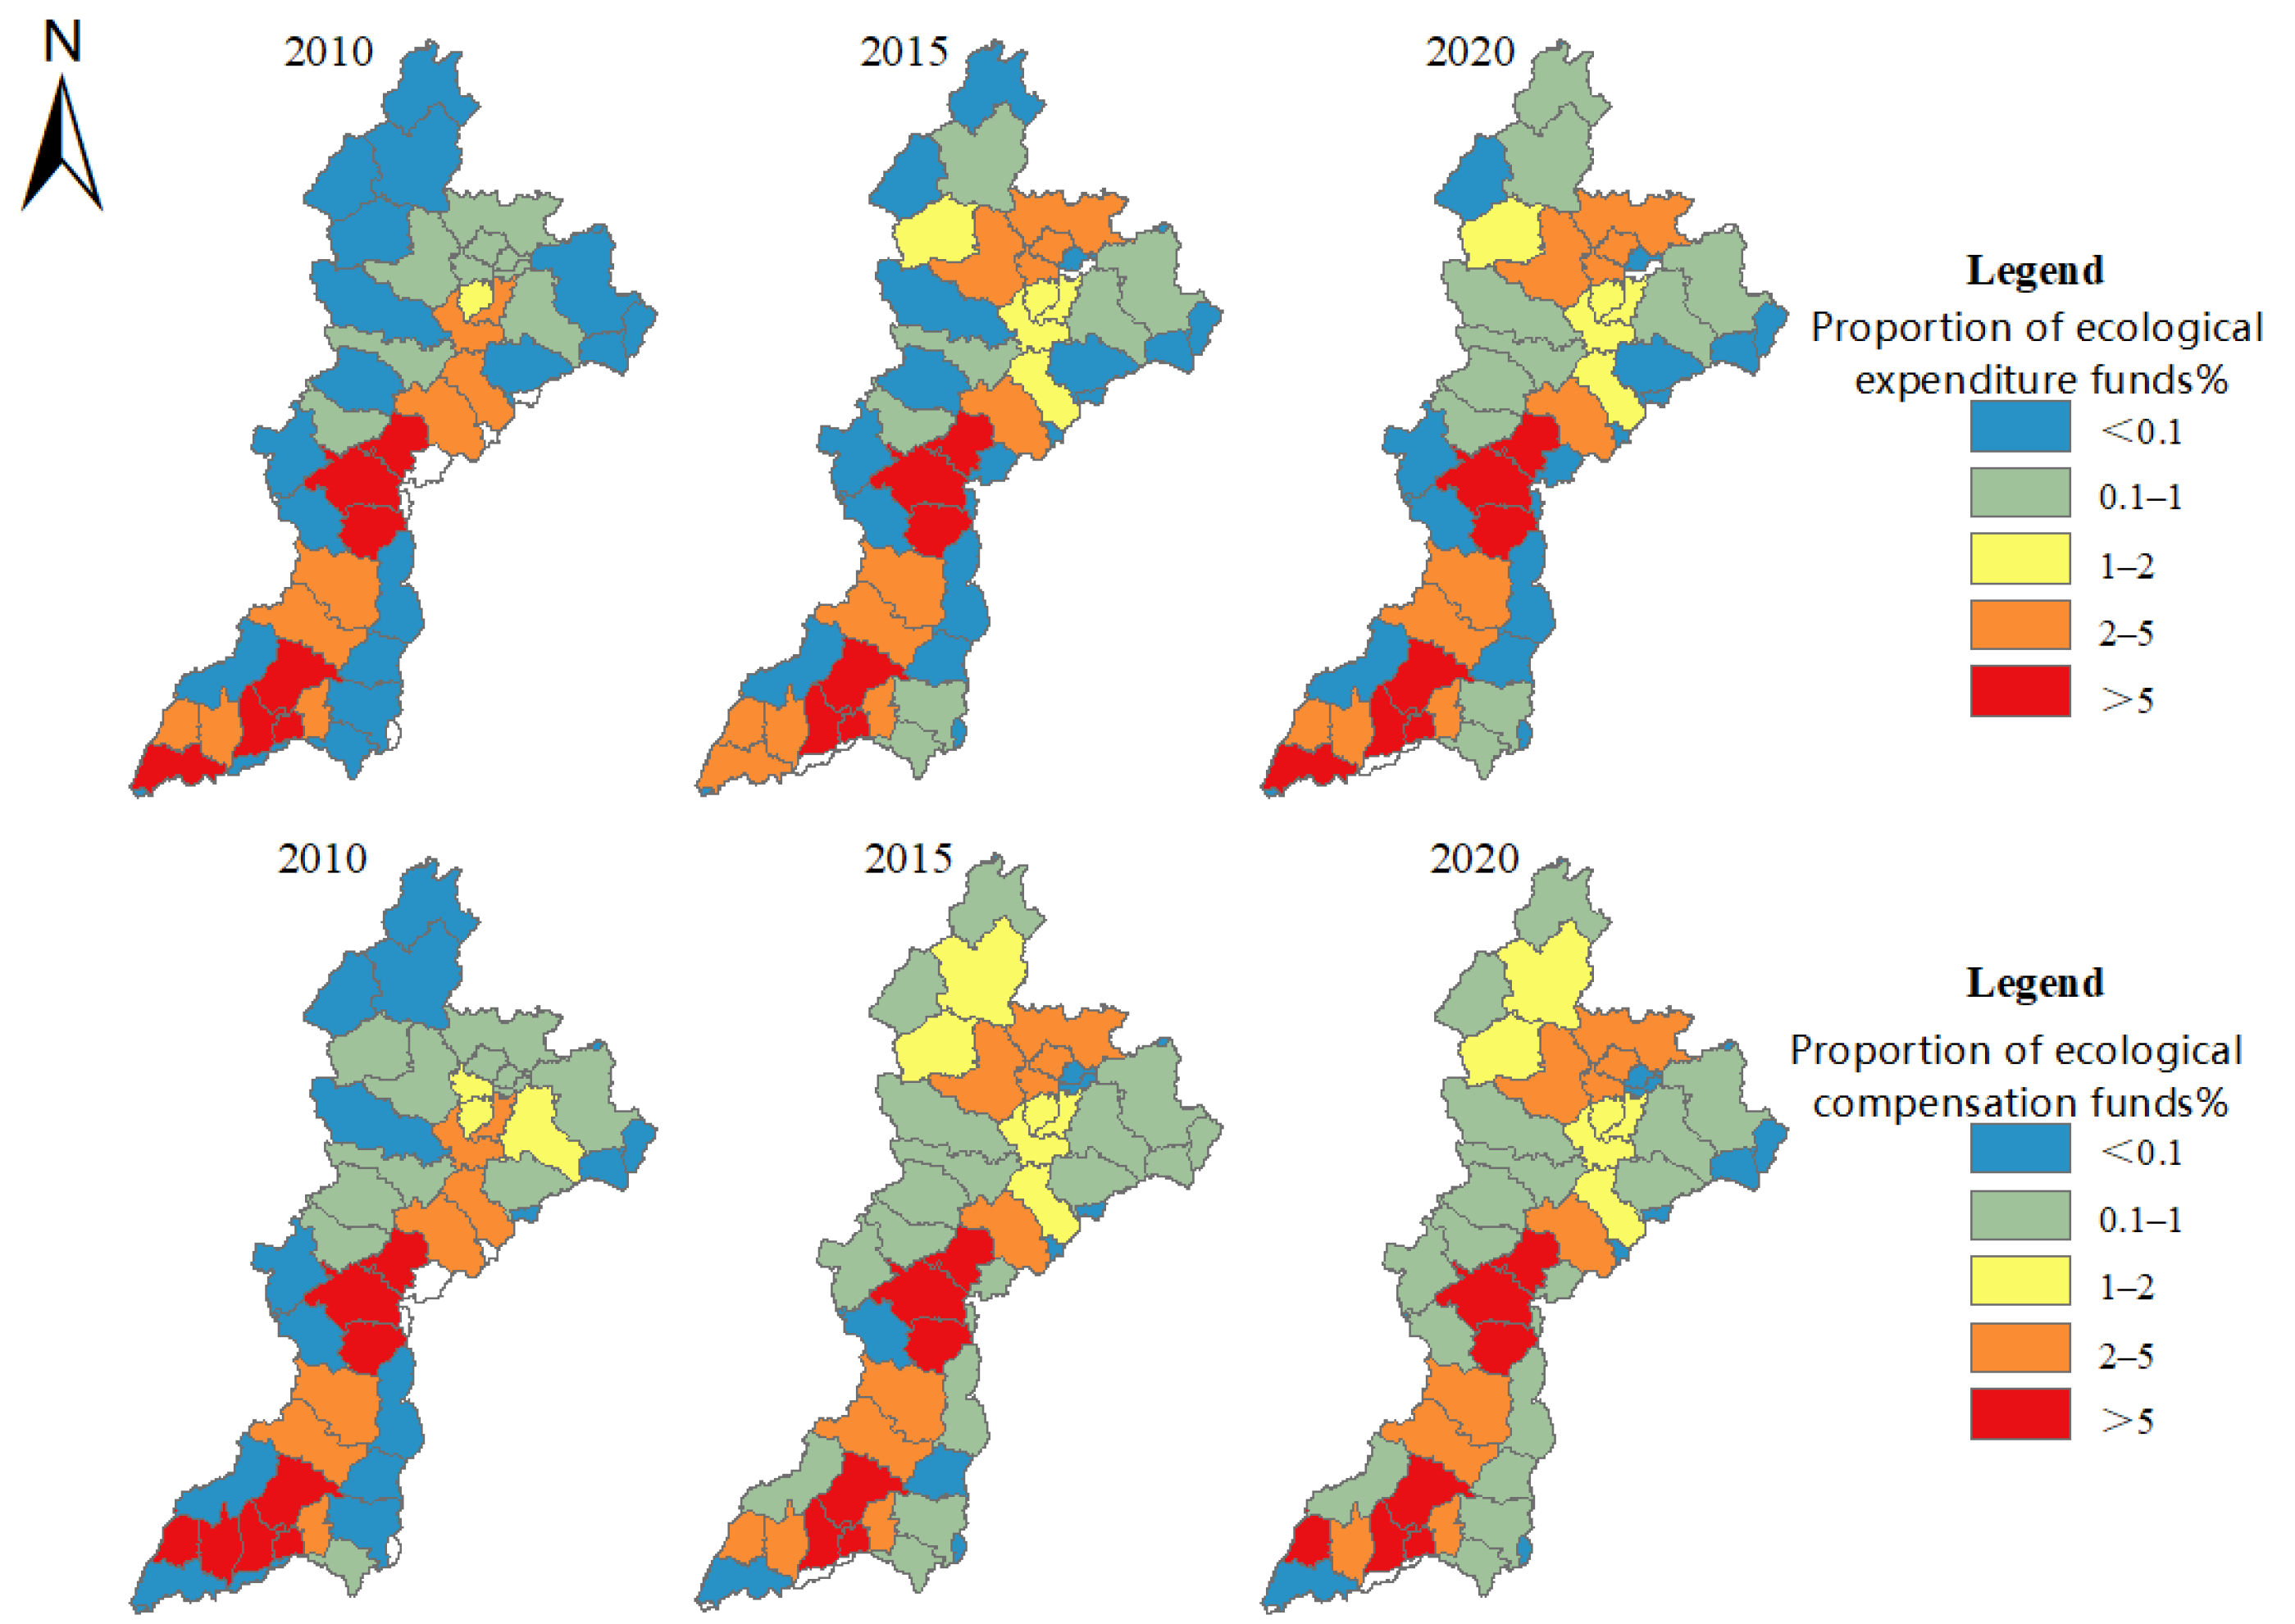
3.4.2. At the County-Level Scale

Based on the flow relationships of water ecosystem services at the county-level scale (as detailed in Section 3.3.2), the expenditure and allocation ratios of ecological compensation funds for 2010, 2015, and 2020 are preliminarily determined. These ratios represent the financial amounts associated with water inflows and outflows for each county, as illustrated in Table 2, Figure 8 and Figure 9.
Overall, counties with higher expenditure ratios and those receiving higher compensation ratios are largely the same, primarily located in the mid-to-lower confluence zones of the Fenhe River Basin. These counties both provide water resources to other regions and receive inflows from them. A comparison of expenditure and compensation ratios reveals that counties in the midstream, such as Jiancaoping District, Jinyuan District, Qingxu County, Wanbailin District, Xiaodian District, and Jiexiu City, have slightly higher expenditure ratios than compensation ratios, requiring them to allocate partial funds to upstream areas. In contrast, Wanrong County, located at the downstream outlet, exhibits a significantly higher expenditure ratio compared to its compensation ratio. As a downstream county, it bears a greater responsibility for compensating upstream regions, reflecting its critical role in the basin’s water resource redistribution and ecological compensation framework.

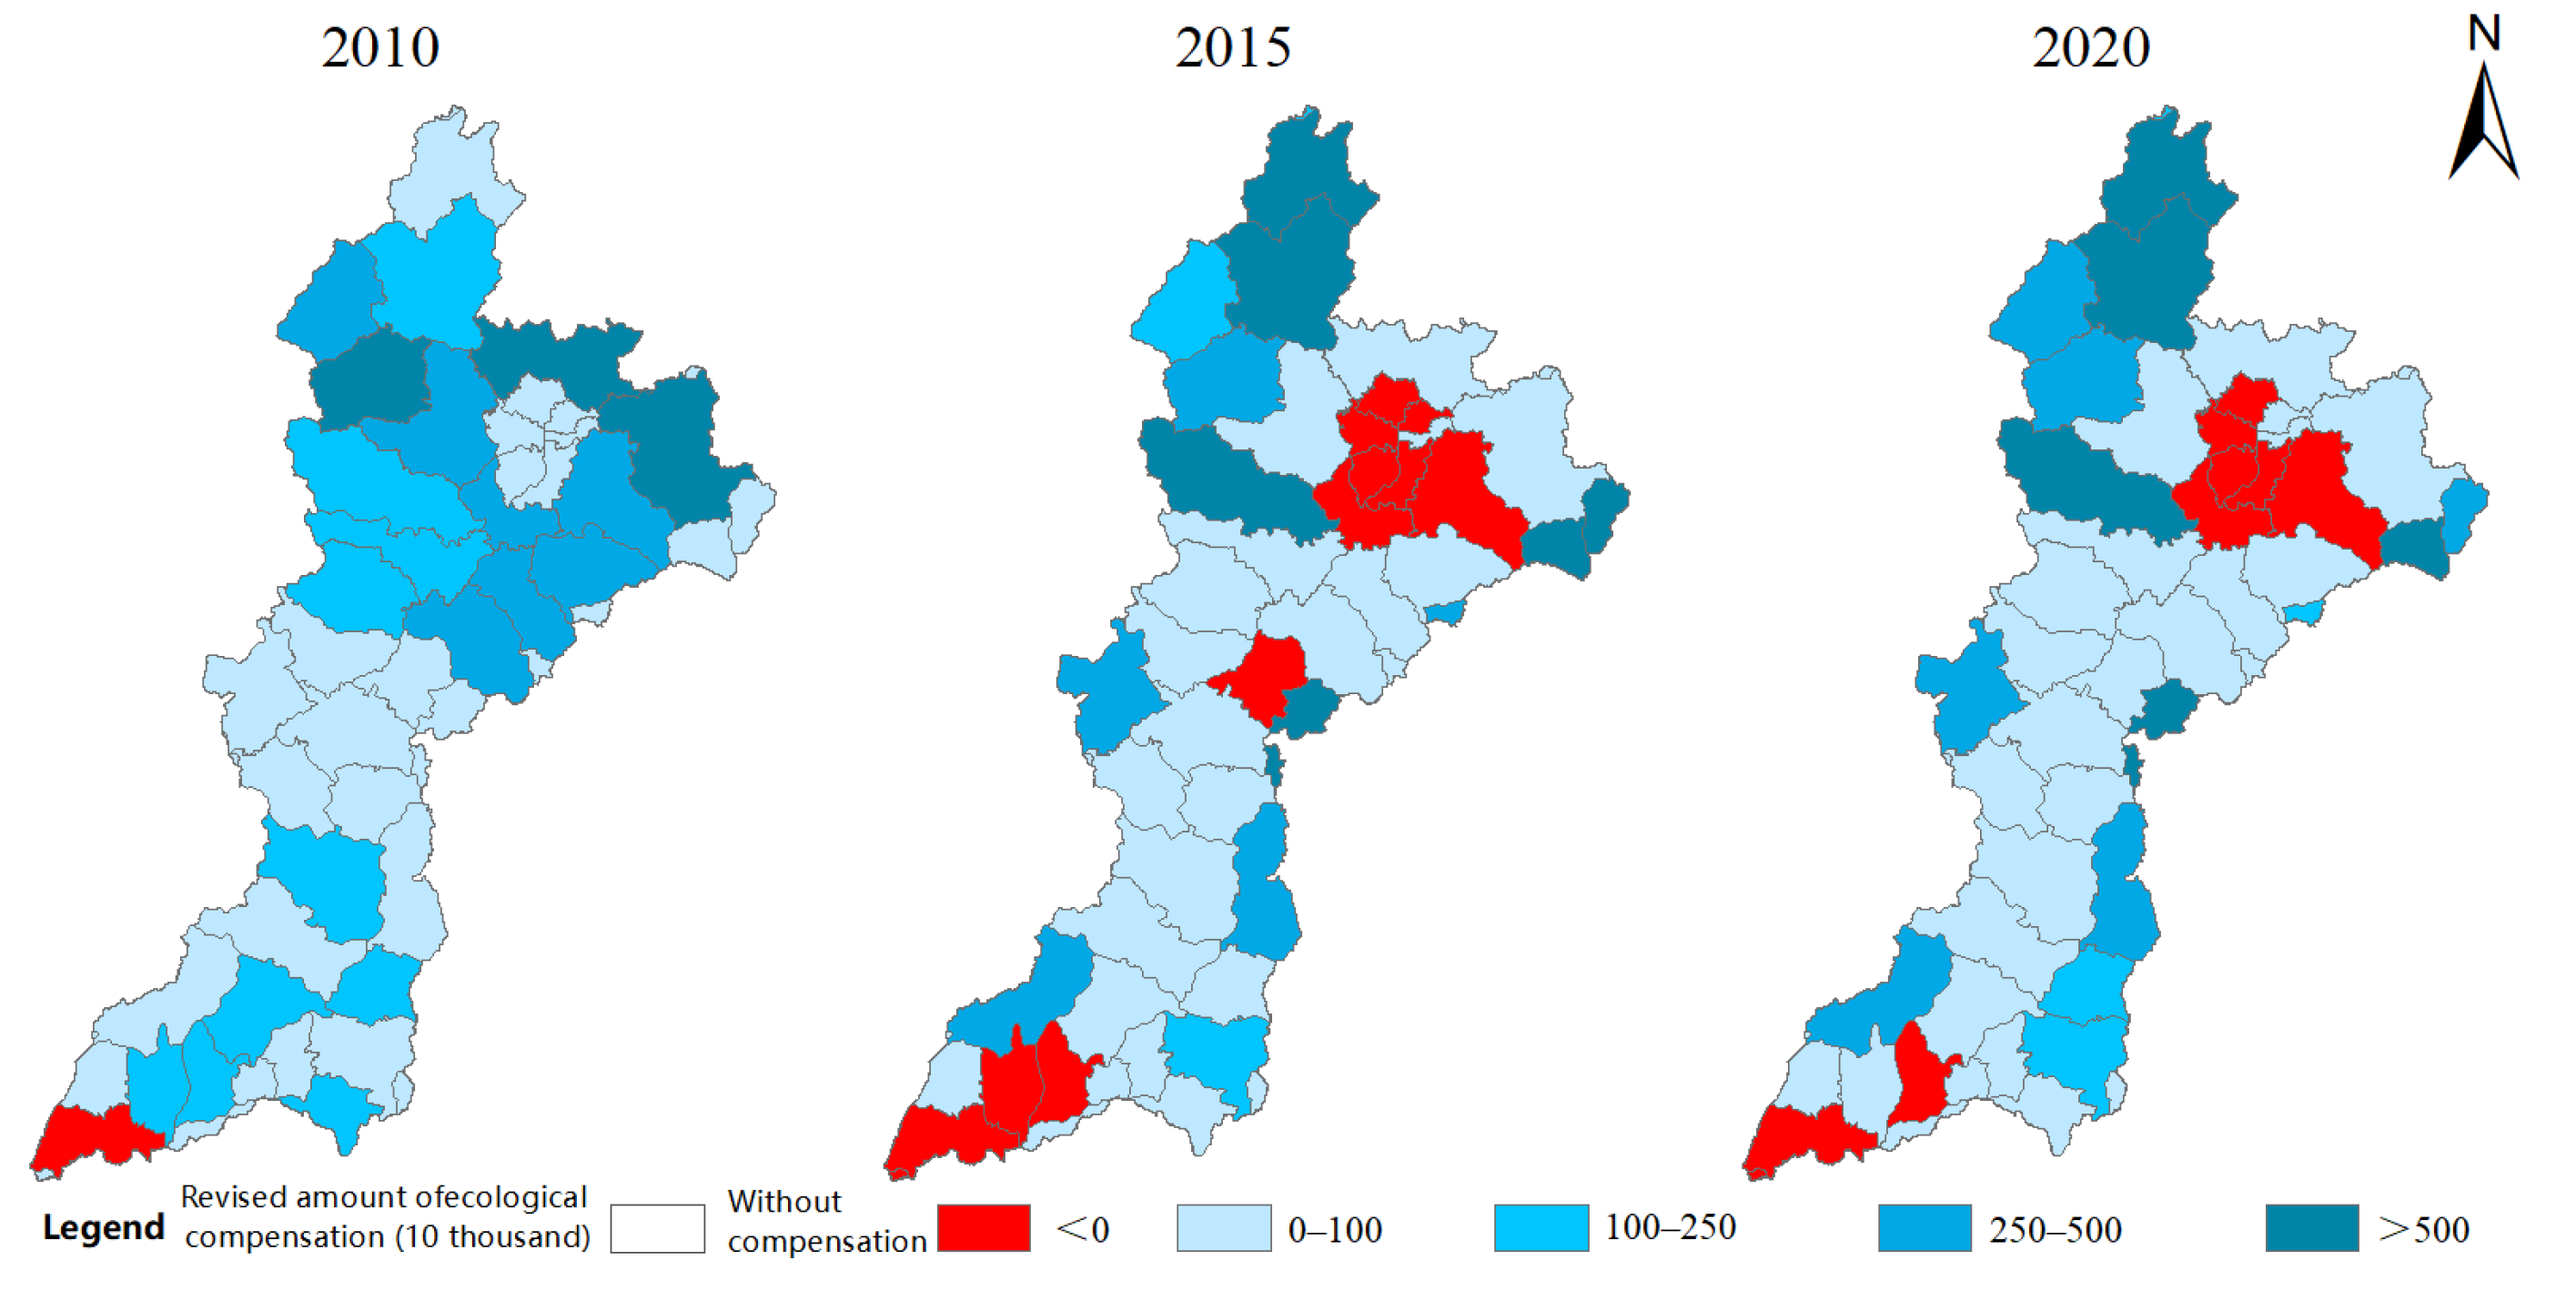
3.5. Calculation and Revision of Ecological Compensation Amounts for Water Ecosystem Services

Using the proportional method, the ecological compensation amounts for water ecosystem services at the county-level scale in the Fenhe River Basin were calculated for 2010, 2015, and 2020. Assuming a total compensation value of 100 million yuan, the results are presented in Supplementary Materials Table S4. To account for regional economic disparities, the preliminary compensation amounts at both the sub-basin and county levels were revised by incorporating adjustment coefficients based on normalized population density and GDP. The revised ecological compensation amounts, shown in Figure 9, generally align with the pre-revision trends but better reflect the economic conditions of the basin. The revised amounts for 2010–2020, which consider economic factors, provide a more reasonable basis for ecological compensation, as detailed in Supplementary Materials Table S5.
In 2010, counties with revised compensation amounts exceeding 5 million yuan/year were primarily located in the midstream Taiyuan urban area. By 2015 and 2020, counties with compensation amounts above this threshold were concentrated in the upstream western region and the midstream central-southern areas.
In 2010: Yangqu County, Shouyang County, and Loufan County received compensation exceeding 5 million yuan/year, with Yangqu County in the midstream receiving the highest amount (23.5724 million yuan/year), followed by Shouyang County (12.7487 million yuan/year). In contrast, peripheral counties such as Xi County, Yu County, and Yushe County received less than 10,000 yuan/year, while Wanrong County at the downstream outlet had a negative net compensation value.
In 2015: Heshun County, Ningwu County, Jingle County, Jiaocheng County, Qinyuan County, and Xiyang County received revised compensation exceeding 5 million yuan/year, with Heshun County in the midstream receiving the highest amount (19.6831 million yuan/year). However, Yingze District in the midstream and Xiaoyi City and Houma City downstream received less than 100,000 yuan/year. Several midstream counties, including Xinghualing District, Yuci District, Xiaodian District, Jinyuan District, Qingxu County, Jiancaoping District, and Wanbailin District, as well as Jiexiu City and downstream counties like Linyi County, Jishan County, Xinjiang County, and Wanrong County, had negative net compensation values.
In 2020: Ningwu County, Heshun County, Jingle County, Jiaocheng County, and Qinyuan County received net compensation exceeding 5 million yuan/year, with Ningwu County in the midstream receiving the highest amount (18.5149 million yuan/year). However, Shouyang County, Xinghualing District, and Yingze District in the midstream, as well as Jishan County downstream, received less than 100,000 yuan/year. Midstream counties such as Yuci District, Xiaodian District, Jinyuan District, Qingxu County, Jiancaoping District, and Wanbailin District, along with downstream counties like Linyi County, Xinjiang County, and Wanrong County, had negative net compensation values.
These results highlight the spatial and temporal variability in ecological compensation, emphasizing the influence of economic factors and regional disparities on compensation allocation. The revised compensation framework provides a more equitable and economically informed basis for sustainable water resource management in the Fenhe River Basin.

4. Discussion

4.1. Characteristics of Water Ecosystem Service Flows in the Fenhe River Basin

Water is a vital resource, sustaining life and shaping ecosystems by transporting sediments, minerals, and nutrients while regulating climate. Its distribution is influenced by natural factors like rainfall and topography, but human activities, especially since the Industrial Revolution, have significantly altered hydrological systems, intensifying resource exploitation.
In the semi-arid Fenhe River Basin, water ecosystem services hold critical socio-economic importance. From 2010 to 2020, both supply and demand increased, but persistent deficits emerged as demand outpaced supply. Spatial mismatches between supply (concentrated in upper and middle reaches) and demand (focused downstream) highlight strong heterogeneity. Rainfall, a key driver of supply, initially decreased before rising, while demand was driven by population density and economic activity. By 2020, improved network connectivity reflected partial recovery from earlier imbalances, aided by water-saving policies and technological advances. Urban expansion and land degradation from 2010 to 2015 worsened deficits, but subsequent measures alleviated some pressures. Human activities have profoundly disrupted natural water flows, underscoring the need for adaptive management.

4.2. Rationality and Necessity of Using Ecosystem Service Flows for Ecological Compensation

In river basins, alluvial plains in middle and lower reaches support intensive human activities, creating high water demand, while upstream areas, crucial for water conservation, often face economic underdevelopment. This mismatch between ecological contributions and economic benefits necessitates ecological compensation to promote balanced development.
Ecosystem service flow theory provides a scientific basis for compensation by identifying supply and beneficiary areas, offering a framework for cross-regional horizontal compensation that reduces reliance on central fiscal support. Studies, such as the economic analysis of the Lushui Basin, demonstrate its effectiveness in balancing regional ecological and economic interests. However, economic disparities, particularly in inland regions like the Fenhe River Basin, limit payment capacities, requiring a hybrid system combining horizontal and vertical compensation.
Accelerating compensation policies is crucial to address growing supply–demand mismatches and ensure water security. While economic development demands stable, high-quality water services, upstream ecological protection must be strengthened. A scientifically sound compensation mechanism is vital for regional water security and coordinated development. However, regional economic disparities create gaps between actual and required payments, necessitating national fiscal support. Research on China’s rural agricultural land compensation system emphasizes the need for policies that account for regional economic differences, advocating for a combined compensation approach.
In summary, ecological compensation, as an incentive mechanism, plays a critical role in promoting balanced development and water security. A hybrid vertical–horizontal compensation system, tailored to socio-economic disparities, is essential for sustainable development, balancing ecological and economic interests while alleviating fiscal pressures.

4.3. Spatial Scale Challenges in Compensation Design

Sub-basins, as subdivisions of river basins, have relatively independent hydrological cycles and ecosystem characteristics. Studying ecosystem services at the sub-basin scale can more precisely reveal spatial heterogeneity, dynamic changes, and influencing factors, aiding in the formulation of targeted and effective ecological protection and restoration measures. In this study, the midstream region around Taiyuan City faces significant water resource deficits due to urban expansion and agricultural development, consuming large amounts of water while producing little. Addressing this issue may require inter-basin water transfers to meet water demand. In Lingshi County and its surrounding areas, the midstream water ecosystem service flow has direct supply zones, but extreme supply–demand imbalances in some sub-basins from 2010 to 2020 limited actual supply to Sub-basin 23 from only Sub-basins 21 and 24. Sub-basin 23 served as a water supply zone in 2010 and 2020, providing resources to downstream Sub-basin 27, but became a demand zone in 2015 due to insufficient upstream supply, disrupting the network. In Yaodu District and its downstream regions, network connectivity initially decreased before improving by 2020. The severe water shortage in 2015 caused widespread supply deficits, but conditions improved by 2020 due to increased rainfall and the implementation of ecological protection and restoration policies in the Fenhe River Basin since 2017.
Globally, implementing ecological compensation policies faces significant challenges, particularly in standardizing ecological value quantification. Additionally, defining spatial scales poses difficulties in ensuring policy effectiveness. While small watershed scales are more suitable for studying hydrological processes, administrative divisions are more practical for managing compensation funds. Integrating these scales requires more cross-scale research and regional practices. Notably, the spatial distribution of supply and demand aligns with sub-basin characteristics, as ecosystem functions and structures are not constrained by administrative boundaries [20]. Future research should adopt a cross-boundary perspective to explore regional ecosystem service flow characteristics [38] for a more comprehensive analysis.

4.4. Research Limitations and Advances

This study, using the Fenhe River Basin as a case, quantifies water ecosystem service supply and demand from 2010 to 2020, analyzes supply–demand matching relationships, constructs a spatial flow model, and calculates ecological compensation amounts at both county and sub-basin scales. The compensation amounts are revised based on economic conditions, culminating in a tailored ecological compensation scheme for the Fenhe River Basin. The study’s innovations include: (1) multi-scale ecosystem service flow research, constructing a framework for ecological compensation mechanisms based on “grid scale-sub-basin scale-county scale” to study supply, flow, and demand; (2) determining ecological compensation ratios and optimizing compensation standards by incorporating population density and GDP to account for regional economic disparities. However, the study idealizes the construction of the water ecosystem service flow network at the sub-basin scale, neglecting factors such as surface–groundwater interactions, water recycling, and the impact of artificial interventions like reservoirs and dams [39]. Additionally, future research should incorporate water quality modules to analyze its impact on water ecosystem services [40].

5. Conclusions

In this study, we have found that the Fenhe River Basin exhibits significant spatial heterogeneity and imbalances in the supply and demand of water ecosystem services. From 2010 to 2020, water supply fluctuated, initially decreasing and then increasing due to variations in rainfall, while demand first rose and then declined, influenced by ecological restoration plans, economic restructuring, industrial upgrades, stricter water resource management, and improved water-use efficiency.
Water ecosystem service flows primarily occur in the midstream and downstream regions. Overall, the basin remains in a deficit state, with demand exceeding supply. However, the mismatch between supply and demand at the sub-basin scale improved significantly compared to 2010 and 2015, and the connectivity of the water ecosystem service network strengthened. At the county level, most regions exhibit multiple inflow and outflow relationships with neighboring areas. In 2010, flow interactions were sparse in the upstream regions, with small volumes, but increased from midstream to downstream. By 2015, flow volumes decreased compared to 2010, but by 2020, they partially recovered, with midstream-to-downstream flows gradually increasing.
Ecological compensation zones are primarily located in the upstream areas, while compensating zones are concentrated in the midstream and downstream regions. Sub-basin 34, at the downstream outlet, has a significantly higher expenditure ratio than compensation ratio, requiring substantial payments to upstream areas. These findings highlight the need for targeted policies to address spatial mismatches and enhance the sustainability of water ecosystem services in the Fenhe River Basin.
Methodologically, The multi-scale framework developed in this study offers critical advancements for addressing water ecosystem service mismatches in basins facing rapid urbanization and climate stressors. By integrating spatial-explicit modeling (InVEST), dynamic service flow networks, and socio-economic adjustment factors, this approach enables precise identification of supply–demand imbalances at sub-basin (±500 m resolution) and county scales. Such granularity surpasses traditional single-scale assessments allowing policymakers to prioritize interventions in critical zones—for instance, upstream sub-basins contributing 45% of water retention but occupying only 12% of the basin area.

Supplementary Materials

The following supporting information can be downloaded at: https://www.mdpi.com/article/10.3390/land14040664/s1, Table S1: Biophysical parameters for each land use type; Table S2: Comparison of Water Supply and Demand at the Sub-basin Scale in the Fenhe River Basin (2010–2020) (106 m3); Table S3: Spatial Location, Weights, and Edge Connectivity of Water Ecosystem Service Network Nodes at the Sub-basin Scale in the Fenhe River Basin (2010–2020); Table S4: The pre-revision amount of subwatershed scale water ecosystem service ecological compensation in Fenhe River Basin from 2010 to 2020; Table S5: The revised amount of subwatershed scale water ecosystem service ecological compensation in Fenhe River Basin from 2010 to 2020.

Author Contributions

Conceptualization, F.D., X.F., J.L., J.W. and C.D.; Methodology, F.D., X.F. and J.L.; Software, S.W.; Formal analysis, F.D. and S.W.; Investigation, F.D. and S.W.; Writing—original draft, F.D. and Chengcheng Dong; Writing—review & editing, F.D., X.F., R.Z. and C.D.; Visualization, F.D.; Supervision, J.W. All authors have read and agreed to the published version of the manuscript.

Funding

This work was supported by Tech and Open Fund of Laboratory for Urban Future, Peking University Shenzhen Graduate School [grant number 202107], and the National Natural Science Foundation of China [grant number 32101299].

Data Availability Statement

The original contributions presented in this study are included in the article/Supplementary Materials. Further inquiries can be directed to the corresponding author. No new data were created or analyzed in this study. Data sharing is not applicable to this article.

Conflicts of Interest

Author Jiacheng Li was employed by the company Urban Planning & Design Institute of Shenzhen Co., Ltd. The remaining authors declare that the research was conducted in the absence of any commercial or financial relationships that could be construed as a potential conflict of interest.

References

  1. Lyu, R.; Zhang, J.; Xu, M.; Li, J. Impacts of urbanization on ecosystem services and their temporal relations: A case study in Northern Ningxia, China. Land Use Policy 2018, 77, 163–173. [Google Scholar] [CrossRef]
  2. Liu, H.; Xiao, W.; Zhu, J.; Zeng, L.; Li, Q. Urbanization intensifies the mismatch between the supply and demand of regional ecosystem services: A large-scale case of the Yangtze River Economic Belt in China. Remote Sens. 2022, 14, 5147. [Google Scholar] [CrossRef]
  3. Li, P.; Liu, C.; Liu, L.; Wang, W. Dynamic analysis of supply and demand coupling of ecosystem services in Loess Hilly Region: A case study of Lanzhou, China. Chin. Geogr. Sci. 2021, 31, 276–296. [Google Scholar]
  4. Peng, S.; Ding, Y.; Wen, Z.; Chen, Y.; Cao, Y.; Ren, J. Spatiotemporal change and trend analysis of potential evapotranspiration over the Loess Plateau of China during 2011–2100. Agric. For. Meteorol. 2017, 233, 183–194. [Google Scholar]
  5. Pinto, R.; de Jonge, V.N.; Marques, J.C. Linking biodiversity indicators, ecosystem functioning, provision of services and human well-being in estuarine systems: Application of a conceptual framework. Ecol. Indic. 2014, 36, 644–655. [Google Scholar]
  6. Haines-Young, R.; Potschin, M. The links between biodiversity, ecosystem services and human well-being. Ecosyst. Ecol. A New Synth. 2010, 1, 110–139. [Google Scholar]
  7. Hernández-Blanco, M.; Costanza, R.; Chen, H.; DeGroot, D.; Jarvis, D.; Kubiszewski, I.; Montoya, J.; Sangha, K.; Stoeckl, N.; Turner, K. Ecosystem health, ecosystem services, and the well-being of humans and the rest of nature. Glob. Change Biol. 2022, 28, 5027–5040. [Google Scholar]
  8. Costanza, R. Ecosystem services: Multiple classification systems are needed. Biol. Conserv. 2008, 141, 350–352. [Google Scholar]
  9. Serna-Chavez, H.; Schulp, C.; Van Bodegom, P.; Bouten, W.; Verburg, P.; Davidson, M. A quantitative framework for assessing spatial flows of ecosystem services. Ecol. Indic. 2014, 39, 24–33. [Google Scholar]
  10. Bagstad, K.J.; Villa, F.; Batker, D.; Harrison-Cox, J.; Voigt, B.; Johnson, G.W. From theoretical to actual ecosystem services: Mapping beneficiaries and spatial flows in ecosystem service assessments. Ecol. Soc. 2014, 19, 64. [Google Scholar] [CrossRef]
  11. Fisher, B.; Turner, R.K.; Morling, P. Defining and classifying ecosystem services for decision making. Ecol. Econ. 2009, 68, 643–653. [Google Scholar]
  12. Jones, L.; Norton, L.; Austin, Z.; Browne, A.; Donovan, D.; Emmett, B.; Grabowski, Z.; Howard, D.; Jones, J.P.; Kenter, J. Stocks and flows of natural and human-derived capital in ecosystem services. Land Use Policy 2016, 52, 151–162. [Google Scholar] [CrossRef]
  13. Villamagna, A.M.; Angermeier, P.L.; Bennett, E.M. Capacity, pressure, demand, and flow: A conceptual framework for analyzing ecosystem service provision and delivery. Ecol. Complex. 2013, 15, 114–121. [Google Scholar] [CrossRef]
  14. Schirpke, U.; Candiago, S.; Egarter Vigl, L.; Jäger, H.; Labadini, A.; Marsoner, T.; Meisch, C.; Tasser, E.; Tappeiner, U. Integrating supply, flow and demand to enhance the understanding of interactions among multiple ecosystem services. Sci. Total Environ. 2019, 651, 928–941. [Google Scholar] [CrossRef]
  15. Daily, G.C.; Polasky, S.; Goldstein, J.; Kareiva, P.M.; Mooney, H.A.; Pejchar, L.; Ricketts, T.H.; Salzman, J.; Shallenberger, R. Ecosystem services in decision making: Time to deliver. Front. Ecol. Environ. 2009, 7, 21–28. [Google Scholar] [CrossRef]
  16. Bagstad, K.J.; Johnson, G.W.; Voigt, B.; Villa, F. Spatial dynamics of ecosystem service flows: A comprehensive approach to quantifying actual services. Ecosyst. Serv. 2013, 4, 117–125. [Google Scholar] [CrossRef]
  17. Baró, F.; Palomo, I.; Zulian, G.; Vizcaino, P.; Haase, D.; Gómez-Baggethun, E. Mapping ecosystem service capacity, flow and demand for landscape and urban planning: A case study in the Barcelona metropolitan region. Land Use Policy 2016, 57, 405–417. [Google Scholar] [CrossRef]
  18. Anton, C.; Young, J.; Harrison, P.A.; Musche, M.; Bela, G.; Feld, C.K.; Harrington, R.; Haslett, J.R.; Pataki, G.; Rounsevell, M.D. Research needs for incorporating the ecosystem service approach into EU biodiversity conservation policy. Biodivers. Conserv. 2010, 19, 2979–2994. [Google Scholar] [CrossRef]
  19. Li, X.; Li, X.; Lyu, X.; Dang, D.; Wang, K.; Zhang, C.; Cao, W. Linking ecological and social systems to promote regional security management: A perspective of ecosystem services supply-flow-demand. Ecol. Indic. 2023, 156, 111124. [Google Scholar] [CrossRef]
  20. Yuan, C.; Weng, Y.; Xiong, K.; Rong, L. Projections of Land Use Change and Water Supply–Demand Assessment Based on Climate Change and Socioeconomic Scenarios: A Case Study of Guizhou Province, China. Land 2024, 13, 194. [Google Scholar] [CrossRef]
  21. Shang, W.; Gong, Y.; Wang, Z.; Stewardson, M.J. Eco-compensation in China: Theory, practices and suggestions for the future. J. Environ. Manag. 2018, 210, 162–170. [Google Scholar]
  22. Zhang, X.; Li, F.; Li, X. Bibliometric analysis of ecological compensation and its application in land resources. Landsc. Ecol. Eng. 2021, 17, 527–540. [Google Scholar] [CrossRef]
  23. Adhikari, R.K.; Kindu, M.; Pokharel, R.; Castro, L.M.; Knoke, T. Financial compensation for biodiversity conservation in Ba Be National Park of Northern Vietnam. J. Nat. Conserv. 2017, 35, 92–100. [Google Scholar] [CrossRef]
  24. Zheng, X.; Zhang, J.; Cao, S. Net value of grassland ecosystem services in mainland China. Land Use Policy 2018, 79, 94–101. [Google Scholar]
  25. Eskandari-Damaneh, H.; Noroozi, H.; Ghoochani, O.M.; Taheri-Reykandeh, E.; Cotton, M. Evaluating rural participation in wetland management: A contingent valuation analysis of the set-aside policy in Iran. Sci. Total Environ. 2020, 747, 141127. [Google Scholar]
  26. Iranah, P.; Lal, P.; Wolde, B.T.; Burli, P. Valuing visitor access to forested areas and exploring willingness to pay for forest conservation and restoration finance: The case of small island developing state of Mauritius. J. Environ. Manag. 2018, 223, 868–877. [Google Scholar]
  27. Sheng, W.; Zhen, L.; Xie, G.; Xiao, Y. Determining eco-compensation standards based on the ecosystem services value of the mountain ecological forests in Beijing, China. Research on ecological compensation standard based on ecological service value of Beijing mountain ecological public welfare forest. Ecosyst. Serv. 2017, 26, 422–430. [Google Scholar] [CrossRef]
  28. Zhong, S.; Geng, Y.; Huang, B.; Zhu, Q.; Cui, X.; Wu, F. Quantitative assessment of eco-compensation standard from the perspective of ecosystem services: A case study of Erhai in China. J. Clean. Prod. 2020, 263, 121530. [Google Scholar] [CrossRef]
  29. Yang, Y.; Yao, C.; Xu, D. Ecological compensation standards of national scenic spots in western China: A case study of Taibai Mountain. Tour. Manag. 2020, 76, 103950. [Google Scholar] [CrossRef]
  30. Yang, Y.; Lu, H.; Liang, D.; Chen, Y.; Tian, P.; Xia, J.; Wang, H.; Lei, X. Ecological sustainability and its driving factor of urban agglomerations in the Yangtze River Economic Belt based on three-dimensional ecological footprint analysis. J. Clean. Prod. 2022, 330, 129802. [Google Scholar] [CrossRef]
  31. Zhang, C.; Li, J.; Zhou, Z.; Sun, Y. Application of ecosystem service flows model in water security assessment: A case study in Weihe River Basin, China. Ecol. Indic. 2021, 120, 106974. [Google Scholar] [CrossRef]
  32. Yu, Y.; Li, J.; Han, L.; Zhang, S. Research on ecological compensation based on the supply and demand of ecosystem services in the Qinling-Daba Mountains. Ecol. Indic. 2023, 154, 110687. [Google Scholar] [CrossRef]
  33. Engel, S.; Palmer, C.; Taschini, L.; Urech, S. Conservation payments under uncertainty. Land Econ. 2015, 91, 36–56. [Google Scholar] [CrossRef]
  34. Liu, Q.; Qiao, J.; Li, M.; Huang, M. Spatiotemporal heterogeneity of ecosystem service interactions and their drivers at different spatial scales in the Yellow River Basin. Sci. Total Environ. 2024, 908, 168486. [Google Scholar] [CrossRef]
  35. Yang, J.; Huang, X. 30 m annual land cover and its dynamics in China from 1990 to 2019. Earth Syst. Sci. Data Discuss. 2021, 2021, 1–29. [Google Scholar]
  36. Ding, Y.; Peng, S. Spatiotemporal change and attribution of potential evapotranspiration over China from 1901 to 2100. Theor. Appl. Climatol. 2021, 145, 79–94. [Google Scholar] [CrossRef]
  37. Wang, C.; Wang, J. Kilometer Grid Dataset of China’s Historical GDP Spatial Distribution (1990–2015); A Big Earth Data Platform for Three Poles; National Tibetan Plateau Data Center: Beijing, China, 2022. [Google Scholar]
  38. Wu, C.; Lu, R.; Zhang, P.; Dai, E. Multilevel ecological compensation policy design based on ecosystem service flow: A case study of carbon sequestration services in the Qinghai-Tibet Plateau. Sci. Total Environ. 2024, 921, 171093. [Google Scholar] [CrossRef] [PubMed]
  39. Thieme, M.L.; Tickner, D.; Grill, G.; Carvallo, J.P.; Goichot, M.; Hartmann, J.; Higgins, J.; Lehner, B.; Mulligan, M.; Nilsson, C. Navigating trade-offs between dams and river conservation. Glob. Sustain. 2021, 4, e17. [Google Scholar] [CrossRef]
  40. Tao, Y.; Tao, Q.; Qiu, J.; Pueppke, S.G.; Gao, G.; Ou, W. Integrating water quantity-and quality-related ecosystem services into water scarcity assessment: A multi-scenario analysis in the Taihu Basin of China. Appl. Geogr. 2023, 160, 103101. [Google Scholar] [CrossRef]
Figure 1. Fen River Basin Overview Map.
Land 14 00664 g001
Figure 2. (a) Supply of water ecosystem services in Fenhe River Basin, grid scale (b) Demand of water ecosystem service in Fenhe River Basin, grid scale (c) Supply of water ecosystem services in Fenhe River Basin, sub-basin scale (d) Demand of water ecosystem services in Fenhe River Basin, sub-basin scale (e) Statistical chart of water ecosystem service supply in sub-basins of Fenhe River Basin from 2010 to 2020 (Unit: 106 m3) (f) Statistical chart of water ecosystem service demand in sub-basins of Fenhe River Basin from 2010 to 2020 (Unit: 106 m3).
Land 14 00664 g002
Figure 3. (a) Supply and demand ratio of water ecosystem services, grid scale (b) Surplus and deficit of water ecosystem services, grid scale (c) Supply and demand ratio of water ecosystem services, sub-basin scale.
Land 14 00664 g003
Figure 4. Theoretical Water Ecosystem Service Flow (the above group) and Actual Water Ecosystem Service Flow (the below group).
Land 14 00664 g004
Figure 5. Spatial distribution of county-scale water supply and benefits in Fenhe River Basin in 2010, 2015 and 2020.
Land 14 00664 g005
Figure 6. Spatial distribution of water ecosystem service supply and demand at the sub-basin scale and the direction of the ecological compensation (in 2010, 2015, 2020).
Land 14 00664 g006
Figure 7. Fund expenditure and allocation ratios for water ecosystem services at the sub-basin scale.
Land 14 00664 g007
Figure 8. The proportion of ecological expenditure and the compensation among Fenhe River Basin in 2010, 2015 and 2020.
Land 14 00664 g008
Figure 9. Revised amount of ecological compensation of Fenhe River Basin in 2010, 2015 and 2020.
Land 14 00664 g009
Table 1. Characteristics of the Water Ecosystem Service Flow Network in the Fenhe River Basin (2010–2020).
YearSupply NodesDemand
Nodes
Edges
with
Active Flows
Edges Without Active FlowsNetwork Denstity
2010142021120.64
2015102415180.45
2020161823100.70
Table 2. The proportion of ecological expenditure and the compensation among Fenhe River Basin in 2010, 2015 and 2020.
The Proportion of Ecological Expenditure The Proportion of Ecological Compensation Funds
Amount of Counties with the Value Greater than 5%Amount of Counties with the Value Less than 0.1%The Top Three CountiesThe Counties with the Lowest ValueAmount of Counties with the Value Greater than 5%Amount of Counties with the Value Less than 0.1%The Top Three CountiesThe Counties with the Lowest Value
2010725Lingshi County
11.86%
Xinjiang County
9.24%
Houma City
9.12%
Qinshui County, Yushe County, Xi County, Shenchi County, Qinyuan County, Wuxiang County 0822Lingshi County
11.91%
Xinjiang County
9.37%
Houma City
9.14%
Qinshui county, Shenchi County, Qinyuan County, Wuxiang County
0
2015621Lingshi County
8.71%,
Xinjiang County
8.36%,
Houma City
8.25%
Yingze District,
Wenxi county, 0
611Lingshi County
8.82%,
Xinjiang County
8.34%,
Houma City
8.32%
Linyi County, Wenxi County, 0
2020620Xinjiang County
9.06%,
Houma City
8.93%,
Lingshi County
8.5%
Yingze District, Yu County, Wenxi County 0713Xinjiang County
9.06%,
Houma City
9.01%,
Lingshi County
8.67%
Linyi County, Wenxi County, 0
Disclaimer/Publisher’s Note: The statements, opinions and data contained in all publications are solely those of the individual author(s) and contributor(s) and not of MDPI and/or the editor(s). MDPI and/or the editor(s) disclaim responsibility for any injury to people or property resulting from any ideas, methods, instructions or products referred to in the content.

