Abstract
Understanding how land use affects urban rail transit (URT) ridership is essential for facilitating URT usage. While previous studies have explored the way that land use impacts URT ridership, few have figured out how this impact evolves over time. Utilizing URT turnstile and land use data in Beijing, we employed panel data analysis methods to verify the existence of the temporal heterogeneity of the impact and capture this temporal heterogeneity. The results identified time-varying impacts of land use on the URT boarding and alighting trips on weekdays and non-weekdays and also demonstrated the rationality of the mixed effects time-varying coefficient panel data (TVC-P) model in capturing this temporal heterogeneity accurately. The TVC-P model revealed how land use density appealed to URT commuting during weekday morning peak times, and how it triggered the generation of URT commutes during the weekday evening rush hours. The land use diversity promoted URT trips over an extended period on non-weekdays. Additionally, the study identified the time-varying impacts of specific land use on URT ridership. These insights provide both theoretical and empirical support for developing policies and actions that improve the efficiency of transportation systems and foster alignment between land use and transport.
1. Introduction
Pursuing sustainable development strategies in today’s cities is imperative, as urban areas worldwide grapple with a myriad of challenges such as traffic congestion, energy consumption, and air pollution stemming from rapid urbanization and motorization. Transit-oriented development (TOD) has been articulated and advocated as an effective planning strategy for urban sustainability. It integrates transport systems and land use to create sustainable communities around public transportation, making sustainable transportation more convenient and appealing [1,2]. Urban rail transit (URT) systems have expanded rapidly from Western countries to emerging markets as an essential part of urban public transportation in recent years. By the end of 2023, 563 cities in 79 countries and regions had established URT systems, with a total mileage of more than 43,400 km [3]. Among them, China has a total of 66 cities that have opened and operate URT systems, with an operating mileage of 11,900 km, and the annual passenger flow of URT is 29,389 million trips [3,4]. Within the framework of TOD, the land use surrounding URT stations is generally dense and involves mixed-use development. This strategy aims to encourage sustainable transportation options, including walking, cycling, and public transit, while supporting consistent URT patronage. However, land uses around URT stations are complex due to the presence of various types and scales of land use [5]. Therefore, it is essential for urban planners to comprehend the influence and scope of land use on URT ridership as they navigate urban land regeneration toward regional sustainability in the paradigm of TOD.
Uncovering how land use affects URT ridership is the most prominent topic in the transportation domain, as it is paramount for policymakers to predict URT ridership and allocate transport resources accordingly. Previous studies have amply demonstrated that land use features under TOD concepts, such as high-density and mixed-use, can reduce the dependence on private cars for travel and promote public transportation trips, providing robust evidence for policy interventions in TOD planning [6,7,8,9,10]. Several studies have also observed heterogeneity in how different types, spaces, and timings of land use impact travel demand [10,11,12]. Heterogeneity in the spatial dimension can be effectively captured by geographically weighted regression (GWR) models [13]. However, heterogeneity in the temporal dimension has still not been effectively validated and captured. Without this understanding, operational managers cannot formulate dynamic schemes for URT train operation and passenger flow organization, and it is not easy to develop differentiated feeder services for URT customers.
This research aimed to empirically examine the temporal variations in the impact of land use on URT ridership and explore the dynamic relationship of the influence of land use on URT usage. We focused on analyzing the correlation between land use and URT ridership by using an existing and validated land use index to represent land use features based on the nature language mining algorithm [5] and explored the relationship via the panel data analysis method in the econometrics domain [14]. The nuanced findings theoretically contribute to dissecting how land use affects URT ridership across time. In practice, the recognized heterogeneity enables planners and URT operators to optimize the temporal distribution of URT ridership to optimize the timing of URT ridership through land renewal. This also helps align the URT system’s capacity with the ridership, thereby fostering coordination between land use and transportation.
The rest of this study is structured as follows. The preceding section provides a brief overview regarding the influence of land use on URT ridership. Section 2 presents a detailed review of this impact, while Section 3 exhibits the study area, data source, data description, and the approach to examine the temporal heterogeneity. Section 4 examines and captures the underlying varying temporal influences of land use on URT ridership. Section 5 discusses the possible reasons for the observed temporal heterogeneity, followed by a conclusion about the results, drawbacks, and future enhancements in Section 6.
2. Related Work
Numerous studies have been conducted in recent years to identify the determinants of URT ridership, providing rich empirical experience for developing TOD strategies and enhancing public transportation patronage. The built environments featured by the “Ds” indicators are the prominent factors influencing URT ridership the most [8,15,16,17]. Although the “Ds” indicators have been developed from 3D to 5D and 6D, the original 3D indicators (i.e., density, diversity, and design) were highlighted in the discussion, and the significant impact of the 3D indicators on the URT ridership was discovered [18,19,20].
Density is usually characterized by the ratio of the floor area of a specific type of land to the total area of the region [7,13,21]. Land-use data are not easily obtained due to the rules of data confidentiality. Consequently, in previous research, mobility and Internet data became an alternative to land-use data for the calculation of the density such as population density, job density, activity density, and density of various point-of-interests (POIs) [15,22,23]. Diversity is typically defined by indices such as land use entropy, POI mixture, and jobs–housing ratio, which describes the distribution of the various function combinations in a region [7,22,24]. Design-related indicators focus on the measurement of the structure of the public transportation network, open spaces, and the road network and its safety and quality including the network structure (i.e., betweenness centrality, degree centrality, closeness centrality), active transport road length/area, and intersection/cul-de-sac density [1,25,26,27,28]. Since the design-related indicators are not strongly associated with land use, they were not explicitly analyzed in this study.
Density generally contributes to the growth of URT ridership as it stimulates primary travel demand [15,29,30]. For instance, Shao (2020) [21] explored the impact of density on URT ridership by using a gradient-boosting decision tree model and found strong and positive impacts of employment density, commercial floor area ratio, and residential density on the URT ridership, suggesting that these indicators should be set as 40,000 jobs/km2, 2, and 77,000 persons/km2 to maximize the URT ridership, respectively. Similarly, Zhu (2024) [7] identified significant positive impacts of density on URT ridership, but only when the development intensity exceeded the threshold value. Studies [16,31,32] have also implied that among the density-related variables, those that were significantly correlated with URT ridership were positive, while those that were negatively correlated with URT ridership were insignificant. This finding also supports the standpoint that density generally contributes to the growth of URT ridership. Diversity is an essential indicator in urban land use planning, and many researchers have demonstrated that regions with high diversity levels depend less on private cars and make more non-motorized trips such as walking and biking [29]. In terms of travel demand, diversity has a modest impact on URT ridership, but in some places where it has a significant effect, the degree of influence is even greater than that of the density [7,9,18,33]. The results of Shao’s (2020) [21] study are consistent with most research findings that diversity is positively correlated with URT ridership and has a lower impact than density. In contrast, in Zhu’s (2024) study [7], the results of the 2015 data analysis found that the effects of diversity were higher than those of the density.
Nevertheless, the impacts of density and diversity variables on URT ridership vary in different regions and different periods. Lee (2017) [34] took the Seoul metropolitan area as an example and developed a regression model for land use and travel demand analysis. The results showed that the high-density development around URT stations in Seoul City and its neighboring sub-centers increased URT ridership, and that the high land use diversity may result in a growth in URT ridership and private car trip sharing in cities in the transition zone. Furthermore, it is necessary to restrict large-scale development in peripheral cities to increase the share of internal trips rather than increase the land use diversity. Geographically weighted regression models have been used as a classical analytical method for dealing with spatial heterogeneity to analyze differences in transit ridership in TOD station areas due to differences in spatial location [10,11,22,35]. In the time dimension, most studies used the daily URT ridership as dependent variables including weekend and weekday URT ridership [13,16,17,23] or peak hour and off-peak hour URT ridership [15,36]. Gan (2020) [15] investigated how land use affected URT ridership by using a gradient-augmented regression tree model and found that the built environment at the departure end of the morning had a more significant impact on the ridership than the land use at the arrival end of the morning, whereas the opposite was true in the afternoon and at night. Yang (2023) [37] further confirmed the existence of nonlinearity and temporal heterogeneity in the above effects using the random forest model and argued that ignoring this heterogeneity would lead to incorrect conclusions and wrong policy implications.
Although previous studies have developed various models to analyze the dynamics between land use and URT ridership, noting variations in this relationship over time, these temporal heterogeneous effects have yet to be thoroughly validated through statistical testing. Therefore, this study attempted to verify the existence of the temporal heterogeneity of the impact and capture the above-mentioned temporal heterogeneity, providing theoretical guidance and empirical basis for regional land renewal, URT passenger flow management, and URT resource scheduling.
3. Study Design
3.1. Study Area
The research site is located in Beijing, the capital of China (Figure 1). Being a prime example of cities in developing nations, Beijing has experienced swift urbanization, characterized by a significant increase in urban area and intensity over the last few decades. By the end of 2023, Beijing was projected to have a fixed population of 218.58 million individuals distributed throughout its 16 administrative districts, spanning a comprehensive administrative region of 16,410 square kilometers [38]. In 2023, there were 27 urban rail transit operating lines in Beijing, with 490 stations and an operating mileage of 836 km. The total urban passenger volume was 7.05 billion person-times, of which the urban rail transit passenger volume was 3.45 billion person-times, accounting for 49% of the total passenger volume. The average daily passenger volume was 9.46 million person-times, and the highest daily passenger volume reached 12.60 million person-times. Exploring how land use affects URT ridership in Beijing can serve as a valuable case study, offering insights for other cities aiming for sustainable development and adopting TOD strategies to address various challenges such as traffic congestion, energy consumption, and air pollution. This study focused on 336 operational URT stations in Beijing due to data availability.
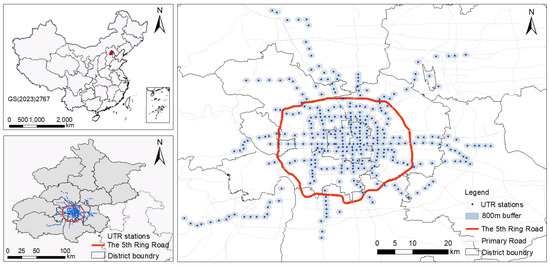
Figure 1.
Study area.
3.2. Data and Processing
3.2.1. Land Use
Although there is no exact standard for defining the catchment area of URT stations, this is generally considered as a buffer zone between 300 m and 800 m from the station, with 800 m widely used in the literature and in practice [39]. Ibraeva (2020) [40] concluded that individuals dwelling within an 800-m radius of a URT station were fourfold more predisposed to engage in public transportation usage than those situated farther than 800 m. Similarly, practices in China also recommend utilizing the 800-m distance as a crucial factor in urban planning and organizing urban activities, aligning with the Guidelines for Planning and Design of Urban Rail. Therefore, the study mapped the catchment zones for the chosen stations with an 800-m radius buffer, taking into account the existing TOD standards and the outcomes of related studies. This methodology ensured that each station’s spatial coverage aligned with the recommended distance for efficient urban planning and facilitated the integration of URT and land use within the urban fabric.
The land use data within the URT station’s catchment area were sourced from the Beijing Urban Planning and Design Institute and included land use types and related building areas. This research covered the top ten land use types by area within the domains of Beijing’s URT stations, specifically including public management and service facilities (L1), commercial and business facilities (L2), multifunction land-use (L3), green space and squares (L4), industrial estate (L5), residences (L6), urban transportation facilities (L7), external transportation facilities (L8), municipal utilities and infrastructure (L9), and logistics and warehouse (L10). Due to the fact that residential land is the primary land use within the catchment areas of selected URT stations in Beijing, covering an average area of over 1.1 million square meters, it covers up the characteristics of other land uses and ignores the potentially significant impact of their attributes on URT ridership. To cope with this issue, we utilized the importance of land use type (ILUT) concept from prior studies, represented by Equation (1), to capture the characteristics of a particular land use type rather than focusing on the overall area [5,12].
where symbolizes the built area of land use type j within the catchment zone of station i, J symbolizes the aggregate of land use types, and I denotes the overall number of stations. is used to denote the logarithm of the ratio between the total tally of the selected stations and the count of stations encompassing a specific land use type j, highlighting the scarcity of the land use j [5,12,41]. The ILUT can comprehensively express the land use characteristics from the perspective of the proportion and overall scarcity of various land use types.
In addition, considering that the total land use density and diversity are the primary land use characteristics that significantly impact urban rail traffic flow, they were supplemented to the land use characteristics we intended to analyze. Density was determined by the total built area across all land use types, while the formula for diversity is detailed in Equation (2), following Liu (2019) [5] and Song (2013) [42].
The aforementioned land use attributes were defined as independent variables and are displayed in Table 1. The overall land use density within Beijing’s URT station areas exhibited an average of 2.06 square kilometers with a variance of 1.22, while land use diversity demonstrated a mean value of 0.52 and a variance of 0.16, as illustrated in Figure 2. It is evident that the development density generally increased with proximity to the city center, reaching its peak near Guomao Station and Jintai Xizhao Station, where the land use density within the station catchment area reached 8.95 square kilometers. In contrast, the spatial distribution of diversity showed no pronounced pattern, maintaining relative equilibrium across the city, with 78% of observations falling within the 0.4–0.6 range. The most prominent land use feature within the catchment areas of URT stations in Beijing was multifunctional mixing (L3), with a mean value of 2.97, followed by external transportation facilities (L8) with a mean value of 2.15. Figure 3 shows the Pearson correlation coefficients between variables. The density exhibited moderate correlations with the ILUT of commercial and business facilities (L2), exhibiting Pearson correlation coefficients of 0.71 at the 0.01 significance level. Notably, all variables were retained for analyzing their associations with URT ridership, as the Pearson coefficients observed in Figure 3 were smaller than 0.8.

Table 1.
Descriptive statistics of the independent variables.
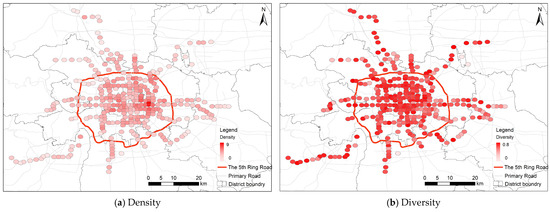
Figure 2.
Land use density (a) and diversity (b) around the selected URT stations.
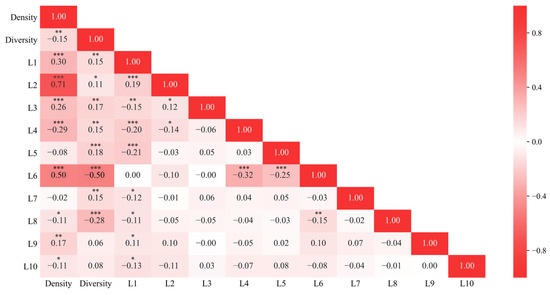
Figure 3.
Pearson correlation coefficients between variables. Note: Symbols ***, **, and * denote statistical significance at the 0.01, 0.05, and 0.10 levels, respectively.
3.2.2. URT Ridership
The URT ridership data were sourced from the Beijing Urban Planning and Design Institute including each station’s entry and exit turnstile data from 7 June to 13 June 2021. The average daily URT ridership during weekdays (7 June to 11 June) was 5.24 million trips, while during non-weekdays (12 June and 13 June), it was approximately half of the weekdays, at 2.65 million trips. The hourly boarding and alighting URT trips for working days and non-working days are presented in Figure 4. During work days, distinct morning and evening peaks were observed, with both boarding and alighting URT trips during the morning peak exceeding those of the evening peak. On non-working days, no distinct morning and evening peaks were evident, as daily boarding and alighting URT trips remained between 0.6 million and 1.1 million per hour. Specifically, the morning peak boarding trip reached 37.36 million per hour (7:00 am–8:00 am), while the corresponding peak alighting trip attained 43.88 million per hour during the same period.
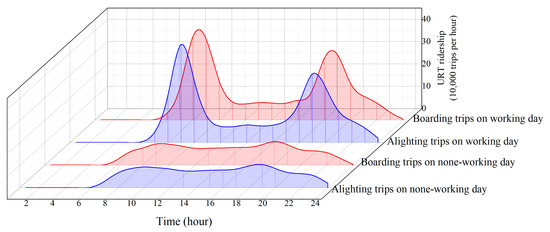
Figure 4.
Evolution of URT ridership over different time periods.
Figure 5 shows the spatial distribution of the daily URT ridership across Beijing. Overall, most stations had relatively balanced boarding and alighting trips spatially. The largest average daily boarding and alighting trips on weekdays were at Xi’erqi Station, while the largest average daily boarding and alighting trips on non-weekdays were at Beijing South Railway Station. Theoretically, the total boarding trips should equal the alighting trips, and the distribution of all-station boarding and alighting trips in the time dimension should be the same. However, as shown in Figure 6 and Figure 7, the relationship between a particular station’s boarding and alighting trips varied significantly across time. On weekdays, boarding trips were considerably higher than alighting trips at most stations in the morning. In contrast, the daytime boarding and alighting trips were similar; at night, alighting trips were significantly higher than the boarding trips. On non-weekdays, these characteristics were not as pronounced as on weekdays. Thus, it was necessary to explore the temporal heterogeneity of the effect of land use on URT boarding and alighting trips separately.
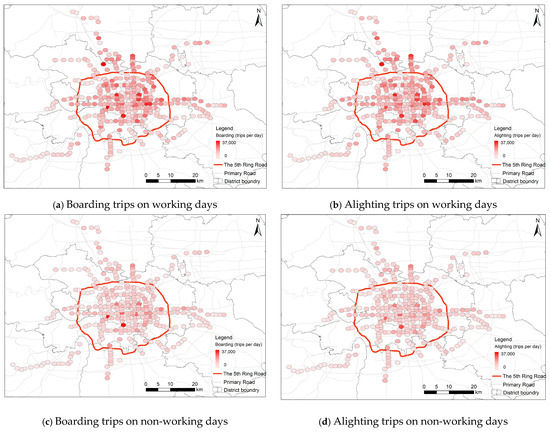
Figure 5.
Daily URT ridership of the selected URT stations.
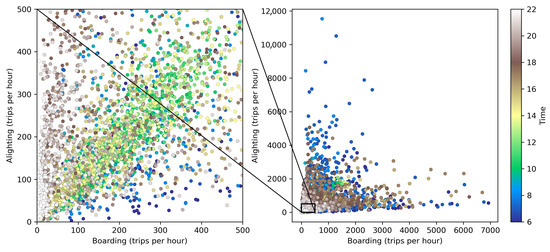
Figure 6.
Hourly URT ridership of the selected URT stations on weekdays.
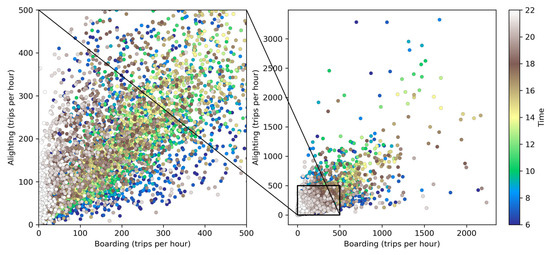
Figure 7.
Hourly URT ridership of the selected URT stations on non-weekdays.
3.3. Methodology
Commonly encountered types of research data types encompass time series, cross-sectional, and panel data. Time-series data focuse on observations of a single variable over time, while cross-sectional data examine multiple variables at a specific point in time. Panel data, on the other hand, combine these two aspects by following a group of specific entities (URT stations in this research) over multiple time periods. Panel data models can be classified into varying intercept models and varying coefficient models based on changes in the coefficients and intercepts. Varying intercept models assume that the intercept may differ across entities but are constant over time, or the intercept may differ over time but be constant across entities. Varying coefficient models allow both the intercept and coefficients to vary either across entities, over time, or both [14]. The time-varying coefficient (TVC) panel data model used in this study is a type of varying coefficient model. It is particularly well-suited for investigating how land use characteristics influence URT ridership, with an emphasis on temporal variations. In this study, we had N URT stations, and we observed ridership data across T periods. The TVC model assumes that the relationships between land use characteristics and ridership are not fixed over time. For example, the effect of a certain type of land use (e.g., a new commercial development near a URT station) on ridership may be different in the morning rush hours compared with the evening rush hours. This dynamic nature of relationships is captured by the TVC model by allowing the coefficients to vary over time. Mathematically, the TVC model can be represented as in Equation (3).
where represents the URT ridership, while represents the K-dimensional land use characteristics of the URT station i in the period t. denotes the intercept for the period t (a K × 1 vector), while represents the K-dimensional coefficient to be regressed. represents the random disturbance term that follows a normal distribution with a mean of zero and a variance of (i.e., ~N(0, )), where all i and t are independent. According to the distribution of intercepts, the TVC model can be classified into three types: the fixed effects TVC (TVC-F), the random effects TVC (TVC-R), and the mixed effects TVC (TVC-P) model. In the TVC-F model, the intercept is associated with the structure of the URT stations or the time periods; in the TVC-R model, the intercept is a constant that follows a normal distribution and is linked to the period; and in the TVC-P model, the intercept maintains static. When all intercepts and coefficients are equal, the TVC model is equivalent to the global linear regression (GLR) model. The variable of boarding and alighting trips changes with time and URT stations, while the independent variable (i.e., land use characteristics) changes with URT stations.
To assess whether the effects of land use on URT ridership exhibited temporal heterogeneity, equality hypotheses were formulated regarding the intercept vectors α∗ and β. This analysis aimed to determine the necessity of establishing a TVC model to account for any temporal variations. The null hypothesis (H0) and the alternative hypothesis (H1) were defined as follows:
H0:
The intercepts and coefficients remain uniform throughout all periods, signifying that,
H1:
The intercepts and coefficients vary across different periods.
Let and represent the constrained sums of squares (RSS) from the ordinary least squares (OLS) regression on the GLR model (representing H0) and the TVC-P model (representing H1), respectively. Under the null hypothesis H0, follows an distribution with degrees of freedom, while follows an distribution with degrees of freedom. Therefore, follows an distribution with degrees of freedom. Thus, an F-statistic was constructed to test the original hypothesis H0, as shown in Equation (5).
If at a confidence level of , then the null hypothesis H0 is accepted, that is, the assertion that intercepts and coefficients are all equal is accepted. In other words, it is considered that the effects of land use characteristics on URT ridership do not exhibit temporal heterogeneity, and therefore, the GLR model is employed to assess the impact of these characteristics on URT ridership. Otherwise, it is considered that land use characteristics have temporal heterogeneous effects on URT ridership, and it is necessary to explore the heterogeneity further. Consequently, when H0 is rejected, an additional homogeneous hypothesis test is performed to determine the appropriate TVC model to explore the heterogeneity. Let the null hypothesis be H1, and the alternative hypothesis be H2:
H2:
The intercepts across all periods are not equal.
In order to fulfill the requirements of the alternative hypothesis H2, given that the number of periods required for the TVC-R model exceeded the number of TOD communities needed to estimate the random effects and the maximum number of time points in this panel dataset was only 24, only the TVC-F model proved sufficient. Similarly, let and represent the unconstrained RSS after OLS regression of the TVC-P (representing H1) and the TVC-F model (representing H2), respectively. follows a distribution with degrees of freedom under the hypothesis H2. Therefore, follows a distribution with degrees of freedom. The F statistic was constructed to test the original hypothesis H1, as shown in Equation (5). If the F-statistic is beyond the bounds of the rejection area, then we accept H1, employing the TVC-P model to assess the time-varying impact. In other circumstances, the TVC-F model is harnessed to encapsulate this time-varying impact.
4. Results
4.1. Temporal Heterogeneity Test and Model Selection
According to the method above-mentioned for analyzing the temporal heterogeneity effects, we first calculated the RSS of the GLR model (representing the null hypothesis H0) and the TVC-P model (representing the alternative hypothesis H1) using the land use data and hourly URT boarding and alighting data on weekdays and non-weekdays. The F-statistic test was then constructed to verify temporal heterogeneity in the impact of the land use characteristics on the URT boarding and alighting trips. The results are shown in Table 2. Given the null hypothesis H0 and the alternative hypothesis H1, the F-statistic pertaining to URT boarding and alighting trips during weekdays and non-weekdays surmounted the corresponding critical value at the 0.01 significance level, thereby dismissing the null hypothesis H0 and suggesting a variance in the intercepts and coefficients across the model’s timespan. Hence, the influence of land usage on URT boarding and alighting trips, during both weekdays and non-weekdays, manifested temporal non-uniformities, necessitating the application of the TVC model to encapsulate this transient heterogeneity.
Table 2.
Results of the temporal heterogeneity test of land use on the URT boarding and alighting trips.
Following the validation of the presence of temporal heterogeneity, the RSS of the TVC-P model and the TVC-F model was computed, and a F-statistic test was constructed to scrutinize the aptness of the TVC-P and TVC-F models in accommodating this temporal heterogeneity. Presented in Table 2 and given the null hypothesis H1 and the alternative H2, the F-statistic corresponding to the URT boarding and alighting trips occurring both on weekdays and non-weekdays was inferior to the critical value of the F-statistic at the 0.01 significance level. Subsequently, we accepted H1, illustrating the TVC-P model’s feasibility in encapsulating the temporal heterogeneous effects of land use on URT ridership.
4.2. Impact Analysis of Temporal Heterogeneity
Employing OLS regression, we designed the TVC-P and GLR models to examine the influence of land use on the URT boarding and alighting trips. The standardized regression coefficients for variables during weekdays and non-weekdays are depicted in Figure 7 and Figure 8, respectively, with noteworthy coefficients highlighted in Table 3, Table 4, Table 5 and Table 6.
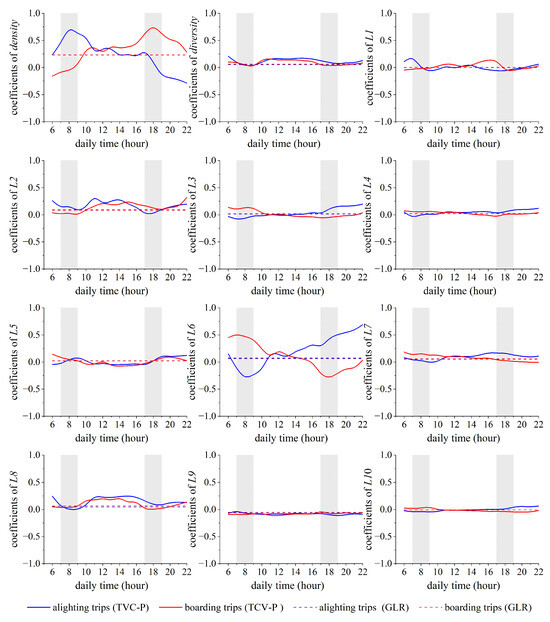
Figure 8.
Standardized coefficients for key variables on weekday trips.
Table 3.
Regression outcome of the GLR and TVC-P models pertaining to the weekday URT boarding trips.
Table 4.
Regression outcome of the GLR and TVC-P models pertaining to the weekday URT alighting trips.
Table 5.
Regression outcome of the GLR and TVC-P models pertaining to the non-weekday URT boarding trips.
Table 6.
Regression outcome of the GLR and TVC-P models pertaining to the non-weekday URT alighting trips.
Regarding the coefficient of determination (R2), the TVC-P model generally outperformed the GLR model due to the higher degrees of freedom and more sample information provided by the panel data. The land use features in the GLR model accounted for approximately 11% of the variance in weekday URT boarding and alighting trips, whereas the TVC-P model elucidated over 50% of this variance. On non-weekdays, the coefficients of determination (R2) for the daily URT boarding and alighting GLR models were approximately 0.16 and 0.18, respectively. The interpretive ability of land use features on the daily URT boarding and alighting trips on non-weekdays was higher than on weekdays. This result indirectly reflects that the land use exerts a slighter influence on commuting travel compared with non-commuting travel. The coefficient of determination (R2) of the TVC-P model on non-weekdays was around 0.25, half that of the workday, and slightly higher than that of the GLR model. Overall, compared with the GLR model, the TVC-P model further explained the temporal differences in the impact of land use features on URT boarding and alighting trips, providing a more microscopic basis for analyzing the aggregate data.
5. Discussion
The GLR model showed a significant and positive effect of land use density on the daily URT boarding and alighting trips on weekdays, while the effect was insignificant on non-weekdays. As presented in Figure 8 and Figure 9, the TVC-P model illustrated variations in the aforementioned impacts across different time intervals and revealed that land use density had a significant impact on the URT boarding trips only during the evening peak and the subsequent hour (17:00–20:00) and on URT alighting trips during the morning peak and some off-peak periods after the morning peak (7:00–11:00). Currently, employment hubs in Beijing are centralized in the inner city, whereas residential zones are primarily situated on the outskirts of this central area. During the morning peak period, commuters predominantly embark from the URT stations near their residential areas in those outer zones and alight at the URT stations in the city center for work. Conversely, during the evening peak period, they board near their offices in the central area and exit at stations on the outskirts to journey back home. The commuting characteristics determined by the spatial distribution of work and residence ultimately manifested in the temporal and spatial distribution differences of the travel features represented by the URT boarding and alighting trips. Combining the results of the TVC-P model, it can be inferred that the current high-density development mainly affects URT boarding and alighting trips through job allocation, attracting URT commuting users (i.e., URT alighting trips) during the morning peak period and generating URT commuting users (i.e., URT boarding trips) during the evening peak period.
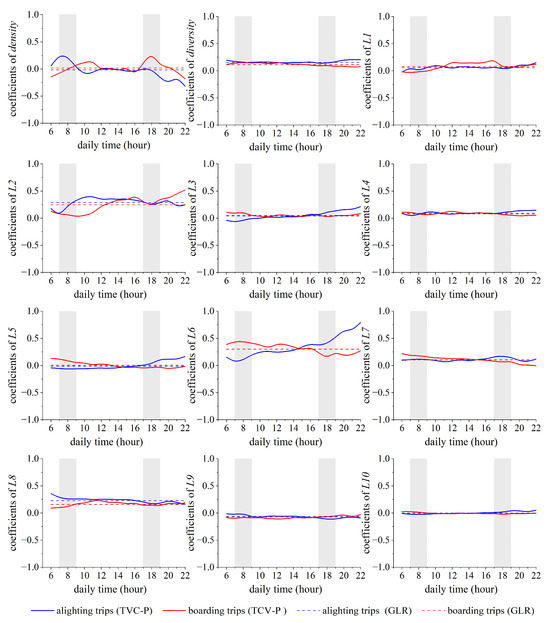
Figure 9.
Standardized coefficients for key variables on non-weekday trips.
The GLR model indicated that diversity significantly impacted the daily URT boarding and alighting trips, consistent with the current findings [15,22]. However, this study found that diversity had a greater impact on non-workday URT boarding and alighting trips than on workdays, contrary to previous research [17], due to the land use features and travel pattern differences between the two case cities. On weekdays, the dominant influence of density on ridership can be attributed to the concentrated commuting patterns and economic considerations. Dense areas typically correlate with high employment concentrations, generating substantial daily transit demands as residents travel to and from work. Additionally, the efficiency of public transit networks in dense regions further enhances their appeal to time-sensitive commuters. Conversely, on weekends, the impact of land use diversity becomes more pronounced due to the varied recreational activities and social interactions it facilitates. Diverse land uses attract a broader range of visitors to commercial, cultural, and recreational destinations, leading to increased transit usage. The flexibility of weekend schedules and the desire for exploration and social engagement further amplify the role of land use diversity in shaping transit ridership [35,43,44]. Moreover, the TVC-P model showed that the impact on weekday URT alighting trips mainly occurred during the morning and evening rush hours, while the impact on the weekday URT boarding trips was primarily concentrated during the morning peak hours and after 20:00, with a continuing impact on non-weekday URT boarding and alighting trips. Arguably, the most interesting thing is that on non-weekdays, diversity had a greater impact than density, as the TVC-P model revealed. This phenomenon may occur because diverse land use types attract/generate trips consistently, while a single type of land use attracts/generates trips during specific periods (e.g., residential land use generates trips during the morning peak hour). Additionally, areas with high diversity can provide employment opportunities, accommodate residents, and maintain activities such as commercial services, thereby ensuring a specific volume of commuting and non-commuting travel. It can be inferred that the current diversity mainly maintains a certain volume of commuting travel on weekdays and promotes URT boarding and alighting trips over a more extensive time range on non-weekdays by providing diverse activities.
Public management and service facilities markedly influenced the URT boarding and alighting trips during specific times on both workdays and non-workdays. In contrast, commercial and business facilities predominantly exhibited a notably positive influence during most intervals on non-workdays. Notably, the effect on URT alighting on non-working days predominantly occurred between the morning and afternoon (9:00–19:00), while the impact on URT boarding was mainly concentrated during the afternoon and evening (14:00–23:00). These results indicate that the attractiveness of commercial service facilities in the URT station’s catchment area lasts from 9:00 in the morning until 19:00, while activities in the URT station’s catchment area might typically first end at 14:00 and last until around 23:00 when people leave entirely.
Mixed-use land refers to land dominated by residential buildings compatible with public buildings and land dominated by public buildings compatible with residential buildings. Compared with diversity, mixed-use land, because it provides a large amount of residential land, can significantly impact the rail transit traffic volumes during weekday commuting periods, with a major influence on the URT boarding trips during the morning rush hours and URT alighting trips during the evening rush hours. The impact of green space and plaza land on URT ridership was mainly reflected in the non-working day URT boarding and alighting trips, reflecting the role of green space and plaza land as public spaces in stimulating non-commuting travel and greatly enhancing regional vitality.
Residential land is an essential trip-generating land type during the morning peak hours and a major trip-attracting land type on the evening rush hours. Therefore, the impact of residential land on URT ridership mainly manifests in the morning peak boarding trips and the evening peak alighting trips. Additionally, for weekday nights and non-working periods, due to the need for non-commuting activities, residential land is both a major traffic generator and attractor, resulting in a significant positive impact on the URT boarding and alighting trips during these periods. It is worth noting that the impact of residential land on URT ridership remained high after the evening peak, even more substantial, indicating that the closer to the end of the URT service, the larger the proportion of trips intended to be homebound is likely to grow.
Internal and external transportation facilities significantly and positively impacted the URT boarding and alighting trips on both working days and non-weekdays, especially on non-weekdays. On weekdays, the pronounced effects of internal transport facilities on URT boarding during the morning rush and alighting during the evening rush underscore the synergistic interaction between rail transit and various other transportation modes. External transportation facilities significantly impact URT alighting trips on weekdays but not URT boarding trips, reflecting that their connection with urban rail transit mainly manifests in rail transit, transporting passengers to external transportation infrastructure such as airports and high-speed rail stations. For non-weekdays, both internal and external transportation facilities significantly positively impacted the URT boarding and alighting trips during most periods, representing efficient connections between the city’s internal and external transportation systems and the vital role of URT systems in serving tourists traveling outside Beijing.
Based on the analysis above, it is clear that contemporary high-density development predominantly influences the URT boarding and alighting trips by distributing employment opportunities, thereby attracting commuters to URT during the morning peak and producing URT trips during the evening peak. Therefore, we conclude that for peripheral communities with low density and a predominant residential focus, the current focus of TOD development in Beijing can revolve around allocating jobs around peripheral URT stations. On the one hand, this can alleviate the ground/underground transportation conditions in the central urban area by coordinating the distribution of jobs and residences. On the other hand, it can increase URT ridership at terminal stations through high-density development in the catchment areas of peripheral stations, achieving flow equilibrium at the network level. Regarding diversity, the overall level of diversity within the current catchment area in Beijing is already high, and increasing the land use diversity has a limited effect on stimulating URT ridership. However, considering the differences in impacts between weekdays and non-weekdays, enhancing diversity in non-residential land use, such as green space and plaza land, should be emphasized to further increase the URT ridership for non-commuting travel.
As the essential land use type generates a travel demand, increasing the proportion of residential land will inevitably increase the URT ridership. Therefore, the critical issue lies in where to increase the proportion of residential land. In the current context of the suburbanization of residential land, providing affordable housing in job-dense central areas plays a vital role in increasing the volume of inbound passengers in the morning rush hours and outbound passengers in the evening rush hours in the central urban area, coordinating the spatial distribution of travel demand at the network level, and alleviating traffic problems caused by the separation of work and residence. Additionally, as the proportion of trips for returning home increases after the evening peak, it is necessary to maintain a certain capacity for regular night buses and taxis operating at night after URT systems stop operating to meet the travel demand and ensure travel safety.
As the primary mode of travel in the chain, URT requires appropriate connectivity facilities within its catchment area to promote sustainable urban transportation by transferring private motorized trips into green travel. Efficient connectivity between external transportation facilities and URT systems is significant for tourist cities. Moreover, since there is a certain proportion of tourist trips in Beijing’s URT system at any time, effectively identifying and guiding this type of trip and coordinating their spatial and temporal distribution with commuting trips can alleviate the current situation of insufficient URT capacity and crowded carriage environments during peak periods to a certain extent.
6. Conclusions
TOD is recognized as a potent strategy for urban sustainability planning that merges city development with public transit systems. Along with the popularity of URT systems and TOD practices, a growing body of literature examining the impact of land use around the URT stations’ catchment area is attempting to stimulate sustainable urban development. This paper explored the time-variant diverse impacts of land use on URT ridership, delivering insightful observations on the connection between land use and URT ridership. We found the following: (1) The influence of land use on URT boarding and alighting during weekdays and non-weekdays demonstrated temporal variability, indicating that the correlation between land use and URT ridership significantly fluctuates over time; (2) Land use density mainly affects URT ridership in particular periods through job allocation. In more detail, the density of land use draws URT commuter trips in the morning rush hours and generates URT commuting trips in the evening rush hours; (3) Land use diversity mainly maintains a certain volume of weekday commuting trips and promotes URT boarding and alighting trips over a more extensive time range on non-weekdays by providing diverse activities; (4) Nevertheless, we also identified the temporal heterogeneous effects of certain types of land use on URT ridership. For instance, increasing the proportion of residential land use will inevitably result in greater URT ridership, and it may be best to increase this proportion in job-dense central areas. However, it is important to note that these findings may be specific to Beijing, given its unique transportation infrastructure and urban planning characteristics. Other cities with different infrastructure and planning practices may exhibit distinct relationships between land use and URT ridership.
This research also presented certain constraints. First, due to the data availability, our focus on Beijing may limit its applicability to other cities with different URT ridership and urban planning characteristics. Researchers in other regions or future studies can utilize the proposed methodological framework to analyze local data, thereby comparing the similarities and differences in URT passenger behaviors across various cities. Second, the URT ridership data gathered from 7 June to 13 June 2021 might not have accurately depicted the typical daily URT ridership characteristics due to COVID-19, which may have significantly affected commuting behavior including mobility restrictions and changes in commuting patterns. Future research should compare pre- and post-COVID-19 data to better understand the impact of the pandemic on URT ridership. Third, we also acknowledge that many factors influence URT ridership except for land use such as built-environment features (walkability, public space design, accessibility, digital technologies, etc.), socioeconomic, and behavioral factors (ticket prices, income levels, travel preferences, etc.). Awareness of the limitations above-mentioned is important when concluding. We hope that future studies will extend the research with new materials, technological tools (such as machine learning), a comprehensive consideration of the factors affecting URT ridership, and conduct more research in different case regions with various social and cultural backgrounds, providing valuable information for understanding the relations between land use and URT ridership through meta-analysis.
Author Contributions
Conceptualization, S.L., J.R. and C.Z.; Methodology, S.L. and C.Z.; Validation, S.L. and J.R.; Formal analysis, S.L.; Investigation, Y.G.; Data curation, J.R.; Writing—original draft, S.L.; Writing—review & editing, C.Z. and L.X.; Visualization, S.L. and Y.G.; Supervision, J.R. and L.X.; Funding acquisition, S.L. All authors have read and agreed to the published version of the manuscript.
Funding
The project was supported by the National Natural Science Foundation of China (52402380) and the Open Fund of the Key Laboratory of Highway Engineering of Ministry of Education (Changsha University of Science & Technology) (kfj230303).
Data Availability Statement
The datasets presented in this article are not readily available because policy restriction (land use data is politically sensitive). Requests to access the datasets should be directed to related government departments.
Conflicts of Interest
The authors declare no conflict of interest.
References
- Jamme, H.-T.; Rodriguez, J.; Bahl, D.; Banerjee, T. A Twenty-Five-Year Biography of the TOD Concept: From Design to Policy, Planning, and Implementation. J. Plan. Educ. Res. 2019, 39, 409–428. [Google Scholar] [CrossRef]
- Calthorpe, P. The Next American Metropolis: Ecology, Community, and the American Dream; Princeton Architectural Press: New York, NY, USA, 1993. [Google Scholar]
- Baoming, H.; Yiran, Y.; Zhe, X.; Yajie, S.; Fang, L.; Siwei, L.; Zhuoyi, L.; Siqi, H.; Jiangfeng, H.; Yanling, S. Statistical Analysis of Urban Rail Transit Operations Worldwide in 2023: A Review. Urban Rapid Rail Transit 2024, 37, 1–9. [Google Scholar] [CrossRef]
- 2023 National Passenger Volume in Urban Transportation. Available online: https://xxgk.mot.gov.cn/2020/jigou/zhghs/202404/t20240416_4128383.html (accessed on 16 April 2024).
- Liu, S.; Rong, J.; Zhou, C.; Bian, Y. Probability -Based Typology for Description of Built Environments around Urban Rail Stations. Build. Environ. 2021, 205, 108193. [Google Scholar] [CrossRef]
- Peng, B.; Zhang, Y.; Li, C.; Wang, T.; Yuan, S. Nonlinear, Threshold and Synergistic Effects of First/Last-Mile Facilities on Metro Ridership. Transp. Res. Part D Transp. Environ. 2023, 121, 103856. [Google Scholar] [CrossRef]
- Zhu, H.; Peng, J.; Dai, Q.; Yang, H. Exploring the Long-Term Threshold Effects of Density and Diversity on Metro Ridership. Transp. Res. Part D Transp. Environ. 2024, 128, 104101. [Google Scholar] [CrossRef]
- Pan, H.; Li, J.; Shen, Q.; Shi, C. What Determines Rail Transit Passenger Volume? Implications for Transit Oriented Development Planning. Transp. Res. Part D Transp. Environ. 2017, 57, 52–63. [Google Scholar] [CrossRef]
- Ding, C.; Cao, X.; Liu, C. How Does the Station-Area Built Environment Influence Metrorail Ridership? Using Gradient Boosting Decision Trees to Identify Non-Linear Thresholds. J. Transp. Geogr. 2019, 77, 70–78. [Google Scholar] [CrossRef]
- Kuai, X.; Wang, F. Global and Localized Neighborhood Effects on Public Transit Ridership in Baton Rouge, Louisiana. Appl. Geogr. 2020, 124, 102338. [Google Scholar] [CrossRef]
- Cardozo, O.D.; García-Palomares, J.C.; Gutiérrez, J. Application of Geographically Weighted Regression to the Direct Forecasting of Transit Ridership at Station-Level. Appl. Geogr. 2012, 34, 548–558. [Google Scholar] [CrossRef]
- Liu, S.; Zhang, X.; Zhou, C.; Rong, J.; Bian, Y. Temporal Heterogeneous Effects of Land-Use on Dockless Bike-Sharing Usage under Transit-Oriented Development Context: The Case of Beijing. J. Clean. Prod. 2022, 380, 134917. [Google Scholar] [CrossRef]
- Li, S.; Lyu, D.; Huang, G.; Zhang, X.; Gao, F.; Chen, Y.; Liu, X. Spatially Varying Impacts of Built Environment Factors on Rail Transit Ridership at Station Level: A Case Study in Guangzhou, China. J. Transp. Geogr. 2020, 82, 102631. [Google Scholar] [CrossRef]
- Hsiao, C. Analysis of Panel Data, 4th ed.; Cambridge University Press: Cambridge, UK, 2022; Volume 82, ISBN 9781009057745. [Google Scholar]
- Gan, Z.; Yang, M.; Feng, T.; Timmermans, H.J.P. Examining the Relationship between Built Environment and Metro Ridership at Station-to-Station Level. Transp. Res. Part D Transp. Environ. 2020, 82, 102332. [Google Scholar] [CrossRef]
- Sung, H.; Oh, J.T. Transit-Oriented Development in a High-Density City: Identifying Its Association with Transit Ridership in Seoul, Korea. Cities 2011, 28, 70–82. [Google Scholar] [CrossRef]
- Li, S.; Lyu, D.; Liu, X.; Tan, Z.; Gao, F.; Huang, G.; Wu, Z. The Varying Patterns of Rail Transit Ridership and Their Relationships with Fine-Scale Built Environment Factors: Big Data Analytics from Guangzhou. Cities 2020, 99, 102580. [Google Scholar] [CrossRef]
- Cervero, R.; Kockelman, K. Travel Demand and the 3Ds: Density, Diversity, and Design. Transp. Res. Part D Transp. Environ. 1997, 2, 199–219. [Google Scholar] [CrossRef]
- Ewing, R.; Cervero, R. Travel and the Built Environment. J. Am. Plan. Assoc. 2010, 76, 265–294. [Google Scholar] [CrossRef]
- Higgins, C.D.; Kanaroglou, P.S. A Latent Class Method for Classifying and Evaluating the Performance of Station Area Transit-Oriented Development in the Toronto Region. J. Transp. Geogr. 2016, 52, 61–72. [Google Scholar] [CrossRef]
- Shao, Q.; Zhang, W.; Cao, X.; Yang, J.; Yin, J. Threshold and Moderating Effects of Land Use on Metro Ridership in Shenzhen: Implications for TOD Planning. J. Transp. Geogr. 2020, 89, 102878. [Google Scholar] [CrossRef]
- Jun, M.J.; Choi, K.; Jeong, J.E.; Kwon, K.H.; Kim, H.J. Land Use Characteristics of Subway Catchment Areas and Their Influence on Subway Ridership in Seoul. J. Transp. Geogr. 2015, 48, 30–40. [Google Scholar] [CrossRef]
- An, D.; Tong, X.; Liu, K.; Chan, E.H.W. Understanding the Impact of Built Environment on Metro Ridership Using Open Source in Shanghai. Cities 2019, 93, 177–187. [Google Scholar] [CrossRef]
- Rodríguez, D.A.; Kang, C.-D. A Typology of the Built Environment around Rail Stops in the Global Transit-Oriented City of Seoul, Korea. Cities 2020, 100, 102663. [Google Scholar] [CrossRef]
- Monajem, S.; Nosratian, F.E. The Evaluation of the Spatial Integration of Station Areas via the Node Place Model; an Application to Subway Station Areas in Tehran. Transp. Res. Part D Transp. Environ. 2015, 40, 14–27. [Google Scholar] [CrossRef]
- Li, Z.; Han, Z.; Xin, J.; Luo, X.; Su, S.; Weng, M. Transit Oriented Development among Metro Station Areas in Shanghai, China: Variations, Typology, Optimization and Implications for Land Use Planning. Land Use Policy 2019, 82, 269–282. [Google Scholar] [CrossRef]
- Nigro, A.; Bertolini, L.; Moccia, F.D. Land Use and Public Transport Integration in Small Cities and Towns: Assessment Methodology and Application. J. Transp. Geogr. 2019, 74, 110–124. [Google Scholar] [CrossRef]
- Kumar, P.P.; Sekhar, C.R.; Parida, M. Identification of Neighborhood Typology for Potential Transit-Oriented Development. Transp. Res. Part D Transp. Environ. 2020, 78, 102186. [Google Scholar] [CrossRef]
- Guzman, L.A.; Cardona, S.G. Density-Oriented Public Transport Corridors: Decoding Their Influence on BRT Ridership at Station-Level and Time-Slot in Bogotá. Cities 2021, 110, 103071. [Google Scholar] [CrossRef]
- Zhao, J.; Deng, W.; Song, Y.; Zhu, Y. What Influences Metro Station Ridership in China? Insights from Nanjing. Cities 2013, 35, 114–124. [Google Scholar] [CrossRef]
- Ma, J.; Zhao, Y. Study on the Adaptability of the Level of Urban Transportation Infrastructure and Economic Development. Appl. Mech. Mater. 2013, 361–363, 1950–1953. [Google Scholar] [CrossRef]
- Durning, M.; Townsend, C. Direct Ridership Model of Rail Rapid Transit Systems in Canada. Transp. Res. Rec. 2015, 2537, 96–102. [Google Scholar] [CrossRef]
- Aston, L.; Currie, G.; Kamruzzaman, M.; Delbosc, A.; Teller, D. Study Design Impacts on Built Environment and Transit Use Research. J. Transp. Geogr. 2020, 82, 102625. [Google Scholar] [CrossRef]
- Lee, S.; An, Y.; Kim, K. Relationship between Transit Modal Split and Intra-City Trip Ratio by Car for Compact City Planning of Municipalities in the Seoul Metropolitan Area. Cities 2017, 70, 11–21. [Google Scholar] [CrossRef]
- Li, M.; Kwan, M.-P.; Hu, W.; Li, R.; Wang, J. Examining the Effects of Station-Level Factors on Metro Ridership Using Multiscale Geographically Weighted Regression. J. Transp. Geogr. 2023, 113, 103720. [Google Scholar] [CrossRef]
- Chen, E.; Ye, Z.; Wang, C.; Zhang, W. Discovering the Spatio-Temporal Impacts of Built Environment on Metro Ridership Using Smart Card Data. Cities 2019, 95, 102359. [Google Scholar] [CrossRef]
- Yang, L.; Yu, B.; Liang, Y.; Lu, Y.; Li, W. Time-Varying and Non-Linear Associations between Metro Ridership and the Built Environment. Tunn. Undergr. Space Technol. 2023, 132, 104931. [Google Scholar] [CrossRef]
- Beijing 2023 National Economic and Social Development Statistical Bulletin. Available online: https://tjj.beijing.gov.cn/tjsj_31433/tjgb_31445/ndgb_31446/202403/t20240321_3595860.html (accessed on 12 March 2024).
- Liu, S.; Zhou, C.; Rong, J.; Bian, Y.; Wang, Y. Concordance between Regional Functions and Mobility Features Using Bike-Sharing and Land-Use Data near Metro Stations. Sustain. Cities Soc. 2022, 84, 104010. [Google Scholar] [CrossRef]
- Ibraeva, A.; Correia, G.H.d.A.; Silva, C.; Antunes, A.P. Transit-Oriented Development: A Review of Research Achievements and Challenges. Transp. Res. Part A Policy Pract. 2020, 132, 110–130. [Google Scholar] [CrossRef]
- Kim, D.; Seo, D.; Cho, S.; Kang, P. Multi-Co-Training for Document Classification Using Various Document Representations: TF–IDF, LDA, and Doc2Vec. Inf. Sci. 2019, 477, 15–29. [Google Scholar] [CrossRef]
- Song, Y.; Merlin, L.; Rodriguez, D. Comparing Measures of Urban Land Use Mix. Comput. Environ. Urban Syst. 2013, 42, 1–13. [Google Scholar] [CrossRef]
- Yang, H.; Zhang, Q.; Wen, J.; Sun, X.; Yang, L. Multi-group exploration of the built environment and metro ridership: Comparison of commuters, seniors and students. Transp. Policy 2024, 155, 189–207. [Google Scholar] [CrossRef]
- Pan, M.; Liao, Z.; Wang, Z.; Ren, C.; Xing, Z.; Li, W. Tourism forecasting: A dynamic spatiotemporal model. Ann. Tour.Res. 2025, 110, 103871. [Google Scholar] [CrossRef]
Disclaimer/Publisher’s Note: The statements, opinions and data contained in all publications are solely those of the individual author(s) and contributor(s) and not of MDPI and/or the editor(s). MDPI and/or the editor(s) disclaim responsibility for any injury to people or property resulting from any ideas, methods, instructions or products referred to in the content. |
© 2025 by the authors. Licensee MDPI, Basel, Switzerland. This article is an open access article distributed under the terms and conditions of the Creative Commons Attribution (CC BY) license (https://creativecommons.org/licenses/by/4.0/).