Article

Optimization of Land Use Patterns in a Typical Coal Resource-Based City Based on the Ecosystem Service Relationships of ‘Food–Carbon–Recreation’

by
Wei-Ling Hsu
1,
Zhicheng Zhuang
2,*,
Cheng Li
3 and
Jie Zhao
4
1
School of Civil Engineering, Jiaying University, Meizhou 514015, China
2
Department of Urban Planning, College of Architecture and Urban Planning, Tongji University, Shanghai 200433, China
3
School of Architecture and Design, China University of Mining and Technology, Xuzhou 221000, China
4
School of Geography, Geomatics and Planning, Jiangsu Normal University, Xuzhou 221000, China
*
Author to whom correspondence should be addressed.
Land 2025, 14(3), 661; https://doi.org/10.3390/land14030661
Submission received: 7 January 2025 / Revised: 16 March 2025 / Accepted: 18 March 2025 / Published: 20 March 2025

Abstract

:
Imbalanced supplies and demands of ecosystem services (ESSD) can negatively affect human well-being. Optimizing land use patterns in cities and regions is, in fact, essential to mitigate this challenge and ensure sustainable development. In this context, the present study aims to analyze the supply and demand of food production services (FPs), carbon sequestration services (CSs), and recreation services (RSs) in a typical coal resource-based city (Huainan) in China. In addition, the main influencing factors and their driving mechanisms were further explored using the geographical detector (Geo-Detector) and multi-scale geographic weighted regression (MGWR) models. Future land use changes were also predicted under traditional and constrained development scenarios using the GeoSOS-FLUS model. The obtained results indicated that: (1) the comprehensive ecosystem service (ES) supply index decreased from 1.42 to 0.84, while the comprehensive demand index increased from 0.74 to 0.95 during the 2010–2020 period; (2) the urban and rural areas had spatial disparities; (3) changes in the construction, ecological, and cultivated land strongly impacted ES; (4) implementing constrained development scenarios can effectively protect the ecological land, control urban expansion, and improve the ESSD relationships in Huainan City. This study provides a valuable theoretical foundation and a methodological framework for future urban and land use optimization efforts, as well as for enhancing the sustainability of ecosystem services and mitigating the imbalance between the supplies and demands of ecosystem services.

1. Introduction

There has been continuous overexploitation and utilization of natural resources through rapid industrialization, urbanization, and socio-economic development. However, the imbalance between natural resource supplies and human demands has resulted in the deterioration of the environment, posing serious threats to the sustainability of socioeconomic and human health [1,2,3]. Indeed, researchers have devoted great attention to the relationships between supplies and demands in ecosystem services (ESSD) and effective ecosystem management in recent years.
Early research on ESSD relationships has focused mainly on conceptual definitions. Wackernagel proposed the ecological carrying capacity concept, defining the maximum level of resource provision that ecosystems can sustainably maintain [4]. Burkhard (2012) suggests the need to consider humans’ actual capacity in ecosystem service (ES) demands [5], while other researchers have defined ES demands based on societal and individual preferences [6,7]. In addition to conceptual delineation, various scholars have employed different methods to quantitatively assess ESSD. Burkhard (2012) [5] proposed the supply and demand matrix method to quantitatively assess ESSD based on land use types and expert ratings. However, although this semi-quantitative and semi-qualitative method is convenient and widely applicable, it is subject to significant subjectivity, making its accuracy influenceable by the expertise of assessors [5]. Costanza (1997) utilized economic value estimation methods to assess the global ESs [8]. Villamagna (2013) assessed ES demands using the willingness to pay (WTP) method [6]. This method is, in fact, based on extensive economic and social data, mitigating the effects of subjectivity on calculation results to some extent. However, it remains challenging to comprehensively assess ESSD based on economic value due to the complexity of ESs. Furthermore, some researchers have employed various models to evaluate ESSD, such as InVEST [9], ARIES [10], RUSLE [11], and FRESF [12]. In recent years, numerous quantitative studies have explored the influencing factors of ESSD, as well as their relationships and spatial heterogeneity, to propose scientific strategies for effective ecological management and planning [13]. Other, related studies have focused on ESSD on both large scales, including watersheds [14] and urban agglomerations [15], and small scales (cities) [16,17,18]. However, previous related studies have paid insufficient attention to coal resource-based cities, where the relationships between ecological environments and social demands are particularly complex.
Coal resource-based cities are often densely populated, with abundant coal deposits and frequent environmental issues, resulting in obvious changes in their ecological and socio-economic features through their development [19]. Intensive coal-mining activities have resulted in the expansion of land subsidence areas, leading to severe damage to farmland, residential areas, and infrastructure [20]. The construction of mining areas and the relocation of villages have expanded construction land, leading to drastic changes in regional land use patterns [21]. Furthermore, coal mining operations can generate great amounts of coal gangue on cultivated and ecological land, resulting in reduced crop yields and disturbed ecological landscapes [22]. Due to the combined negative effects of coal mining activities and urbanization, coal resource-based cities have been facing distinct and different ecological challenges compared to other urban areas. Therefore, it is crucial to explore the ESSD relationships in these cities and identify key influencing factors to provide guidance for ecosystem management. As one of China’s 14 major coal-producing bases, Huainan City possesses abundant coal reserves that have long driven regional economic growth. However, prolonged extensive mining has resulted in a series of environmental challenges, including land degradation and ecosystem disruption. The rapid urbanization process has additionally intensified environmental resource deprivation effects. Moreover, Huainan City has mining areas at different stages, such as closed and active mining zones, making it a representative case study for coal resource-based cities.
In this context, the present study aims to quantitatively assess ecosystem services (ESs) in a representative coal resource-based city (Huainan City), including food production services (FPs), carbon sequestration services (CSs), and recreational services (RSs), as well as their supply–demand relationships, taking into account the specific urban characteristics, ecological environment, government priorities, and residents’ welfare needs. In addition, the key factors and the mechanisms underlying their impacts on changes in FP, CS, and RS relationships were further identified and explained in this study. The changes in the land use types of the study area were also explored using the GeoSOS-FLUS (V. 2.4.0) under various scenarios to provide a useful reference for ensuring effective management and regulation of ESs.

2. Materials and Methods

2.1. Study Area

Huainan City is situated in the north-central part of Anhui Province (116°21′5″ E–117°12′30″ E; 31°54′8″ N–33°00′26″ N), covering both banks of the Huai River (Figure 1). In 2020, the urban population of Huainan City was 1.85 million, accounting for 61.08% of the total population, while the rural population was 1.18 million, accounting for 38.92%. The terrain of Huainan City is flat, with distinct seasons and abundant rainfall, making it an important production base for rice and wheat. In terms of mineral resources, as an important coal-fired power and coal chemical base in East China and Anhui Province, its coal consumption accounts for 22% of the province’s total, and its carbon emission intensity is 2.4 times the provincial average, with carbon dioxide emissions from electricity generation accounting for 79.1%. Due to intensive coal mining activities, the region has experienced large-scale land subsidence, vegetation destruction, housing damage, and loss of arable land. Furthermore, the extensive land development pattern in Huainan City induced damage to the local ecosystem, explaining the selection of Huainan City as a case study for this research. The administrative divisions of Huainan City include Tianjia’an, Datong, Xiejiaji, Bagongshan, Panji, Fengtai, and Shouxian. It is worth noting that Shouxian was not considered in this study as there was a lack of coal mining activities, as part of the 2016 administrative jurisdiction.

2.2. Data Sources

As shown in Table 1, the Normalized Difference Vegetation Index (NDVI) is an indicator of vegetation growth. It is calculated based on the difference in reflectance of red (Red) and near-infrared (Near-Infrared, NIR) light by plants. The value of NDVI typically ranges from −1 to 1. Through this index, it is possible to distinguish between vegetation and non-vegetation areas as well as the growth condition. In this study, the maximum NDVI value dataset of China over the 2000–2020 period, with a 30 m spatial resolution, was supplied by the National Ecosystem Science Data Center (http://www.nesdc.org.cn/, accessed on 2 August 2024) to determine the FP supplies. The land use data of the study area were extracted from the China Multi-Temporal Land Use Remote Sensing Monitoring Dataset provided by the Resource and Environmental Science Data Platform (http://www.resdc.cn/DOI, accessed on 3 August 2024). In this study, further corrections were performed using remote-sensing images to enhance the accuracy of the collected data. Land use data were employed to calculate the CSs and RSs of the study area. The nighttime light data were obtained from the China Annual Nighttime Lights Dataset, provided by the Resource and Environmental Science Data Platform (http://www.resdc.cn/DOI, accessed on 3 August 2024), to determine CS demands. Digital Elevation Model (DEM) elevation data were sourced from the 30 m resolution ASTER GDEM provided by the Geospatial Data Cloud (http://www.gscloud.cn/, accessed on 6 August 2024). The DEM data were first preprocessed using different techniques, including the mosaic creation tool, projection transformation, and mask-based extraction before generating the DEM map of Huainan City. These data were used to extract the slope and aspect features of the study area. The economic and social data of Huainan City were collected from the “China County Statistical Yearbook” and the “Huainan Statistical Yearbook” provided by the China National Knowledge Infrastructure (https://data.cnki.net/, accessed on 11 July 2024). Additionally, the “Bulletin of National Economic and Social Development Statistics” of the municipality, district, and county, as well as the “Sixth National Population Census Bulletin” and “Seventh National Population Census Bulletin”, were provided by the Huainan Government (https://www.huainan.gov.cn/, accessed on 11 July 2024).

2.3. Methods

(1)
Quantification of FP supply and demand
Belmahi (2023) [23] revealed a significant linear relationship between FP and the NDVI. The NDVI has also been widely applied in studies focused on rice and wheat yield estimation [24,25,26]. Therefore, the ratio total for FP-to-NDVI ratios was calculated in this study to characterize the FP supply capacity of each cultivated land grid (Equation (1)). Given that rice and wheat planting areas account for 93.22% of cultivated land in Huainan City, this study primarily considers these two crops as the main FP sources in the region. Based on the planting patterns for rice and wheat, NDVI data from April and September were selected for analysis. Using the Extract by Mask function in ArcGIS 10.5, we extracted NDVI values for cultivated land and used a raster calculator to determine the maximum NDVI values between the two months, thereby characterizing the FP capacity of cultivated land.
Food _ supply = NDV I i NDV I sum   ×   Food _ supply   sum  
Food _ supply represents the allocated FP of the grid i ;   Food _ supply   sum   represents the total FP of the study area; NDV I i denotes the NDVI of the grid i ; and NDV I sum denotes the sum of the NDVI values over the cultivated land grids.
The FP demand was estimated in this study by multiplying the per capita grain demand by the total population. The per capita grain demand was determined based on the grain demand standard published by the National Bureau of Statistics of Anhui Province according to the following formula (Equation (2)):
Food _ demand =   Food _ consumption   p × ρ pop  
  Food demand represents the grain demand;   Food _ consumption   p represents the per capita grain demand; and ρ pop   represents the total population in the study area.
(2)
Quantification of the CS supply and demand
In this study, the InVEST software model (V. 3.9.0) [27] was employed to evaluate the CS supply in Huainan City. InVEST, a tool designed to explore how changes in ecosystems may lead to changes in the benefits flowing to people, typically employs a production function approach to quantify and assess ES [28,29]. The model calculates carbon stocks by considering four primary carbon pools, namely, aboveground biomass (Cabove), belowground biomass (Cbelow), soil (Csoil), and dead (Cdead) organic matter. The calculation formula was obtained from carbon sequestration studies, in areas surrounding Huainan City [30], as follows (Equation (3)) [31]:
C tot   = C above   + C below   + C soil   + C dead  
Numerous studies have demonstrated that nighttime light data can reflect the intensity of human activities and exhibit a significant linear relationship with regional carbon emissions [32,33,34]. Therefore, this study allocated carbon emission data based on the ratio of the nighttime light index for each grid to the total nighttime light index. The calculation formula is as follows (Equation (4)):
C demand = NL i NL sum ×   C emission
C demand denotes the CS demand; NL i denotes the nighttime light index of the grid i ; NL sum denotes the total nighttime light index; and C emission   denotes the total carbon emissions.
(3)
Quantification of the RS supply and demand
Recreational services (RSs) are closely related to human subjective cognition. In this study, a matrix was established to quantitatively assess the RS supply and demand [5]. Specifically, six experts with extensive knowledge of natural and social environments in Huainan City were invited to evaluate the RS supply and demand under five land use types (Table 2).
The rating values indicate the levels of the RS supply and demand. Rating values of 0, 1, 2, 3, 4, and 5 indicate no, low, relevant, medium-relevant, highly relevant, and very highly relevant capacities, respectively [5]. A higher score implies a higher level of supply or demand [35].
(4)
Supply–Demand Index of the ESs
The matching degrees of the ESSD were calculated using the Supply–Demand Index (SDI) according to the following formula (Equation (5)):
SDI = ES s ES D ES D
The SDI denotes the matching degree of the ESSD; ES s   denotes the supply of the ESs; and E S D   denotes the demand of the ESs. SDI > 0 , SDI = 0 , and SDI < 0 indicate surplus, balanced, and deficit statuses, where the supply is greater than, equal to, and less than the demand, respectively.
(5)
Influencing factors analysis
In this study, the factor detection module of the Geo-Detector was used to identify the main factors influencing the ESSD, including both natural and socio-economic factors.
q = 1 1 N 0 2 i = 1 m n 0 i 2
where q denotes the explanatory power of the factors on the SDI, ranging from 0 to 1. The highest q value indicates stronger explanatory power of the factors [36].   N 0 denotes the total number of samples; n denotes the number of samples for each subcategory or region. i = 1 m n 0 i 2 denotes the sum of the squares of the sample sizes for all subcategories which were first obtained. This sum is then normalized by dividing it by N 0 2 . Finally, subtracting this ratio from 1 yields q.
Although the Geo-Detector can be used to explore influencing factors, it cannot effectively explore spatial heterogeneity and reveal the main mechanisms underlying the effects of influencing factors [37]. Therefore, multi-scale geographic weighted regression (MGWR) was used to explore the relationships between dependent and explanatory variables, taking into account spatial heterogeneity according to the following Equation (7) [38]:
y i = j = 1 n   a j x ij + j = n + 1 m   β j x i , y i x ij + ε i
The bandwidth search method, model type, and bandwidth selection optimization method considered in this study are the golden section search, Gaussian, and the Akaike information criterion (AIC), respectively.
(6)
Prediction of future land use types
Predicting future land use types is essential for developing effective land management and development strategies, thereby ensuring rational utilization of resources. This is crucial for promoting sustainable development and improving the ecological environment. The GeoSOS-FLUS model combines the advantages of System Dynamics (SD) and Cellular Automata (CA) models, incorporating the Artificial Neural Networks (ANNs) algorithm and a roulette selection mechanism [39]. This comprehensive approach was considered to predict land use changes with high precision, taking into account multiple influencing factors of land use dynamics, such as natural, social, and economic factors [40].

3. Results

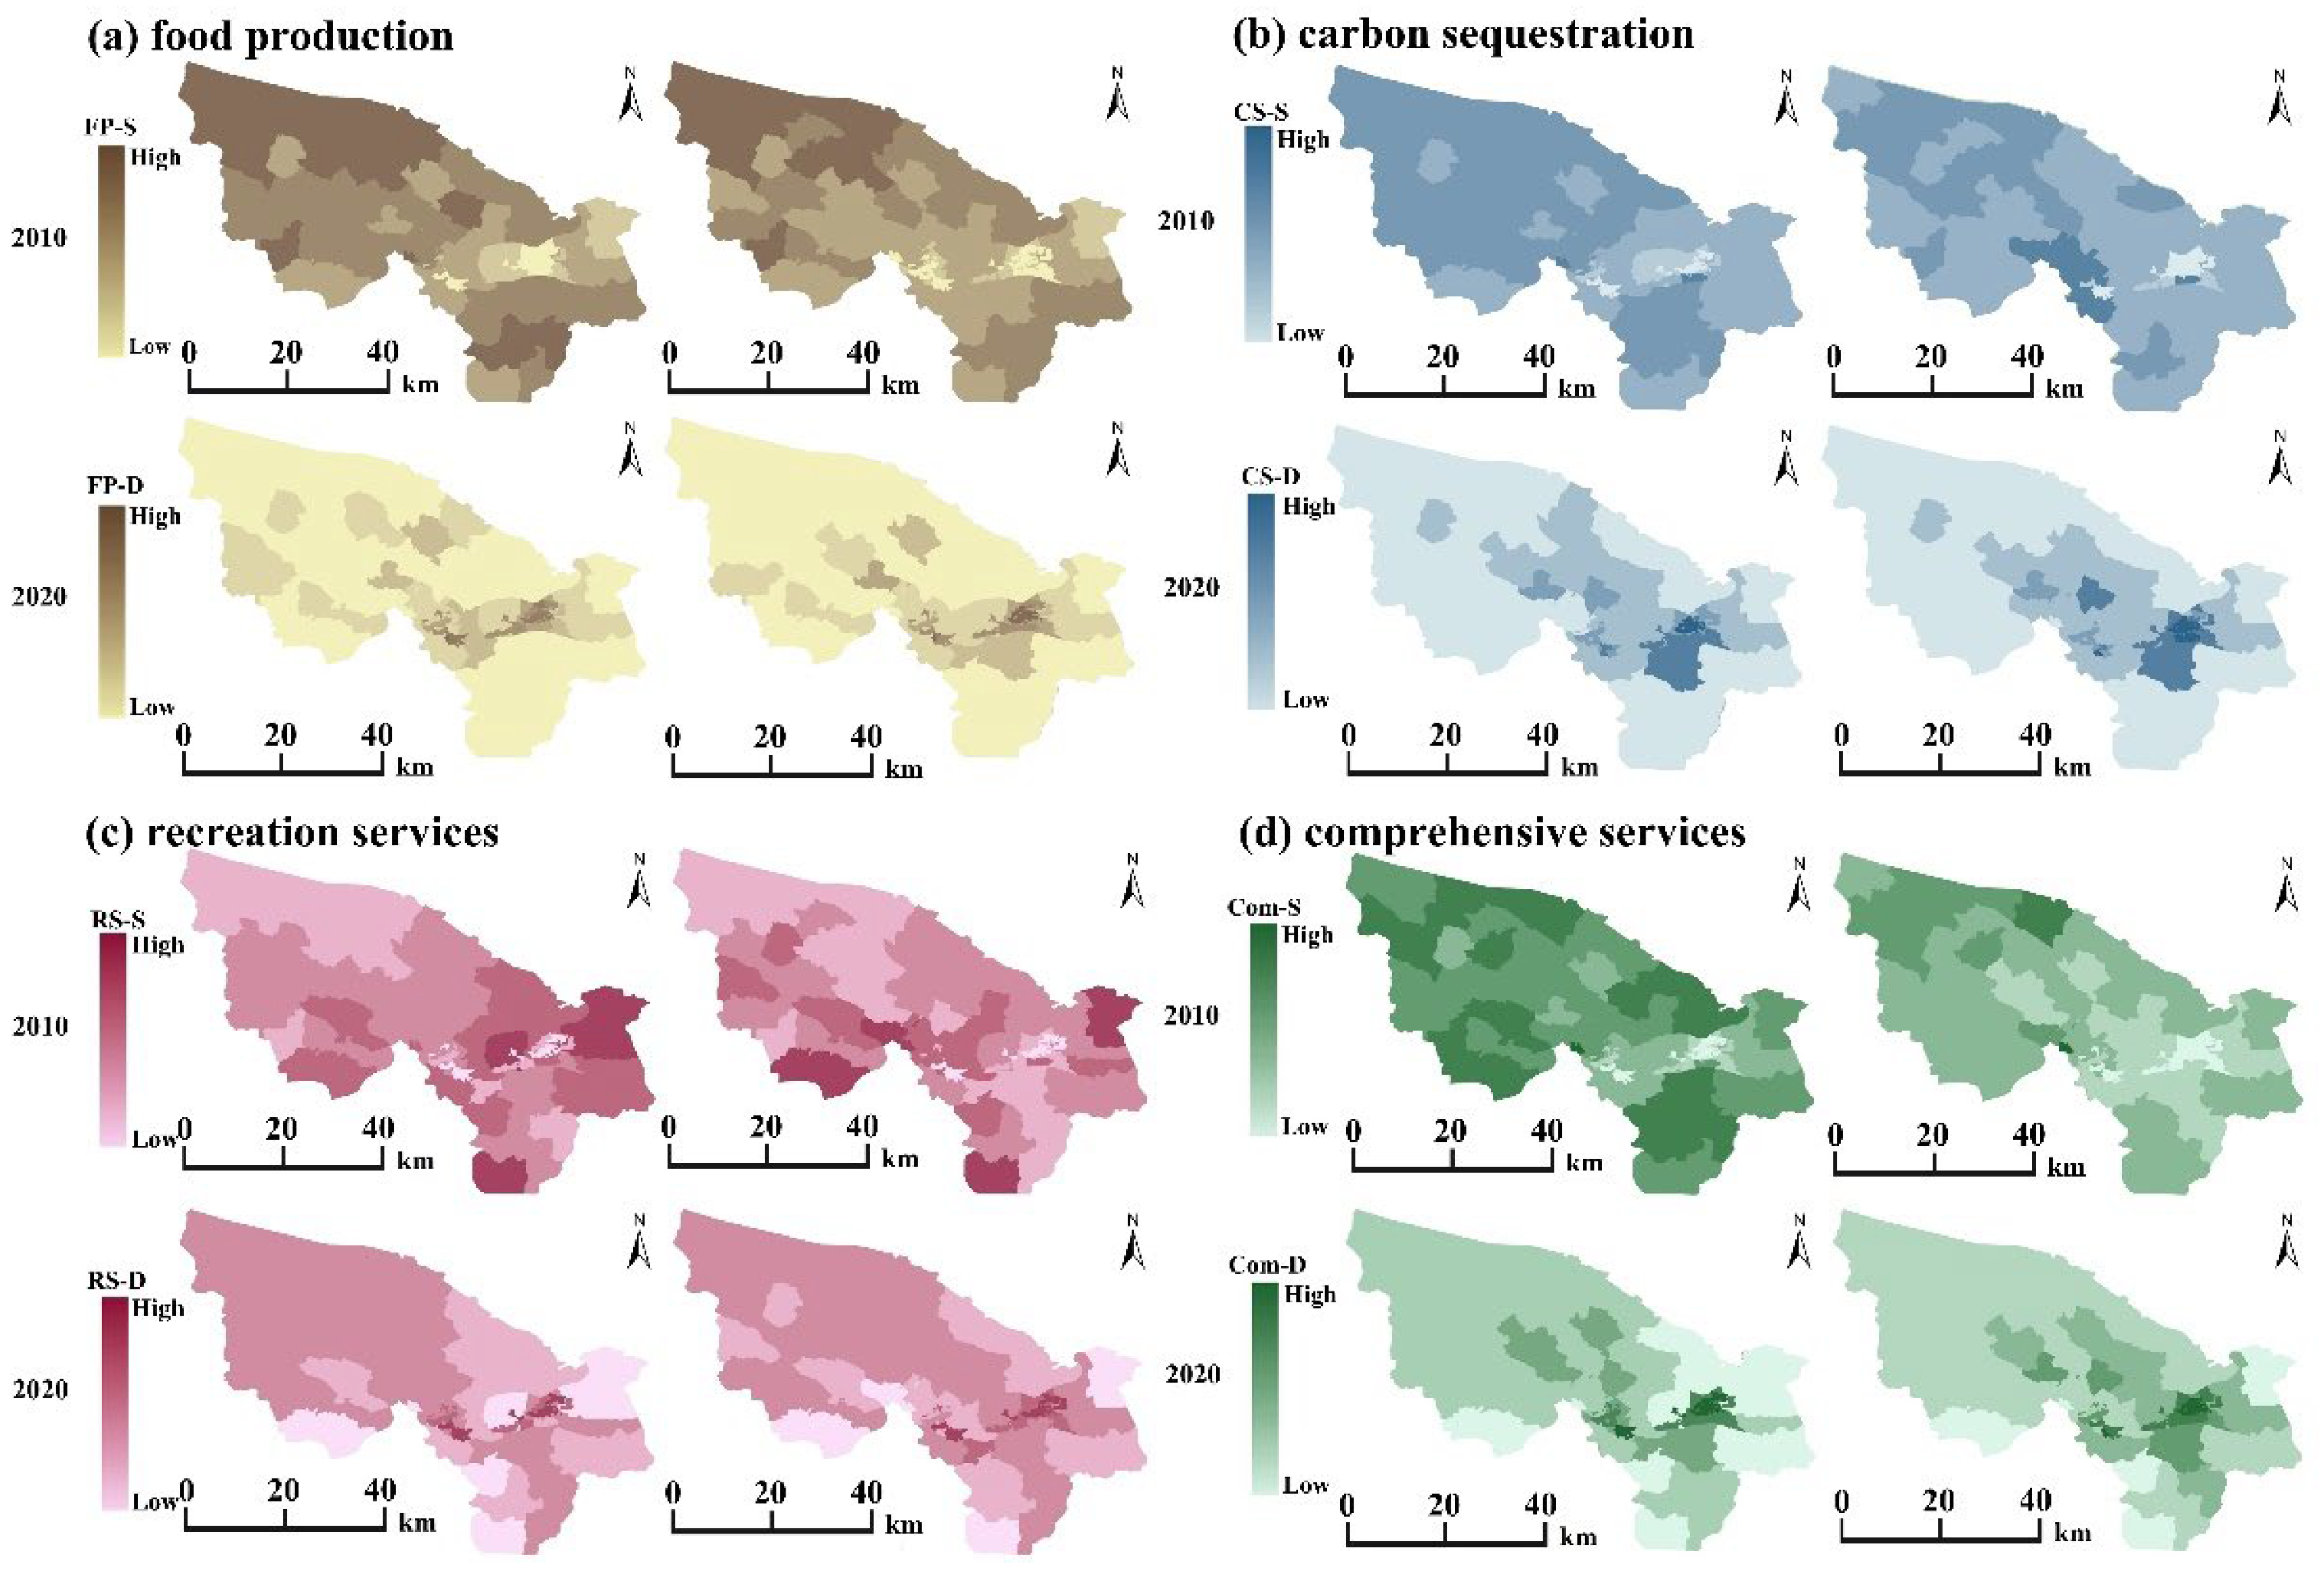
3.1. Spatial Distribution of the ES Supplies and Demands

The results revealed similar spatial distributions of the FP and CS supplies in Huainan City (Figure 2). The strongest supply capacities were found in the northwestern and southeastern rural areas, while the lowest supply capacities were observed in the central urban areas. In contrast, the spatial distribution of the RSs was different from those of the FPs and CSs. Specifically, scattered high RS values were found due to the impacts of natural resource endowment. On the other hand, similar spatial distributions of the FP, CS, and RS demands were observed, showing high values in the eastern and western urban districts of Huainan City.
In this study, the FPs, CSs, and RSs were considered equally important for human well-being. Therefore, the min–max normalization method was applied to standardize the service data, followed by summation to obtain comprehensive supply and demand indices. The average comprehensive ES supply indices in Huainan City were 1.42 and 0.84 in 2010 and 2020, respectively. On the other hand, the average comprehensive ES demand indices were 0.74 and 0.95 in 2010 and 2020, respectively (Figure 2). In addition, the comprehensive ES supply and demand indices showed decreasing and increasing trends, respectively. These indices exhibited similar spatial variation characteristics to the supply of FPs, CSs, and RSs, characterized by urban–rural differentiations.
The spatial distribution of the ESs in Huainan City exhibited urban–rural differentiation due to the high population density and large impervious surfaces in the urban areas, which reduce the availability of ecological areas and, consequently, result in weak supply capacities and high demands for the ESs [41]. In contrast, rural areas are characterized by comparatively lower population densities and larger ecological areas, enhancing the supply capacities and decreasing the demands for the ESs. However, urban expansion and rural development in Huainan City significantly impacted ecological areas [42]. These impacts resulted in slight declines in the ES supply and increased demand in the rural areas over the 2010–2020 period.

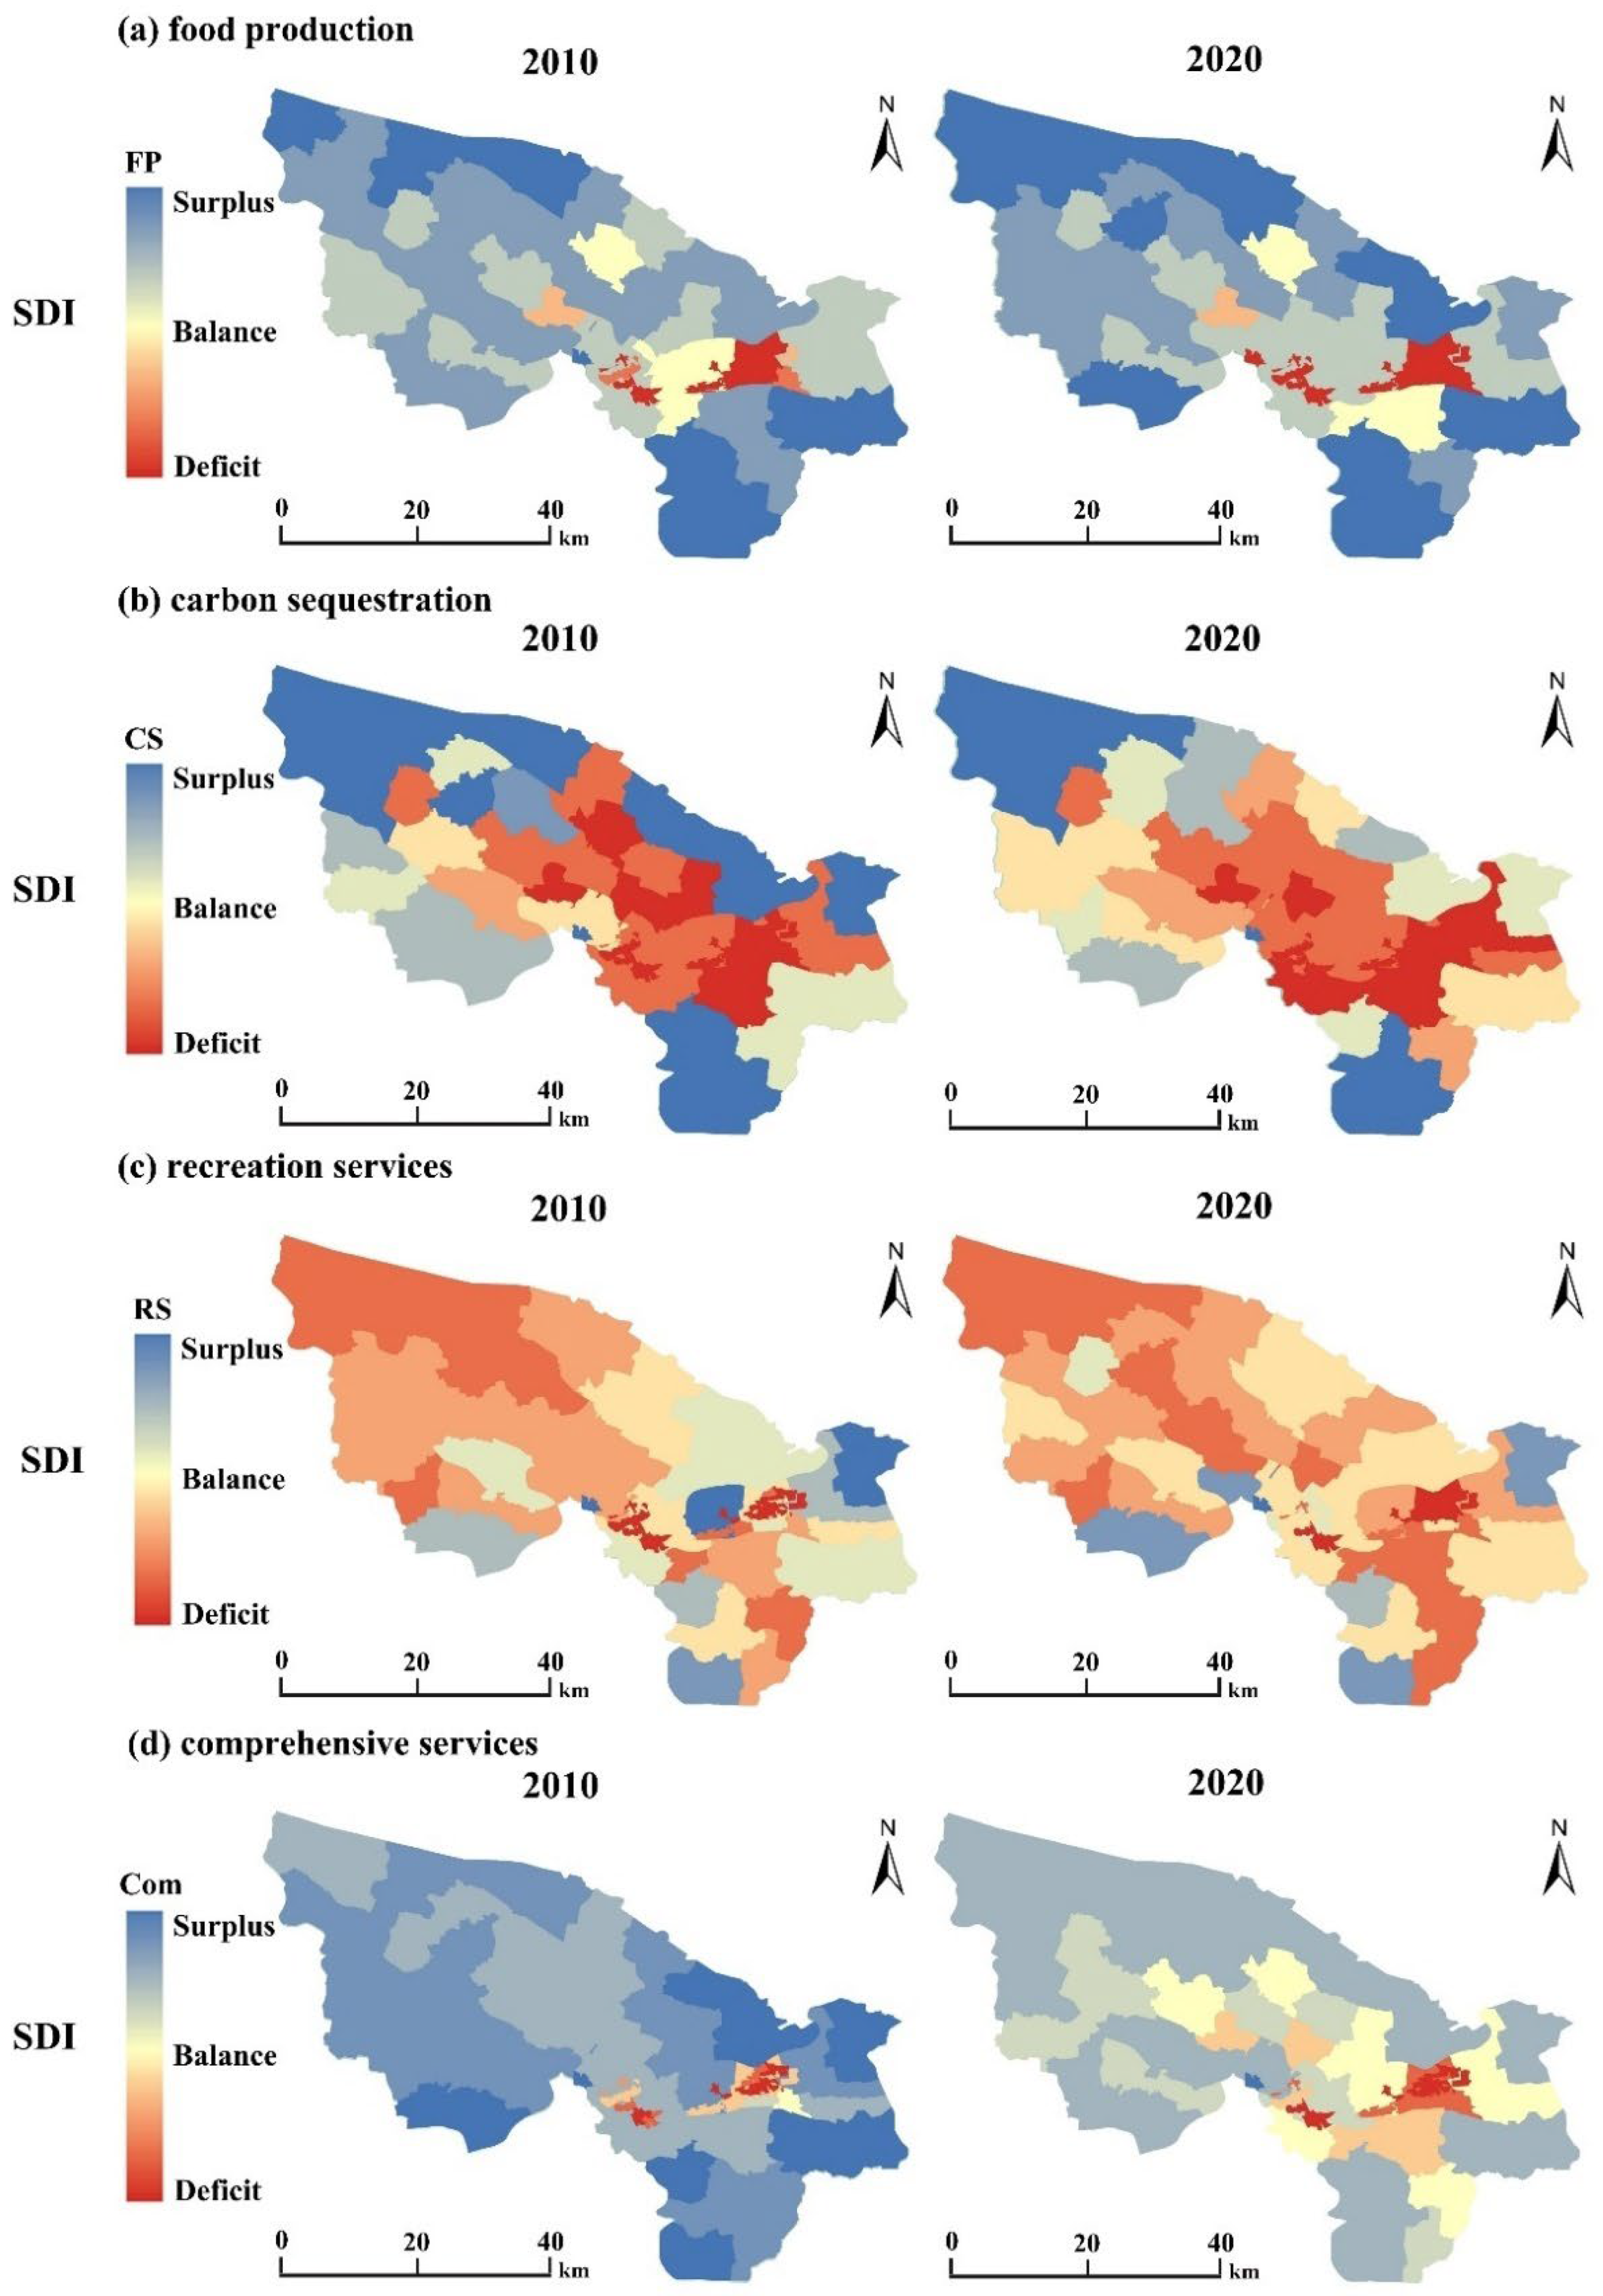
3.2. Spatial Distribution of the SDI

The results showed surpluses in the supply–demand relationship of FPs in Huainan City. The surplus and deficit units in 2010 accounted for 68.66 and 31.34%, respectively. The deficit and surplus areas were primarily concentrated in the central urban district and rural townships away, respectively. Similar spatial surplus and deficit characteristics were found in 2020 to some extent (Figure 3).
According to the obtained results, CSs exhibited significant supply–demand mismatches, with deficit rates reaching 61.19% in 2010 and increasing to 70.15% by 2020. The overall supply–demand relationship of RSs was also in deficit. Specifically, 83.58 and 88.05% of the RS values were in deficit in 2010 and 2020, respectively. The CS and RS surpluses were scattered variation patterns in the study area, particularly in areas rich in natural resources. The CS and RS deficit concentrated spatial distributions near the eastern and western urban districts.
The comprehensive supply–demand deficit rates in 2010 and 2020 were 26.87 and 34.32%, respectively. Although the deficit proportions were moderate, they exhibited increasing trends. The ESSD relationships in Huainan City exhibited a spatial distribution characteristic of urban–rural duality. In urban areas, the supply–demand relationship was in deficit, while in towns and villages, it was predominantly in surplus. In addition, the results showed an expansion trend of the deficit areas from the central urban area to the surrounding towns and villages.

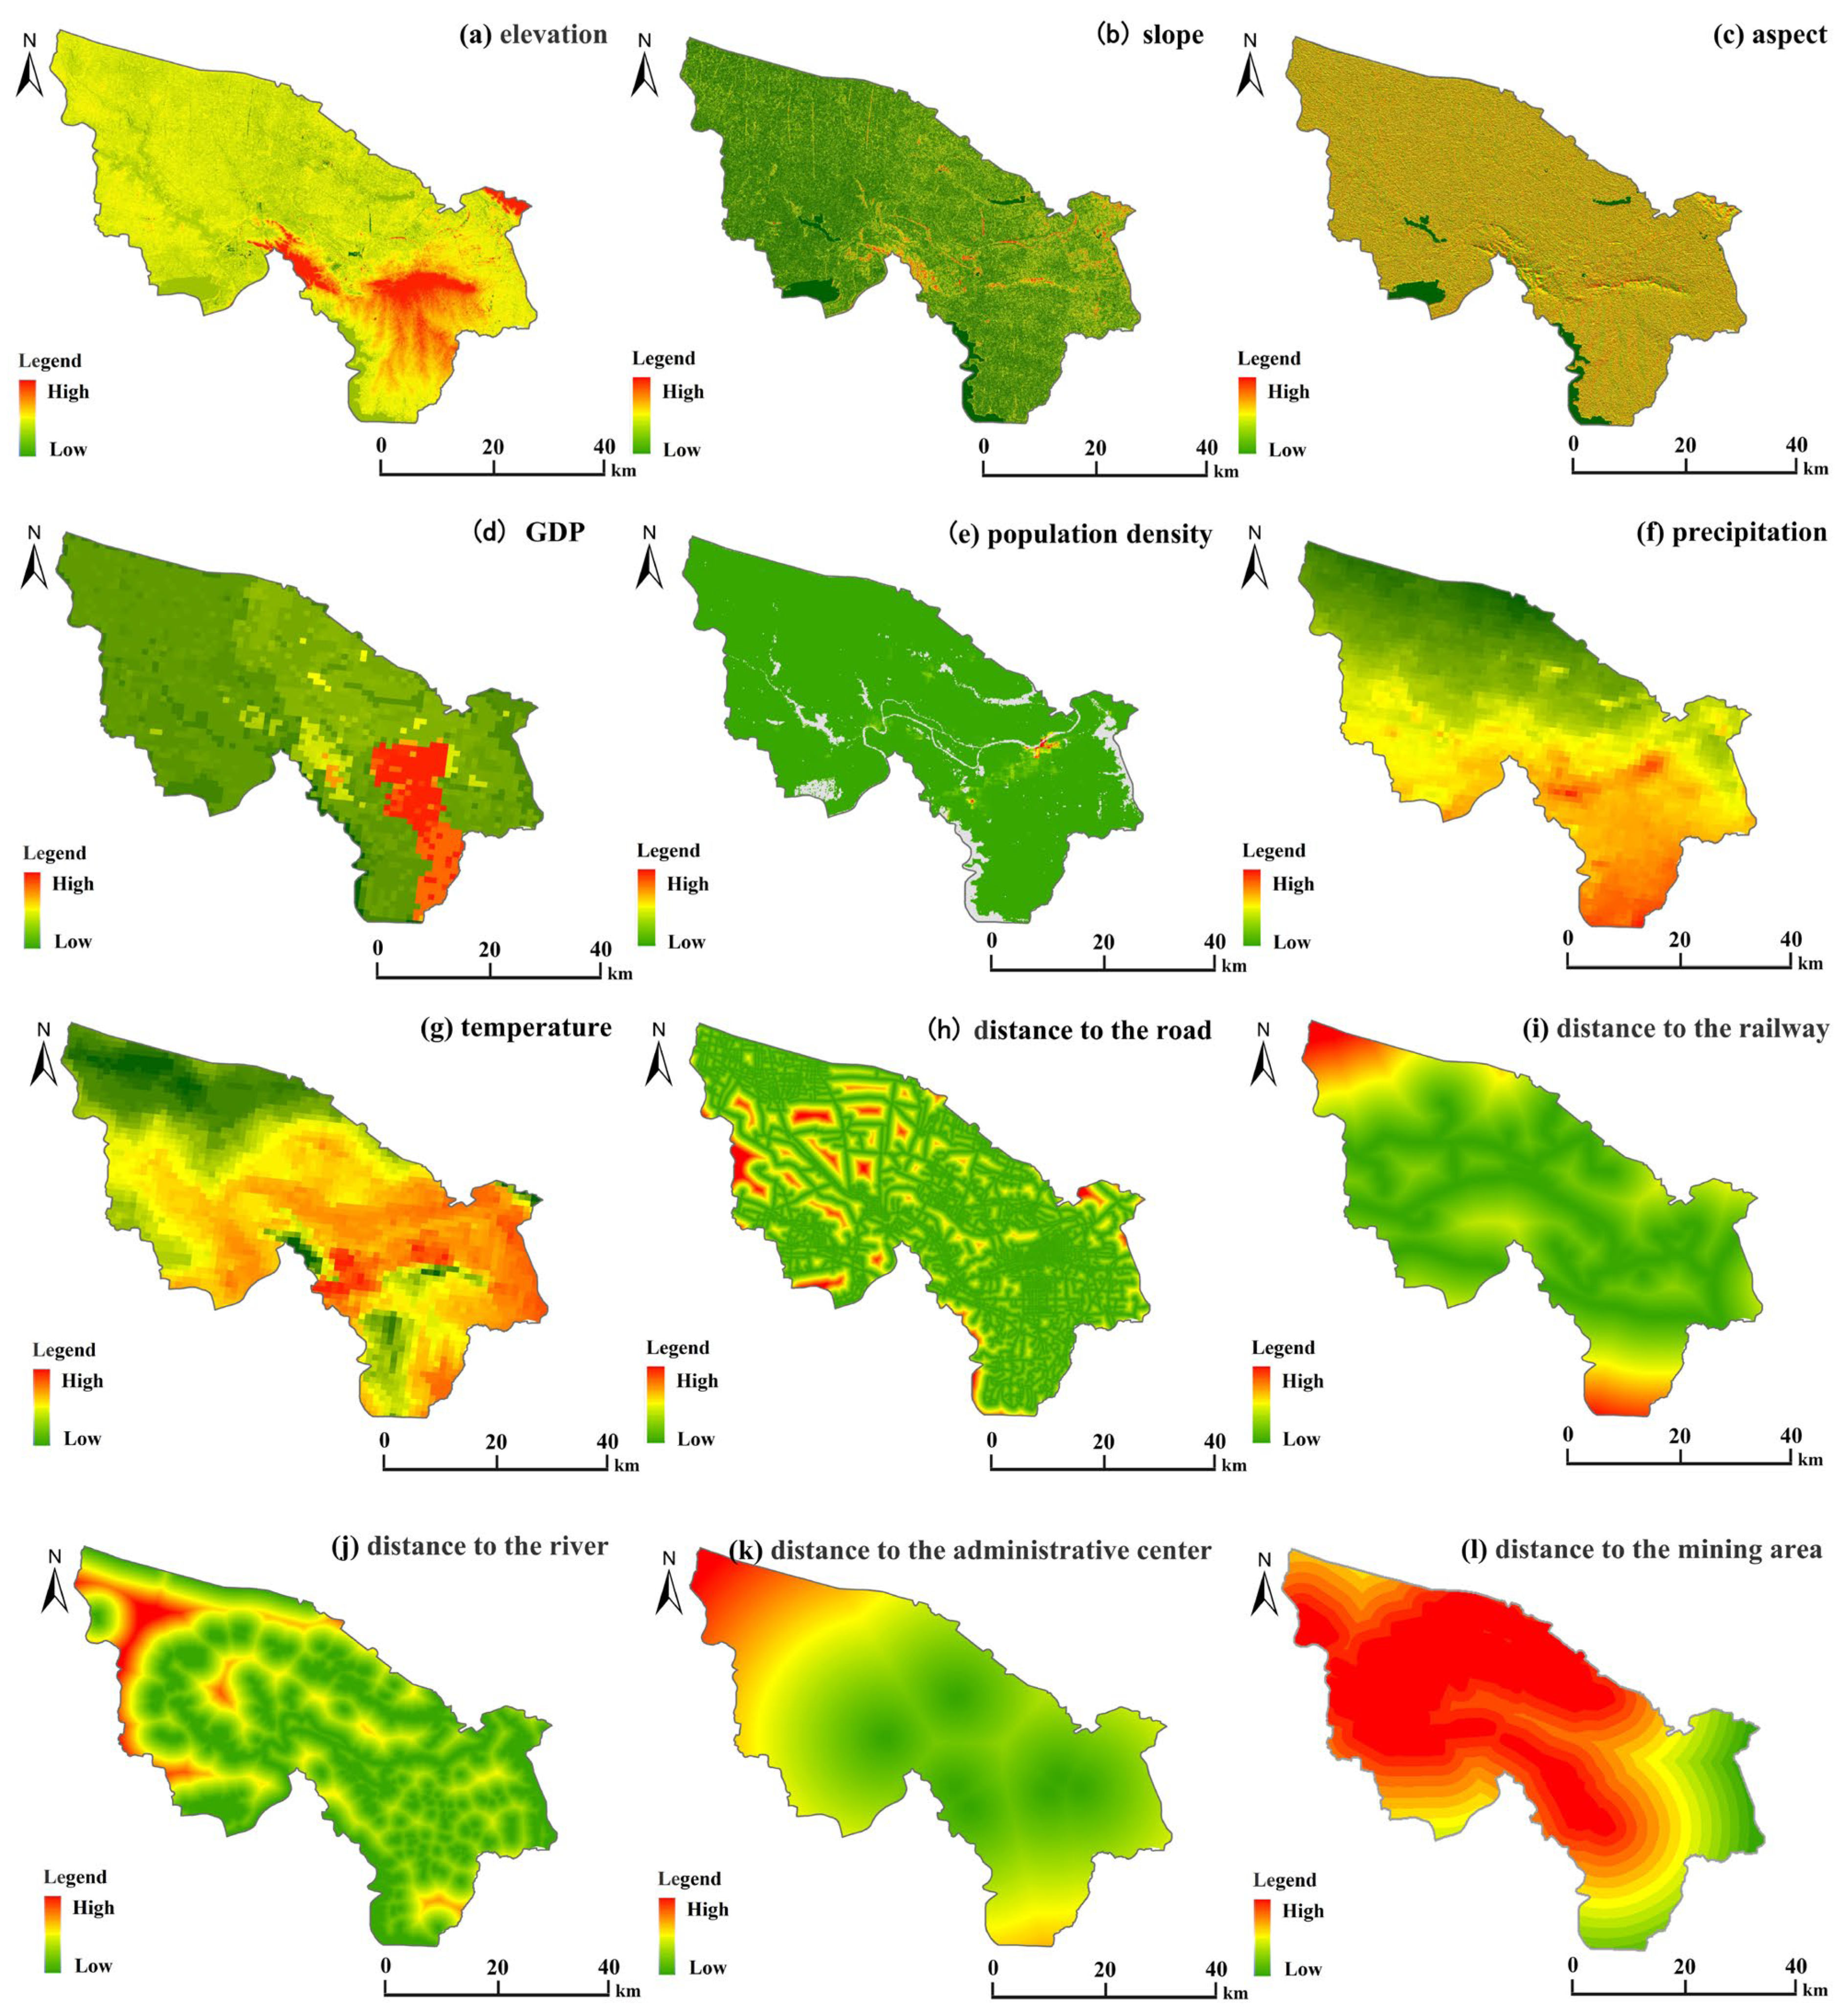
3.3. Factors Influencing the ESSD Relationships

Previous studies on ESSD-influencing factors have predominantly focused on natural and social drivers [43,44,45,46]. In this study, we systematically reviewed the factors identified in existing literature and selected nine key determinants by considering data availability and the natural, economic, and social conditions of Huainan City (Table 3). Geo-Detector was employed to identify the main factors influencing the spatiotemporal variations in the ESSD relationships.
The Geo-Detector results demonstrated the influences of the social and natural factors on the ESSD relationships in Huainan City (Figure 4). The q-values of the construction and ecological land areas were relatively higher than those of the other social factors. Among the natural factors, on the other hand, the precipitation and temperature data had relatively higher q-values. However, the contribution rates of the social factors were higher than those of the natural factors, demonstrating the strong controlling effects of the social factors on the ESSD relationships.
The Geo-Detector method accurately identified the main factors influencing the ESSD relationships in Huainan City without revealing the main mechanisms underlying the impacts of the selected factors within each unit. Therefore, factors with explanatory power values greater than 0.25 in the Geo-Detector results were selected and considered as input variables into the MGWR model to determine the directions, intensities, and spatiotemporal variations in the impacts exerted by the factors on the ESSD relationships.
The regression coefficients of the construction land areas in 2010 and 2020 were negative, indicating the negative impacts of increased construction land areas on the ESSD relationships. The negative impacts of the increased construction land on the supply–demand relationship were, in fact, more pronounced in the western region when compared with those in the eastern region. On the other hand, the regression coefficients of the ecological and cultivated land areas in 2010 and 2020 were positive, demonstrating the positive impacts of these factors on the ESSD relationships. The regression coefficients of these factors were higher in the central region than those in the eastern and western regions (Figure 5).

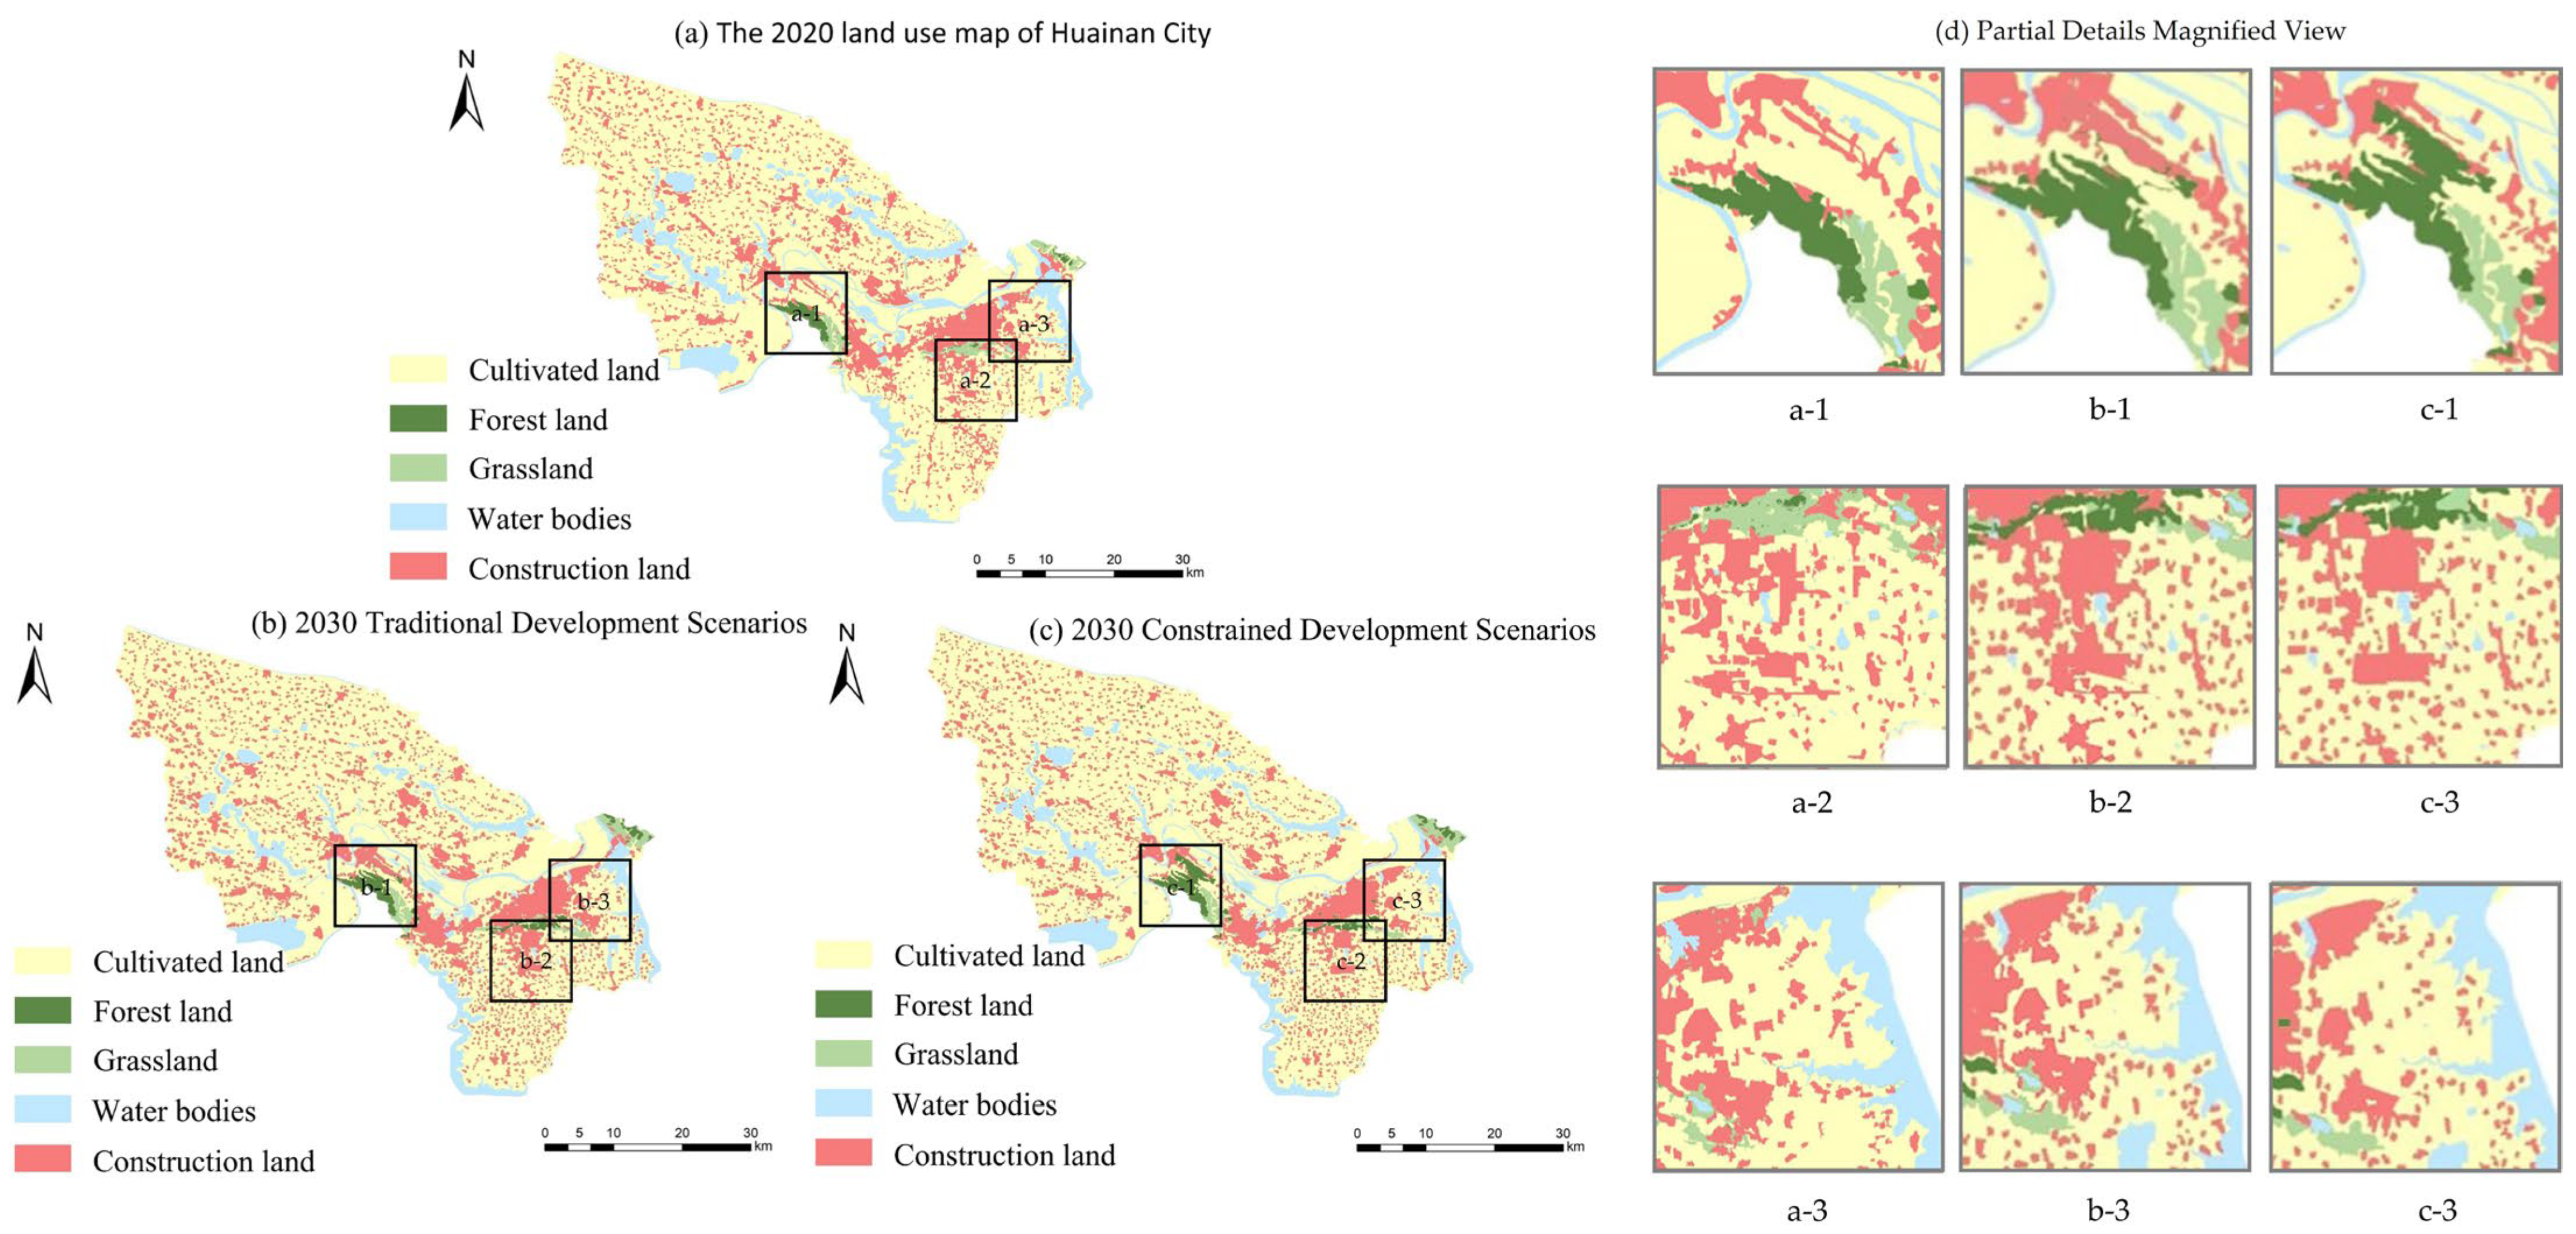
3.4. Future Land Use in Huainan City

The analysis results indicated strong impacts of land use patterns on the ESSD relationships in Huainan City. The increased construction land negatively affected the balance between the ES supplies and demands. In contrast, the ecological and cultivated land areas were beneficial for maintaining the stability of supply–demand relationships. Therefore, land development patterns can influence future ESSD relationships in Huainan City. To ensure comprehensive risk assessments and resource allocation strategy formulations, it is essential to predict and analyze future development scenarios. In this study, a land use transition probability matrix was further established based on the collected historical land use data and various related factors (Figure 6), taking into account the MGWR-based regression coefficients of the MGWR. This matrix was employed to predict land use patterns in Huainan City for 2030 under the traditional and constrained development scenarios (Figure 7).
The land use types in the study area were unaffected by the national agroecology policies under the traditional development scenario. They were influenced mainly by the historical changing trends, as well as by other influencing factors, such as terrain, natural conditions, socio-economic factors, and location conditions. Under the constrained development scenario, on the other hand, ecological priorities are emphasized for maintaining sufficient cultivated land areas. Indeed, the protection measures for the ecological function zones were strengthened. Moreover, strict control measures were implemented to restrict obvious conversions of ecologically valuable forests, grasslands, and water bodies to construction land areas in the study area.
The predicted expansion rate of the construction land under the traditional development scenario was substantially greater than that under the constrained development scenario, resulting in reduced ecological areas. Under the constrained development scenario, on the other hand, the expansion rate of the construction land was restricted without a substantial difference to that revealed in 2020. The ecological areas under this scenario were well protected with no significant reductions. Furthermore, areas with good ecological resources exhibited an expansion trend towards the urban areas.
The results showed a significant expansion of the eastern urban construction land area towards Shungengshan under the traditional development scenario, resulting in reduced ecological and farmland areas. These construction land areas had a continuous expansion trend in the southern mountain areas, substantially reducing the farmland areas. Comparatively higher expansion rates were found in the eastern part of the study area. In addition, construction land patches in the Huainan Economic Development Zone showed an increasing trend towards the eastern main urban area.
The expansion of urban construction land in Huainan City was restricted under the constrained development scenario, resulting in more intensive land construction. The spatial distribution of land use types in the northern part of Shungengshan in 2030 was relatively similar to those observed in 2020, showing a lack of significant expansion toward the mountain areas under the traditional development scenario. On the other hand, some ecological areas were found in the urban areas under the constrained development scenario. However, the observed expansion rates of the urban area in the southern parts of the Shungeng Mountain and the Eastern Economic Development Zone were limited. Therefore, the overall urban development in the east-central area was within a reasonable range, which could ensure effective ecological protection.

4. Discussion

4.1. Comparison of the Results with Relevant Research Findings

Ecosystem services (ESs) are crucial for human society’s survival and development. It is, therefore, important to comprehensively explore the relationship and mechanisms of factors influencing the ESSD [47,48]. This study evaluated the distribution, evolution, and influencing factors of ESSD under the combined impacts of coal mining activities and urbanization on land use changes to elucidate the relationships between human activities, land use dynamics, and ecosystems. In addition, this study explained the processes and driving mechanisms associated with social and ecological transformations. This study revealed a significant spatial mismatch in the supply and demand pattern of ES in Huainan City. Urban areas exhibited high ES demand coupled with low supply, while rural areas demonstrated the inverse pattern of high supply but low demand. This phenomenon is mainly due to the combined effect of natural and social factors, among which the roles of construction land area and ecological land area are particularly significant. Regulating the ESSD in Huainan City through land use patterns is actively effective. By comparing two land use scenarios, it is found that the traditional development scenario will continue to lead to the expansion of construction land and reductions in ecological land, which will further deteriorate the ESSD. On the contrary, if a constrained land use development model is adopted, it will reduce the degree of construction land expansion and increase the area of ecological land in important ecological nodes, which is conducive to regulating ESSD. This provides new perspectives and methods for future research on ESs and land use optimization, as well as a scientific basis for exploring the main mechanisms underlying social-ecological interactions and guiding the management and planning of ESs in coal resource-based urban areas.
Contrary to previous related studies on ESs at city [49], county [50], and grid [51] scales, this study considered townships as fundamental research units. This approach can provide accurate measurements of the ESs and facilitates administrative actions by local authorities to improve the efficiency of ES protection and restoration [52]. Most related studies have, typically, conducted time series analyses at intervals of 5 or 10 years [53,54]. In this study, we have conducted the time series analysis with 10-year intervals, taking into account administrative adjustments and the extent of changes in ESs. The combination of the Geo-Detector and MGWR models was effective in exploring the main mechanisms underlying the effects on the ESSD [37]. Furthermore, the different input variables into the MGWR have different bandwidths, effectively capturing the heterogeneity in the spatial data [55,56].
The analysis results of the influencing factors were consistent with those revealed in previous related studies, highlighting the combined impacts of social and natural factors on the ESSD relationships [57]. The natural and social factors predominantly affected the ES supplies and demands, respectively. The endowments and levels of economic and social development can vary between different research regions, resulting in varied intensities of their effects [58]. In Huainan City, where natural conditions were relatively stable, significant changes in the economic and social characteristics were found, including increased construction land and population growth. These changes, consequently, increased the ES demands [59]. Therefore, the ESSD relationships were mainly driven by the social factors over the 2010–2020 period. Among these factors, changes in the land use types notably affected the ESSD relationships, which is in line with the findings revealed in previous related studies [60,61,62].
Some scholars have further explored the impacts of land use changes on the ESSD relationships using predictive models [63,64]. According to their findings, economic growth or uncontrolled development can exacerbate the imbalance between the ESSD relationships. In contrast, ecological conservation or controlled development can effectively enhance ESs [65,66]. These findings are in line with those revealed in the present study, highlighting the need for balanced economic growth and enhanced ecological benefits in Huainan City to achieve sustainable development that harmonizes human needs and environmental conservation.

4.2. Policy Directions

Regarding policy directions for ESSD optimization, scholars have conducted extensive discussions, such as establishing ecological protection zones [67,68], strengthening the construction of green infrastructure [69,70], and improving ecological compensation mechanisms [71,72]. By drawing on relevant strategies and combining the analytical results, this study puts forward targeted policy direction suggestions. Huainan City is suggested to ensure optimal economic growth, effectively allocate existing resources, restrict urban expansion, reduce construction land areas, and increase farmland/ecological land areas in Huainan City to achieve the constrained development scenario. Underused or unused construction land areas can be converted into street corner gardens and parks, thereby increasing ecological land areas and promoting the restoration and enhancement of the urban ecosystems. It is suggested that great efforts be devoted to ecological restoration and management in the mining regions by the government to mitigate environmental issues caused by coal mining activities. In addition, sustainable economic growth and ecological protection can be achieved by replacing governance indicators with development indicators.
Comprehensive planning strategies, strengthened urban–rural linkage, and orderly distributions of ecological resources need to be implemented in the study area in response to the existing disparities in the ESSD between the rural and urban areas. Additionally, ecological corridors can be established through water systems and transportation networks to enhance ecological connectivity between the urban and rural areas.

4.3. Limitations of This Study

This study focused only on three components of the ESSD impacting the well-being of residents in Huainan due to the lack of comprehensive related data. These components were ESs—those of food, carbon, and recreation. Hence, it is suggested that in the future, related studies be conducted while taking into account a broader range of ESs, such as water conservation, soil preservation, and water/air purification, to provide more comprehensive assessments of the ESSD in Huainan City. It is also suggested that meteorological and climate models be considered to accurately predict future natural, economic, and social development, thereby providing further insights into the evolution of ESSD under various future scenarios. Such studies can guide the formulation of effective environmental protection policies and sustainable development plans, optimize resource allocation, and promote ecosystem stability.

5. Conclusions

The present study aimed to assess the ESSD relationships in a coal resource-based city (Huainan) using multi-source data from 2010 to 2020. The Geo-Detector and MGWR models were employed to identify the main influencing factors and their mechanisms, as well as to predict future land use changes.
The following conclusions were drawn in this study:
(1)
Compared to 2010, FP supplies in 2020 increased while demand decreased; in contrast, both CSs and RSs experienced a decline in supply alongside a rise in demand during the same period. Overall, the comprehensive supply–demand relationship showed a surplus. However, the surplus degrees and their spatial distributions exhibited decreasing trends.
(2)
Spatially, the ESSD relationships showed a clear urban–rural dichotomy. In urban areas, ES demands were high, while supplies were low. The ESSD deficits were mainly concentrated in urban areas and extended to surrounding areas.
(3)
The ESSD relationships were mainly influenced by the selected social factors. The construction land areas negatively impacted the ESSD across the study region, while the increased ecological land and cultivated land had positive effects.
(4)
The urban expansion in Huainan City can be effectively controlled under the constrained development scenario. In addition, this scenario is of great importance for reducing the impact of urban encroachment on ecological land, thereby promoting ecological expansion in areas with good ecological resources.
(5)
The government of Huainan should focus on limiting incremental growth, restoring existing natural resources, and implementing effective measures to restore mining and ecological areas. Additionally, it is crucial to consider urban–rural coordination and resource allocation optimization to achieve sustainable urban development.
(6)
This study provides a replicable framework for the sustainable development of coal resource-based cities through the optimization of land use based on ESSD. By analyzing the influencing factors, it was found that the control of land use patterns plays a crucial role in ESSD. In the development process, coal resource-based cities should curb excessive development activities and adopt scientific land use patterns to ensure sustainable development.

Author Contributions

Conceptualization, Z.Z. and C.L.; methodology, C.L.; software, Z.Z. and W.-L.H.; validation, W.-L.H., Z.Z. and C.L.; formal analysis, Z.Z. and W.-L.H.; investigation, Z.Z. and C.L.; resources, C.L. and W.-L.H.; data curation, Z.Z. and C.L.; writing—original draft preparation, Z.Z. and C.L.; writing—review and editing, W.-L.H., Z.Z., J.Z. and C.L.; visualization, Z.Z.; supervision, W.-L.H.; project administration, C.L.; funding acquisition, W.-L.H., C.L. and J.Z. All authors have read and agreed to the published version of the manuscript.

Funding

This research was funded by Guangdong Science and Technology (grant number: 2024A0505050031), the National Natural Science Foundation of China Project (grant number: 42371307) and the Ministry of Education Humanities and Social Sciences Research Project (grant number: 24YJCZH131).

Data Availability Statement

The original contributions presented in the study are included in the article, further inquiries can be directed to the corresponding author.

Acknowledgments

We would like to thank the anonymous reviewers for their valuable comments and suggestions for improving this paper.

Conflicts of Interest

The authors declare no conflicts of interest.

Abbreviations

The following abbreviations are used in this manuscript:
ESSDsupplies and demands of ecosystem services
FPsfood production services
CSscarbon sequestration services
RSsrecreation services
MGWRmulti-scale geographic weighted regression
ESecosystem service
WTPwillingness to pay
NDVIThe Normalized Difference Vegetation Index
SDSystem Dynamics
CACellular Automata
ANNArtificial Neural Networks

References

  1. Brander, L.; de Groot, R.; Schägner, J.; Guisado-Goni, V.; van’t Hoff, V.; Solomonides, S.; McVittie, A.; Eppink, F.; Sposato, M.; Do, L. Economic values for ecosystem services: A global synthesis and way forward. Ecosyst. Serv. 2024, 66, 101606. [Google Scholar] [CrossRef]
  2. Tan, J.; Peng, L.; Wu, W.; Huang, Q. Mapping the evolution patterns of urbanization, ecosystem service supply–demand, and human well-being: A tree-like landscape perspective. Ecol. Indic. 2023, 154, 110591. [Google Scholar] [CrossRef]
  3. Wei, H.; Fan, W.; Wang, X.; Lu, N.; Dong, X.; Zhao, Y.; Ya, X.; Zhao, Y. Integrating supply and social demand in ecosystem services assessment: A review. Ecosyst. Serv. 2017, 25, 15–27. [Google Scholar] [CrossRef]
  4. Rees, W.; Wackernagel, M. Urban ecological footprints: Why cities cannot be sustainable–and why they are a key to sustainability. Urban Sociol. Read. 2012, 157, 537–555. [Google Scholar] [CrossRef]
  5. Burkhard, B.; Kroll, F.; Nedkov, S.; Müller, F. Mapping ecosystem service supply, demand and budgets. Ecol. Indic. 2012, 21, 17–29. [Google Scholar] [CrossRef]
  6. Villamagna, A.M.; Angermeier, P.L.; Bennett, E.M. Capacity, pressure, demand, and flow: A conceptual framework for analyzing ecosystem service provision and delivery. Ecol. Complex. 2013, 15, 114–121. [Google Scholar] [CrossRef]
  7. Schröter, M.; Barton, D.N.; Remme, R.P.; Hein, L. Accounting for capacity and flow of ecosystem services: A conceptual model and a case study for Telemark, Norway. Ecol. Indic. 2014, 36, 539–551. [Google Scholar] [CrossRef]
  8. Costanza, R.; d’Arge, R.; De Groot, R.; Farber, S.; Grasso, M.; Hannon, B.; Limburg, K.; Naeem, S.; O’neill, R.V.; Paruelo, J. The value of the world’s ecosystem services and natural capital. Nature 1997, 387, 253–260. [Google Scholar] [CrossRef]
  9. Zhang, J.; Guo, W.; Wang, Y.; Tang, Z.; Qi, L. Identifying the regional spatial management of ecosystem services from a supply and demand perspective: A case study of Danjiangkou reservoir area, China. Ecol. Indic. 2024, 158, 111421. [Google Scholar] [CrossRef]
  10. Bagstad, K.J.; Villa, F.; Batker, D.; Harrison-Cox, J.; Voigt, B.; Johnson, G.W. From theoretical to actual ecosystem services: Mapping beneficiaries and spatial flows in ecosystem service assessments. Ecol. Soc. 2014, 19, 64. [Google Scholar] [CrossRef]
  11. Yu, J.; Yi, L.; Xie, B.; Li, X.; Li, J.; Xiao, J.; Zhang, L. Matching and coupling coordination between the supply and demand for ecosystem services in Hunan Province, China. Ecol. Indic. 2023, 157, 111303. [Google Scholar] [CrossRef]
  12. Wanghe, K.; Guo, X.; Ahmad, S.; Tian, F.; Nabi, G.; Strelnikov, I.I.; Li, K.; Zhao, K. FRESF model: An ArcGIS toolbox for rapid assessment of the supply, demand, and flow of flood regulation ecosystem services. Ecol. Indic. 2022, 143, 109264. [Google Scholar] [CrossRef]
  13. Zhuang, Z.; Li, C.; Hsu, W.-L.; Gu, S.; Hou, X.; Zhang, C. Spatiotemporal changes in the supply and demand of ecosystem services in China’s Huai River basin and their influencing factors. Water 2022, 14, 2559. [Google Scholar] [CrossRef]
  14. Yin, D.; Yu, H.; Shi, Y.; Zhao, M.; Zhang, J.; Li, X. Matching supply and demand for ecosystem services in the Yellow River Basin, China: A perspective of the water-energy-food nexus. J. Clean. Prod. 2023, 384, 135469. [Google Scholar] [CrossRef]
  15. Hou, W.; Hu, T.; Yang, L.; Liu, X.; Zheng, X.; Pan, H.; Zhang, X.; Xiao, S.; Deng, S. Matching ecosystem services supply and demand in China’s urban agglomerations for multiple-scale management. J. Clean. Prod. 2023, 420, 138351. [Google Scholar] [CrossRef]
  16. Zhai, W.; Zhang, K.; Gou, F.; Cheng, H.; Li, Z.; Zhang, Y. Examining supply-demand imbalances and social inequalities of regulating ecosystem services in high-density cities: A case study of Wuhan, China. Ecol. Indic. 2023, 154, 110654. [Google Scholar] [CrossRef]
  17. Dang, H.; Li, J. Supply-demand relationship and spatial flow of urban cultural ecosystem services: The case of Shenzhen, China. J. Clean. Prod. 2023, 423, 138765. [Google Scholar] [CrossRef]
  18. Luo, Z.; Tian, J.; Zeng, J.; Pilla, F. Assessing the spatial pattern of supply-demand mismatches in ecosystem flood regulation service: A case study in Xiamen. Appl. Geogr. 2023, 160, 103113. [Google Scholar] [CrossRef]
  19. Jiang, S.; Feng, F.; Zhang, X.; Xu, C.; Jia, B.; Lafortezza, R. Ecological transformation is the key to improve ecosystem health for resource-exhausted cities: A case study in China based on future development scenarios. Sci. Total Environ. 2024, 921, 171147. [Google Scholar] [CrossRef]
  20. Wang, Z.; Luo, K.; Zhao, Y.; Lechner, A.M.; Wu, J.; Zhu, Q.; Sha, W.; Wang, Y. Modelling regional ecological security pattern and restoration priorities after long-term intensive open-pit coal mining. Sci. Total Environ. 2022, 835, 155491. [Google Scholar] [CrossRef]
  21. Fu, Y.; He, Y.; Chen, W.; Xiao, W.; Ren, H.; Shi, Y.; Hu, Z. Dynamics of carbon storage driven by land use/land cover transformation in coal mining areas with a high groundwater table: A case study of Yanzhou Coal Mine, China. Environ. Res. 2024, 247, 118392. [Google Scholar] [CrossRef]
  22. Han, J.; Hu, Z.; Wang, P.; Yan, Z.; Li, G.; Zhang, Y.; Zhou, T. Spatio-temporal evolution and optimization analysis of ecosystem service value-A case study of coal resource-based city group in Shandong, China. J. Clean. Prod. 2022, 363, 132602. [Google Scholar] [CrossRef]
  23. Belmahi, M.; Hanchane, M.; Krakauer, N.Y.; Kessabi, R.; Bouayad, H.; Mahjoub, A.; Zouhri, D. Analysis of relationship between grain yield and NDVI from MODIS in the fez-meknes region, Morocco. Remote Sens. 2023, 15, 2707. [Google Scholar] [CrossRef]
  24. Harrell, D.; Tubana, B.; Walker, T.; Phillips, S. Estimating rice grain yield potential using normalized difference vegetation index. Agron. J. 2011, 103, 1717–1723. [Google Scholar] [CrossRef]
  25. Huang, J.; Wang, H.; Dai, Q.; Han, D. Analysis of NDVI data for crop identification and yield estimation. IEEE J. Sel. Top. Appl. Earth Obs. Remote Sens. 2014, 7, 4374–4384. [Google Scholar]
  26. Hassan, M.A.; Yang, M.; Rasheed, A.; Yang, G.; Reynolds, M.; Xia, X.; Xiao, Y.; He, Z. A rapid monitoring of NDVI across the wheat growth cycle for grain yield prediction using a multi-spectral UAV platform. Plant Sci. 2019, 282, 95–103. [Google Scholar]
  27. Natural Capital Project. InVEST 0.0 User’s Guide; Stanford University: Stanford, CA, USA; University of Minnesota: St. Paul, MN, USA; Chinese Academy of Sciences: Beijing, China; The Nature Conservancy: Arlington, VA, USA; World Wildlife Fund: Gland, Switzerland; Stockholm Resilience Centre: Stockholm, Sweden, 2022. [Google Scholar]
  28. Wu, Q.; Wang, L.; Wang, T.; Ruan, Z.; Du, P. Spatial–temporal evolution analysis of multi-scenario land use and carbon storage based on PLUS-InVEST model: A case study in Dalian, China. Ecol. Indic. 2024, 166, 112448. [Google Scholar]
  29. Li, W.; Geng, J.; Bao, J.; Lin, W.; Wu, Z.; Fan, S. Analysis of spatial and temporal variations in ecosystem service functions and drivers in Anxi county based on the InVEST model. Sustainability 2023, 15, 10153. [Google Scholar] [CrossRef]
  30. Sun, F.; Fang, F.; Hong, W.; Luo, H.; Yu, J.; Fang, L.; Miao, Y. Analysis and prediction of carbon storage evolution in Anhui Province based on PLUS and InVEST models. J. Soil Water Conserv. 2023, 37, 151–158. [Google Scholar]
  31. Adelisardou, F.; Zhao, W.; Chow, R.; Mederly, P.; Minkina, T.; Schou, J. Spatiotemporal change detection of carbon storage and sequestration in an arid ecosystem by integrating Google Earth Engine and InVEST (the Jiroft plain, Iran). Int. J. Environ. Sci. Technol. 2022, 19, 5929–5944. [Google Scholar]
  32. Yang, D.; Luan, W.; Qiao, L.; Pratama, M. Modeling and spatio-temporal analysis of city-level carbon emissions based on nighttime light satellite imagery. Appl. Energy 2020, 268, 114696. [Google Scholar] [CrossRef]
  33. Zhou, Y.; Chen, M.; Tang, Z.; Zhao, Y. City-level carbon emissions accounting and differentiation integrated nighttime light and city attributes. Resour. Conserv. Recycl. 2022, 182, 106337. [Google Scholar] [CrossRef]
  34. Fang, G.; Gao, Z.; Tian, L.; Fu, M. What drives urban carbon emission efficiency?–Spatial analysis based on nighttime light data. Appl. Energy 2022, 312, 118772. [Google Scholar] [CrossRef]
  35. Tao, Y.; Wang, H.; Ou, W.; Guo, J. A land-cover-based approach to assessing ecosystem services supply and demand dynamics in the rapidly urbanizing Yangtze River Delta region. Land Use Policy 2018, 72, 250–258. [Google Scholar] [CrossRef]
  36. Sun, H.; Di, Z.; Sun, P.; Wang, X.; Liu, Z.; Zhang, W. Spatiotemporal Differentiation and Its Attribution of the Ecosystem Service Trade-Off/Synergy in the Yellow River Basin. Land 2024, 13, 369. [Google Scholar] [CrossRef]
  37. Wang, Q.; Jiang, D.; Gao, Y.; Zhang, Z.; Chang, Q. Examining the driving factors of SOM using a multi-scale GWR model augmented by geo-detector and GWPCA analysis. Agronomy 2022, 12, 1697. [Google Scholar] [CrossRef]
  38. Hu, B.; Kang, F.; Han, H.; Cheng, X.; Li, Z. Exploring drivers of ecosystem services variation from a geospatial perspective: Insights from China’s Shanxi Province. Ecol. Indic. 2021, 131, 108188. [Google Scholar] [CrossRef]
  39. Liu, X.; Liang, X.; Li, X.; Xu, X.; Ou, J.; Chen, Y.; Li, S.; Wang, S.; Pei, F. A future land use simulation model (FLUS) for simulating multiple land use scenarios by coupling human and natural effects. Landsc. Urban Plan. 2017, 168, 94–116. [Google Scholar] [CrossRef]
  40. Wang, Y.; Shen, J.; Yan, W.; Chen, C. Backcasting approach with multi-scenario simulation for assessing effects of land use policy using GeoSOS-FLUS software. MethodsX 2019, 6, 1384–1397. [Google Scholar] [CrossRef]
  41. Wang, J.; Wu, S.; Wang, Y.; Yan, D.; Cheng, M.; Zhou, W.; Liu, Z. Spatiotemporal decoupling between impervious surface areas and ecosystem services. Environ. Sci. Pollut. Res. 2024, 31, 3707–3721. [Google Scholar]
  42. Cumming, G.S.; Buerkert, A.; Hoffmann, E.M.; Schlecht, E.; von Cramon-Taubadel, S.; Tscharntke, T. Implications of agricultural transitions and urbanization for ecosystem services. Nature 2014, 515, 50–57. [Google Scholar] [CrossRef] [PubMed]
  43. Wu, Y.; Liu, Y.; Zeng, H. Ecosystem service supply–demand ratio zoning and thresholds of the key influencing factors in the Pearl River Delta, China. Landsc. Ecol. 2024, 39, 162. [Google Scholar] [CrossRef]
  44. Wu, Q.; Jiang, X.; Song, M.; Liu, Y.; Shi, X.; Lei, Y.; Nie, T. Study on the development trend of social-ecological systems and the drivers of sustainable development–A case study of the Loess Plateau in China. Ecol. Indic. 2023, 156, 111172. [Google Scholar] [CrossRef]
  45. Kang, J.; Li, C.; Zhang, B.; Zhang, J.; Li, M.; Hu, Y. How do natural and human factors influence ecosystem services changing? A case study in two most developed regions of China. Ecol. Indic. 2023, 146, 109891. [Google Scholar] [CrossRef]
  46. Zhang, Z.; Liu, Y.; Wang, Y.; Liu, Y.; Zhang, Y.; Zhang, Y. What factors affect the synergy and tradeoff between ecosystem services, and how, from a geospatial perspective? J. Clean. Prod. 2020, 257, 120454. [Google Scholar] [CrossRef]
  47. Wei, H.; Liu, H.; Xu, Z.; Ren, J.; Lu, N.; Fan, W.; Zhang, P.; Dong, X. Linking ecosystem services supply, social demand and human well-being in a typical mountain–oasis–desert area, Xinjiang, China. Ecosyst. Serv. 2018, 31, 44–57. [Google Scholar] [CrossRef]
  48. Wang, B.; Tang, H.; Zhang, Q.; Cui, F. Exploring connections among ecosystem services supply, demand and human well-being in a mountain-basin system, China. Int. J. Environ. Res. Public Health 2020, 17, 5309. [Google Scholar] [CrossRef]
  49. Su, R.; Duan, C.; Chen, B. The shift in the spatiotemporal relationship between supply and demand of ecosystem services and its drivers in China. J. Environ. Manag. 2024, 365, 121698. [Google Scholar] [CrossRef]
  50. Qi, F.; Liu, J.; Gao, H.; Fu, T.; Wang, F. Characteristics and spatial–temporal patterns of supply and demand of ecosystem services in the Taihang Mountains. Ecol. Indic. 2023, 147, 109932. [Google Scholar] [CrossRef]
  51. Li, J. Identification of ecosystem services supply and demand and driving factors in Taihu Lake Basin. Environ. Sci. Pollut. Res. 2022, 29, 29735–29745. [Google Scholar] [CrossRef]
  52. Yang, W.; Bai, Y.; Ali, M.; Huang, Z.; Yang, Z.; Zhou, Y. Quantifying the difference between supply and demand of ecosystem services at different spatial-temporal scales: A case study of the Taihu Lake Basin. Circ. Agric. Syst. 2023, 3, 5. [Google Scholar]
  53. Chen, F.; Li, L.; Niu, J.; Lin, A.; Chen, S.; Hao, L. Evaluating ecosystem services supply and demand dynamics and ecological zoning management in Wuhan, China. Int. J. Environ. Res. Public Health 2019, 16, 2332. [Google Scholar] [CrossRef] [PubMed]
  54. Sun, X.; Tang, H.; Yang, P.; Hu, G.; Liu, Z.; Wu, J. Spatiotemporal patterns and drivers of ecosystem service supply and demand across the conterminous United States: A multiscale analysis. Sci. Total Environ. 2020, 703, 135005. [Google Scholar] [CrossRef]
  55. Fotheringham, A.S.; Yang, W.; Kang, W. Multiscale geographically weighted regression (MGWR). Ann. Am. Assoc. Geogr. 2017, 107, 1247–1265. [Google Scholar] [CrossRef]
  56. Shabrina, Z.; Buyuklieva, B.; Ng, M.K.M. Short-term rental platform in the urban tourism context: A geographically weighted regression (GWR) and a multiscale GWR (MGWR) approaches. Geogr. Anal. 2021, 53, 686–707. [Google Scholar] [CrossRef]
  57. Zhao, H.; Li, C.; Gao, M. Investigation of the relationship between supply and demand of ecosystem services and the influencing factors in resource-based cities in China. Sustainability 2023, 15, 7397. [Google Scholar] [CrossRef]
  58. Wen, Y.; Li, H.; Zhang, X.; Li, T. Ecosystem services in Jiangsu province: Changes in the supply and demand patterns and its influencing factors. Front. Environ. Sci. 2022, 10, 931735. [Google Scholar]
  59. Xie, Y.; Dai, W.; Xiang, S.; Deng, H.; Wang, Z.; Li, Y.; Wang, Z.; Zhou, M.; Gao, M. Supply and demand of ecosystem services and their interaction with urbanization: The case of Chengdu-Chongqing urban agglomeration. Urban Clim. 2024, 55, 101978. [Google Scholar] [CrossRef]
  60. Yu, T.; Bao, A.; Xu, W.; Guo, H.; Jiang, L.; Zheng, G.; Yuan, Y.; Nzabarinda, V. Exploring variability in landscape ecological risk and quantifying its driving factors in the Amu Darya Delta. Int. J. Environ. Res. Public Health 2020, 17, 79. [Google Scholar] [CrossRef]
  61. Liang, T.; Yang, F.; Huang, D.; Luo, Y.; Wu, Y.; Wen, C. Land-use transformation and landscape ecological risk assessment in the Three Gorges Reservoir region based on the “production–living–ecological space”. Perspective. Land 2022, 11, 1234. [Google Scholar] [CrossRef]
  62. Fan, S.; Yan, M.; Yu, L.; Chen, B.; Zhang, L. Integrating ecosystem service supply–demand and ecological risk assessment for urban planning: A case study in Beijing, China. Ecol. Indic. 2024, 161, 111950. [Google Scholar] [CrossRef]
  63. Wu, A.; Zhang, J.; Zhao, Y.; Shen, H.; Guo, X. Simulation and Optimization of Supply and Demand Pattern of Multiobjective Ecosystem Services—A Case Study of the Beijing-Tianjin-Hebei Region. Sustainability 2022, 14, 2658. [Google Scholar] [CrossRef]
  64. Wang, W.; Wu, T.; Li, Y.; Zheng, H.; Ouyang, Z. Matching ecosystem services supply and demand through land use optimization: A study of the Guangdong-Hong Kong-Macao megacity. Int. J. Environ. Res. Public Health 2021, 18, 2324. [Google Scholar] [CrossRef] [PubMed]
  65. Wu, X.; Wang, S.; Fu, B.; Liu, Y.; Zhu, Y. Land use optimization based on ecosystem service assessment: A case study in the Yanhe watershed. Land Use Policy 2018, 72, 303–312. [Google Scholar] [CrossRef]
  66. Ma, S.; Wen, Z. Optimization of land use structure to balance economic benefits and ecosystem services under uncertainties: A case study in Wuhan, China. J. Clean. Prod. 2021, 311, 127537. [Google Scholar] [CrossRef]
  67. Zhang, Z.; Shen, Z.; Liu, L.; Zhang, Y.; Yu, C.; Cui, L.; Gao, Y. Integrating ecosystem services conservation into the optimization of urban planning policies in eco-fragile areas: A scenario-based case study. Cities 2023, 134, 104200. [Google Scholar]
  68. Li, Z.; Cheng, X.; Han, H. Future impacts of land use change on ecosystem services under different scenarios in the ecological conservation area, Beijing, China. Forests 2020, 11, 584. [Google Scholar] [CrossRef]
  69. Escobedo, F.J.; Giannico, V.; Jim, C.Y.; Sanesi, G.; Lafortezza, R. Urban forests, ecosystem services, green infrastructure and nature-based solutions: Nexus or evolving metaphors? Urban For. Urban Green. 2019, 37, 3–12. [Google Scholar]
  70. Lovell, S.T.; Taylor, J.R. Supplying urban ecosystem services through multifunctional green infrastructure in the United States. Landsc. Ecol. 2013, 28, 1447–1463. [Google Scholar]
  71. Gao, X.; Shen, J.; He, W.; Sun, F.; Zhang, Z.; Zhang, X.; Zhang, C.; Kong, Y.; An, M.; Yuan, L. Changes in ecosystem services value and establishment of watershed ecological compensation standards. Int. J. Environ. Res. Public Health 2019, 16, 2951. [Google Scholar] [CrossRef]
  72. Yu, H.; Chen, C.; Shao, C. Spatial and temporal changes in ecosystem service driven by ecological compensation in the Xin’an River Basin, China. Ecol. Indic. 2023, 146, 109798. [Google Scholar] [CrossRef]
Figure 1. Geographic location of the research area.
Land 14 00661 g001
Figure 2. Spatiotemporal distributions of the ESSD in Huainan City (FP-S: Food production services supply; FP-D: Food production services demand; CS-S: Carbon sequestration services supply; CS-D: Carbon sequestration services demand; RS-S: Recreation services supply; RS-D: Recreation services demand; Com-S: Comprehensive supply; Com-D: Comprehensive demand).
Land 14 00661 g002
Figure 3. Spatiotemporal distribution of the SDI in Huainan City (FPs: food production services; CSs: carbon sequestration services; RSs: recreation services; Com: comprehensive).
Land 14 00661 g003
Figure 4. Geo-Detector analysis results.
Land 14 00661 g004
Figure 5. MGWR Analysis results.
Land 14 00661 g005
Figure 6. Spatial distributions of the driving factors in the study area.
Land 14 00661 g006
Figure 7. Land use map of Huainan City.(Figures a-1, b-1, c-1, a-2, b-2, c-2, a-3, b-3, and c-3 are the detail magnification images of Figures (a), (b), and (c), respectively.)
Land 14 00661 g007
Table 1. Data Sources and Resolution.
DataSourceTimeSpatial
Resolution
NDVINational Ecosystem Science Data Center (http://www.nesdc.org.cn/, accessed on 2 August2024)2010 and 202030 m
Land useResource and Environmental Science Data Platform (http://www.resdc.cn/DOI, accessed on 3 August 2024)2010 and 202030 m
DEMGeospatial Data Cloud (http://www.gscloud.cn/, accessed on 6 August 2024)200930 m
Nighttime light dataResource and Environmental Science Data Platform (http://www.resdc.cn/DOI, accessed on 3 August 2024)2010 and 20200.008 degree and 0.004 degree
Economic and social dataChina County Statistical Yearbook and Huainan Statistical Yearbook (https://data.cnki.net/, accessed on 11 July 2024)
Bulletin of National Economic and Social Development Statistics and Seventh National Population Census Bulletin (https://www.huainan.gov.cn/, accessed on 11 July 2024)
2010 and 2020/
Table 2. Supply and Demand Matrix of the RS in Huainan City.
Cultivated LandForest LandGrasslandWater BodiesConstruction Land
Supply15450
Demand20004
Table 3. Factors driving the ESSD relationships.
Categories FactorsSignificance
Natural Factorsx1ElevationHeight of the ground above the sea level
x2SlopeThe steepness of the terrain
x3PrecipitationMean annual rainfall amounts
x4TemperatureMean annual temperatures
Social
Factors
x5PopulationThe number of permanent residents within the units
x6Gross domestic product (GDP)The economic development status of the units
x7Cultivated land areaThe scale of the cultivated land within the units
x8Construction land areaThe scale of the construction land within the units
x9Ecological land areaThe scale of ecological land within the units
Disclaimer/Publisher’s Note: The statements, opinions and data contained in all publications are solely those of the individual author(s) and contributor(s) and not of MDPI and/or the editor(s). MDPI and/or the editor(s) disclaim responsibility for any injury to people or property resulting from any ideas, methods, instructions or products referred to in the content.

