Article

Influence of Tree Community Characteristics on Carbon Sinks in Urban Parks: A Case Study of Xinyang, China

1
International Union Laboratory of Landscape Architecture, College of Landscape Architecture and Art, Henan Agricultural University, Zhengzhou 450002, China
2
College of Tourism, Xinyang Normal University, Xinyang 464000, China
3
MOE Key Laboratory of Tibetan Plateau Land Surface Processes and Ecological Conservation, School of the Geographical Science, Qinghai Normal University, Xining 810016, China
*
Authors to whom correspondence should be addressed.
Land 2025, 14(3), 653; https://doi.org/10.3390/land14030653
Submission received: 7 February 2025 / Revised: 12 March 2025 / Accepted: 17 March 2025 / Published: 19 March 2025
(This article belongs to the Section Landscape Ecology)

Abstract

:
Cities are major contributors to global carbon emissions; however, urban parks offer substantial potential for carbon sinks. Research on factors influencing carbon capture in urban park vegetation is still limited. This study investigates 81 urban parks in Xinyang, Henan Province, to quantify woody plant carbon storage (CS) and sequestration (CSG). By surveying all vegetation types and quantities in these parks, along with factors like park attributes, community structure, biodiversity, spatial distribution, woody plant connectivity, and spatial complexity, we create statistical models for CS and CSG. The results indicate that the average carbon storage density (CSD) in Xinyang’s urban parks is 4.01 kg/m2, while the carbon sequestration density (CSGD) is 0.39 kg·C·m2·yr−1. The dominant tree species are Ligustrum lucidum, Osmanthus fragrans, and Lagerstroemia indica, while species with higher carbon sequestration potential, such as Glyptostrobus pensilis, Populus deltoides, and Albizia kalkora, reveal a discrepancy between common and high-sequestration species. The study shows that park characteristics, community structure, and biodiversity are key factors impacting urban carbon sink capacity. By analyzing the relationship between these factors and carbon sinks in urban park vegetation, we create a comprehensive framework for assessing tree CS and CSG, offering quantitative support to improve carbon capture in urban parks.

Graphical Abstract

1. Introduction

Since the Industrial Revolution, global urbanization has accelerated, bringing profound socio-economic changes. However, rapid urbanization has also led to numerous environmental and social challenges [1,2]. A United Nations report indicates that by 2018, the global extent of urban areas with impervious surfaces had reached 797,076 km2, 2.5 times the corresponding area in 1990 [3]. By 2030, the global urban land area is projected to expand to 1.2 million km2, tripling its size compared to 2000 [4]. By 2050, the global urban population is projected to reach 6 billion [5]. Population growth and urban expansion are expected to significantly increase carbon emissions from urban activities, contributing about 71% of energy-related CO2 emissions [6]. Amid global warming, the role of carbon sinks has become increasingly crucial as a key strategy for mitigating climate change. Low-carbon city initiatives have been actively promoted in China in recent years, seeing initial success with pilot policies and green space expansion. The green transition in low-carbon cities significantly impacts carbon reduction, urban ecosystem restoration, and sustainable development [7,8].
As the environmental challenges of urbanization and climate change intensify, the carbon sink function of urban green spaces is garnering significant attention [9]. Urban green spaces convert atmospheric carbon into solid forms through photosynthesis, aiding CSG. Different types of green spaces have varying CSG capacities, with parks playing a key role due to their diverse plant communities and complex spatial layouts. Parks not only surpass other urban green spaces in total CS but also provide greater ecological stability and long-term carbon retention due to their multilayered vegetation. For instance, research in Muscat Province showed that above-ground CS was highest in parks and gardens, while roadside greenery stored less carbon [10]. Similarly, Strohbach et al. demonstrated through life-cycle analysis that parks outperform other greenery types, such as street and residential greenery, with regard to CS and CSG benefits [11].
Research indicates that woody plants in urban green spaces significantly contribute to CS and play vital ecological roles [12,13], including improving air quality, reducing temperatures, and enhancing biodiversity. Tree structural characteristics, such as height, crown width, and community diversity, substantially influence CS. Liu et al. found that forests with higher tree species richness had greater carbon stocks, particularly in above-ground tree biomass, soil, and root carbon [14]. Meanwhile, a 30-year study in Japan showed that multi-species afforestation strategies can improve forest biomass production and carbon sequestration [15]. Factors such as species selection, planting density, and spatial arrangement also influence CS benefits [16]. Lin et al. demonstrated that a rational spatial structure and configuration in urban tree-covered areas enhance CSG benefits [17]. For example, the “pocket forest” method, which involves densely planting diverse native species in small areas, achieved rapid and efficient CS and CSG [18]. To precisely quantify and assess CS characteristics in urban green spaces, researchers have widely employed remote sensing and LiDAR technology, which provide essential means for the large-scale, rapid acquisition of vegetation spatial distribution and biomass data [9,19,20,21,22]. Research on how community structure and tree distribution patterns contribute to CSG efficiency remains limited. Most studies on woody plant CSG focus on single factors, with limited research on interactions between spatial distribution, structural traits, and biodiversity. Furthermore, most existing studies focus on CS, with relatively fewer studies on CSG rates. Finally, remote sensing and LiDAR technologies face limitations in accurately reflecting vegetation carbon density, especially in multi-layered canopy structures due to data processing complexities.
This study focuses on urban parks in Xinyang’s built-up areas. The current carbon sequestration status in these parks and green spaces was quantified through on-site surveys to obtain GPS coordinates of each tree, combined with remote sensing images, i-Tree6.1.55 models, GIS10.7, and other software. Additionally, this study evaluates the relationship between park characteristics, community structure, spatial distribution, connectivity, and CS and CSG. The objectives are to (1) develop a comprehensive framework for evaluating relationships among park attributes, community growth, spatial patterns, and CS/CSG, providing model support for carbon sink research; (2) determine the current status and spatial characteristics of CS and CSG in Xinyang’s urban parks; and (3) explore strategies for enhancing CS and CSG through management and regulation. This research aims to provide scientific support for carbon sink assessment and offer recommendations for effective low-carbon urban development.

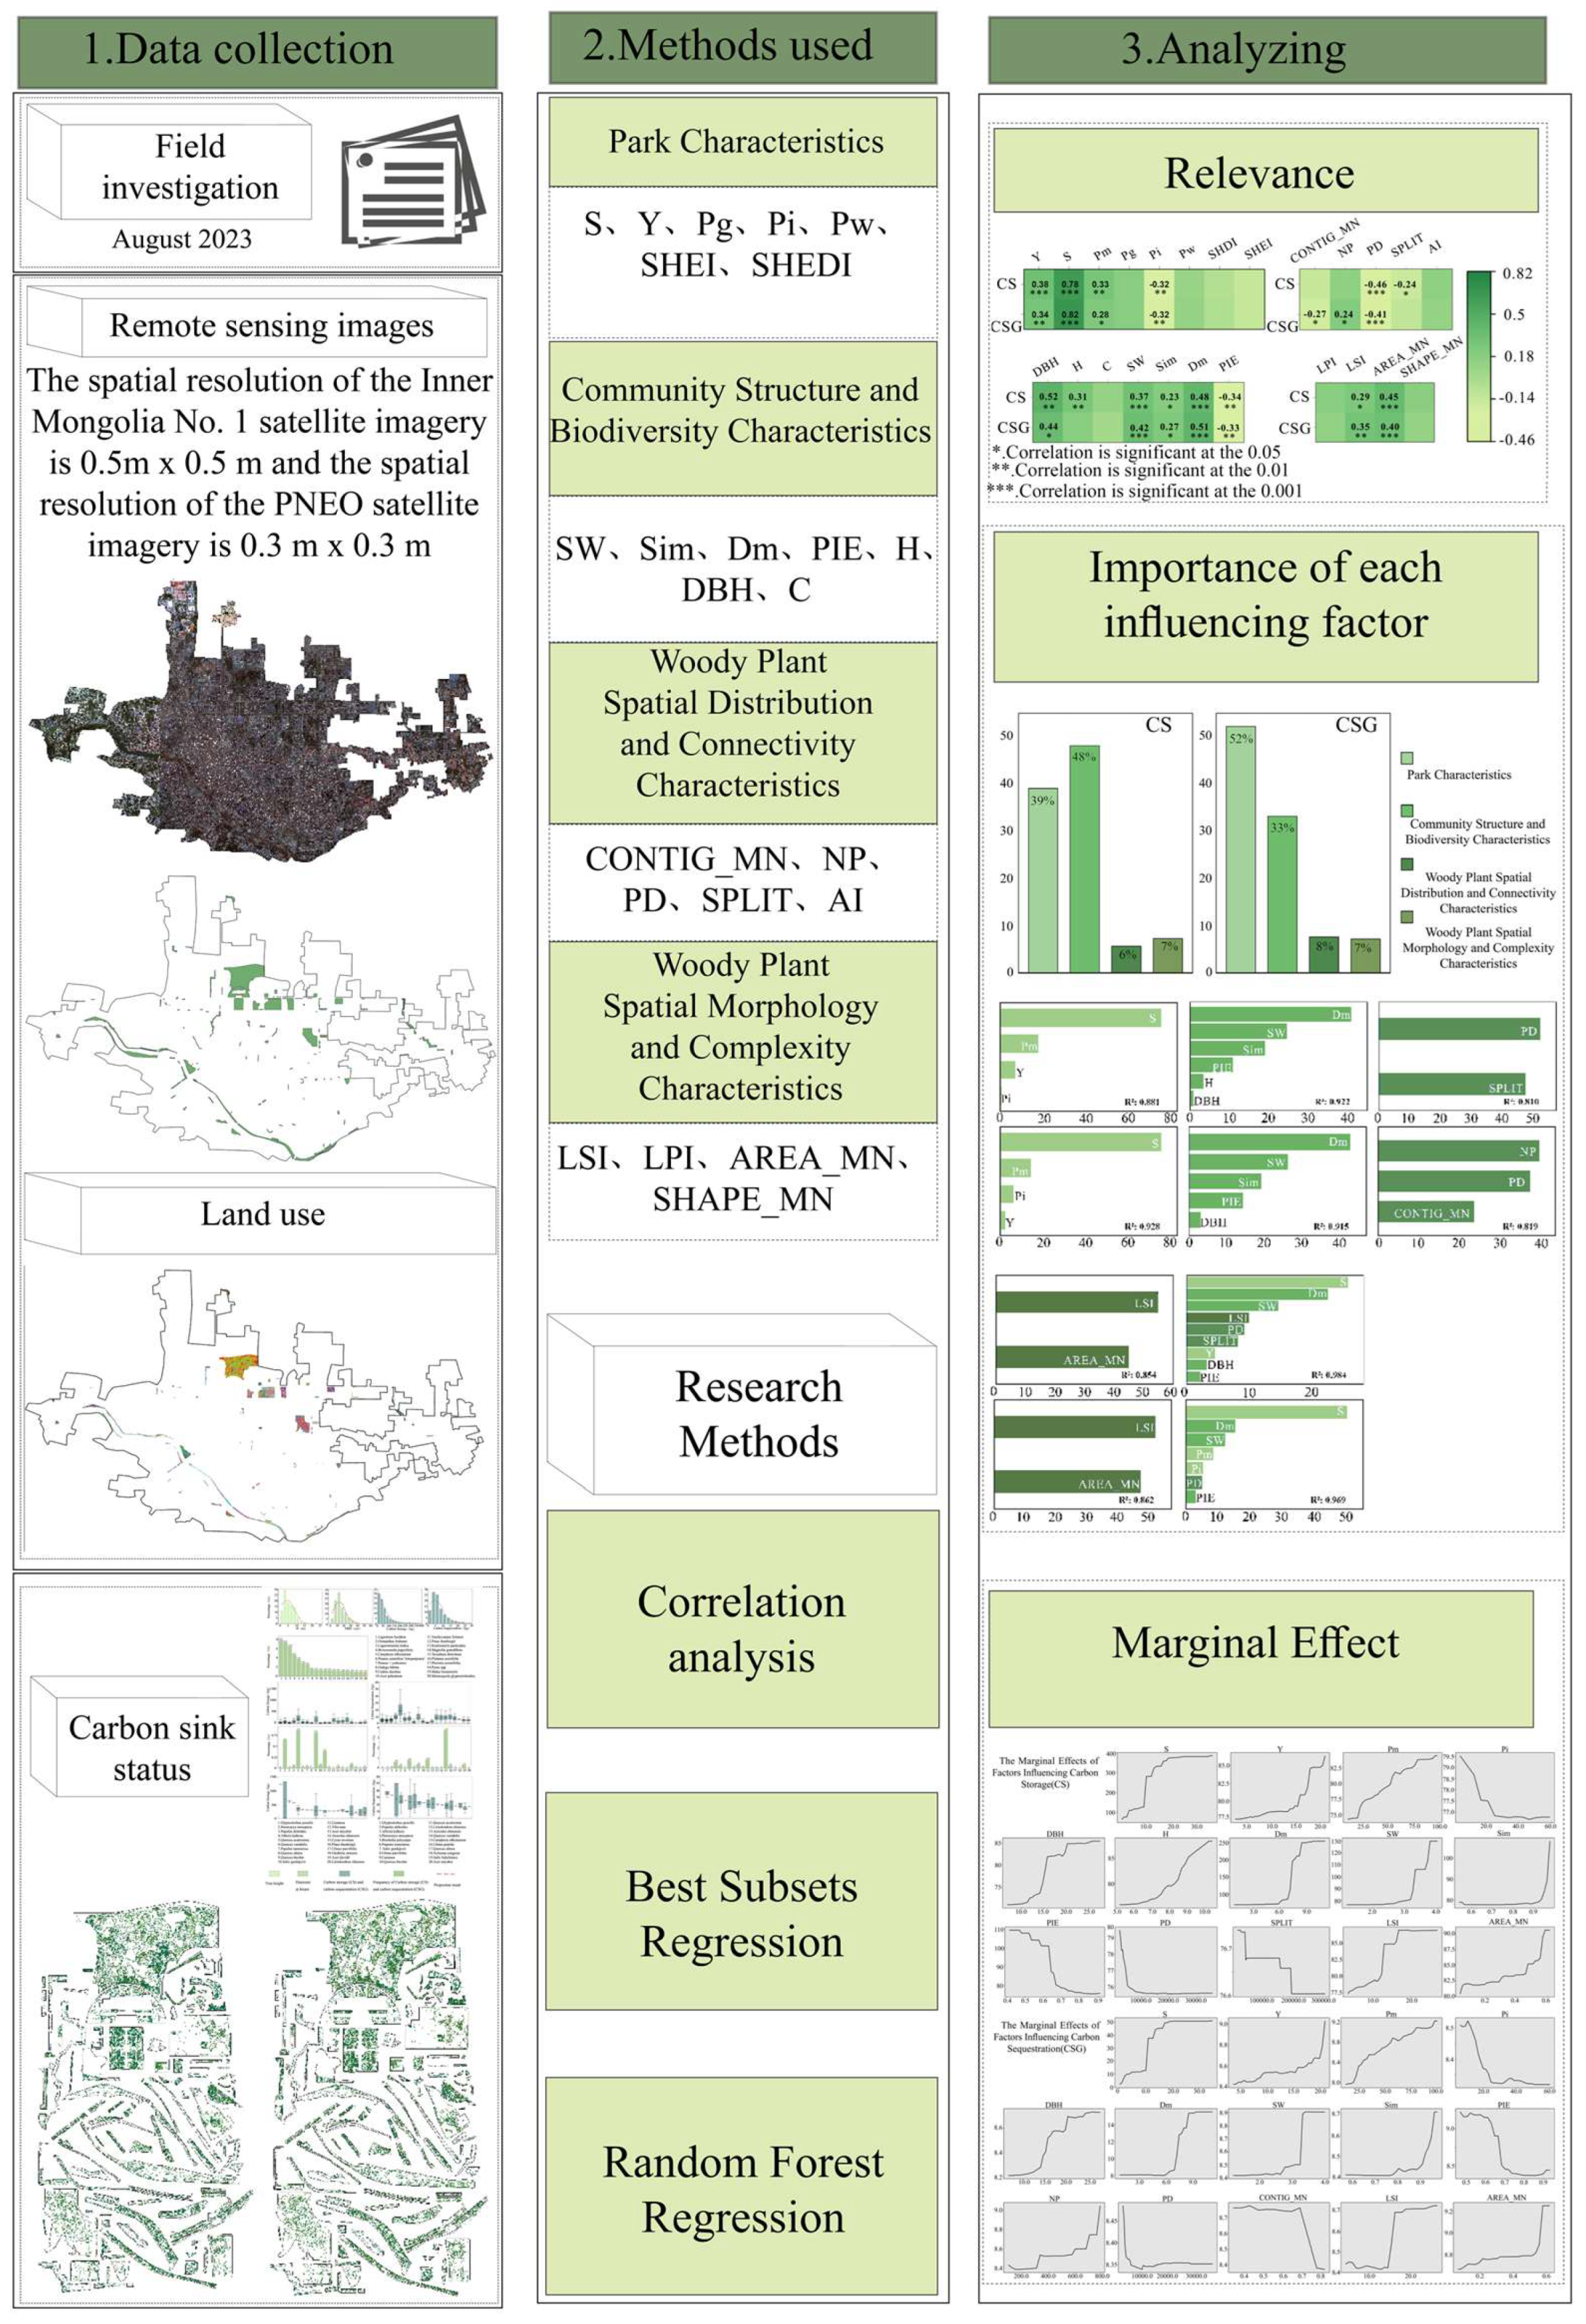
2. Materials and Methods

2.1. Study Area

Xinyang spans a longitude of 114°01′–114°06′ E and a latitude of 31°46′–31°52′ N, with a built-up area of 107.28 km2. Located in a transition zone between subtropical and warm temperate regions, it has a monsoon climate, has an average annual temperature of 15.2 °C, and receives 1300 mm of rainfall per year [23]. By late 2022, Xinyang’s permanent population was 6.166 million, with 3.192 million in urban areas and 2.975 million in rural regions. The urbanization rate reached 51.76%, up 0.62 percentage points from the previous year. The per capita urban park green space is 15.25 m2 (Figure 1a–d).

2.2. Research Methods

This study utilized multi-source data analysis, starting with preprocessing remote sensing imagery and field survey data to extract vegetation information for CS and CSG. To investigate factors affecting CS and CSG, variables such as park age, vegetation structure, spatial characteristics, and coverage were considered. Key factors were selected in four areas: park attributes, community structure and biodiversity, spatial distribution and connectivity of woody plants, and spatial morphology and complexity of woody plants. We conducted correlation analyses of CS, CSG, and influencing factors to eliminate extraneous variables, followed by optimal subset regression to identify key factors. A random forest regression model was then used to analyze factor contributions to CS and CSG, revealing non-linear relationships and marginal effects of key factors. This study used the “RandomForest” package in R to implement the random forest model. Proposed by Breiman, this model combines ensemble algorithms and random subspace methods. This decision-tree-based algorithm isolates the effects of specific factors on CS and CSG while controlling for other variables. This model has been employed extensively in the field of ecological research [24,25,26]. The following provides a flowchart of the steps in this study and a detailed description of each step. (Figure 2).

2.2.1. Field Surveys

This study’s field surveys were conducted between August and September 2023, comprehensively cataloging vegetation species within the study area. During the survey, data on green space area, establishment date, and detailed information about woody plants in each park, including the location, diameter at breast height (DBH), crown width (C), branching points (g), and tree height (H), were collected using equipment such as forestry stadiometers (Harbin Optical Instrument Co., Ltd., Harbin, China), handheld GPS locators (Heng Yi Li Co., Ltd., Beijing, China), diameter tapes, and tape measures (Weiteng Measuring Tools Co., Ltd., Shanghai, China). All tools are made in China. Additionally, species distribution maps were created (Figure S1, Supporting Information), providing precise spatial data to support subsequent analyses (Figure 1e–g).

2.2.2. Estimation of CS and CSG

In this study, the CS and CSG of woody plants in park green spaces were calculated as the sum of the CS and CSG of trees and shrubs. The detailed formulas are as follows:
C S i = C S i + C s h i
C G i = C g i + C g h i
Here, C S i represents the CS of park i and C G i represents the CSG of park i. C S i is the CS of trees in park i, C s h i is the CS of shrubs in park i, C g i is the CSG of trees in park i, and C g h i is the CSG of shrubs in park i.
The CS and CSG of the tree layer were calculated using the i-Tree Eco model, while the shrub layer’s CS and CSG were estimated using an allometric growth model. The i-Tree Eco model, created by the U.S. Forest Service, was formulated to evaluate the ecological contributions of urban forests. This model uses forest stand data and biomass equations to estimate tree biomass. By incorporating data such as H, DBH, and C, the model enables the precise calculation of CS and CSG in urban green spaces, enhancing the scientific validity and reliability of carbon storage estimates compared to traditional remote sensing and sampling methods [27,28,29]. The formulas for calculating CS and CSG in the i-Tree Eco model are as follows:
C = a D b
Here, D represents the tree’s diameter at breast height, and a and b are species-specific coefficients.
The allometric growth model for biomass has been a significant focus in ecological research, aiding in the understanding of relationships between biomass and plant characteristics. Initially proposed by American scholars, this model was developed to establish allometric relationships between roots, stems, and leaves and has been proven to offer strong predictive capability [30,31,32,33]. However, traditional biomass models have shown lower accuracy in estimating the biomass of multi-stemmed or small woody plants [34]. Conti et al. (2018) developed a biomass model based on 118 shrub species across 49 regions worldwide, enabling more accurate biomass estimates for multi-stemmed woody plants [35]. The equation used to determine shrub biomass (B) is expressed as follows:
B = e 370 + 1.903 l n C + 0.652 l n H × 1.403               g 0 e 2.474 l n D 2.575 × 1.0787     0 < g 10 e ( 2.281 + 1.525 l n D + 0.831 l n C + 0.523 l n H ) 10 < g 130
Here, g represents the branching point height (cm), D is the basal stem diameter of the shrub (cm), C is the average crown diameter of the shrub (m), and H is the height of the shrub (cm).
In this study, the aboveground biomass of shrubs was estimated using an allometric growth model, with CS derived by multiplying the biomass by a carbon conversion factor of 0.5. The equation used to compute shrub CS is presented as follows:
C s h = B × 0.5
The CSG of shrubs was calculated based on tree data. Specifically, first, the CS and CSG of trees were calculated by the i-Tree Eco model. Conversion coefficients were then derived by calculating the ratio of CS to CSG for each tree family. The shrub CS was multiplied by the corresponding tree family’s conversion coefficient to estimate shrub CSG. If no matching coefficient was available for a shrub family, an average tree conversion coefficient was used (Table 1). The equation for calculating shrub CSG is defined as follows:
F f = C s f C g f  
C g h = C s h i F f
Here, C s f represents the total CS of trees in family f, C g f is the total CSG of trees in family f, C g h denotes the CSG of shrub species i in family f, C s h i is the CS of shrub species i, and F f is the conversion coefficient between CS and CSG for shrubs in a family.
This study excluded the carbon sequestration contribution of herbaceous plants, mainly due to data availability limitations and the focus of the study on the carbon sequestration effect of trees and shrubs. The carbon sequestration capacity of woody plants and herbaceous plants has its own advantages in different ecosystems. Woody plants usually dominate large-scale carbon sequestration due to their large biomass and long-term carbon storage capacity [36].

2.2.3. Processing of Satellite Images

This study utilized optical sensors from the PNEO satellite, launched in April 2021, and the Inner Mongolia-1 satellite, launched in July 2021. The PNEO satellite provides panchromatic imagery with a spatial resolution of 0.3 m and multispectral imagery with a resolution of 1.2 m. The Inner Mongolia-1 satellite delivers panchromatic data at a resolution of 0.5 m and multispectral data at 2 m. Remote sensing imagery for this study was obtained from the PNEO satellite on 29 May 2023 and the Inner Mongolia-1 satellite on 18 August 2023. The imagery was processed in ENVI5.2 software, including radiometric calibration, atmospheric correction, and geometric correction. These steps improved image quality and accuracy, establishing a robust data foundation for subsequent analysis.
Land cover types in park green spaces were classified using the maximum likelihood supervised classification method. This was refined through visual interpretation based on Google Maps imagery from September 2023. The final land cover types were categorized into five classes: woody vegetation, herbaceous vegetation, water bodies, impervious surfaces, and bare soil.

2.2.4. Selection of Influencing Factors

Based on relevant research and the specific conditions of the study area, this study selected factors including 8 park attributes, 7 community structure and biodiversity characteristics, 5 spatial distribution and connectivity characteristics of woody plants, and 4 spatial morphology and complexity characteristics of woody plants. Some indicators within park attributes and community structure and biodiversity characteristics were obtained from field survey data. The remaining indicators were derived from land use classification data extracted from satellite imagery and analyzed quantitatively for each park’s green space using Fragstats4.3 software (Table 2).

3. Results

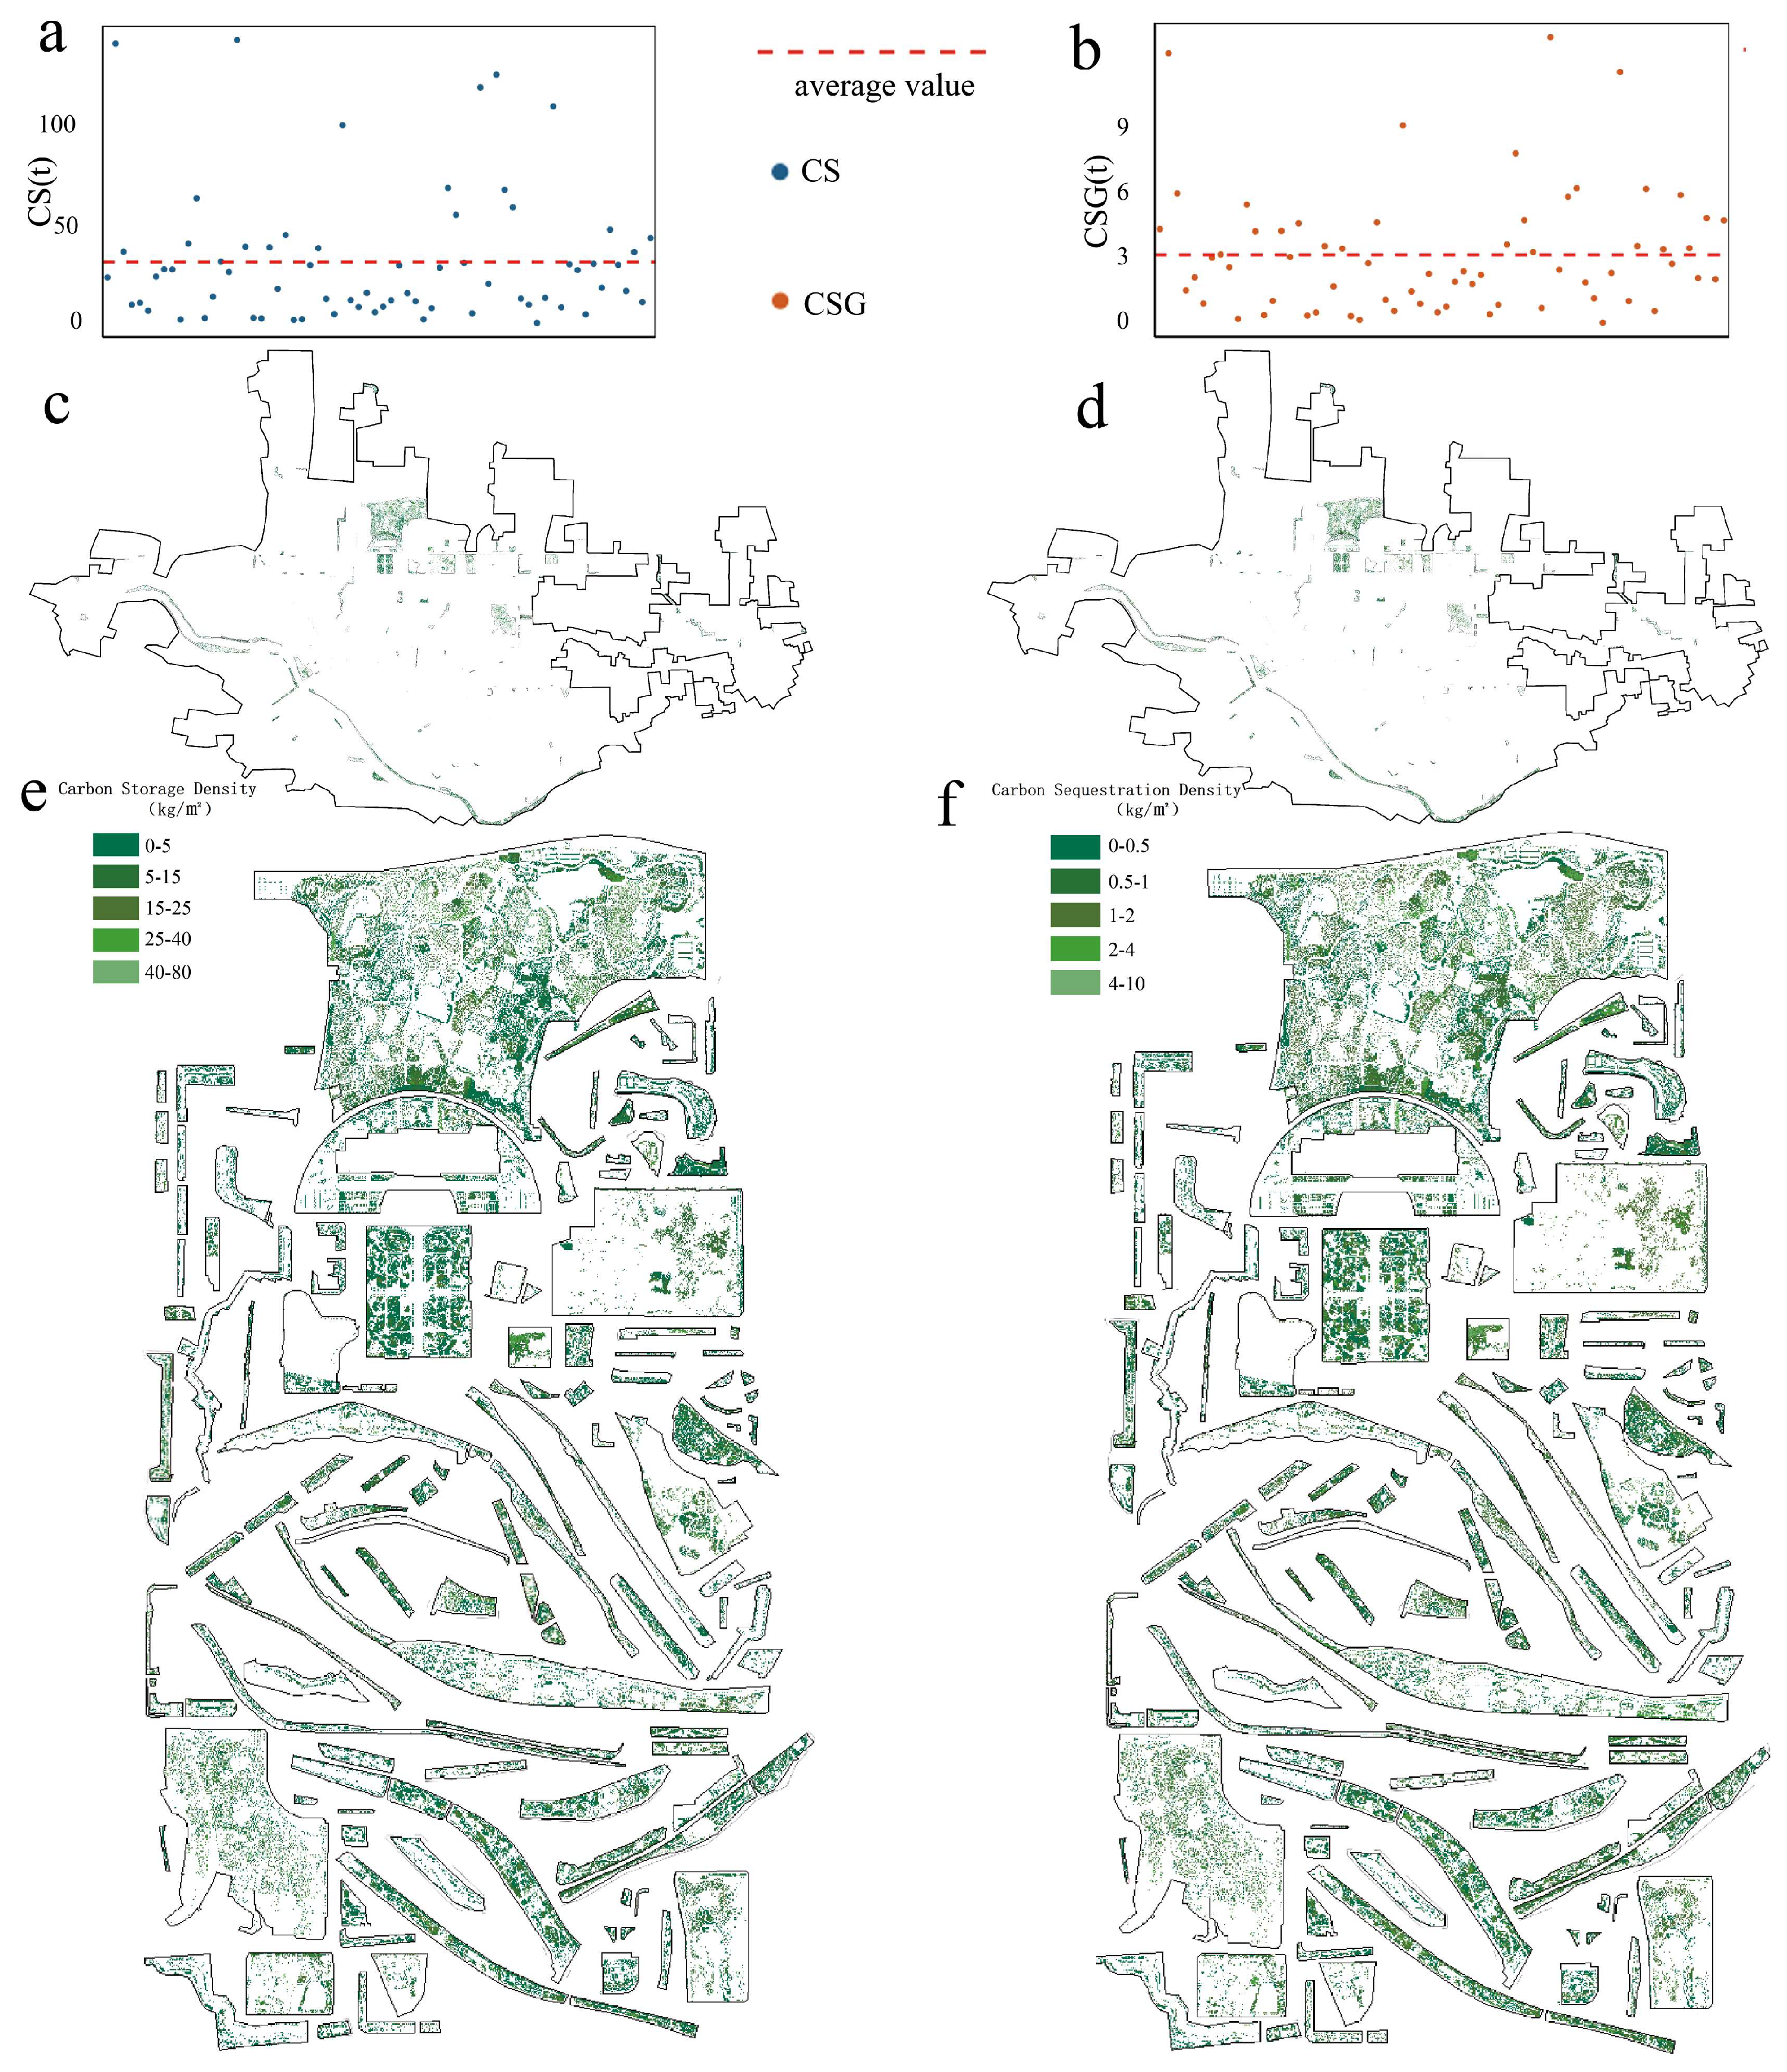
3.1. Overview of CS and CSG in Park Green Spaces

The 81 park green spaces in Xinyang’s built-up area span approximately 2.68 square kilometers, with a total CS of 10.78 Gg and total CSG of 1.05 Gg (detailed in Table S1, Supporting Information). The average CSD and CSGD are 4.01 kg/m2 and 0.39 kg·C·m2·yr−1, respectively. Most parks are located in the northern built-up area and along both sides of the water bodies in the south (Figure 3). Significant variations in CS and CSG across the parks indicate substantial potential for enhancing their carbon sink capacity.

3.2. Characterization of CS and CSG by Woody Plants in Park Green Spaces

Field surveys identified 189,401 woody plants from 328 species in the green spaces of Xinyang’s urbanized parks. In terms of H, 90.9% of vegetation was under 10 m. The 2–4 m range was most common (29.5%), followed by 4–6 m (18%), 6–8 m (16.8%), 8–10 m (14.8%), and 0–2 m (11.8%). Most plants have a DBH of less than 30 cm. The 10–15 cm range was most prevalent (32%), followed by 5–10 cm (24.8%) and 15–20 cm (16.4%). For CSG, most woody plants fell in the 2.5–7.5 kg range, accounting for 52.3% of the total. Plants in the 0–2.5 kg and 7.5–10 kg ranges constituted 11.8% and 12.8%, respectively, with plant proportions decreasing as CSG increased. CS proportions also declined with increasing values. The 0–25 kg range was most common, followed by 25–50 kg (30.9%), 50–75 kg (24.8%), and 75–100 kg (16%). Overall, 79.5% of plants had CS values between 0 and 100 kg (Figure 4a–d). The dominant woody species in Xinyang’s urban parks were Ligustrum lucidum, Osmanthus fragrans, Lagerstroemia indica, Broussonetia papyrifera, and Camphora officinarum, comprising 7.93%, 7.45%, 6.54%, 4.68%, and 3.77% of the total, while the 20 most common species accounted for 51.57% of the total (Figure 4e–g).
In Xinyang, Glyptostrobus pensilis, Pterocarya stenoptera, and Populus deltoides had the highest average CS, with the top 20 species for average CS accounting for 3.24% of the total (Figure 4h,j). Meanwhile, Glyptostrobus pensilis, Populus deltoides, and Albizia kalkora had the highest average CSG, with the top 20 species for average CSG comprising 7.89% of the total (Figure 4i,k). The top 20 species with the highest average CS and CSG were similar, but among the most common species, those with the highest averages constituted only a small proportion.

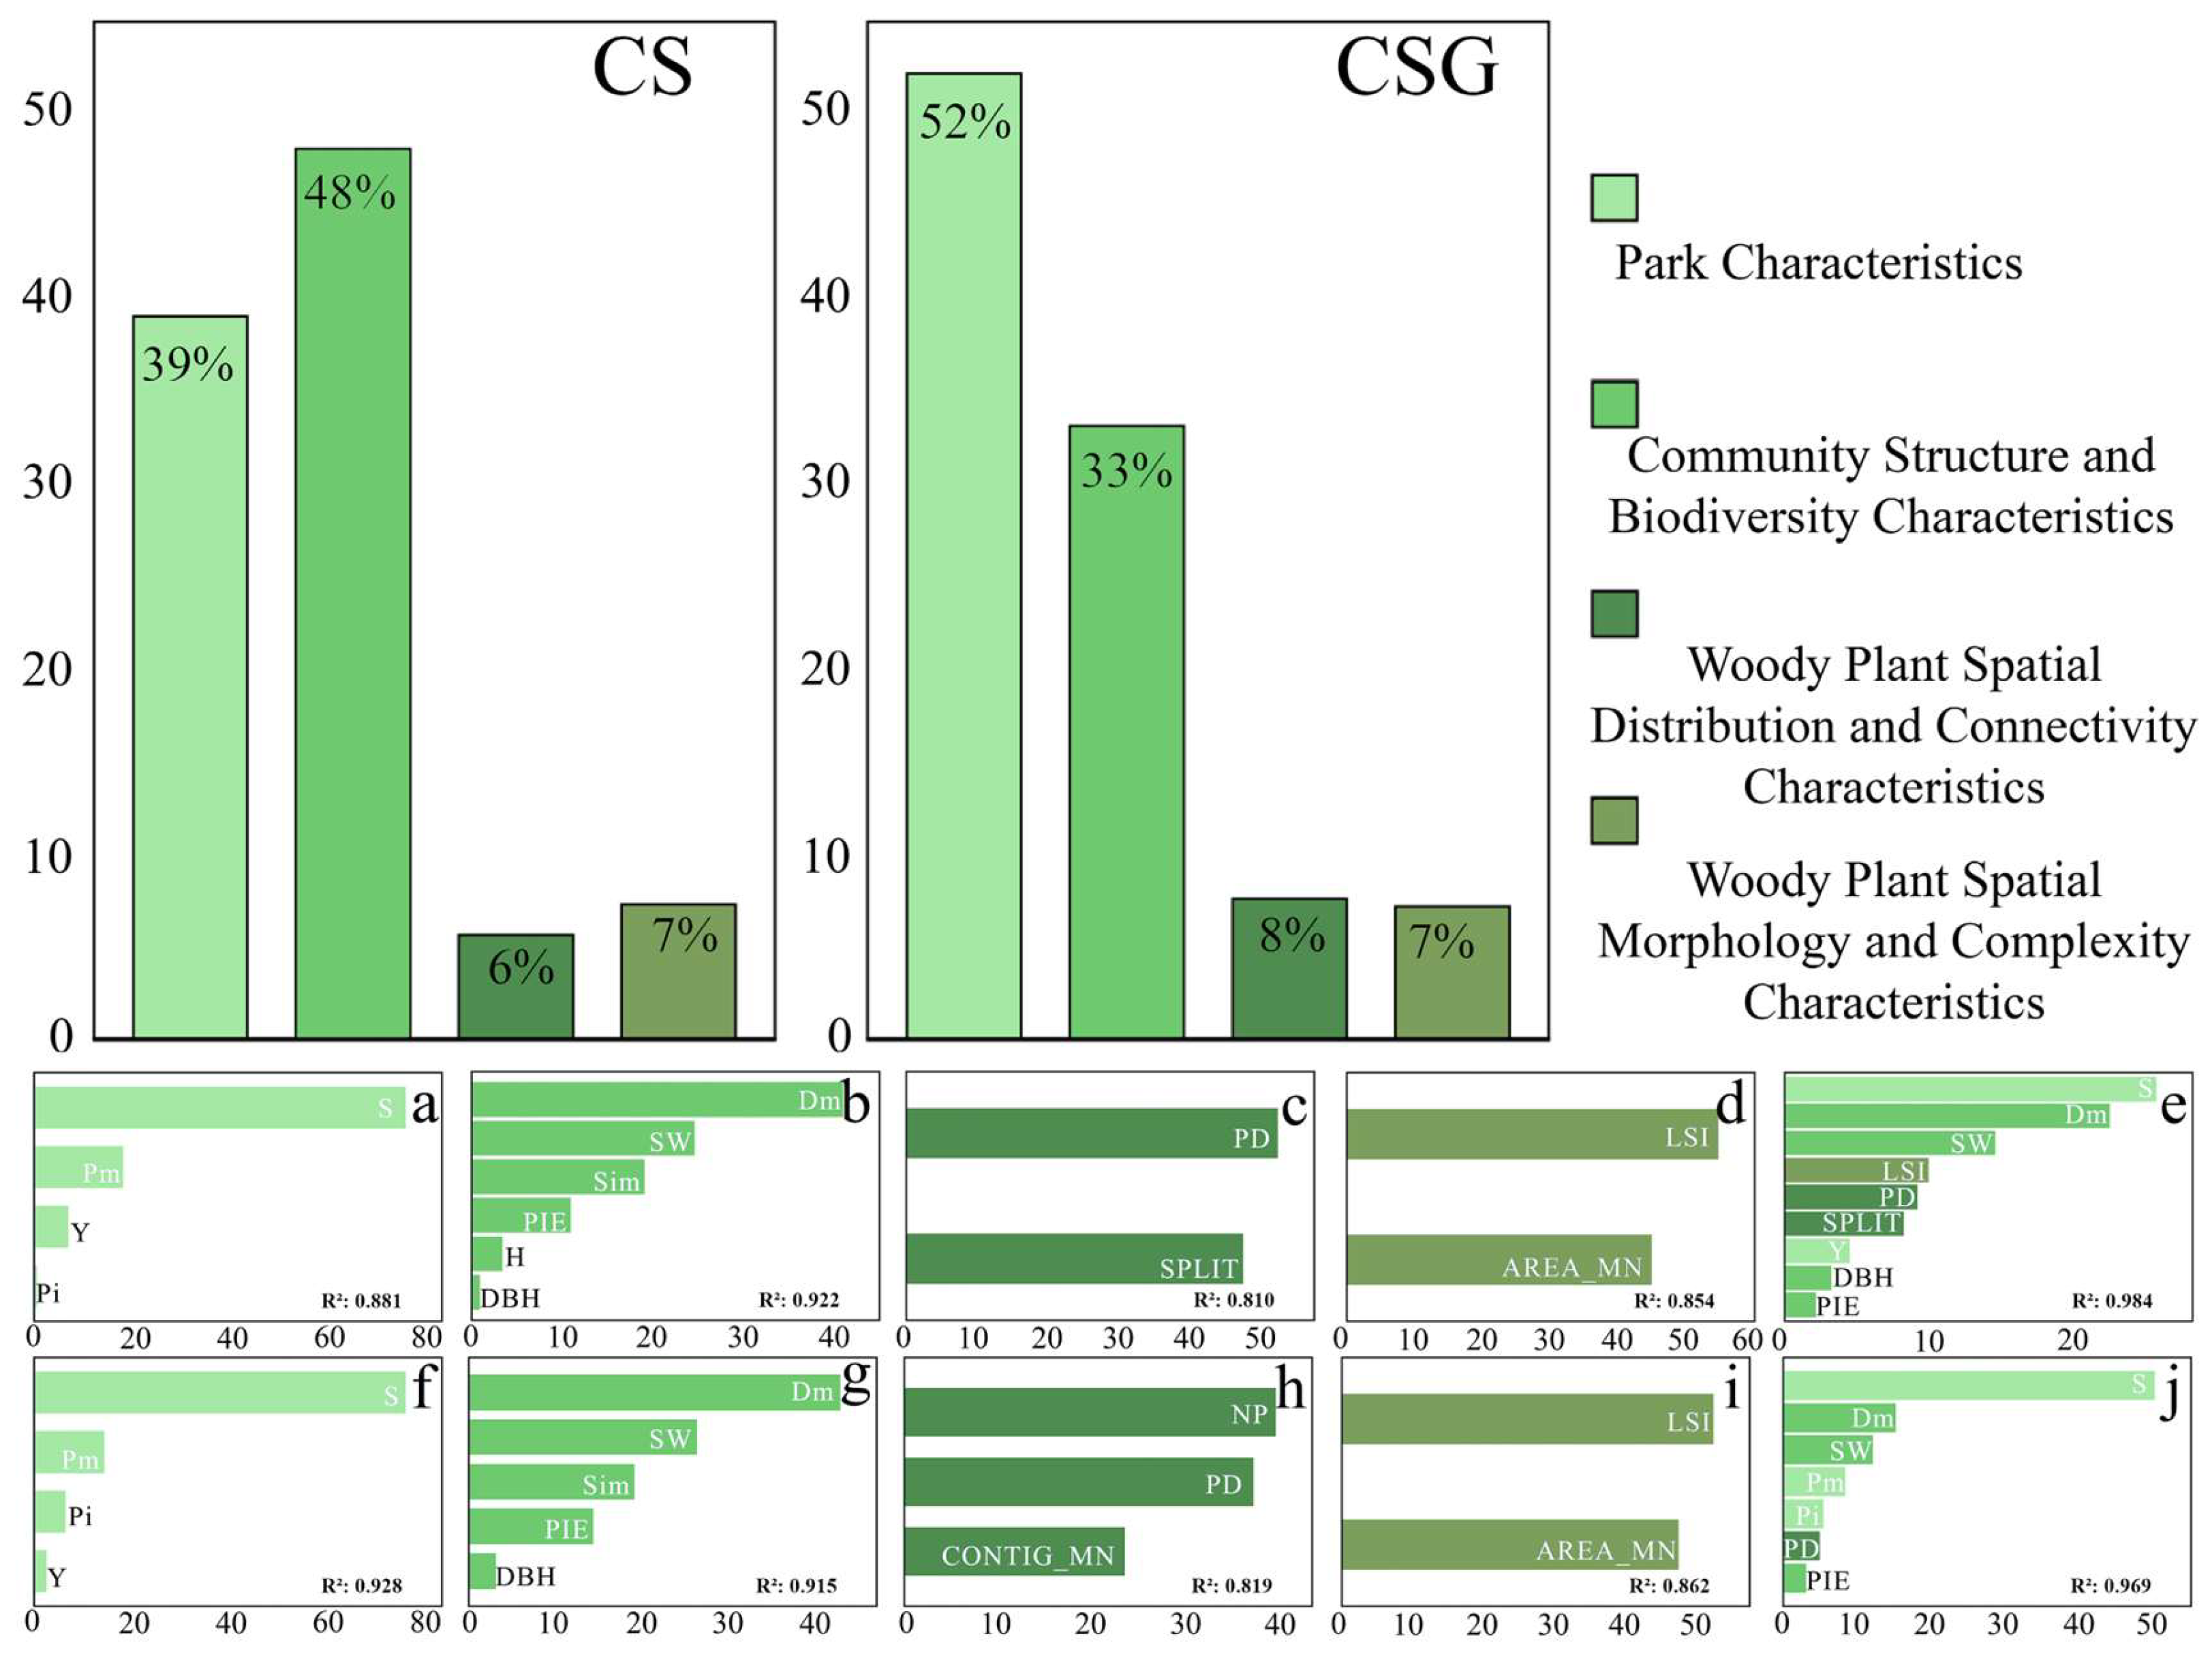
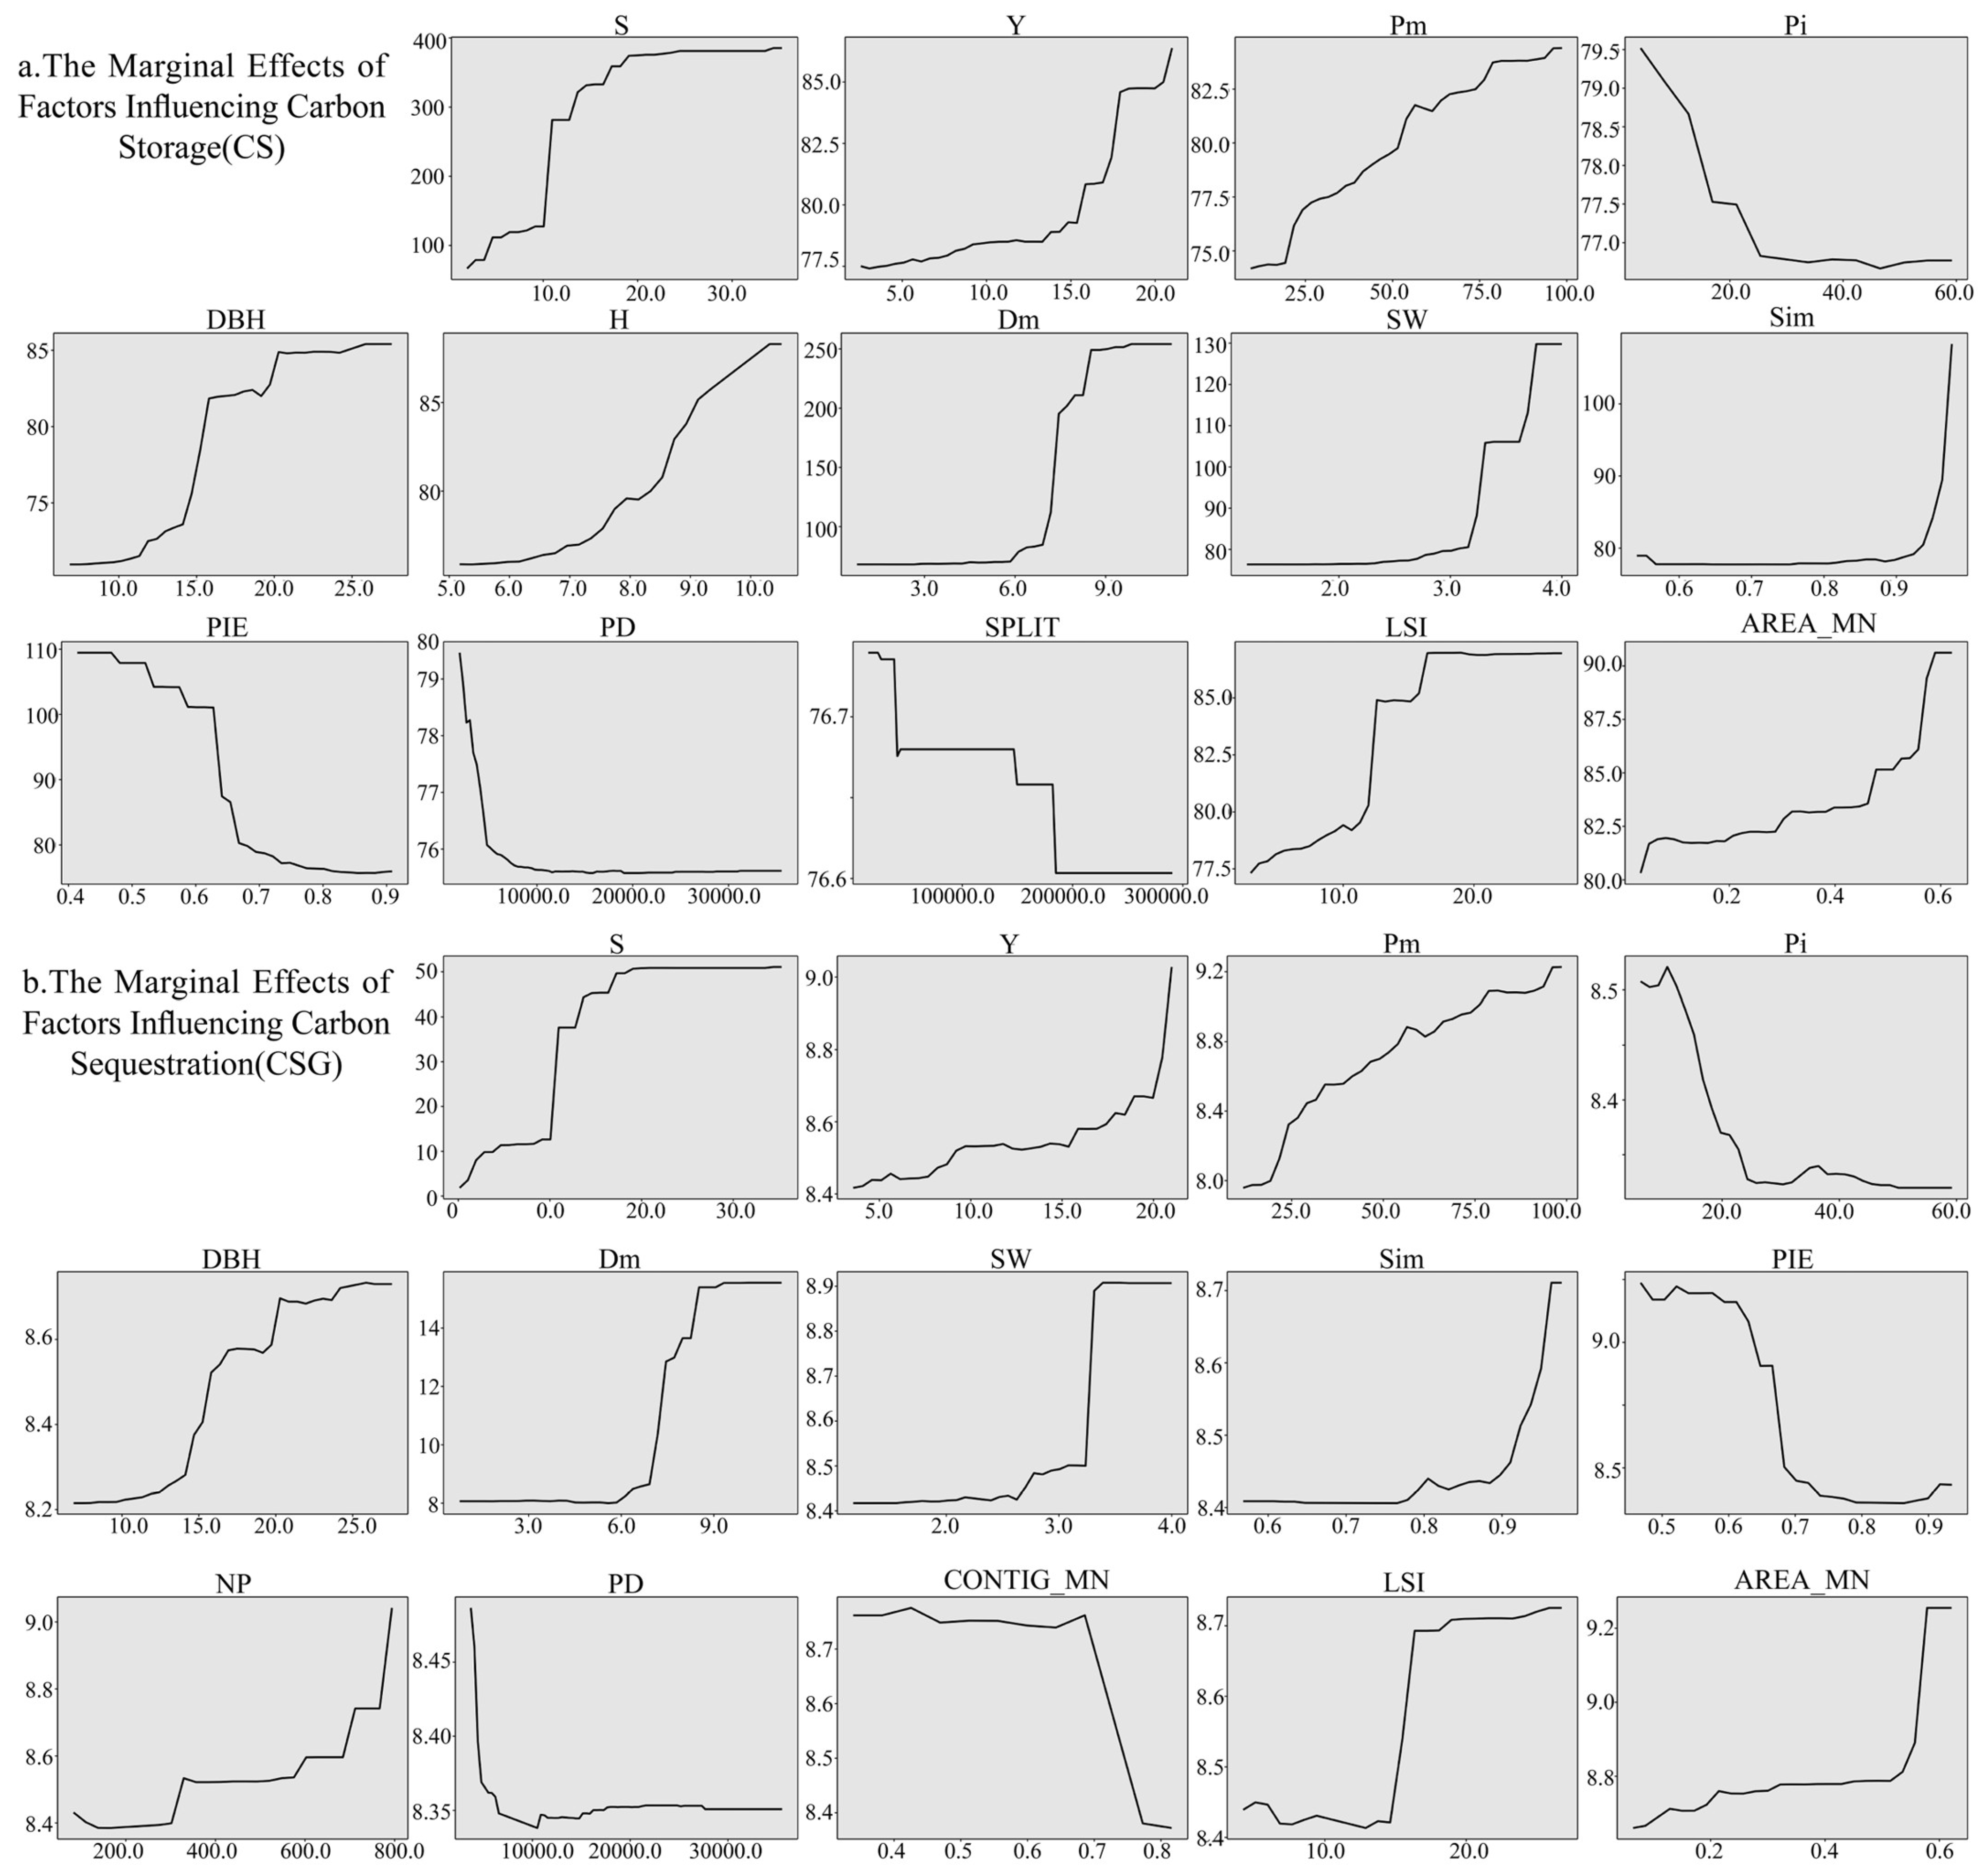
3.3. Analysis of Drivers of CS and CSG in Park Green Spaces

3.3.1. Correlation Analysis of Influencing Factors with CS and CSG

Among park attributes, Y (year of establishment), S (park area), and Pm (woody vegetation ratio) were positively correlated with CS and CSG, while Pi (impervious surface ratio) was negatively correlated. The highest correlations were with Y, at 0.78 and 0.82. For community characteristics and biodiversity, CS showed no significant correlation with C (average crown width), and CSG had no significant correlation with C or H (average tree height). Both CS and CSG were significantly negatively correlated with PIE (Pielou Evenness Index), with correlation coefficients of −0.34 and −0.33, respectively, and were significantly positively correlated with SW (Shannon–Wiener Diversity Index), DM (Margalef Richness Index), and Sim (Simpson Diversity Index). Regarding the spatial distribution and connectivity characteristics of woody plants, CS was significantly negatively correlated with PD (patch density) and SPLIT (splitting index), with correlation coefficients of −0.45 and −0.24, respectively. CSG was significantly negatively correlated with CONTIG_MN (connectivity index) and PD (patch density), with coefficients of −0.27 and −0.41, and was positively correlated with NP (number of patches), with a coefficient of 0.24. Regarding the spatial morphology and complexity characteristics of woody plants, both CS and CSG were significantly positively correlated with LSI (landscape shape index) and AREA_MN (average patch area) (Figure 5).

3.3.2. Contribution and Impact of Influencing Factors on CS, CSG

The findings indicate that park characteristics and community structure and biodiversity significantly influence CS and CSG, accounting for over 85% of the total impact. For CS, community structure and biodiversity have a stronger influence, while park attributes have a greater impact on CSG. Random forest regression analysis revealed that S had the strongest effect on CS (74.33%) and CSG (76.22%). Y influenced CS more (7.02%) than CSG (2.74%). Regarding community structure and biodiversity, the influence of various factors on CS and CSG was nearly identical. Dm had the largest impact on CS (40.92%) and CSG (40.43%), while DBH had the smallest effect on CS (1.02%) and CSG (3.03%). In terms of spatial distribution and connectivity characteristics, PD had a substantial effect on both CS (52.43%) and CSG (37.06%). When considering only spatial morphology and complexity characteristics, LSI and AREA_MN had similar impacts on CS (54.91%, 52.46%) and CSG (45.09%,47.54%). Overall, S, Dm, and SW ranked as the top factors affecting both CS and CSG, highlighting the significant roles of park attributes, community characteristics, and biodiversity (Figure 6).
The random forest model indicated that, when holding other variables constant, both CS and CSG increased with higher values of S, Y, and Pm among park attributes. The trend was nearly identical, with S reaching a plateau at a certain point, possibly due to sample size limitations. Regarding community structure and biodiversity indices, lower values of SW, Sim, and Dm had a minimal impact on CS and CSG. However, once these indices reached a certain threshold, CS and CSG increased sharply. Conversely, the PIE caused a rapid decline in CS and CSG once it exceeded a certain level (Figure 7).

4. Discussion

4.1. Comparison with Other Studies

This study found that the average CSD of park green spaces in Xinyang’s built-up area is 4.02 kg/m2, and the average CSGD is 0.39 kg·C·m2·yr−1, significantly higher than in cities like Hangzhou, Harbin, Shijiazhuang, and Chongqing [37]. In contrast, Zhengzhou’s Green Expo Park reported a CSD of 30.72 kg/m2, and Beijing’s parks showed a CSGD of 2.06 kg·C·m2·yr−1, both significantly exceeding the findings of this study [27,38]. Internationally, the CSGD of park green spaces in Xinyang surpasses that of 71 parks in Daejeon and Daegu, South Korea (0.26 kg·C·m2·yr−1) [39], but falls short of the levels observed in parks in Dhaka, Bangladesh (0.56 kg·C·m2·yr−1), and Seoul, South Korea (0.70 kg·C·m2·yr−1) [40,41]. These differences may stem from several factors.
First, terrain and climate conditions significantly impact carbon sink capacity. A study by Xu et al. in the Pearl River Delta found that slope and altitude greatly affect carbon sink capacity [42]. Similarly, the research conducted by Nie et al. in Fujian, China, showed that altitude, slope, and annual precipitation were key factors influencing CS [43]. Additionally, a study of 22 European cities demonstrated that climate change significantly impacts the CS of trees [44].
Second, different survey methods may also contribute to the variations. Many researchers have measured CS and CSG through field surveys, the National Forest Inventory (NFI), and remote sensing [45,46,47]. Field surveys are highly accurate but labor-intensive. Remote sensing is largely influenced by image quality and is primarily used for large forest areas [48,49], while urban environments are more complex. Radar surveys require extensive work, and sampling surveys may lack accuracy, making censuses a moderate yet reliable approach. Hence, this study adopted the census method.
Third, urban development significantly affects the CS and CSG of parks. Studies suggest that economic growth may reduce urban carbon sinks due to CS loss from urban expansion [50,51,52]. However, urban forests in high-GDP areas exhibit strong carbon sequestration capacity, partly due to eco-construction driven by economic growth [53].
Fourth, park size and type significantly influence carbon sink benefits. This study area mainly comprises small parks, with few large ones. Large parks offer greater biodiversity and larger green spaces, resulting in higher carbon sink benefits. Furthermore, the exclusion of grasslands’ carbon sink capacity may have caused an underestimation of CS and CSG in Xinyang’s built-up area parks.

4.2. Key Influencing Factors for CS and CSG

Park green spaces are essential contributors to urban carbon sink functions. Our study indicates that various factors have differing impacts on the CS and CSG of urban park green spaces (Figure 8). The specific reasons for these differences may include the following:
First, increasing S and Pm expands the base area for trees, enhancing CS and CSG. Y and DBH also significantly influence CS and CSG. In addition, studies have shown that soil conditions and nutrients change with tree age [54]. At the same time, soil conditions will also affect the carbon storage benefits of plants. For example, Ghareghiye et al. found that factors like soil conductivity, gypsum content, lime content, and pH significantly affect plant growth and carbon sequestration [55]. Furthermore, the carbon storage of plants increases with vegetation age [56,57]. The parks in this study area were established relatively recently, suggesting that the carbon sink benefits of older parks warrant further investigation. The biodiversity indices Dm, SW, and Sim positively correlate with CS and CSG. Higher species richness enhances carbon sink benefits in parks. Diverse plant combinations improve resource efficiency through variations in root structures, leaf morphology, and photosynthetic mechanisms. These variations reduce resource competition, promote microbial diversity, and boost community resilience and carbon sink benefits [58]. This finding aligns with Marquard et al.’s grassland experiments and Ruiz et al.’s research on natural and artificial forests [59,60,61]. However, Szwagrzyk et al. observed a slight negative relationship between tree species diversity and aboveground biomass in natural forests of Central Europe [62]. This study identified a negative correlation between PIE and both CS and CSG, indicating that a more uniform species distribution with fewer dominant species leads to a decrease in CS and CSG. However, Sintayehu et al. reported a positive correlation between species evenness and CSG, suggesting that the relationship between plant diversity and biomass may differ depending on the ecosystem and functional group [63].
Secondly, PD, which represents the number of patches per unit area, is inversely related to CS and CSG. Higher patch density correlates with lower CS and CSG. Additionally, as SPLIT increases, the CS and CSG decrease, indicating that higher fragmentation reduces community size and connectivity, impacting soil health and carbon sink capacity [64,65,66]. However, CONTIG_MN shows a threshold effect on CSG; when CONTIG_MN exceeds a certain level, CSG significantly declines, indicating that excessive fragmentation or over-connectivity in plant distribution reduces CSG efficiency. LSI and AREA_MN positively impact CS and CSG, as higher complexity often correlates with greater biodiversity. In contrast, smaller, simpler patches experience more edge effects from fragmentation, increasing vulnerability to external impacts and reducing carbon fixation efficiency [67].
This study shows that when park biodiversity and patch connectivity fall below a threshold, the marginal benefits for CS and CSG become negligible. A balance point exists where ecosystem stability, resilience, and carbon sequestration efficiency improve. To maximize CSG benefits, urban park design should prioritize suitable species selection and reasonable layouts tailored to local conditions.

4.3. Implications and Limitations

This study highlights that park characteristics, community structure, and biodiversity are critical to enhancing CS and CSG in urban parks. Urban park planning should prioritize enlarging park size, increasing woody vegetation proportion, and selecting high-carbon-efficiency species suited to the local climate. Diverse plant species improve resource efficiency, soil microbial diversity, and community stability. To avoid overly concentrated or dispersed communities, plant arrangements should ensure diversified coverage and moderate structural complexity, reducing negative edge effects. Additionally, designing patches with high shape complexity can increase the effective carbon sink area (Figure 9).
However, this study has several limitations. First, this study mainly focuses on park green spaces in the built-up area of Xinyang. Most of the parks in this area are newly built small and medium-sized parks. However, considering the significant impact of differences in park size and maturity on carbon sink effects, future research should be extended to parks of different sizes and levels of maturity. In particular, by comparing small, medium, and large parks, we can gain a deeper understanding of the mechanism of scale on carbon sink dynamics. At the same time, studying the differences in carbon storage between mature parks and newly built parks will provide a more comprehensive perspective for understanding the carbon sink potential of parks. Although this study focuses on a specific type of park, its research methods, data collection, and analysis framework provide important references for future large-scale research. In future studies, these methods can be used as a reference and further expanded to parks in different climate zones and different ecological environments in order to comprehensively evaluate the diversity of parks as carbon sinks. Second, this study does not fully account for factors such as altitude, climate, and economic conditions, which are crucial to carbon sink capacity—for instance, altitude changes impact the growth rate and distribution of plant species, thereby affecting carbon absorption and storage capacity. Economic conditions, on the other hand, can influence carbon emissions and sequestration through factors like land use changes and industrial emissions, Therefore, future research should integrate these variables more thoroughly to better assess the carbon sequestration capacity of different regions, providing a more solid foundation for achieving carbon neutrality [42,68,69,70]. Third, the estimation of shrub CS relies on the general allometric growth model. The estimation of shrub CSG relies on the conversion coefficient calculated for all local trees of the same family. However, this approach has a flaw, as the CS and CSG can vary greatly between different species within the same family. These differences will affect the calculation of the conversion coefficient and thus affect the accuracy of CSG. In the future, the estimation of shrub CSG can be based on the CSG of similar shrub species, and new CS and CSG estimation models can be developed, which can improve the accuracy of the estimation to a certain extent. Fourth, this study lacks a long-term perspective, as trends in CS and CSG over time are not fully considered. Tree growth, community succession, and long-term climate change may cause significant fluctuations in carbon sink benefits [71], varying across parks. Future studies should implement long-term dynamic monitoring in multiple cities to understand carbon sink variations over time. Finally, the research focuses on the carbon sequestration effect of trees and shrubs, which have large biomass and can store carbon more stably. Due to limitations in data acquisition and the focus on the carbon sequestration of woody plants in urban parks, the contribution of herbaceous plants to carbon sequestration is not included. This decision means that the total carbon sequestration potential of urban parks is underestimated to a certain extent. However, the carbon storage role of grasslands in urban parks cannot be ignored. The grassland area of Chinese urban parks is relatively large, and the growth cycle of herbaceous plants is short. Although their carbon storage is small, they can quickly absorb carbon in a short period of time. Therefore, future research can consider further incorporating the carbon sequestration contribution of herbaceous plants to more accurately evaluate the carbon sequestration benefits of urban parks.

5. Conclusions

This study evaluates the CS and CSG of park green spaces in the built-up area of Xinyang and examines the influence of park attributes, the community structure and biodiversity, the spatial distribution and connectivity of woody plants, and morphological complexity characteristics. This study employs field surveys, the i-Tree Eco model, and high-resolution remote sensing data to quantify the effects of various factors on CS and CSG. The results show that most park green spaces in Xinyang are relatively recent, mainly consisting of community parks and recreational areas, with few large park green spaces. The average CSD is 4.01 kg/m2, and the average CSGD is 0.39 kg/m2·yr. These values are lower compared to Beijing and Zhengzhou Green Expo Park, but are higher when compared to Shijiazhuang, Chongqing, Daejeon, and Daegu in South Korea. Plants with high CS and CSD represent a small proportion of the total, while frequently occurring species tend to have a lower carbon sink capacity, indicating that the carbon sink potential of woody plants in Xinyang’s park green spaces can be improved. This study identifies park area (S) and biodiversity indices (Dm, SW) as key factors affecting CS and CSG. Larger park green spaces, higher proportions of woody vegetation, and greater species richness are associated with higher CS and CSD. Conversely, patch fragmentation significantly reduces carbon sink capacity, while larger and more complex patches promote biodiversity and carbon fixation. Overall, the carbon sink benefits of park green spaces in Xinyang are moderately high compared to those in other domestic and international cities, reflecting the influence of factors such as climate, terrain, and economic conditions. In addition, it is worth noting that tree species with high carbon sequestration capacity usually help to improve carbon sequestration potential. However, tree species with high carbon sequestration capacity, such as Populus, are more likely to be blown down in storms due to their low wood density. Moreover, non-native invasive species may affect the efficiency of carbon sequestration in some cases by changing the soil chemistry and inhibiting the growth of other plants. Ginkgo biloba has low carbon sequestration efficiency, but it has good ornamental qualities and pollution resistance. Therefore, in future park green space planning, tree species selection should take into account the adaptability of tree species, pollution resistance, and competitiveness against invasive species. Even if tree species with general carbon sequestration benefits are selected, multiple ecological benefits should be considered to achieve a balance between carbon storage and ecological diversity. This study provides a basis for urban planning, emphasizing the importance of park size, plant diversity, and strategic layout in the design and renovation of urban parks. It recommends including socioeconomic and soil factors in future research. Additionally, investigating carbon pools in urban soil, understory vegetation, and water bodies is crucial for enhancing urban climate. Finally, this study found a significant “threshold effect” when exploring the relationship between various factors and park carbon sinks. When environmental conditions or resource inputs reach a critical point, the ecological benefits of trees significantly improve and remain at their maximum. Beyond this threshold, further increases or changes in resources may lead to diminishing returns. Therefore, accurately identifying and understanding this threshold is crucial for future urban planning. These insights will support efforts to enhance carbon sink benefits in urban green spaces, address global climate warming, and promote low-carbon urban development.

Supplementary Materials

The following supporting information can be downloaded at: https://www.mdpi.com/article/10.3390/land14030653/s1.

Author Contributions

H.Z.: Conceptualization, Formal analysis, Methodology, Data curation, Investigation, Writing—original draft, Writing—review and editing, Software. Q.R.: Conceptualization, Formal analysis, Writing—review and editing. Y.Z.: Conceptualization, Formal analysis, Investigation, Writing—review and editing. N.D.: Conceptualization, Formal analysis, Investigation, Resources. H.W.: Conceptualization, Formal analysis, Investigation, Resources. Y.H.: Conceptualization, Formal analysis, Investigation, Resources. P.S.: Conceptualization, Formal analysis, Resources, Writing—review and editing. R.H.: Conceptualization, Formal analysis, Resources. G.T.: Conceptualization, Formal analysis, Resources, Funding acquisition, Writing—review and editing. S.G.: Conceptualization, Methodology, Formal analysis, Resources, Funding acquisition, Writing—review and editing. All authors have read and agreed to the published version of the manuscript.

Funding

This study was funded by the National Natural Science Foundation of China, grant number 32460421, and the Key Technology R&D Program of Henan Province, grant number 232102521015 and 242102320320.

Data Availability Statement

The raw data supporting the conclusions of this article will be made available by the authors on request.

Conflicts of Interest

The authors declare that they have no known competing financial interests or personal relationships that could have appeared to influence the work reported in this paper.

References

  1. Li, G.Y.; Yu, F.F.; Chen, J.; Duan, Z.Y. Research on Urbanization Development of Mountainous Area—Take in Yichang for Example. Adv. Mater. Res. 2011, 250–253, 2723–2728. [Google Scholar] [CrossRef]
  2. Wang, J.; Wang, R. The Impact of Urbanization on Environmental Quality in Ecologically Fragile Areas: Evidence from Hengduan Mountain, Southwest China. Land 2024, 13, 503. [Google Scholar] [CrossRef]
  3. Gong, P.; Li, X.; Wang, J.; Bai, Y.; Chen, B.; Hu, T.; Liu, X.; Xu, B.; Yang, J.; Zhang, W.; et al. Annual maps of global artificial impervious area (GAIA) between 1985 and 2018. Remote Sens. Environ. 2020, 236, 111510. [Google Scholar] [CrossRef]
  4. Seto, K.C.; Güneralp, B.; Hutyra, L.R. Global forecasts of urban expansion to 2030 and direct impacts on biodiversity and carbon pools. Proc. Natl. Acad. Sci. USA 2012, 109, 16083–16088. [Google Scholar] [CrossRef]
  5. McCarthy, M.P.; Best, M.J.; Betts, R.A. Climate change in cities due to global warming and urban effects. Geophys. Res. Lett. 2010, 37, 2010GL042845. [Google Scholar] [CrossRef]
  6. Grimm, N.B.; Faeth, S.H.; Golubiewski, N.E.; Redman, C.L.; Wu, J.; Bai, X.; Briggs, J.M. Global Change and the Ecology of Cities. Science 2008, 319, 756–760. [Google Scholar] [CrossRef]
  7. Ren, H.; Gu, G.; Zhou, H. Assessing the low-carbon city pilot policy on carbon emission from consumption and production in China: How underlying mechanism and spatial spillover effect? Environ. Sci. Pollut. Res. 2022, 29, 71958–71977. [Google Scholar] [CrossRef]
  8. Zeng, S.; Jin, G.; Tan, K.; Liu, X. Can low-carbon city construction reduce carbon intensity? Empirical evidence from low-carbon city pilot policy in China. J. Environ. Manag. 2023, 332, 117363. [Google Scholar] [CrossRef]
  9. Nowak, D.J.; Crane, D.E. Carbon storage and sequestration by urban trees in the USA. Environ. Pollut. 2002, 116, 381–389. [Google Scholar] [CrossRef]
  10. Amoatey, P.; Sulaiman, H.; Kwarteng, A.; Al-Reasi, H.A. Above-ground carbon dynamics in different arid urban green spaces. Environ. Earth Sci. 2018, 77, 431. [Google Scholar] [CrossRef]
  11. Strohbach, M.W.; Arnold, E.; Haase, D. The carbon footprint of urban green space—A life cycle approach. Landsc. Urban Plan. 2012, 104, 220–229. [Google Scholar] [CrossRef]
  12. Francesco Agostini, A.S.G.; Richter, G.M. Carbon Sequestration by Perennial Energy Crops: Is the Jury Still Out? Bioenergy Res. 2015, 8, 1057–1080. [Google Scholar] [CrossRef] [PubMed]
  13. Wei, Y.; Jim, C.-Y.; Gao, J.; Zhao, M. Determinants of Aboveground Carbon Storage of Woody Vegetation in an Urban–Rural Transect in Shanghai, China. Sustainability 2023, 15, 8574. [Google Scholar] [CrossRef]
  14. Liu, X.; Trogisch, S.; He, J.-S.; Niklaus, P.A.; Bruelheide, H.; Tang, Z.; Erfmeier, A.; Scherer-Lorenzen, M.; Pietsch, K.A.; Yang, B.; et al. Tree species richness increases ecosystem carbon storage in subtropical forests. Proc. R. Soc. B Biol. Sci. 2018, 285, 20181240. [Google Scholar] [CrossRef]
  15. Tatsumi, S. Tree diversity effects on forest productivity increase through time because of spatial partitioning. BioRxiv 2020, 7, 24. [Google Scholar] [CrossRef]
  16. Zhang, X.; Huang, H.; Tu, K.; Li, R.; Zhang, X.; Wang, P.; Li, Y.; Yang, Q.; Acerman, A.C.; Guo, N.; et al. Effects of plant community structural characteristics on carbon sequestration in urban green spaces. Sci. Rep. 2023, 14, 7382. [Google Scholar] [CrossRef]
  17. Lin, J.; Ma, Q.; Ju, Y.; Zhang, H.; Wang, Q.; Huang, B. Relationships between urbanization, tree morphology, and carbon density: An integration of remote sensing, allometric models, and field survey. Urban For. Urban Green. 2022, 76, 127725. [Google Scholar] [CrossRef]
  18. Kavana, G.B. Miyawaki Forest; University of Agricultural & Horticultural Sciences: Shivamogga, India, 2023. [Google Scholar] [CrossRef]
  19. Zhao, K.; Suarez, J.C.; Garcia, M.; Hu, T.; Wang, C.; Londo, A. Utility of multitemporal lidar for forest and carbon monitoring: Tree growth, biomass dynamics, and carbon flux. Remote Sens. Environ. 2018, 204, 883–897. [Google Scholar] [CrossRef]
  20. Gülçin, D.; Van Den Bosch, C.C.K. Assessment of Above-Ground Carbon Storage by Urban Trees Using LiDAR Data: The Case of a University Campus. Forests 2021, 12, 62. [Google Scholar] [CrossRef]
  21. Choudhury, M.A.M.; Marcheggiani, E.; Galli, A.; Modica, G.; Somers, B. Mapping the Urban Atmospheric Carbon Stock by LiDAR and WorldView-3 Data. Forests 2021, 12, 692. [Google Scholar] [CrossRef]
  22. Li, N.; Deng, L.; Yan, G.; Cao, M.; Cui, Y. Estimation for Refined Carbon Storage of Urban Green Space and Minimum Spatial Mapping Scale in a Plain City of China. Remote Sens. 2024, 16, 217. [Google Scholar] [CrossRef]
  23. Gu, X.; Zhang, P.; Zhang, W.; Liu, Y.; Jiang, P.; Wang, S.; Lai, X.; Long, A. A Study of Drought and Flood Cycles in Xinyang, China, Using the Wavelet Transform and M-K Test. Atmosphere 2023, 14, 1196. [Google Scholar] [CrossRef]
  24. Yao, X.; Zhu, Z.; Zhou, X.; Shen, Y.; Shen, X.; Xu, Z. Investigating the effects of urban morphological factors on seasonal land surface temperature in a “Furnace city” from a block perspective. Sustain. Cities Soc. 2022, 86, 104165. [Google Scholar] [CrossRef]
  25. Lin, Z.; Xu, H.; Yao, X.; Yang, C.; Yang, L. Exploring the relationship between thermal environmental factors and land surface temperature of a “furnace city” based on local climate zones. Build. Environ. 2023, 243, 110732. [Google Scholar] [CrossRef]
  26. Ossola, A.; Jenerette, G.D.; McGrath, A.; Chow, W.; Hughes, L.; Leishman, M.R. Small vegetated patches greatly reduce urban surface temperature during a summer heatwave in Adelaide, Australia. Landsc. Urban Plan. 2021, 209, 104046. [Google Scholar] [CrossRef]
  27. Jia, X.; Han, H.; Feng, Y.; Song, P.; He, R.; Liu, Y.; Wang, P.; Zhang, K.; Du, C.; Ge, S.; et al. Scale-dependent and driving relationships between spatial features and carbon storage and sequestration in an urban park of Zhengzhou, China. Sci. Total Environ. 2023, 894, 164916. [Google Scholar] [CrossRef]
  28. Escobedo, F.J.; Nowak, D.J. Spatial Heterogeneity and Air Pollution Removal by an Urban Forest. Landsc. Urban Plan. 2008, 90, 102–110. [Google Scholar] [CrossRef]
  29. Nowak, D.J.; Maco, S.; Binkley, M. i-Tree: Global Tools to Assess Tree Benefits and Risks to Improve Forest Management. Arboric. Consult. 2018, 51, 10–13. [Google Scholar]
  30. Colgan, M.S.; Asner, G.P.; Swemmer, T. Harvesting tree biomass at the stand level to assess the accuracy of field and airborne biomass estimation in savannas. Ecol. Appl. 2013, 23, 1170–1184. [Google Scholar] [CrossRef]
  31. West, G.B.; Brown, J.H.; Enquist, B.J. A general model for ontogenetic growth. Nature 2001, 413, 628–631. [Google Scholar] [CrossRef]
  32. Niklas, K.J.; Enquist, B.J. On the Vegetative Biomass Partitioning of Seed Plant Leaves, Stems, and Roots. Am. Nat. 2002, 159, 482–497. [Google Scholar] [CrossRef] [PubMed]
  33. Smith, R.E.H.; Kalff, J. Size—Dependent Phosphorus Uptake Kinetics and Cell Quota in Phytoplankton. J. Phycol. 1982, 18, 275–284. [Google Scholar] [CrossRef]
  34. Kouamé, Y.A.G.; Millan, M.; N’Dri, A.B.; Charles-Dominique, T.; Konan, M.; Bakayoko, A.; Gignoux, J. Multispecies allometric equations for shrubs and trees biomass prediction in a Guinean savanna (West Africa). Silva Fenn. 2022, 56, 10617. [Google Scholar] [CrossRef]
  35. Conti, G.; Gorné, L.D.; Zeballos, S.R.; Lipoma, M.L.; Gatica, G.; Kowaljow, E.; Whitworth-Hulse, J.I.; Cuchietti, A.; Poca, M.; Pestoni, S.; et al. Developing allometric models to predict the individual aboveground biomass of shrubs worldwide. Glob. Ecol. Biogeogr. 2019, 28, 961–975. [Google Scholar] [CrossRef]
  36. Mildrexler, D.J.; Berner, L.T.; Law, B.E.; Birdsey, R.A.; Moomaw, W.R. Large Trees Dominate Carbon Storage in Forests East of the Cascade Crest in the United States Pacific Northwest. Front. For. Glob. Chang. 2020, 3, 594274. [Google Scholar] [CrossRef]
  37. Chen, W.Y. The role of urban green infrastructure in offsetting carbon emissions in 35 major Chinese cities: A nationwide estimate. Cities 2015, 44, 112–120. [Google Scholar] [CrossRef]
  38. Wang, Y.; Chang, Q.; Li, X. Promoting sustainable carbon sequestration of plants in urban greenspace by planting design: A case study in parks of Beijing. Urban For. Urban Green. 2021, 64, 127291. [Google Scholar] [CrossRef]
  39. Jo, H.-K.; Park, H.-M.; Kim, J.-Y. Carbon Offset Service of Urban Park Trees and Desirable Planting Strategies for Several Metropolitan Cities in South Korea. Forests 2023, 14, 278. [Google Scholar] [CrossRef]
  40. Shadman, S.; Ahanaf Khalid, P.; Hanafiah, M.M.; Koyande, A.K.; Islam, M.A.; Bhuiyan, S.A.; Sin Woon, K.; Show, P.-L. The carbon sequestration potential of urban public parks of densely populated cities to improve environmental sustainability. Sustain. Energy Technol. Assess. 2022, 52, 102064. [Google Scholar] [CrossRef]
  41. Jo, H.-K.; Kim, J.-Y.; Park, H.-M. Carbon reduction and planning strategies for urban parks in Seoul. Urban For. Urban Green. 2019, 41, 48–54. [Google Scholar] [CrossRef]
  42. Xu, Q.; Dong, Y.; Yang, R. Influence of different geographical factors on carbon sink functions in the Pearl River Delta. Sci. Rep. 2017, 7, 110. [Google Scholar] [CrossRef] [PubMed]
  43. Nie, Q.; Wu, G.; Li, L.; Man, W.; Ma, J.; Bao, Z.; Luo, L.; Li, H. Exploring scaling differences and spatial heterogeneity in drivers of carbon storage Changes: A comprehensive geographic analysis framework. Ecol. Indic. 2024, 165, 112193. [Google Scholar] [CrossRef]
  44. Lloyd, G.; Ossola, A.; Burley, H.; Evans, K. Climate change threatens carbon storage in Europe’s urban trees. Urban For. Urban Green. 2024, 101, 128532. [Google Scholar] [CrossRef]
  45. Chen, Y.; Guerschman, J.P.; Cheng, Z.; Guo, L. Remote sensing for vegetation monitoring in carbon capture storage regions: A review. Appl. Energy 2019, 240, 312–326. [Google Scholar] [CrossRef]
  46. Suriya Prabhakaran, M.; Rohith, V.; Prabu, T. Carbon Capture and Storage Potential in India. In Proceedings of the First International Conference on Science, Engineering and Technology Practices for Sustainable Development, ICSETPSD 2023, Coimbatore, India, 17–18 November 2023; EAI: Coimbatore, India, 2024. [Google Scholar] [CrossRef]
  47. Brown, S. Measuring carbon in forests: Current status and future challenges. Environ. Pollut. 2002, 116, 363–372. [Google Scholar] [CrossRef]
  48. Cavanaugh, K.C.; Bell, T.; Costa, M.; Eddy, N.E.; Gendall, L.; Gleason, M.G.; Hessing-Lewis, M.; Martone, R.; McPherson, M.; Pontier, O.; et al. A Review of the Opportunities and Challenges for Using Remote Sensing for Management of Surface-Canopy Forming Kelps. Front. Mar. Sci. 2021, 8, 753531. [Google Scholar] [CrossRef]
  49. Dubovik, O.; Schuster, G.L.; Xu, F.; Hu, Y.; Bösch, H.; Landgraf, J.; Li, Z. Grand Challenges in Satellite Remote Sensing. Front. Remote Sens. 2021, 2, 619818. [Google Scholar] [CrossRef]
  50. Yang, H.; Chen, W. Spatio-temporal pattern of urban vegetation carbon sink and driving mechanisms of human activities in Huaibei, China. Environ. Sci. Pollut. Res. 2022, 29, 31957–31971. [Google Scholar] [CrossRef]
  51. Chen, J.; Fan, W.; Li, D.; Liu, X.; Song, M. Driving factors of global carbon footprint pressure: Based on vegetation carbon sequestration. Appl. Energy 2020, 267, 114914. [Google Scholar] [CrossRef]
  52. Ren, Y.; Yan, J.; Wei, X.; Wang, Y.; Yang, Y.; Hua, L.; Xiong, Y.; Niu, X.; Song, X. Effects of rapid urban sprawl on urban forest carbon stocks: Integrating remotely sensed, GIS and forest inventory data. J. Environ. Manag. 2012, 113, 447–455. [Google Scholar] [CrossRef]
  53. Zhang, Z.; Wan, X.; Sheng, K.; Sun, H.; Jia, L.; Peng, J. Impact of Carbon Sequestration by Terrestrial Vegetation on Economic Growth: Evidence from Chinese County Satellite Data. Sustainability 2023, 15, 1369. [Google Scholar] [CrossRef]
  54. Chen, G.-s.; Zeng, D.-h.; Chen, F.-s. Concentrations of foliar and surface soil nutrients in Pinus spp. plantations in relation to species and stand age in Zhanggutai sandy land, northeast China. J. For. Res. 2004, 15, 11–18. [Google Scholar] [CrossRef]
  55. Ghareghiye, Z.N. Management of Carbon Sequestration by Identification of Soil Limitation Factors That Affect Plants Growing. Innov. Educ. Res. 2019, 7, 538–557. [Google Scholar] [CrossRef]
  56. Hoover, C.M.; Smith, J.E. Aboveground live tree carbon stock and change in forests of conterminous United States: Influence of stand age. Carbon Balance Manag. 2023, 18, 7. [Google Scholar] [CrossRef]
  57. Stephenson, N.L.; Das, A.J.; Condit, R.; Russo, S.E.; Baker, P.J.; Beckman, N.G.; Coomes, D.A.; Lines, E.R.; Morris, W.K.; Rüger, N.; et al. Rate of tree carbon accumulation increases continuously with tree size. Nature 2014, 507, 90–93. [Google Scholar] [CrossRef]
  58. Domeignoz-Horta, L.A.; Cappelli, S.L.; Shrestha, R.; Gerin, S.; Lohila, A.K.; Heinonsalo, J.; Nelson, D.B.; Kahmen, A.; Duan, P.; Sebag, D.; et al. Plant diversity drives positive microbial associations in the rhizosphere enhancing carbon use efficiency in agricultural soils. Nat. Commun. 2024, 15, 8065. [Google Scholar] [CrossRef] [PubMed]
  59. Ruiz-Jaen, M.C.; Potvin, C. Can we predict carbon stocks in tropical ecosystems from tree diversity? Comparing species and functional diversity in a plantation and a natural forest. New Phytol. 2011, 189, 978–987. [Google Scholar] [CrossRef]
  60. Yang, L.; Zhang, J.; Wang, J.; Han, S.; Guo, Z.; Fan, C.; Yu, J. Relationships between Tree Species Diversity and Aboveground Biomass Are Mediated by Site-Dependent Factors in Northeastern China Natural Reserves on a Small Spatial Scale. Sustainability 2024, 16, 8378. [Google Scholar] [CrossRef]
  61. Marquard, E.; Weigelt, A.; Temperton, V.M.; Roscher, C.; Schumacher, J.; Buchmann, N.; Fischer, M.; Weisser, W.W.; Schmid, B. Plant species richness and functional composition drive overyielding in a six-year grassland experiment. Ecology 2009, 90, 3290–3302. [Google Scholar] [CrossRef]
  62. Szwagrzyk, J.; Gazda, A. Above-ground standing biomass and tree species diversity in natural stands of Central Europe. J. Veg. Sci. 2007, 18, 555–562. [Google Scholar] [CrossRef]
  63. Sintayehu, D.W.; Belayneh, A.; Dechassa, N. Aboveground carbon stock is related to land cover and woody species diversity in tropical ecosystems of Eastern Ethiopia. Ecol. Process. 2020, 9, 37. [Google Scholar] [CrossRef]
  64. Lei, H.; Duan, D.; Chen, Y.; Guo, H.; Li, J.; Li, X. Effects of landscape fragmentation of plantation forests on carbon storage in the Loess Plateau, China. J. Arid Land 2024, 16, 266–281. [Google Scholar] [CrossRef]
  65. Mesa-Sierra, N.; Laborde, J.; Chaplin-Kramer, R.; Escobar, F. Carbon stocks in a highly fragmented landscape with seasonally dry tropical forest in the Neotropics. For. Ecosyst. 2022, 9, 100016. [Google Scholar] [CrossRef]
  66. Jha, C.S.; Goparaju, L.; Tripathi, A.; Gharai, B.; Raghubanshi, A.S.; Singh, J.S. Forest fragmentation and its impact on species diversity: An analysis using remote sensing and GIS. Biodivers. Conserv. 2005, 14, 1681–1698. [Google Scholar] [CrossRef]
  67. Hou, Y.; Wang, L.; Li, Z.; Ouyang, X.; Xiao, T.; Wang, H.; Li, W.; Nie, X. Landscape fragmentation and regularity lead to decreased carbon stocks in basins: Evidence from century-scale research. J. Environ. Manag. 2024, 367, 121937. [Google Scholar] [CrossRef]
  68. Pan, Y.; Zhang, H.; Wang, C.; Zhou, Y. Impact of land use change on regional carbon sink capacity: Evidence from Sanmenxia, China. Ecol. Indic. 2023, 156, 111189. [Google Scholar] [CrossRef]
  69. Wang, G.; Guan, D.; Xiao, L.; Peart, M.R. Forest biomass-carbon variation affected by the climatic and topographic factors in Pearl River Delta, South China. J. Environ. Manag. 2019, 232, 781–788. [Google Scholar] [CrossRef]
  70. Dong, Z.; Hou, L.; Ruan, Q. Effect of Elevation Gradient on Carbon Pools in a Juniperus przewalskii Kom. Forest in Qinghai, China. Sustainability 2023, 15, 6163. [Google Scholar] [CrossRef]
  71. Zhu, K.; Zhang, J.; Niu, S.; Chu, C.; Luo, Y. Limits to growth of forest biomass carbon sink under climate change. Nat. Commun. 2018, 9, 2709. [Google Scholar] [CrossRef]
Figure 1. Study area: China (a). Henan (b). Xinyang (c). Distribution of parks in built-up areas (d). GPS location of woody plants in parks (e). Detailed GPS location map of woody plants in an individual park (f,g).
Land 14 00653 g001
Figure 2. Flowchart of this study.
Land 14 00653 g002
Figure 3. Differences in the distribution of CS and CSG in parks: quartile distribution of park CS (a) and CSG (b). Overall distribution of CSD (c) and CSGD (d) in built-up area parks. Overall distribution of individual CSD (e) and CSGD (f).
Land 14 00653 g003
Figure 4. Distribution of woody vegetation characteristics in the park: percentage distribution of tree height (a), percentage distribution of diameter at breast height (b), and percentage distribution of CS (c) and CSG (d). Overview of CS and CSG of woody plants in Xinyang City: the top 20 plants with the highest frequency (e), boxplot of CS (f) and CSG (g) of the top 20 most frequent plants, frequency chart of the top 20 plants with the highest average CS (h) and CSG (i), and box plot of the top 20 plants with the highest average CS (j) and CSG (k).
Land 14 00653 g004
Figure 5. Correlation analysis of factors affecting CS and CSG.
Land 14 00653 g005
Figure 6. Contributions of various types of factors and the best subset of impact factors: contribution of park characteristic variables to CS (a) and CSG (f). Contribution of biodiversity and community variables to CS (b) and CSG (g). Contribution of spatial distribution and connectivity variables to CS (c) and CSG (h). Contribution of spatial morphology and complexity variables to CS (d) and CSG (i). Contribution of the best influencing variables to CS (e) and CSG (j).
Land 14 00653 g006
Figure 7. Marginal effects.
Land 14 00653 g007
Figure 8. Indicators intention diagrams for woody plant spatial distribution, connectivity, spatial morphology and complexity characteristics: the intention map of the Connectivity Index (a), the intention map of the Splitting Index (b), the intention map of the number of patches (c), the intention map of the Landscape Shape Index (d), the intention maps of the patch density (e) and average patch area (f).
Land 14 00653 g008
Figure 9. Regulatory scenario diagram.
Land 14 00653 g009
Table 1. Xinyang City shrub CS and CSG conversion coefficient table.
FamilyConversion CoefficientFamilyConversion CoefficientFamilyConversion Coefficient
Taxaceae3.10Malvaceae13.02Paeoniaceae7.81
Euphorbiaceae4.23Arecaceae8.05Lamiaceae18.82
Aquifoliaceae5.54Calycanthaceae15.86Salicaceae9.54
Fabaceae6.61Cupressaceae10.23Pinaceae10.32
Theaceae4.39Podocarpaceae8.01Cycadaceae6.37
Moraceae27.34Caprifoliaceae3.49Myrtaceae10.68
Rosaceae9.23Magnoliaceae28.97Sapindaceae15.08
Lythraceae9.56Oleaceae17.84Berberidaceae4.00
Celastraceae12.76Apocynaceae5.53Pentaphylacaceae8.58
Other Shrubs10.12
Table 2. Table of influencing factors.
Factor TypeFactor NameAbbreviationEcological Meaning
Park CharacteristicsPark Green Space AreaSArea covered by green space within the park
Park Establishment TimeYTime since the park was established
Vegetation Area RatioPgRatio of green space area to total area within the region
Impervious Surface RatioPiRatio of impervious surface area to total area within the region
Water Body RatioPwRatio of water body area to total area within the region
Woody Vegetation RatioPmRatio of woody vegetation cover area to total area within the region
Shannon Evenness IndexSHEIReflects the evenness of different patch types in the landscape
Shannon Diversity IndexSHDIIndicates the diversity of different patch types in the landscape
Community Structure and Biodiversity CharacteristicsShannon–Wiener Diversity IndexSWDescribes species occurrence disorder and uncertainty, considering species count and unevenness; higher values indicate greater diversity
Simpson Diversity IndexSimProbability that two randomly selected individuals belong to different species; values closer to 1 indicate higher biodiversity
Margalef Richness IndexDmNormalizes richness by total individual count for comparability across sample sizes; higher values indicate greater species richness
Pielou Evenness IndexPIEDescribes the uniformity of individual distribution across species in a community; higher values indicate more even distribution
Average Tree HeightHAverage height of trees within the park
Average Diameter at Breast Height DBHAverage DBH of trees within the park
Average Crown WidthCAverage crown width of trees within the park
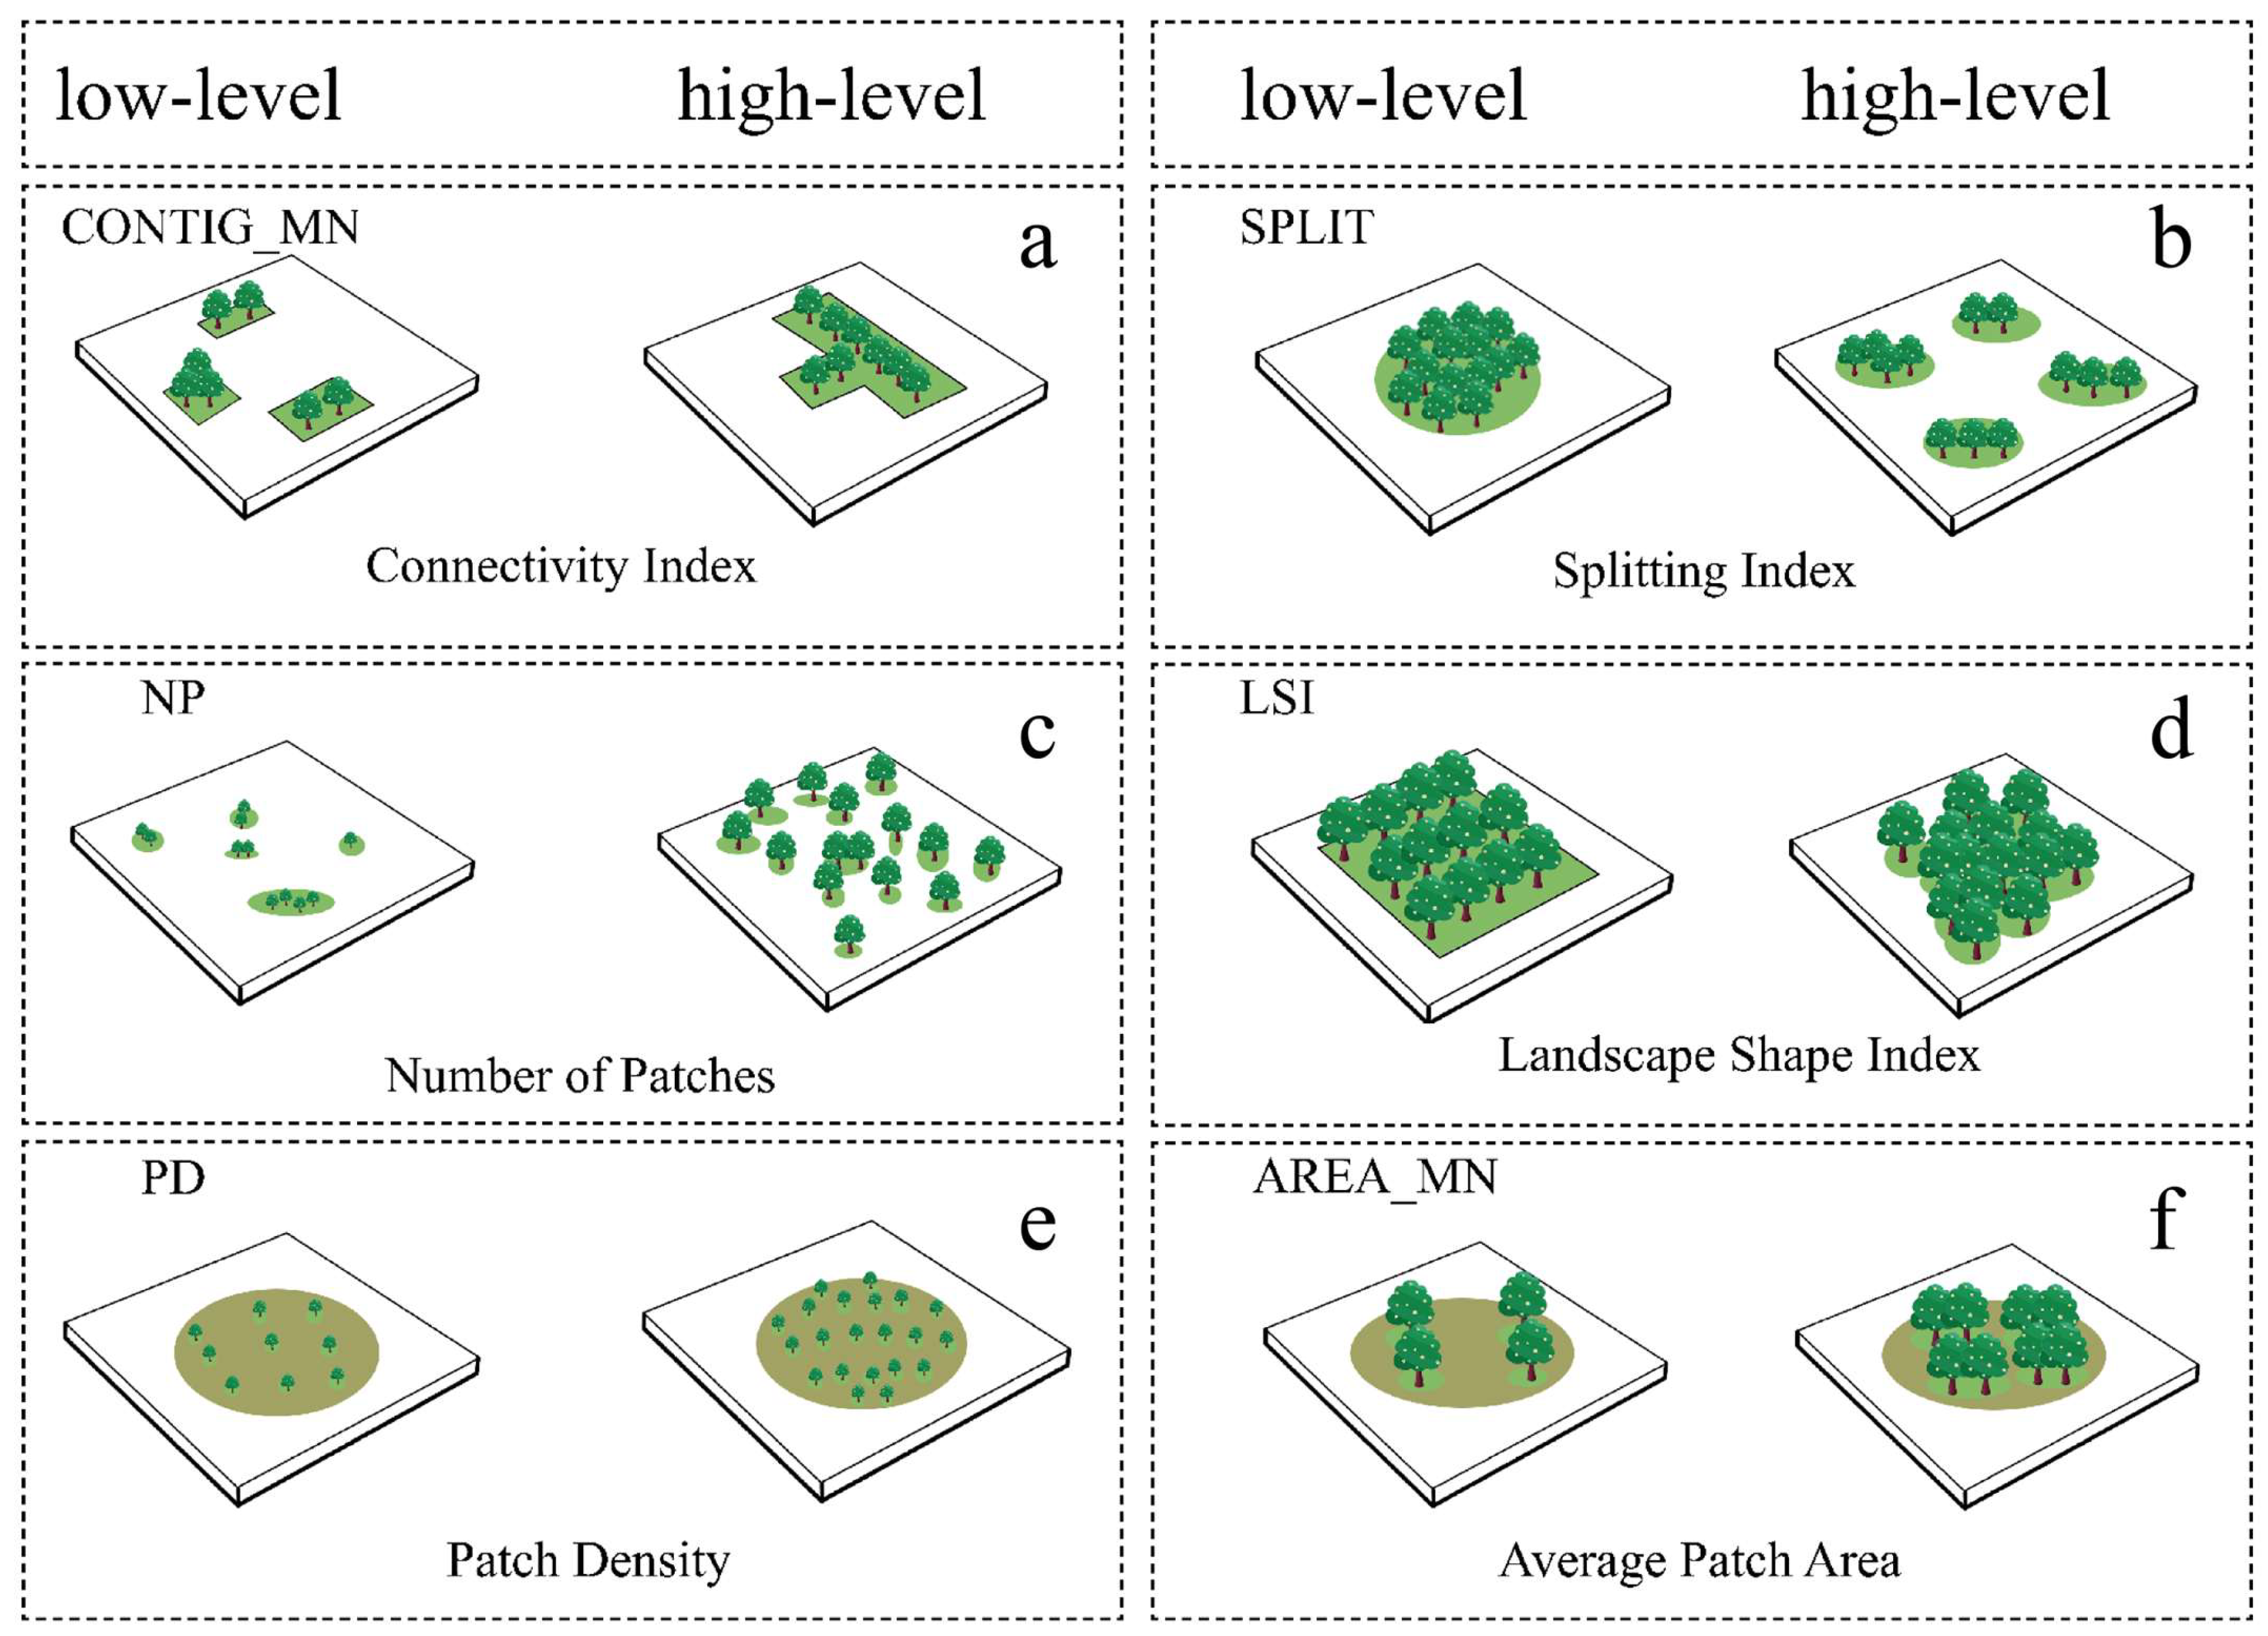
Woody Plant Spatial Distribution and Connectivity CharacteristicsConnectivity IndexCONTIG_MN Average connectivity between woody plant patches values closer to 1 indicate stronger connectivity
Number of PatchesNPNumber of woody plant patches
Patch DensityPDDensity of woody plant patches
Splitting IndexSPLITDegree of fragmentation of woody plant patches
Aggregation IndexAIDegree of aggregation of woody plant patches
Woody Plant Spatial Morphology and Complexity CharacteristicsLandscape Shape IndexLSIOverall woody plant patch shape complexity
Largest Patch IndexLPIPercentage of landscape area occupied by the largest woody plant patches
Average Patch AreaAREA_MNAverage size of woody plant patches
Mean Shape IndexSHAPE_MNAverage complexity of woody plant patches
Disclaimer/Publisher’s Note: The statements, opinions and data contained in all publications are solely those of the individual author(s) and contributor(s) and not of MDPI and/or the editor(s). MDPI and/or the editor(s) disclaim responsibility for any injury to people or property resulting from any ideas, methods, instructions or products referred to in the content.

