
Configuration of Green–Blue–Grey Spaces for Efficient Cooling of Urban Physical and Perceptual Thermal Environments

 ,
,
Abstract
1. Introduction
2. Materials and Methods
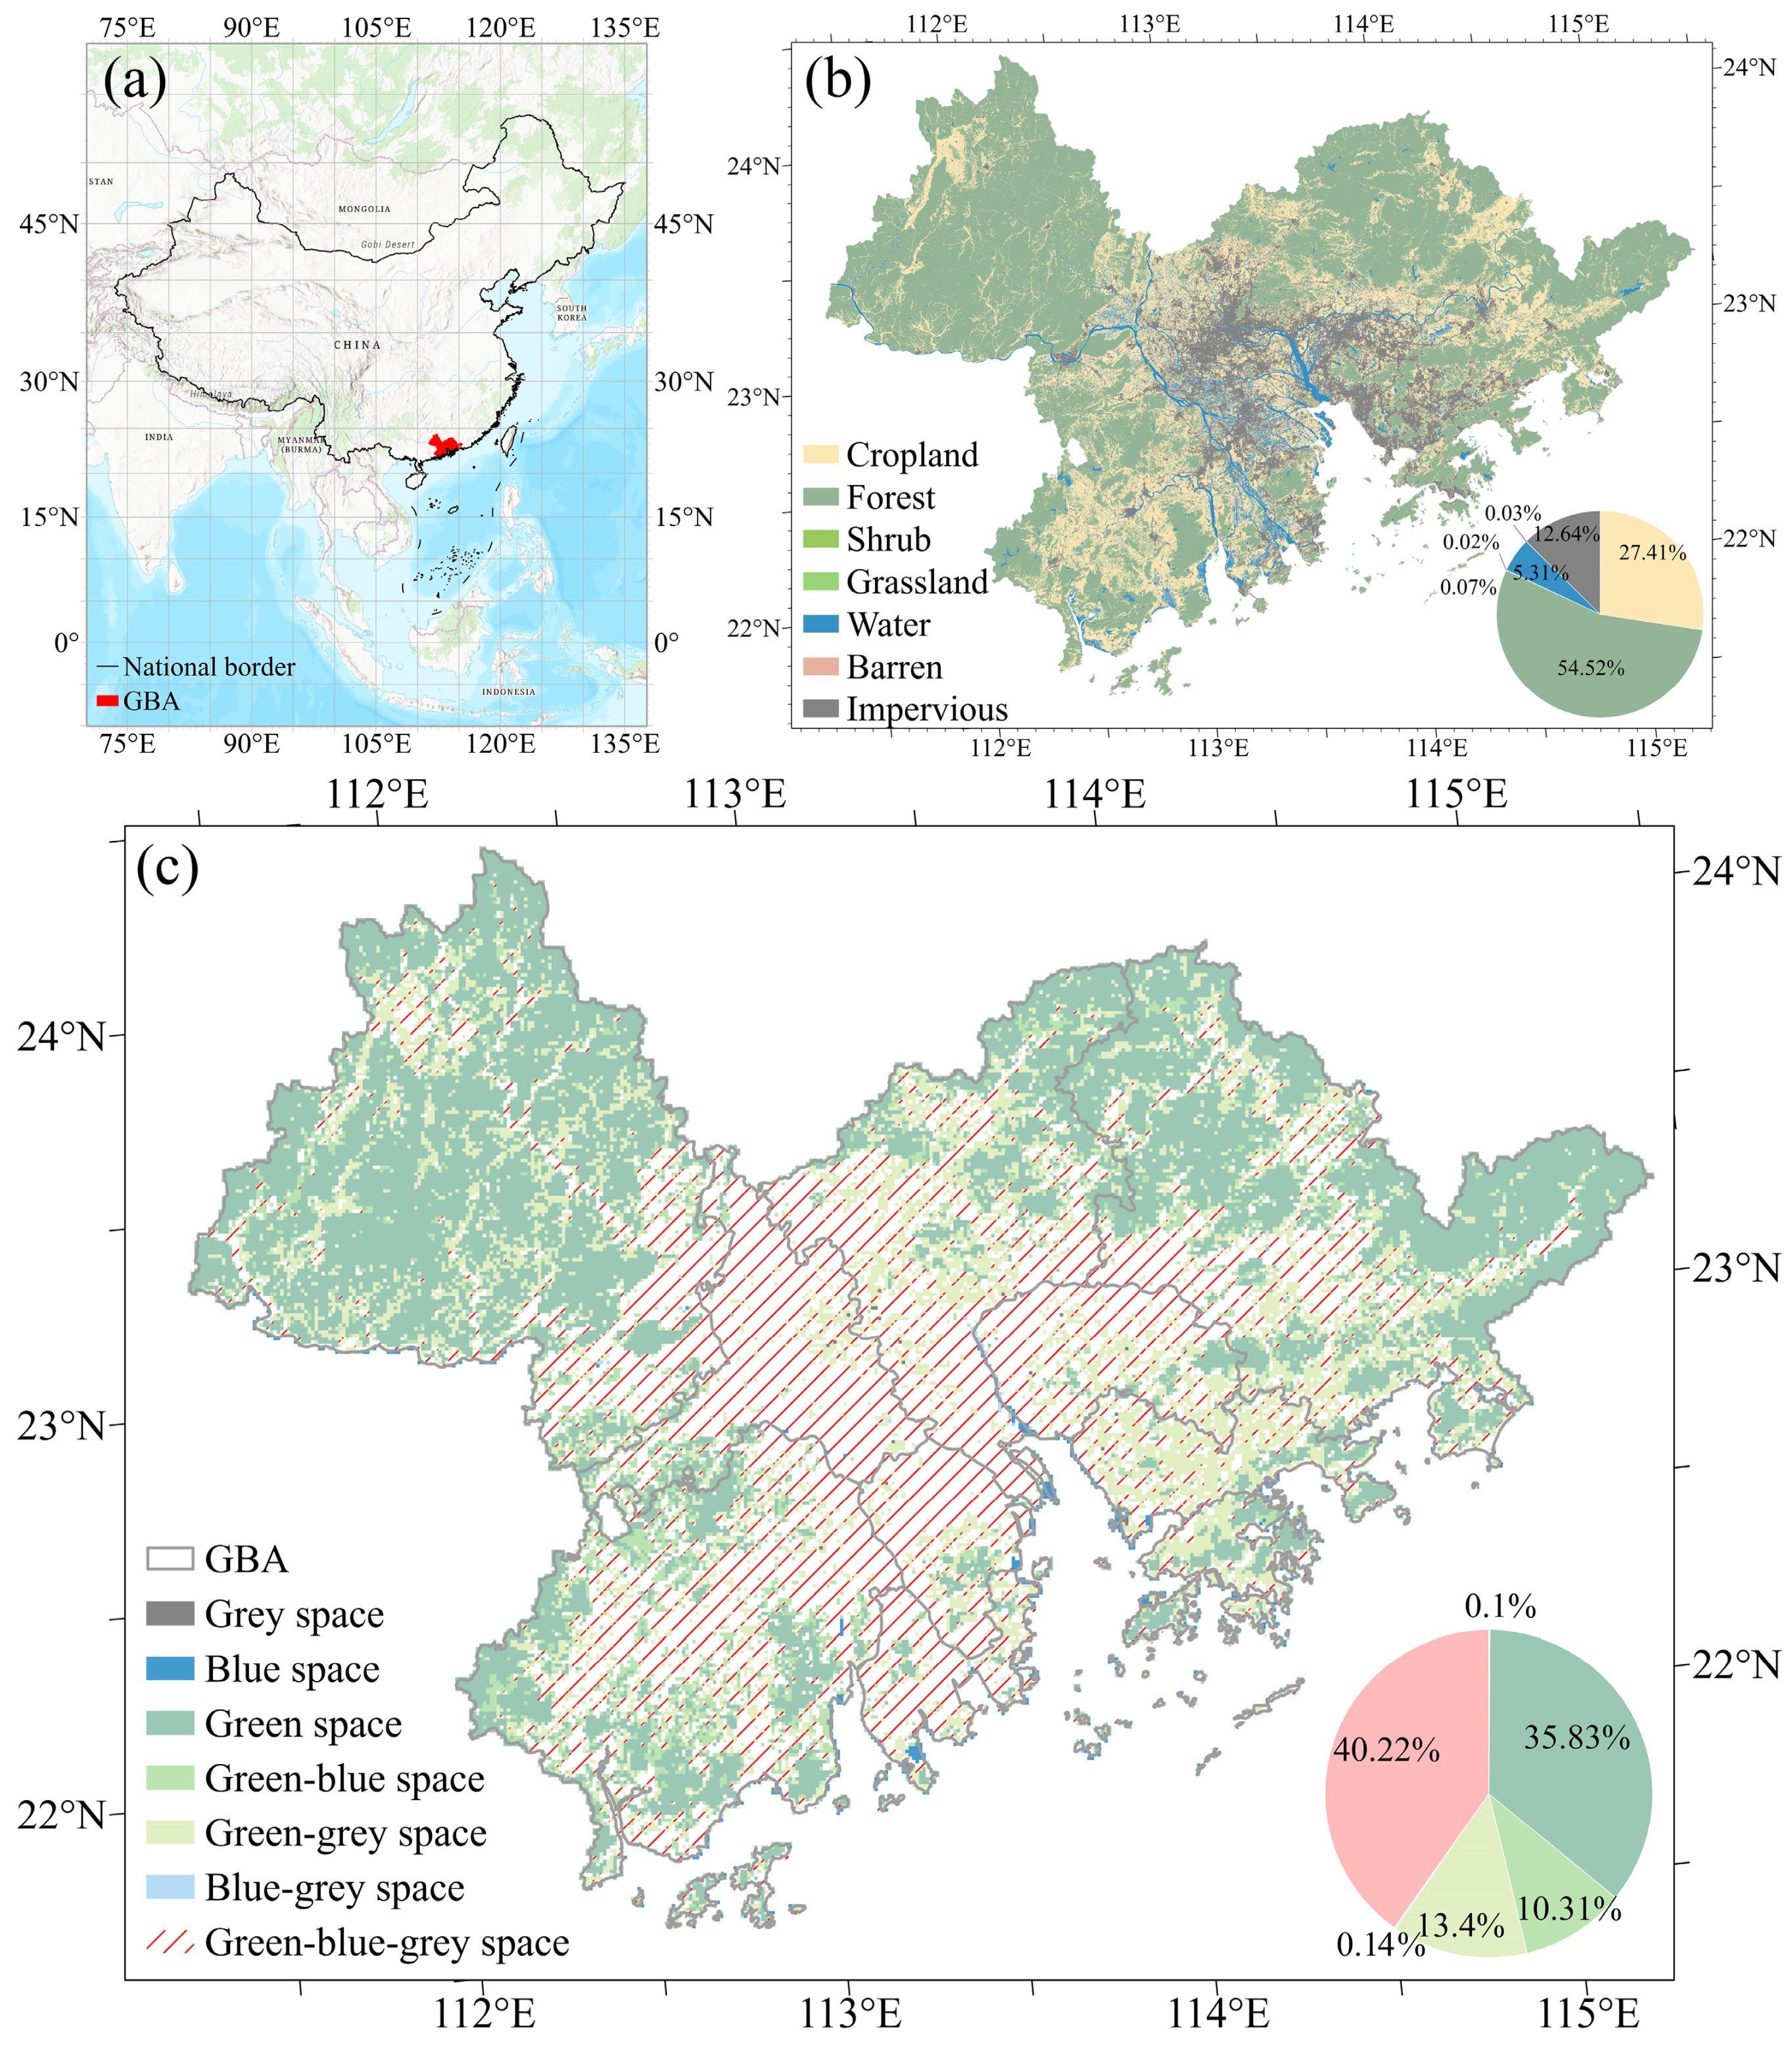
2.1. Study Area
2.2. Data Sources and Preprocessing
2.2.1. Land Cover Data
2.2.2. Indicators of Urban Thermal Environments
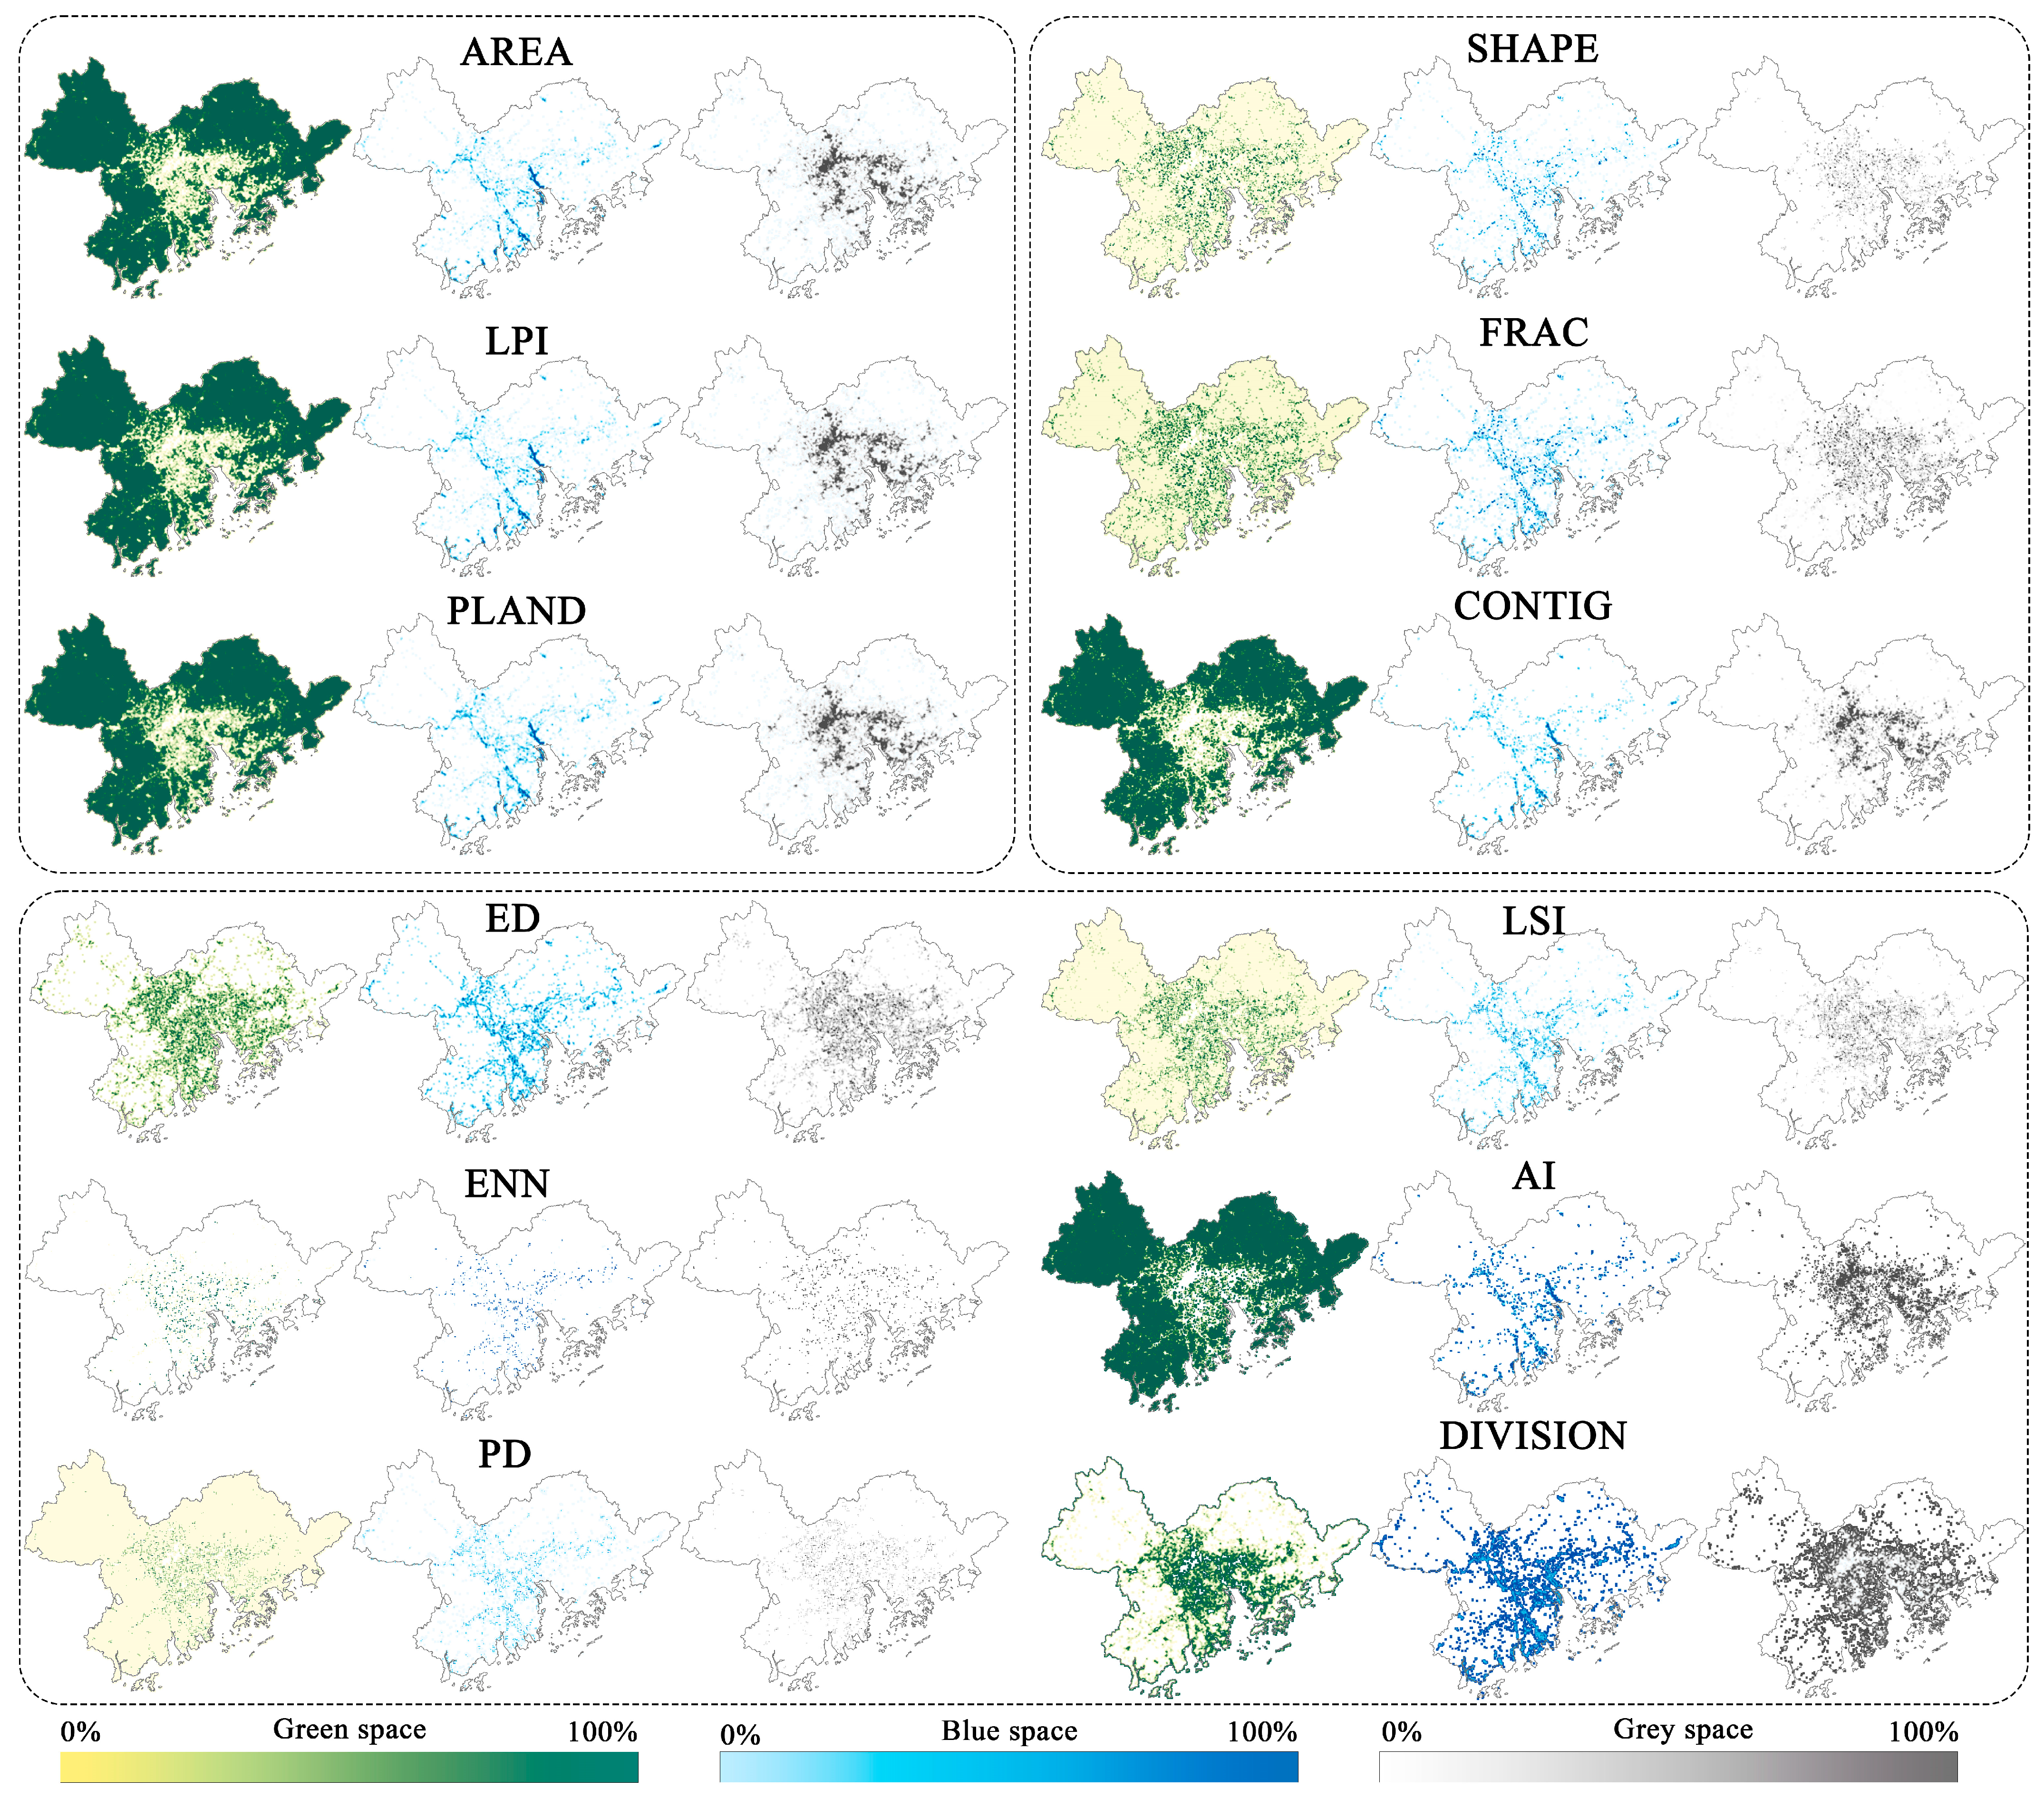
2.2.3. Indicators of Urban Space Coverage and Landscape
2.3. Methods
2.3.1. Methodology for Analyzing the Relationship Between USCL and UTE
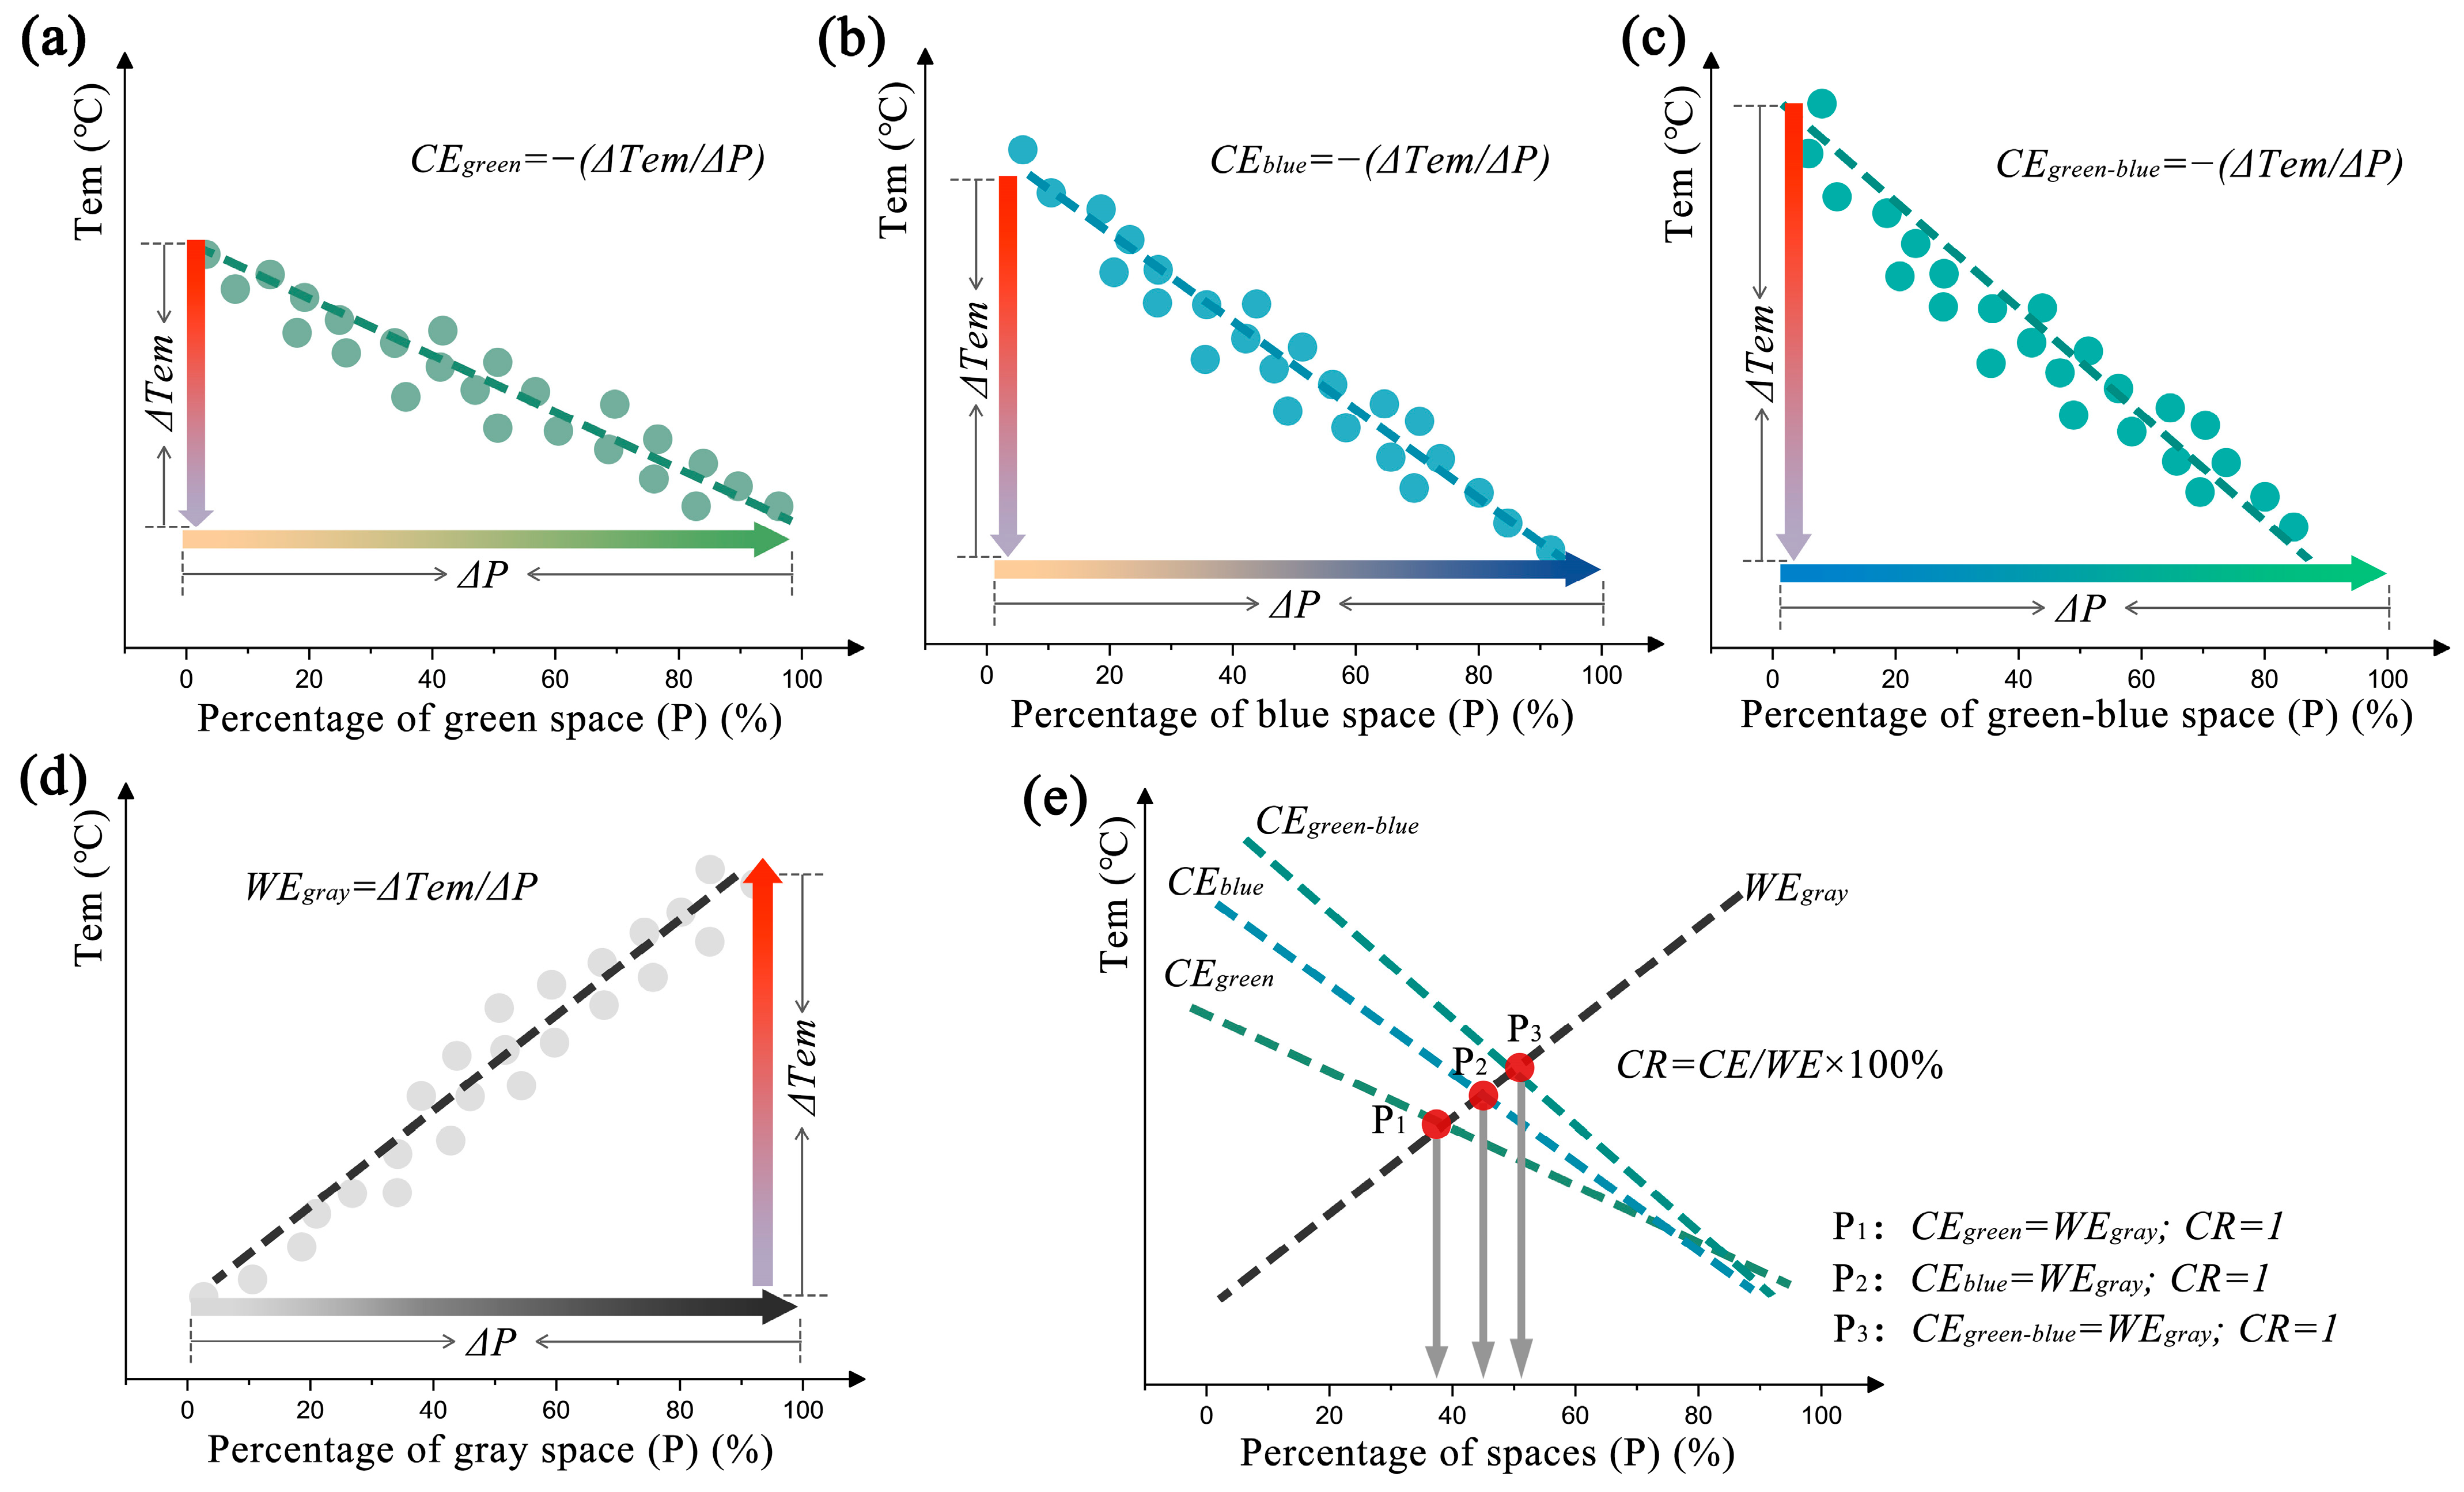
2.3.2. Cooling Efficiency and Warming Efficiency of USCL
3. Results
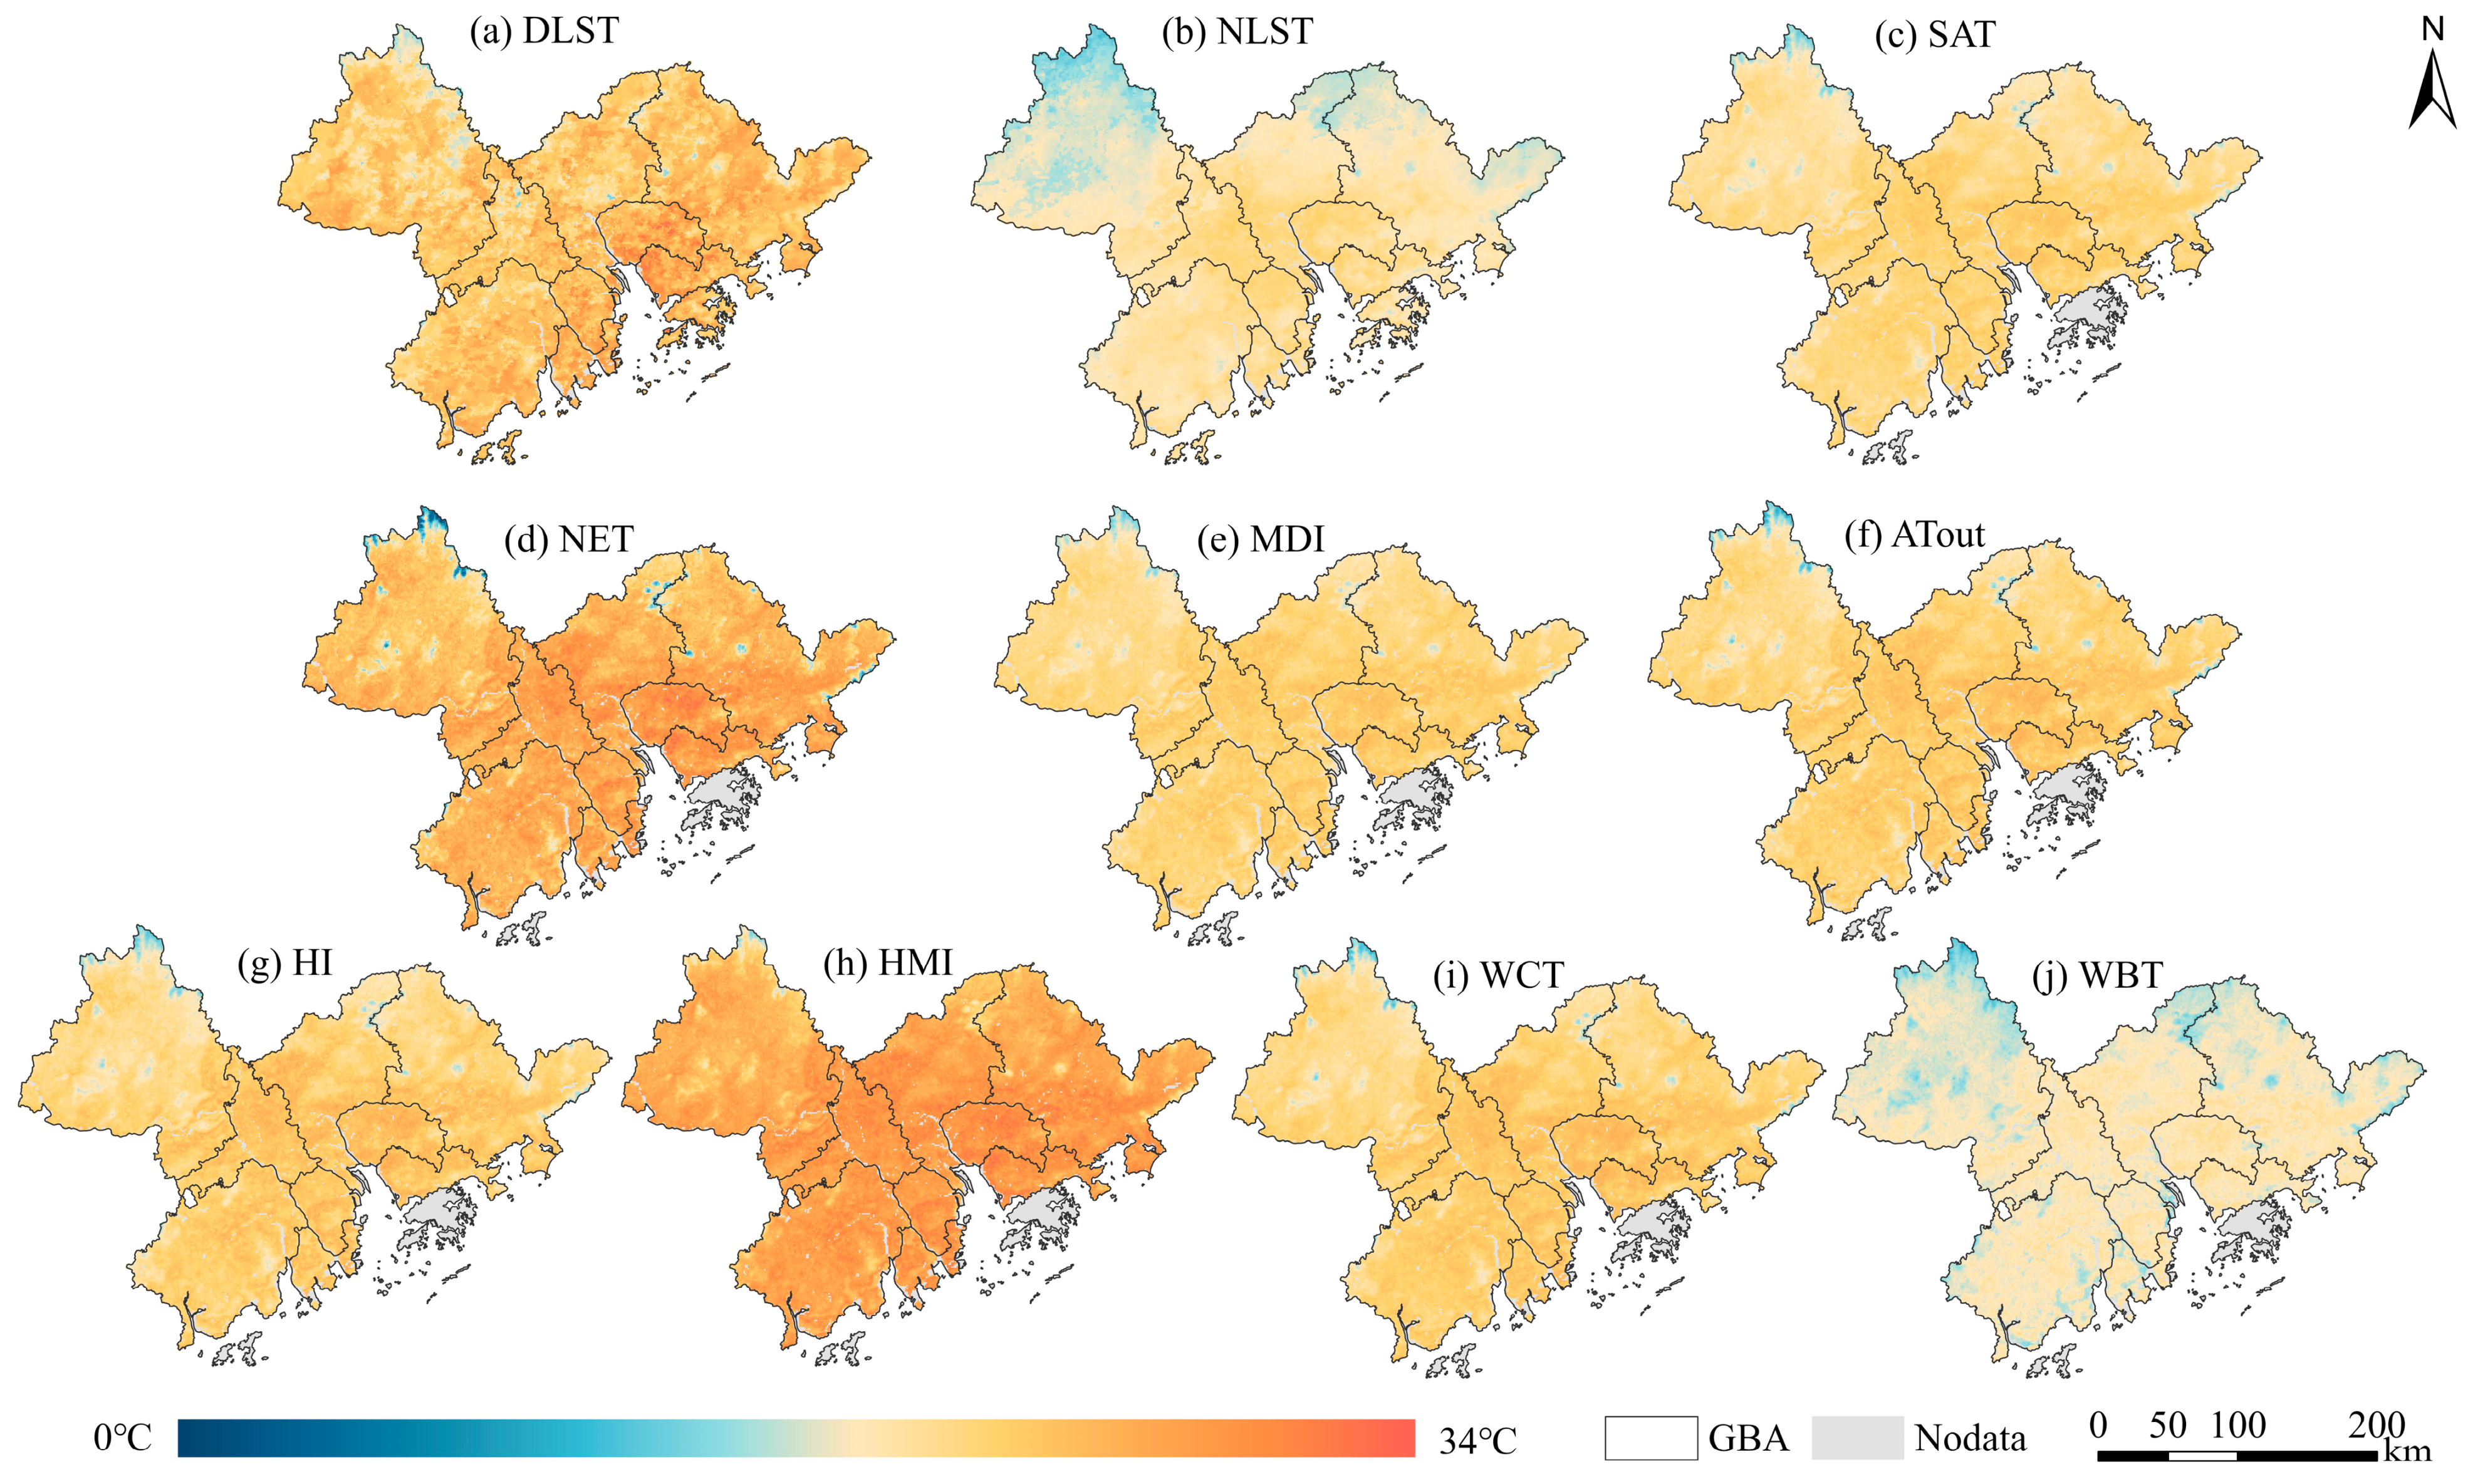
3.1. Spatial Distribution of Urban Spaces and Thermal Environments
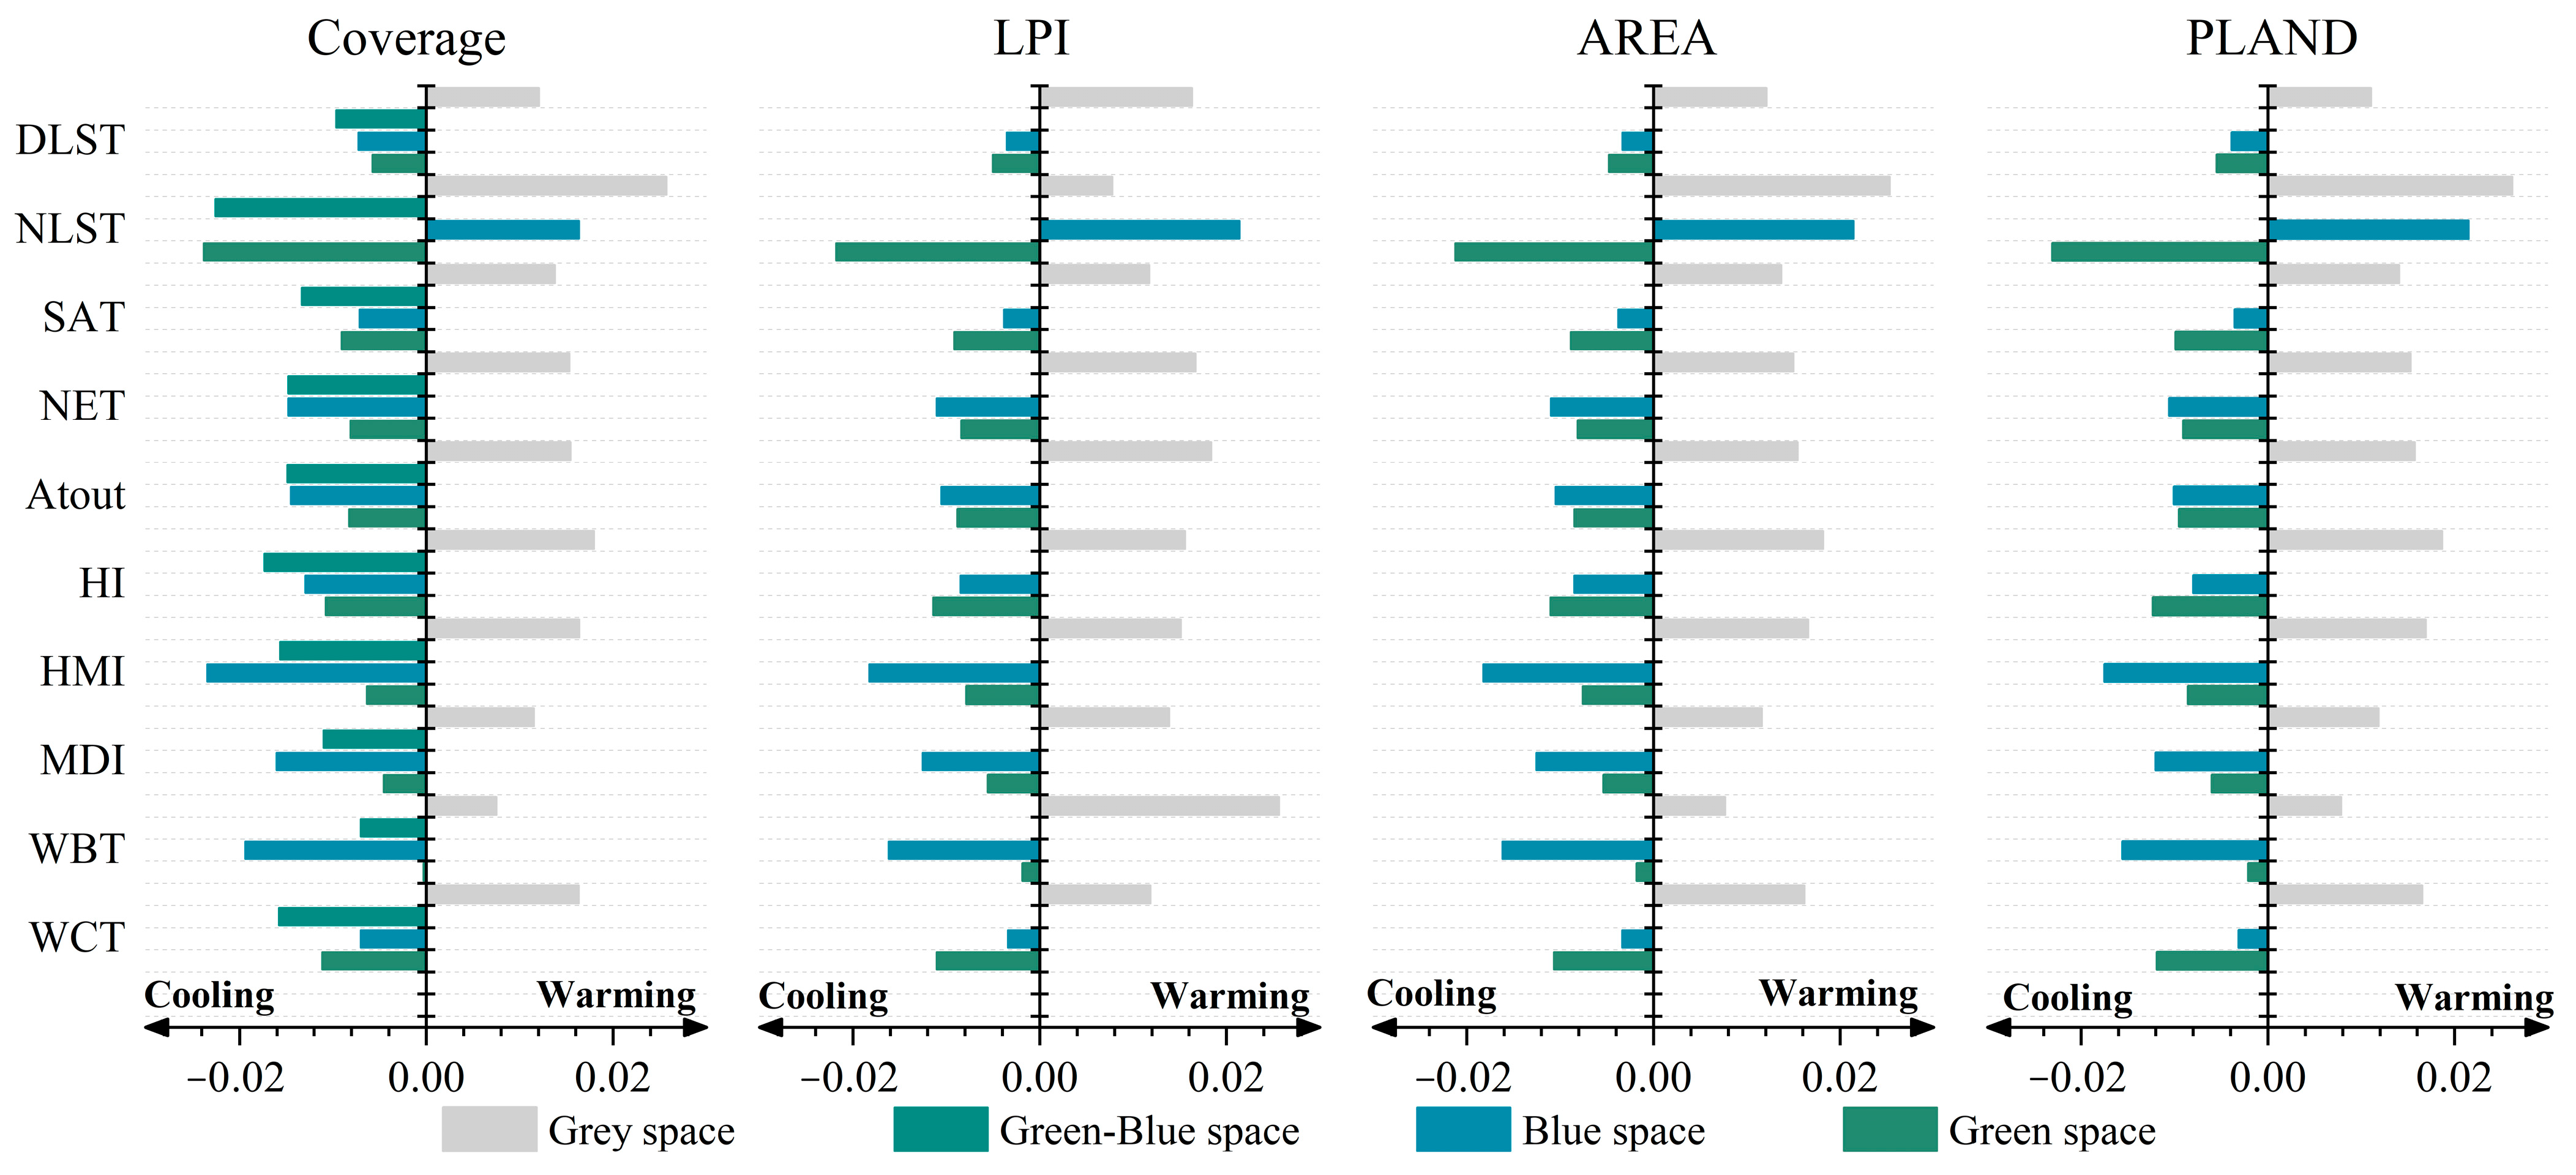
3.2. The Coverage and Landscape of Urban Spaces Significantly Affect the Thermal Environments
3.3. Cooling and Warming Efficiency in Different Urban Spaces Coverage
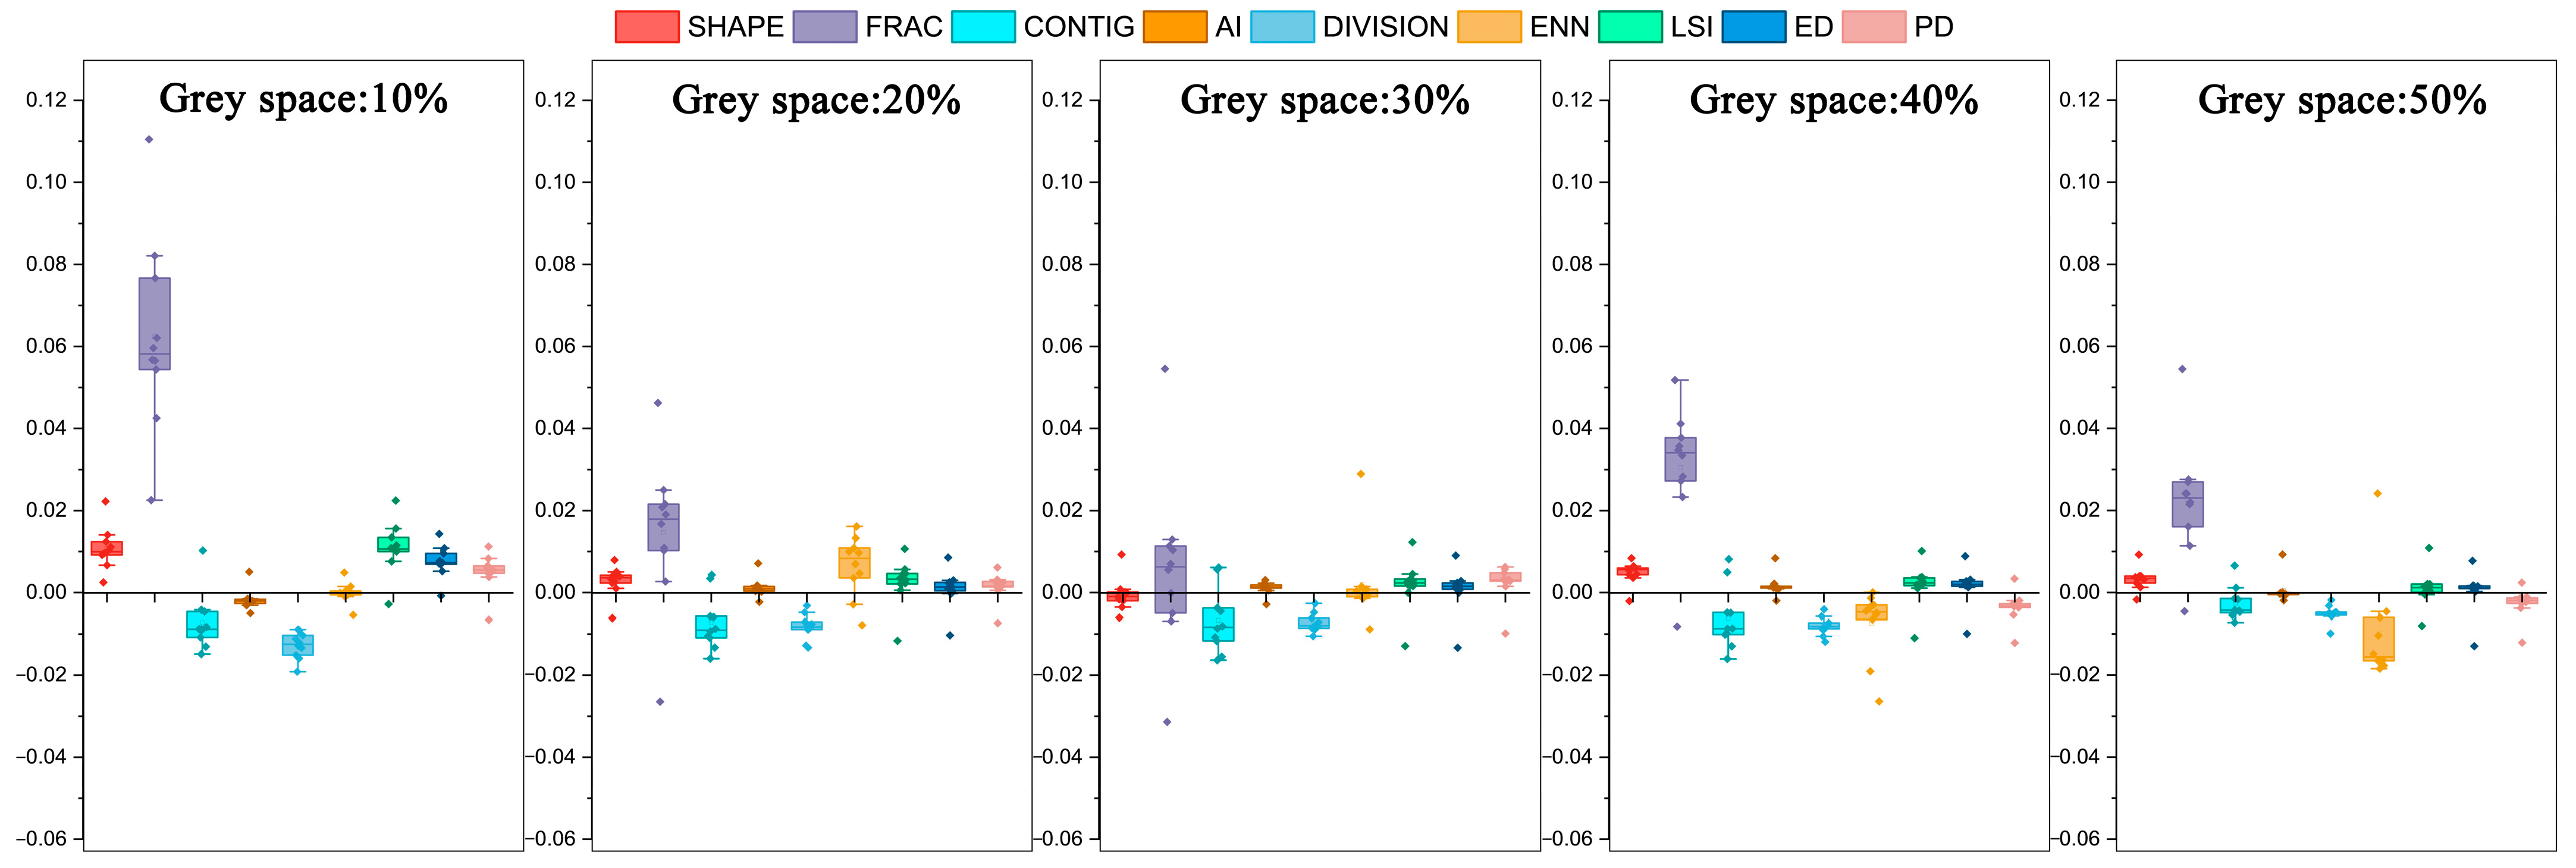
3.4. Optimal Configuration of Urban Space Coverage and Landscape
4. Discussion
4.1. Perceived Temperature and Its Role in Urban Thermal Environment
4.2. Optimal Combination of Green Blue and Grey Space for Urban Thermal Environment Cooling
4.3. Limitations of the Study
5. Conclusions
- There is a significant spatial consistency between the physical and perceived thermal environments in the GBA. Humidity and wind speed contribute to discrepancies between perceived temperature and physical environmental temperature. Perceived temperatures, including sultry and humid-heat temperatures, are lower than daytime land surface temperatures but higher than near-surface air temperatures. Discomfort temperatures exceed all temperature indices by 4 to 10 °C. Both thermal environments, however, are influenced by land use patterns and landscape configurations;
- Green and blue spaces offer substantial cooling benefits to both physical and perceived urban thermal environments, while grey spaces contribute to warming. While blue spaces can warm nighttime land surface temperatures, their overall cooling effect on the urban thermal environment remains significant. The cooling efficiency (CE) of combined blue–green spaces (average CE of 0.014 °C/%) exceeds that of green spaces alone (average CE of 0.009 °C/%) or blue spaces alone (average CE of 0.013 °C/%);
- Spatial coverage significantly impacts the regional thermal environment. Urban planning should limit the expansion of grey spaces, keeping their proportion below 30–40% per square kilometer. Green spaces should make up at least 35%, while blue spaces should comprise 15–25%. On average, a 1% increase in green space can offset 54% of the warming caused by an equivalent increase in grey space, while the same increase in blue space can offset 87%. A combination of blue and green spaces can mitigate up to 95% of the warming effect;
- The shapes and degrees of aggregation of GBGS also influence regional temperatures. In grids with low grey space proportions (10–20%), increasing blue space and simplifying the shapes of green spaces improve overall cooling efficiency. When the grey space proportion is moderate (30–40%), increasing the boundary complexity of blue spaces should be prioritized. In grids with a high grey space proportion (50%), blue space should be maintained at approximately 30%, while optimizing green space aggregation and shape, and enhancing cooling capacity through a green space network.
Supplementary Materials
Author Contributions
Funding
Data Availability Statement
Conflicts of Interest
Abbreviations
| GBGS | Green Blue Grey Spaces |
| LST | Land Surface Temperature |
| SAT | Surface Air Temperature |
| STE | Surface Urban Thermal Environments |
| PTE | Perceptual Urban Thermal Environments |
| UTE | Urban Thermal Environments |
| UHI | Urban Heat Island |
| UCI | Urban Cooling Island |
| GBA | Guangdong-Hong Kong-Macao Greater Bay Area |
| USCL | Urban Space Coverage and Landscape |
| CE | Cooling Efficiency |
| WE | Warming Efficiency |
| CR | Cooling-to-Warming Ratio |
| TVoE | Threshold Values of Efficiency |
| CG | Cooling Gradient |
| CI | Cooling Intensity |
| AS | Artificial Surfaces |
| PET | Physiological Equivalent Temperature |
| UTCI | Universal Thermal Climate Index |
| DLST | Day Land Surface Temperature |
| NLST | Night Land Surface Temperature |
| NET | Net Effective Temperature |
| ET | Effective Temperature |
| AT | Apparent Temperature |
| HI | Heat Index |
| HMI | Humidex |
| DI | Discomfort Index |
| MDI | Modified Discomfort Index |
| WCT | Wind Chill Temperature |
| WBT | Wet-Bulb Temperature |
References
- Bai, Y.; Wang, W.; Liu, M.; Xiong, X.; Li, S. Impact of urban greenspace on the urban thermal environment: A case study of Shenzhen, China. Sustain. Cities Soc. 2024, 112, 105591. [Google Scholar] [CrossRef]
- Massaro, E.; Schifanella, R.; Piccardo, M.; Caporaso, L.; Taubenbock, H.; Cescatti, A.; Duveiller, G. Spatially-optimized urban greening for reduction of population exposure to land surface temperature extremes. Nat. Commun. 2023, 14, 2903. [Google Scholar] [CrossRef]
- Raymond, C.; Matthews, T.; Horton, R.M. The emergence of heat and humidity too severe for human tolerance. Sci. Adv. 2020, 6, eaaw1838. [Google Scholar] [CrossRef] [PubMed]
- Guo, Y.; Gasparrini, A.; Armstrong, B.G.; Tawatsupa, B.; Tobias, A.; Lavigne, E.; Coelho, M.; Pan, X.; Kim, H.; Hashizume, M.; et al. Heat Wave and Mortality: A Multicountry, Multicommunity Study. Environ. Health Perspect. 2017, 125, 087006. [Google Scholar] [CrossRef]
- Tong, S.; Prior, J.; McGregor, G.; Shi, X.; Kinney, P. Urban heat: An increasing threat to global health. BMJ 2021, 375, n2467. [Google Scholar] [CrossRef]
- Estoque, R.C.; Ooba, M.; Seposo, X.T.; Togawa, T.; Hijioka, Y.; Takahashi, K.; Nakamura, S. Heat health risk assessment in Philippine cities using remotely sensed data and social-ecological indicators. Nat. Commun. 2020, 11, 1581. [Google Scholar] [CrossRef]
- Zhang, X.; Chen, F.; Chen, Z. Heatwave and mental health. J. Environ. Manag. 2023, 332, 117385. [Google Scholar] [CrossRef]
- Fouillet, A.; Rey, G.; Laurent, F.; Pavillon, G.; Bellec, S.; Guihenneuc-Jouyaux, C.; Clavel, J.; Jougla, E.; Hemon, D. Excess mortality related to the August 2003 heat wave in France. Int. Arch. Occup. Environ. Health 2006, 80, 16–24. [Google Scholar] [CrossRef]
- Yang, J.; Bao, L.; Dong, S.; Qiu, Y.; Gao, J.; Zou, S.; Tao, R.; Fan, X.; Yu, X. Integrating a heatscape index and a Patch CA model to predict land surface temperature under multiple scenarios of landscape composition and configuration. Sustain. Cities Soc. 2024, 100, 105033. [Google Scholar] [CrossRef]
- Jones, P.D.; New, M.; Parker, D.E.; Martin, S.; Rigor, I.G. Surface air temperature and its changes over the past 150 years. Rev. Geophys. 1999, 37, 173–199. [Google Scholar] [CrossRef]
- Geng, S.; Yang, L.; Sun, Z.; Wang, Z.; Qian, J.; Jiang, C.; Wen, M. Spatiotemporal patterns and driving forces of remotely sensed urban agglomeration heat islands in South China. Sci. Total Environ. 2021, 800, 149499. [Google Scholar] [CrossRef]
- Nichol, J.E.; Fung, W.Y.; Lam, K.-s.; Wong, M.S. Urban heat island diagnosis using ASTER satellite images and ‘in situ’ air temperature. Atmos. Res. 2009, 94, 276–284. [Google Scholar] [CrossRef]
- Sun, T.; Sun, R.; Chen, L. The Trend Inconsistency between Land Surface Temperature and Near Surface Air Temperature in Assessing Urban Heat Island Effects. Remote Sens. 2020, 12, 1271. [Google Scholar] [CrossRef]
- Rao, Y.; Zhang, S.; Yang, K.; Ma, Y.; Wang, W.; Niu, L. Scale Differences and Gradient Effects of Local Climate Zone Spatial Pattern on Urban Heat Island Impact—A Case in Guangzhou’s Core Area. Sustainability 2024, 16, 6656. [Google Scholar] [CrossRef]
- Venter, Z.S.; Chakraborty, T.; Lee, X. Crowdsourced air temperatures contrast satellite measures of the urban heat island and its mechanisms. Sci. Adv. 2021, 7, eabb9569. [Google Scholar] [CrossRef]
- Ho, H.C.; Knudby, A.; Xu, Y.; Hodul, M.; Aminipouri, M. A comparison of urban heat islands mapped using skin temperature, air temperature, and apparent temperature (Humidex), for the greater Vancouver area. Sci. Total Environ. 2016, 544, 929–938. [Google Scholar] [CrossRef] [PubMed]
- Martilli, A.; Roth, M.; Chow, W.T. Summer average urban-rural surface temperature differences do not indicate the need for urban heat reduction. Nature 2020, 573, 55–60. [Google Scholar]
- Givoni, B.; Noguchi, M.; Saaroni, H.; Pochter, O.; Yaacov, Y.; Feller, N.; Becker, S. Outdoor comfort research issues. Energy Build. 2003, 35, 77–86. [Google Scholar] [CrossRef]
- Nikolopoulou, M.; Baker, N.; Steemers, K. Thermal comfort in outdoor urban spaces: Understanding the human parameter. Sol. Energy 2001, 70, 227–235. [Google Scholar] [CrossRef]
- Rupp, R.F.; Vásquez, N.G.; Lamberts, R. A review of human thermal comfort in the built environment. Energy Build. 2015, 105, 178–205. [Google Scholar]
- Tseliou, A.; Tsiros, I.X.; Lykoudis, S.; Nikolopoulou, M. An evaluation of three biometeorological indices for human thermal comfort in urban outdoor areas under real climatic conditions. Build. Environ. 2010, 45, 1346–1352. [Google Scholar] [CrossRef]
- Höppe, P. The physiological equivalent temperature—A universal index for the biometeorological assessment of the thermal environment. Int. J. Biometeorol. 1999, 43, 71–75. [Google Scholar] [CrossRef]
- Coccolo, S.; Kämpf, J.; Scartezzini, J.-L.; Pearlmutter, D. Outdoor human comfort and thermal stress: A comprehensive review on models and standards. Urban Clim. 2016, 18, 33–57. [Google Scholar] [CrossRef]
- Reinhart, C.F.; Dhariwal, J.; Gero, K. Biometeorological indices explain outside dwelling patterns based on Wi-Fi data in support of sustainable urban planning. Build. Environ. 2017, 126, 422–430. [Google Scholar] [CrossRef]
- Matzarakis, A.; Mayer, H. Another kind of environmental stress: Thermal stress. WHO Newsl. 1996, 18, 7–10. [Google Scholar]
- Li, P.; Chan, S. Application of a weather stress index for alerting the public to stressful weather in Hong Kong. Meteorol. Appl. A J. Forecast. Pract. Appl. Train. Tech. Model. 2000, 7, 369–375. [Google Scholar] [CrossRef]
- Steadman, R.G. A universal scale of apparent temperature. J. Appl. Meteorol. Climatol. 1984, 23, 1674–1687. [Google Scholar] [CrossRef]
- Steadman, R.G. The assessment of sultriness. Part I: A temperature-humidity index based on human physiology and clothing science. J. Appl. Meteorol. Climatol. 1979, 18, 861–873. [Google Scholar] [CrossRef]
- Rothfusz, L.P. The Heat Index Equation (or, More Than You Ever Wanted to Know About Heat Index); NWS S. Reg. Headquarters: Forth Worth, TX, USA, 1990. [Google Scholar]
- Masterton, J.M.; Richardson, F. Humidex: A Method of Quantifying Human Discomfort Due to Excessive Heat And Humidity; Environment Canada, Atmospheric Environment: Downsview, ON, Canada, 1981. [Google Scholar]
- Sohar, E.; Adar, R.; Kaly, J. Comparison of the environmental heat load in various parts of Israel. Bull. Res. Counc. Isr. E 1963, 10, 111–115. [Google Scholar]
- Moran, D.; Shapiro, Y.; Epstein, Y.; Matthew, W.; Pandolf, K. A Modified Discomfort Index (MDI) as an Alternative to the Wet Bulb Globe Temperature (WBGT); Environmental Ergonomics VIII; Hodgdon, J.A., Heaney, J.H., Buono, M.J., Eds.; San Diego State University: San Diego, CA, USA, 1998; pp. 77–80. [Google Scholar]
- Osczevski, R.; Bluestein, M. The new wind chill equivalent temperature chart. Bull. Am. Meteorol. Soc. 2005, 86, 1453–1458. [Google Scholar] [CrossRef]
- Stull, R. Wet-bulb temperature from relative humidity and air temperature. J. Appl. Meteorol. Climatol. 2011, 50, 2267–2269. [Google Scholar] [CrossRef]
- Phelan, P.E.; Kaloush, K.; Miner, M.; Golden, J.; Phelan, B.; Silva III, H.; Taylor, R.A. Urban heat island: Mechanisms, implications, and possible remedies. Annu. Rev. Environ. Resour. 2015, 40, 285–307. [Google Scholar] [CrossRef]
- Chen, L.; Wang, X.; Cai, X.; Yang, C.; Lu, X. Combined Effects of Artificial Surface and Urban Blue-Green Space on Land Surface Temperature in 28 Major Cities in China. Remote Sens. 2022, 14, 448. [Google Scholar] [CrossRef]
- Sheng, S.; Wang, Y. Configuration characteristics of green-blue spaces for efficient cooling in urban environments. Sustain. Cities Soc. 2024, 100, 105040. [Google Scholar] [CrossRef]
- Wu, J.; Yang, S.; Zhang, X. Interaction Analysis of Urban Blue-Green Space and Built-Up Area Based on Coupling Model—A Case Study of Wuhan Central City. Water 2020, 12, 2185. [Google Scholar] [CrossRef]
- Wu, W.; Guo, F.; Elze, S.; Knopp, J.; Banzhaf, E. Deciphering the effects of 2D/3D urban morphology on diurnal cooling efficiency of urban green space. Build. Environ. 2024, 266, 112047. [Google Scholar] [CrossRef]
- Yang, F.; Yang, D.; Zhang, Y.; Guo, R.; Li, J.; Wang, H. Evaluating the multi-seasonal impacts of urban blue-green space combination models on cooling and carbon-saving capacities. Build. Environ. 2024, 266, 112045. [Google Scholar] [CrossRef]
- Guan, S.; Hu, H. Exploring the potential relationship between cooling green space and built-up area: Analysis of community green space characteristics based on GWPCA. Build. Environ. 2025, 267, 112190. [Google Scholar] [CrossRef]
- Wang, Y.; Ouyang, W.; Zhang, J. Matching supply and demand of cooling service provided by urban green and blue space. Urban For. Urban Green. 2024, 96, 128338. [Google Scholar] [CrossRef]
- Mohajerani, A.; Bakaric, J.; Jeffrey-Bailey, T. The urban heat island effect, its causes, and mitigation, with reference to the thermal properties of asphalt concrete. J Env. Manag. 2017, 197, 522–538. [Google Scholar] [CrossRef]
- Zhang, S.; Yang, K.; Ma, Y.; Li, M. The Expansion Dynamics and Modes of Impervious Surfaces in the Guangdong-Hong Kong-Macau Bay Area, China. Land 2021, 10, 1167. [Google Scholar] [CrossRef]
- Ma, Y.; Zhang, S.; Yang, K.; Li, M. Influence of spatiotemporal pattern changes of impervious surface of urban megaregion on thermal environment: A case study of the Guangdong–Hong Kong–Macao Greater Bay Area of China. Ecol. Indic. 2021, 121, 107106. [Google Scholar] [CrossRef]
- Peng, J.; Liu, Q.; Xu, Z.; Lyu, D.; Du, Y.; Qiao, R.; Wu, J. How to effectively mitigate urban heat island effect? A perspective of waterbody patch size threshold. Landsc. Urban Plan. 2020, 202, 103873. [Google Scholar] [CrossRef]
- Li, Y.; Svenning, J.C.; Zhou, W.; Zhu, K.; Abrams, J.F.; Lenton, T.M.; Ripple, W.J.; Yu, Z.; Teng, S.N.; Dunn, R.R.; et al. Green spaces provide substantial but unequal urban cooling globally. Nat. Commun. 2024, 15, 7108. [Google Scholar] [CrossRef]
- Lehnert, M.; Brabec, M.; Jurek, M.; Tokar, V.; Geletič, J. The role of blue and green infrastructure in thermal sensation in public urban areas: A case study of summer days in four Czech cities. Sustain. Cities Soc. 2021, 66, 102683. [Google Scholar] [CrossRef]
- Yu, Z.; Guo, X.; Jørgensen, G.; Vejre, H. How can urban green spaces be planned for climate adaptation in subtropical cities? Ecol. Indic. 2017, 82, 152–162. [Google Scholar] [CrossRef]
- Sun, R.; Chen, L. How can urban water bodies be designed for climate adaptation? Landsc. Urban Plan. 2012, 105, 27–33. [Google Scholar] [CrossRef]
- Abd-Elmabod, S.K.; Gui, D.; Liu, Q.; Liu, Y.; Al-Qthanin, R.N.; Jiménez-González, M.A.; Jones, L. Seasonal environmental cooling benefits of urban green and blue spaces in arid regions. Sustain. Cities Soc. 2024, 115, 105805. [Google Scholar] [CrossRef]
- Cheng, X.; Liu, Y.; Dong, J.; Corcoran, J.; Peng, J. Opposite climate impacts on urban green spaces’ cooling efficiency around their coverage change thresholds in major African cities. Sustain. Cities Soc. 2023, 88, 104254. [Google Scholar] [CrossRef]
- Xue, X.; He, T.; Xu, L.; Tong, C.; Ye, Y.; Liu, H.; Xu, D.; Zheng, X. Quantifying the spatial pattern of urban heat islands and the associated cooling effect of blue-green landscapes using multisource remote sensing data. Sci. Total Env. 2022, 843, 156829. [Google Scholar] [CrossRef]
- Jiao, M.; Zhou, W.; Zheng, Z.; Wang, J.; Qian, Y. Patch size of trees affects its cooling effectiveness: A perspective from shading and transpiration processes. Agric. For. Meteorol. 2017, 247, 293–299. [Google Scholar] [CrossRef]
- Tan, X.; Sun, X.; Huang, C.; Yuan, Y.; Hou, D. Comparison of cooling effect between green space and water body. Sustain. Cities Soc. 2021, 67, 102711. [Google Scholar] [CrossRef]
- Hu, N.; Wang, G.; Ma, Z.; Ren, Z.; Zhao, M.; Meng, J. The cooling effects of urban waterbodies and their driving forces in China. Ecol. Indic. 2023, 156, 111200. [Google Scholar] [CrossRef]
- Yu, Z.; Yang, G.; Zuo, S.; Jørgensen, G.; Koga, M.; Vejre, H. Critical review on the cooling effect of urban blue-green space: A threshold-size perspective. Urban For. Urban Green. 2020, 49, 126630. [Google Scholar] [CrossRef]
- Fan, H.; Yu, Z.; Yang, G.; Liu, T.Y.; Liu, T.Y.; Hung, C.H.; Vejre, H. How to cool hot-humid (Asian) cities with urban trees? An optimal landscape size perspective. Agric. For. Meteorol. 2019, 265, 338–348. [Google Scholar] [CrossRef]
- Zhou, W.; Huang, G.; Pickett, S.T.; Wang, J.; Cadenasso, M.; McPhearson, T.; Grove, J.M.; Wang, J. Urban tree canopy has greater cooling effects in socially vulnerable communities in the US. One Earth 2021, 4, 1764–1775. [Google Scholar] [CrossRef]
- Yang, F.; Yousefpour, R.; Zhang, Y.; Wang, H. The assessment of cooling capacity of blue-green spaces in rapidly developing cities: A case study of Tianjin’s central urban area. Sustain. Cities Soc. 2023, 99, 104918. [Google Scholar] [CrossRef]
- Qian, Y.; Zhou, W.; Pickett, S.T.; Yu, W.; Xiong, D.; Wang, W.; Jing, C. Integrating structure and function: Mapping the hierarchical spatial heterogeneity of urban landscapes. Ecol. Process. 2020, 9, 59. [Google Scholar] [CrossRef]
- Li, Y.; Schubert, S.; Kropp, J.P.; Rybski, D. On the influence of density and morphology on the Urban Heat Island intensity. Nat. Commun. 2020, 11, 2647. [Google Scholar] [CrossRef]
- Peng, J.; Xie, P.; Liu, Y.; Ma, J. Urban thermal environment dynamics and associated landscape pattern factors: A case study in the Beijing metropolitan region. Remote Sens. Environ. 2016, 173, 145–155. [Google Scholar] [CrossRef]
- Chen, Y.; Yang, J.; Yu, W.; Ren, J.; Xiao, X.; Xia, J.C. Relationship between urban spatial form and seasonal land surface temperature under different grid scales. Sustain. Cities Soc. 2023, 89, 104374. [Google Scholar] [CrossRef]
- Sun, Y.; Gao, C.; Li, J.; Wang, R.; Liu, J. Evaluating urban heat island intensity and its associated determinants of towns and cities continuum in the Yangtze River Delta Urban Agglomerations. Sustain. Cities Soc. 2019, 50, 101659. [Google Scholar] [CrossRef]
- Liu, W.; Meng, Q.; Allam, M.; Zhang, L.; Hu, D.; Menenti, M. Driving Factors of Land Surface Temperature in Urban Agglomerations: A Case Study in the Pearl River Delta, China. Remote Sens. 2021, 13, 2858. [Google Scholar] [CrossRef]
- Ma, Y.; Yang, K.; Zhang, S.; Li, M. Impacts of Large-Area Impervious Surfaces on Regional Land Surface Temperature in the Great Pearl River Delta, China. J. Indian Soc. Remote Sens. 2019, 47, 1831–1845. [Google Scholar] [CrossRef]
- Wang, Q.; Wang, H.; Ren, L.; Chen, J.; Wang, X. Hourly impact of urban features on the spatial distribution of land surface temperature: A study across 30 cities. Sustain. Cities Soc. 2024, 113, 105701. [Google Scholar] [CrossRef]
- Mohammad, P.; Goswami, A.; Chauhan, S.; Nayak, S. Machine learning algorithm based prediction of land use land cover and land surface temperature changes to characterize the surface urban heat island phenomena over Ahmedabad city, India. Urban Clim. 2022, 42, 101116. [Google Scholar] [CrossRef]
- Zhang, H.; Luo, M.; Zhao, Y.; Lin, L.; Ge, E.; Yang, Y.; Ning, G.; Cong, J.; Zeng, Z.; Gui, K.; et al. HiTIC-Monthly: A monthly high spatial resolution (1 km) human thermal index collection over China during 2003–2020. Earth Syst. Sci. Data 2023, 15, 359–381. [Google Scholar] [CrossRef]
- Zhou, W.; Cao, F. Effects of changing spatial extent on the relationship between urban forest patterns and land surface temperature. Ecol. Indic. 2020, 109, 105778. [Google Scholar] [CrossRef]
- Yu, S.; Chen, Z.; Yu, B.; Wang, L.; Wu, B.; Wu, J.; Zhao, F. Exploring the relationship between 2D/3D landscape pattern and land surface temperature based on explainable eXtreme Gradient Boosting tree: A case study of Shanghai, China. Sci. Total Env. 2020, 725, 138229. [Google Scholar] [CrossRef]
- Song, Y.; Wang, J.; Ge, Y.; Xu, C. An optimal parameters-based geographical detector model enhances geographic characteristics of explanatory variables for spatial heterogeneity analysis: Cases with different types of spatial data. GIScience Remote Sens. 2020, 57, 593–610. [Google Scholar] [CrossRef]
- Cen, Q.; Zhou, X.; Qiu, H. Exploration of urban neighborhood blue-green space quality patterns and influencing factors in waterfront cities based on MGWR and OPGD models. Urban Clim. 2024, 55, 101942. [Google Scholar] [CrossRef]
- Wang, W.; Hu, Y.; Song, R.; Guo, Z. Analysis of the Spatiotemporal Heterogeneity of Various Landscape Processes and Their Driving Factors Based on the OPGD Model for the Jiaozhou Bay Coast Zone, China. Land 2021, 11, 7. [Google Scholar] [CrossRef]
- Luo, K.; Samat, A.; Li, W.; Xu, W.; Abuduwaili, J. Assessing Ecological Quality Dynamics and Driving Factors in the Irtysh River Basin using AWBEI and OPGD approaches. IEEE J. Sel. Top. Appl. Earth Obs. Remote Sens. 2024, 18, 1153–1173. [Google Scholar] [CrossRef]
- Wang, J.F.; Li, X.H.; Christakos, G.; Liao, Y.L.; Zhang, T.; Gu, X.; Zheng, X.Y. Geographical detectors-based health risk assessment and its application in the neural tube defects study of the Heshun Region, China. Int. J. Geogr. Inf. Sci. 2010, 24, 107–127. [Google Scholar] [CrossRef]
- de Freitas, C.R.; Grigorieva, E.A. A comparison and appraisal of a comprehensive range of human thermal climate indices. Int. J. Biometeorol. 2017, 61, 487–512. [Google Scholar] [CrossRef]
- Salata, F.; Golasi, I.; Petitti, D.; de Lieto Vollaro, E.; Coppi, M.; de Lieto Vollaro, A. Relating microclimate, human thermal comfort and health during heat waves: An analysis of heat island mitigation strategies through a case study in an urban outdoor environment. Sustain. Cities Soc. 2017, 30, 79–96. [Google Scholar] [CrossRef]
- Huang, X.; Song, J.; Wang, C.; Chan, P.W. Realistic representation of city street-level human thermal stress via a new urban climate-human coupling system. Renew. Sustain. Energy Rev. 2022, 169, 112919. [Google Scholar] [CrossRef]
- Mashhoodi, B.; Unceta, P.M. Urban form and surface temperature inequality in 683 European cities. Sustain. Cities Soc. 2024, 113, 105690. [Google Scholar] [CrossRef]
- Pigliautile, I.; Pisello, A.L.; Bou-Zeid, E. Humans in the city: Representing outdoor thermal comfort in urban canopy models. Renew. Sustain. Energy Rev. 2020, 133, 110103. [Google Scholar] [CrossRef]
- Kruger, E.L.; Costa, T. Interferences of urban form on human thermal perception. Sci. Total Env. 2019, 653, 1067–1076. [Google Scholar] [CrossRef]
- Potchter, O.; Cohen, P.; Lin, T.P.; Matzarakis, A. Outdoor human thermal perception in various climates: A comprehensive review of approaches, methods and quantification. Sci. Total Environ. 2018, 631–632, 390–406. [Google Scholar] [CrossRef]
- Coccolo, S.; Pearlmutter, D.; Kaempf, J.; Scartezzini, J.-L. Thermal Comfort Maps to estimate the impact of urban greening on the outdoor human comfort. Urban For. Urban Green. 2018, 35, 91–105. [Google Scholar] [CrossRef]
- Ha, J.; Kim, H.J.; With, K.A. Urban green space alone is not enough: A landscape analysis linking the spatial distribution of urban green space to mental health in the city of Chicago. Landsc. Urban Plan. 2022, 218, 104309. [Google Scholar] [CrossRef]
- Gao, J.; Gong, J.; Yang, J.; Li, J.; Li, S. Measuring Spatial Connectivity between patches of the heat source and sink (SCSS): A new index to quantify the heterogeneity impacts of landscape patterns on land surface temperature. Landsc. Urban Plan. 2022, 217, 104260. [Google Scholar] [CrossRef]
- Liu, H.; Huang, B.; Zhan, Q.; Gao, S.; Li, R.; Fan, Z. The influence of urban form on surface urban heat island and its planning implications: Evidence from 1288 urban clusters in China. Sustain. Cities Soc. 2021, 71, 102987. [Google Scholar] [CrossRef]
- Sodoudi, S.; Zhang, H.; Chi, X.; Müller, F.; Li, H. The influence of spatial configuration of green areas on microclimate and thermal comfort. Urban For. Urban Green. 2018, 34, 85–96. [Google Scholar] [CrossRef]
- Xu, J.; Wei, Q.; Huang, X.; Zhu, X.; Li, G. Evaluation of human thermal comfort near urban waterbody during summer. Build. Environ. 2010, 45, 1072–1080. [Google Scholar] [CrossRef]
- Ampatzidis, P.; Kershaw, T. A review of the impact of blue space on the urban microclimate. Sci. Total Environ. 2020, 730, 139068. [Google Scholar] [CrossRef]
- Cai, Z.; Guldmann, J.M.; Tang, Y.; Han, G. Does city-water layout matter? Comparing the cooling effects of water bodies across 34 Chinese megacities. J. Environ. Manag. 2022, 324, 116263. [Google Scholar] [CrossRef]
- Mitchell, V.G.; Cleugh, H.A.; Grimmond, C.S.B.; Xu, J. Linking urban water balance and energy balance models to analyse urban design options. Hydrol. Process. 2007, 22, 2891–2900. [Google Scholar] [CrossRef]
- Masoudi, M.; Tan, P.Y.; Fadaei, M. The effects of land use on spatial pattern of urban green spaces and their cooling ability. Urban Clim. 2021, 35, 100743. [Google Scholar] [CrossRef]
- Masoudi, M.; Tan, P.Y. Multi-year comparison of the effects of spatial pattern of urban green spaces on urban land surface temperature. Landsc. Urban Plan. 2019, 184, 44–58. [Google Scholar] [CrossRef]
- Zhou, W.; Wang, J.; Cadenasso, M.L. Effects of the spatial configuration of trees on urban heat mitigation: A comparative study. Remote Sens. Environ. 2017, 195, 1–12. [Google Scholar] [CrossRef]
- Wang, X.; Li, H.; Sodoudi, S. The effectiveness of cool and green roofs in mitigating urban heat island and improving human thermal comfort. Build. Environ. 2022, 217, 109082. [Google Scholar] [CrossRef]
- He, B.-J. Towards the next generation of green building for urban heat island mitigation: Zero UHI impact building. Sustain. Cities Soc. 2019, 50, 101647. [Google Scholar] [CrossRef]


| Urban Regions | Descriptions | Number of Grids |
|---|---|---|
| 100% green space | The area consists of complete green space in the grid. | 21,453 |
| 100% blue space | The area consists of complete blue space in the grid. | 472 |
| 100% grey space | The area consists of complete grey space in the grid. | 385 |
| Green–blue space | The grid where the proportions of green and blue spaces are both greater than 0% but less than 100%, indicating a coexistence of green and blue spaces without grey space. | 4550 |
| Green–grey space | The grid where the proportions of green and grey spaces are both greater than 0% but less than 100%, indicating a coexistence of green and grey spaces without blue space. | 10,664 |
| Blue–grey space | The grid where the proportions of blue and grey spaces are both greater than 0% but less than 100%, indicating a coexistence of blue and grey spaces without green space. | 89 |
| Green–blue–grey space | The grid where the proportions of green, blue, and grey spaces are all greater than 0% but less than 100%, indicating the coexistence of all three types of space. The green space, blue space, and grey space mentioned in this study refer to the component of the grid of green–blue–grey space. | 23,831 |
| Abbreviation | Index | Spatial Resolution | Data Source |
|---|---|---|---|
| DLST | Land surface temperature of day | 500 m | MODIS Aqua satellite (13:30 P.M.) |
| NLST | Land surface temperature of night | 500 m | MODIS Aqua satellite (01:30 A.M.) |
| SAT | Surface air temperature | 0.1° | https://doi.org/10.5281/zenodo.6895533 [70] |
| NET | Net effective temperature | 0.1° | |
| ATout | Apparent temperature (outdoors, in the shade) | 0.1° | |
| HI | Heat index | 0.1° | |
| HMI | Humidex | 0.1° | |
| MDI | Modified discomfort index | 0.1° | |
| WBT | Wet-bulb temperature | 0.1° | |
| WCT | Wind chill temperature | 0.1° |
| Metrics | Index | Unit | Description |
|---|---|---|---|
| Coverage | Coverage | % | Coverage of spaces in each grid |
| Area | Patch Area Distribution (AREA) | ha | Area (m2) of the patch, converted to hectares by dividing by 10,000. |
| Percentage of Landscape (PLAND) | % | Percentage of the landscape occupied by the corresponding patch type. | |
| Largest Patch Index (LPI) | % | Percentage of the total landscape area comprised by the largest patch. A higher LPI indicates greater dominance by a single landscape patch. | |
| Shape | Shape Index Distribution (SHAPE) | - | Mean ratio between the actual perimeter of the patches and the square root of the patch area. |
| Fractal Index Distribution (FRAC) | - | Reflects the complexity and diversity of the landscape. | |
| Contiguity Index Distribution (CONTIG) | - | Measures the contiguity of landscape patches. | |
| Aggregation | Aggregation Index (AI) | % | Reflects the proximity of landscape components. Higher values indicate greater aggregation of similar patch types. |
| Landscape Shape Index (LSI) | - | Degree of landscape shape complexity. | |
| Landscape Division Index (DIVISION) | % | Sum of the lengths (m) of all edge segments involving the corresponding patch type, divided by the total landscape area (m2), then multiplied by 10,000. | |
| Edge Density (ED) | m/ha | Equals the sum of the lengths (m) of all edge segments involving the corresponding patch type, divided by the total landscape area (m2), multiplied by 10,000 (to convert to hectares) | |
| Patch Density (PD) | n/100 ha | Degree of fragmentation and heterogeneity within a landscape. | |
| Euclidean Nearest Neighbor Distance Distribution (ENN) | m | Mean distance from each landscape patch to its nearest neighbor, compared to the hypothetical value assuming random distribution. |
| Index | 100% Green Space | 100% Blue Space | 100% Grey Space | Green–Blue | Green–Grey | Blue–Grey | Green–Blue–Grey | GBA |
|---|---|---|---|---|---|---|---|---|
| DLST | 21.49 | 21.81 | 23.60 | 21.99 | 23.96 | 24.24 | 22.94 | 23.04 |
| NLST | 17.19 | 19.15 | 20.58 | 17.80 | 19.04 | 21.01 | 19.18 | 18.76 |
| SAT | 19.99 | 21.60 | 22.63 | 21.19 | 21.60 | 22.40 | 22.04 | 21.17 |
| NET | 15.11 | 16.33 | 17.90 | 16.23 | 16.72 | 17.38 | 16.98 | 16.21 |
| MDI | 20.76 | 21.86 | 23.19 | 21.81 | 22.22 | 22.78 | 22.54 | 21.79 |
| ATout | 20.79 | 22.34 | 23.77 | 22.12 | 22.61 | 23.37 | 22.98 | 22.07 |
| HI | 20.71 | 22.59 | 24.38 | 22.18 | 22.78 | 23.74 | 23.37 | 22.23 |
| HMI | 25.44 | 27.49 | 29.28 | 27.13 | 27.73 | 28.53 | 28.25 | 27.07 |
| WCT | 20.82 | 22.89 | 23.86 | 22.16 | 22.68 | 23.64 | 23.18 | 22.17 |
| WBT | 17.51 | 18.00 | 19.35 | 18.40 | 18.68 | 18.86 | 18.88 | 18.32 |
Disclaimer/Publisher’s Note: The statements, opinions and data contained in all publications are solely those of the individual author(s) and contributor(s) and not of MDPI and/or the editor(s). MDPI and/or the editor(s) disclaim responsibility for any injury to people or property resulting from any ideas, methods, instructions or products referred to in the content. |
© 2025 by the authors. Licensee MDPI, Basel, Switzerland. This article is an open access article distributed under the terms and conditions of the Creative Commons Attribution (CC BY) license (https://creativecommons.org/licenses/by/4.0/).
Share and Cite
Zeng, W.; Yang, K.; Zhang, S.; Bi, C.; Liu, J.; Yang, X.; Rao, Y.; Ma, Y. Configuration of Green–Blue–Grey Spaces for Efficient Cooling of Urban Physical and Perceptual Thermal Environments. Land 2025, 14, 645. https://doi.org/10.3390/land14030645
Zeng W, Yang K, Zhang S, Bi C, Liu J, Yang X, Rao Y, Ma Y. Configuration of Green–Blue–Grey Spaces for Efficient Cooling of Urban Physical and Perceptual Thermal Environments. Land. 2025; 14(3):645. https://doi.org/10.3390/land14030645
Chicago/Turabian StyleZeng, Wenxia, Kun Yang, Shaohua Zhang, Changyou Bi, Jing Liu, Xiaofang Yang, Yan Rao, and Yan Ma. 2025. "Configuration of Green–Blue–Grey Spaces for Efficient Cooling of Urban Physical and Perceptual Thermal Environments" Land 14, no. 3: 645. https://doi.org/10.3390/land14030645
APA StyleZeng, W., Yang, K., Zhang, S., Bi, C., Liu, J., Yang, X., Rao, Y., & Ma, Y. (2025). Configuration of Green–Blue–Grey Spaces for Efficient Cooling of Urban Physical and Perceptual Thermal Environments. Land, 14(3), 645. https://doi.org/10.3390/land14030645