Article

Retrieval of Soil Moisture in the Yutian Oasis, Northwest China by 3D Feature Space Based on Optical and Radar Remote Sensing Data

1
College of Geography and Remote Sensing Sciences, Xinjiang University, Urumqi 830046, China
2
Xinjiang Key Laboratory of Oasis Ecology, Xinjiang University, Urumqi 830046, China
3
Xinjiang Field Scientific Observation and Research Station for the Oasisization Process in the Hinterland of the Taklamakan Desert, Yutian 848400, China
*
Author to whom correspondence should be addressed.
Land 2025, 14(3), 627; https://doi.org/10.3390/land14030627
Submission received: 8 February 2025 / Revised: 11 March 2025 / Accepted: 14 March 2025 / Published: 16 March 2025

Abstract

:
Soil moisture in arid areas serves as a vital indicator for assessing hydrological scarcity and ecosystem vulnerability, particularly in Northwest China (NW China), where water resource deficits critically exacerbate environmental fragility. Soil moisture retrieval through remote sensing techniques proves essential for formulating sustainable strategies to enhance local environmental management. This study presents an innovative fusion framework integrating Sentinel-2 optical data and Radarsat-2 PolSAR (Polarimetric Synthetic Aperture Radar) data to establish a three-dimensional (3D) optical–radar feature space. The feature space synergistically combines SAR backscattering coefficients (HH polarization modes), polarimetric decomposition (volume scattering components of van Zyl), and optical remote sensing indices (MSAVI and NDVI). Through systematic analysis of feature space partitioning patterns across soil moisture gradients, the Optical–Radar Soil Moisture Retrieval Index (ORSMRI) was proposed, and fitting analysis was conducted by measured soil moisture. The results confirmed consistency between ORSMRI-derived retrieved soil moisture and measured soil moisture, with ORSMRI1 attaining R2 = 0.797 (RMSE = 3.329%) and ORSMRI2 reaching R2 = 0.721 (RMSE = 3.905%). The soil moisture in the study area was retrieved by applying the proposed ORSMRI and utilizing its linear correlation with soil moisture. The distribution of soil moisture showed a trend of being higher in the south than in the north, and higher in the west than in the east. Specifically, low soil moisture is generally concentrated in the northern and southwestern parts of the oasis, while high soil moisture is primarily concentrated in the central part of the oasis.

1. Introduction

Soil moisture refers to the water in the pores of soil particles, typically the water content of the soil layer within 10 cm of the surface. It is an important parameter in hydrological, ecological, climatic, and land surface processes [1,2]. Soil moisture, as a critical component of land surface ecosystems, has become one of the key factors in drought monitoring, water resource management, climate change, and agriculture [3,4,5], particularly in arid and semi-arid areas. As shown in Figure 1, soil moisture is a key and indispensable part of the land-to-atmosphere interaction system, influencing the water cycle through surface runoff, infiltration, and evapotranspiration [6,7,8,9,10]. Since evaporation greatly exceeds precipitation in arid areas, water scarcity is an increasingly significant issue [11], making soil moisture a critical indicator [12,13]. In addition, soil moisture serves as a key indicator for monitoring land degradation and drought [14], both of which continue to expand due to land water exploitation and climate change [15]. Therefore, soil moisture monitoring plays critical role in guiding regional water cycle, climate change, and crop growth [16].
China is a typical water-scarce country, with a total water resource of 2810 billion tons, globally ranking 6th, while the per capita possession ranks 108th in the world, and the per capita freshwater possession is only one-fourth of the global average [17]. China Northwest (NW China) is the most severely resource-limited area in the country, accounting for just 3.46% of China’s total water resources [18]. It is one of the driest areas globally, and the scarcity of water resources is the most critical natural factor limiting socio-economic development in this region [18]. Located in the interior of NW China, Xinjiang is dominated by mountains, deserts, and Gobi, characterized by a dry climate and low precipitation, with a multi-year average of approximately 156.36 mm. In the southern Tarim Basin, the multi-year average precipitation is only 74.2 mm [19]. Due to the limited water resources, the region has become one of the most ecologically fragile environments, and it is also one of the most severely desertified areas in China [20]. In arid areas, soil moisture monitoring provides valuable insights into the dynamics and ecological impacts of soil moisture. Therefore, the retrieval of soil moisture in such areas is essential, and accurate soil moisture retrieval is crucial for improving local environmental conditions.
Recently, the retrieval of soil moisture using optical remote sensing techniques has achieved notable success, with an increase in soil moisture correlating with higher reflectance as a spectral property of soil moisture. However, optical sensors, being passive remote sensing devices, are susceptible to interference from incident light sources and weather conditions during data collection due to their spectral characteristics [21]. In contrast, microwave remote sensing technology is considered the most effective method for soil moisture monitoring [22]. Radar, as an active microwave technique, is not affected by weather and has high penetration [23]. Additionally, Synthetic Aperture Radar (SAR) is highly sensitive to soil properties [24].
Polarimetric Synthetic Aperture Radar (PolSAR) offers significant advantages in SAR imaging [25]. As polarization is a fundamental property of electromagnetic waves, PolSAR has demonstrated its effectiveness in soil moisture retrieval by measuring the polarization scattering properties of a target and representing them through polarization scattering matrices [26]. Several studies have validated the potential of PolSAR in this domain. Tripathi et al. [27] employed Sentinel-1A C-band SAR remote sensing data with VV and VH polarizations to estimate surface soil moisture across alluvial soils and their sub-types in Rupnagar, Punjab, India, achieving expected results. Huang et al. [28] utilized microwave data to develop a soil moisture estimation model based on the Dubois model, successfully estimating soil moisture in the Ugan-Kuqa River Delta Oasis, Xinjiang. Their findings highlighted the effectiveness of microwave data as a powerful tool for soil moisture retrieval. Lievens et al. [29] investigated the potential of retrieving soil moisture information using a series of Radarsat-2 HH- and VV-polarized C-band backscatter observations across numerous bare agricultural fields in Flevoland, the Netherlands. Their results confirmed the high capability of Radarsat-2 data in monitoring the spatial and temporal dynamics of soil moisture. In summary, soil moisture retrieval is closely linked to the advantages of PolSAR. While the application of optical remote sensing in soil moisture studies has reached a mature stage, future research should further explore the unique strengths of PolSAR to enhance soil moisture retrieval accuracy and reliability.
At the end of the 20th century, the concept of extracting soil moisture information from a multi-dimensional spectral feature space gained increasing attention, and several inversion methods based on spectral feature space for soil moisture retrieval were subsequently proposed [30]. Many researchers have leveraged the correlation between remote sensing surface temperature and vegetation indices to obtain surface moisture information and assess the potential for land cover classification [31,32,33,34]. In the 21st century, Ghulam et al. [35] proposed the PDI using an infrared–near infrared feature space spectral distribution pattern, which offers advantages in terms of simplicity, effectiveness, and operability while achieving better results in soil moisture monitoring. Liu et al. [36] developed and analyzed the NDVI–Ts feature space using MODIS imagery, applying it to different regions (Shendong Mining Area and Henan Province), and confirming its generalizability for soil moisture estimation. Pandey et al. [37] retrieved soil moisture in Hoshangabad District, Madhya Pradesh using the TOTRAM model, which relies on the relationship between LST and NDVI. Their findings demonstrated the strong inherent relationship between soil moisture, LST, and NDVI, as well as its applicability for large-scale soil moisture retrieval. Becaro Crioni et al. [38] constructed the NDVI–STR space using Sentinel-2 multispectral images to estimate soil moisture in the Rio Claro municipality, further highlighting the potential of feature space for soil moisture detection. However, few studies have incorporated radar data into the feature space approach. SAR has demonstrated great potential for soil moisture retrieval [28], with recent studies indicating that longer wavelengths offer better penetration into different soil types [39]. However, these optically based models have inherent limitations. For example, they are susceptible to atmospheric disturbances (e.g., cloud cover and variations in solar illumination) [21,24] and exhibit reduced sensitivity to surface moisture under vegetation cover due to spectral saturation [40].
The integration and utilization of PolSAR information for soil moisture retrieval is a key focus of this study. Moreover, most existing studies remain at the two-dimensional (2D) level, with limited research focusing on the potential of a three-dimensional (3D) feature space. In fact, leveraging a 3D feature space allows for the incorporation of additional parameters, facilitating a deeper exploration of remote sensing data and ultimately enhancing the reliability of soil moisture retrieval. Therefore, based on feature space theory, this study extracts backscattering coefficients under different polarization modes and polarimetric decomposition components from PolSAR data, analyzes the relationships between scattering mechanisms and polarimetric decomposition components, and explores the integrated retrieval of soil moisture using both optical and radar parameters.

2. Materials and Methods
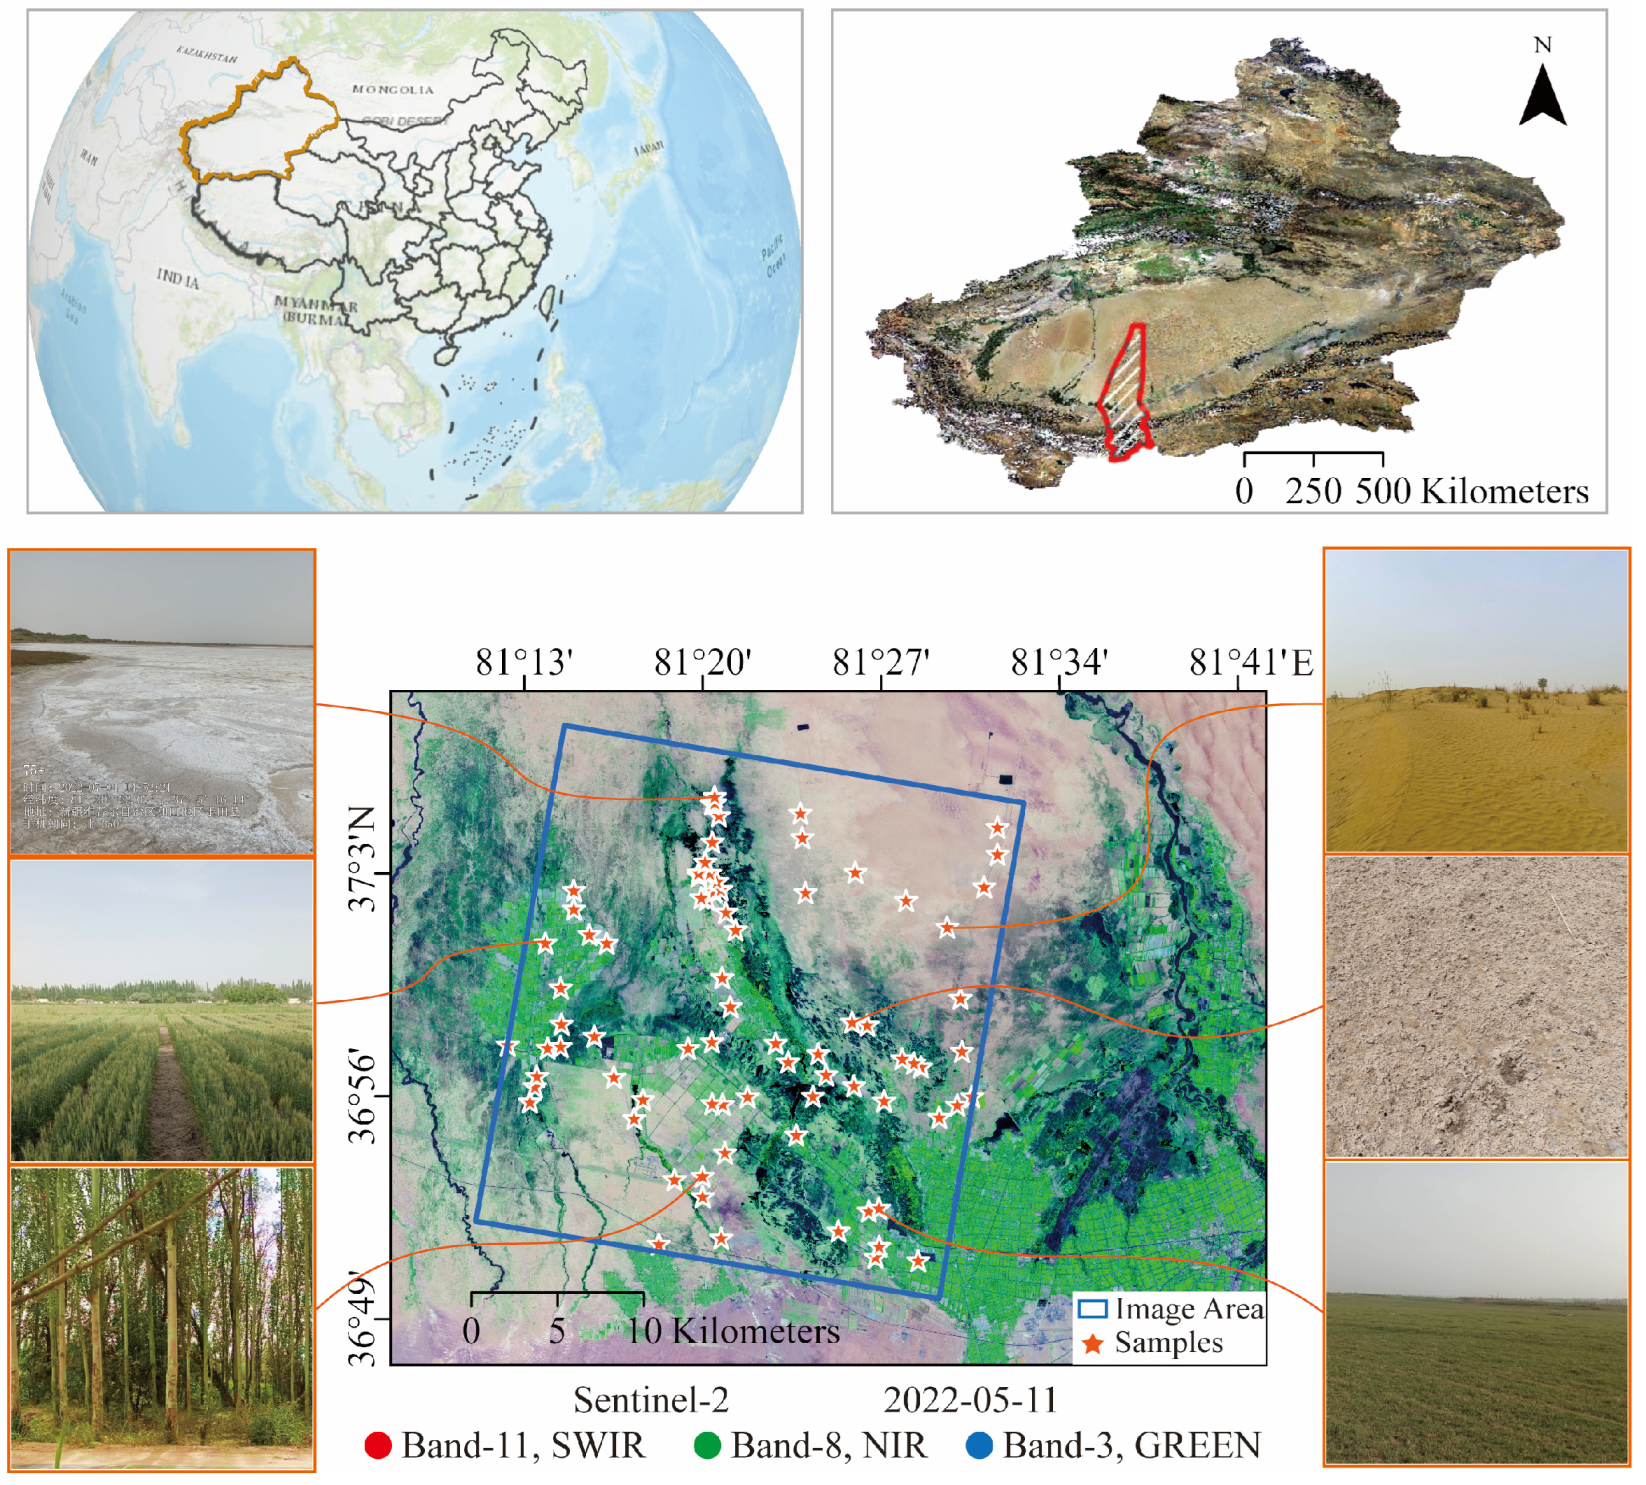
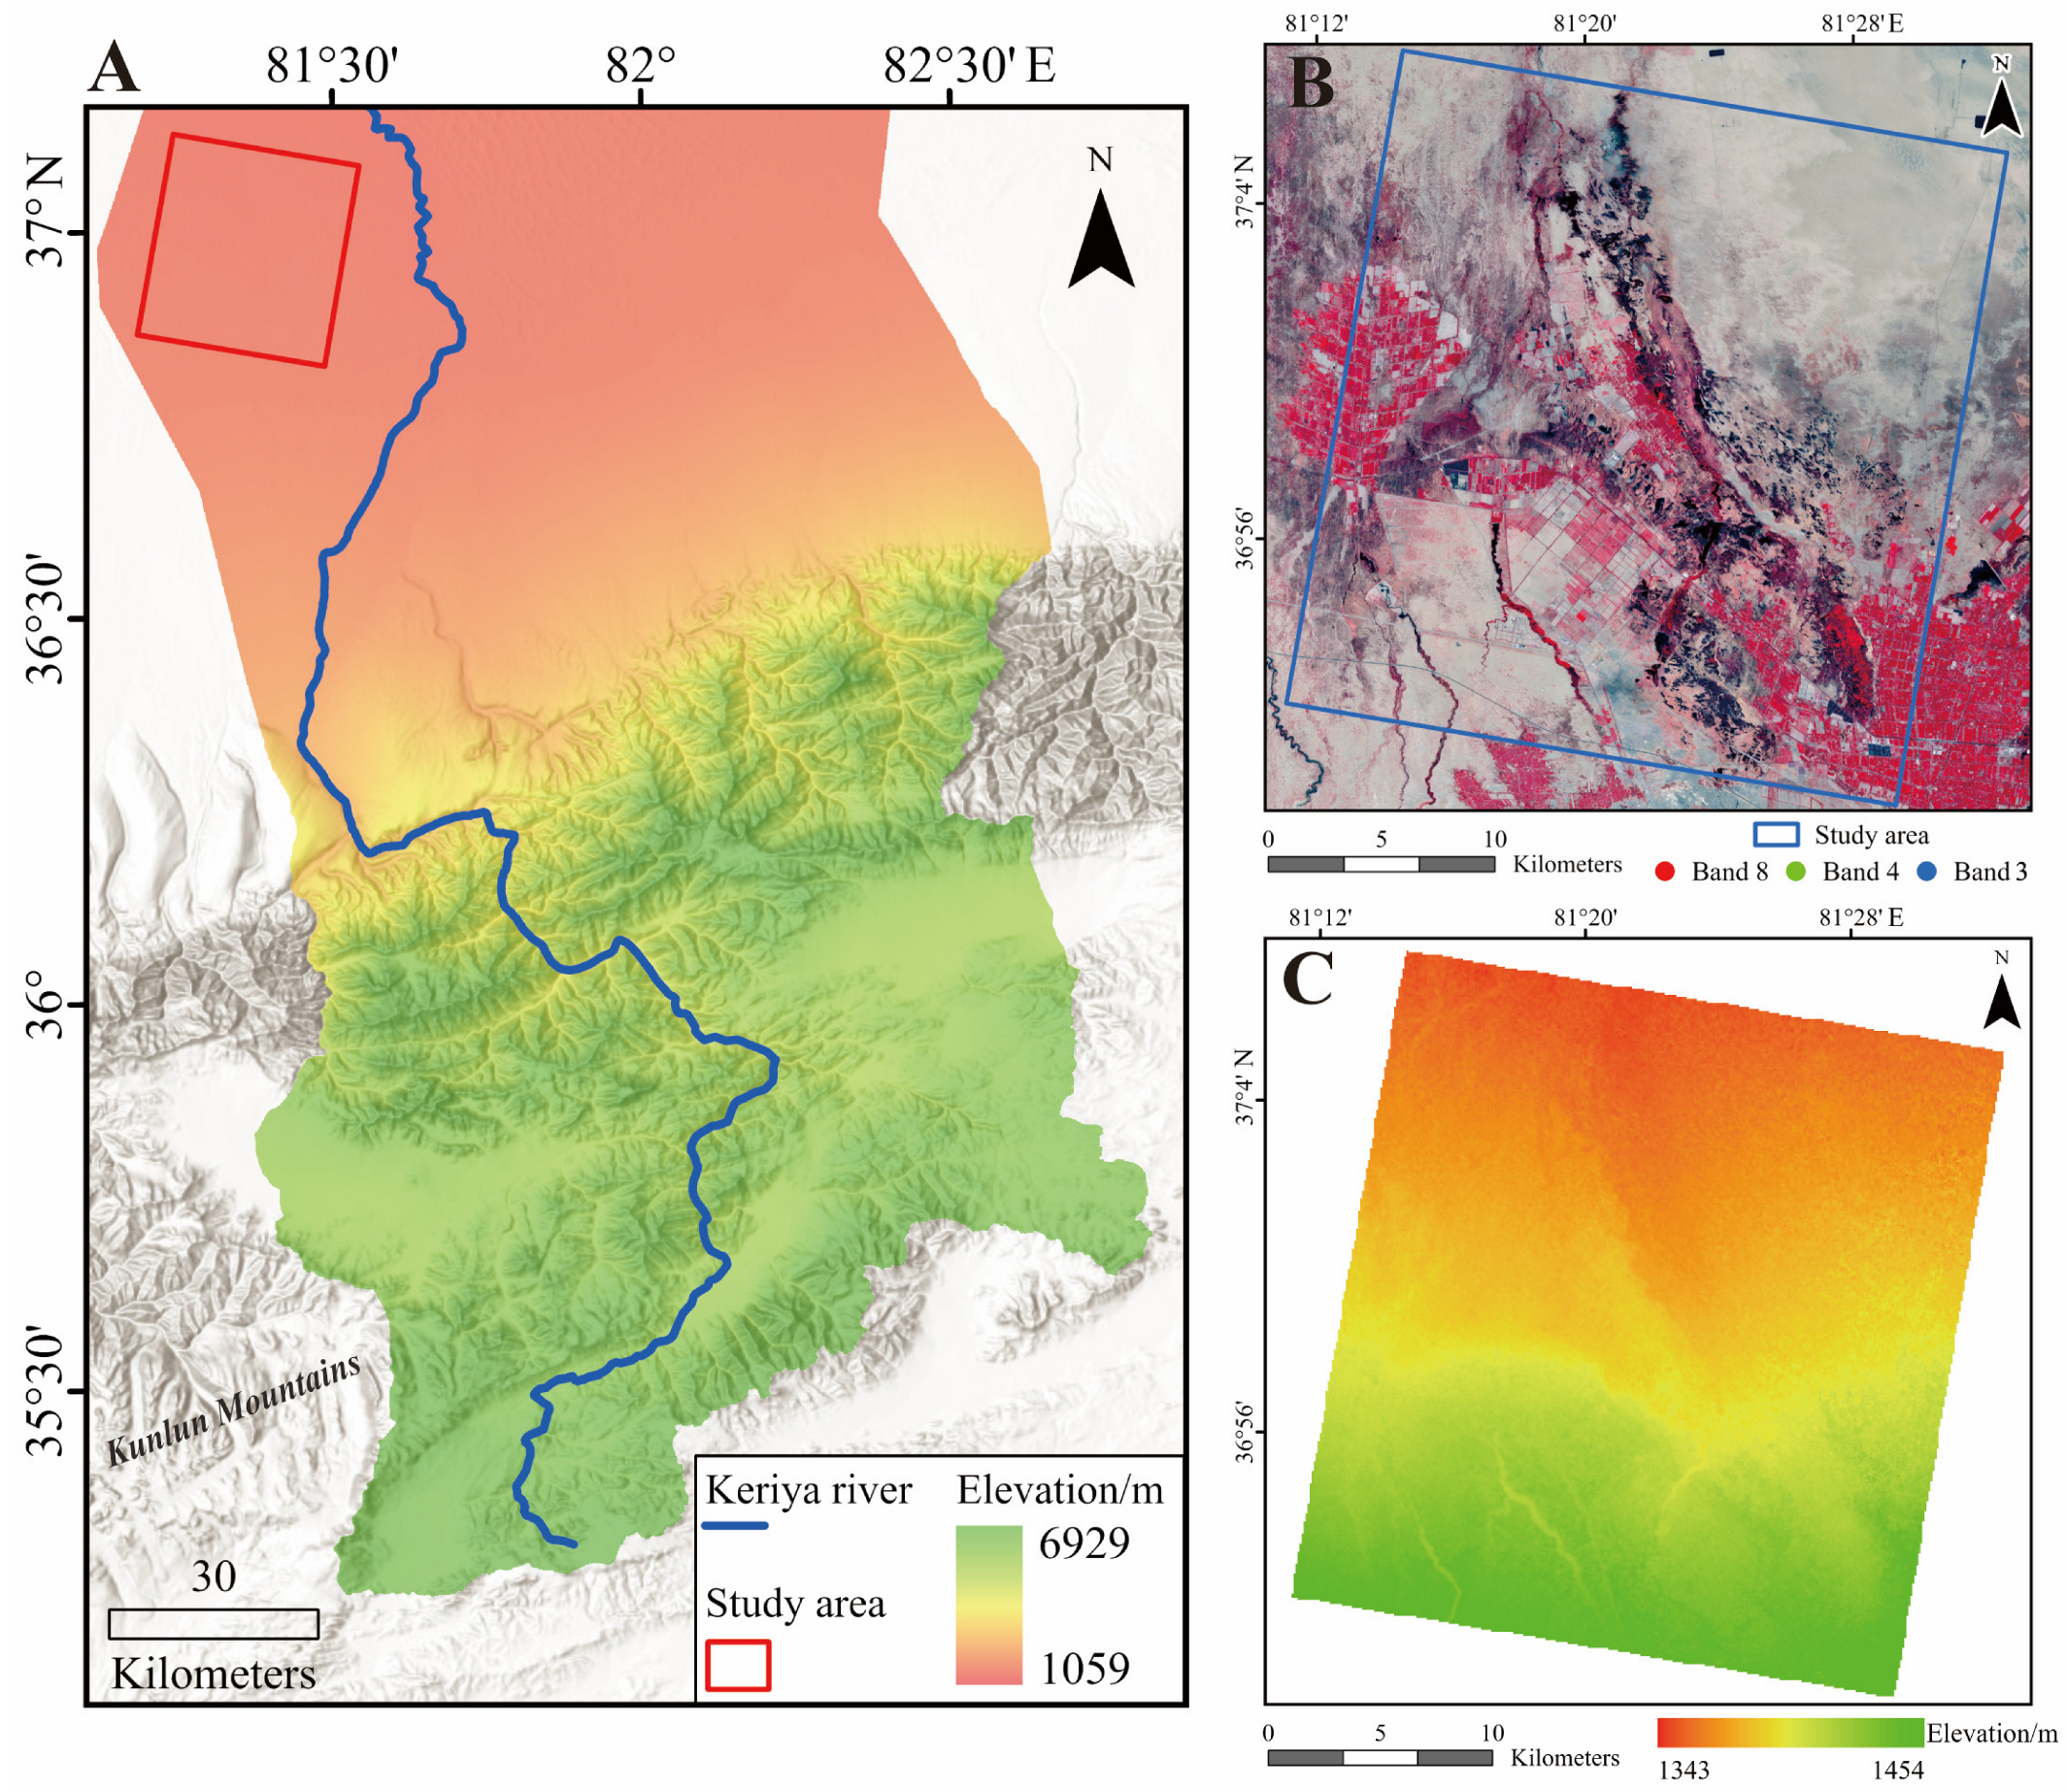
2.1. Study Area

Yutian Oasis, located at the southern edge of the Taklamakan Desert in the Hotan region of Xinjiang, China, was selected as the study area (Figure 2). The Yutian Oasis (36°30′–37°05′ N, 81°09′–82°03′ E) is situated in southern Xinjiang, within the Keriya River Basin. This basin lies at the southern edge of the Taklamakan Desert and is bordered by the Kunlun Mountains along the northern slopes of the Keriya River’s middle reaches [39,40]. The oasis is characterized by rugged topography, with an elevation gradient that gradually increases from south to north. It is dominated by deserts and features an arid climate, sparse vegetation, and fragile ecology. Notably, the area exhibits distinct topographic features, with mountainous hills in the south and plains and deserts in the north, making it an important oasis–desert interface area [24,41,42,43].
The dominant soil types in the oasis are Gleyic Phaeozems, Mollic Gleysols, and Cambic Arenosols. The primary cultivated crops include cotton, corn, and wheat, while the main vegetation consists of Populus diversifolia, Tamarix chinensis, and Phragmites australis [44]. The oasis is situated in a warm temperate inland arid desert climate [45]. The average temperature is 12.2 °C, and the annual precipitation is approximately 44.7 mm, while the annual evaporation rate is 2498 mm [42]. The seasonal rivers of the oasis originate from the Keriya River in the Kunlun Mountains, an inland river primarily replenished by glacier-melted snow. The river has a total length of 860 km and a relatively closed water system [46,47]. Furthermore, the oasis is characterized by high levels of soil desertification, which is attributed to sparse vegetation, fragile ecosystems, high evaporation rates, and low precipitation [48]. Therefore, soil moisture retrieval is essential to provide scientific insights for crop growth, soil improvement, and the enhancement of the local ecological environment.

2.2. Soil Sampling and Analysis

In May 2022, the research team conducted field soil sampling and investigations in the Yutian Oasis to cover the study area. A total of 81 surface soil samples (0–10 cm) were collected from different landscape types (Figure 2), encompassing the primary landscapes in the region. GPS was used to record the latitude, longitude, and elevation of each sampling site. Photos were taken of the surrounding landscape types and features for later analysis. Field sampling was carried out by establishing uniform, standardized sampling plots, which were evenly distributed across the study area. During the sampling period, the weather was sunny with no rainfall. Given the diverse land uses, planting methods, and irrigation techniques, the sampling followed a grid-based approach to ensure comprehensive coverage of the entire study area. The samples were categorized into three types: (1) those located in farmland irrigated by snowmelt or other irrigation water, the desert–oasis transitional zone around farmland, and the vegetation belt at the junction of farmland and roads, characterized by high vegetation cover; (2) barren land with low vegetation cover; and (3) desert hinterland with sparse vegetation, where no precipitation occurs throughout the year and no human intervention takes place. Soil samples from each site were collected in aluminum boxes, weighed, and transported back to the laboratory. In the lab, they were placed in a drying oven for 48 h until completely dehydrated and reached a constant weight. Soil moisture content was measured in a shaded room using the drying and weighing method, with moisture content ranging from 0.23% to 27.94%.

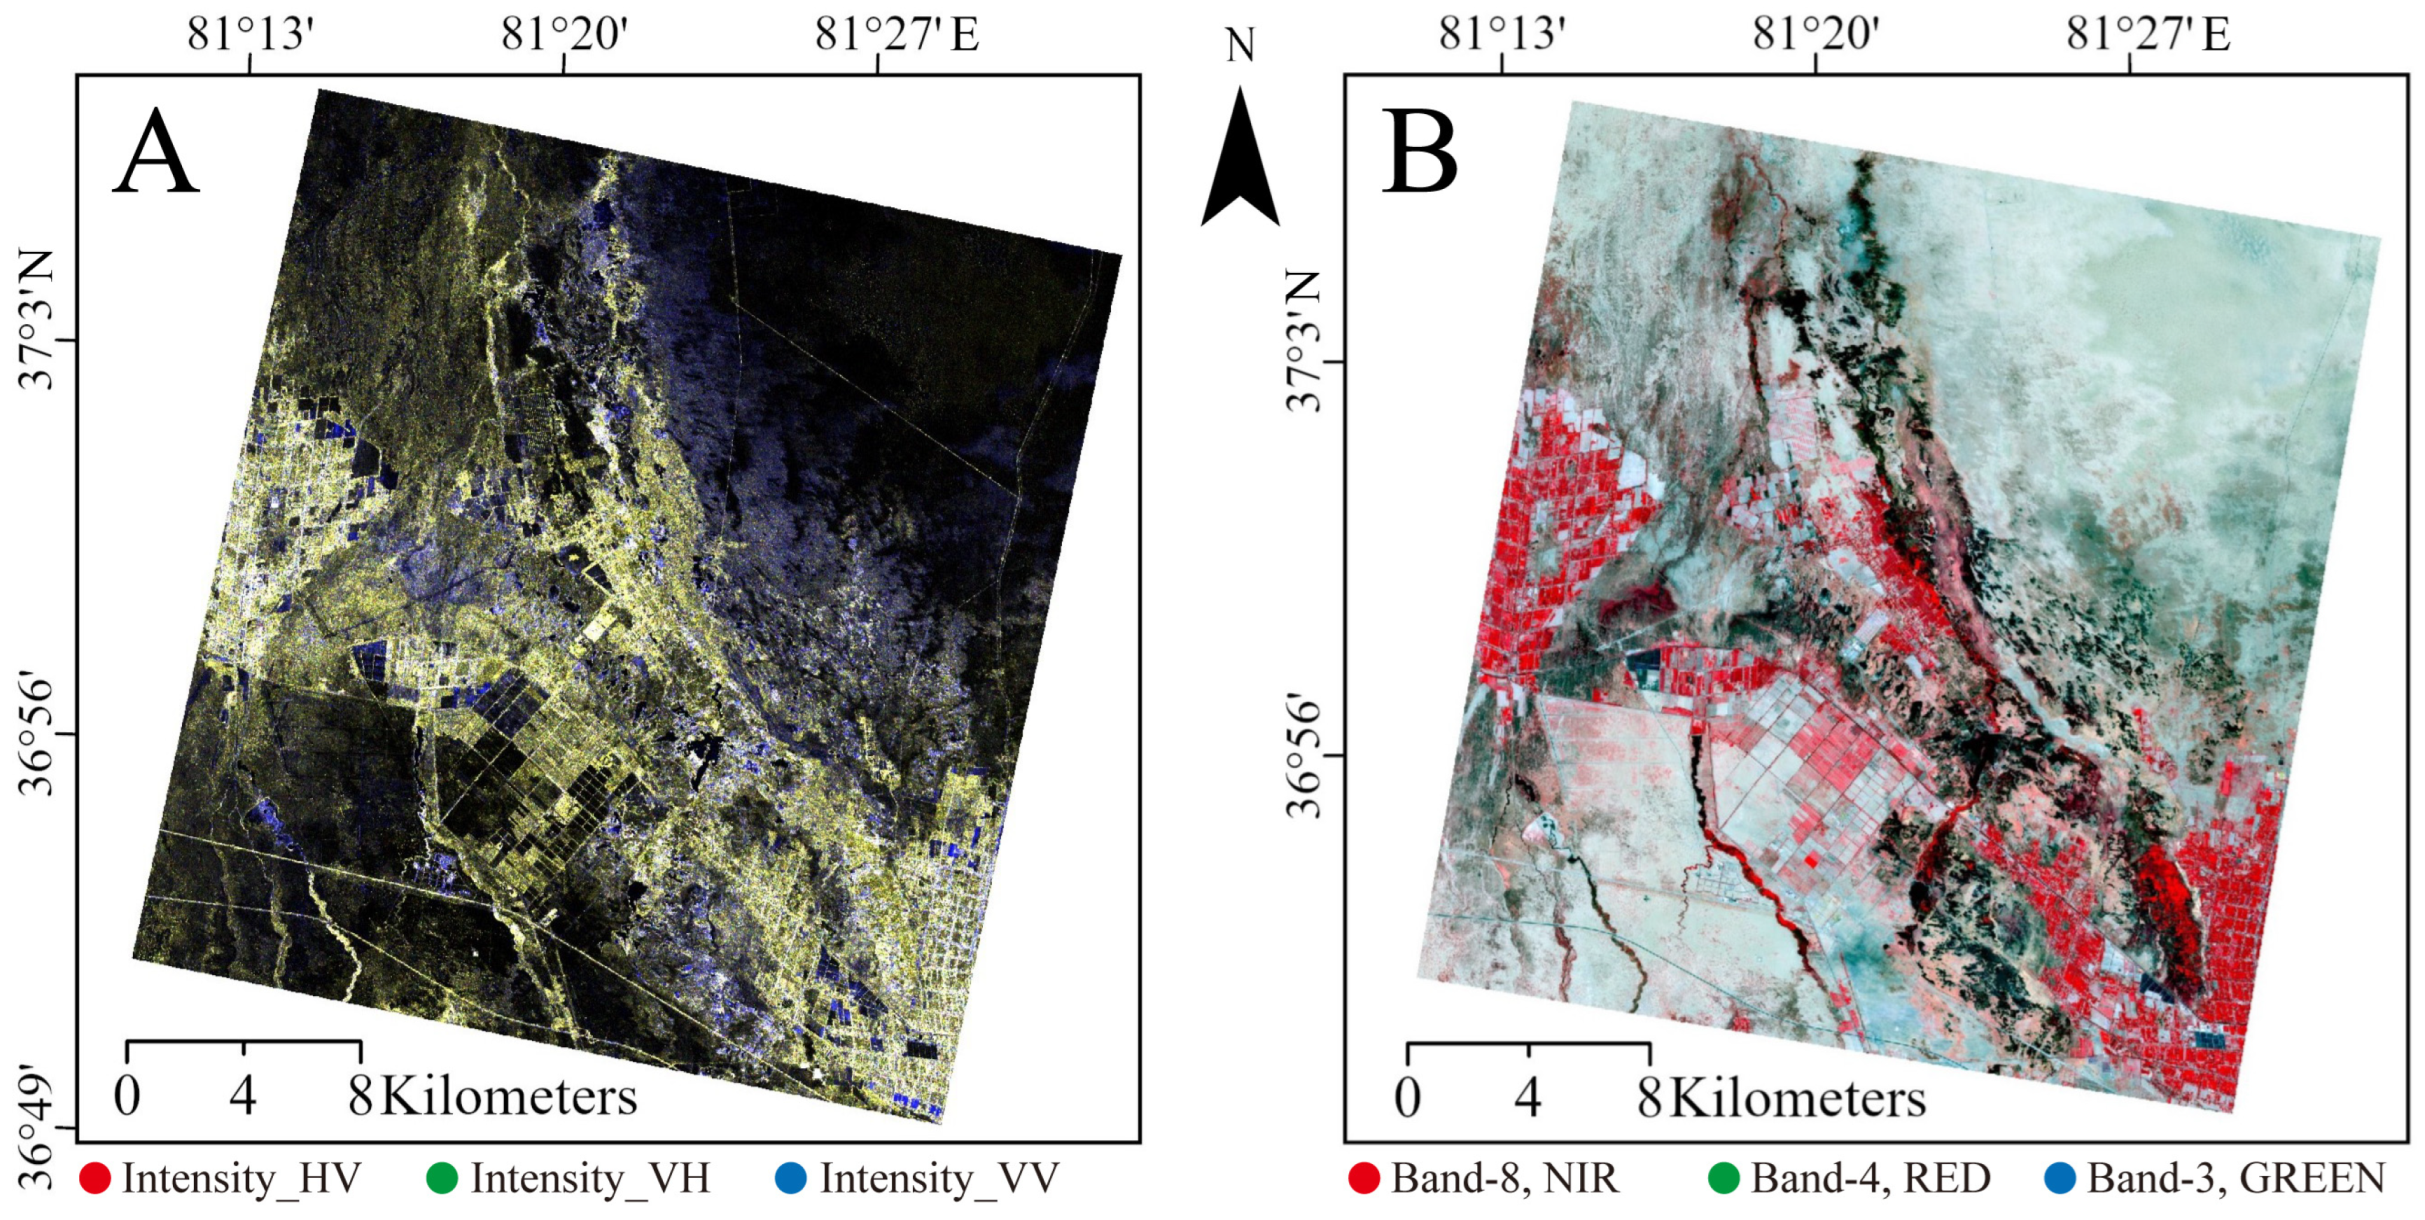
2.3. Satellite Imagery and Preparation

The satellite images used in this study include Radarsat-2 radar imagery and Sentinel-2 optical imagery of the Yutian Oasis (Figure 3).
Radarsat-2 is a high-resolution SAR commercial satellite equipped with C-band (4–8 GHz) sensors, capable of penetrating vegetation and the ground surface [49]. Sentinel-2 is a high-resolution multispectral imaging satellite with 13 spectral bands that provides a ground resolution of up to 10 m [50].
The Radarsat-2 radar imagery used in this study is a quad-polarization Single Look Complex (SLC) product acquired in fine mode, with an incidence angle range of 41.06° to 42.45°. The detailed technical specifications are provided in Table 1. Due to the unique imaging mechanism of the radar, data processing is relatively complex. Therefore, SNAP 9.0® software was used to preprocess the raw SLC image, with the following steps [51]: (1) radiometric calibration; (2) generation of the T3 polarization matrix; (3) multi-look processing (both range and azimuth looks were set to 1) on the generated T3 polarization matrix; (4) speckle filtering using the Refined Lee filter to remove coherent speckle noise; (5) geocoding using a digital elevation model (DEM); and (6) resampling to an optimal resolution of 10 m.
The Sentinel-2 optical imagery used in this study was acquired on 11 May 2022. To ensure complete coverage of the study area, a mosaic of two image tiles, T44SNF and T44SNG, was generated, with detailed specifications provided in Table 2. The preprocessing steps included the following [52]: (1) radiometric calibration; (2) atmospheric correction; (3) super-resolution, where the native spatial resolutions of 10 m, 20 m, and 60 m were harmonized to a unified 10 m grid; (4) mosaicking; and (5) spatial subset.

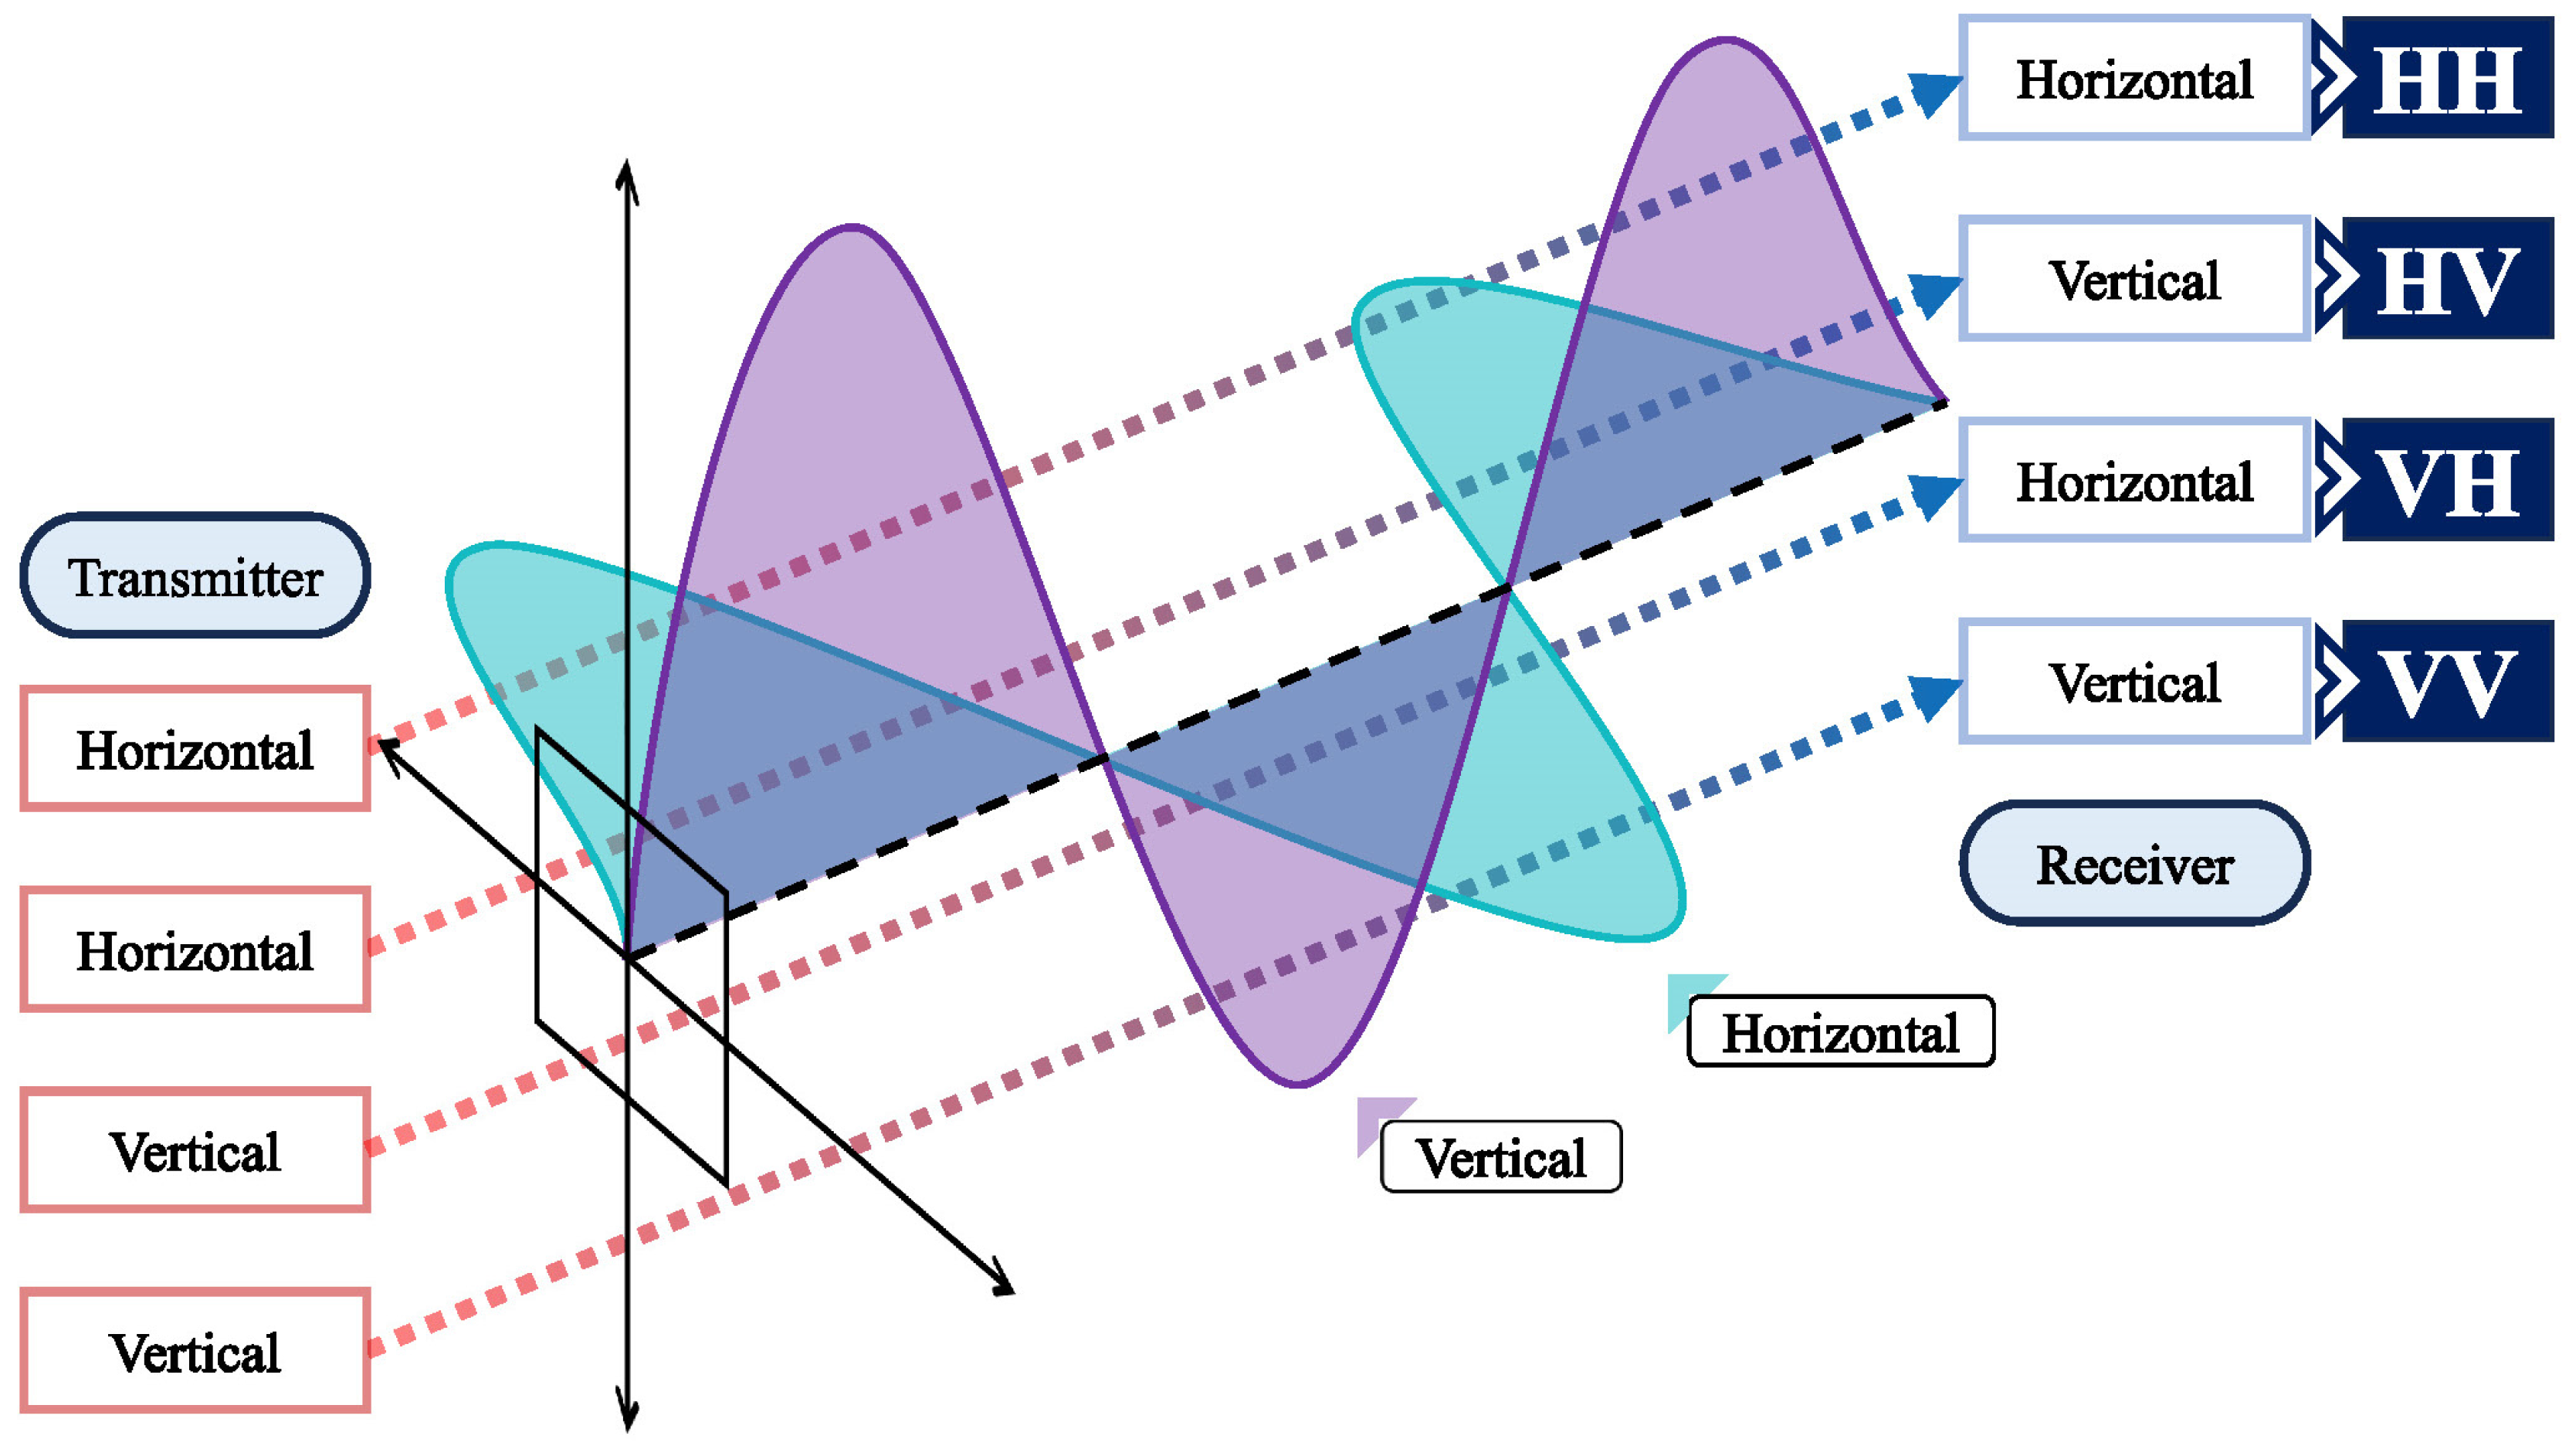
2.4. Polarization Mode of SAR

Polarization is one of the most important parameters of SAR data [53]. Fully PolSAR obtains microwave reflectivity in HH, HV, VH, and VV modes (Figure 4), which are then used to form the scattering matrix [54]. Currently, many studies on soil moisture retrieval have utilized polarization to extract soil moisture information by analyzing backscattering coefficients [28,29,55]. However, most studies on soil moisture retrieval based on backscattering coefficients under different polarization modes focus on dual-polarization SAR, and relatively few studies have investigated soil moisture retrieval using fully PolSAR. Furthermore, there are variations in the selected polarization modes or their combinations used for soil moisture retrieval in many studies, which may be influenced by the radar incidence angle [56,57,58]. Therefore, the following backscattering coefficients under various polarization modes and their combinations were selected, considering both the practicality of these modes and combinations in previous studies [28,29,55], as well as the fine four-polarization data used in this study: HH, HV, VH, VV, HV/HH, and HH/VV.

2.5. Polarimetric Decomposition of SAR

The polarimetric decomposition of targets has attracted considerable attention and advanced rapidly due to its ability to uncover the scattering mechanisms of targets and deepen the comprehension of their scattering properties [59]. In 1978, Huynen proposed the polarimetric decomposition and analyzed the scattering mechanisms of radar targets based on the concept of optimal polarization [60]. Subsequently, a multitude of polarization decomposition techniques have been put forward to explain the scattering mechanisms of SAR for different ground targets and to extract the feature information contained in the SAR data [61,62,63,64,65,66].
Recently, several polarimetric decomposition methods have been developed to analyze Radarsat-2 data and extract scattering components based on the polarization properties of the signals [67,68]. SAR scattering refers to the process in which a portion of the radar-transmitted electromagnetic waves, upon interacting with the target surface, is scattered back toward the radar receiver [69]. This physical process is governed by three fundamental scattering mechanisms: volume scattering within multi-layer media, surface scattering at dielectric interfaces, and double-bounce scattering from dihedral structures [70]. In polarimetric decomposition, double-bounce scattering typically occurs from tree trunks or buildings, surface scattering is mainly associated with bare ground, and volume scattering is dominant in vegetation-covered areas [71]. The scattering characteristics of SAR signals interacting with different ground targets are illustrated in Figure 5. These scattering mechanisms collectively define the characteristics of SAR data, playing a crucial role in interpreting SAR images, extracting surface parameters, and facilitating ground object classification and monitoring [72].
Target decomposition methods are generally classified into two categories based on scattering characteristics: coherent target decomposition and non-coherent target decomposition [73]. The primary goal of coherent target decomposition is to decompose the measured scattering matrix S into the sum of scattering contributions from several elementary objects [74]. In contrast, non-coherent target decomposition methods decompose the covariance matrix C or coherence matrix T into a combination of second-order descriptors corresponding to simple or canonical objects, thereby offering more intuitive physical interpretations [74]. Notable non-coherent decomposition approaches include Freeman–Durden decomposition, Cloude decomposition, and Huynen decomposition [75].
Based on these matrices, the computational methodologies for deriving polarimetric decomposition components vary significantly [48]. For example, Freeman decomposition can be applied to either the covariance matrix C or the scattering matrix S, where the decomposition equations partition matrix elements into three primary scattering components: volume scattering, surface scattering, and double-bounce scattering [71].
P = P s + P d + P v
where P represents the total power, while P s , P d , and P v denote surface scattering, double-bounce scattering, and volume scattering, respectively.
van Zyl decomposition, while also partitioning radar backscatter into the three aforementioned mechanisms using the coherence matrix T, enhances the physical interpretation of scattering mechanisms through eigenvalue dominance analysis [59].
T t o t a l = T v o l + T s u r f + T d b l
where T t o t a l represents the total power, and T s u r f , T d b l , and T s u r f correspond to scattering, double-bounce scattering, and volume scattering, respectively.
Yamaguchi decomposition extends the Freeman and van Zyl paradigms by incorporating an additional helix scattering component to better characterize complex scattering phenomena in high-resolution radar systems [65].
P t = P s + P d + P v + P c
where P t represents the total power, while P s , P d , P v , and P c correspond to surface scattering, double-bounce scattering, volume scattering, and helix scattering, respectively.
The selection of polarimetric decomposition methods in this study was informed by a comprehensive review of the existing literature and its direct relevance to soil moisture retrieval [73,76,77,78]. To fully exploit the capabilities of fully polarimetric Radarsat-2 data, the following decomposition methods were chosen based on their demonstrated applicability in previous studies: Sinclair, van Zyl, Pauli, Yang, Yamaguchi, Huynen, Cloude, Freeman–Durden, and Generalized Freeman–Durden. First, a T3 polarization matrix was generated using SNAP 9.0®. Second, nine polarimetric decomposition techniques were applied to extract the scattering components from Radarsat-2 imagery. Finally, 28 polarization features were extracted from the PolSAR data (as shown in Table 3).

2.6. Optical Remote Sensing Indices of Soil Moisture Response

The selection of appropriate indices for characterizing the spectral response of soil moisture is crucial for accurately retrieving soil moisture information. In recent years, numerous studies have focused on developing soil moisture index algorithms based on remote sensing spectral imaging to enhance the accuracy of soil moisture estimation [79]. As a key interface between surface water and groundwater, soil moisture plays a fundamental role in surface energy exchange processes. Its variations influence surface parameters such as reflectance and vegetation growth, which manifest as distinct spectral characteristics in remote sensing imagery [80]. Consequently, optical remote sensing indices—including water indices, vegetation indices, and drought indices—are widely used for analyzing and interpreting remote sensing data [81]. These indices can be applied in applications related to vegetation cover, soil salinity, soil moisture, and crop growth monitoring, as well as health status assessment [81]. Due to variations in the principles, sensitivity, and applicability of different indices, comparing and selecting the most suitable indices has become a key research objective for scientists. A well-chosen index can effectively enhance the accuracy of soil moisture estimation by capturing specific spectral responses related to surface water content. In this study, the selection of optical remote sensing indices was based on four categories to comprehensively assess soil moisture conditions: (1) Water index: Normalized Difference Water Index (NDWI), Modified Normalized Difference Water Index (MNDWI), which are widely used to detect surface water and assess soil moisture availability [82]. (2) Drought index: Normalized Multi-band Drought Index (NMDI), which integrates multiple spectral bands to indicate drought severity and soil dryness [83]. (3) Moisture index: Normalized Difference Moisture Index (NDMI), Shortwave Infrared Soil Moisture Index (SIMI), and Surface Water Capacity Index (SWCI), which leverage shortwave infrared and near-infrared reflectance to capture soil moisture variations under different land cover conditions [84]. (4) Vegetation index: Normalized Difference Vegetation Index (NDVI), Green Normalized Difference Vegetation Index (GNDVI), Soil-Adjusted Vegetation Index (SAVI), and Modified Soil-Adjusted Vegetation Index (MSAVI). These indices serve as proxies for vegetation health and canopy moisture, indirectly reflecting soil moisture status [85].
The application of optical remote sensing metrics, including water indices, vegetation indices, and drought indices, has been widely recognized as a feasible approach for soil moisture estimation, as confirmed by numerous studies [24,80,86]. These indices leverage spectral responses to characterize surface moisture conditions, making them valuable tools for soil moisture retrieval in various environmental settings. Therefore, building upon previous research, this study selected ten representative optical remote sensing indices for analysis, with their respective formulas presented in Table 4.

2.7. Optimal Component Selection Method

The extraction of soil moisture information relies on the selection of appropriate feature components in soil moisture response, specifically optimal component selection. In this study, the selection of optimal components involves the optimization of polarization modes, the screening of target polarimetric decomposition scattering components, and the prioritization of optical remote sensing indices. The scattering components of fully polarized SAR images include surface scattering, double-bounce scattering, and volume scattering, as well as helix scattering, which is included in the Yamaguchi polarimetric decomposition method and serves as the basis for feature classification based on polarimetric scattering mechanisms [96]. However, not all extracted features are suitable for soil moisture monitoring and retrieval. Additionally, the large quantity of feature data and high computational cost, combined with redundancy among feature components, complicates the process. Therefore, in this study, Random Forest (RF) was applied to select feature components sensitive to measured soil moisture for constructing the feature space. Its core idea is to assess the contribution of each sample and then take the average value to compare feature importance. RF is commonly used due to its ease of understanding, implementation, and resistance to overfitting [97].
The principle of variable selection in RF is as follows: During the sampling process, approximately one-third of the original dataset remains unselected, referred to as Out-Of-Bag (OOB) data. The Out-Of-Bag Error (OOB-Error) derived from OOB data serves not only as a metric for evaluating classification accuracy but also as a basis for assessing the importance of different feature variables, thereby aiding feature selection [97]. The computation process can be broadly divided into three steps: (1) For each decision tree, the prediction error rate of the OOB data is recorded. (2) The values of the feature variables in the OOB data are randomly permuted (equivalent to sequentially replacing the feature variables under evaluation with noise), and the prediction error rate of the OOB data is recorded again. (3) For each decision tree, the difference between the two recorded OOB prediction error rates is computed, and the average of these differences across all decision trees is obtained. The formula for this process is given by
V I = 1 N t = 1 N ( B n t M A B O t M A )
The variable importance VI quantifies the significance of a feature, where M represents the total number of features in the dataset, and N denotes the number of decision trees constructed. B O t M A denotes the OOB-Error of the t-th decision tree when the feature M A remains unaltered, whereas B n t M A represents the OOB-Error when M A is is perturbed by random noise. If introducing random noise to a given feature M A results in a significant decline in OOB accuracy, it implies that M A exerts a considerable influence on the classification outcome, thereby indicating its high importance [27].

2.8. Feature Space

Feature space, a system of spatial components integrating two or more typical imagery sources [98], serves as a powerful tool in remote sensing estimation due to its directness, efficiency, and effectiveness [48,70]. Several researches have indicated the extraction of soil moisture information through the selection of appropriate indicators and the construction of feature spaces. Zhang et al. [99] spatially monitored soil moisture by utilizing surface temperature and vegetation index data from MODIS. Liu et al. [36] retrieved soil moisture using NDVI and surface temperature data. Sadeghi et al. [100] proposed a new remote sensing method for soil moisture based on an optical trapezoidal model and observations from Sentinel-2 and Landsat-8. Carlson and Petropoulos [101] normalized the LST-VI feature space to simplify the process of calculating the soil moisture index. However, most of these studies relied solely on a single optical remote sensing data source, neglecting other important sources such as SAR. The reliance on single-sensor data is susceptible to bias caused by the mixed pixel effect [102]. In contrast, leveraging radar–optical synergy through a complementary mechanism can mitigate this limitation. Furthermore, most existing studies focus on 2D feature spaces, with fewer studies exploring the use of 3D feature spaces for information extraction. In fact, the 3D feature space can utilize more parameters due to its increased dimensionality, leading to higher accuracy in soil moisture estimation. Therefore, based on feature space theory, this study extracts polarization information and polarimetric decomposition from PolSAR data, constructs a 3D feature space by integrating optical remote sensing indices, explores the potential for collaboration between optical and radar data in soil moisture estimation, and demonstrates the use of optical–radar data to estimate soil moisture distribution in arid areas.
In this study, remote sensing data from optical and radar sensors were first acquired, and soil moisture measurements were obtained through field sampling. Parameters from both data sources were then extracted, followed by the selection of optimal feature components. Subsequently, a 3D feature space was constructed, within which the Optical–Radar Soil Moisture Retrieval Index (ORSMRI) was proposed to characterize different soil moisture levels. Finally, the accuracy of the proposed index was validated. The main methodological steps are illustrated in Figure 6.

3. Construction of Feature Spaces and Estimation Index

3.1. Optimal Feature Component Selection

In this study, the selection of optimal feature components was categorized into four scenarios: (1) backscattering coefficients under different polarization modes; (2) polarimetric decomposition scattering components; (3) optical remote sensing index components; (4) all optical and radar components. The “Random Forest” package in R 4.3.0® was utilized for optimal component selection. The resulting output is presented in Figure 7.
The results showed that within the first scenario, the backscattering coefficients under the HH polarization mode were the most important. It was consistent with the results of Ayari et al. and further confirmed the potential of the HH polarization mode in soil moisture estimation [103]. In the second scenario, Vanzyl_g held the highest importance, representing the volume scattering component of van Zyl decomposition. In the study by Xie et al., the best results were also obtained using the van Zyl polarization decomposition method [67]. In the third scenario, MSAVI achieved the best performance. This suggests a strong relationship between vegetation and soil moisture. Many scholars have obtained satisfactory results using vegetation indices to estimate soil moisture, and this is why, in the fourth scenario, the correlation between NDVI and soil moisture is greater than that of HH [104,105]. Additionally, the effectiveness of MSAVI in arid and semi-arid areas has been demonstrated by numerous studies [106,107].
In the arid and semi-arid area, Yutian Oasis, two feature spaces were constructed based on the above four scenarios of feature selection: (1) HH, Vanzyl_g, and MSAVI were selected from the polarization modes and their combinations, polarimetric decomposition scattering components, and optical remote sensing indices, respectively, to construct the 3D feature space. (2) Vanzyl_g, MSAVI, and NDVI were selected from all components to construct the 3D feature space. Before constructing the feature space, the HH, Vanzyl_g, MSAVI, and NDVI data had to be normalized. In this study, the Max-Min normalization method was used to eliminate the effect of unit differences between the data.
H H = ( H H P V H H M i n ) / ( H H M a x H H M i n )
V a n z y l = ( V a n z y l _ g P V V a n z y l _ g M i n ) / ( V a n z y l _ g M a x V a n z y l _ g M i n )
M S A V I = ( M S A V I P V M S A V I M i n ) / ( M S A V I M a x M S A V I M i n )
N D V I = ( N D V I P V N D V I M i n ) / ( N D V I M a x N D V I M i n )
where PV is the pixel value of the remote sensing image data; Min and Max are the minimum and maximum values of the data.

3.2. Feature Space

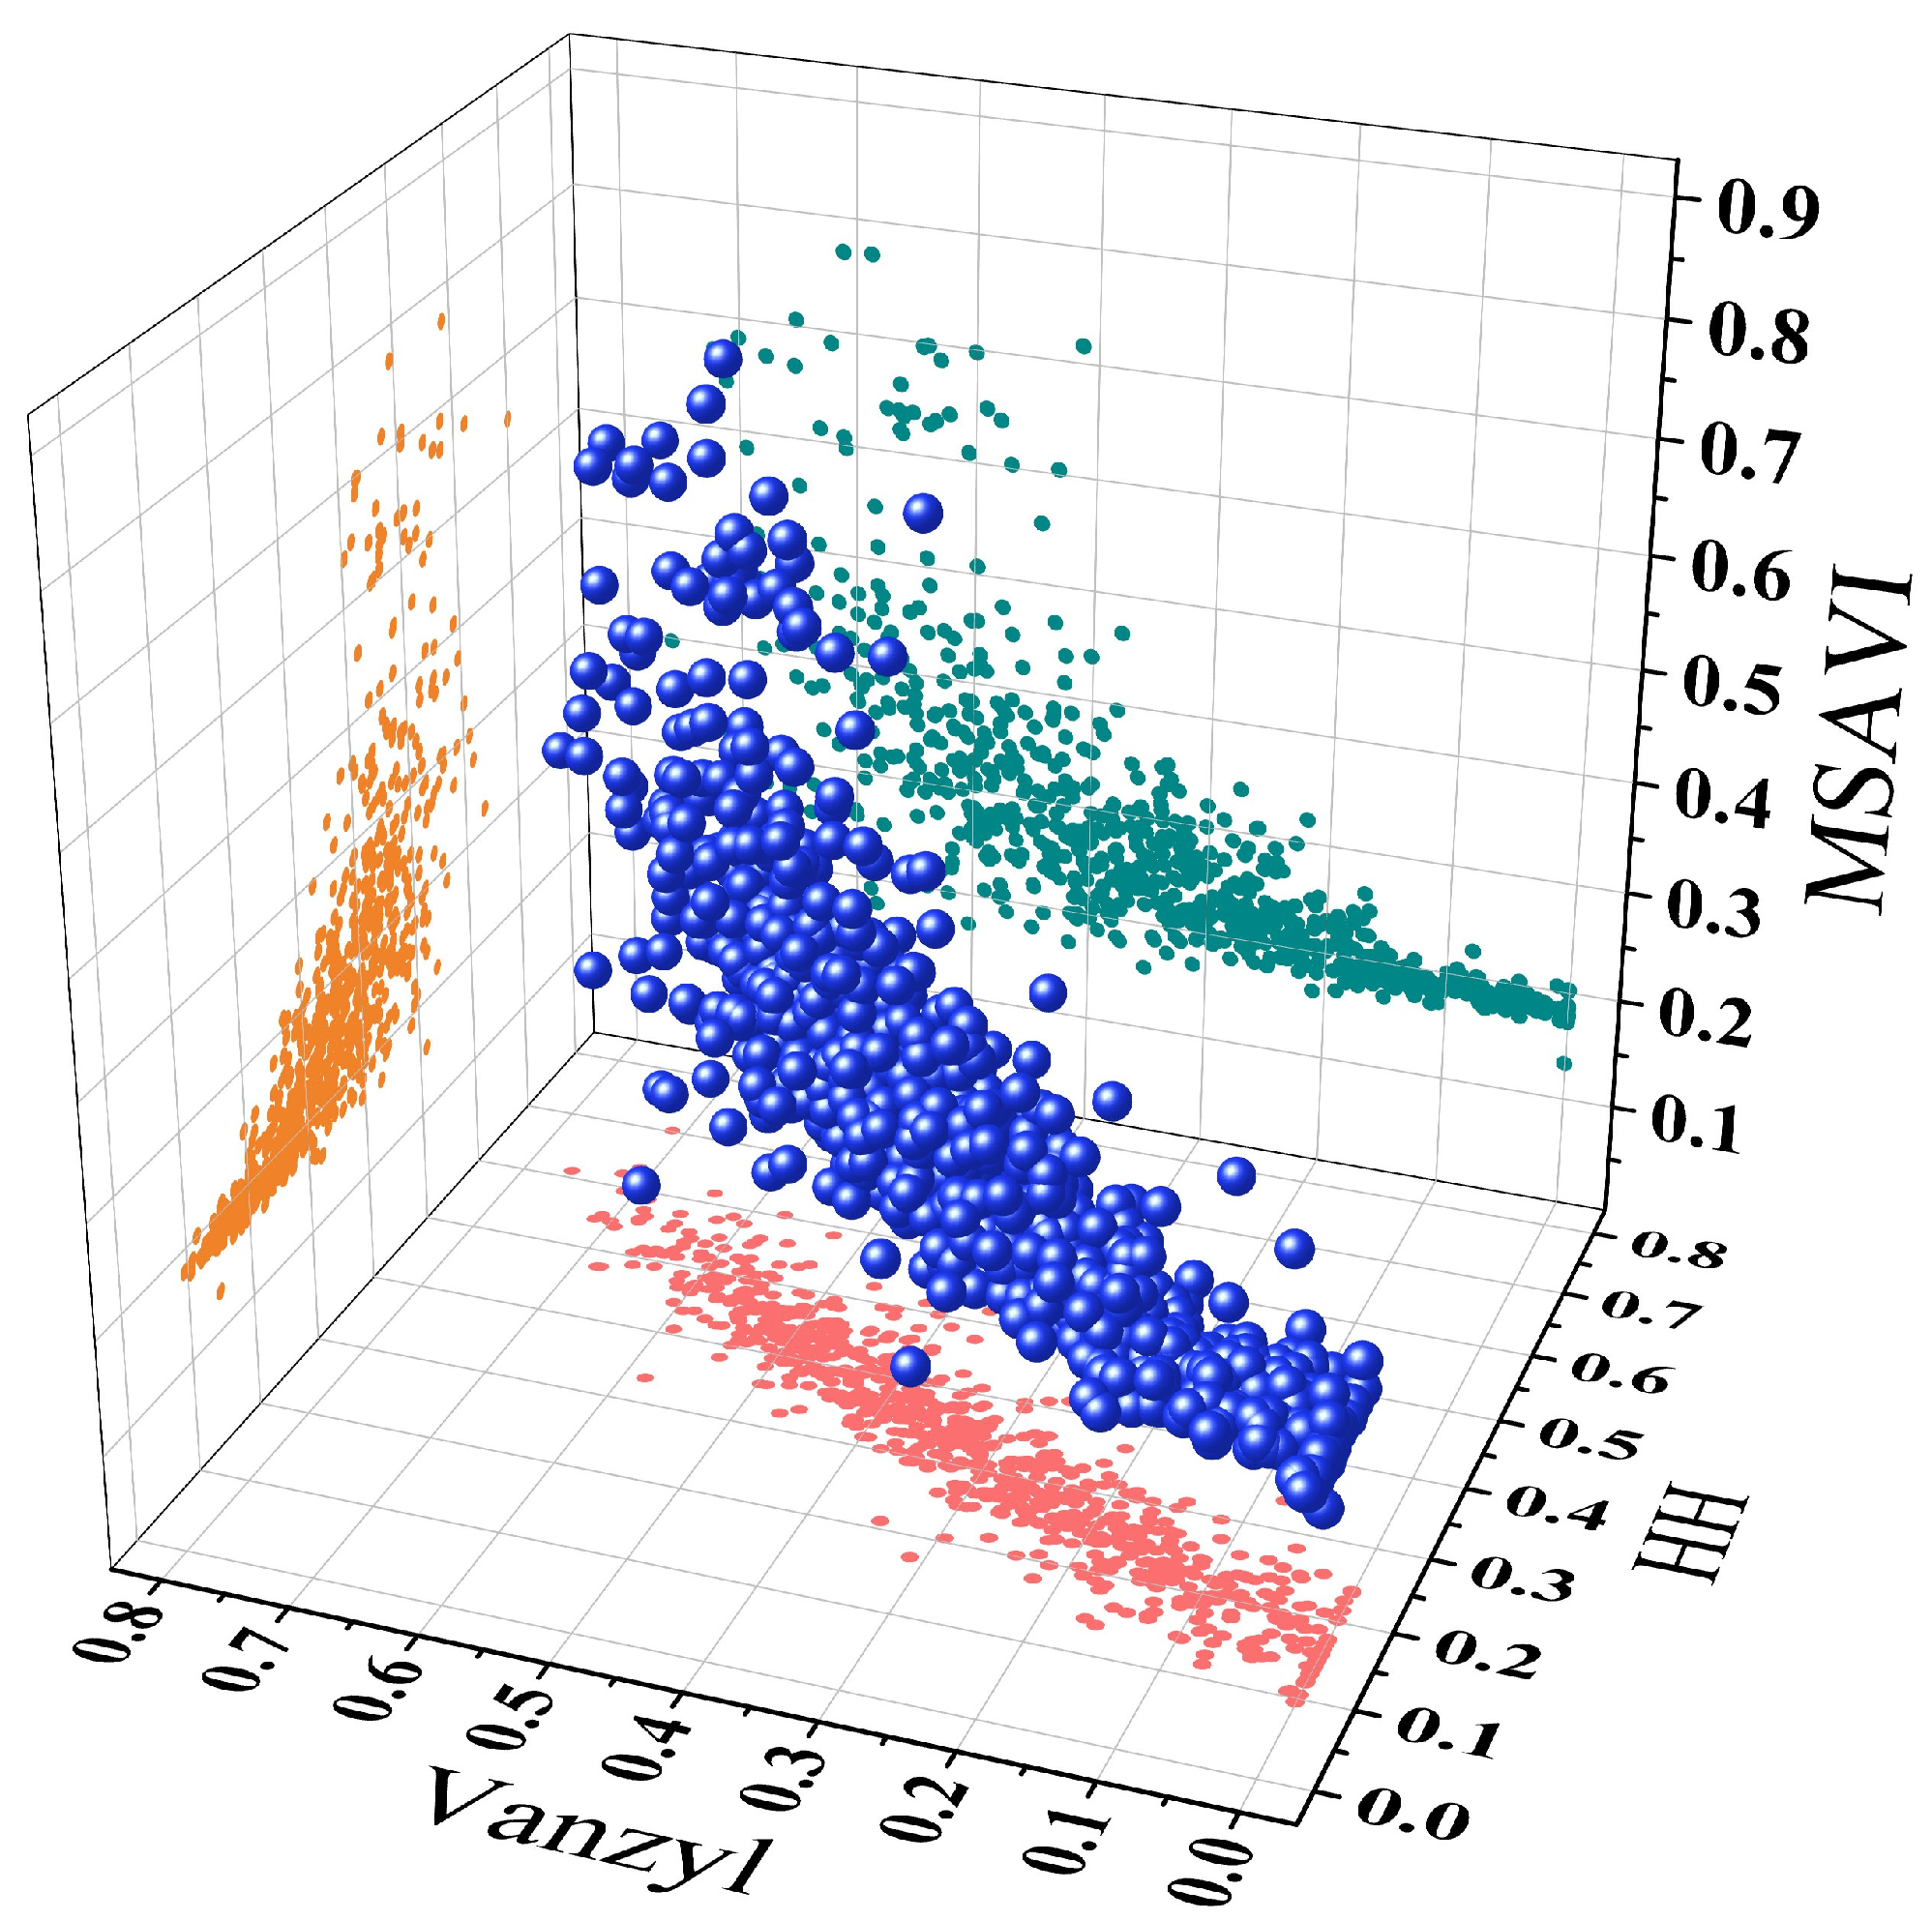
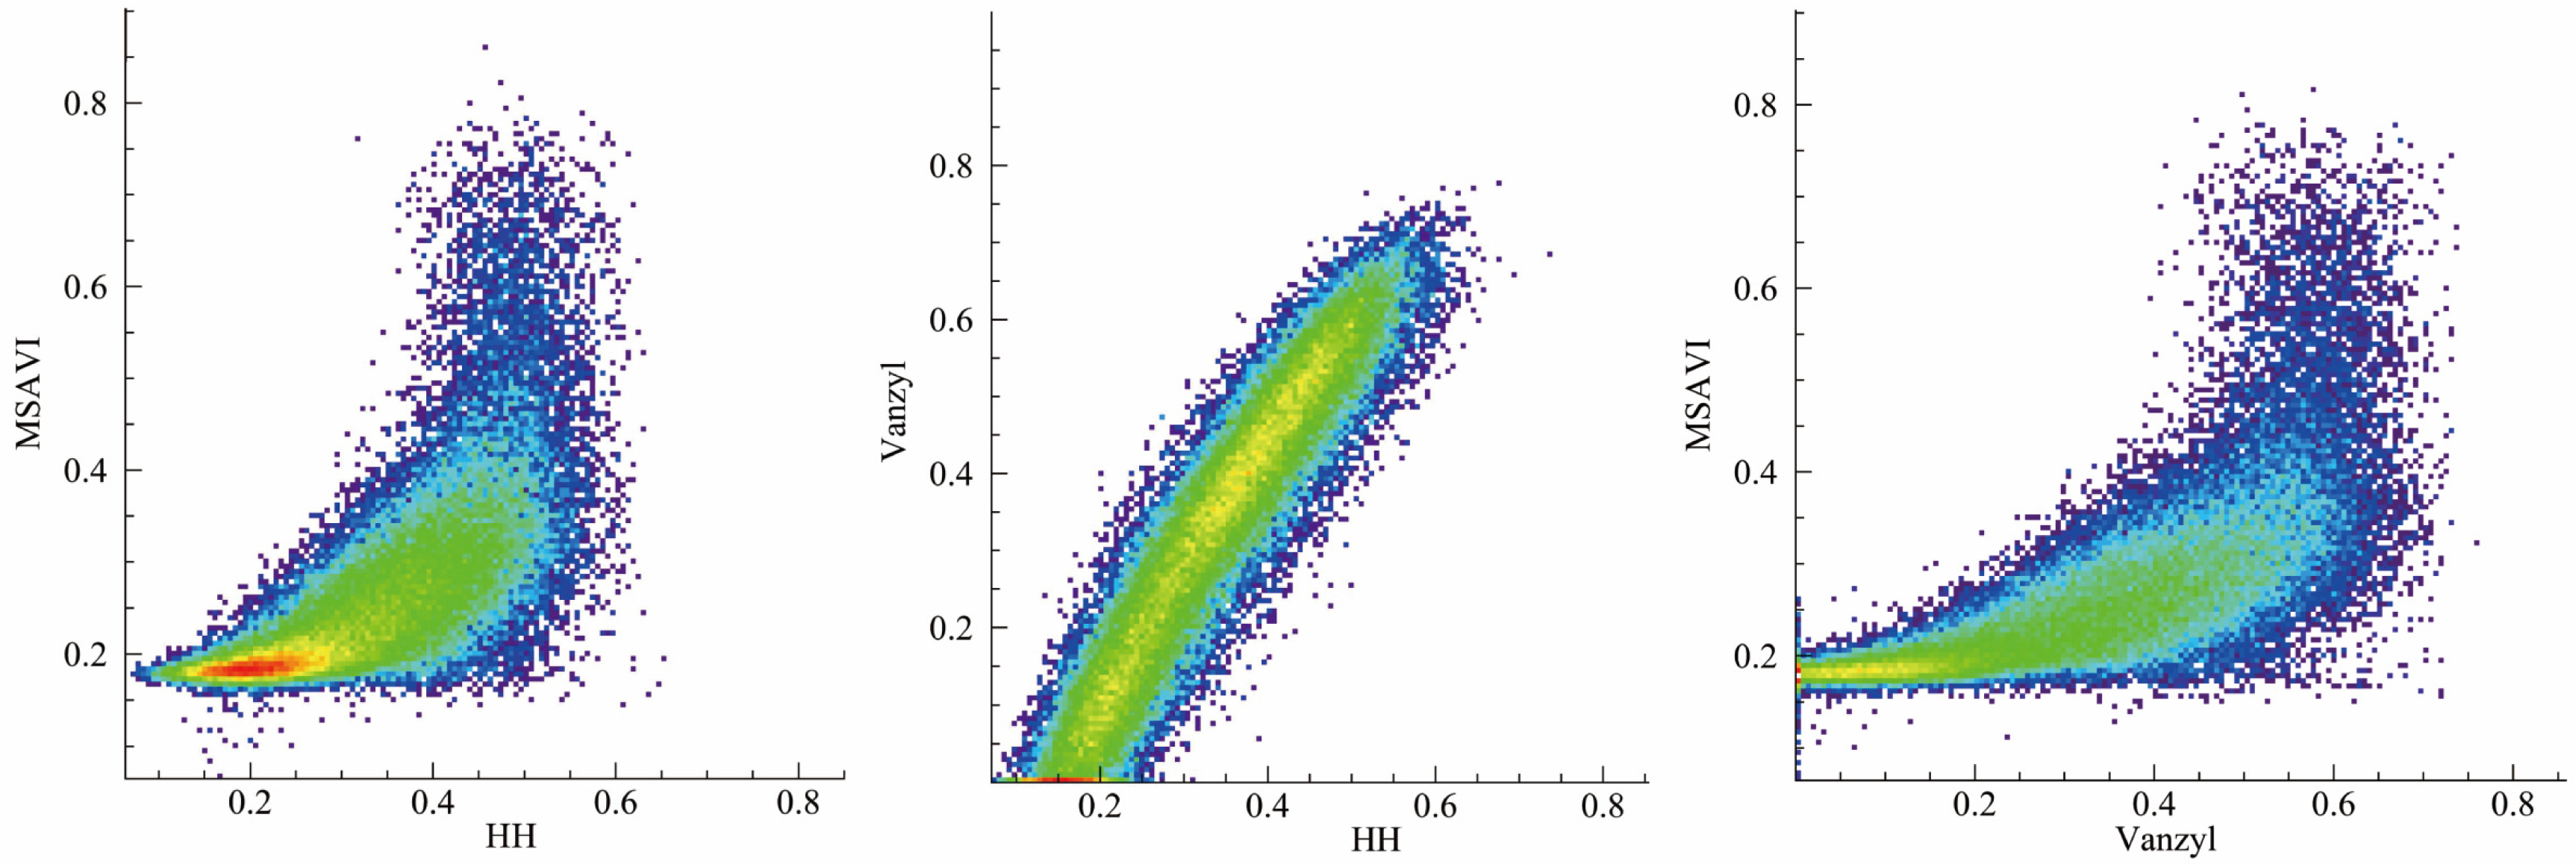
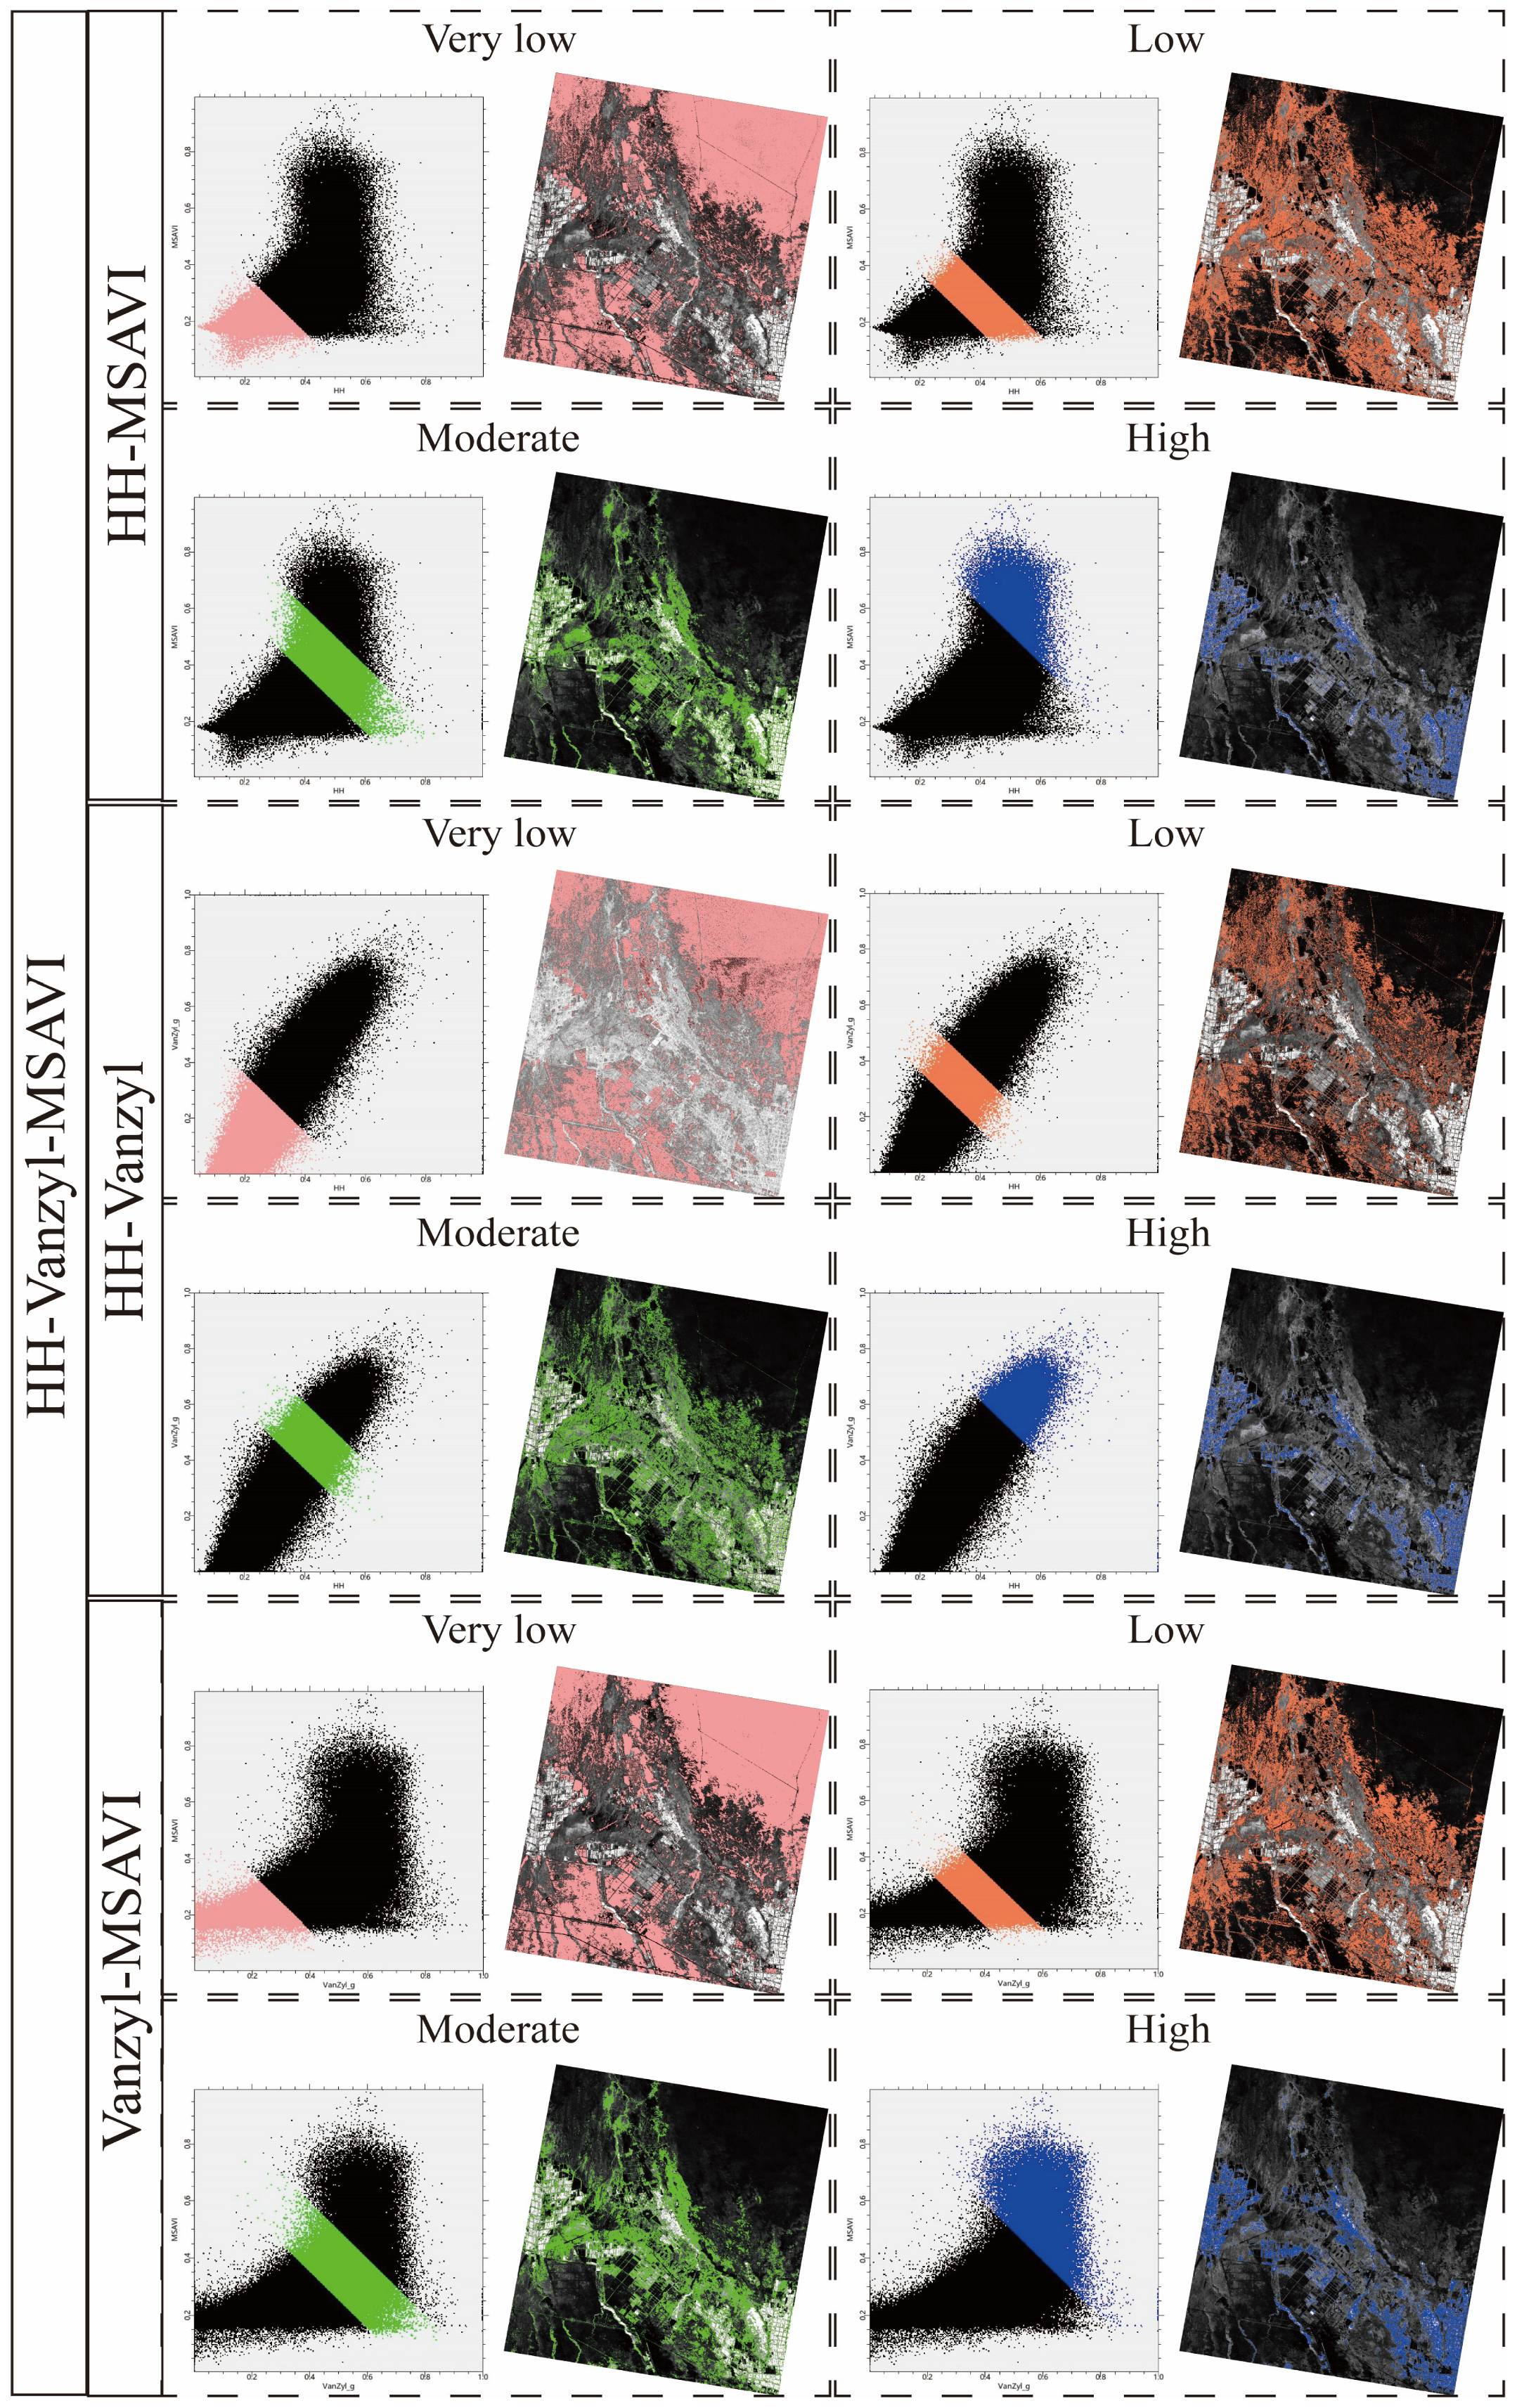
3.2.1. HH-Vanzyl-MSAVI Feature Space

The HH-Vanzyl-MSAVI 3D feature space was constructed using normalized HH, van Zyl, and MSAVI, as shown in Figure 8. A significant correlation between the components in the HH-Vanzyl-MSAVI 3D feature space can be observed. Therefore, in this study, the relationships between the components were further explored on a 2D scale.
Significant positive correlations between HH-MSAVI, HH-Vanzyl, and Vanzyl-MSAVI can be observed on a 2D scale, and all of them exhibit a positive correlation. Among them, HH-Vanzyl, which consists of a single radar datum, shows a very strong linear correlation (Figure 9).

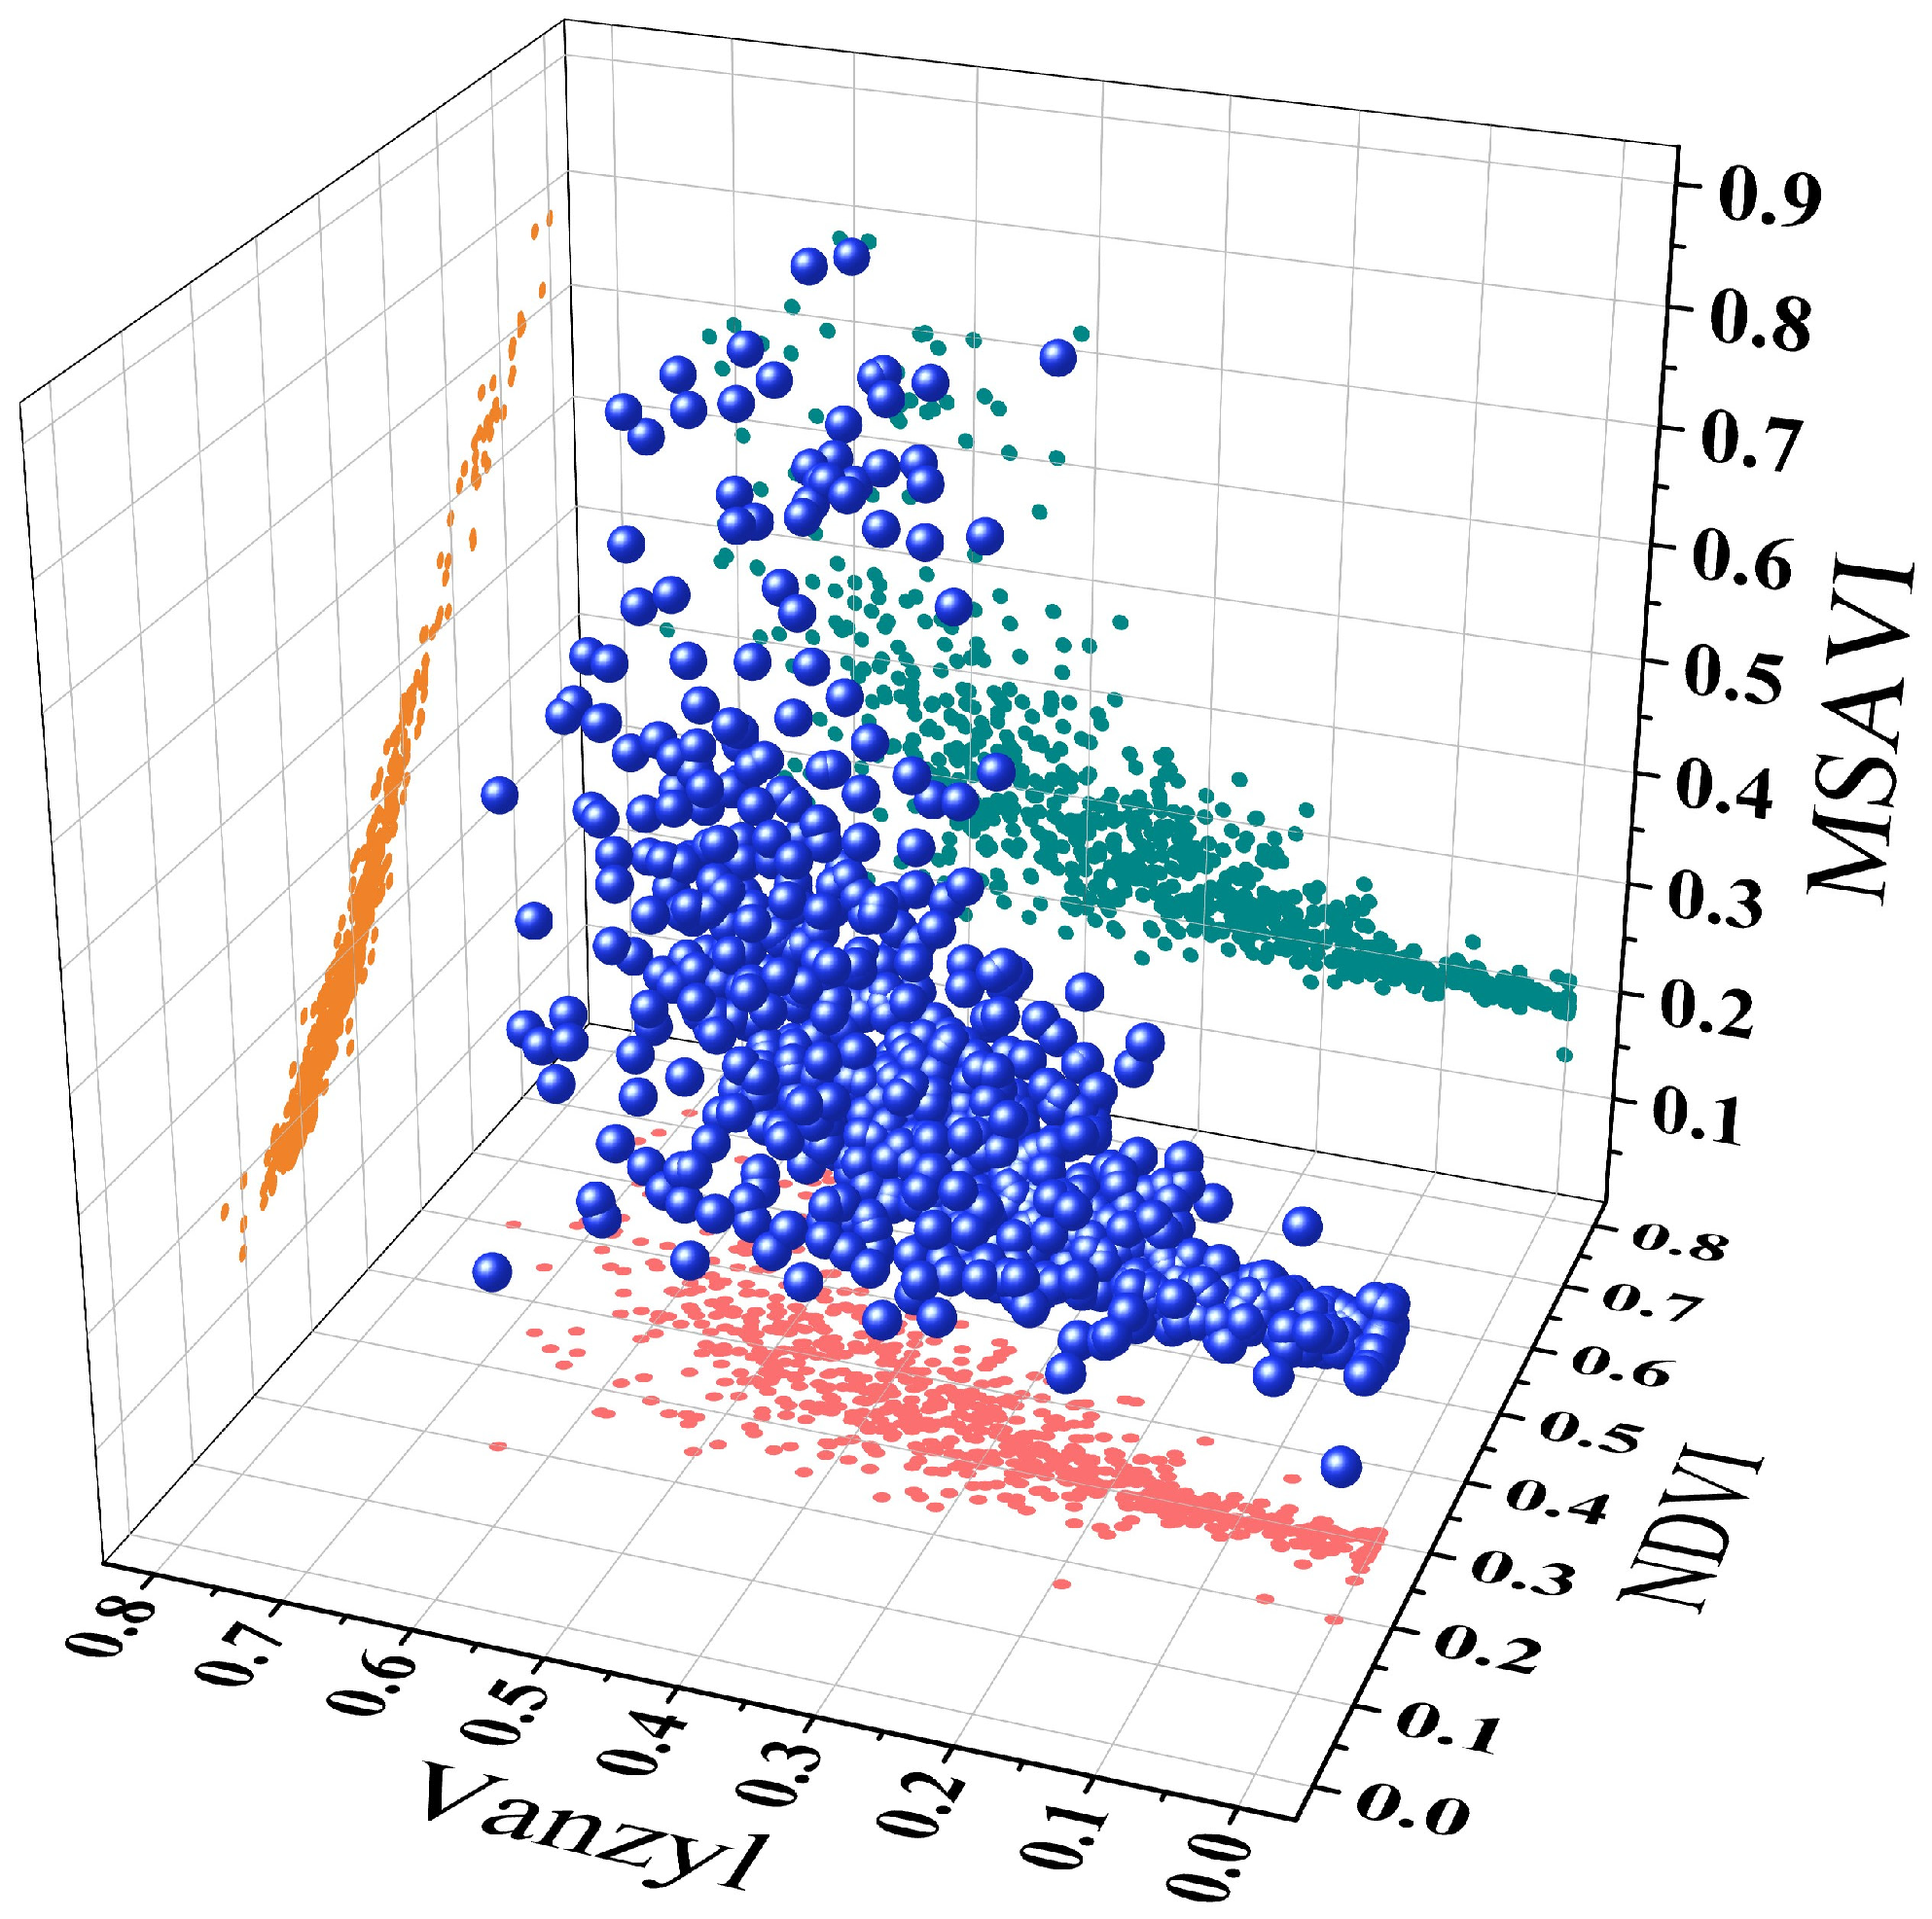
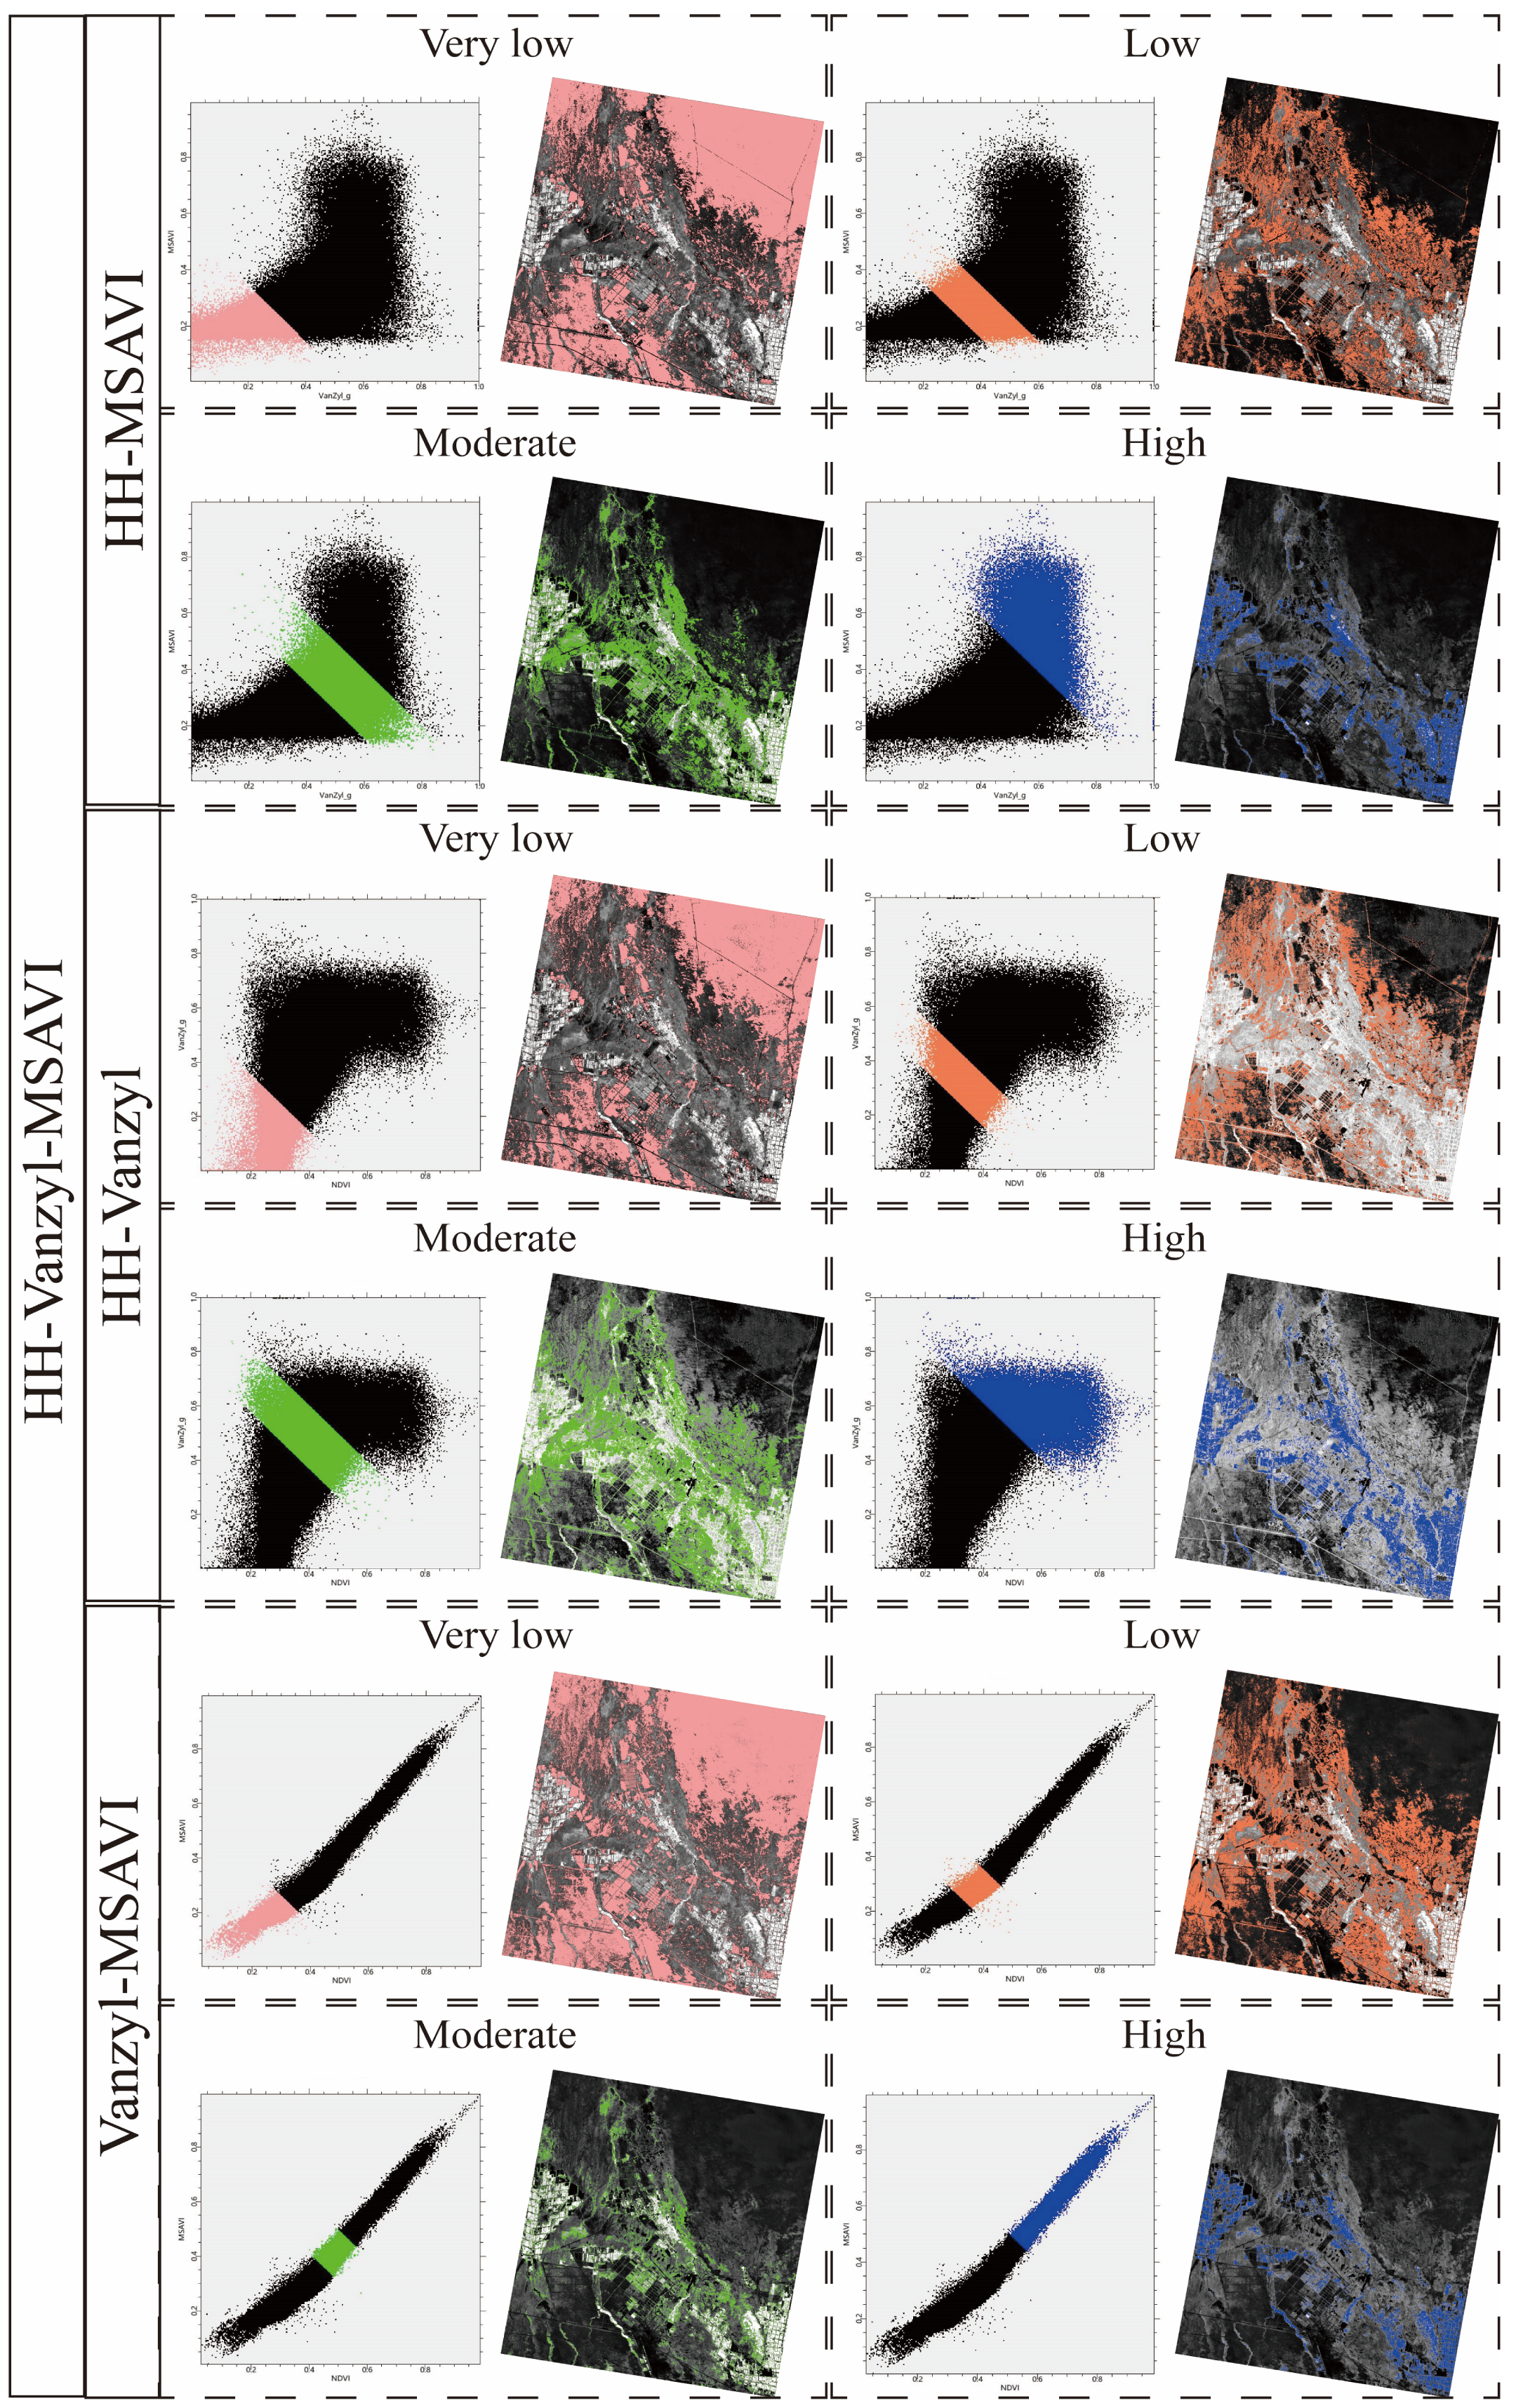
3.2.2. NDVI-Vanzyl-MSAVI Feature Space

The NDVI-Vanzyl-MSAVI 3D feature space was constructed using the normalized NDVI, van Zyl, and MSAVI, as shown in Figure 10. This 3D feature space differs from the one in Section 3.2.1 in that NDVI replaces HH, as NDVI shows a stronger correlation with soil moisture than HH when all components are ranked by importance. In the 3D space, a significant correlation between the components can be observed, although it is not as obvious as in the HH-Vanzyl-MSAVI space. The correlation between components was similarly examined on a 2D scale for the NDVI-Vanzyl-MSAVI feature space.
The positive correlations between HH-MSAVI, HH-Vanzyl, and Vanzyl-MSAVI can be observed on the 2D scale. Notably, the NDVI-MSAVI combination, consisting of a single optical data source, shows a very strong linear correlation (Figure 11). This is because both are vegetation indices, which are generally strongly correlated.

3.2.3. Soil Moisture Estimation Index

Soil moisture levels were analyzed by visualizing the correlations on a 2D scale, using data recorded by GPS, high-resolution supplementary interpreted imagery, and landscape photos obtained through field surveys in conjunction with the feature space in conjunction with the feature space (Figure 12 and Figure 13).
Regardless of the complexity of the spatial distribution of features in the imagery, the same feature type in feature space typically forms scenarios in the scatterplot. The comparative analysis revealed clear differences in soil moisture within the feature space, with distinct patterns in the location and distribution of varying soil moisture levels in the scatterplot. Areas with high soil moisture are primarily concentrated in the upper right corner of the 2D scale in both feature spaces. High soil moisture is represented in the HH-Vanzyl-MSAVI feature space as a zone with high values for HH, van Zyl, and MSAVI, and in the NDVI-Vanzyl-MSAVI feature space as a zone with high values for NDVI, van Zyl, and MSAVI. In contrast, low soil moisture is mainly concentrated in the lower left corner of the 2D scale, representing the zone with low values for each component. Based on this observation, the distance from any image pixel to the low-value zone is defined as a representation of soil moisture, with reference to the locations of high and low soil moisture in the feature space. The distance is greater for high soil moisture and shorter for low soil moisture. Therefore, an Optical–Radar Soil Moisture Retrieval Index (ORSMRI) was proposed in this study. The minimum value of soil moisture is 0. The position of the point in the feature space is represented as the origin (0, 0, 0). The ORSMRI can then be expressed as the distance from any point P (x, y, z) to the origin O (0, 0, 0), as shown in Figure 14.
O R S M R I   1 = L   1 = P O = ( H H ) 2 + ( V a n z y l ) 2 + ( M S A V I ) 2
O R S M R I   2 = L   2 = P O = ( N D V I ) 2 + ( V a n z y l ) 2 + ( M S A V I ) 2

4. Results

In this study, field samples were used to validate the proposed ORSMRI, assessing its effectiveness in retrieving soil moisture in the Yutian Oasis. A total of 81 samples were collected, with 60 randomly selected for fitting analysis with the ORSMRI, while the remaining 21 samples were used for correlation analysis with the retrieved values. The results showed that the proposed ORSMRIs are capable of retrieving soil moisture; for ORSMRI 1 and ORSMRI 2, R2 values were 0.797 and 0.721, and RMSE values were 3.329% and 3.905%, respectively (Figure 15).
The proposed ORSMRI, along with its linear correlation to soil moisture, was employed to retrieve and analyze soil moisture distribution in the oasis. High soil moisture is represented by blue, while low soil moisture is represented by red, as shown in Figure 16. The spatial distribution of soil moisture within the study area follows a hierarchical variation pattern, with higher moisture levels observed in the southern region compared to the north, and greater values in the west relative to the east. This pattern is likely influenced by the distinctive topography of the Yutian Oasis, which is flanked by high-altitude mountainous terrain to the south and low-lying desert regions to the north.
Figure 16A illustrates pronounced spatial heterogeneity in soil moisture distribution across the study area. High-moisture zones are primarily concentrated in the southern region, aligning spatially with major agricultural activity centers. The high moisture retention in these areas likely results from extensive farmland and vegetation coverage, which enhance vegetation-mediated water storage and soil water-holding capacity while minimizing evaporative losses. In contrast, low-moisture zones are predominantly distributed in the northern sector, especially in the northeast. A gradual decline in moisture content is evident along the transition from oasis to oasis–desert ecotones and further into desert environments. This spatial pattern can be attributed to the dominance of bare land and desert substrates in these regions, which exhibit poor soil permeability, limited water retention capacity, and high evaporative losses under arid climatic conditions. In these regions, soil moisture content is predominantly below 10%, with extensive areas approaching 0%. Figure 16B presents a soil moisture distribution pattern generally similar to that Figure 16A, albeit with subtle differences. Overall, soil moisture distribution appears more uniform, with diminished regional variations. High-moisture zones remain concentrated in the southern region, but their moisture levels are relatively higher than those in Figure 16A. Similarly, low-moisture zones persist in the northern sector, especially in the northeast, but exhibit higher moisture values compared to Figure 16A. Notably, areas with 0% soil moisture (depicted in yellow and light-red) are significantly reduced compared to those in Figure 16A.
The maximum soil moisture values retrieved using ORSMRI 1 and ORSMRI 2, based on their linear relationships with soil moisture, are 31.43% and 33.19%, respectively. Although both models produce generally consistent spatial soil moisture patterns, subtle differences are observed. Specifically, the northern regions in Figure 16A exhibit minimal variation in soil moisture distribution compared to those in Figure 16B. A detailed comparative analysis of Figure 16A, B confirms the operational feasibility of both ORSMRI 1 and ORSMRI 2 for soil moisture retrieval while highlighting their performance differences. ORSMRI 1 demonstrates higher accuracy (Figure 15), with retrieval results more closely matching observed soil moisture patterns in the study area. This improved performance is mainly attributed to its optimized selection and integration of feature components. The feature space, integrating backscattering coefficients, polarimetric decomposition scattering components, and optical remote sensing indices (HH, van Zyl, and MSAVI), more effectively captures the physical mechanisms underlying soil moisture dynamics.
A correlation test was conducted between the retrieved soil moisture and the remaining measured soil moisture during the same period. As shown in Table 5, the Pearson correlation coefficients were 0.71 and 0.70, respectively, with a significance level of 1% for both ORSMRI 1 and ORSMRI 2, demonstrating the effectiveness of ORSMRI.

5. Discussion

5.1. Strengths and Potentials of This Study

In soil moisture retrieval research based on feature space, optical remote sensing data are widely used due to their ability to provide abundant information about the ground surface. Numerous studies have confirmed that soil moisture information can be effectively retrieved through the selection of appropriate indices and the construction of diverse feature spaces [108,109]. However, optical-based models inherently face several limitations: (1) vulnerability to atmospheric interference, such as cloud cover and variations in solar illumination [21,24]; (2) limited sensitivity to surface moisture beneath vegetation cover due to spectral saturation [40]; (3) reliance on 2D feature spaces, with insufficient research on integrating radar data for soil moisture retrieval using 3D feature spaces, particularly in arid areas.
Unlike previous studies, this paper integrates both optical and SAR data, directly addressing these limitations by (1) utilizing radar’s all-weather acquisition capability [23], (2) improving penetration through vegetation and dry surface layers using C-band PolSAR [39], and (3) developing a 3D feature space that integrates radar-derived scattering mechanisms (HH backscattering coefficient and Vanzyl_g) with optical indices (MSAVI and NDVI) [23]. Compared to multispectral-only models, such as VI-TS/Albedo (R2 = 0.55 [108]) and VI-LST (R2 = 0.71 [109]), the proposed ORSMRI1 demonstrates superior accuracy (R2 = 0.797). This performance improvement highlights the added value of radar data acquisition, particularly in arid areas where optical indices are limited by sparse vegetation and mixed pixel effects [24,92]. The Radarsat-2 data used in this study are fully polarimetric, and extensive research has demonstrated the potential of PolSAR for soil moisture retrieval [26,28,29]. From a dimensionality perspective, this study distinguishes itself by expanding the feature space from a conventional 2D scale to a 3D scale, as commonly used in previous research [99,100,101]. This expansion utilizes both optical and radar data to enhance the extraction of soil moisture-related information from radar signals. Radar-based soil moisture retrieval has yielded satisfactory results using both backscattering coefficients and polarimetric decomposition methods [67,103].
Therefore, this study utilizes not only backscattering coefficients from various polarization modes and their combinations but also 28 polarimetric decomposition scattering components derived from nine different polarimetric decomposition methods. Regarding optical remote sensing indices, this study selects six moisture indices and four vegetation indices. The vegetation index was chosen because of the strong correlation existing among soil moisture and vegetation in arid areas, where climate, precipitation, and soil conditions play a significant role [107]. Compared to moisture indices, vegetation indices are more convenient and reliable, as demonstrated by the optimal feature selection results presented in this study (Figure 7), and they have also been widely used in feature space-based research [99,101]. When comparing the performance of ORSMRI 1, which incorporates backscattering coefficients, polarimetric decomposition scattering components, and optical remote sensing indices, with ORSMRI 2, which only uses polarimetric decomposition scattering components and optical remote sensing indices, ORSMRI 1 demonstrates greater accuracy. This improved performance can be attributed to radar’s higher sensitivity to soil moisture. The R2 values for ORSMRI 1 and ORSMRI 2 were 0.797 and 0.721, and RMSE values were 3.329% and 3.905%, respectively. Additionally, the Pearson correlation coefficients reached 0.71 and 0.70, at a 1% significance level, demonstrating a significant correlation and validating the effectiveness of ORSMRI in soil moisture retrieval.

5.2. Soil Moisture Distribution Characteristics Analysis

As shown in Figure 16, areas with high soil moisture are primarily concentrated in the southeastern and central-western parts of the oasis, which coincide with the main agricultural activity centers. These areas are predominantly covered by vegetation and farmland, as confirmed by a comparative analysis with Sentinel-2 satellite images (Figure 17B). The high soil moisture in these areas may be related to the water retention and storage capacity of vegetation, which helps reduce surface runoff and minimize evaporative loss of soil moisture [110]. Soil moisture gradually decreases from the oasis to the oasis–desert interface and then to the desert. Areas of low soil moisture are concentrated in the deserts and Gobi region along the northern and southwestern periphery of the oasis, particularly in the northeast. This distribution is influenced by groundwater evaporation in the Gobi due to the arid climate [111]. Additionally, topography plays a significant role in the spatial distribution of soil moisture [112]. The Yutian Oasis is situated in a unique topographic setting, with high-altitude mountains to the south and low-altitude deserts to the north. The oasis lies between the mountains and the desert, with a gradual increase in elevation from south to north (Figure 17C). Snowmelt from the Kunlun Mountains, carried by the Keriya River, flows through the oasis and directly influences the spatial distribution of surface runoff, groundwater, and surface water (Figure 17A).
Zhuang et al. [113] demonstrated that groundwater flow paths are longer and slower in areas with low elevations and gentle slopes, leading to accumulation at the surface. As the oasis is located in an arid area, groundwater is a major source of soil moisture and evapotranspiration is a major destination of soil moisture, which affects the distribution of soil moisture in the oasis [114].

5.3. Limitations and Perspectives

The limitations of this study are as follows: First, although SAR images were filtered to reduce speckle noise, complete elimination of speckle noise remains challenging, and the filtering process could result in the loss of useful information [70]. In the future, a range of advanced filtering methods should be considered, along with repeated experiments and comparisons. Second, the resolution of the radar image was reduced to 10 m using cubic convolutional reconstruction to match the resolution of the optical data due to spatial resolution limitations. However, this process inevitably led to the loss of some texture information in the radar data. Multi-source data fusion or spatiotemporal fusion methods should be explored in the future to improve image quality [115]. Third, in this study, only conventional polarimetric decomposition methods have been considered, which makes limited use of the polarimetric characteristics of SAR data, and in the future, the texture characteristics of SAR data could be considered more comprehensively.
In this study, the vegetation index was selected based on its importance, and while numerous studies have demonstrated the feasibility and effectiveness of vegetation indices in soil moisture retrieval, they also have certain limitations. First, the sensitivity of vegetation indices to soil moisture is influenced by seasonal and climatic conditions, making them unsuitable for application in all regions and periods. Second, vegetation indices do not provide an absolute value for soil moisture but rather a relative indicator of vegetation condition. Third, vegetation indices are sensitive to land use changes and human interventions, which may compromise the accuracy of retrieval.
Finally, the samples were evenly distributed to cover the study area, with a more reasonable distribution to include a variety of land types. However, the relatively limited number of samples increased the uncertainty of the results. To address this issue in future field sampling, the sample density will be increased to provide a more comprehensive understanding.

6. Conclusions

In this study, backscattering coefficients under different polarization modes and polarimetric decomposition scattering components were extracted from SAR data, while optical remote sensing indices were derived from optical data. The RF feature selection algorithm was then applied to identify the most sensitive feature components to measured soil moisture, enabling the construction of a 3D feature space. Finally, an ORSMRI was proposed, based on the spatial positioning of varying soil moisture levels within 3D feature space. Subsequent validation of the accuracy of ORSMRI was performed.
(1)
Two feature spaces were constructed on the basis of the four scenarios of feature selection: the HH-Vanzyl-MSAVI 3D feature space was created by selecting HH, Vanzyl_g, and MSAVI from the polarization modes and their combinations, polarimetric decomposition scattering components, and optical remote sensing indices, respectively; the other NDVI-Vanzyl-MSAVI 3D feature space was constructed by selecting van Zyl, MSAVI, and NDVI from all optical and radar components. The results showed a positive correlation between the individual components of both 3D feature spaces.
(2)
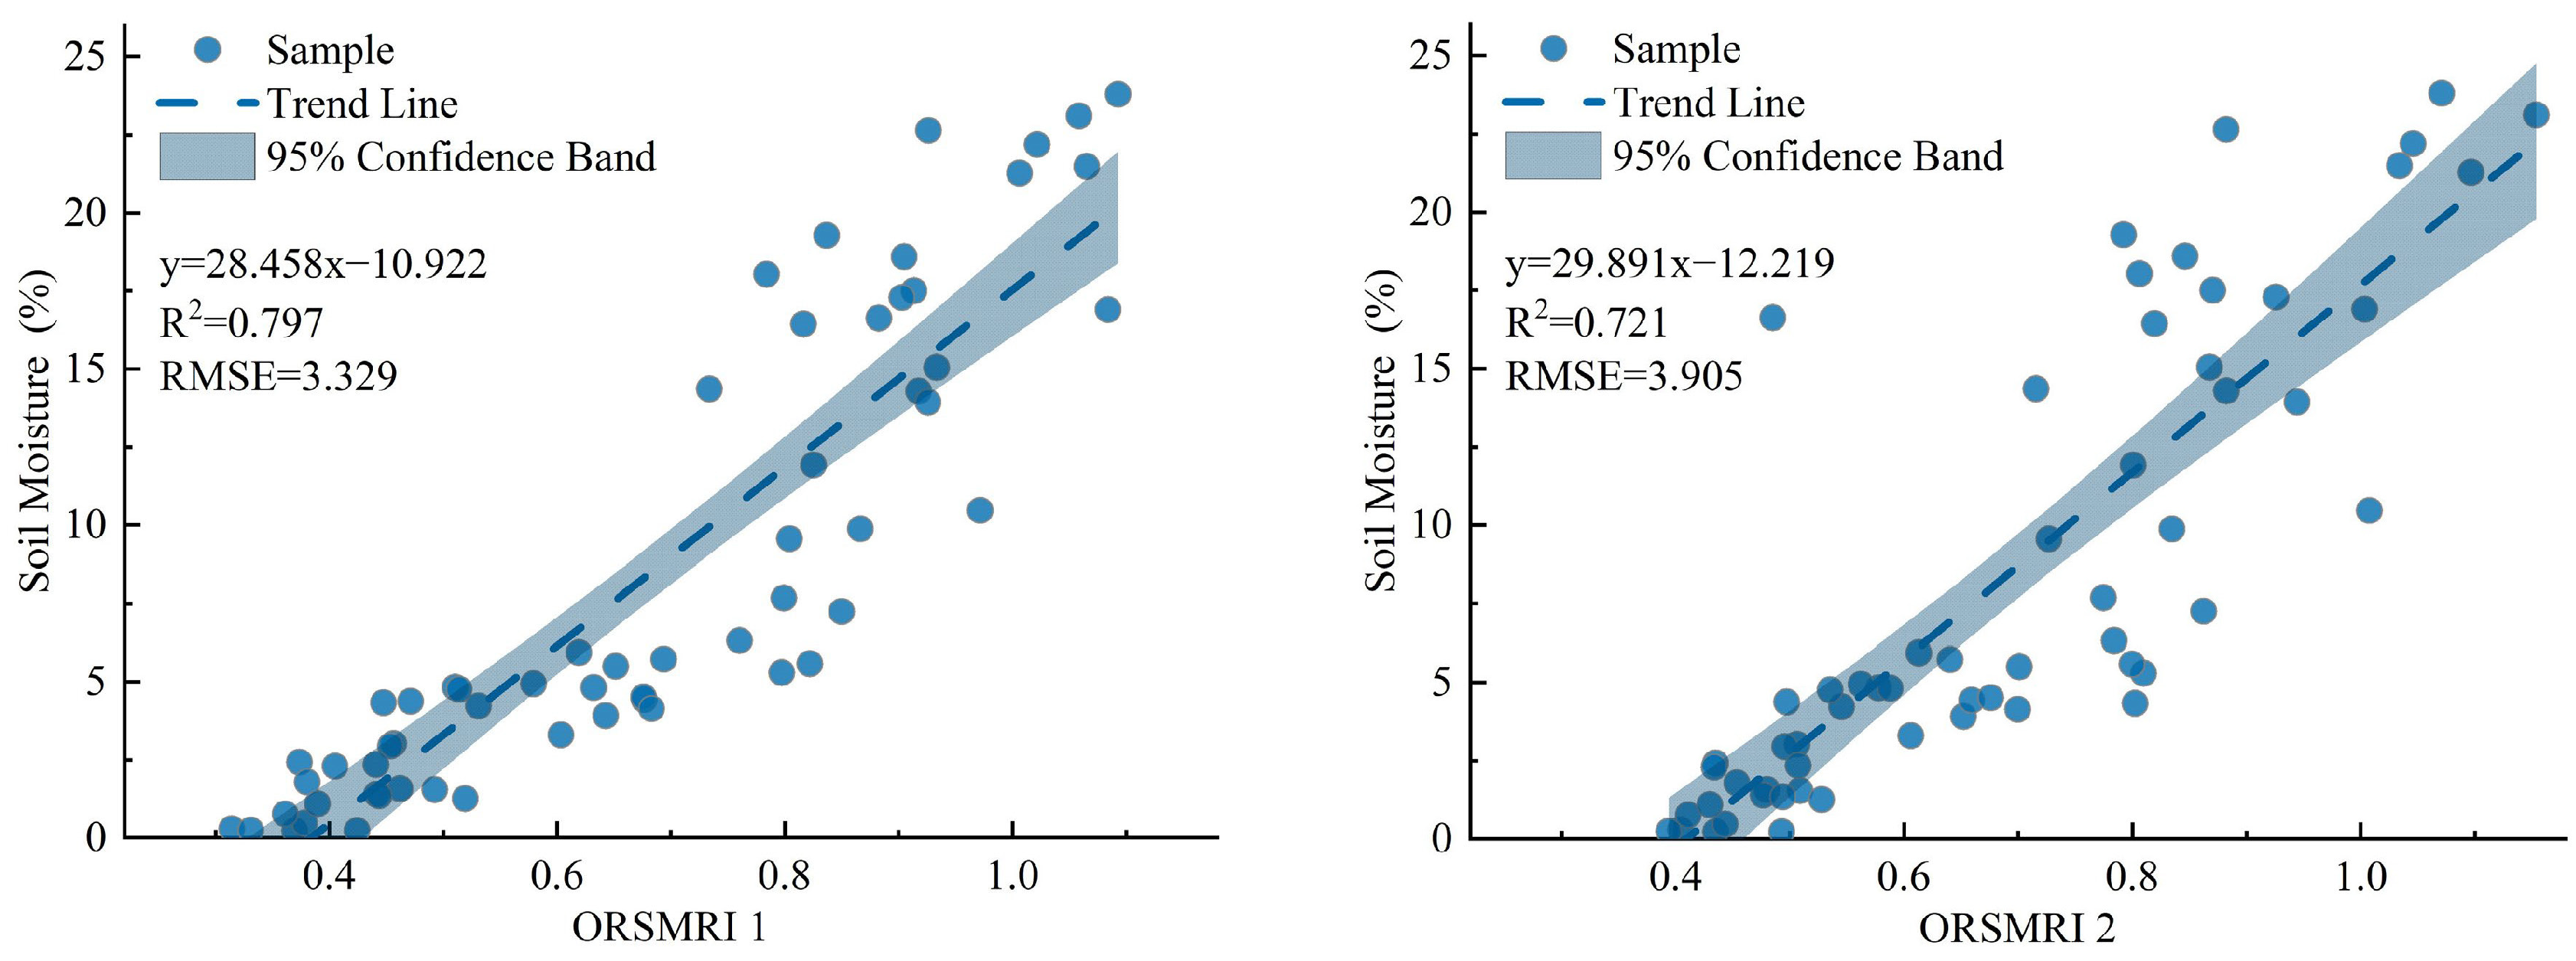
The ORSMRI, based on both radar and optical remote sensing data, was proposed by analyzing the distribution of soil moisture in the 3D feature space. A total of 60 samples were randomly selected and used for fitting with the ORSMRI to verify its accuracy. The results showed that the R2 values for ORSMRI 1 and ORSMRI 2 were 0.797 and 0.721, and RMSE values were 3.329% and 3.905%, respectively. To further analyze soil moisture and its distribution in the study area, the retrieval of soil moisture was performed using the proposed ORSMRI, and the linear correlation between the retrieved and measured soil moisture was examined. A correlation test between the retrieved soil moisture and the remaining measured soil moisture for the same period revealed that the Pearson correlation coefficients for ORSMRI 1 and ORSMRI 2 were 0.71 and 0.70, respectively, with a significance level of 1%, which confirms the effectiveness of the ORSMRI proposed in this study.
(3)
Yutian Oasis is a typical arid and semi-arid oasis located inland, where the soil moisture distribution exhibits a hierarchical and alternating pattern. The distribution of soil moisture shows a trend of being higher in the south than in the north, and higher in the west than in the east. Areas with low soil moisture are concentrated in the deserts and Gobi in the southwestern and northern (especially northeastern) parts of the oasis’s periphery, while areas with high soil moisture are concentrated in the southeastern and central-western regions of the oasis, which are primarily covered by vegetation and farmland.
In general, this study incorporated both radar and optical remote sensing data to construct a 3D feature space and proposed the ORSMRI for soil moisture retrieval based on feature space theory. The findings demonstrate the feasibility of soil moisture retrieval using multi-source remote sensing data within the feature space framework, offering a new perspective for the sustainable development of oasis agriculture in the future.

Author Contributions

Conceptualization, Y.A. and I.N.; Methodology, Y.A. and I.N.; Software, Y.A.; Validation, Y.A.; Formal Analysis, Y.A.; Investigation, Y.A., S.L., X.L., X.Y., A.A. and Y.Q.; Resources, I.N.; Data Curation, Y.A., S.L., X.L., X.Y., A.A. and Y.Q.; Writing—Original Draft Preparation, Y.A.; Writing—Review and Editing, I.N., S.L., X.L., X.Y., A.A. and Y.Q.; Visualization, Y.A.; Supervision, I.N.; Project Administration, I.N.; Funding Acquisition, I.N. All authors have read and agreed to the published version of the manuscript.

Funding

This research was funded by the Third Xinjiang Comprehensive Scientific Expedition (No. 2022xjkk0301); the Natural Science Foundation of Xinjiang Uygur Autonomous Region (No. 2024D01C34); and the National Natural Science Foundation of China (42061065, 32160319).

Data Availability Statement

Data will be made available on request; further inquiries can be directed to the corresponding author.

Acknowledgments

All authors are sincerely grateful to the reviewers and editors for their constructive comments on the improvement of the manuscript.

Conflicts of Interest

The authors declare that there are no conflicts of interest or competing financial interests in relation to the work described in this manuscript. All authors have reviewed and approved the final version of the manuscript and agree to its submission. This research was conducted in the absence of any commercial or financial relationships that could be construed as a potential conflict of interest.

References

  1. Avissar, R. Which type of soil–vegetation–atmosphere transfer scheme is needed for general circulation models: A proposal for a higher–order scheme. J. Hydrol. 1998, 212–213, 136–154. [Google Scholar] [CrossRef]
  2. Baghdadi, N.; Cresson, R.; Pottier, E.; Aubert, M.; Mehrez, M.; Jacome, A.; Benabdallah, S. A Potential Use for the C-Band Polarimetric SAR Parameters to Characterize the Soil Surface Over Bare Agriculture Fields. IEEE Trans. Geosci. Remote Sens. 2012, 50, 3844–3858. [Google Scholar] [CrossRef]
  3. Beck, H.E.; de Jeu, R.A.M.; Schellekens, J.; van Dijk, A.I.J.M.; Bruijnzeel, L.A. Improving Curve Number Based Storm Runoff Estimates Using Soil Moisture Proxies. IEEE J. Sel. Top. Appl. Earth Obs. Remote Sens. 2009, 2, 250–259. [Google Scholar] [CrossRef]
  4. Yang, T.; Gong, H.; Li, X.; Zhao, W.; Meng, D. Progress of soil moisture monitoring by remote sensing. Acta Ecol. Sin. 2010, 30, 6264–6277. [Google Scholar]
  5. Walker, J. Estimating Soil Moisture Profile Dynamics from Near-Surface Soil Moisture Measurements and Standard Metrological Data. Ph.D. Thesis, The University of Newcastle, Newcastle, NSW, Australia, 1999. [Google Scholar]
  6. Lo, M.-H.; Famiglietti, J.S. Irrigation in California’s Central Valley strengthens the southwestern U.S. water cycle. Geophys. Res. Lett. 2013, 40, 301–306. [Google Scholar] [CrossRef]
  7. Hong, Z.; Zhang, W.; Yu, C.; Zhang, D.; Li, L.; Meng, L. SWCTI: Surface Water Content Temperature Index for Assessment of Surface Soil Moisture Status. Sensors 2018, 18, 2875. [Google Scholar] [CrossRef] [PubMed]
  8. Yin, Z.; Lei, T.; Yan, Q.; Chen, Z.; Dong, Y. A near-infrared reflectance sensor for soil surface moisture measurement. Comput. Electron. Agric. 2013, 99, 101–107. [Google Scholar] [CrossRef]
  9. Wang, Y.; Yang, J.; Chen, Y.; Wang, A.; De Maeyer, P. The Spatiotemporal Response of Soil Moisture to Precipitation and Temperature Changes in an Arid Region, China. Remote Sens. 2018, 10, 468. [Google Scholar] [CrossRef]
  10. Pierdicca, N.; Fascetti, F.; Pulvirenti, L.; Crapolicchio, R.; Muñoz-Sabater, J. Analysis of ASCAT, SMOS, in-situ and land model soil moisture as a regionalized variable over Europe and North Africa. Remote Sens. Environ. 2015, 170, 280–289. [Google Scholar] [CrossRef]
  11. Zhao, W.; Liu, B. The response of sap flow in shrubs to rainfall pulses in the desert region of China. Agric. For. Meteorol. 2010, 150, 1297–1306. [Google Scholar] [CrossRef]
  12. Gao, J.; Wang, W.; Zhao, M.; Ma, Z.; Hou, X.; Li, W. Spatial and temporal distribution characteristics of soil moisture in the non-freezing period under the bare land and vegetation cover in the Mu Us desert. Hydrogeol. Eng. Geol. 2022, 49, 34–42. [Google Scholar] [CrossRef]
  13. Hu, D.; Guo, N.; Sha, S.; Wang, L.; Li, Q.; Wang, J.; Liu, W. Retrieval of Bare Soil Moisture Based on Radarsat-2 SAR in Dingxi of Gansu Provine. J. Arid Meteorol. 2014, 32, 553–559. [Google Scholar]
  14. Procházka, P.; Hönig, V.; Maitah, M.; Pljučarská, I.; Kleindienst, J. Evaluation of Water Scarcity in Selected Countries of the Middle East. Water 2018, 10, 1482. [Google Scholar] [CrossRef]
  15. Feng, S.; Fu, Q. Expansion of global drylands under a warming climate. Atmos. Chem. Phys. 2013, 13, 10081–10094. [Google Scholar] [CrossRef]
  16. Liang, X.; Lettenmaier, D.P.; Wood, E.F.; Burges, S.J. A simple hydrologically based model of land surface water and energy fluxes for general circulation models. J. Geophys. Res. Atmos. 2012, 99, 14415–14428. [Google Scholar] [CrossRef]
  17. Xi, W.; Zhan, W.; Wentao, Y.; Xuejie, X.; Longyue, S.; Wenyue, D.; Qian, Z.; Yuenan, Z. Shortage of Water Resources in CHINA and Countermeasures. Environ. Eng. 2014, 32, 1–5. [Google Scholar] [CrossRef]
  18. Chen, Y.; Li, Z.; Xu, J.; Shen, Y.; Xing, X.; Xie, T.; Li, Z.; Yang, L.; Xi, H.; Zhu, C.; et al. Changes and Protection Suggestions in Water Resources and Ecological Environment in Arid Region of Northwest China. Bull. Chin. Acad. Sci. 2023, 38, 385–393. [Google Scholar]
  19. Chen, Y. Research on Water Resources in the Arid Areas of Northwest China; Science Press: Beijing, China, 2014. [Google Scholar]
  20. Wu, M.-C.; Ding, J.-L.; Wang, G.-F. Regional Soil Moisture Inversion Based on Surface Temperature and Vegetation Index Characteristic Spaces. J. Desert Res. 2012, 32, 148–154. [Google Scholar]
  21. Guo, B.; Zang, W.; Zhang, R. Soil Salizanation Information in the Yellow River Delta Based on Feature Surface Models Using Landsat 8 OLI Data. IEEE Access 2020, 8, 94394–94403. [Google Scholar] [CrossRef]
  22. Escorihuela, M.J.; Quintana-Seguí, P. Comparison of remote sensing and simulated soil moisture datasets in Mediterranean landscapes. Remote Sens. Environ. 2016, 180, 99–114. [Google Scholar] [CrossRef]
  23. Shi, J.; Du, Y.; Du, J.; Jiang, L.; Chai, L.; Mao, K.; Xu, P.; Ni, W.; Xiong, C.; Liu, Q.; et al. Progresses on microwave remote sensing of land surface parameters. Sci. China Earth Sci. 2012, 55, 1052–1078. [Google Scholar] [CrossRef]
  24. Ilyas, N.; Shi, Q.; Abdulla, A.; Xia, N.; Wang, J. Quantitative evaluation of soil salinization risk in Keriya Oasis based on grey evaluation model. Trans. Chin. Soc. Agric. Eng. 2019, 35, 176–184. [Google Scholar] [CrossRef]
  25. Boerner, W.M. Recent advances in extra-wide-band polarimetry, interferometry and polarimetric interferometry in synthetic aperture remote sensing and its applications. IEE Proc.-Radar Sonar Navig. 2003, 150, 113–124. [Google Scholar] [CrossRef]
  26. Hajnsek, I.; Jagdhuber, T.; Schon, H.; Papathanassiou, K.P. Potential of Estimating Soil Moisture Under Vegetation Cover by Means of PolSAR. IEEE Trans. Geosci. Remote Sens. 2009, 47, 442–454. [Google Scholar] [CrossRef]
  27. Tripathi, A.; Tiwari, R.K. Synergetic utilization of sentinel-1 SAR and sentinel-2 optical remote sensing data for surface soil moisture estimation for Rupnagar, Punjab, India. Geocarto Int. 2020, 37, 2215–2236. [Google Scholar] [CrossRef]
  28. Huang, S.; Ding, J.; Liu, B.; Ge, X.; Wang, J.; Zou, J.; Zhang, J. The Capability of Integrating Optical and Microwave Data for Detecting Soil Moisture in an Oasis Region. Remote Sens. 2020, 12, 1358. [Google Scholar] [CrossRef]
  29. Lievens, H.; Verhoest, N.E.C. Spatial and temporal soil moisture estimation from RADARSAT-2 imagery over Flevoland, The Netherlands. J. Hydrol. 2012, 456-457, 44–56. [Google Scholar] [CrossRef]
  30. Sandholt, I.; Rasmussen, K.; Andersen, J. A simple interpretation of the surface temperature/vegetation index space for assessment of surface moisture status. Remote Sens. Environ. 2002, 79, 213–224. [Google Scholar] [CrossRef]
  31. Carlson, T.N.; Gillies, R.R.; Perry, E.M. A method to make use of thermal infrared temperature and NDVI measurements to infer surface soil water content and fractional vegetation cover. Remote Sens. Rev. 1994, 9, 161–173. [Google Scholar] [CrossRef]
  32. Clarke, T.R. An Empirical Approach for Detecting Crop Water Stress Using Multispectral Airborne Sensors. HortTechnology 1997, 7, 9–16. [Google Scholar] [CrossRef]
  33. Goetz, S.J. Multi-sensor analysis of NDVI, surface temperature and biophysical variables at a mixed grassland site. Int. J. Remote Sens. 2010, 18, 71–94. [Google Scholar] [CrossRef]
  34. Lambin, E.F.; Ehrlich, D. The surface temperature-vegetation index space for land cover and land-cover change analysis. Int. J. Remote Sens. 2007, 17, 463–487. [Google Scholar] [CrossRef]
  35. Ghulam, A.; Qin, Q.; Zhan, Z. Designing of the perpendicular drought index. Environ. Geol. 2006, 52, 1045–1052. [Google Scholar] [CrossRef]
  36. Liu, Y.; Wu, L.; Yue, H. Biparabolic NDVI-Ts Space and Soil Moisture Remote Sensing in an Arid and Semi arid Area. Can. J. Remote Sens. 2015, 41, 159–169. [Google Scholar] [CrossRef]
  37. Pandey, R.; Goswami, S.; Sarup, J.; Matin, S. The thermal–optical trapezoid model-based soil moisture estimation using Landsat-8 data. Model. Earth Syst. Environ. 2020, 7, 1029–1037. [Google Scholar] [CrossRef]
  38. Becaro Crioni, P.L.; Hideo Teramoto, E.; Favoreto da Cunha, C.; Chang, H.K. Evaluation of the OPTRAM Using Sentinel-2 Imagery to Estimate Soil Moisture in Urban Environments. Rev. Bras. Geogr. Física 2025, 18, 605–621. [Google Scholar] [CrossRef]
  39. Singh, A.; Meena, G.K.; Kumar, S.; Gaurav, K. Evaluation of the Penetration Depth of L- and S-Band (NISAR mission) Microwave SAR Signals into Ground. In Proceedings of the 2019 URSI Asia-Pacific Radio Science Conference (AP-RASC), New Delhi, India, 9–15 March 2019; p. 1. [Google Scholar]
  40. Huete, A.R.; Warrick, A.W. Assessment of vegetation and soil water regimes in partial canopies with optical remotely sensed data. Remote Sens. Environ. 1990, 32, 155–167. [Google Scholar] [CrossRef]
  41. Deng, B.; Wahap, H.; Dang, J.; Zhang, Y.; Xuan, J. Coupled analysis of spafio-temporal variability of groundwater depth and soil salinity in Keriya Oasi. Arid. Land Geogr. 2015, 38, 599–607. [Google Scholar] [CrossRef]
  42. Nurmemet, I.; Sagan, V.; Ding, J.-L.; Halik, Ü.; Abliz, A.; Yakup, Z. A WFS-SVM Model for Soil Salinity Mapping in Keriya Oasis, Northwestern China Using Polarimetric Decomposition and Fully PolSAR Data. Remote Sens. 2018, 10, 598. [Google Scholar] [CrossRef]
  43. Wang, Q. The Couping Relationship Between SoilWater Content and the Buried Depth of Ground Water on Yutian Oasis. Master’s Thesis, Xinjinang University, Urumqi, China, 2011. [Google Scholar]
  44. Wang, F.; Yang, S.; Yang, W.; Yang, X.; Jianli, D. Comparison of machine learning algorithms for soil salinity predictions in three dryland oases located in Xinjiang Uyghur Autonomous Region (XJUAR) of China. Eur. J. Remote Sens. 2019, 52, 256–276. [Google Scholar] [CrossRef]
  45. Yan-bing, P.; Dun-peng, L.; Fang-fang, G.; Zhe-feng, H.; Jun-ling, P.; Jian, L.; Yue, Z. Geomorphological features of the Keriya River valley and the early-middle Pleistocene great lake of the Tarim basin. Geol. Bull. China 2008, 27, 814–822. [Google Scholar] [CrossRef]
  46. Ling, H.-B.; Xu, H.-L.; Liu, X.-H.; Zhang, Q.-Q.; Fu, J.-Y.; Bai, Y. Suitable scale of oasis in Keriya River basin, Xinjiang. Adv. Water Sci. 2012, 23, 563–568. [Google Scholar] [CrossRef]
  47. Wang, F.; Ding, J.; Wu, M. Remote sensing monitoring models of soil salinization based on NDVI-SI feature space. Trans. Chin. Soc. Agric. Eng. 2010, 26, 168–173. [Google Scholar] [CrossRef]
  48. Muhetaer, N.; Nurmemet, I.; Abulaiti, A.; Xiao, S.; Zhao, J. A Quantifying Approach to Soil Salinity Based on a Radar Feature Space Model Using ALOS PALSAR-2 Data. Remote Sens. 2022, 14, 363. [Google Scholar] [CrossRef]
  49. Ali, Z.; Barnard, I.; Fox, P.; Duggan, P.; Gray, R.; Allan, P.; Brand, A.; Ste-Mari, R. Description of RADARSAT-2 synthetic aperture radar design. Can. J. Remote Sens. 2014, 30, 246–257. [Google Scholar] [CrossRef]
  50. Baillarin, S.J.; Meygret, A.; Dechoz, C.; Petrucci, B.; Lacherade, S.; Tremas, T.; Isola, C.; Martimort, P.; Spoto, F. Sentinel-2 Level 1 Products and Image Processing Performances. Int. Arch. Photogramm. Remote Sens. Spat. Inf. Sci. 2012, XXXIX-B1, 197–202. [Google Scholar] [CrossRef]
  51. Acar, H.; Ozerdem, M.S.; Acar, E. Soil Moisture Inversion Via Semiempirical and Machine Learning Methods with Full-Polarization Radarsat-2 and Polarimetric Target Decomposition Data: A Comparative Study. IEEE Access 2020, 8, 197896–197907. [Google Scholar] [CrossRef]
  52. Ma, C.; Li, X.; McCabe, M.F. Retrieval of High-Resolution Soil Moisture through Combination of Sentinel-1 and Sentinel-2 Data. Remote Sens. 2020, 12, 2303. [Google Scholar] [CrossRef]
  53. Jong-Sen, L.; Grunes, M.R.; Pottier, E. Quantitative comparison of classification capability: Fully polarimetric versus dual and single-polarization SAR. IEEE Trans. Geosci. Remote Sens. 2001, 39, 2343–2351. [Google Scholar] [CrossRef]
  54. Boerner, W.M.; Mott, H.; Luneburg, E. Polarimetry in remote sensing: Basic and applied concepts. In Proceedings of the IGARSS’97, 1997 IEEE International Geoscience and Remote Sensing Symposium Proceedings, Remote Sensing—A Scientific Vision for Sustainable Development, Singapore, 3–8 August 1997; Volume 1403, pp. 1401–1403. [Google Scholar]
  55. Merzouki, A.; McNairn, H.; Pacheco, A. Mapping Soil Moisture Using RADARSAT-2 Data and Local Autocorrelation Statistics. IEEE J. Sel. Top. Appl. Earth Obs. Remote Sens. 2011, 4, 128–137. [Google Scholar] [CrossRef]
  56. Ulaby, F.T.; Bradley, G.A.; Dobson, M.C. Microwave Backscatter Dependence on Surface Roughness, Soil Moisture, and Soil Texture: Part II-Vegetation-Covered Soil. IEEE Trans. Geosci. Electron. 1979, 17, 33–40. [Google Scholar] [CrossRef]
  57. Holah, N.; Baghdadi, N.; Zribi, M.; Bruand, A.; King, C. Potential of ASAR/ENVISAT for the characterization of soil surface parameters over bare agricultural fields. Remote Sens. Environ. 2005, 96, 78–86. [Google Scholar] [CrossRef]
  58. Junzhan, W.; Yansong, B.; Youjing, Z.; Jianjun, Q.; Weimin, Z. Soil moisture inversion multi-polarization and multi angle ENVISAT ASAR data in surface soils of bare area and wheat-covered area. Trans. Chin. Soc. Agric. Eng. 2010, 26, 205–210. [Google Scholar] [CrossRef]
  59. Jakob, J.v.Z. Application of Cloude’s target decomposition theorem to polarimetric imaging radar data. Proc.SPIE 1993, 1748, 184–191. [Google Scholar] [CrossRef]
  60. Huynen, J.R. Phenomenological Theory of Radar Targets. In Electromagnetic Scattering; Uslenghi, P.L.E., Ed.; Academic Press: Cambridge, MA, USA, 1978. [Google Scholar]
  61. Wentao, A.; Yi, C.; Jian, Y. Three-Component Model-Based Decomposition for Polarimetric SAR Data. IEEE Trans. Geosci. Remote Sens. 2010, 48, 2732–2739. [Google Scholar] [CrossRef]
  62. Krogager, E.; Boerner, W.-M.; Madsen, S. Feature-motivated Sinclair matrix (sphere/diplane/helix) decomposition and its application to target sorting for land feature classification. Proc. SPIE-Int. Soc. Opt. Eng. 1997, 3120, 144–154. [Google Scholar] [CrossRef]
  63. Cloude, S.R.; Pottier, E. A review of target decomposition theorems in radar polarimetry. IEEE Trans. Geosci. Remote Sens. 1996, 34, 498–518. [Google Scholar] [CrossRef]
  64. Yang, J.; Yamaguchi, Y.; Yamada, H.; Sengoku, M.; Lin, S. Stable Decomposition of Mueller Matrix. IEICE Trans. Commun. 1998, E81-B, 1261–1268. [Google Scholar]
  65. Yamaguchi, Y.; Moriyama, T.; Ishido, M.; Yamada, H. Four-component scattering model for polarimetric SAR image decomposition. IEEE Trans. Geosci. Remote Sens. 2005, 43, 1699–1706. [Google Scholar] [CrossRef]
  66. Krogager, E. Aspects of Polarimetric Radar Imaging; Danish Defence Research Establishment: Copenhagen, Denmark, 1993. [Google Scholar]
  67. Xie, Q.; Meng, Q.; Zhang, L.; Wang, C.; Sun, Y.; Sun, Z. A Soil Moisture Retrieval Method Based on Typical Polarization Decomposition Techniques for a Maize Field from Full-Polarization Radarsat-2 Data. Remote Sens. 2017, 9, 168. [Google Scholar] [CrossRef]
  68. Li, Z.; Lindenschmidt, K.-E. Monitoring river ice cover development using the Freeman–Durden decomposition of quad-pol Radarsat-2 images. J. Appl. Remote Sens. 2018, 12, 026014. [Google Scholar] [CrossRef]
  69. Banerjee, B.; Bhattacharya, A.; Buddhiraju, K.M. A Generic Land-Cover Classification Framework for Polarimetric SAR Images Using the Optimum Touzi Decomposition Parameter Subset—An Insight on Mutual Information-Based Feature Selection Techniques. IEEE J. Sel. Top. Appl. Earth Obs. Remote Sens. 2014, 7, 1167–1176. [Google Scholar] [CrossRef]
  70. Muhetaer, N.; Nurmemet, I.; Abulaiti, A.; Xiao, S.; Zhao, J. An Efficient Approach for Inverting the Soil Salinity in Keriya Oasis, Northwestern China, Based on the Optical-Radar Feature-Space Model. Sensors 2022, 22, 7226. [Google Scholar] [CrossRef]
  71. Freeman, A.; Durden, S.L. A three-component scattering model for polarimetric SAR data. IEEE Trans. Geosci. Remote Sens. 1998, 36, 963–973. [Google Scholar] [CrossRef]
  72. Varghese, A.O.; Suryavanshi, A.; Joshi, A.K. Analysis of different polarimetric target decomposition methods in forest density classification using C band SAR data. Int. J. Remote Sens. 2016, 37, 694–709. [Google Scholar] [CrossRef]
  73. Touzi, R. Polarimetric Target Scattering Decomposition: A Review; IEEE: Piscataway, NJ, USA, 2016; pp. 5658–5661. [Google Scholar]
  74. Zhang, L.; Meng, Q.; Zeng, J.; Wei, X.; Shi, H. Evaluation of Gaofen-3 C-Band SAR for Soil Moisture Retrieval Using Different Polarimetric Decomposition Models. IEEE J. Sel. Top. Appl. Earth Obs. Remote Sens. 2021, 14, 5707–5719. [Google Scholar] [CrossRef]
  75. Anconitano, G.; Lavalle, M.; Acuña, M.A.; Pierdicca, N. Sensitivity of Polarimetric SAR Decompositions to Soil Moisture and Vegetation Over Three Agricultural Sites Across a Latitudinal Gradient. IEEE J. Sel. Top. Appl. Earth Obs. Remote Sens. 2024, 17, 3615–3634. [Google Scholar] [CrossRef]
  76. Yang, L.; Feng, X.; Liu, F.; Liu, J.; Sun, X. Potential of soil moisture estimation using C-band polarimetric SAR data in arid regions. Int. J. Remote Sens. 2018, 40, 2138–2150. [Google Scholar] [CrossRef]
  77. Wang, H.; Magagi, R.; Goita, K. Comparison of different polarimetric decompositions for soil moisture retrieval over vegetation covered agricultural area. Remote Sens. Environ. 2017, 199, 120–136. [Google Scholar] [CrossRef]
  78. Huang, X.; Ziniti, B.; Cosh, M.H.; Reba, M.; Wang, J.; Torbick, N. Field-Scale Soil Moisture Retrieval Using PALSAR-2 Polarimetric Decomposition and Machine Learning. Agronomy 2020, 11, 35. [Google Scholar] [CrossRef]
  79. Joseph, A.S.; Paul, W.N.; Nathan, A.K.; Nathan, J.P.; Devin, M.; Cassie, K.; Nathan, F.; Randal, M.L.; Angela, C.D.; Knighton, W.B. Multispectral imaging systems on tethered balloons for optical remote sensing education and research. J. Appl. Remote Sens. 2012, 6, 063613. [Google Scholar] [CrossRef]
  80. Liu, Z.; Zheng, J.; Zhu, Z.; Qu, Y.; Xu, Z. Applicability Research of Parameters in Soil Moisture Inversion. Geogr. Sci. Res. 2022, 11, 395–406. [Google Scholar] [CrossRef]
  81. Ling, C.-X.; Zhang, H.-Q.; Ju, H.-B.; Sun, H. Research on Vegetation Fractional Coverage Estimation of NDVI-Dimidiate Pixel Model based on Worldview-2 Data. In Proceedings of the 2012 International Conference on Earth Science and Remote Sensing (ESRS 2012), Hong Kong, China, 4–5 September 2012; pp. 120–127. [Google Scholar]
  82. Wang, X.; Xie, S.; Du, J. Water index formulation and its effectiveness research on the complicated surface water surroundings. J. Remote Sens. 2018, 22, 360–372. [Google Scholar] [CrossRef]
  83. Wang, L.; Qu, J.J. NMDI: A normalized multi-band drought index for monitoring soil and vegetation moisture with satellite remote sensing. Geophys. Res. Lett. 2007, 34, L20405. [Google Scholar] [CrossRef]
  84. Olsen, J.; Ceccato, P.; Proud, S.; Fensholt, R.; Grippa, M.; Mougin, E.; Ardö, J.; Sandholt, I. Relation between Seasonally Detrended Shortwave Infrared Reflectance Data and Land Surface Moisture in Semi-Arid Sahel. Remote Sens. 2013, 5, 2898–2927. [Google Scholar] [CrossRef]
  85. Patel, N.R.; Anapashsha, R.; Kumar, S.; Saha, S.K.; Dadhwal, V.K. Assessing potential of MODIS derived temperature/vegetation condition index (TVDI) to infer soil moisture status. Int. J. Remote Sens. 2008, 30, 23–39. [Google Scholar] [CrossRef]
  86. Casamitjana, M.; Torres-Madroñero, M.C.; Bernal-Riobo, J.; Varga, D. Soil Moisture Analysis by Means of Multispectral Images According to Land Use and Spatial Resolution on Andosols in the Colombian Andes. Appl. Sci. 2020, 10, 5540. [Google Scholar] [CrossRef]
  87. McFeeters, S.K. The use of the Normalized Difference Water Index (NDWI) in the delineation of open water features. Int. J. Remote Sens. 2007, 17, 1425–1432. [Google Scholar] [CrossRef]
  88. Xu, H. Modification of normalised difference water index (NDWI) to enhance open water features in remotely sensed imagery. Int. J. Remote Sens. 2007, 27, 3025–3033. [Google Scholar] [CrossRef]
  89. Gu, Y.; Hunt, E.; Wardlow, B.; Basara, J.B.; Brown, J.F.; Verdin, J.P. Evaluation of MODIS NDVI and NDWI for vegetation drought monitoring using Oklahoma Mesonet soil moisture data. Geophys. Res. Lett. 2008, 35, L22401. [Google Scholar] [CrossRef]
  90. Yun-Jun, Y.; Qi-Ming, Q.; Shao-Hua, Z.; Wei-Lin, Y. Retrieval of soil moisture based on MODIS shortwave infrared spectral feature. J. Infrared Millim. Waves 2011, 30, 9. [Google Scholar]
  91. Xiao, D.; Shixin, W.; Yi, Z.; Hua, W. Construction and Validation of a New Model for Unified Surface Water Capacity Based on MODIS Data. Geomat. Inf. Sci. Wuhan Univ. 2017, 32, 205–207. [Google Scholar]
  92. Tucker, C.J. Red and photographic infrared linear combinations for monitoring vegetation. Remote Sens. Environ. 1979, 8, 127–150. [Google Scholar] [CrossRef]
  93. Gitelson, A.A.; Kaufman, Y.J.; Merzlyak, M.N. Use of a green channel in remote sensing of global vegetation from EOS-MODIS. Remote Sens. Environ. 1996, 58, 289–298. [Google Scholar] [CrossRef]
  94. Huete, A.R. A soil-adjusted vegetation index (SAVI). Remote Sens. Environ. 1988, 25, 295–309. [Google Scholar] [CrossRef]
  95. Qi, J.; Chehbouni, A.; Huete, A.R.; Kerr, Y.H.; Sorooshian, S. A modified soil adjusted vegetation index. Remote Sens. Environ. 1994, 48, 119–126. [Google Scholar] [CrossRef]
  96. Yin, Q.; Hong, W.; Zhang, F.; Pottier, E. Optimal Combination of Polarimetric Features for Vegetation Classification in PolSAR Image. IEEE J. Sel. Top. Appl. Earth Obs. Remote Sens. 2019, 12, 3919–3931. [Google Scholar] [CrossRef]
  97. Strobl, C.; Boulesteix, A.-L.; Zeileis, A.; Hothorn, T. Bias in random forest variable importance measures: Illustrations, sources and a solution. BMC Bioinform. 2007, 8, 25. [Google Scholar] [CrossRef] [PubMed]
  98. Das, B.; Rathore, P.; Roy, D.; Chakraborty, D.; Jatav, R.S.; Sethi, D.; Kumar, P. Comparison of bagging, boosting and stacking algorithms for surface soil moisture mapping using optical-thermal-microwave remote sensing synergies. Catena 2022, 217, 106485. [Google Scholar] [CrossRef]
  99. Zhang, F.; Zhang, L.-W.; Shi, J.-J.; Huang, J.-F. Soil Moisture Monitoring Based on Land Surface Temperature-Vegetation Index Space Derived from MODIS Data. Pedosphere 2014, 24, 450–460. [Google Scholar] [CrossRef]
  100. Sadeghi, M.; Babaeian, E.; Tuller, M.; Jones, S.B. The optical trapezoid model: A novel approach to remote sensing of soil moisture applied to Sentinel-2 and Landsat-8 observations. Remote Sens. Environ. 2017, 198, 52–68. [Google Scholar] [CrossRef]
  101. Carlson, T.N.; Petropoulos, G.P. A new method for estimating of evapotranspiration and surface soil moisture from optical and thermal infrared measurements: The simplified triangle. Int. J. Remote Sens. 2019, 40, 7716–7729. [Google Scholar] [CrossRef]
  102. Kulkarni, S.C.; Rege, P.P. Pixel level fusion techniques for SAR and optical images: A review. Inf. Fusion 2020, 59, 13–29. [Google Scholar] [CrossRef]
  103. Ayari, E.; Kassouk, Z.; Lili-Chabaane, Z.; Baghdadi, N.; Zribi, M. Investigation of Multi-Frequency SAR Data to Retrieve the Soil Moisture within a Drip Irrigation Context Using Modified Water Cloud Model. Sensors 2022, 22, 580. [Google Scholar] [CrossRef]
  104. Zhang, Q.-L.; Yin, H.; Ji, R.-P.; Wu, J.-W.; Zhang, H.-X. Retrieving on Monthly Soil Moisture in Liaoning Province Based on NDVI-LST Module. Chin. J. Agrometeorol. 2017, 38, 720–728. [Google Scholar] [CrossRef]
  105. Yuan, L.; Li, L.; Zhang, T.; Chen, L.; Zhao, J.; Hu, S.; Cheng, L.; Liu, W. Soil Moisture Estimation for the Chinese Loess Plateau Using MODIS-derived ATI and TVDI. Remote Sens. 2020, 12, 3040. [Google Scholar] [CrossRef]
  106. Guo, B.; Zang, W.; Han, B.; Yang, F.; Luo, W.; He, T.; Fan, Y.; Yang, X.; Chen, S. Dynamic monitoring of desertification in Naiman Banner based on feature space models with typical surface parameters derived from LANDSAT images. Land Degrad. Dev. 2020, 31, 1573–1592. [Google Scholar] [CrossRef]
  107. Guo, X.; Fu, Q.; Hang, Y.; Lu, H.; Gao, F.; Si, J. Spatial Variability of Soil Moisture in Relation to Land Use Types and Topographic Features on Hillslopes in the Black Soil (Mollisols) Area of Northeast China. Sustainability 2020, 12, 3352. [Google Scholar] [CrossRef]
  108. Liu, Y.; Qian, J.; Yue, H. Comparison and evaluation of different dryness indices based on vegetation indices-land surface temperature/albedo feature space. Adv. Space Res. 2021, 68, 2791–2803. [Google Scholar] [CrossRef]
  109. Cheng, L.; Liu, S.; Mo, X.; Hu, S.; Zhou, H.; Xie, C.; Nielsen, S.; Grosen, H.; Bauer-Gottwein, P. Assessing the Potential of 10-m Resolution TVDI Based on Downscaled LST to Monitor Soil Moisture in Tang River Basin, China. Remote Sens. 2023, 15, 744. [Google Scholar] [CrossRef]
  110. Ma, Y.; Liu, H.; Zhao, W.; Guo, L.; Yang, Q.; Li, Y.; Liu, J.; Yetemen, O. Responses of Soil Water Potential and Plant Physiological Status to Pulsed Rainfall Events in Arid Northwestern China: Implications for Disclosing the Water-Use Strategies of Desert Plants. Ecohydrology 2024, e2728. [Google Scholar] [CrossRef]
  111. Yang, T.; Ala, M.; Guan, D.; Wang, A. The Effects of Groundwater Depth on the Soil Evaporation in Horqin Sandy Land, China. Chin. Geogr. Sci. 2021, 31, 727–734. [Google Scholar] [CrossRef]
  112. Zhang, K.-G.; Ba, M.-T.; Meng, H.-L.; Sun, Y.-M. Characteristics Analysis of Land Use Spatial Distribution on Terrain Gradient in Henan Province. DEStech Trans. Comput. Sci. Eng. 2018, 96–102. [Google Scholar] [CrossRef] [PubMed]
  113. Zhuang, J.; Du, C.; Kong, J.; Zhu, Y.; Peng, J. A simplified calculation method for high-steep soil slope stability due to groundwater rise from irrigation. Geocarto Int. 2024, 39, 2408332. [Google Scholar] [CrossRef]
  114. Jiang, H.; Jiang, H.; Ding, J. Effect factors on soil moisture tempo-spatial variability of Yutian Oasis in arid area of China. J. Arid Land Resour. Environ. 2017, 31, 136–142. [Google Scholar] [CrossRef]
  115. Xiao, S.; Nurmemet, I.; Zhao, J. Soil salinity estimation based on machine learning using the GF-3 radar and Landsat-8 data in the Keriya Oasis, Southern Xinjiang, China. Plant Soil 2023, 498, 451–469. [Google Scholar] [CrossRef]
Figure 1. Relationship between soil moisture and the water cycle.
Land 14 00627 g001
Figure 2. Study area—photos of typical and specialized feature types.
Land 14 00627 g002
Figure 3. Satellite images—Radarsat-2 (A) and Sentinel-2 (B).
Land 14 00627 g003
Figure 4. Different polarizations of SAR.
Land 14 00627 g004
Figure 5. Scattering characteristics of SAR signals interacting with different ground targets.
Land 14 00627 g005
Figure 6. Soil moisture retrieval workflow.
Land 14 00627 g006
Figure 7. Results of optimal feature selection.
Land 14 00627 g007
Figure 8. HH-Vanzyl-MSAVI feature space.
Land 14 00627 g008
Figure 9. Two-dimensional-scale scatterplot of HH-Vanzyl-MSAVI feature space.
Land 14 00627 g009
Figure 10. NDVI-Vanzyl-MSAVI feature space.
Land 14 00627 g010
Figure 11. Two-dimensional-scale scatterplot of NDVI-Vanzyl-MSAVI feature space.
Land 14 00627 g011
Figure 12. Different levels of soil moisture in HH-Vanzyl-MSAVI space.
Land 14 00627 g012
Figure 13. Different levels of soil moisture in NDVI-Vanzyl-MSAVI space.
Land 14 00627 g013
Figure 14. Construction of the optical–radar soil moisture estimation index. HH-Vanzyl-MSAVI 3D space (A); NDVI-Vanzyl-MSAVI 3D space (B). L1 and L2 are the distances from any point P to the origin O, respectively.
Land 14 00627 g014
Figure 15. Fitting analysis of ORSMEI to soil moisture samples.
Land 14 00627 g015
Figure 16. Soil moisture retrieval using ORSMEI 1 (A) and ORSMEI 2 (B).
Land 14 00627 g016
Figure 17. (A) Keriya River sources and elevation of Yutian County and (B,C) Sentinel-2 and DEM imagery of the study area, respectively.
Land 14 00627 g017
Table 1. Detailed parameters of Radarsat-2.
ParametersData
Data acquisition data6 May 2022
Radar center frequency5.4 GHz(C-band)
Product typeSLC
Incident angle41.0582–42.4470°
Acquisition typeFine quad polarization
Observation and orbit directionRight and descending
Size of a scene25 km × 25 km (range × azimuth)
Nominal resolution4.73 m × 5.49 m (range × azimuth)
PolarizationsHH, HV, VH, VV
Table 2. Detailed parameters of Sentinel-2.
ParametersData
Data acquisition data11 May 2022
SatelliteSentinel-2A
Product typeLevel-1C
Number of bands13 spectral bands
Resolution10 m, 20 m, 60 m
Swath width290 km
Scene footprintT44SNG, T44SNF
Table 3. Target scattering component obtained from the Radarsat-2 data.
Polarimetric Decomposition MethodsNumber of ComponentsTarget Scattering Component
Sinclair3Sinclair _b, Sinclair _r, Sinclair _g
van Zyl3Vanzyl _b, Vanzyl _r, Vanzyl _g
Pauli3Pauli _b, Pauli _r, Pauli _g
Yang3Yang _b, Yang _r, Yang _g
Yamaguchi4Yamaguchi _b, Yamaguchi _r,
Yamaguchi _hlx, Yamaguchi _g
Huynen3Huynen _r, Huynen _b, Huynen _g
Cloude3Cloude _b, Cloude _r, Cloude _g
Freeman–Durden3Freeman _b, Freeman _r, Freeman _g
Generalized Freeman–Durden3Generalized _b, Generalized _r, Generalized _g
In the table, _b is double-bounce scattering, _r is surface scattering, _g is volume scattering, and _hlx is helix scattering.
Table 4. Selected optical remote sensing indices and formulas.
IndexFormulationRef.
NDWI G r e e n N I R / ( G r e e n + N I R ) [87]
MNDWI G r e e n S W I R 1 / ( G r e e n + S W I R 1 ) [88]
NMDI N I R S W I R 1 S W I R 2 / N I R + ( S W I R 1 S W I R 2 ) [83]
NDMI N I R S W I R 1 / ( N I R + S W I R 1 ) [89]
SIMI ( S W I R 1 + S W I R 2 ) 2   /   2 [90]
SWCI S W I R 1 S W I R 2 / ( S W I R 1 + S W I R 2 ) [91]
NDVI N I R R e d / ( N I R + R e d ) [92]
GNDVI N I R G r e e n / ( N I R + G r e e n ) [93]
SAVI 1 + L × N I R R / ( N I R + R + L ) [94]
MSAVI 2 × N I R + 1 2 × N I R + 1 2 8 × ( N I R R ) / 2 [95]
Table 5. Person’s correlation coefficient between retrieved and measured soil moisture.
Retrieval IndexPointsMeanSDPearson Correlation CoefficientSignificance LevelRMSE
ORSMRI 1Retrieved soil moisture8.797.030.710.0013.0
Measured soil moisture7.325.66
ORSMRI 2Retrieved soil moisture8.677.030.700.0014.43
Measured soil moisture7.325.83
Disclaimer/Publisher’s Note: The statements, opinions and data contained in all publications are solely those of the individual author(s) and contributor(s) and not of MDPI and/or the editor(s). MDPI and/or the editor(s) disclaim responsibility for any injury to people or property resulting from any ideas, methods, instructions or products referred to in the content.

