Abstract
This study examines the effectiveness of torrential erosion control structures (concrete check dams) to mitigate post-fire sediment transport within the Seich Sou Forest in Thessaloniki, Greece. Four years after the fire of 1997, which burned 68% of the forest, check dams were constructed (in 2001) to control erosion and sediment transport in the catchments of Eleonas and Panteleimon. In 2022, our team conducted field surveys, in which the size, effective storage capacity, and siltation of 40 check dams were recorded. The results revealed that the dams stored 14.36% and 18.81% of their total effective capacity in the Eleonas and Panteleimon catchments, respectively, with average annual erosion levels of 0.33 t/ha/year and 0.21 t/ha/year. These low rates of erosion could be attributed to the shallow, rocky soils and rapid post-fire vegetation recovery. However, this study highlights that timely construction of check dams immediately after the fire could have significantly increased their effectiveness. The results showed that if the dams were constructed immediately after the fire, they would retain 6.17 t/ha/year (Eleonas) and 7.08 t/ha/year (Panteleimon), during the first three post-fire years. These values of erosion are in agreement with previously published studies in Mediterranean ecosystems. This study highlighted the importance of the timely construction of post-fire erosion control structures to increase sediment storage and reduce soil transportation.
1. Introduction
The detachment of soil particles owing to the rain drops’ impact and the movement of these particles by the force of water runoff are the two main phases of soil erosion [1,2,3]. Rock weathering and pedogenesis are processes which mitigate soil erosion through soil formation; however, the gradual reduction in protective vegetation in forested areas, influenced by both biotic and abiotic factors, results in higher erosion values [4,5,6]. One of the most devastating phenomena that greatly affects the rate of soil erosion is forest wildfires. Insect infestations, changes in land use, wildfires, excessive tillage, and improper soil utilization techniques are some of the main disturbances that might be linked to enhanced soil erosion [7,8,9,10,11]. Forest wildfires are one of the most damaging of these, having a significant effect on the dynamics of soil erosion [12,13,14]. The forest ecosystems of Mediterranean countries are prone to fires due to the long dry season (May–September) [15]. Soil erosion has a significant negative influence on the ecosystem, increasing the danger of flooding and land instability, degrading soil, and lowering water quality [16]. Furthermore, in reservoirs and natural lakes, it leads to increased sediment generation, transportation, and accumulation [17,18,19].
After a wildfire in a forest ecosystem, measures should be taken immediately to retain the soil due to the increased risk of erosion, mitigating the rain drops’ force on the newly exposed soil. The lack of appropriate flood and sediment control measures in torrents and catchments could lead to devasting catastrophes (floods, landslides, damage on infrastructure) in cities and settlements [20,21] and smaller communities and potential lake/reservoir sedimentation. These measures involve afforestation, and reforestation works in the most extended region of the watershed, bioengineering and technical stabilization works—on areas of sediment generation—and torrential erosion control structures in the hydrographic network. The main hydraulic structures that have been constructed aiming to flood and sediment control are low dams or torrent check dams [22,23]. They are classified as sediment storage dams and dams for debris flow [24,25], and as a series of check dams that aim to achieve the compensation gradient to improve the longitudinal profile, to decrease stream slope and water velocity and to stabilize the streambed and areas of potential ground subsidence [26,27,28,29]. Check dams are generally small in scale and rarely exceed 15 m in height [30,31]. The technique of source sediment area control by check dams has found wide application throughout the Alps [32], Japan and elsewhere [27,33]. The materials that are used for the construction of the dams may vary according to the type of the dam and the main purposes of the constructed structures [34]. The majority of check dams constructed for torrent control are gravity dams [35,36]. These dams are currently constructed mainly out of concrete. In gravity dams, the gravity and the base width are the prevailing variables which must be large enough to withstand the overturning and sliding tendencies [37].
Reforestation and check dam building in first- and second-order streams are two commonly used watershed management techniques in Mediterranean watersheds. These methods intend to improve landscape stability and reduce soil erosion [38,39,40,41]. Gravity check dams are a crucial management tool in these types of ecosystems because of their proven ability to reduce erosion and floods [33,42,43]. In order to lower water velocity and the erosive power of flowing water, check dams are essential [44,45,46,47]. By enabling sediment deposition upstream of the dams, they further assist in stabilizing the riverbed, preventing landslides and bank erosion [44,48,49,50].
After the devastating fire which took place on 6 July 1997, in the suburban forest (Seich Sou) of Thessaloniki, Greece, approximately 68% of the forest vegetation was burned, resulting in an immediate risk of extreme erosion and flooding phenomena that would affect the city’s urban complex. For this reason, the responsible services proceeded to construct erosion control works within the streambeds of the watersheds that drain the Seich Sou Forest. This effort was of major importance in watersheds where the lowland part of the stream passes through settlements and the transport of sediments and debris could threaten property, infrastructure, and even human lives. Based on the Special Definitive Study of Flood Protection Works in the Suburban Forest, check dams were constructed gradually and not immediately after the fire. Most of the concrete check dams were constructed in 2001, 4 years after the fire. In this work, a detailed recording of the constructed check dams, and measurement of the sediments retained the 21 years after the fire were carried out. There has been no other forest fire in the study area since 1997. The aim of this study was to evaluate the effectiveness of the dams in retaining sediments after a fire and to assess the effect of the time of their construction. Further, the hypothesis “What would it be the effectiveness of check dams if they would construct immediately after the fire?” was tested. The novel aspect of this study was the extensive recording of all check dams and the volume of the retained sediments, while the fact that most dams were not totally filled allowed us to calculate in detail the soil erosion rates.
2. Materials and Methods
2.1. Study Area—Seich Sou Forest
The study area involves two small catchments: the “Eleonas” and “Panteleimon” catchments (Thessaloniki, Seich Sou Forest). The topographical relief (Table 1) is relatively intense (mainly characterized by hills and semi-mountainous), marked by a continuous alternation of peaks, descending ridgelines, and small valleys traversed by streams which flow toward the city (Figure 1). The forest is artificial and is the result of efforts spanning more than 60 years. The first reforestation attempt was made in 1929 by students of the Forestry School of Aristotle University of Thessaloniki and was repeated in 1931. One of the main purposes of establishing the forest was to mitigate flooding and erosion phenomena that caused damage to the city of Thessaloniki.

Table 1.
Morphometric and hydrographic characteristics of the Eleonas and Panteleimon catchments.
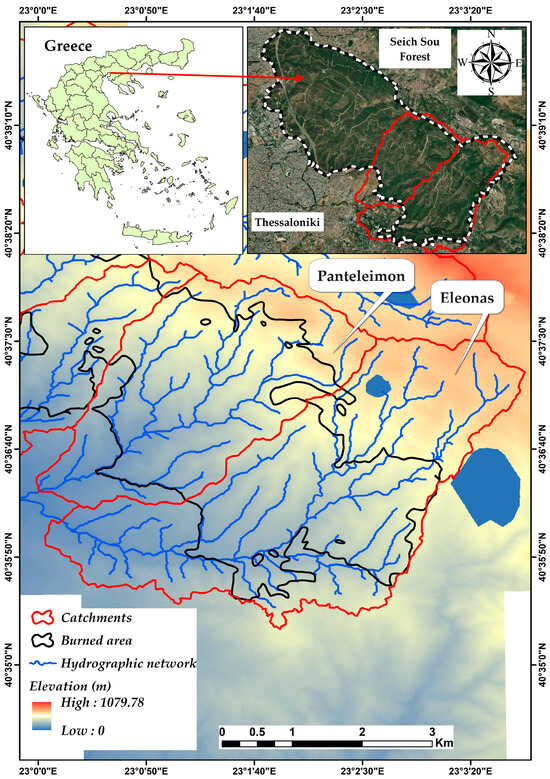
Figure 1.
Study area. Panteleimon and Eleonas catchments. The filled-line area denotes the burned area of the 1997 wildfire.
The most common rock formation in the studied catchments is gneiss, which is distinguished by its considerable thickness and limited permeability [51]. Based on both fieldwork and laboratory tests, the Forest Research Institute of Thessaloniki [52] carried out an extensive investigation into the soil characteristics of Seich Sou (May 2001). In general, the region’s soils are shallow, mostly sandy loam (SL), moderate mechanical composition, and have a typical horizon distribution of A (B) C. The B horizon is frequently nonexistent and leads straight to the deep C horizon, whereas the A horizon hardly rises over 3 cm. The soil pH ranges from 6.66 to 7.35, with a depth of 0–30 cm. The area has a typical Mediterranean climate, with hot, dry summers and moderate winters, based on the meteorological data that are currently available. With the highest quantities falling in winter (December) and an additional peak in spring (May), the average yearly rainfall is 437.4 mm. The average yearly temperature is 16.5 °C, with a low of 13.2 °C and a maximum of 19.6 °C.
The three-day wildfire in 1997 destroyed 1664 hectares of the suburban forest’s total area of 3018.84 hectares. The fire severity was very high, burning all the vegetation, while the causes of the fire remained unclear. Prior to the fire, a Pinus brutia Ten. forest covered most of the region. Today, the same region is primarily covered by regenerating Pinus brutia, though with younger trees.
2.2. Check Dams’ Field Recording and Dimensioning
Before visiting the check dam sites, information sources were gathered related to their locations within the study area. Their identification was conducted using Google satellite imagery in combination with the Special Definitive Study of Flood Protection Works in the Suburban Forest [52]. Additionally, a field survey of the streambed was carried out to locate dams that were not clearly visible in the satellite images, either due to vegetation growth from natural regeneration or shadowing effects.
After identifying a significant number of dams (40 check dams) using satellite imagery and existing maps from the Special Definitive Study of Flood Protection Works in the Suburban Forest, site visits to each check dam were conducted. During these visits (Figure 2), we recorded their visible dimensions and documented their location coordinates in a specialized data sheet (Figure S1, Supplementary Materials).
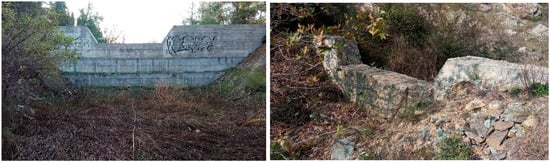
Figure 2.
Typical cement check dams with trapezoidal spillway in the study area. The view is from the upstream of the dams showing the low volume of retained sediments.
A total of 19 check dams were constructed in the Eleonas watershed, where a detailed survey and measurement of their dimensions were conducted. The documentation includes only the visible, above-ground portion of each dam. A total of 21 dams were constructed in the Panteleimon watershed, all of which were visited and documented during our fieldwork. The check dams were constructed in 2001, almost 4 years after the fire. The dimensions of the check dams, as recorded during our site visits, are presented in Table 2 and Table 3, and their exact locations are visible in Figure 3.
Table 2.
Check dam main dimensions of Eleonas catchment.
Table 3.
Check dam main dimensions of Panteleimon catchment.
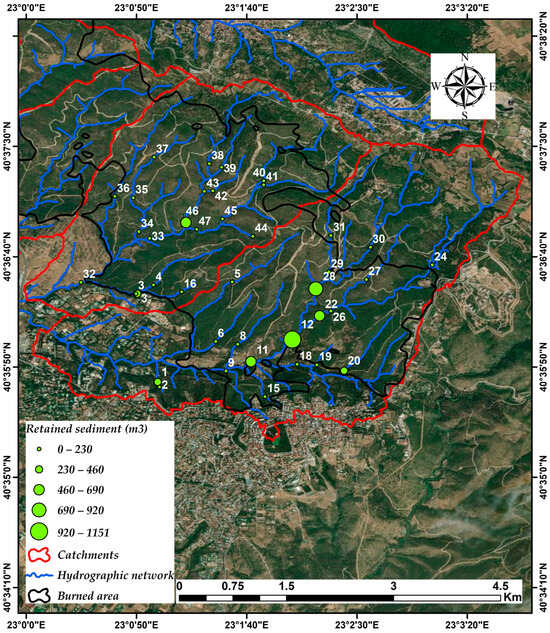
Figure 3.
The location of the constructed check dams (green circles) in the Eleonas and Panteleimon catchments. The black polygon denotes the burned area of the 1997 wildfire.
2.3. Estimation of Check Dams’ Effective Capacity and Total Retained Sediments
During the field surveys (the year 2022) to the dam locations, we obtained information on the natural slope of the terrain, and we recorded the sediment deposition height accumulated upstream of each check dam to assess their effectiveness and evaluate the extent of erosion occurring within the catchments. Since we determined the degree of sedimentation (i.e., the deposition height upstream of each dam) as well as the distance (L’) at which the natural ground slope reaches 0% at the crest elevation, we also calculated the sediment storage area that has formed to date (Figure 4).
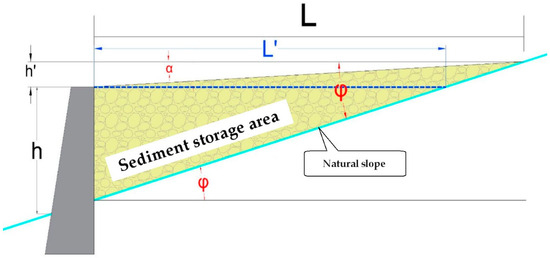
Figure 4.
Side cross section of the check dam for the calculation of the effective capacity.
The storage area or effective capacity is defined as the area of land/space where water and sediment are stored upstream of the check dam. The effective capacity of the check dam is determined using various stereometric methods depending on its topography and the expected compensation slope. The calculation of the flood basin volume (V, m3) for each check dam was performed using the Kotoulas method [53].
where (h) represents the dam height (m), and (tanφ) and (tanα) correspond to the natural slope of the streambed and the slope of the deposited material, respectively. (L) denotes the length of sediment deposition at the crest elevation (m), while (p) and (p1) indicate the gradient of the left and right slopes (m/m), respectively. Additionally, (m1) represents the width of the streambed (m). Figure 4 illustrates the key parameters of Kotoulas’ Equation (2). In the equation above, dam height (h) was used to calculate the effective capacity of each check dam, while the accumulated sediment’s height upstream of the dam was used to determine the current amount of deposition.
2.4. Sediment Sample Collection and Bulk Density Calculation
From each check dam, two sediment samples were collected at random locations within the sediment deposits accumulated upstream the dam. The choice of two samples per dam was made because of the huge field difficulties that we faced during the field work. Twenty-four years after the dams’ construction, most dams are not even accessible due to the dense forest vegetation. There are no paths, roads or anything to show the location of the dams. We made a significant effort to find the dams and measure their dimensions. The retained sediments were fully covered with dense vegetation, and we were forced to cut some plants with a chainsaw to have access to the sediment. Also, the total number of dams is 40 and the total number of soil samples was 80, a number which is adequate to calculate the bulk density. Sampling was conducted by excavating a hole with a diameter of 10 cm and a depth of 15 cm. The excavated material from each hole was carefully placed into plastic bags for transportation to the laboratory, where dry weight measurements were subsequently performed. After the sample was collected, a plastic bag was placed into the opening and filled with water. The volume of water required to fill the hole was measured using a volumetric tube to determine the precise volume of the excavated space. The dry bulk density of the sediments was computed using the dry weight of the sediment sample and the measured volume of the hole. The procedure above was conducted to convert the volume (m3) of the retained sediments to dry weight (tons). Knowing the exact catchment area of each check dam, the weight of the retained sediments and the years between dam construction and field survey (21 years), the total and mean annual erosion was calculated (t/ha/year). Based on this experimental procedure, it was estimated that the average dry bulk density of the retained sediment was 1.72 g/cm3.
3. Results
3.1. Effective Capacity of Check Dams
The results presented in Table 4 show the total volume of sediment that the constructed dams in the two basins can retain once they have fully performed their function and become completely filled. The distance (L) in Table 4 refers to the measured distance between the dam crest and the upstream ground surface at the point where the compensation slope ended, between the dam crest and the sediment reaches (Supplementary Figure S1). Regarding the Eleonas catchment, it is concluded that the constructed and recorded check dams have the capacity to retain a total of 11,226.9 m3 of sediment. Regarding the dams within the Panteleimon catchment, they have the capacity to retain a total of 8738.32 m3 of sediment. Here, it must be highlighted that the total retained sediments did not take into account the portion of the suspended sediments that pass through the check dams. It is considered that this portion is very low in comparison with the total amount of soil losses.
Table 4.
Check dams’ effective capacity for Eleonas and Panteleimon catchments.
3.2. Total Volume of Sediment Retained Behind Each Check Dam Until 2022
By assessing the accumulated sediment’s height, we estimated the volume of transported soil materials retained behind the dams within the two studied catchments. Some dams have nearly reached their full retention capacity, with significant sediment deposition, while others exhibit little to no sediment accumulation. The calculation method applied is the same as that used for determining the total effective capacity of each dam. However, instead of using the dam’s above-ground height, we utilized the height of the sediment accumulation achieved in 2022, the year of the field surveys. In Table 5, the volume of retained sediments, the height of sediments for each dam, and the percent of dam siltation are presented.
Table 5.
Total sediments retained by the check dams in the Eleonas and Panteleimon catchments.
4. Discussion
4.1. Check Dam Effectiveness to Retain Sediment Transport
Table 5 revealed that most check dams are not silted, and the retained volume of sediments is generally low. In the Eleonas catchment, only 14.36% of the total effective capacity is filled with sediments, while in the Panteleimon catchment, the retained volume is 18.81%, a little higher than that of the Eleonas catchment. By converting the total volume of sediment retained by the dams into an annual erosion rate, it is possible to assess soil loss during the past decades following the 1997 wildfire. This estimation allows for comparisons with previous studies conducted in the area, as well as with similar research across the Mediterranean region. Dividing the total retained sediment by the catchment area and the years of the check dams’ operation (21 years), the mean annual erosion rate for the Eleonas catchment was 0.33 t/ha/year, while for Panteleimon catchment was 0.21 t/ha/year. These values of annual erosion are quite low, but they are in agreement with previously published studies in the area [6,7,54,55] and in the Mediterranean region. However, it is important to note that the low erosion values are a characteristic of certain Mediterranean areas, with soils typically being shallow, rocky, and already degraded [10,56,57]. The mean annual erosion rate in the study area could be considered relatively low compared to the broader range of soil erosion rates observed across Europe (0.1–19.8 t/ha/year) [11,58,59,60]. Furthermore, this rate remains low even when evaluated against the widely accepted range of soil formation rates in Europe, which varies between 0.3 and 1.4 t/ha/year [58,61,62]. The low mean annual erosion rates in the study area could be explained by the stony and very thin soil depth, the fast post-fire forest regeneration, the low burned area of the Eleonas catchment and the late construction of dams (discussed below). It is worth noting that in certain Mediterranean regions, where soils are typically shallow, rocky, and already degraded, low erosion rates are commonly observed [10,56,57].
As is evident in Table 4, the total effective capacity of the check dams in both catchments was 11,226.9 m3 (Eleonas) and 8738.32 m3 (Panteleimon). Converting the total effective capacity of the check dams (m3) to erosion rates (t/ha/year) for each catchment provided the mean annual erosion value, which the constructed check dams could retain. For the Eleonas catchment, the maximum annual erosion retention was 0.87 t/ha/year, and for the Panteleimon catchment, it was 1.01 t/ha/year. These values are far higher than the reported annual erosion rates in the study area [7]. This means that proper construction of the check dams could be extremely efficient in controlling the erosion processes.
4.2. The Significance of Timely Construction of Check Dams
It should be highlighted (as stated earlier in the text) that the check dams were constructed in 2001, four years after the devastating wildfire in July of 1997. This means that a significant amount of sediment was discharged out of the catchments before the construction of the dams. In the previous paragraph, it was revealed that check dams could effectively control the low erosion rates that existed four years after the fire and during the last 21 years. These findings raise an important question: Would these dams have been effective in retaining sediment transportation if they had been constructed immediately after the wildfire? To answer that question, the total effective capacity of the check dams was divided by three, which are the post-fire years, which have widely been accepted as the years with the most significant erosion rates [63,64,65,66]. Concerning the first three post-fire years, the maximum annual retain capacity of the check dams in the Eleonas catchment was 6.17 t/ha/year, while in the Panteleimon catchment, it was 7.08. Considering that the post-fire erosion rates in the Mediterranean region are often relatively low, ranging from 0.016 to 13.1 t/ha/year [56,67], it can be concluded that the dams could efficiently control the post-fire erosion rates for the first three years if they had been constructed immediately after the wildfire. This conclusion is further supported by a recent study of annual post-fire erosion rates conducted very close to the study area. In July 2021, there was a new forest fire in the same forest, although not in the studied catchments but in adjacent catchments. These catchments are a few hundred meters away. Immediately after the fire, our team installed erosion plots and a meteorological station to measure the erosion process [7]. The exact values of post-fire erosion for the study area are known, and these values would be retained by the check dams if they had been constructed after the fire of 1997. The erosion rate of the first post-fire year was 7.76 t/ha/year and that of the second post-fire year was 3.39 t/ha/year [7]. These values of annual post-fire erosion are within the calculated maximum retain capacity of the check dams constructed in the study catchments. Consequently, the timely (immediately after the fire) and proper construction of check dams can efficiently control the significantly increased post-fire erosion rates.
Variations in soil type, relief, and climate must be carefully taken into account in order to generalize our results to other Mediterranean places that are susceptible to fire. Our work provides significant information as regards post-fire erosion control, but because of variations in soil depth, slope, and distribution of rainfall, its generalization to other areas (for example, Catalonia or California) is uncertain [56,66]. A comparison with studies from other similar regions could help identify the potential differences. For instance, California receives heavy, short-duration rainfalls, which may contribute to altered erosion dynamics compared to locations with more distributed precipitation [68,69]. Additionally, differences in soil texture and depth affect how well check dams work since coarser or deeper soils may change their ability to retain sediment [39,70]. Steeper slopes and different hydrological responses in Catalonia may affect the comparison of our results to evaluate check dam dimensioning [71,72,73]. In the future, more field-based studies are needed in order to make post-fire erosion control measures more effective and offer a higher control of soil loss in various Mediterranean ecosystems.
Based on the results and discussion, some policy recommendations could be proposed: (1) establishment of immediate response protocols which ensure the design and construction of check dams within the first post-fire years; (2) proposal of specific plan for the best placement of check dams in high erosion areas; (3) establishment of a check dam maintenance program and potential sediment removal; (4) organization of collaboration among local stakeholders, academic institutions, forest services and local communities.
5. Conclusions
The results of this study demonstrate how well check dams work to reduce erosion and regulate sediment transportation in the study area. The observed sediment retention rates showed that these structures were essential for controlling the erosion process and limiting soil loss. Efficiently constructed erosion control structures may successfully reduce even greater sediment loads, as seen by the check dams’ estimated maximum retention capacity, which exceeded the annual erosion rates recorded.
One of the major findings of this research was the timing of the construction of the check dams. The construction of the check dams was delayed for four years following the wildfire, which may have caused a significant loss of sediments. If the structures had been built immediately following the fire, they would have been able to retain much larger sediments during the first three years following the fire, when erosion rates are higher.
Finally, this study emphasizes the need for developing erosion prevention plans for wildfire-affected Mediterranean ecosystems. The findings indicate that although check dams are very effective in stabilizing disturbed fire ecosystems, their optimum benefit can only be achieved if these are constructed on time and effectively. In an attempt to reduce soil loss and landscape resilience, future research needs to focus on the timely installation of post-wildfire erosion control structures.
Supplementary Materials
The following supporting information can be downloaded at: https://www.mdpi.com/article/10.3390/land14030629/s1, Figure S1. Check dam recording form.
Author Contributions
Conceptualization, A.T. and M.S.; methodology, A.T., M.S. and A.K.; software, A.T.; validation, A.T. and A.K.; formal analysis, A.T. and A.K.; investigation, A.T. and A.K.; resources, A.T. and M.S.; data curation, A.T. and A.K.; writing—original draft preparation, A.T. and A.K.; writing—review and editing, A.T., A.K. and M.S.; visualization, A.T. and A.K.; supervision, M.S. All authors have read and agreed to the published version of the manuscript.
Funding
This research received no external funding.
Data Availability Statement
The data that support the findings of this study are available from the corresponding author upon reasonable request.
Conflicts of Interest
The authors declare no conflicts of interest.
References
- Benavidez, R.; Jackson, B.; Maxwell, D.; Norton, K. A Review of the (Revised) Universal Soil Loss Equation ((R)USLE): With a View to Increasing Its Global Applicability and Improving Soil Loss Estimates. Hydrol. Earth Syst. Sci. 2018, 22, 6059–6086. [Google Scholar] [CrossRef]
- Morgan, R.P.C. Soil Erosion and Conservation, 2nd ed.; Wiley: Harlow, UK; New York, NY, USA, 1995. [Google Scholar]
- Foster, G.R. Modeling the Erosion Process. In Hydrologic Modeling of Small Watersheds; American Society of Agricultural Engineers: St. Joseph, MI, USA, 1982; pp. 297–380. [Google Scholar]
- Boix-Fayos, C.; de Vente, J.; Martínez-Mena, M.; Barberá, G.G.; Castillo, V. The Impact of Land Use Change and Check-Dams on Catchment Sediment Yield. Hydrol. Process 2008, 22, 4922–4935. [Google Scholar] [CrossRef]
- Kondolf, G.M.; Piégay, H.; Landon, N. Channel Response to Increased and Decreased Bedload Supply from Land Use Change: Contrasts between Two Catchments. Geomorphology 2002, 45, 35–51. [Google Scholar] [CrossRef]
- Kastridis, A.; Margiorou, S.; Sapountzis, M. Check-Dams and Silt Fences: Cost-Effective Methods to Monitor Soil Erosion under Various Disturbances in Forest Ecosystems. Land 2022, 11, 2129. [Google Scholar] [CrossRef]
- Kastridis, A.; Margiorou, S.; Sapountzis, M. Post-Fire Soil Erosion: Two Years of Monitoring—First Time Detected Implications between Extremely Intense Consecutive Rainfall Events and Erosion Rates. Catena 2024, 243, 108194. [Google Scholar] [CrossRef]
- Borrelli, P.; Robinson, D.A.; Fleischer, L.R.; Lugato, E.; Ballabio, C.; Alewell, C.; Meusburger, K.; Modugno, S.; Schütt, B.; Ferro, V.; et al. An Assessment of the Global Impact of 21st Century Land Use Change on Soil Erosion. Nat. Commun. 2017, 8, 2013. [Google Scholar] [CrossRef]
- Panagos, P.; Borrelli, P.; Poesen, J. Soil Loss Due to Crop Harvesting in the European Union: A First Estimation of an Underrated Geomorphic Process. Sci. Total Environ. 2019, 664, 487–498. [Google Scholar] [CrossRef]
- Shakesby, R.A.; Bento, C.P.M.; Ferreira, C.S.S.; Ferreira, A.J.D.; Stoof, C.R.; Urbanek, E.; Walsh, R.P.D. Impacts of Prescribed Fire on Soil Loss and Soil Quality: An Assessment Based on an Experimentally-Burned Catchment in Central Portugal. Catena 2015, 128, 278–293. [Google Scholar] [CrossRef]
- Ferreira, C.S.S.; Seifollahi-Aghmiuni, S.; Destouni, G.; Ghajarnia, N.; Kalantari, Z. Soil Degradation in the European Mediterranean Region: Processes, Status and Consequences. Sci. Total Environ. 2022, 805, 150106. [Google Scholar] [CrossRef]
- Moazeni, S.; Cerdà, A. The Impacts of Forest Fires on Watershed Hydrological Response. A Review. Trees For. People 2024, 18, 100707. [Google Scholar] [CrossRef]
- García-Redondo, C.; Díaz-Raviña, M.; Regos, A. Long-Term Cumulative Effects of Wildfires on Soil-Vegetation Dynamics in the “Baixa Limia–Serra Do Xurés” Natural Park. Span. J. Soil. Sci. 2024, 14, 13103. [Google Scholar] [CrossRef]
- Agbeshie, A.A.; Abugre, S.; Atta-Darkwa, T.; Awuah, R. A Review of the Effects of Forest Fire on Soil Properties. J. Res. 2022, 33, 1419–1441. [Google Scholar] [CrossRef]
- Stathi, E.; Kastridis, A.; Myronidis, D. Analysis of Hydrometeorological Characteristics and Water Demand in Semi-Arid Mediterranean Catchments under Water Deficit Conditions. Climate 2023, 11, 137. [Google Scholar] [CrossRef]
- Depountis, N.; Michalopoulou, M.; Kavoura, K.; Nikolakopoulos, K.; Sabatakakis, N. Estimating Soil Erosion Rate Changes in Areas Affected by Wildfires. ISPRS Int. J. Geoinf. 2020, 9, 562. [Google Scholar] [CrossRef]
- Kalinderis, I.A.; Sapountzis, M.; Stathis, D.; Tziaftani, F.; Kourakli, P.; Stefanidis, P. The Risk of Sedimentation of Artificial Lakes, Following the Soil Loss and Degradation Process in the Wider Drainage Basin. Artificial Lake of Smokovo case study (Central Greece). In Proceedings of the International Conference “Land Conservation”-LANDCON 0905, Tara Mountain, Serbia, 26–30 May 2009; Faculty of Forestry: Belgrade, Serbia, 2009; Volume 41, pp. 129–140. [Google Scholar]
- Iradukunda, P.; Bwambale, E. Reservoir Sedimentation and Its Effect on Storage Capacity—A Case Study of Murera Reservoir, Kenya. Cogent Eng. 2021, 8, 1917329. [Google Scholar] [CrossRef]
- Kastridis, A.; Stathis, D. The Effect of Small Earth Dams and Reservoirs on Water Management in North Greece (Kerkini Municipality). Silva Balc. 2015, 16, 71–84. [Google Scholar]
- Kastridis, A.; Stathis, D. Evaluation of Hydrological and Hydraulic Models Applied in Typical Mediterranean Ungauged Watersheds Using Post-Flash-Flood Measurements. Hydrology 2020, 7, 12. [Google Scholar] [CrossRef]
- Segura-Beltrán, F.; Sanchis-Ibor, C.; Morales-Hernández, M.; González-Sanchis, M.; Bussi, G.; Ortiz, E. Using Post-Flood Surveys and Geomorphologic Mapping to Evaluate Hydrological and Hydraulic Models: The Flash Flood of the Girona River (Spain) in 2007. J. Hydrol. 2016, 541, 310–329. [Google Scholar] [CrossRef]
- Jaeggi, M.N.R.; Pellandini, S. Torrent Check Dams as a Control Measure for Debris Flows. In Recent Developments on Debris Flows; Armanini, A., Michiue, M., Eds.; Springer: Berlin/Heidelberg, Germany, 1997; pp. 186–207. ISBN 978-3-540-49729-5. [Google Scholar]
- López Cadenas de Llano, F.; Nations, F. ; A.O. of the U. Torrent Control and Streambed Stabilization; FAO Land and Water Development Series, No. 9; Food and Agriculture Organization of the United Nations: Rome, Italy, 1993; ISBN 9251024243. [Google Scholar]
- Remaitre, A.; van Asch, T.W.J.; Malet, J.-P.; Maquaire, O. Influence of Check Dams on Debris-Flow Run-out Intensity. Nat. Hazards Earth Syst. Sci. 2008, 8, 1403–1416. [Google Scholar] [CrossRef]
- Mizuyama, T. Sediment Hazards and SABO Works in Japan. Int. J. Eros. Control Eng. 2008, 1, 1–4. [Google Scholar] [CrossRef]
- Frankl, A.; Nyssen, J.; Vanmaercke, M.; Poesen, J. Gully Prevention and Control: Techniques, Failures and Effectiveness. Earth Surf. Process Landf. 2021, 46, 220–238. [Google Scholar] [CrossRef]
- Eisbacher, G.H. Slope Stability and Land Use in Mountain Valleys(of Canada). Geosci. Can. 1982, 9, 14–27. [Google Scholar]
- Porto, P.; Gessler, J. Ultimate Bed Slope in Calabrian Streams Upstream of Check Dams: Field Study. J. Hydraul. Eng. 1999, 125, 1231–1242. [Google Scholar] [CrossRef]
- Conesa-García, C.; López-Bermúdez, F.; García-Lorenzo, R. Bed Stability Variations after Check Dam Construction in Torrential Channels (South-East Spain). Earth Surf. Process Landf. 2007, 32, 2165–2184. [Google Scholar] [CrossRef]
- VanDine, D.F. Debris Flow Control Structures for Forest Engineering; Working Paper No. 22/1996; British Columbia Ministry of Forests: Victoria, BC, Canada, 1996. Available online: https://www.osti.gov/etdeweb/biblio/371009 (accessed on 15 February 2025).
- Shrestha, A.B.; Ezee, G.C.; Adhikary, R.P.; Rai, S.K. Resource Manual on Flash Flood Risk Management. Module 3: Structural Measures; International Centre for Integrated Mountain Development (ICIMOD): Kathmandu, Nepal, 2012. [Google Scholar]
- Marchi, L.; Comiti, F.; Crema, S.; Cavalli, M. Channel Control Works and Sediment Connectivity in the European Alps. Sci. Total Environ. 2019, 668, 389–399. [Google Scholar] [CrossRef] [PubMed]
- Abbasi, N.A.; Xu, X.; Lucas-Borja, M.E.; Dang, W.; Liu, B. The Use of Check Dams in Watershed Management Projects: Examples from around the World. Sci. Total Environ. 2019, 676, 683–691. [Google Scholar] [CrossRef]
- Aristeidis, K.; Vasiliki, K. Evaluation of the Post-Fire Erosion and Flood Control Works in the Area of Cassandra (Chalkidiki, North Greece). J. Res. 2015, 26, 209–217. [Google Scholar] [CrossRef]
- Cucchiaro, S.; Cazorzi, F.; Marchi, L.; Crema, S.; Beinat, A.; Cavalli, M. Multi-Temporal Analysis of the Role of Check Dams in a Debris-Flow Channel: Linking Structural and Functional Connectivity. Geomorphology 2019, 345, 106844. [Google Scholar] [CrossRef]
- Piton, G.; Recking, A. Effects of Check Dams on Bed-Load Transport and Steep-Slope Stream Morphodynamics. Geomorphology 2017, 291, 94–105. [Google Scholar] [CrossRef]
- Beşer, M.R. A Study on the Reliability-Based Safety Analysis of Concrete Gravity Dams. Master’s Thesis, Middle East Technical University, Ankara, Turkey, 2005. [Google Scholar]
- Zema, D.A.; Bombino, G.; Denisi, P.; Lucas-Borja, M.E.; Zimbone, S.M. Evaluating the Effects of Check Dams on Channel Geometry, Bed Sediment Size and Riparian Vegetation in Mediterranean Mountain Torrents. Sci. Total Environ. 2018, 642, 327–340. [Google Scholar] [CrossRef]
- Castillo, V.M.; Mosch, W.M.; García, C.C.; Barberá, G.G.; Cano, J.A.N.; López-Bermúdez, F. Effectiveness and Geomorphological Impacts of Check Dams for Soil Erosion Control in a Semiarid Mediterranean Catchment: El Cárcavo (Murcia, Spain). Catena 2007, 70, 416–427. [Google Scholar] [CrossRef]
- Zema, D.A.; Carrà, B.G.; Lucas-Borja, M.E.; Filianoti, P.G.F.; Pérez-Cutillas, P.; Conesa-García, C. Modelling Water Flow and Soil Erosion in Mediterranean Headwaters (with or without Check Dams) under Land-Use and Climate Change Scenarios Using SWAT. Water 2022, 14, 2338. [Google Scholar] [CrossRef]
- Dalaris, M.; Psilovikos, A.; Sapountzis, M.; Mourtzis, P.; Mourtzios, P. Water Erosion Assessment in Skiathos Island Using the Gavrilovic Method. Fresenius Environ. Bull. 2013, 22, 2943–2952. [Google Scholar]
- Sun, P.; Wu, Y. Dynamic Modeling Framework of Sediment Trapped by Check-Dam Networks: A Case Study of a Typical Watershed on the Chinese Loess Plateau. Engineering 2022, 27, 209–221. [Google Scholar] [CrossRef]
- Hassanli, A.M.; Nameghi, A.E.; Beecham, S. Evaluation of the Effect of Porous Check Dam Location on Fine Sediment Retention (a Case Study). Environ. Monit. Assess. 2009, 152, 319–326. [Google Scholar] [CrossRef]
- Díaz, V.; Mongil, J.; Navarro, J. Topographical Surveying for Improved Assessment of Sediment Retention in Check Dams Applied to a Mediterranean Badlands Restoration Site (Central Spain). J. Soils Sediments 2014, 14, 2045–2056. [Google Scholar] [CrossRef]
- Kang, J.H.; Kazama, S. Development and Application of Hydrological and Geomorphic Diversity Measures for Mountain Streams with Check and Slit-Check Dams. J. Hydro-Environ. Res. 2014, 8, 32–42. [Google Scholar] [CrossRef]
- Bombino, G.; Gurnell, A.M.; Tamburino, V.; Zema, D.A.; Zimbone, S.M. Sediment Size Variation in Torrents with Check Dams: Effects on Riparian Vegetation. Ecol. Eng. 2008, 32, 166–177. [Google Scholar] [CrossRef]
- Ayele, G.K.; Gessess, A.A.; Addisie, M.B.; Tilahun, S.A.; Tebebu, T.Y.; Tenessa, D.B.; Langendoen, E.J.; Nicholson, C.F.; Steenhuis, T.S. A Biophysical and Economic Assessment of a Community-Based Rehabilitated Gully in the Ethiopian Highlands. Land Degrad. Dev. 2016, 27, 270–280. [Google Scholar] [CrossRef]
- Lucas-Borja, M.E.; Zema, D.A.; Hinojosa Guzman, M.D.; Yang, Y.; Hernández, A.C.; Xiangzhou, X.; Carrà, B.G.; Nichols, M.; Cerdá, A. Exploring the Influence of Vegetation Cover, Sediment Storage Capacity and Channel Dimensions on Stone Check Dam Conditions and Effectiveness in a Large Regulated River in México. Ecol. Eng. 2018, 122, 39–47. [Google Scholar] [CrossRef]
- Wei, Y.; He, Z.; Li, Y.; Jiao, J.; Zhao, G.; Mu, X. Sediment Yield Deduction from Check–Dams Deposition in the Weathered Sandstone Watershed on the North Loess Plateau, China. Land Degrad. Dev. 2017, 28, 217–231. [Google Scholar] [CrossRef]
- Zeng, Q.L.; Yue, Z.Q.; Yang, Z.F.; Zhang, X.J. A Case Study of Long-Term Field Performance of Check-Dams in Mitigation of Soil Erosion in Jiangjia Stream, China. Environ. Geol. 2009, 58, 897–911. [Google Scholar] [CrossRef]
- Institute of Geology and Mineral Exploitation (IGME). Engineering Geological Map of Greece, Scale 1:500,000; IGME: Athens, Greece, 1993. [Google Scholar]
- Forest Research Institute of Thessaloniki. Installation of a System for Monitoring the Developments in the Suburban Forest of Thessaloniki (Seich Sou) and Preparation of a Study for the Selection of Forest Species in Fire-Affected Areas; Forest Research Institute of Thessaloniki: Thessaloniki, Greece, 1993. (In Greek) [Google Scholar]
- Kotoulas, D. Mountainous Hydronomy; Flowing Waters; Aristotle University of Thessaloniki: Thessaloniki, Greece, 2001; Volume 1. [Google Scholar]
- Margiorou, S.; Kastridis, A.; Sapountzis, M. Pre/Post-Fire Soil Erosion and Evaluation of Check-Dams Effectiveness in Mediterranean Suburban Catchments Based on Field Measurements and Modeling. Land 2022, 11, 1705. [Google Scholar] [CrossRef]
- Kastridis, A.; Stathis, D.; Sapountzis, M.; Theodosiou, G. Insect Outbreak and Long-Term Post-Fire Effects on Soil Erosion in Mediterranean Suburban Forest. Land 2022, 11, 911. [Google Scholar] [CrossRef]
- Shakesby, R.A. Post-Wildfire Soil Erosion in the Mediterranean: Review and Future Research Directions. Earth Sci. Rev. 2011, 105, 71–100. [Google Scholar] [CrossRef]
- Miranda, E.D.; Attorre, F.; Azevedo, J.; Belen, I.; Alcalde, E.E.; Freitas, H.; Garavaglia, V.; Hódar, J.A.; Iritas, O.; Karaaslan, Y.; et al. Drivers of Degradation and Other Threats. In State of Mediterranean Forests 2018; FAO and Plan Bleu: Rome, Italy, 2018; pp. 2–15. [Google Scholar]
- Verheijen, F.G.A.; Jones, R.J.A.; Rickson, R.J.; Smith, C.J. Tolerable versus Actual Soil Erosion Rates in Europe. Earth Sci. Rev. 2009, 94, 23–38. [Google Scholar] [CrossRef]
- Cerdan, O.; Poesen, J.; Govers, G.; Saby, N.; Le Bissonnais, Y.; Gobin, A.; Vacca, A.; Quinton, J.; Auerswald, K.; Klik, A.; et al. Sheet and Rill Erosion; John Wiley & Sons, Ltd: Hoboken, NJ, USA, 2006. [Google Scholar]
- Panagos, P.; Borrelli, P.; Poesen, J.; Ballabio, C.; Lugato, E.; Meusburger, K.; Montanarella, L.; Alewell, C. The New Assessment of Soil Loss by Water Erosion in Europe. Environ. Sci. Policy 2015, 54, 438–447. [Google Scholar] [CrossRef]
- Jones, R.J.A.; Le Bissonnais, Y.; Bazzoffi, P.; Sanchez Diaz, J.; Düwel, O.; Loj, G.; Øygarden, L.; Prasuhn, V.; Rydell, B.; Strauss, P.; et al. Nature and Extent of Soil Erosion in Europe. In Nature and Extent of Soil Erosion in Europe; Joint Research Centre, European Commission: Ispra, Italy, 2004; pp. 145–185. [Google Scholar]
- Alexander, E.B. Rates of Soil Formation: Implications for Soil-Loss Tolerance. Soil. Sci. 1988, 145, 37–45. [Google Scholar] [CrossRef]
- Inbar, M.; Wittenberg, L.; Tamir, M. Soil Erosion and Forestry Management after Wildfire in a Mediterranean Woodland, Mt. Carmel, Israel. Int. J. Wildland Fire 1997, 7, 285–294. [Google Scholar] [CrossRef]
- Inbar, M.; Tamir, M.; Wittenberg, L. Runoff and Erosion Processes after a Forest Fire in Mount Carmel, a Mediterranean Area. Geomorphology 1998, 24, 17–33. [Google Scholar] [CrossRef]
- Robichaud, P.R.; Beyers, J.L.; Neary, D.G. Evaluating the Effectiveness of Postfire Rehabilitation Treatments; US Department of Agriculture, Forest Service, Rocky Mountain Research Station: Washington, DC, USA, 2000.
- Mayor, A.G.; Bautista, S.; Llovet, J.; Bellot, J. Post-Fire Hydrological and Erosional Responses of a Mediterranean Landscpe: Seven Years of Catchment-Scale Dynamics. Catena 2007, 71, 68–75. [Google Scholar] [CrossRef]
- Mastrolonardo, G.; Castelli, G.; Certini, G.; Maxwald, M.; Trucchi, P.; Foderi, C.; Errico, A.; Marra, E.; Preti, F. Post-Fire Erosion and Sediment Yield in a Mediterranean Forest Catchment in Italy. Int. J. Sediment. Res. 2024, 39, 464–477. [Google Scholar] [CrossRef]
- Hubbert, K.R.; Wohlgemuth, P.M.; Beyers, J.L. Effects of Hydromulch on Post-Fire Erosion and Plant Recovery in Chaparral Shrublands of Southern California. Int. J. Wildland Fire 2012, 21, 155. [Google Scholar] [CrossRef]
- Moody, J.A.; Martin, D.A. Synthesis of Sediment Yields after Wildland Fire in Different Rainfall Regimes in the Western United States. Int. J. Wildland Fire 2009, 18, 96. [Google Scholar] [CrossRef]
- Prosdocimi, M.; Cerdà, A.; Tarolli, P. Soil Water Erosion on Mediterranean Vineyards: A Review. Catena 2016, 141, 1–21. [Google Scholar] [CrossRef]
- Morán-Ordóñez, A.; Duane, A.; Gil-Tena, A.; De Cáceres, M.; Aquilué, N.; Guerra, C.A.; Geijzendorffer, I.R.; Fortin, M.; Brotons, L. Future Impact of Climate Extremes in the Mediterranean: Soil Erosion Projections When Fire and Extreme Rainfall Meet. Land Degrad. Dev. 2020, 31, 3040–3054. [Google Scholar] [CrossRef]
- Francos, M.; Pereira, P.; Alcañiz, M.; Úbeda, X. Post-Wildfire Management Effects on Short-Term Evolution of Soil Properties (Catalonia, Spain, SW-Europe). Sci. Total Environ. 2018, 633, 285–292. [Google Scholar] [CrossRef]
- Girona-García, A.; Vieira, D.C.S.; Silva, J.; Fernández, C.; Robichaud, P.R.; Keizer, J.J. Effectiveness of Post-Fire Soil Erosion Mitigation Treatments: A Systematic Review and Meta-Analysis. Earth Sci. Rev. 2021, 217, 103611. [Google Scholar] [CrossRef]
Disclaimer/Publisher’s Note: The statements, opinions and data contained in all publications are solely those of the individual author(s) and contributor(s) and not of MDPI and/or the editor(s). MDPI and/or the editor(s) disclaim responsibility for any injury to people or property resulting from any ideas, methods, instructions or products referred to in the content. |
© 2025 by the authors. Licensee MDPI, Basel, Switzerland. This article is an open access article distributed under the terms and conditions of the Creative Commons Attribution (CC BY) license (https://creativecommons.org/licenses/by/4.0/).