Article

Dramatic Decoupling Between Population and Construction Land in Rural China

1
Key Laboratory of Land Surface Pattern and Simulation, Institute of Geographic Sciences and Natural Resources Research, Chinese Academy of Sciences, Beijing 100101, China
2
College of Resources and Environment, University of Chinese Academy of Sciences, Beijing 100049, China
*
Author to whom correspondence should be addressed.
Land 2025, 14(3), 605; https://doi.org/10.3390/land14030605
Submission received: 18 February 2025 / Revised: 11 March 2025 / Accepted: 12 March 2025 / Published: 13 March 2025

Abstract

:
The rural population in China is experiencing a rapid decline, yet rural construction land (RCL) continues to exhibit an upward trend. The vast number and widespread distribution of villages have hindered the establishment of a unified understanding of per capita RCL and its evolving characteristics in China. This study uses both per capita RCL and a decoupling index as indicators to investigate the decoupling relationship between RCL and the rural population in China and examines their variations across national, provincial, and prefectural levels, utilizing more precise data from national land surveys and censuses. The findings reveal that China’s per capita RCL displays considerable regional disparities, having increased by 53.0% from 2010 to 2020. More than 80% of prefecture-level cities show a strong negative decoupling relationship between RCL and the rural population. Additionally, the results demonstrate that per capita RCL is influenced by various factors, including terrain, latitude, and urbanization rates. Notably, the per capita income of rural residents shows no significant effect on the per capita RCL. These research findings can serve as a valuable reference for understanding the current status of per capita RCL in China and provide a reference for RCL planning in the developing world.

1. Introduction

Villages, as the most fundamental organizational units of rural areas, have always been the primary space for residents to engage in various production and living activities [1]. However, the “population decline-village expansion” paradox has now become a global conflict [2]. Eurostat [3] found that, although rural areas have been growing faster, many European countries have also experienced rural population loss, with the population of predominantly rural areas declining by an average of 0.1% per year since 2015. The phenomena of these countries are mainly affected by the development of tertiary industry in rural areas [4]. Similar situations also exist in the developing world due to the accelerated urbanization process. For example, some Indian scholars [5] have found that the country’s rural areas have increased abnormally due to traditional land inheritance and lack of planning regulations, while many rural people have moved into cities. However, these studies often rely on small-scale cases and lack nationwide spatial data analysis.
As the world’s largest developing country, China also faces severe challenges. The human–land relationship in rural China is a unique phenomenon in the context of its rapid urbanization [6]. Unlike many countries, although many residents have moved from rural areas to cities, most have not changed their traditional concepts and continue to build houses in rural areas, resulting in the continuous growth of rural construction land. The third national land survey defines rural construction land (RCL) as commercial, residential, industrial, school, and other land belonging to a village, including other types of land within the rural settlements. Rural population is defined as the sum of the agricultural and the non-agricultural population residing in rural areas. According to data from the third national land survey, the total domestic construction land area increased by 26.5% in 10 years, of which RCL accounted for more than 50% of the total. The RCL area is almost four times that of the urban construction land [7,8]. At the same time, the rural population in China decreased by 24%, with a reduction of 160 million people. By 2020, the rural population was only 65% of the urban population.
The rapid growth of RCL and the significant decrease in rural population have led to dramatic decoupling between the rural population and land, manifested as a substantial increase in per capita RCL [9,10]. This may lead to idleness of rural housing and a massive waste of resources. Studies have shown that the average hollowing rate of Chinese villages reached 10.2% in 2010 [11]. Researchers found through investigation that the utilization rate of RCL is low, with about 45% of rural houses being idle for a long time [12] and nearly 40% of rural houses being occupied by only one to two people for an extended period. Moreover, the continuous expansion of RCL encroaches on other types of land (such as cropland and forest land). Nearly 90% of the expansion of RCL is at the expense of cropland, and this newly added land is small in scale, scattered, and lacks scientific planning, which not only affects food production but also damages the ecological environment [13].
Against the backdrop of the deepening implementation of the rural revitalization strategy, China has issued a series of planning and development schemes for RCL. In 2018, the State Council introduced the “Rural Revitalization Strategic Plan (2018–2022)”, which emphasized the importance of “adapting to local conditions and progressing gradually” and reasonably constraining the per capita RCL area [14]. However, due to various factors, China has not yet issued a unified national standard for per capita RCL planning. First, there are no accurate data on the per capita RCL area, and the current situation is unclear. Second, the reasons for regional differences in per capita RCL are not well understood and lack in-depth research. Many domestic scholars have conducted extensive research based on the content related to RCL. For example, some scholars have conducted detailed studies on spatial evolution mechanisms of villages [15,16], changes in the per capita area of rural settlements, and changes in RCL patterns and the driving factors [17] in small-scale study areas, accumulating some achievements. However, these studies mainly focus on the micro or middle scales and are mostly qualitative [1]. Research utilizing accurate data to focus on the spatial differences in per capita RCL on a national scale and its influencing factors needs to be strengthened.
This paper utilizes accurate census and national land survey data to precisely depict per capita RCL, analyzing the current state and regional differences in the decoupling relationship between RCL and the rural population across the country. By combining data on the rural population, income, urbanization rate, and terrain, we analyze the influencing factors of per capita RCL at the prefecture-level city scale. This study aims to identify issues related to human–land decoupling in rural China and the driving factors behind it, which can provide a scientific basis for the formulation of RCL planning. As a typical developing country, China’s changes in human–land relations in rural areas have sufficient representativeness and research significance. For other developing countries, the changes in the relationship between RCL and the rural population in China may provide them with a reference and deepen people’s understanding of the disconnection between massive out-migration and growth in rural construction land in the developing world, while also promoting the development of land science in the Global South.

2. Research Method and Data

The research data primarily included natural geographic, land use, and socioeconomic data (Table 1). The land use data comprised the second and third national land survey data (at provincial and prefectural scales), while the socioeconomic data included rural population data from the sixth and seventh national censuses, as well as per capita income data of rural residents. All statistical data in this paper excluded Taiwan Province, Hong Kong, Macao, areas jointly administered by China and North Korea, and the South China Sea islands.
To study the decoupling relationship between RCL and rural population, this study used two indicators to represent this relationship, namely per capita RCL and a decoupling index. Per capita RCL is a simple and clear indicator that can quantitatively characterize the situation of land use in rural areas and help formulate national standards. Per capita RCL may be influenced by a combination of natural and social factors. The natural environmental factors include longitude, latitude, and terrain. Longitude was selected because the Western regions of China have abundant land resources, which may result in larger per capita RCL. Latitude was chosen because in high-latitude areas of China, the lower solar elevation angle leads to lower buildings and larger distances between buildings, potentially affecting per capita RCL. Terrain could also impact per capita RCL, with plains potentially having higher per capita RCL compared to mountainous areas. Referring to relevant research [19], the socioeconomic factors selected were per capita land resources, per capita income of rural residents, and urbanization rate.
In summary, seven indexes were selected as independent variables (Table 2), and multiple linear regression was established to analyze the factors influencing the per capita RCL area. Considering the huge spatial differences in China, it was necessary to set up geographical variables to explain the differences. Because the existing variables cannot fully express certain factors, such as geographical divisions, the model needed dummy variables. In this study, we set four dummy variables. First, a dummy variable for plains was established. The distribution of China’s mountainous areas was delineated based on the “Digital Mountain Map of China” dataset formed by Li and others [18] based on the study of diverse mountainous terrains (Supplementary Figure S1a). Second, based on China’s four major geographical regions, three dummy variables (Eastern, Central, and Northeastern) were set, with the Western region as the reference variable. The Northeastern region included the provinces of Liaoning, Jilin, and Heilongjiang. The Eastern region included Beijing, Tianjin, Hebei, Shanghai, Jiangsu, Zhejiang, Shandong, Fujian, Guangdong, and Hainan. The Central region included Shanxi, Anhui, Jiangxi, Henan, Hubei, and Hunan. The Western region included Inner Mongolia, Guangxi, Chongqing, Sichuan, Guizhou, Yunnan, Shaanxi, Gansu, Qinghai, Ningxia, Tibet, and Xinjiang (Supplementary Figure S1b).
This study employed a multiple linear regression model, using SPSS 27.0 for regression analysis. The dependent variable y is per capita RCL. The main influencing factors studied include longitude (x1), latitude (x2), terrain (x3), per capita land resources (x4), per capita income of rural residents (hereinafter referred to as per capita income) (x5), urbanization rate (x6), and geographical regions (x7). The regression model is as follows:
y = a × x 1 + b × x 2 + c × x 3 + d × x 4 + e × x 5 + f × x 6 + g × x 7
Among them, a, b, c, d, e, f, and g are all constant coefficients.
Apart from using per capita RCL to characterize the decoupling relationship between rural population and RCL, the decoupling index is also a feasible method. We mainly used the Tapio decoupling index method to roughly analyze the decoupling state of the human–land decoupling relationship by comparing the change rates of RCL and rural population in China [20]. This model can be defined as follows:
e i = ( L t L 0 ) / L 0 ( P t P 0 ) / P 0 = r L r P
where ei represents the decoupling coefficient between RCL and rural population in the period i; L0 and Lt represent the RCL area at the beginning year and year t, respectively, P0 and Pt represent the rural population at the beginning year and year t, respectively, and rL and rP represent the growth rate of RCL and rural population, respectively. Referring to previous studies, decoupling relationship types were divided into eight degrees (Supplementary Figure S2). Using the Tapio decoupling model, we can investigate the specific decoupling types and spatial differences between the rural population and RCL in China from 2010 to 2020.

3. Research Results

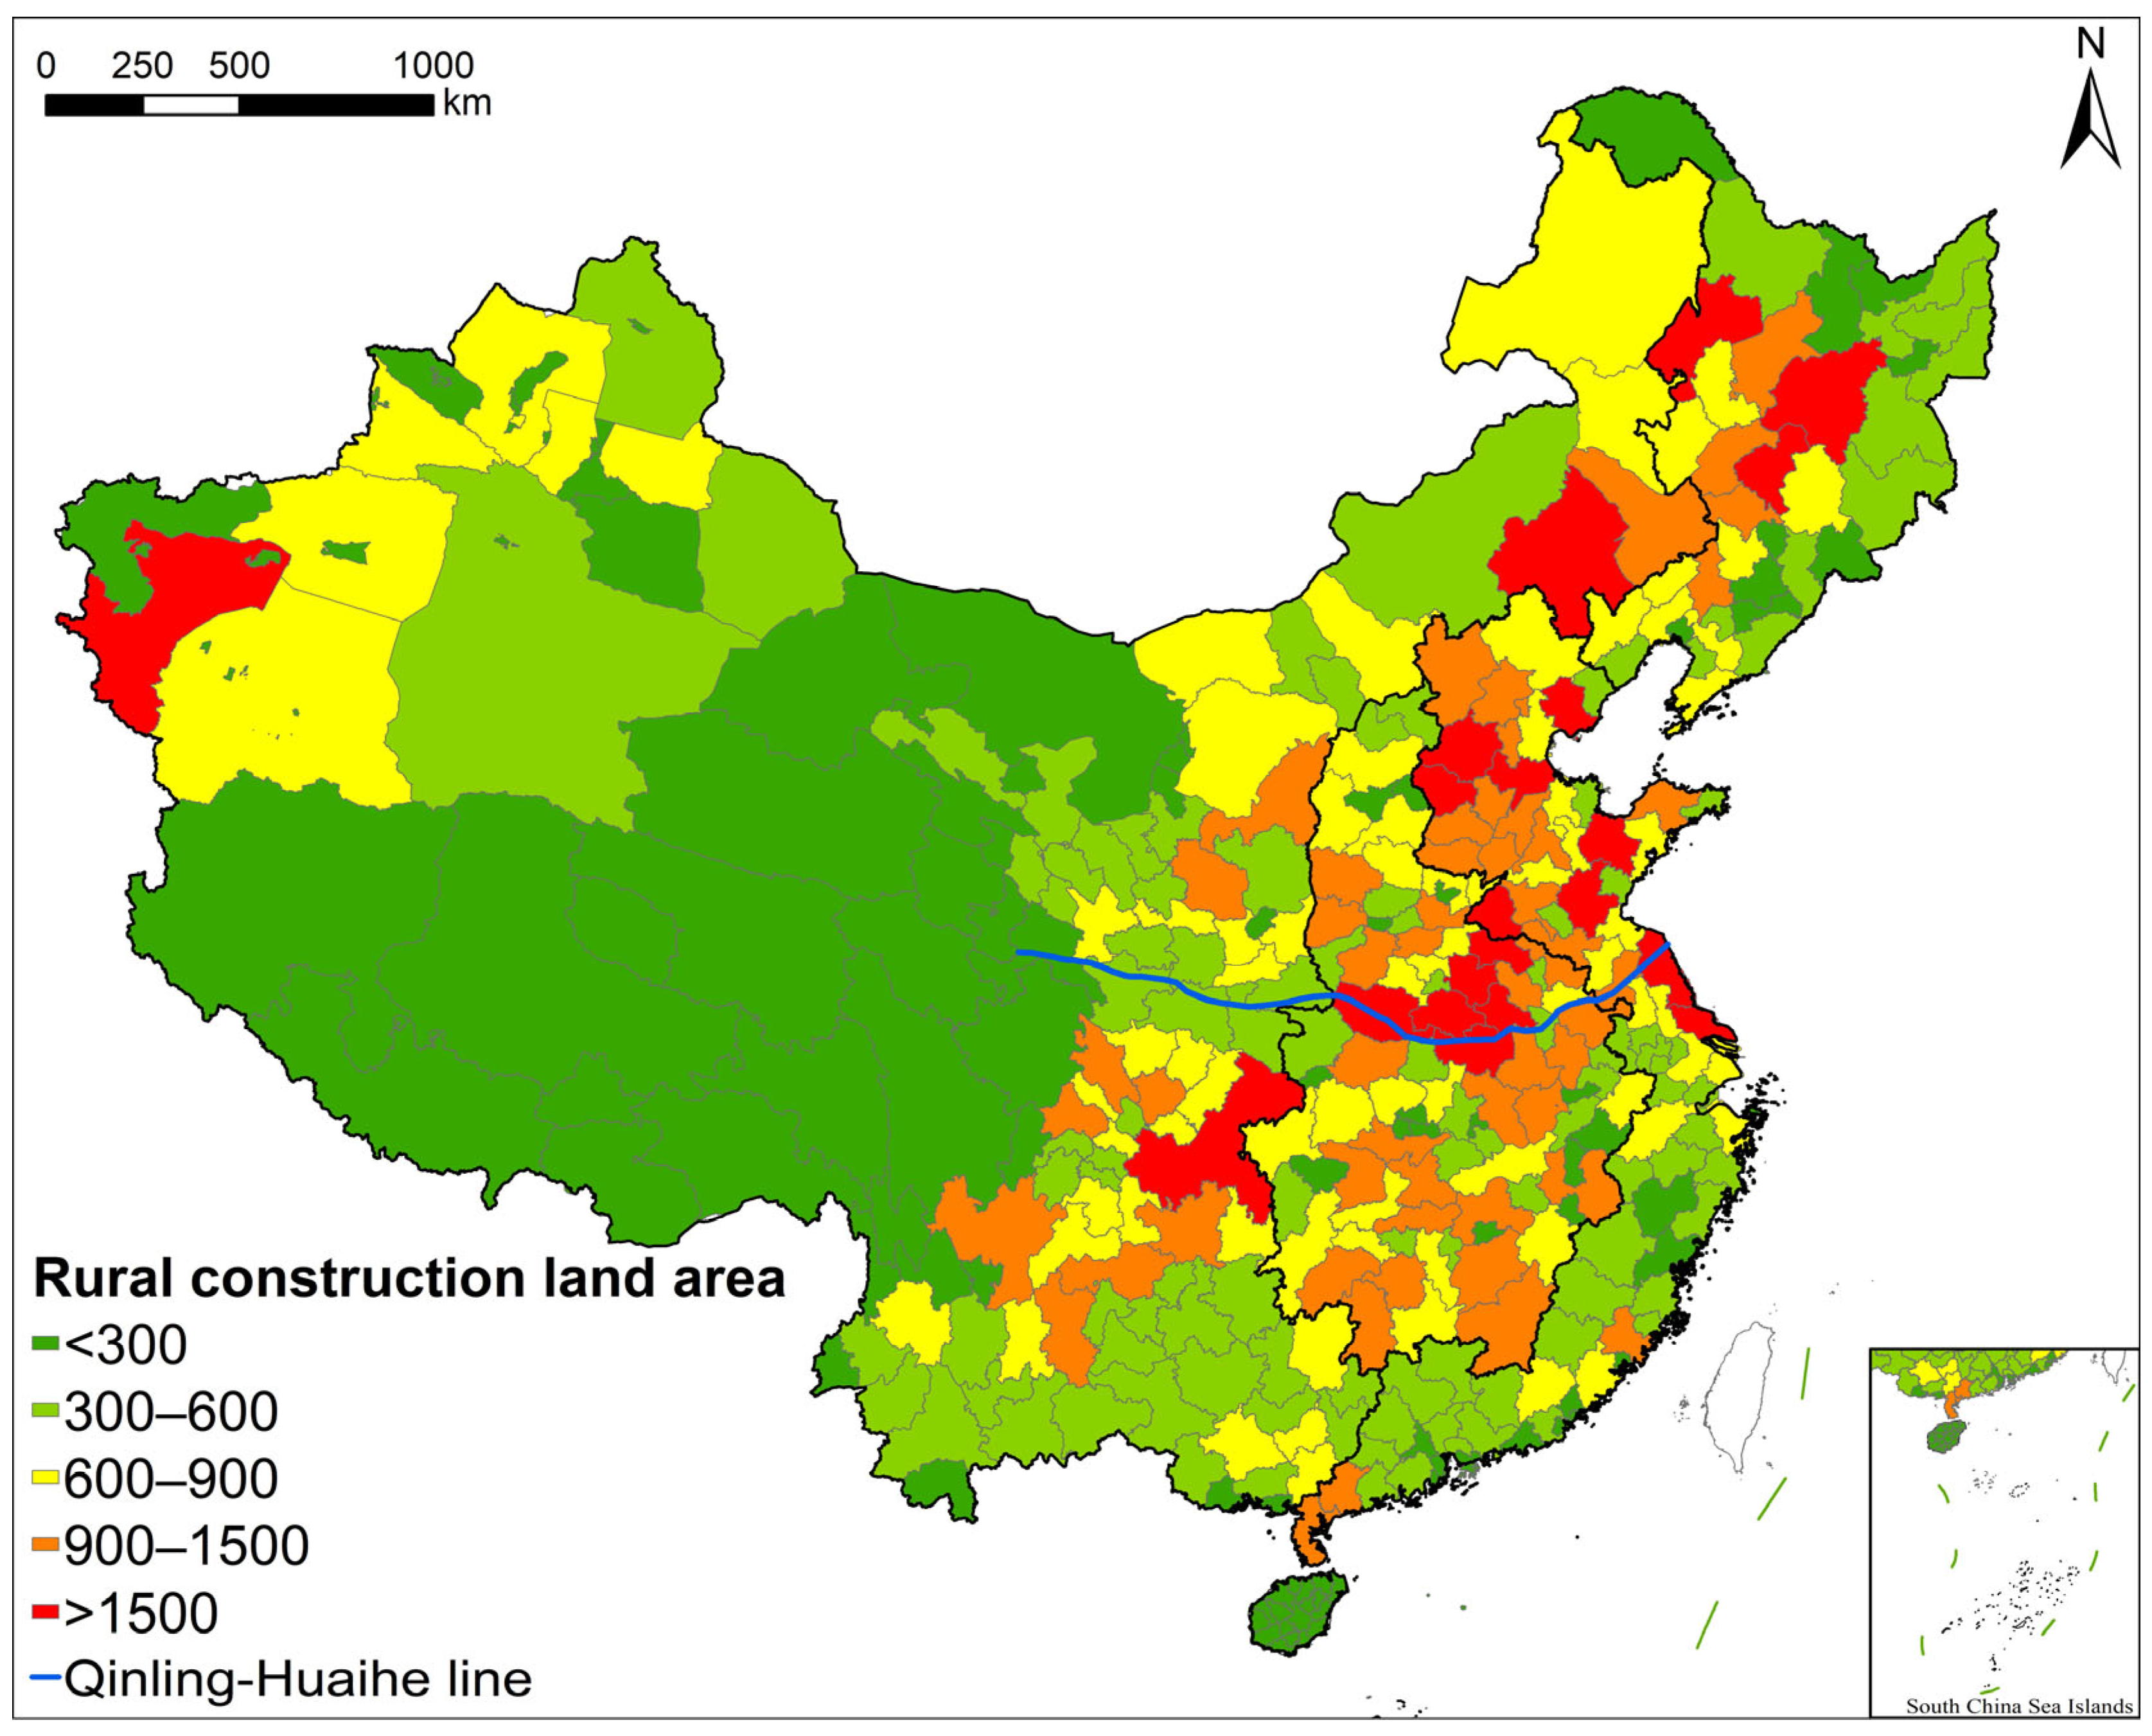
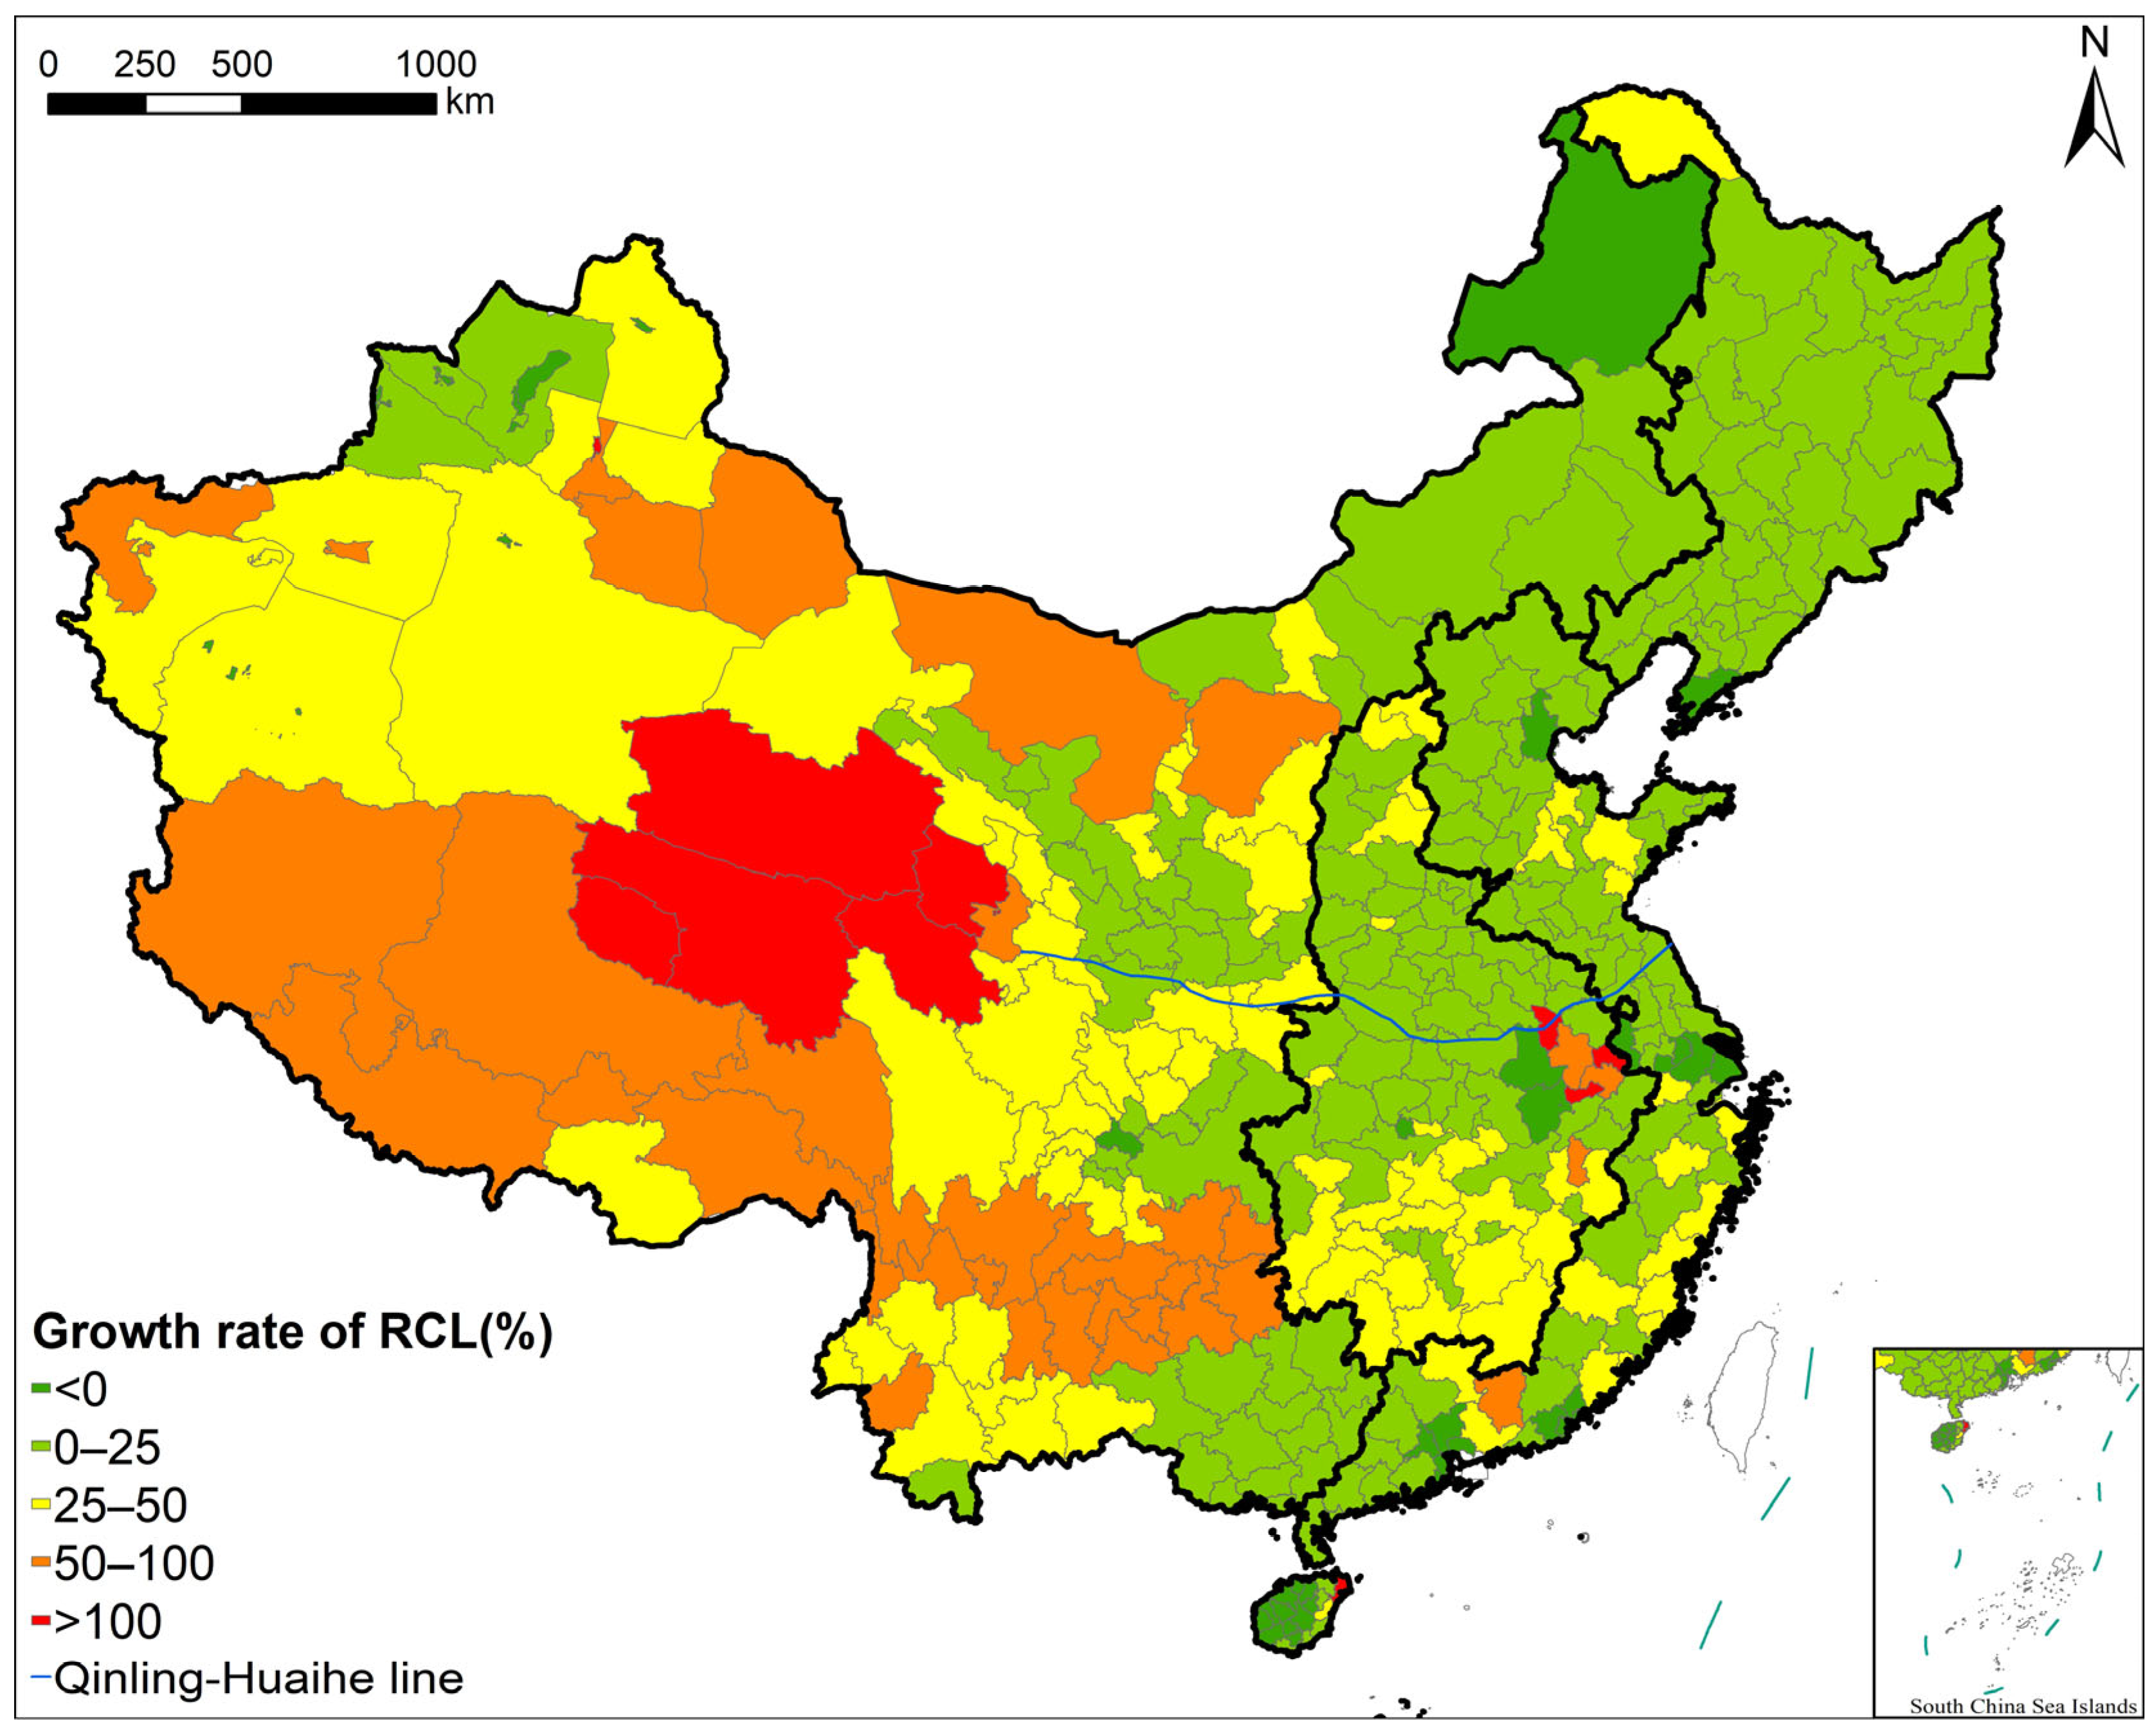
3.1. Current Situation of RCL in China

In 2020, the total area of RCL nationwide was 218.5 thousand km2. The current area of RCL in China is shown in Figure 1. This picture shows that prefecture-level cities with RCL areas greater than 1.5 thousand km2 are concentrated in the Northeastern Plain, the North China Plain, the middle and lower reaches of the Yangtze River, and the Southwestern hilly areas, mostly located in the Eastern and Central regions. Among the four major regions, the Western region has the largest area share (31.8%), while the Northeastern region has the smallest (10.0%). The Central and Eastern regions are similar, with shares of 29.8% and 28.4% respectively. The Eastern region has the most prefecture-level cities with areas greater than 1.5 thousand km2, accounting for 8.7% of the total, while the Western region has the fewest cities with areas less than 1.5 thousand km2, accounting for only 2.1% of the total.
Figure 2 shows the growth rate of RCL nationwide. From 2010 to 2020, RCL nationwide increased by 18.1%. Except for a few prefecture-level cities, RCL increased in most regions. Among the four major regions, the Western region experienced the largest growth at 29.8%, while the Northeastern region saw the smallest increase at 6.8%. The Eastern and Central regions grew by 10.7% and 18.6%, respectively. These findings indicate that the growth in the RCL area mainly occurred in the Central and Western regions, while the increases in the Northeastern and Eastern regions were below the national average. At the provincial scale, except for Tianjin and Shanghai, which saw a decrease in area, all other provinces experienced significant growth. Guizhou, Qinghai, and Tibet had the largest increases in rural construction land area, each exceeding 50%.

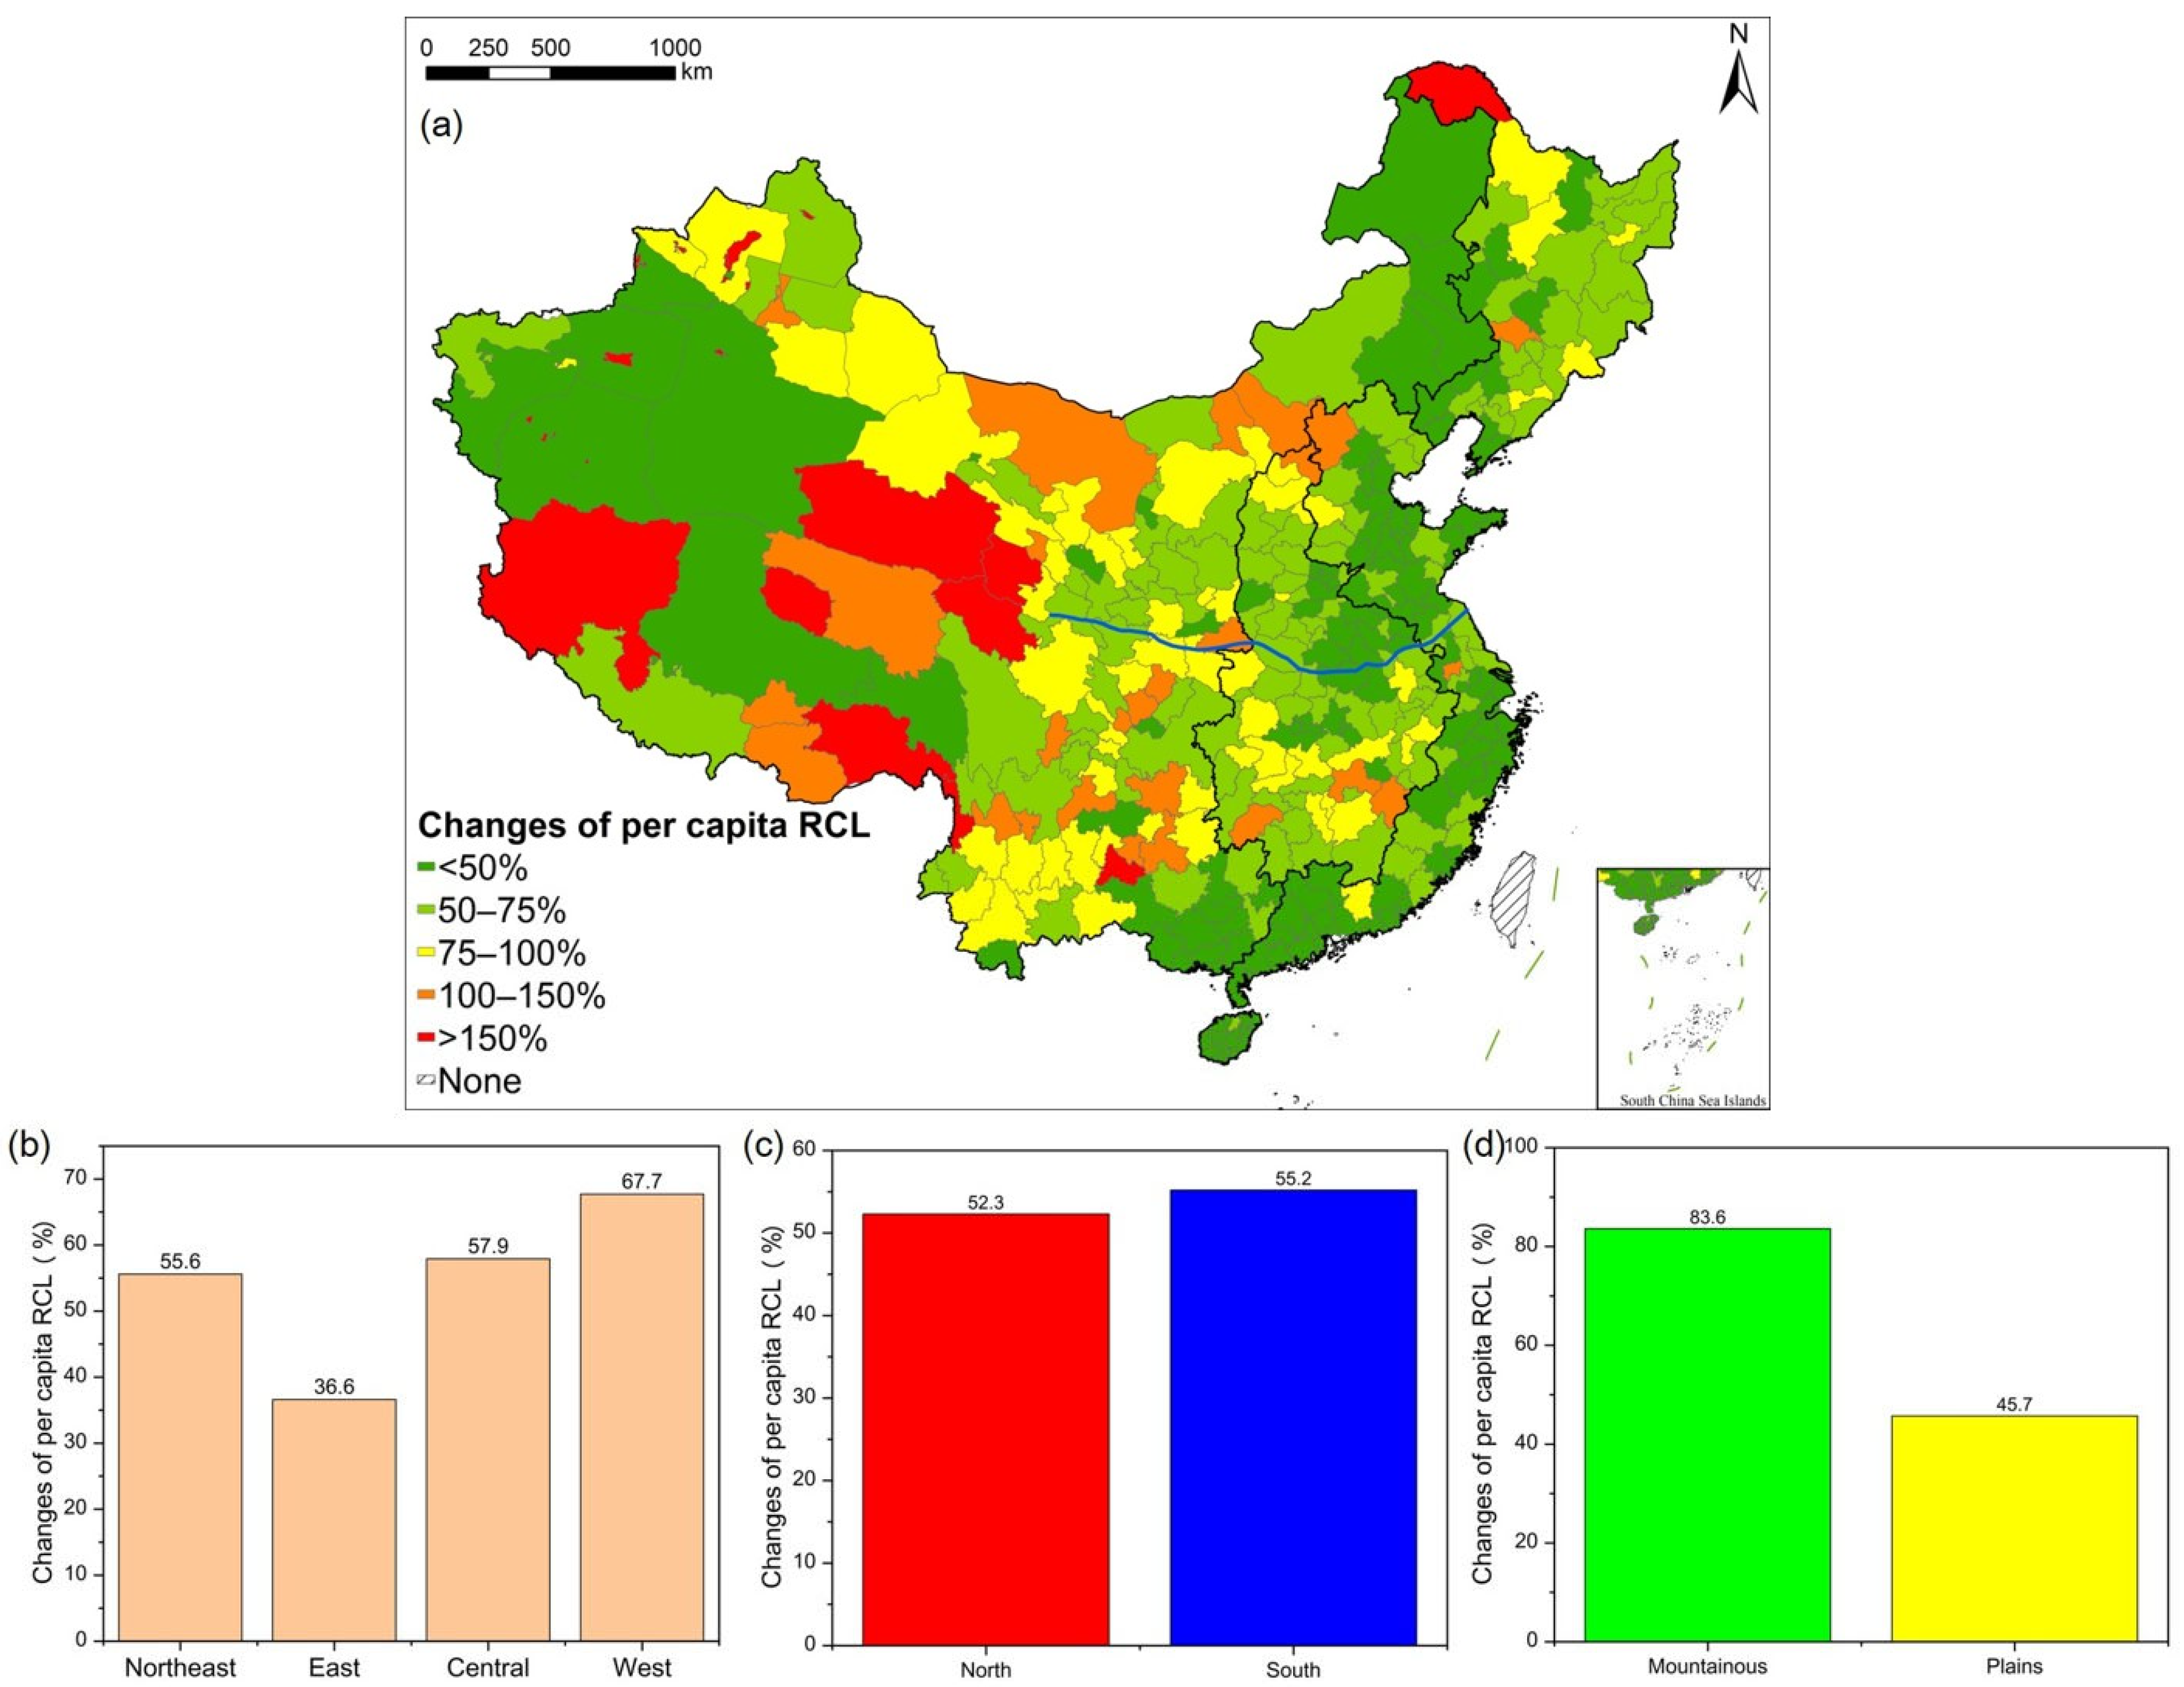
3.2. Current Situation and Changes in per Capita RCL

The per capita RCL in China exhibits a spatial pattern of being higher in the north and lower in the south (Figure 3a). In 2020, most prefecture-level cities with per capita areas exceeding the national average (142.9 m2) were located north of the Qinling-Huaihe Line and in the Jianghuai region. The regions with high per capita RCL were concentrated around the Greater Khingan Mountains, northern Xinjiang, and Western Inner Mongolia. The regions with low per capita RCL were distributed in southern regions centered around Guangxi and Guangdong and parts of the Qinghai-Tibet Plateau. With the Qinling-Huaihe line as the boundary, per capita RCL in northern regions was 1.4 times that of the southern regions (Figure 3c), indicating that the decoupling phenomenon in the northern regions is more pronounced.
Similarly, there are significant differences in per capita RCL area among the four major regions. The Northeastern region has the largest per capita area at 230.0 m2, while the Eastern region has the smallest, with the former being 1.8 times the latter (Figure 3b). Additionally, per capita RCL in mountainous areas is 1.1 times that of plains, indicating that the decoupling relationship between the rural population in mountainous areas and RCL is more severe (Figure 3d).
In 2020, the national per capita RCL increased by 49.5 m2 compared to 2010, a growth rate of 53.0%, which is significantly higher than the growth rate of RCL (18.1%). As shown in Figure 4a, areas with growth rates exceeding 75% are mainly distributed in the Central and Western regions. Among the four major regions, the Western region has the highest growth rate (67.8%), and the Eastern region has the lowest (36.6%), with the former being 1.8 times the latter (Figure 4b).
The calculation results show that the growth rate of per capita RCL in the northern regions is 52.2%. In the southern regions, the growth rate of per capita RCL is 55.2%, indicating that the growth of per capita RCL in the south is slightly faster than that in the north (Figure 4c). There is also a significant difference in per capita RCL growth between the plains and mountainous areas. From 2010 to 2020, the growth rate of per capita RCL in the plains was 45.7%, while in the mountainous areas, it was 83.6%, making the latter 1.8 times the former (Figure 4d).

3.3. Decoupling Relationships Between RCL and Rural Population

From 2010 to 2020, most prefecture-level cities in China showed strong negative decoupling between RCL and the rural population, occupying 87.7% of the national total (Table 3), and the national decoupling index between RCL and rural population is −0.8. Excluding the strong negative decoupling relationship, the number of cities exhibiting weak negative decoupling is highest, followed by expansive negative decoupling, indicating that most prefecture-level cities in China showed a negative decoupling relationship between the rural population and RCL; that is RCL continues to expand while the rural population continues to flow away. Some prefecture-level cities in provinces like Anhui and Guizhou, as well as western Xinjiang and the Qinghai-Tibet Plateau, showed an expansive negative decoupling relationship. Some prefecture-level cities in northeast China—Jiangsu, Anhui, Guangdong, Hainan, Sichuan and Xinjiang—showed weak negative decoupling. A few prefecture-level cities in the eastern coastal and Tibet areas showed recessive decoupling, weak decoupling, and strong decoupling. In addition, only Xiamen in Fujian province still exhibits coupling relationships (Table 3). In general, we can find a strong negative decoupling relationship between RCL and the rural population in China.

4. Discussion

This section uses a multiple linear regression model to quantitatively analyze the factors influencing the per capita RCL area. The results of the covariance analysis show (Table 4a) that there is no collinearity between the variables selected in this study. The results of the linear regression model (Table 4b) show that longitude, latitude, per capita land resources, and the urbanization rate have significant effects on per capita RCL at the 1% level, while the impact of per capita income is not significant (the model passes the collinearity test).

4.1. Terrain

The coefficient for the independent variable terrain in Table 3 indicates that there is a certain positive correlation between terrain and human–land decoupling in rural China. Although the current difference is not significant, the growth of per capita RCL in mountainous areas is noticeably faster. In just this decade, the growth rate of per capita RCL in mountainous areas was 1.8 times that of plains. Research indicates that both the number of houses built by mountain villagers and the average area per household are on the rise, with new housing in recent years typically being three stories or more [21]. This is likely due to the uneven terrain and relative inconvenience of transportation in mountainous areas, prompting villagers to expand RCL to improve living conditions and production capabilities. The proportion of China’s rural population in mountainous areas relative to the total national population is consistently decreasing, the extent of population decline is growing, and the degree of contraction is intensifying [22], leading to rapid growth in per capita RCL.

4.2. Geographic Location

Table 3 shows that the coefficient for the independent variable latitude is positive and significant at the 1% level, indicating that higher latitudes correspond to larger per capita RCL areas, with the decoupling phenomenon in the north more severe than in the south. Various factors related to geographic location contribute to the larger rural construction land area in the north. First, the northern terrain is open and flat, allowing for more expansive rural construction [23,24]. Second, the high degree of agricultural mechanization in the north requires large areas of construction land for agricultural product processing and storage of farming tools [25], with policies also favoring the expansion of RCL. Third, the high latitude in the north results in cold and long winters, necessitating larger living and storage spaces for villagers to withstand the cold, leading to rural houses predominantly being large single-story buildings [26].
The coefficient for the independent variable longitude is negative and significant at the 1% level, indicating that higher longitudes correspond to smaller per capita RCL areas. From 2010 to 2020, the increase in RCL in the Western region far exceeded the national average, indicating that rural construction has continued to advance. The Western region, with its vast and sparsely populated areas, has accelerated rural construction in recent years. The government has also implemented a series of favorable policies and special support funds to promote local rural infrastructure development and economic growth, improving the quality of life for villagers and increasing the area of RCL [27]. Additionally, influenced by ecological migration and poverty alleviation policies in some western areas, as well as many villagers moving to cities for work, many villagers in places like Inner Mongolia and Gansu have chosen to migrate to nearby large cities such as Xi’an, leading to a significant increase in per capita RCL in the Western region.

4.3. Urbanization Rate

The results in Table 3 indicate that the urbanization rate has a significant positive impact on per capita RCL. A high urbanization rate means a large amount of idle RCL and an increasingly serious “hollow village” phenomenon. According to research by Li et al., the national village hollowing rate reached 18.2% in 2016, with nearly 25 million rural houses being long-term vacant or abandoned [22]. Cities with high urbanization rates typically have higher levels of economic development. Moreover, rural areas surrounding cities with high urbanization rates often become urban peripheries, driving the demand for more construction land for factories, enterprises, and commercial facilities [28].
Finally, per capita land resources are significant at the 1% level and have a positive impact on per capita RCL. This is mainly because areas with abundant per capita land resources (such as the Northeast and Northwest) have fewer land constraints on village construction, leading to stronger decoupling.

4.4. Per Capita Income

The impact of per capita income as a corresponding variable is not significant, indicating that RCL will grow regardless of whether the farmers’ income in a region is high or low. Housing construction is often less related to income and more susceptible to various social factors [29,30]. For relatively impoverished areas, if this investment proportion is too high, it becomes a financial burden on rural residents, squeezing their investment in production and affecting the development of the rural economy [31]. In 2020, the proportion of rural housing investment to rural residents’ income in China was 6.3%. Provinces with a proportion exceeding 12% are mostly located in the Western regions (Supplementary Figure S3). For rural residents in the Western regions with relatively low per capita income levels, excessive housing construction can impose a significant economic burden on farmers’ lives [32].

4.5. Decoupling Index

The results based on the Tapio decoupling model show that 96.4% of prefecture-level cities in China are in a negative decoupling state between RCL and rural population, with strong negative decoupling relationships accounting for more than 80%. In certain extreme regions, such as some prefecture-level cities in the north, the decoupling index between RCL and the rural population has been less than −5, significantly exceeding the national average. This situation contradicts the principle of compact development advocated by global land science [33]. Of the prefecture-level cities in China, 3.3% show a decoupling state, with most of them concentrated in the provinces along the eastern coast of China. These cities started their urbanization process early, so RCL tends to decrease while the rural population may grow due to counter-urbanization. Only 0.3% of prefecture-level cities show a coupling relationship, which includes Xiamen. It is also located on the southeast coast of China and shows an expansive coupling relationship.
Traditional cultural concepts are an important influencing factor for the negative decoupling relationship between RCL and rural populations. Some farmers place significant importance on housing construction. Therefore, they may be inclined to use RCL to build larger houses to demonstrate their family’s prosperity and status. In traditional Chinese beliefs, young adulthood is about establishing a family and career, middle age is for planning one’s retirement, and old age is for investing in children’s marriage capital. These cultural values emphasize the importance of rural housing throughout life, leading to an increase in per capita RCL. What is more, some rural areas’ traditional views emphasize family seclusion and privacy, leading people to preserve more space around their homes, thereby affecting the size of per capita RCL.

5. Conclusions

This paper used more accurate census and land survey data to analyze the decoupling relationship between RCL and the rural population in China, yielding the following conclusions:
(1)
A dramatic decoupling phenomenon between RCL and the rural population is shown in China. Despite the rapid decline in China’s rural population, RCL has grown rapidly. From 2010 to 2020, per capita RCL has grown fast at 53.0%.
(2)
There are strong regional differences in per capita RCL. There is a substantial difference between per capita RCL in the plains and mountainous areas, with the latter being 1.1 times higher than the former. The higher the latitude, the larger the per capita RCL, with northern areas being 1.4 times that of southern areas. Among the four major regions, the Northeast has the largest per capita RCL, while the East has the smallest.
(3)
More than 80% of prefecture-level cities in China show a negative decoupling relationship between RCL and rural population.
(4)
Per capita income has no significant impact on per capita RCL, indicating that RCL grows regardless of whether farmers’ income is high or low. In some provinces in western China, rural residential investment accounts for more than 10% of farmers’ income, imposing a significant burden on their livelihoods.
In conclusion, this study fills the gap in China’s lack of accurate per capita RCL data and highlights the huge contradiction between China’s rural population loss and RCL expansion from a macro perspective against the backdrop of rapid urbanization. The findings of this study have reference value for RCL use and village planning management in China and provide support for the formulation of per capita RCL standards. First, accurate national per capita RCL data can provide a basis for establishing RCL standards. When setting standards, it is essential to consider the impact of geographical and socioeconomic factors on RCL, adjusting per capita RCL indexes accordingly. Second, during rapid urbanization, the growth of per capita RCL has been unexpected. Policies need to guide farmers to diversify and rationalize their investments, control the trend of blindly building houses, and improve the monitoring and management mechanisms of per capita RCL, especially in areas where its growth is too rapid. Third, although per capita income has no significant impact on decoupling, in the Western regions, the high proportion of rural residential investment relative to rural residents’ income imposes a substantial burden on their lives. Therefore, attention should be paid to not only reducing the housing burden on farmers and improving their quality of life but also reasonably adjusting village layouts, integrating scattered RCL to build new rural communities, and enhancing land use efficiency. In addition, the results of this study provide a reference for future RCL spatial planning in the developing world and promote the advancement of land science in the Global South.
This study still has certain limitations. First, due to the unavailability of research data, some factors causing human–land decoupling were not quantified, such as the influence of some social factors. Second, the study only analyzed the strong human–land decoupling phenomenon in China at the macro scale, which is not in-depth enough at the micro-scale and lacks more detailed research on some typical regions. In future research, we expect to improve the model to establish RCL dynamic multi-scale monitoring systems and explore changes in decoupling. Some case studies and in-depth research on some serious decoupling phenomena and the decoupling relationship between population and construction land in areas around cities will be paid more attention to in future studies.

Supplementary Materials

The following supporting information can be downloaded at: https://www.mdpi.com/article/10.3390/land14030605/s1.

Author Contributions

Conceptualization, writing–original draft, data curation, formal analysis, methodology, software, J.H.; writing–review and editing, methodology, conceptualization, funding acquisition, project administration, resources, supervision, M.T. All authors have read and agreed to the published version of the manuscript.

Funding

This research was supported by the National Natural Science Foundation of China (grant number: 42361144881).

Data Availability Statement

Data are contained within the article. Further inquiries can be directed to the corresponding author.

Conflicts of Interest

The authors declare no conflicts of interest.

References

  1. Zhou, Y.; Huang, H.; Liu, Y. Dynamic Mechanism and Present Situation of Rural Settlements Evolution in China. Acta Geogr. Sin. 2020, 75, 2206–2223. [Google Scholar] [CrossRef]
  2. López, E.; Bocco, G.; Mendoza, M.E.; Velázquez, A.; Aguirre-Rivera, J.R. Peasant emigration and land-use change at the watershed level: A GIS-based approach in Central Mexico. Agric. Syst. 2006, 90, 62–78. [Google Scholar] [CrossRef]
  3. Eurostat. Predominantly Rural Regions Experience Depopulation. News Article of the Official Website of the European Union. 2023. Available online: https://ec.europa.eu/eurostat/web/products-eurostat-news/w/ddn-20230117-2 (accessed on 20 December 2024).
  4. Capello, R.; Cerisola, S. Industrial transformations and regional inequalities in Europe. Ann. Reg. Sci. 2022, 70, 15–28. [Google Scholar] [CrossRef]
  5. Somvanshi, S.S.; Kumari, M.; Sharma, R. Spatio-temporal analysis of rural–urban transitions and transformations in Gautam Buddha Nagar, India. Int. J. Environ. Sci. Technol. 2023, 21, 5079–5088. [Google Scholar] [CrossRef]
  6. Deng, X.; Huang, J.; Rozelle, S.; Uchida, E. Growth, population and industrialization, and urban land expansion of China. J. Urban Econ. 2008, 63, 96–115. [Google Scholar] [CrossRef]
  7. Liu, S.-c.; Xiao, W.; Ye, Y.; He, T.; Luo, H. Rural residential land expansion and its impacts on cultivated land in China between 1990 and 2020. Land Use Policy 2023, 132, 106816. [Google Scholar] [CrossRef]
  8. Yao, P. Village planning under the national spatial planning system. South China Agric. 2022, 16, 149–151. [Google Scholar]
  9. Song, W.; Liu, M. Assessment of decoupling between rural settlement area and rural population in China. Land Use Policy 2014, 39, 331–341. [Google Scholar] [CrossRef]
  10. Zhang, Y.; Li, M.; Zhen, A. Analysis of the Influencing Factors of Paid Withdrawal and Use of Rural Homestead Land. Econ. Geogr. Available online: http://kns.cnki.net/kcms/detail/43.1126.k.20230525.1939.002.html (accessed on 17 September 2023).
  11. Huang, Q.; Li, M.; Chen, Z.; Li, F. Land Consolidation: An Approach for Sustainable Development in Rural China. AMBIO 2011, 40, 93–95. [Google Scholar] [CrossRef]
  12. Xu, L.; Xiao, S. On the Contradiction between Migrant Workers’ Surplus of Rural Housing and Shortage of Urban Housing. J. Anhui Agric. Univ. Soc. Sci. Ed. 2012, 21, 15–18. [Google Scholar]
  13. Xiao, Y.; Xu, Y.; Wu, B. Spatial patterns, influencing factors and type classification in villages of Hainan Island, China. Geogr. Sin. 2023, 43, 1410–1422. [Google Scholar]
  14. Li, H. Research on the scale of rural construction land under the national spatial planning system. Rural. Econ. Technol. 2021, 32, 24–26. [Google Scholar]
  15. Gu, G.; Wu, B.; Chen, Q.; Zhang, W.; Lu, R.; Lu, S.-q.; Feng, X.; Liao, W. Spatial differences and influence mechanisms of construction land development intensity in China, 2002–2020. Sci. Rep. 2023, 13, 11153. [Google Scholar] [CrossRef]
  16. Li, X.; Kuang, X.; Ma, X.; Li, C. Are there interactions between the urban and rural construction land use transition? Evidence from Jiangsu province in China. Habitat Int. 2024, 148, 103092. [Google Scholar] [CrossRef]
  17. Xue-la, T. The Change and Driving Forces of Rural Residential Area Under the Background of Rapid Urbanization:A Case Study of the Changsha-Zhuzhou-Xiangtan Urban Agglomeration. Sci. Geogr. Sin. 2014, 34, 309–315. [Google Scholar]
  18. Xi, N.; Ainong, L.; Yu, C.; Wei, D. Design and Compilation of Digital Mountain Map of China (1∶6 700 000) in Vertical Layout. Remote Sens. Technol. Appl. 2016, 31, 451–458. [Google Scholar]
  19. Guo, Y.; Tang, X.; Chen, K.; Li, Z.; Lin, S. Characteristics and influencing factors of rural settlement spatial reconstruction in Wuhan City. Econ. Geogr. 2018, 38, 180–189. [Google Scholar]
  20. Shi, L.; Wang, Y. Evolution characteristics and driving factors of negative decoupled rural residential land and resident population in the Yellow River Basin. Land Use Policy 2021, 109, 105685. [Google Scholar] [CrossRef]
  21. Wang, P.; Zhang, J.; Sun, F.; Cao, S.; Que, Y.; Wang, C.; Xu, D. Spatial Distribution and the Impact Mechanism of Traditional Villages in Southwest China. Econ. Geogr. 2021, 41, 204–213. [Google Scholar]
  22. Hou, X.; Yu, Z.; Li, Y.; Yuan, L.; Sun, C. Spatial pattern and mechanism of depopulation in the mountainous counties in China. Geogr. Res. 2024, 43, 1205–1224. [Google Scholar]
  23. Zhao, P.; Zhang, M. The Role of Villages and Townships in Informal Land Development in China: An Investigation on the City Fringe of Beijing. Sustainability 2016, 8, 255. [Google Scholar] [CrossRef]
  24. Yin, L.; Wei, W.; Zhao, L.; Xia, J.; Bo, L. Characteristics, regional differences, and influencing factors of agricultural spatial evolution in China from 2000 to 2020. Geogr. Res. 2024, 43, 1225–1246. [Google Scholar]
  25. Meng, F. Improving agricultural mechanization level to promote agricultural sustainable development. Trans. Chin. Soc. Agric. Eng. Trans. CSAE 2017, 37, 57. [Google Scholar]
  26. Wang, M.; Mizoguchi, M.; Lai, W. A Study on the Feature of Spatial Structure and Its Formative Factors in Northern Chinese Farmhouses—A Perspective of Function and Arrangement. J. Hum. Settl. West China 2015, 30, 63–70. [Google Scholar]
  27. Liu, Y.; Yu, H.; Liu, D.; Zhu, L. Spatial differentiation mechanism of development intensity pattern of construction land in Northeast China. Acta Geogr. Sin 2018, 73, 818–831. [Google Scholar]
  28. Li, X.; Ma, X. The mechanism of excessive expansion of construction land leading to inefficient economic growth. Urban Probl. 2015, 8, 2–7. [Google Scholar] [CrossRef]
  29. Lou, F.; Li, X.; Chen, X. Comparison on Spatial Evolution of Rural Settlements between the Flat and the Mountainous Areas: Evidence from Yanjin County and Baofeng County, Henan Province. Econ. Geogr. 2017, 37, 158–166. [Google Scholar]
  30. Wang, D.; Chen, C.; Findlay, C. A review of rural transformation studies: Definition, measurement, and indicators. J. Integr. Agric. 2023, 22, 3568–3581. [Google Scholar] [CrossRef]
  31. Yan, Q.; Li, J. Empirical Study on the Over construction of Self built Houses in Rural Areas of China: A Case Study of Jiangxi Province. Technol. Innov. Appl. 2015, 4, 14–16. [Google Scholar] [CrossRef]
  32. Yang, C.; Liu, X. Rural Settlements Landscape Evolution and Driving Factor in Beibei District of Chongqing. Mt. Res. 2017, 35, 890–898. [Google Scholar]
  33. Bibri, S.E.; Krogstie, J.; Kärrholm, M. Compact city planning and development: Emerging practices and strategies for achieving the goals of sustainability. Dev. Built Environ. 2020, 3, 100021. [Google Scholar] [CrossRef]
Figure 1. Current situation of RCL nationwide (km2).
Land 14 00605 g001
Figure 2. The growth rate of RCL in China from 2010 to 2020.
Land 14 00605 g002
Figure 3. Current situation of per capita RCL (m2) in China (a) and comparison of per capita RCL: in four major regions (b), the North and the South (c), the mountains and the plains (d).
Land 14 00605 g003
Figure 4. Changes in per capita RCL in China (a) and comparison of the changes in per capita RCL: in four major regions (b), the North and the South (c) and the mountains and the plains (d), 2010–2020.
Land 14 00605 g004
Table 1. Data sources and attributes.
Data TypeDataUnitTimeSource
Natural Geographic DataLatitude and longitude 2020ArcGIS
Land Use DataArea of RCLm22010, 2020The second and third national land surveys
Socioeconomic DataRural populationpeople2010, 2020The sixth and seventh censuses
Per capita land resourcesm22010, 2020The second and third national land surveys
Urbanization rate%2010, 2020China Urban Statistical Yearbook
Per capita income of rural residentsYuan per person2010, 2020Panel data on residents’ income at the prefecture-level cities scale (1999–2020)
Investment in rural housingTen thousand yuan2010, 2020China Fixed Assets Investment Statistical Yearbook
Vector DataNational administrative divisions 2020Geospatial Data Cloud Platform
Mountain Distribution 2015Dataset of “Digital Mountain Map of China” [18]
Table 2. Definition of variables affecting per capita RCL.
Types of ArgumentsArgument NamesDefinition
Natural factorsLongitudeLocation longitude
LatitudeLocation latitude
TerrainSet two dummy variables: plain and mountainous areas, with mountainous areas as the control variable
Socioeconomic factorsPer capita land resourcesThe total land area owned by each citizen within the administrative region
Per capita incomeThe abbreviation for per capita income of rural residents
Urbanization RateProportion of urban population to total regional population
Regional dummy variableGeographical regionSet 3 dummy variables, Northeast, East, and Central, with Western as the control variable
Table 3. Classification of decoupling relationships.
TypeRelationshipDistribution RegionNumber of Prefecture-Level Cities
DecouplingStrong decouplingShanghai, Guangdong4
Weak decouplingGuangdong, Hainan, Tibet4
Recessive decouplingGuangdong, Tianjin4
Negative decouplingStrong negative decouplingnationwide320
Weak negative decouplingInner Mongolia, Liaoning, Jiangsu, Anhui, Guangdong, Sichuan, Xinjiang12
Expansive negative decouplingZhejiang, Anhui, Shandong, Hainan, Guizhou, Tibet, Gansu, Xinjiang, Qinghai, Ningxia20
CouplingExpansion couplingFujian1
Recessive coupling 0
Table 4. Linear regression model results; (a) covariance analysis between independent variables; (b) linear regression model coefficient. R2 = 0.555 Adjusted R2 = 0.543.
(a)
Independent VariableLongitudeLatitudePer Capita Land ResourcesPer Capita IncomeUrbanization Rate
CorrelationLongitude1.00−0.020.26−0.16−0.16
Latitude−0.021.00−0.180.22−0.35
Per capita land resources0.26−0.181.00−0.03−0.01
Per capita income−0.160.22−0.031.00−0.41
Urbanization rate−0.16−0.35−0.01−0.411.00
CovariancesLongitude0.25−8.00 × 10−38.23 × 10−6−5.75 × 10⁻⁵−3.11
Latitude−8.00 × 10−30.49−7.95 × 10−61.2 × 10−4−9.58
Per capita land resources8.23 × 10−6−7.95 × 10−63.86 × 10−9−1.40 × 10⁻⁵−2.13 × 10⁻⁵
Per capita income−5.75 × 10−51.2 × 10−4−1.40 × 10−55.39 × 10−7−0.01
Urbanization rate−3.11−9.58−2.13 × 10⁻⁵−0.011541.93
(b)
TypeIndependent variableBBetatSignificanceVIF
Natural factorsLongitude−1.87−0.17−2.560.012.50
Latitude6.550.437.50<0.011.91
Terrain13.130.061.240.021.26
Socioeconomic factorsPer capita land resources3.23 × 10−40.235.22<0.011.13
Per capita income−7.94 × 10⁻⁵−5.00 × 10⁻³−0.110.921.38
Urbanization Rate43.750.061.11<0.011.44
Regional dummy variableD1 (Northeast)70.560.192.93<0.012.43
D2 (East)−2.03−8.00 × 10⁻³−0.120.902.70
D3 (Central)8.670.030.530.592.04
Disclaimer/Publisher’s Note: The statements, opinions and data contained in all publications are solely those of the individual author(s) and contributor(s) and not of MDPI and/or the editor(s). MDPI and/or the editor(s) disclaim responsibility for any injury to people or property resulting from any ideas, methods, instructions or products referred to in the content.

