Article

Influence of Land-Use Type on Black Soil Features in Indonesia Based on Soil Survey Data

1
Research Organization for Agriculture and Food, National Research and Innovation Agency, Jalan Jakarta-Bogor KM 46, Cibinong, Bogor 16915, West Java, Indonesia
2
Department of Soil Science, Hasanuddin University, Jalan Perintis Kemerdekaan KM 10, Makassar 90245, South Sulawesi, Indonesia
3
Department of Agrotechnology, State University of Gorontalo, Jalan Prof. Dr. Ing. B.J. Habibie, Gorontalo 96554, Gorontalo, Indonesia
4
Department of Ecology, Russian Timiryazev State Agrarian University, Timiryazevskaya Ulitsa, 49, Moscow 127550, Russia
*
Author to whom correspondence should be addressed.
Land 2025, 14(3), 599; https://doi.org/10.3390/land14030599
Submission received: 8 January 2025 / Revised: 6 March 2025 / Accepted: 10 March 2025 / Published: 12 March 2025

Abstract

:
Black soils refer to soils with black, thick upper layers containing 0.6% or more soil organic carbon in the tropical region. This high organic carbon content makes these soils essential for climate change control and food production. In Indonesia, black soils are found under forests, shrublands, and grasslands in tropical monsoon and savannah climates. Land clearing for agricultural uses will change black soil properties; however, knowledge of change (level, direction, and sensitivity) is limited. Meanwhile, soil surveying records land-use types and collects soil samples, resulting in voluminous legacy soil data. This study aimed to compare the mean difference in soil properties between two land-cover/use types. We used 142 black soil datasets containing legacy data on particle size distribution (sand, silt, clay), pH, soil organic carbon (SOC), total nitrogen (TN), available P2O5 (AP), and exchangeable cations (Ca, Mg, K, Na). We calculated the Hedges’s g-index for effect size assessment and performed a Welch’s t-test for significant differences. The results show that, compared to the forest, the agricultural dryland and monoculture home gardens have a large effect size and trigger changes in many soil properties. In contrast, mixed home gardens and paddy fields have a small effect size. In decreasing order, the black soil properties sensitive to change are TN > SOC = exchangeable K > exchangeable Mg = available phosphorus = pH = exchangeable Na > sand = silt = clay > exchangeable Ca. The results suggest that a combination of home gardens and paddy fields better supports food security and mitigates climate change in black soils. In addition, the legacy soil data can be used to monitor soil property changes.

1. Introduction

Black soils refer to mineral soils having thick, black upper layers (>25 cm) containing 0.6% or more soil organic carbon in tropical regions [1]. These soils store high organic carbon, being essential for climate change control and food production. Due to inherently fertile and productive soils, the black soil area has become a food basket for many countries [2], such as China, Russia, and Ukraine, and the soils are intensively and extensively farmed [3,4,5]. However, these soils are subject to degradation: soil erosion, nutrient depletion, pollution, compaction, salinization, and acidification [6,7]. Promoting conservation and sustainable use of these soils are among the strategies to maintain black soil productivity for food security and to reduce soil organic carbon (SOC) loss to the atmosphere for climate change mitigation [7].
Globally, black soils occupy 725 Mha of land, constituting 5.6% of global soils but containing 8.2% of the world’s SOC stocks and accounting for 10% of the world’s SOC sequestration potential [6]. In Indonesia, black soil covers about 6.3 Mha, mainly Central Sulawesi, East Nusa Tenggara, South Sulawesi, Southeastern Sulawesi, and Maluku Provinces [8]. Based on the US Soil Taxonomy [9], black soils are generally categorized within the Mollisols [10]. Indonesian black soils are also Mollisols, including a subgroup of Hapludolls, Haplustolls, Endoaquolls, Argiudolls, Argiustolls, Rendolls, Calciustolls, Haprendolls, and Epiaquolls [8].
In Indonesia, black soils are found under forests, shrubs, and grasslands; however, in some areas, this land cover has been cleared for agricultural dryland, paddy fields, and home gardens [11]. Previous studies indicate that changing land cover and intensive use causes changes in black soil properties, soil quality, and chemical and biological soil processes [12]. The forests’ conversion into agricultural land decreases black soil’s structural stability. It reduces the levels of organic carbon, nitrogen, and phosphorus, thereby increasing the risk of soil erosion in Northeast China [13]. Intensive farming is prone to soil erosion, dehumification (losing stable aggregates and organic matter), and anthropogenic soil acidification [14]. In Uttarakhand, India, the monoculture farming of black soils has a destructive impact on soil health, production potency, water pollution, land degradation, and biodiversity loss, among others [15].
Understanding soil property change requires a large dataset from multiyear and multi-location field research. However, such data are rare in developing countries such as Indonesia. Meanwhile, legacy data from soil surveys have become global attention, where several agencies and researchers develop and maintain legacy soil datasets [16,17]. These legacy soil data then are based input for advanced soil studies [18,19,20,21]. These legacy data also have the potential to asses soil property change due to land-cover/use change in black soils to address research questions, such as (i) what soil property is sensitive to land use and management changes?; (ii) what is the change direction for a given soil property?; (iii) what type of land use causes less change in soil properties?; and (iv) what management option maintains or enhances soil properties? The preferred land use types should cause less change in soil properties for black soil conservation.
This study aimed to compare the mean difference in soil properties between two land-cover/use types using legacy soil survey data. The specific objectives of this study were to identify (i) whether the magnitude of the mean difference in soil property between two land-cover/use types is large, medium or small, (ii) whether the observed mean difference in soil property of two land-cover/use types is statistically significant, and (iii) whether a large mean difference in soil property is also statistically significant. The findings of this study provide valuable knowledge for selecting the best land-use type and its management strategies. Moreover, this study demonstrates other practices using legacy soil survey data to monitor soil property change through effect size analysis and Welch’s t-test.

2. Materials and Methods
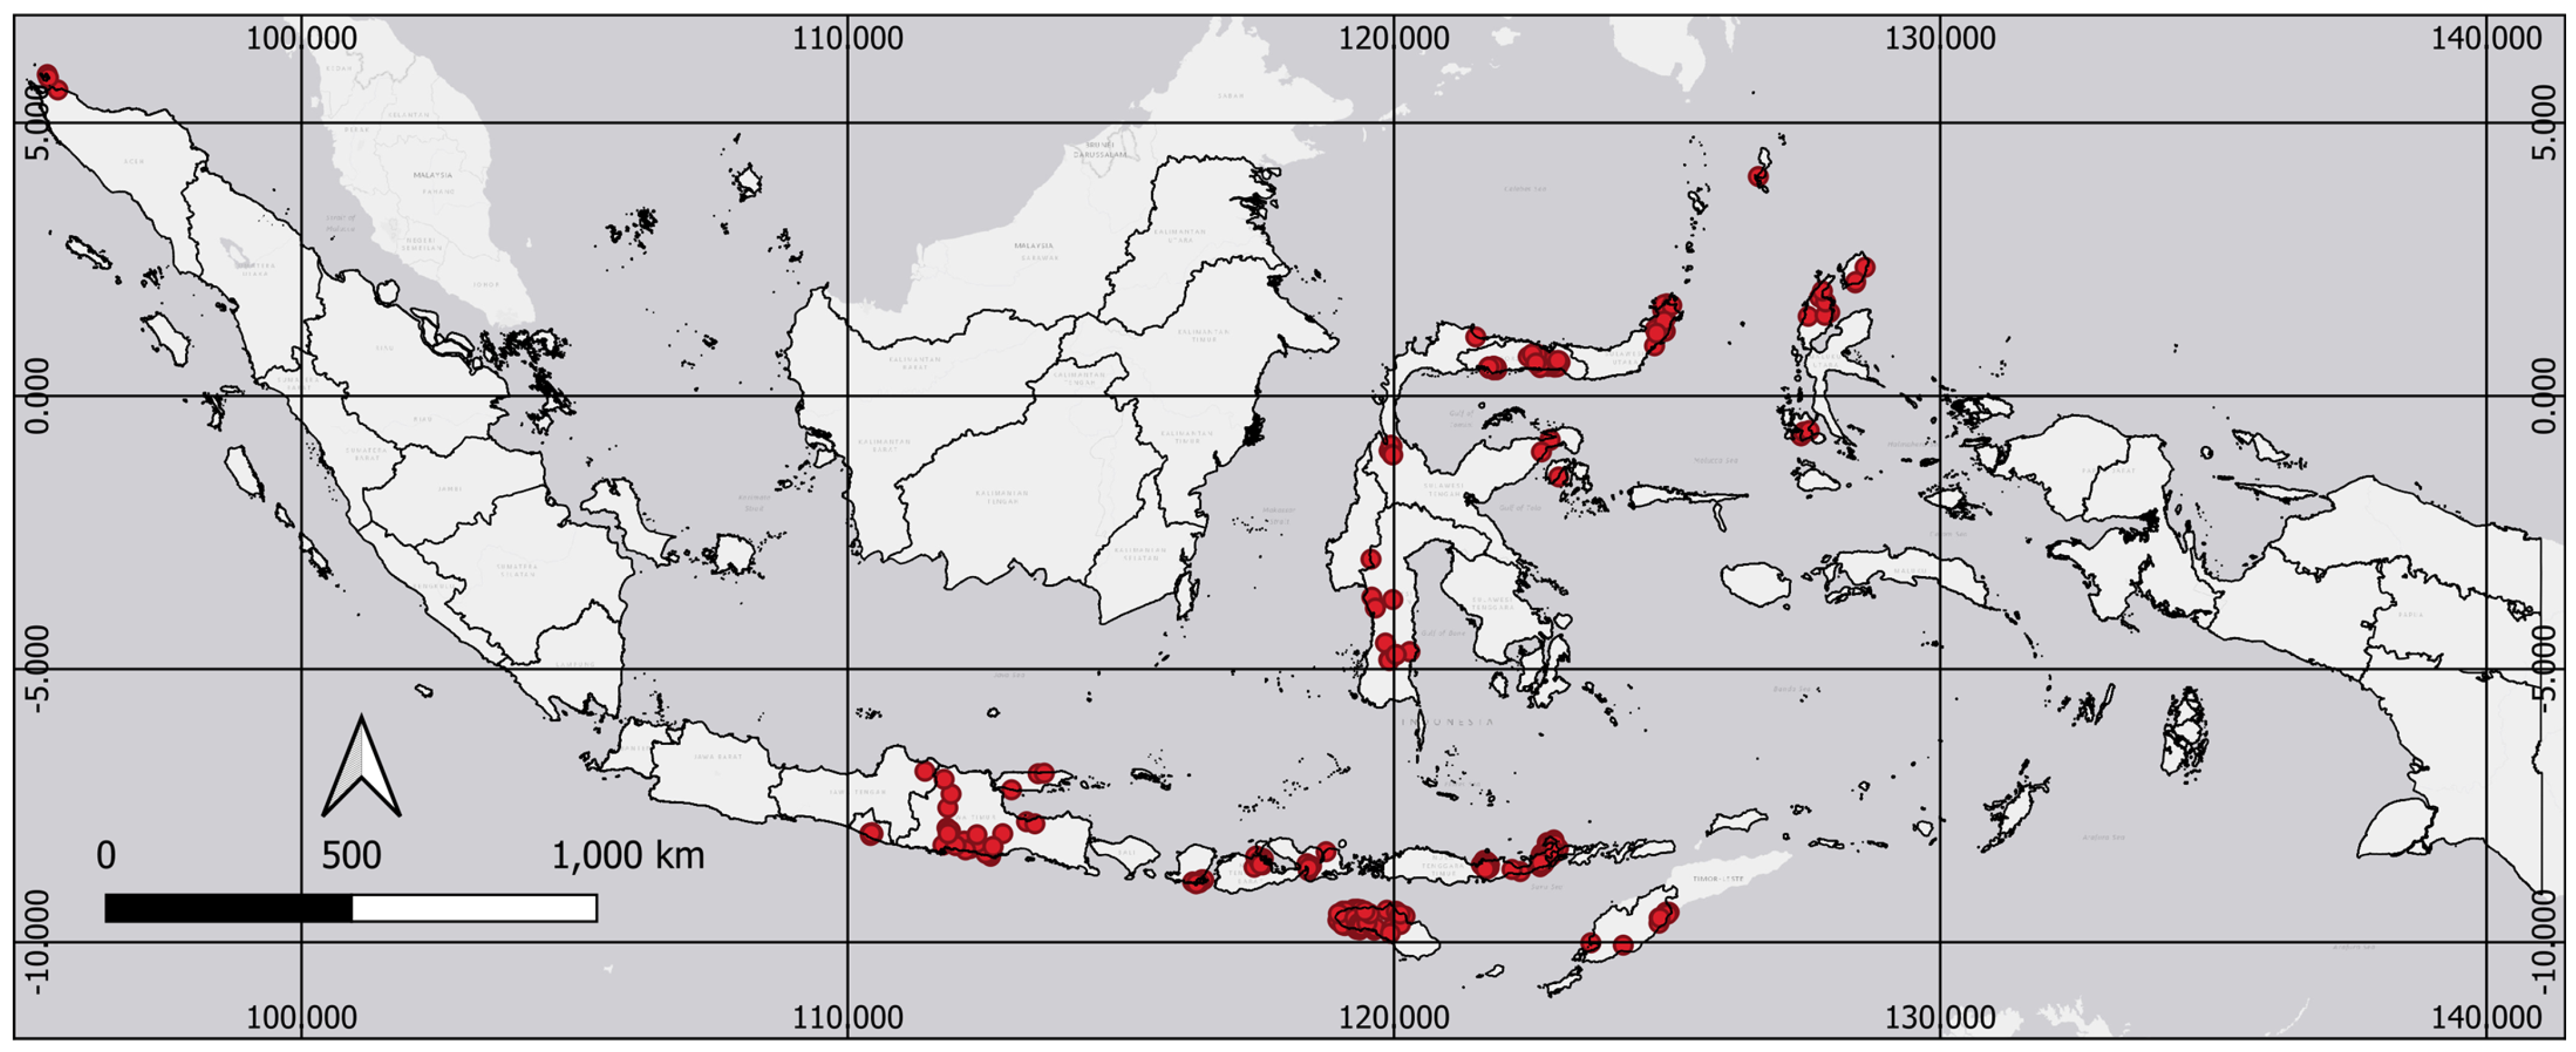
2.1. Dataset

This study used a black soil dataset developed by Sulaeman et al. [11] from 291 locations, sampled from 1994 to 2017 (Figure 1). They collated soil profiles of Mollisols from articles, technical reports, theses, existing datasets, and their soil survey data. The dataset contains the following: id, initials of soil observation, latitude, longitude, altitude, slope, land-use type, parent material, soil name according to the Soil Taxonomy subgroup, administrative name (village, district, regency, province), soil horizon designation, upper boundary, lower boundary, Munsell color (hue, value, chroma), particle size distribution (sand, silt, clay), pH, soil organic carbon (SOC), total nitrogen (TN), C/N ratio, total P2O5, total K2O, Olsen P2O5, exchangeable cations, the sum of bases, cation exchange capacity (CEC), base saturation (BS), bulk density (BD), total pore space, rapid drainage pores, slow drainage pores, water retention, and available water. The dataset secures 345 soil profiles, but only 142 profiles have physicochemical data.
This study used 142 black soil datasets and selected only 10 soil properties, grouped as stable and regulated. Stable soil properties are particle size distribution (namely, the sand fraction (sand), silt fraction (silt), and clay fraction (clay)) and the soil organic carbon content (SOC). The particle size distribution takes over 100 years to change [22]; hence, it is considered stable. The SOC is regarded as a stable soil property because it is one of the black soil criteria, where a minimum SOC of 0.6% was used to consider the tropical soils as black soils [1]. Stable soil properties control regulated soil properties, namely total nitrogen (TN), soil pH (PH), available P2O5 (AP), exchangeable Ca (XCa), exchangeable Mg (XMg), exchangeable K (XK), and exchangeable Na (XNa).
The particle size distribution was determined using the pipet method; meanwhile, soil organic carbon was measured using the Walkley and Black method, and total nitrogen was determined using the Kjeldahl method. The soil pH was extracted by water (soil: water = 1:5) and measured using a pH meter. The available P was determined using the Olsen method with NaHCO3 0.5M pH 8.5 and then measured by the UV–VIS spectrophotometer. The exchangeable cations (Ca, Mg, K, Na) were extracted using NH4OAC 1M pH 7 and then measured by Atomic Absorption Spectroscopy. More details on laboratory methods are provided in Balittanah [23]. Table 1 shows the code for soil properties, units, and laboratory methods used to determine each soil property.
The soil samples were from black soils, which originated mainly from alluvial, limestone, andesite, and tuff [11] and developed under tropical monsoon and savannah climates. Naturally, these black soils are covered by tropical grassland (GS), shrubland (SB), and forests (HT). Soil survey data indicate that these soils are used by smallholder farmers to grow food crops (e.g., rice, maize, cassava) in agricultural dryland (TG) and paddy fields (SW) [11]. Other smallholder farmers use this soil for monocropping permanent tree crops in monocropping home gardens (KB) or for mixed cropping, combining permanent tree crops, food crops, medicinal crops, and vegetables in mixed-cropping home gardens (KC). This type of home garden is a form of agroforestry (multistorey, shade), in contrast to cropland in the agricultural dry fields and paddy fields. In addition, there are plantations (teak, coconut, etc.) in black soils managed by enterprises intensively. In this study, we selected only land-cover and land-use types with more than five sample numbers: HT, SB, KB, KC, TG, and SW. The grassland and plantation were excluded from this study: grassland has fewer than 5 sample numbers, and there is no data available for plantations.

2.2. Statistical Analysis

For two independent land-use types, we determined the mean difference in a given soil property using Cohen’s d index to evaluate the effect size and the t-test to assess the significance of the difference. Cohen’s d index [24] works when both land-use types have the same number of samples. If the number of samples differs, the Hedges’s g-index is used. Cohen’s d index is calculated using the formula [24]
Cohen s   d = X 1 ¯ X 2 ¯ n 1 1 S 1 2 + n 2 1 S 2 2 n 1 + n 2 2
Meanwhile, the Hedges’s g-index is calculated using the following formula [25]:
Hedges s   g = Cohen s   d × 1 3 4 n 1 + n 2 9
where X 1 ¯ = mean of the soil property under land-use type 1, X 2 ¯ = mean of the soil property under land-use type 2, S 1 = standard deviation of the soil property under land-use type 1, S 2 = standard deviation of the soil property under land-use type 2, n 1 = number of samples for the soil property under land-use type 1, n 1 = number of samples for the soil property under land-use type 2.
In this study, for a given soil property, the sample number was not the same between two land-use types; hence, we used Hedges’s g-index. For the interpretation, the effect size of the mean difference is small if 0.2 ≥ |g| < 0.5, medium if 0.5 ≥ |g| < 0.8, and large if |g| ≥ 0.8 [24,26].
Since Hedges’s g-index compared two land-use types, we used Welch’s t-test, rather than the F-test (analysis of variance), to determine if the mean difference in soil property was statistically significant. Welch’s t-test was selected in this study rather than the Student’s t-test because the sample number was small, less than 40, and unequal between land-use type and unequal variance [27].
In Welch’s t-test, the null hypothesis (Ho) was that the two means of soil properties are equal between two land-use types, and the alternative hypothesis (H1) was that the true difference in means between groups is not equal to 0. This study used an alpha level of 0.05 for a significant difference. Welch’s t-statistic was calculated using the following formula [28]:
t = X 1 ¯ X 2 ¯ ( S 1 2 n 1 + S 2 2 n 2 )
where X 1 ¯ = mean of the soil property under land-use type 1, X 2 ¯ = mean of soil property under land-use type 2, S 1 = standard deviation of the soil property under land-use type 1, S 2 = standard deviation of the soil property under land-use type 2, n 1 = number of samples of the soil property under land-use type 1, n 1 = number of samples of the soil property under land-use type 2. Statistical analysis was assisted by R [29], and the package of esc version 0.5.1 [30] was used for effect size computation.

3. Results

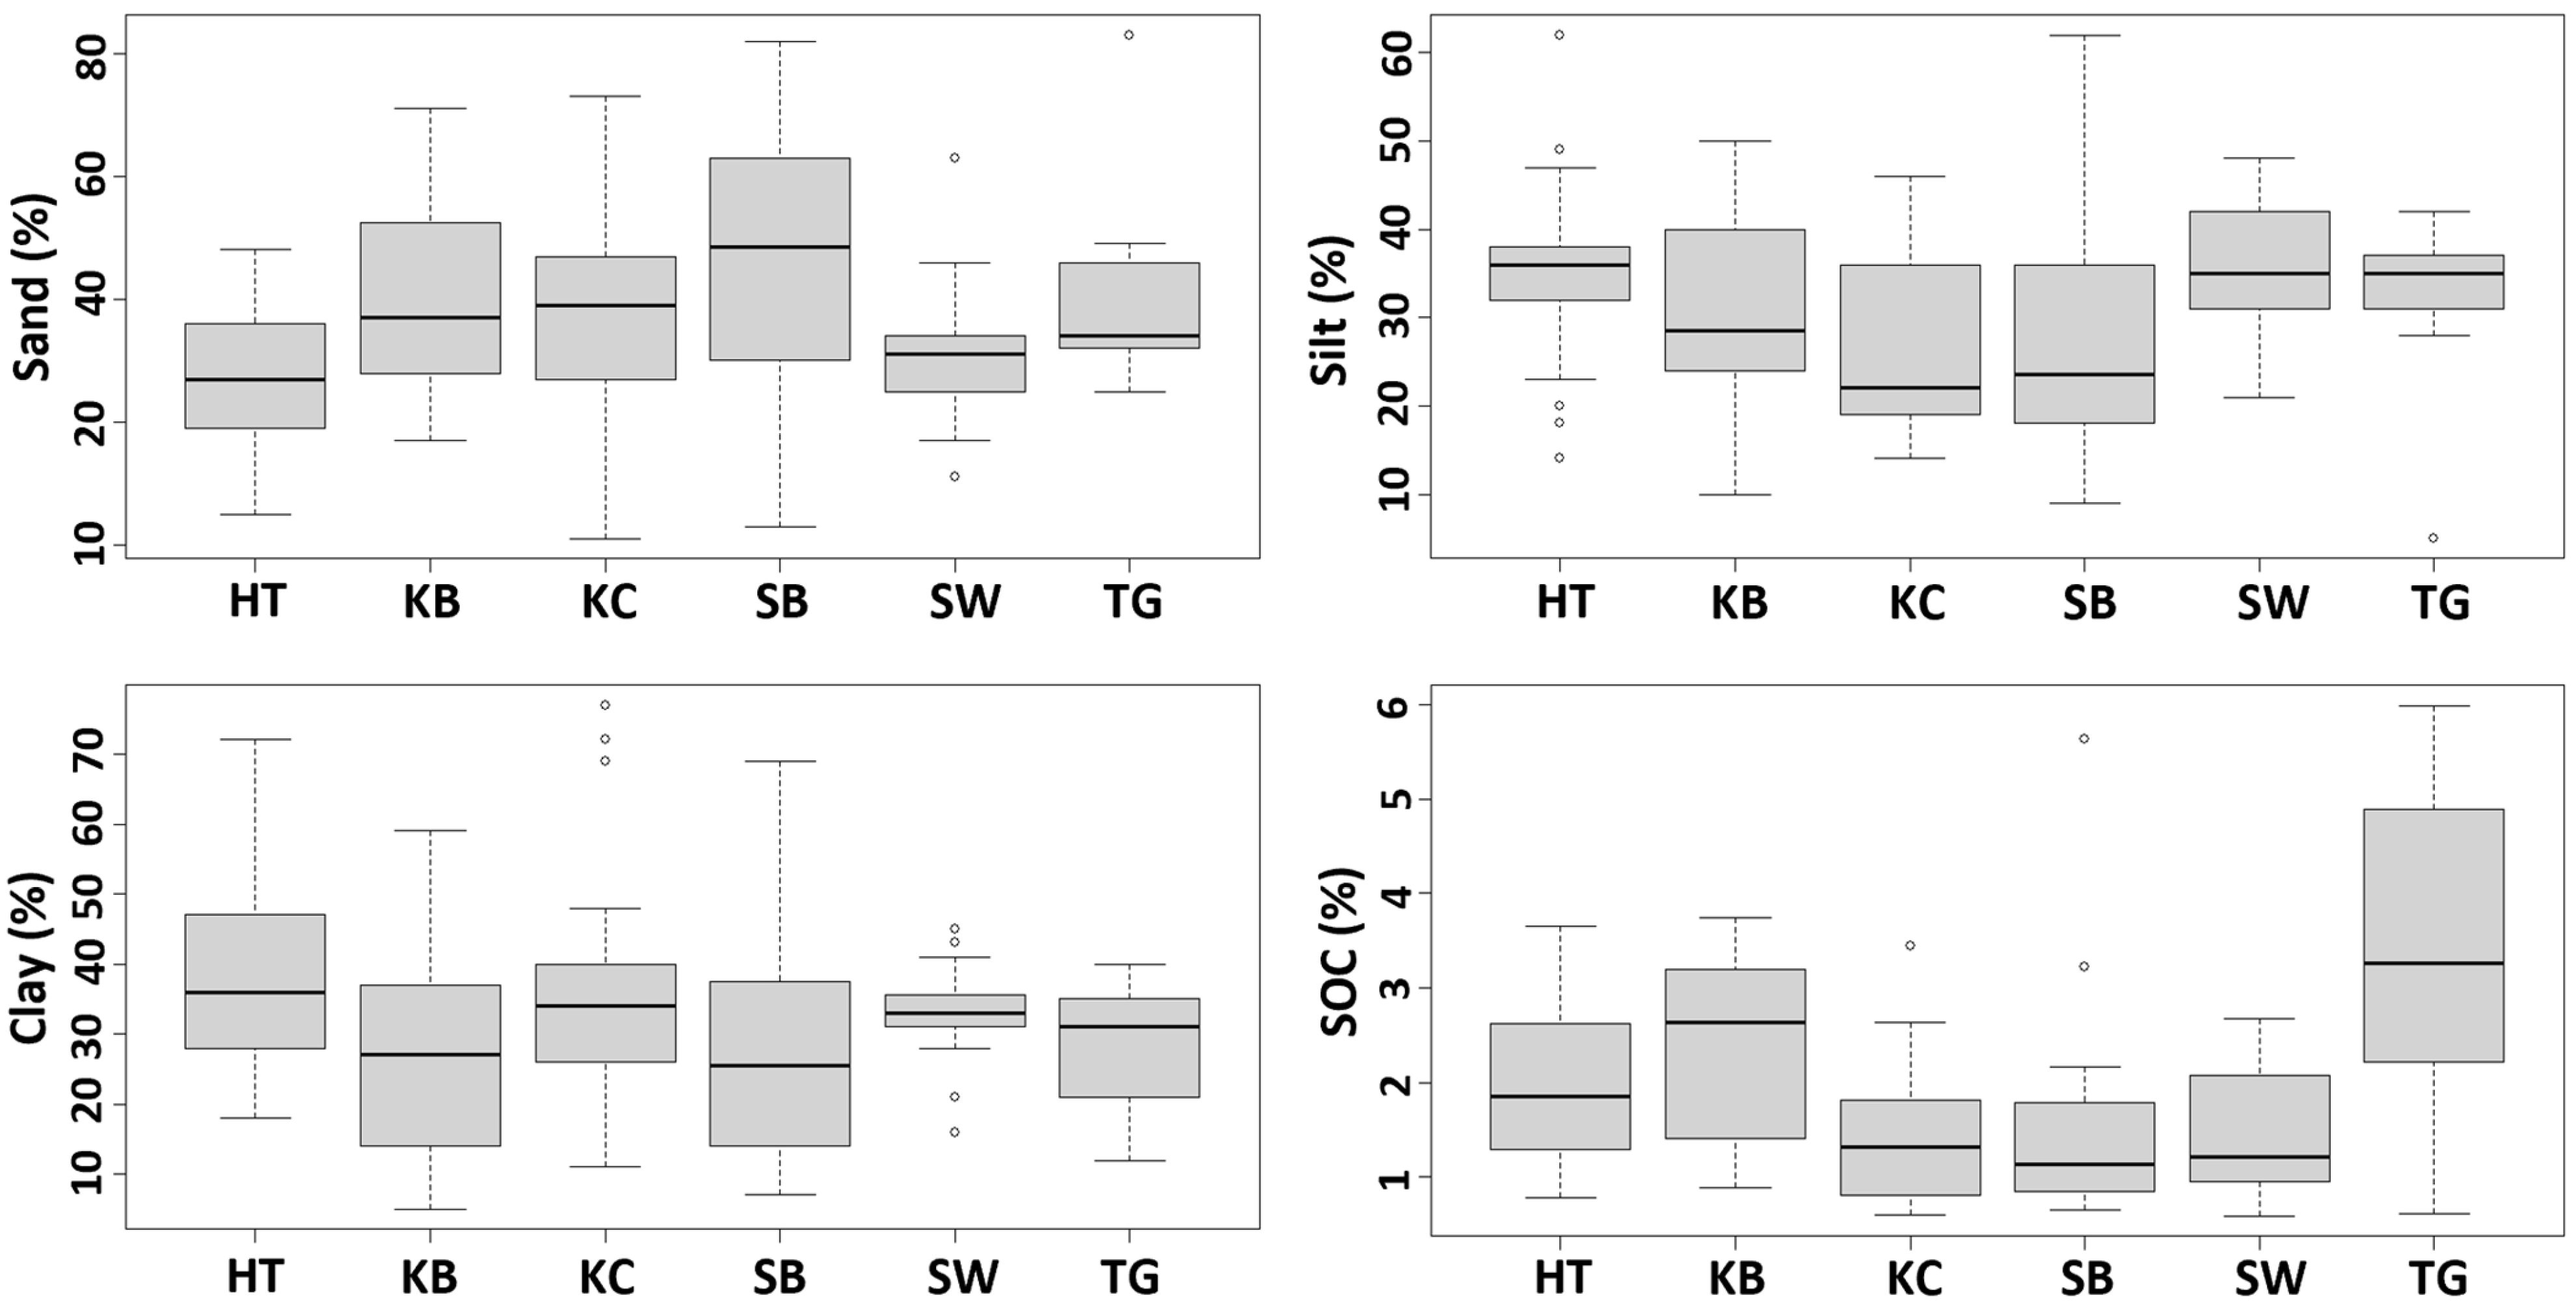
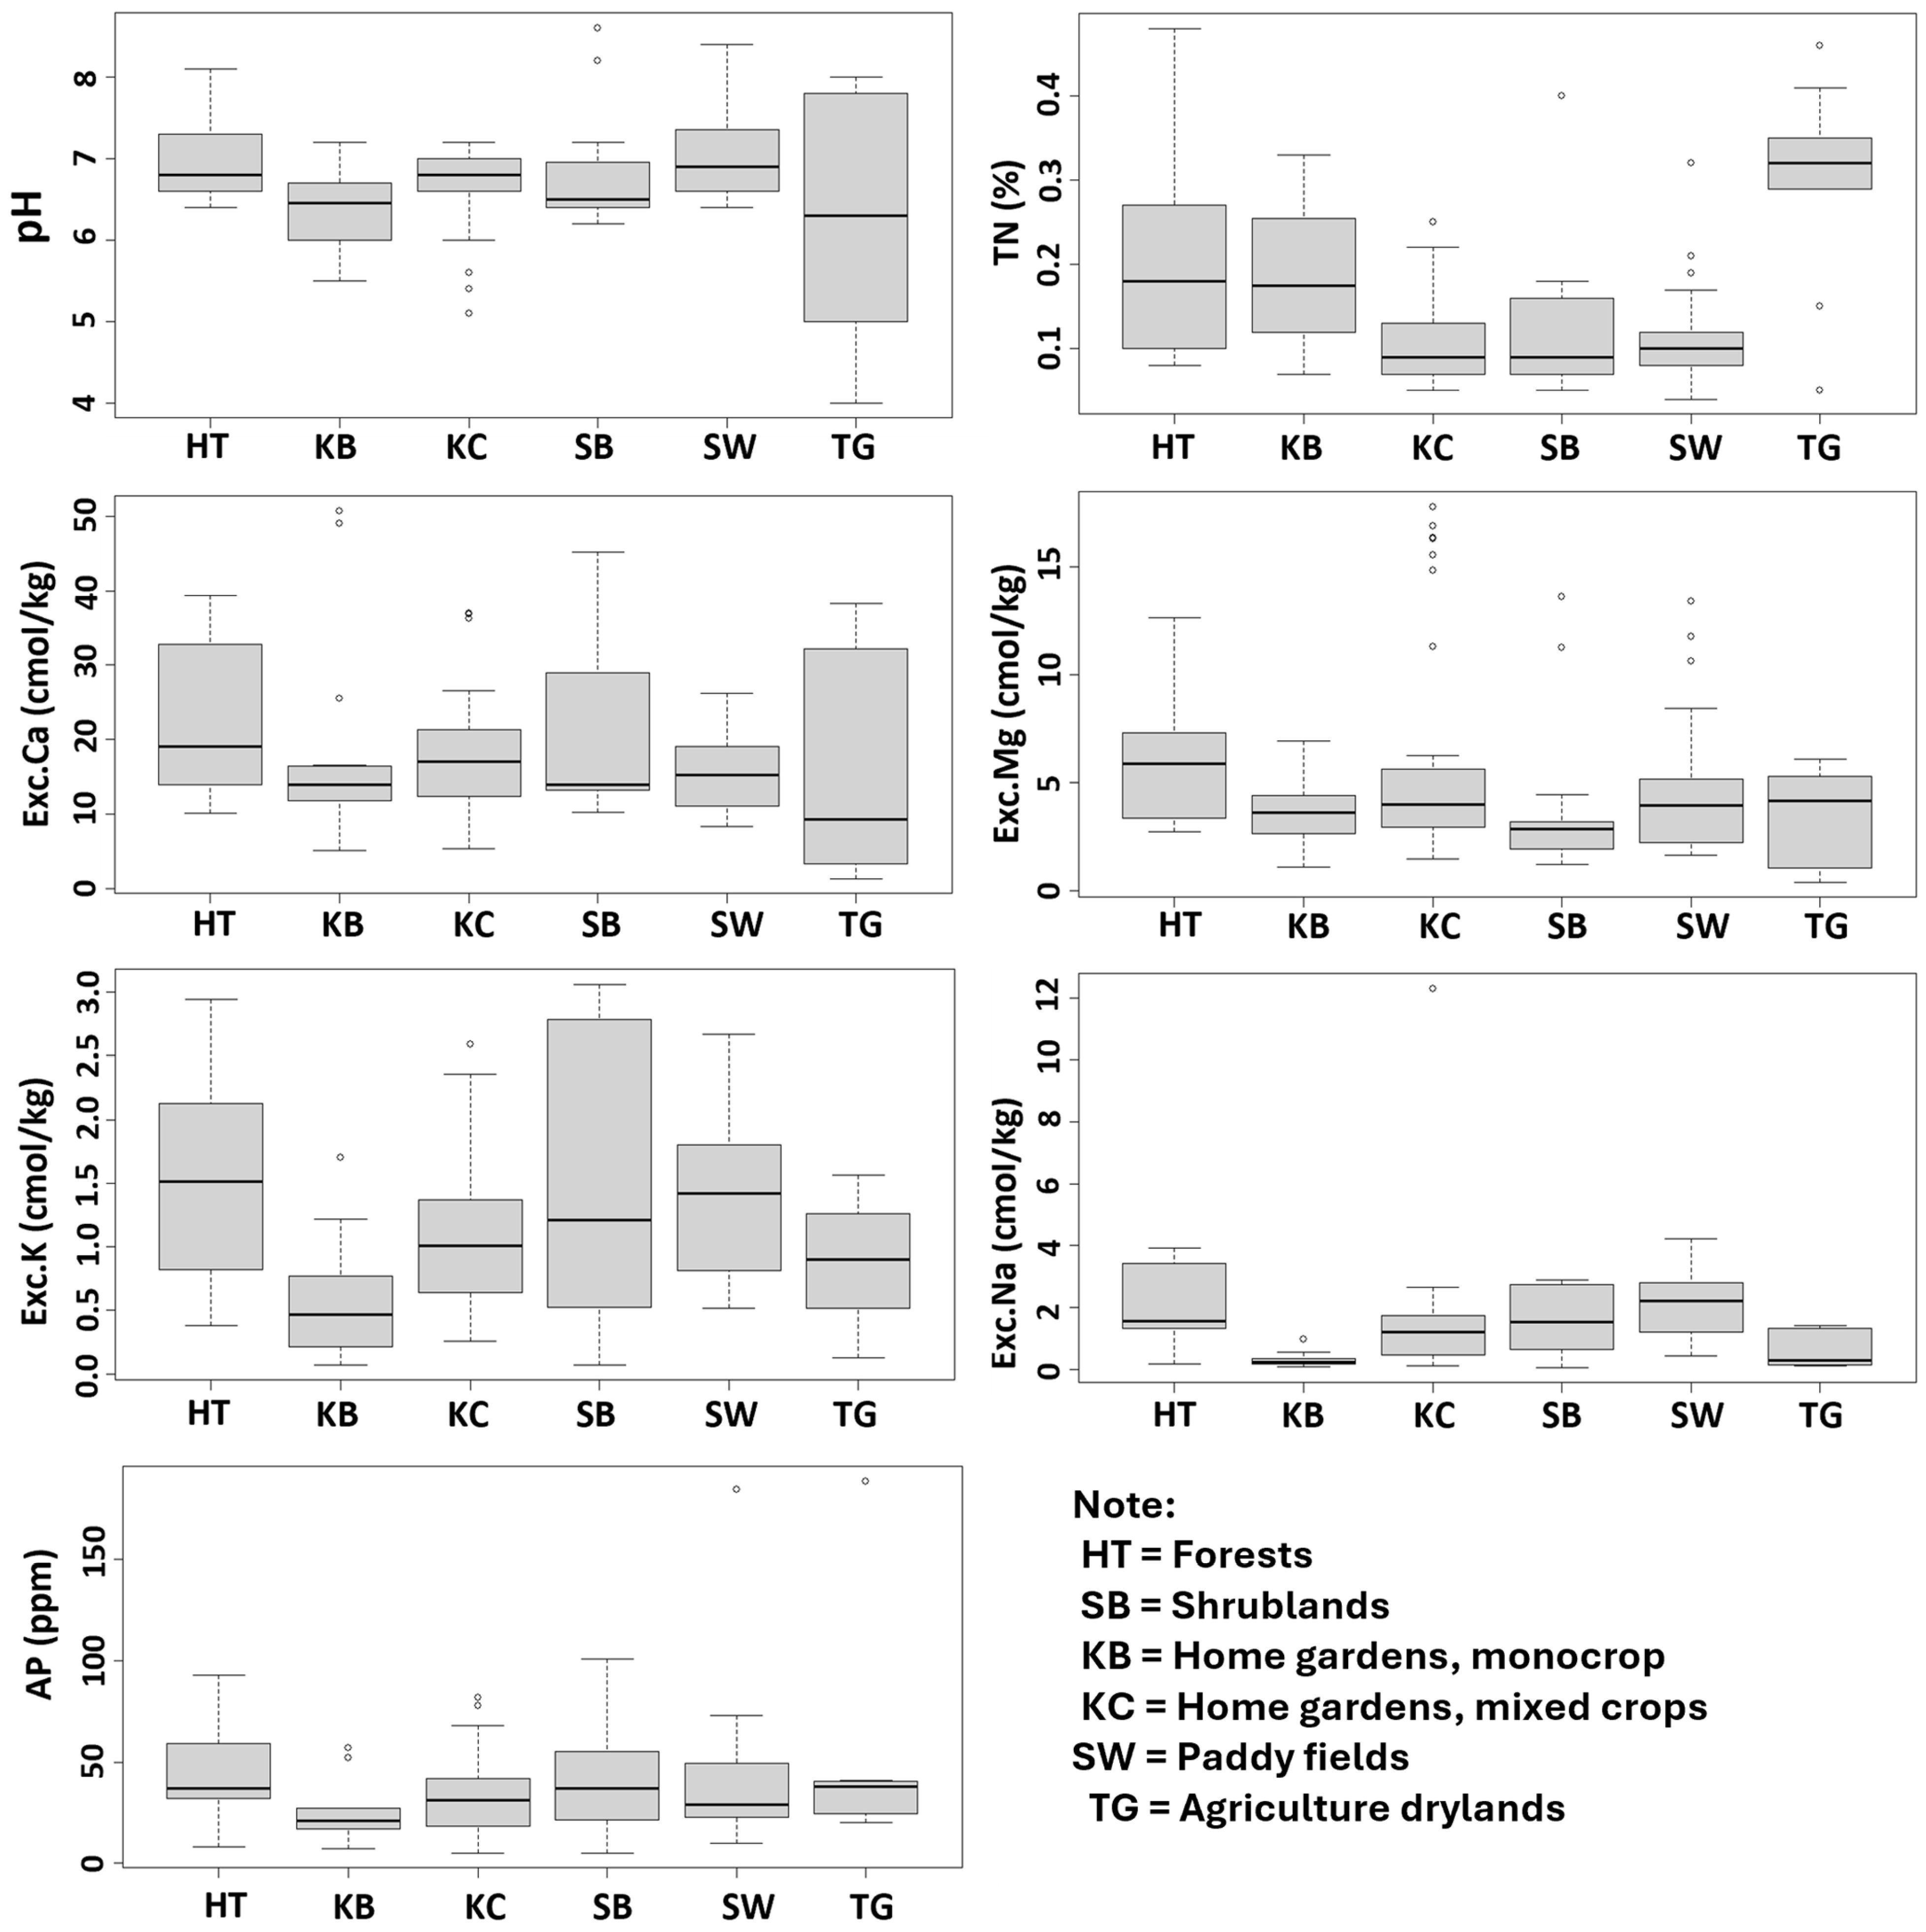
3.1. Soil Property Variation Across Land-Use Types

Figure 2 presents a boxplot of stable black soil properties grouped by land-cover types (HT, SB) and agriculture land-use types (KB, KC, TG, SW). The number of samples, mean, standard deviation (SD), and coefficient variation (CV) of soil properties across land-use types are presented in Appendix A. The sand content (sand) of black soils varies with land-use types, with the median ranging from 27% to 39%. Black soils under SB exhibit the highest sand content (median = 48.5%) and high variation (CV = 55%), followed by black soils under KC (median = 39%), but with high variation (CV = 49%). The sand content (sand) controls porosity, with higher sand content leading to greater porosity compared to lower sand content.
The silt content (silt) of black soils also varies with land-use types, with the median ranging from 22% to 36%. Black soils under HT, TG, and SW show a similar silt content (medians of 36%, 35.5%, and 35%, respectively). The lowest silt content is found in black soils under KC, about 21%. Meanwhile, the black soils under SB show the highest silt variation (CV = 58%) among all land-cover and land-use types.
The clay content (clay) of black soils also varies, with the median ranging from 25.5% to 36%. Black soils under KB (CV = 63%) and SB (CV = 57%) show a higher clay content variation compared to other land-use types. Black soils under HT have the highest clay content (median = 36%), while black soils under SB show the lowest clay content (median = 25.5%). These findings indicate that each land-use type has a distinct variation in soil texture class that influences other soil properties.
The soil organic carbon content (SOC) is the primary indicator of black soil; however, the SOC varies among land-cover/use types, with a median ranging from 1.1% to 3.3%. Black soils under TG show a higher SOC (median = 3.3%), followed by black soils under KB (median = 2.4%) and under HT (median = 2.1%). The black soils under SW, SB, and KC show a lower SOC, namely a median of 1.2%, 1,1%, and 1.3%, respectively. Although high in SOC, the soil under TG also shows a higher variation (CV = 36%). The SOC and clay probably control variations in other soil properties (namely pH, TN, AP, and exchangeable cations) by controlling moisture content, porosity, and microbial activities.
Figure 3 shows a boxplot of regulated soil properties of black soils: pH, TN, AP, and exchangeable cations (Ca, Mg, K, Na) grouped by land-cover/land-use types. Appendix A presents the number of samples, mean, standard deviation (SD), and coefficient variation (CV) of soil properties across land-use types. The black soils under SW show a higher pH (median = 6.9), whereas black soils under TG have the lowest pH (median = 6.3) and the highest variation (CV = 27%). This pH level is expected as the black soils are derived from calcareous parent material and intermediate-to-basic volcanic material. The observed pH variation is due to management, with soil under TG showing greater variation than that under natural cover (HT, SB) or permanent tree crops (KB and KC).
The black soils under TG show the highest TN (median = 0.32%), followed by HT (median = 0.18%) and KB (median = 0.18%). Meanwhile, black soils under KC, SB, and SW show a lower TN, with a median of 0.09%, 0.09%, and 0.10%, respectively. Meanwhile, all land-cover/use types for AP show a lower median than natural cover (HT, SB). Black soils under HT have the highest median (37 ppm P2O5) among all land-use types.
For XCa, black soils under HT have the highest median (19.1 cmol(+)/kg), whereas black soils under TG have the lowest median (9.34 cmol(+)/kg). Meanwhile, the median value of XMg ranges from 3.6 cmol(+)/kg to 5.9 cmol(+)/kg, indicating low variation among land-cover/land-use types. For XK, the lower variation is observed in black soils under agricultural uses, compared to natural land cover (HT, SB), except SW, which is almost the same as HT. For XNa, black soils under HT and SW have a higher median compared to other land-use types, with a median of 1.54 cmol(+)/kg and 2.2 cmol(+)/kg, respectively.

3.2. Effect Size and Statistical Significance of Mean Differences

Table 2 shows Hedges’s g-index of the mean difference between two land-use types for stable soil properties. The absolute index ranges from 0.00 to 1.63; the lowest is for the sand fraction in KB versus TG, while the highest is for the SOC in TG versus SW. The negative index means that the first land-use type has a lower level of the soil property than the second one, whereas the positive index means that the first has a higher level of the soil property than the second one. The mean difference between the two land-use types, when significant, is indicated by an asterisk, tested at the alpha level of 0.05.
For sand, large (|g > 0.8|) and significant mean differences are found when comparing SB or KB to HT, but large and no significant differences are observed when comparing TG to HT (Table 2). Large and significant mean differences are found in the silt fraction when comparing KC to HT or SW to KC. Meanwhile, a large mean difference is not observed in the clay fraction. Large mean differences in SOC are observed when comparing TG to HT, SB, or KC; SW to KB or TG; and KC to KB. However, this difference is not significant when comparing TG to HT. The large index (|g > 0.8|) does not necessarily mean the difference is statistically significant. Thus, the sensitivity of both indicators is different for a given stable soil property and land-use pair.
Table 3 shows Hedges’s g-index of the mean difference between land-cover and land-use types for regulated soil properties. For the PH, the absolute g-index ranges from 0.17 to 1.23. Large and significant mean differences are observed in the HT vs. KB and KB vs. SW comparisons, while large differences but insignificant ones are in the HT vs. TG and TG vs. SW comparison. Meanwhile, for TN, the absolute g-index ranges from 0.00 to 2. 62. The large and significant differences in TN are observed in 10 comparisons, namely HT vs. KC, HT vs. TG, HT vs. SW, SB vs. KB, SB vs. TG, KB vs. KC, KB vs. TG, KB vs. SW, KC vs TG, and TG vs. SW. For AP, the absolute g-index ranges from 0.02 to 0.98, while the large (|g > 0.8|) and significant mean differences are found when comparing KB to HT or KB to SB.
For XCa, the absolute g-index ranges from 0.03 to 0.79, while medium and significant mean differences are found in the HT-to-KC or HT-to-SW comparison. For XMg, the absolute g-index ranges from 0.00 to 0.98, while the large (|g > 0.8|) and significant mean differences are found when comparing KB to HT or TG to HT. For XK, the absolute g- index ranges from 0.11 to 1.51, while the large (|g > 0.8|) and significant mean differences are found in the HT vs. KB, SB vs. KB, KB vs. KC, KB vs. SW, and TG vs. SW comparisons. For XNa, the absolute g-index ranges from 0.00 to 2.14, while the large (|g > 0.8|) and significant mean differences are found in the HT vs. KB, HT vs. TG, SB vs. KB, SB vs. TG, KB vs SW, and TG vs. SW comparisons. There is a large mean difference in XNa between KB and TG, but it is statistically insignificant. Thus, the sensitivity of both indicators is different for a given regulated soil property and land-use pair.

3.3. Sensitive Soil Properties Toward Land-Use Change

Table 4 lists soil properties with medium-to-large effect size (|g| > 0.5) and statistically significant mean differences at the alpha level of 0.05 for a given pair of land-use types. Each pair of land-use types shows a different number of soil properties, where eight soil properties differ in the HT vs. KC comparison, namely silt, SOC, TN, AP, XCa, XK, PH, and sand. Other pairs have only one soil property but different soil property names, namely SB vs. KC (for clay), SB vs. TG (for TN), and KB vs. TG (for TN). The rest of the pairs have six, five, four, and three different soil properties but different compositions of soil property names. The SB vs. SW pair has no soil property, meaning that the mean soil property difference is small or statistically insignificant in this pair.
Table 4 also shows the frequency of a soil property as a differentiating factor in land-use type comparisons. TN becomes the most frequently observed soil property in the medium to large, statistically significant mean differences in land-use type comparisons, as observed in 10 out of 15 pairs. SOC and XK rank second and are shown in six out of 15 pairs. In decreasing order of frequency, soil properties with medium-to-large and significant mean differences are TN (10) > SOC (6) = XK (6) > XMg (4) = AP (4) = PH (4) = XNa (4) > Sand (3) = Silt (3) = Clay (3) > XCa (2). Thus, total nitrogen (TN) has the highest sensitivity, and exchangeable Ca (XCa) is the least sensitive to change with land-cover/use change in tropical black soils.

4. Discussion

This study categorizes soil properties into stable (Figure 2) and regulated ones (Figure 3). Particle size distribution is considered a stable soil property because it takes over 100 years to change [30]. Meanwhile, soil organic carbon is the criteria for black soil identification [1]. Both the particle size distribution and the soil organic carbon content regulated other soil properties, as presented in Figure 3. As observed in both figures, the variation in each soil property is due to climate setting, parent material, topography, and management [11]. As stated earlier, black soils are found in tropical monsoons and savannah climates, originating from limestone, calcareous sedimentary rock, and intermediate and mafic volcanic rock. Black soils are found in lowlands and medium to highlands [11]. Our field observations found that intensive management (soil organic matter application, fertilizer and pesticide application, intensive tillage, etc.) is common in paddy fields, agricultural dryland, and monocropping home gardens compared to mixed cropping home gardens.

4.1. Land-Cover/Use Changes Trigger Changes in Soil Property Level and Direction

Our study confirmed that the change in land-use type caused the change in the level of soil properties. Such soil property change occurs because of (i) accelerated soil erosion due to soil cover decrease, (ii) intensive soil tillage that disrupts soil structure, and (iii) changes in the level of organic matter and fertilizer inputs. The nature and extent of these soil property changes depend on soil type, land-use type and management intensity, and climatic conditions [31]. Land-use types that maintain similar levels of soil properties to those of natural land cover (HT, SB) assist in soil carbon and black soil conservation. Soil conservation is essential for determining and achieving agricultural sustainability by increasing soil productivity and carbon stock. Organic carbon stability is influenced by land-use management practices and, to some extent, soil type [32]. Extensive research has been conducted to ensure that land-use changes do not disrupt the balance of soil organic carbon at global and regional levels [33,34,35]. Moreover, Zhang et al. [32] found that carbon availability increases more in paddy fields compared to dryland systems.
Table 4 shows the direction of soil property change, where the direction of change for a given soil property varies depending on the pair of land-use types. For example, the direction of SOC and TN is positive when comparing agricultural uses to natural forests (the HT vs. KC and HT vs. SW comparisons) or monocropping home gardens (KB vs. KC and KB vs. SW). It indicates that KC and SW have lower SOC content than forest and monocropping home gardens. As another example, the XK direction is positive when comparing agricultural uses to natural forests (the HT vs. KB, HT vs. KC, and HT vs. TG comparisons) or shrubland (the SB vs. KB comparison). These findings demonstrate that the direction of change in soil property is specific to the land-use types being analyzed.
In general, our study revealed that dryland-based crop cultivation (KB, KC, and TG) significantly changes soil properties compared to natural land cover (HT, SB) and paddy fields (SW), with the size of the effect ranging from medium to large. Variations in land management practices play a critical role in determining soil nutrient availability, such as N, P2O5, and K2O [36]. The monocropping home gardens (KB) showed the most significant control over soil properties, mainly AP and SOC, with larger effect sizes and more significant differences compared to other land-use types. Such patterns were also observed in mixed home gardens (KC) compared to paddy fields (SW) and in shrubland compared to paddy fields (SW). Compared to dryland, the paddy fields negatively influenced available phosphorus (AP), with a medium-to-large effect size. Mohana et al. [37] reported that paddy fields significantly affect the content of organic carbon, total nitrogen, and available K. This pattern is also found in forests, compared to mixed gardens and shrubland. Natural forests significantly increase carbon stock and total N [38]. Conversely, deforestation significantly reduces soil nutrients, including N, P, K, and SOC [39].
Our study also confirms that the sensitivity level of soil properties to changes in land use varies significantly. Soil properties are constantly changed when soil conditions are disturbed by introducing a new land use type. As presented in Table 4, the SOC and XK are particular soil properties frequently changing when land-use type changes. The SOC and XK show changes in six of 15 pairs of land-use types. Other sensitive soil properties affected by land-use change include AP, PH, XMg, and XNa. These soil properties show high differences in four pairs of 15 comparisons. Land-use changes have been shown to affect organic carbon, organic matter, available N, available P, and available K in Mollisols [12]. Changes from forest to orchards, agriculture, or agroforestry reduce the amount of N, C, and P in the soil [40]. However, Mollisols under grassland has the largest SOC compared to those under cultivation or forest [41]. All Mollisols regions worldwide face the challenge of SOC loss, and this trend could negatively impact global climate change. Therefore, it is crucial to take appropriate actions to maintain and enhance the organic carbon content in Mollisols [42].

4.2. Sensitivity of Hedges’s g-Index and Welch’s t-Test

This study employed Hedges’s g-index and Welch’s t-test to evaluate the difference in soil properties between two land-use types. As shown in Table 2 and Table 3, a small effect size is consistently found to have a statistically insignificant mean difference. However, for medium-to-large effect sizes, some mean differences are statistically significant, while others are not. This indicates that Hedges’s g-index can detect mean differences better than Welch’s t-testing. These findings also confirm that Hedges’s g-index of 0.5 is a critical threshold for determining whether a mean difference is statistically significant.
Hedges’s g-index is rarely applied in soil science but is common in medical science [43,44]. However, Hedges’s g-test is frequently used for meta-analyses involving large and diverse datasets [45,46,47]. Unlike traditional analysis of variance, Hedges’s g-index does not require clarification regarding the normality assumption that applies in the analysis of variance. Furthermore, Hedges’s g-index allows for the comparison of the mean of two groups with unequal sample numbers, making it a flexible and robust tool for data analysis.

4.3. Practical Implications and Future Directions

Our study shows that agricultural land-use types (KB, KC, TG, SW), compared to forest (HT) or shrubland (SB), lead to significant changes in soil properties, with many soil properties exhibiting change in both levels and directions. The inappropriate land-use changes may degrade soil properties; therefore, an appropriate and effective intervention in the land-use systems should be implemented to amend soil properties [48]. Thus, our study provides empirical data identifying land-use types that result in minimum soil property changes or improve black soil properties in the future.
Our findings highlight that mixed-cropping home gardens improve soil properties. Hence, our result provides additional evidence of the benefit of multi-strata farming and permanent crops, which are better than others in managing black soils. With these home gardens, the potency of carbon sequestration is higher than in dryland or paddy fields, while also increasing soil health and farming resilience.
Our study also reveals the sensitivity of soil properties to changes associated with land-cover/use changes. This result is essential when selecting indicators for assessing soil health, land-use impact, and soil change in tropical regions. The more sensitive soil property is preferable as a soil health indicator. Based on our findings, total nitrogen, soil organic carbon, and exchangeable K are promising primary indicators for detecting black soil health and potential degradation.

4.4. The Limitation of This Study

This study used legacy soil data collated from soil survey projects across different years and for various purposes. Despite these differences, the same soil analysis procedure was applied for each soil property in soil laboratory analysis. The land use comparison originated from different times, climates, parent materials, and islands. However, we grouped them into one group of land-use types. In addition, when comparing one pair of land-use types, the exact location of the land-use type may be far and on different geomorphic surfaces.
Soil samples were also taken from different years. As climatic conditions may differ yearly, these conditions were not accounted for in this study, and the climate was assumed to be constant. Hence, soil property changes due to climate change (as rainfall changes) were ignored. Another factor that was overlooked in this study was slope. Slope plays a crucial role in water and energy distribution, and the effect will be more apparent locally. However, this study was conducted on a regional scale, and the slope effect was also ignored.

5. Conclusions

Land-cover/use change alters soil properties, with the extent of the change and directions varying depending on the specific soil properties and land-use types. The effect size of the mean difference in soil properties between two land-cover/use types also varies with soil properties and land-use types, highlighting a unique level and direction of change. A statistically significant mean difference does not necessarily indicate a large difference, since soil properties in a given pair of land-use types show large differences but are statistically insignificant. In decreasing order of frequency, soil properties with medium-to-large and significant mean differences are TN > SOC = XK > XMg = AP = PH = XNa > sand = silt = clay > XCa. The sensitivity of Hedges’s g-index and Welch’s t-test in detecting mean differences varies depending on a given soil property, the land-use type pair being compared, and effect size (medium to large).
A recommended management and conservation strategy option in further black soil utilization is selecting a land-use type that minimizes soil property change. Using black soils for mixed garden and paddy fields results in less impact on soil properties. It triggers small changes to soil properties, more effectively achieves food security, and mitigates climate change in black soils. In addition, legacy soil data are valuable resources for monitoring the change in soil properties due to land-cover/use changes.

Author Contributions

Conceptualization, Y.S. and S.S.; methodology, Y.S.; software, E.M.; validation, T.B., A.S. and N.N.; formal analysis, Y.S. and T.B.; investigation, Y.S., S.S., T.B. and A.S.; resources, E.M.; data curation, Y.S.; writing—original draft preparation, Y.S., S.S., T.B. and A.S.; writing—review and editing, Y.S., S.S., T.B., A.S., E.M., R.N., N.N. and I.V.; visualization, Y.S. and E.M.; supervision, Y.S. and E.M.; project administration, E.M.; funding acquisition, Y.S. and E.M. All authors have read and agreed to the published version of the manuscript.

Funding

This research received no external funding.

Data Availability Statement

Data are available from the corresponding author upon reasonable request.

Conflicts of Interest

The authors declare no conflicts of interest.

Appendix A

Table A1. Brief statistics of 10 soil properties based on land-cover and land-use types.
Land-Use TypeParameterStable Soil PropertiesRegulated Soil Properties
SandSiltClaySOCPHTNAPXCaXMgXKXNa
(………………%……………………) (%)(ppm)(………cmol(+)/kg….……)
Forest (HT)n3737373437373737373737
Mean27.534.937.62.07.00.2043.322.56.01.52.1
SD11.58.813.30.80.50.1120.610.02.70.81.2
CV422535437544844445258
Shrubland (SB)n2020201915201515151515
Mean44.728.726.61.56.80.1242.920.93.91.61.6
SD24.616.615.11.20.70.0828.012.73.61.11.1
CV5558577510666561947371
Monoculture home garden (KB)n1616161616161316161616
Mean40.631.128.32.46.40.1923.918.03.60.60.3
SD17.110.717.81.00.50.0815.213.11.50.40.2
CV423463447446373417977
Mixed home garden (KC)n3737373737373637373737
Mean37.926.635.51.46.70.1132.217.66.01.11.4
SD18.79.614.90.70.50.0519.58.44.90.62.0
CV4936425074760488254137
Agriculture dryland (TG)n99979979999
Mean40.631.927.63.46.20.3053.918.43.40.90.7
SD17.711.010.01.91.70.1360.216.02.30.50.6
CV44343656274311287665690
Paddy field (SW)n1919191919191919191919
Mean30.636.233.21.57.10.1241.615.64.81.42.1
SD11.47.67.00.70.60.0738.85.03.60.61.1
CV372121458569332754452
Note: n = sample number, SD = standard deviation, CV = coefficient of variation in %: low (CV < 15%), medium (15% < CV < 35%), and high (CV > 35%) [49]. For a given soil property, the sample number differs among land-use types. For example, for sand, the sample number is 37 in forests, 19 in shrubland, 16 in monoculture gardens, 37 in the mixed gardens, 8 in agricultural dryland, and 19 in paddies. In general, the sample is small (6 to 37). The sample number also differs among soil properties for the same land-use type. Differences in soil number between soil properties and land-use types are common in legacy soil data. The legacy dataset comes from different soil surveys and mapping conducted with different objectives; hence, the observation intensity and the details could differ. In other words, it is not explicitly designed to ensure that each land-use type has the same number of samples. Accordingly, selecting an analysis method is essential. The t-test is better for small samples than the F-test, which needs homogeneous variance that can be achieved in large sample sizes (>60).

References

  1. FAO Black Soils Definition. Available online: https://www.fao.org/global-soil-partnership/intergovernmental-technical-panel-soils/gsoc17-implementation/internationalnetworkblacksoils/more-on-black-soils/definition-what-is-a-black-soil/en/ (accessed on 8 June 2023).
  2. Durán, A.; Morrás, H.; Studdert, G.; Liu, X. Distribution, Properties, Land Use and Management of Mollisols in South America. Chin. Geogr. Sci. 2011, 21, 511–530. [Google Scholar] [CrossRef]
  3. Wang, H.; Yang, S.; Wang, Y.; Gu, Z.; Xiong, S.; Huang, X.; Sun, M.; Zhang, S.; Guo, L.; Cui, J.; et al. Rates and Causes of Black Soil Erosion in Northeast China. Catena 2022, 214, 106250. [Google Scholar] [CrossRef]
  4. Liu, X.; Burras, C.L.; Kravchenko, Y.S.; Duran, A.; Huffman, T.; Morras, H.; Studdert, G.; Zhang, X.; Cruse, R.M.; Yuan, X. Overview of Mollisols in the World: Distribution, Land Use and Management. Can J Soil Sci 2012, 12, 383–402. [Google Scholar] [CrossRef]
  5. Pozniak, S.; Havrysh, N.; Yamelynets, T. Chernozems of Ukraine and Its Evolution under the Influence of Anthropogenic Factors. Agronomy 2021, 64, 156–161. [Google Scholar]
  6. FAO. Global Status of Black Soils; FAO: Rome, Italy, 2022. [Google Scholar]
  7. Li, R.; Hu, W.; Jia, Z.; Liu, H.; Zhang, C.; Huang, B.; Yang, S.; Zhao, Y.; Zhao, Y.; Shukla, M.K.; et al. Soil Degradation: A Global Threat to Sustainable Use of Black Soils. Pedosphere 2024, 25, 264–279. [Google Scholar] [CrossRef]
  8. Sulaeman, Y.; Cahyana, D.; Husnain; Nursyamsi, D. Spatial Identification of Black Soils in Indonesia. IOP Conf Ser. Earth Environ. Sci. 2021, 757, 012035. [Google Scholar] [CrossRef]
  9. Soil Survey Staff. Soil Taxonomy. A Basic System of Soil Classification for Making and Interpreting Soil Surveys, 2nd ed.; Agricultural Handbook 436; Natural Resources Conservation Service, USDA: Washington DC, USA, 1999. [Google Scholar]
  10. Sorokin, A.; Owens, P.; Láng, V.; Jiang, Z.-D.; Michéli, E.; Krasilnikov, P. “Black Soils” in the Russian Soil Classification System, the US Soil Taxonomy and the WRB: Quantitative Correlation and Implications for Pedodiversity Assessment. CATENA 2021, 196, 104824. [Google Scholar] [CrossRef]
  11. Sulaeman, Y.; Sukarman; Neswati, R.; Nurdin; Basuki, T. Characteristics and Utilization of Black Soils in Indonesia. Sains Tanah 2023, 20, 114–123. [Google Scholar] [CrossRef]
  12. Ram, B.; Singh, A.P.; Singh, V.K.; Luthra, N.; Nath, A. Effect of Different Land Uses on Chemical Properties of Soil in a Mollisol. Pharma Innov. J. 2022, 11, 242–246. [Google Scholar]
  13. Li, H.; Zhu, H.; Qiu, L.; Wei, X.; Liu, B.; Shao, M. Response of Soil OC, N and P to Land-Use Change and Erosion in the Black Soil Region of the Northeast China. Agric. Ecosyst. Environ. 2020, 302, 107081. [Google Scholar] [CrossRef]
  14. Lin, L.; Han, S.; Zhao, P.; Li, L.; Zhang, C.; Wang, E. Influence of Soil Physical and Chemical Properties on Mechanical Characteristics under Different Cultivation Durations with Mollisols. Soil Tillage Res. 2022, 224, 105520. [Google Scholar] [CrossRef]
  15. Ram, B.; Singh, A.P.; Singh, V.K.; Shivran, M.; Serawat, A. Effect of Different Land-Uses Systems on Soil pH, Electrical Conductivity and Micronutrients in Mollisols of Uttarakhand. Biol. Forum–Int. J. 2022, 14, 712–716. [Google Scholar]
  16. Sulaeman, Y.; Minasny, B.; McBratney, A.B.; Sarwani, M.; Sutandi, A. Harmonizing Legacy Soil Data for Digital Soil Mapping in Indonesia. Geoderma 2013, 192, 77–85. [Google Scholar] [CrossRef]
  17. Arrouays, D.; Leenaars, J.G.B.; Richer-de-Forges, A.C.; Adhikari, K.; Ballabio, C.; Greve, M.; Grundy, M.; Guerrero, E.; Hempel, J.; Hengl, T.; et al. Soil Legacy Data Rescue via GlobalSoilMap and Other International and National Initiatives. GeoResJ 2017, 14, 1–19. [Google Scholar] [CrossRef]
  18. Kempen, B.; Brus, D.J.; Heuvelink, G.B.M.; Stoorvogel, J.J. Updating the 1:50,000 Dutch Soil Map Using Legacy Soil Data: A Multinomial Logistic Regression Approach. Geoderma 2009, 151, 311–326. [Google Scholar] [CrossRef]
  19. Heung, B.; Hodúl, M.; Schmidt, M.G. Comparing the Use of Training Data Derived from Legacy Soil Pits and Soil Survey Polygons for Mapping Soil Classes. Geoderma 2017, 290, 51–68. [Google Scholar] [CrossRef]
  20. Machado, I.R.; Giasson, E.; Campos, A.R.; Costa, J.J.F.; Silva, E.B.d.; Bonfatti, B.R. Spatial Disaggregation of Multi-Component Soil Map Units Using Legacy Data and a Tree-Based Algorithm in Southern Brazil. Rev. Bras. Ciênc. Solo 2018, 42, e0170193. [Google Scholar] [CrossRef]
  21. Ellili Bargaoui, Y.; Walter, C.; Michot, D.; Saby, N.P.A.; Vincent, S.; Lemercier, B. Validation of Digital Maps Derived from Spatial Disaggregation of Legacy Soil Maps. Geoderma 2019, 356, 113907. [Google Scholar] [CrossRef]
  22. Sanchez, P.A.; Palm, C.A.; Buol, S.W. Fertility Capability Soil Classification: A Tool to Help Assess Soil Quality in the Tropics. Geoderma 2003, 114, 157–185. [Google Scholar] [CrossRef]
  23. Balai Penelitian Tanah. Petunjuk Teknis Analisa Kimia Tanah, Tanaman, Air, Dan Pupuk; Balai Penelitian Tanah: Bogor, Indonesia, 2005. [Google Scholar]
  24. Cohen, J. Statistical Power Analysis for the Behavioral Sciences, 2nd ed.; Lawrence Erlbaum Associates: Hillsdale, NJ, USA, 1988. [Google Scholar]
  25. Hedges, L.V. Distribution Theory for Glass’s Estimator of Effect Size and Related Estimators. J. Educ. Behav. Stat. 1981, 6, 107–128. [Google Scholar] [CrossRef]
  26. Cohen, J. A Power Primer. Psychol. Bull. 1992, 112, 155–159. [Google Scholar] [CrossRef] [PubMed]
  27. Sakai, T. Two Sample T-Tests for IR Evaluation: Student or Welch? In Proceedings of the 39th International ACM SIGIR Conference on Research and Development in Information Retrieval, Pisa, Italy, 17–21 July 2016; Association for Computing Machinery: New York, NY, USA, 2016; pp. 1045–1048. [Google Scholar]
  28. Ruxton, G.D. The Unequal Variance T-Test Is an Underused Alternative to Student’s t-Test and the Mann–Whitney U Test. Behav. Ecol. 2006, 17, 688–690. [Google Scholar] [CrossRef]
  29. R Core Team R: A Language and Environment for Statistical Computing; R Core Team: Vienna, Austria, 2021.
  30. Lüdecke, D. Esc: Effect Size Computation for Meta Analysis (Version 0.5.1) 2019. Available online: https://zenodo.org/records/1249218 (accessed on 9 March 2025).
  31. Haile, G.; Itanna, F.; Teklu, B.; Agegnehu, G. Variation in Soil Properties under Different Land Use Types Managed by Smallholder Farmers in Central Ethiopia. Sustain. Environ. 2022, 8, 1–15. [Google Scholar] [CrossRef]
  32. Zhang, M.; Han, J.; Jiao, J.; Han, J.; Zhao, X.; Hu, K.; Kang, Y.; Jaffar, M.T.; Qin, W. Soil Carbon Management Index under Different Land Use Systems and Soil Types of Sanjiang Plain in Northeast China. Agronomy 2023, 13, 2533. [Google Scholar] [CrossRef]
  33. Sainepo, B.M.; Gachene, C.K.; Karuma, A. Assessment of Soil Organic Carbon Fractions and Carbon Management Index under Different Land Use Types in Olesharo Catchment, Narok County, Kenya. Carbon Balance Manag. 2018, 13, 1–9. [Google Scholar] [CrossRef]
  34. Pham, T.G.; Nguyen, H.T.; Kappas, M. Assessment of Soil Quality Indicators under Different Agricultural Land Uses and Topographic Aspects in Central Vietnam. Int. Soil Water Conserv. Res. 2018, 6, 280–288. [Google Scholar] [CrossRef]
  35. Paustian, K.; Collier, S.; Baldock, J.; Burgess, R.; Creque, J.; DeLonge, M.; Dungait, J.; Ellert, B.; Frank, S.; Goddard, T.; et al. Quantifying Carbon for Agricultural Soil Management: From the Current Status toward a Global Soil Information System. Carbon Manag. 2019, 10, 567–587. [Google Scholar] [CrossRef]
  36. Jyoti, K.M.; Sarmah, M.K.; Das, K.N.; Lolesh, P.; Wasifur, R.; Bhoirab, G. Impact of Available N, P2O5 and K2O on Soil Due to Different Management Practices after Growing Sali Rice. Int. J. Agric. Sci. 2018, 8, 3306–3309. [Google Scholar]
  37. Moharana, P.C.; Meena, R.L.; Nogiya, M.; Jena, R.K.; Sharma, G.K.; Sahoo, S.; Jha, P.K.; Aditi, K.; Vara Prasad, P.V. Impacts of Land Use on Pools and Indices of Soil Organic Carbon and Nitrogen in the Ghaggar Flood Plains of Arid India. Land 2022, 11, 1180. [Google Scholar] [CrossRef]
  38. Leul, Y.; Assen, M.; Damene, S.; Legass, A. Effects of Land-Use Dynamics on Soil Organic Carbon and Total Nitrogen Stock, Western Ethiopia. Appl. Environ. Soil Sci. 2023, 2023, 5080313. [Google Scholar] [CrossRef]
  39. Wang, B.; Wang, G.; Myo, S.T.Z.; Li, Y.; Xu, C.; Lin, Z.; Qian, Z.; Tang, L. Deforestation for Agriculture Temporarily Improved Soil Quality and Soil Organic Carbon Stocks. Forests 2022, 13, 228. [Google Scholar] [CrossRef]
  40. Samani, K.M.; Pordel, N.; Hosseini, V.; Shakeri, Z. Effect of Land-Use Changes on Chemical and Physical Properties of Soil in Western Iran (Zagros Oak Forests). J. For. Res. 2020, 31, 637–647. [Google Scholar] [CrossRef]
  41. Labaz, B.; Hartemink, A.E.; Zhang, Y.; Stevenson, A.; Kabała, C. Organic Carbon in Mollisols of the World − A Review. Geoderma 2024, 447, 116937. [Google Scholar] [CrossRef]
  42. Xu, X.; Pei, J.; Xu, Y.; Wang, J. Soil Organic Carbon Depletion in Global Mollisols Regions and Restoration by Management Practices: A Review. J. Soils Sediments 2020, 20, 1173–1181. [Google Scholar] [CrossRef]
  43. Brydges, C.R. Effect Size Guidelines, Sample Size Calculations, and Statistical Power in Gerontology. Innov. Aging 2019, 3, igz036. [Google Scholar] [CrossRef]
  44. Szeghy, R.E.; Province, V.M.; Stute, N.L.; Augenreich, M.A.; Koontz, L.K.; Stickford, J.L.; Stickford, A.S.L.; Ratchford, S.M. Carotid Stiffness, Intima–Media Thickness and Aortic Augmentation Index among Adults with SARS-CoV-2. Exp. Physiol. 2022, 107, 694–707. [Google Scholar] [CrossRef]
  45. Hedges, L.V.; Pigoot, T.D. The Power of Statistical Test for Moderators in Meta Analysis. Psychol. Methods 2004, 9, 426–445. [Google Scholar] [CrossRef]
  46. Blankinship, J.C.; Niklaus, P.A.; Hungate, B.A. A Meta-Analysis of Responses of Soil Biota to Global Change. Oecologia 2011, 165, 553–565. [Google Scholar] [CrossRef]
  47. Horvatinec, J.; Buczny, J.; Ondrasek, G. Fly Ash Application Impacts Master Physicochemical Pedovariables: A Multilevel Meta-Analysis. J. Environ. Manage. 2024, 368, 122066. [Google Scholar] [CrossRef]
  48. Molla, E.; Getnet, K.; Mekonnen, M. Land Use Change and Its Effect on Selected Soil Properties in the Northwest Highlands of Ethiopia. Heliyon 2022, 8, e10157. [Google Scholar] [CrossRef]
  49. Wilding, L.P.; Dress, L.R. Spatial Variability and Pedology. In Pedogenesis and Soil Taxonomy I: Concepts and Interaction; Wilding, L.P., Smeck, N.E., Hall, G.F., Eds.; Elsevier: Amsterdam, The Netherlands, 1983; pp. 83–116. [Google Scholar]
Figure 1. Distribution of 291 black soil profiles (red dots) from 1994 to 2017. As many as 54 profiles in the dataset have no coordinate location. From 345 soil profiles, only 142 profiles were sampled for soil laboratory analysis. Source: Sulaeman et al. [11], with modifications.
Land 14 00599 g001
Figure 2. Boxplots of stable black soil properties by land-cover and land-use types. Note: HT = forests; KB = home gardens, monocropping; KC = home gardens, mixed cropping; SB = shrublands; SW = paddy fields; TG = agriculture dryland. Data source: Sulaeman et al. [11].
Land 14 00599 g002
Figure 3. Boxplots of regulated black soil properties by land-cover and land-use types. Data source: Sulaeman et al. [11].
Land 14 00599 g003
Table 1. Code and soil property used in this study.
CodeSoil PropertyUnitLaboratory Methods *
Stable soil properties
SandSand fraction content%Pipet
SiltSilt fraction content%Pipet
ClayClay fraction content%Pipet
SOCSoil organic carbon content%Walkley and Black
Regulated soil properties
PHSoil pH pH meter, soil: water = 1:5
TNTotal nitrogen%Kjeldahl
APAvailable P2O5ppmOlsen
XCaExchangeable Cacmol(+)/kgNH4OAc 1M, pH 7
XMgExchangeable Mgcmol(+)/kgNH4OAc 1M, pH 7
XKExchangeable Kcmol(+)/kgNH4OAc 1M, pH 7
XNaExchangeable Nacmol(+)/kgNH4OAc 1M, pH 7
(*) The detailed procedure can be found in Balittanah [23].
Table 2. Hedges’s g-index for the mean difference in stable soil properties by land-use type.
1st Land Use2nd Land UseSandSiltClaySOC
A. Natural land cover versus natural land cover
HTSB−0.99 *0.510.78 *0.51
B. Natural land cover versus farming use
HTKB−0.96 *0.400.62−0.45
HTKC−0.66 *0.89 *0.150.79 *
HTTG−1.000.320.77 *−1.31
HTSW−0.27−0.150.370.64 *
SBKB0.18−0.16−0.10−0.79 *
SBKC0.320.16−0.59 *0.11
SBTG0.17−0.21−0.07−1.31 *
SBSW0.71 *−0.56−0.540.00
C. Farming use versus farming use
KBKC0.150.44−0.451.23 *
KBTG0.00−0.070.04−0.73
KBSW0.68−0.55−0.371.04 *
KCTG−0.14−0.530.55−2.03 *
KCSW0.43−1.06 *0.18−0.14
TGSW0.71−0.48−0.681.63 *
Notes: HT = forest, KB = monoculture home garden, KC = mixed home garden, SB = shrubland, SW = paddy field, TG = agriculture dryland. Large difference if |g| > 0.8, medium difference if 0.5 > |g| < 0.8, small difference if 0.2 > |g| < 0.5, and very small difference if |g| < 0.2. The positive sign means that the mean value of the soil property in the reference land-use type (first land-use type) is higher than in the second land-use type. (*) The mean difference is statistically significant at the alpha level of 0.05.
Table 3. Hedges’s g-index for the mean difference in regulated soil properties by land-use type.
1st Land Use2nd Land UsePHTNAPXCaXMgXKXNa
A. Natural land cover versus natural land cover
HTSB0.350.78 *0.020.140.69 *−0.110.42
B. Natural land cover versus farming use
HTKB1.18 *0.090.98 *0.400.98 *1.26 *1.75 *
HTKC0.59 *1.04 *0.55 *0.53 *0.000.56 *0.42
HTTG0.92−0.86 *−0.350.360.97 *0.78 *1.23 *
HTSW−0.180.80 *0.060.79 *0.390.130.00
SBKB0.64 *−0.86 *0.80 *0.220.111.19 *1.63 *
SBKC0.170.160.470.33−0.450.640.11
SBTG0.50−1.79 *−0.260.170.150.730.92 *
SBSW−0.450.000.040.56−0.240.23−0.44
C. Farming use versus farming use
KBKC−0.59 *1.31 *−0.440.04−0.56 *−0.89 *−0.64 *
KBTG0.18−1.06 *−0.78−0.030.11−0.66−0.99
KBSW−1.23 *0.92 *−0.550.25−0.41−1.51 *−2.14 *
KCTG0.58−2.61 *−0.73−0.080.56 *0.340.38
KCSW−0.74 *−0.17−0.340.270.26−0.49−0.39
TGSW−0.821.89 *0.260.28−0.42−0.85 *−1.39 *
Notes: HT = forest, KB = monoculture garden, KC = mixed garden, SB = shrubland, SW = paddy field, TG = agriculture dryland. Large difference if |g| ≥ 0.8, medium difference if 0.5 ≥ |g| < 0.8, and small difference if 0.2 ≥ |g| < 0.5. The positive sign indicates that the mean value of the soil property in the reference land-use type (first land-use type) is higher than that of the second one. (*) the mean difference is statistically significant at the alpha level of 0.05.
Table 4. List of soil properties with significant differences and medium-to-high effect sizes.
PairNumber of PropertiesDifference *
Positive (+)Negative (−)
A. Natural land cover versus natural land cover
HT vs. SB5Clay, SOC, TN, XMgSand
B. Natural land cover versus farming use
HT vs. KB5AP, XMg, XK, PHSand
HT vs. KC8Silt, SOC, TN, AP, XCa, XK, PHSand
HT vs. TG4Clay, XMg, XK, XNa
HT vs. SW3SOC, TN, XCa
SB vs. KB5AP, XK, XNaSOC, TN
SB vs. KC1 Clay
SB vs. TG1 TN
SB vs. SW0
C. Farming use versus farming use
KB vs. KC6SOC, TNXMg, XK, XNa, PH
KB vs. TG1 TN
KB vs. SW4SOC, TNXK, XNa
KC vs. TG2 Silt, TN
KC vs. SW2 Silt, PH
TG vs. SW2TNAP
Note: * A positive (+) difference indicates that the value of the soil property in the first land-use type is higher than in the second. A negative (−) difference implies that the value of the soil property in the first land-use type is lower than in the second.
Disclaimer/Publisher’s Note: The statements, opinions and data contained in all publications are solely those of the individual author(s) and contributor(s) and not of MDPI and/or the editor(s). MDPI and/or the editor(s) disclaim responsibility for any injury to people or property resulting from any ideas, methods, instructions or products referred to in the content.

