Article

Medium-Term Effect of Livestock Grazing Intensities on the Vegetation Dynamics in Alpine Meadow Ecosystems

1
College of Forestry, Gansu Agricultural University, Lanzhou 730070, China
2
Key Laboratory of Ecological Safety and Sustainable Development in Arid Lands, Urat Desert-Grassland Research Station, Northwest Institute of Eco-Environment and Resources, Chinese Academy of Sciences, Lanzhou 730000, China
*
Author to whom correspondence should be addressed.
Land 2025, 14(3), 591; https://doi.org/10.3390/land14030591
Submission received: 31 January 2025 / Revised: 2 March 2025 / Accepted: 3 March 2025 / Published: 12 March 2025

Abstract

:
The dynamics and plant composition of toxic weeds in alpine meadows are strongly influenced by management practices such as livestock grazing. Here, the effect of grazing management on vegetation and soil characteristics within an alpine meadow ecosystem was assessed over a 5-year period. The experimental grazing treatments comprised no grazing (control), light grazing (5 sheep/ha), moderate grazing (10 sheep/ha), and heavy grazing (15 sheep/ha). The characteristics of both edible grass and toxic weeds, along with the soil’s physicochemical and biological properties, were evaluated. Under heavy grazing, the biomass of toxic weeds increased by 15.0%, while the biomass of edible species decreased by 57.0% compared to the control. The findings indicated that after 5 years, the plant composition changed significantly, with edible species such as Taraxacum mongolicum and Tibetia himalaica decreasing and disappearing under moderate and heavy grazing treatments. Conversely, toxic weeds like Stellera chamaejasme and Euphorbia micractina emerged under moderate or heavy grazing. Additionally, the richness of toxic weeds increased from 6.3 under the control to 14.2 under heavy grazing. Regarding soil properties, the levels of soil glucosidase, amylase, and cellulose decreased by 39.0%, 53.0%, and 40.0%, respectively. The amount of available potassium initially decreased and then increased under heavy grazing. The results demonstrated that the quality of the vegetation cover and a soil’s properties directly depend on land management. Overall, light to moderate grazing kept the soil in a better chemical and biological state and kept the biomass of palatable plants at a desirable level, which also controlled the abundance and biomass of toxic weeds. Enhancing soil nutrient conditions, such as by adding nitrate fertilizers, can be effective in restoring grasslands that have been severely degraded by grazing.

Graphical Abstract

1. Introduction

The invasion of toxic weed species has long been associated with the degradation of alpine grassland ecosystems [1,2,3,4]. These plants, due to their negative effects on animals’ health, significantly impact livestock production and the animal husbandry industry as well [5,6].
Alpine meadows, which cover 65% of the Qinghai–Tibet Plateau, provide the material basis of plateau meadow animal husbandry [7], sustaining the livelihoods of tens of thousands of herders [8]. In terms of plant types, alpine meadows also play a crucial role in maintaining global terrestrial ecosystem functions, e.g., water conservation, biodiversity protection, and climate feedback, with aboveground biomass serving as a crucial indicator of grassland health and functionality [9]. However, anthropogenic activities, such as grazing, have been shown to alter the productivity and biodiversity of grassland ecosystems, potentially affecting their functioning [10,11]. In alpine meadows, grazing disturbances can change the environmental resource utilization of plant communities, thereby altering species interactions and impacting the stability of these communities [12,13,14].
Due to climate change and human activities, as well as long-term extensive management, overloading, overgrazing, and the unsustainable use of grassland resources, the fragile alpine meadow ecosystem has undergone great changes, and the vegetation community’s structure has been greatly altered [15,16,17]. Changes in vegetation structure, an increase in invasive toxic weeds, and a decrease in species with high palatability and good quality in this region are among the most important negative effects of intensive livestock grazing [18]. In fact, biological invasion is one of the primary drivers of biodiversity loss and environmental change [19,20]. Besides adversely affecting native biodiversity, the invasion of toxic species poses a major threat from a socio-ecological perspective [21]. Toxic weed species contribute to the alteration in the cultural identity/value of landscapes and negatively impact human health and safety [20,21].
Generally, a toxic weed, which may be an annual, biennial, or perennial plant species, a grass, or a broadleaf woody or herbaceous plant species, is one that has been legislated against in some way because it has an undesirable property or trait [22]. Toxic weed species can profoundly modify the structure and function of native ecosystems by releasing toxic substances [23,24]. Toxic weed species will ultimately establish a dominant population and result in the degradation of the native population, finally resulting in a loss of genetic, species, and ecosystem diversity [1,25].
Moreover, toxic weeds can conflict with, restrict, or otherwise interfere with vegetation management objectives. The displacement of many native plant communities by invasive toxic weeds has reduced rangeland biodiversity and value [6,26]. Furthermore, understanding and managing toxic weed species is particularly important to the sustainable development of ecosystems [10,24]. Therefore, it is necessary to accurately assess the vegetation health of the alpine meadows while mitigating the confounding effects of invasive toxic weeds [4,27], as vegetation composition is severely affected by grazing management [4,28].
Grazing can directly alter the structure and composition of plant communities, resulting in reduced aboveground biomass, a decrease in the species richness of palatable grass species, and an increase in the species richness of unpalatable grasses [4,29,30]. Consequently, determining the optimal grazing intensity to enhance the richness of desirable and palatable species and suppress undesirable/toxic species is crucial for effective and efficient ecosystem management [4,26,31]. Additionally, managing grazing to control invasive toxic weeds also impacts other ecosystem functions, such as water and soil conservation [20,26]. This assessment aims to investigate the influence of toxic species on overall grassland diversity while evaluating the susceptibility (and conversely, resistance) of grazed native plant communities to invasive toxic exotic plant encroachment [28]. However, the relationships between grazing and invasive toxic plant species are less understood [28,32].
Generally, the effects of grazing removal on vegetation are highly variable across ecosystems and grazing contexts [32,33]. Controlled grazing or exclosures have a long history in land vegetation management [28,34]. In many instances, livestock grazing control has proven to be an effective method for managing vegetation [11,13,23,35]. However, other studies have indicated that livestock grazing does not always result in significant changes to plant community structure, such as in biomes, or diversity [36]. Consequently, the impact of grazing removal on vegetation differs across ecological and biogeographic contexts [15,32].
As an effective practice in grassland management, grazing exclusion is widely utilized to restore the ecosystem multifunctionality of degraded grasslands. However, it might not always be beneficial for conserving grassland biodiversity [37,38]. Reports suggest that livestock grazing can alter the composition of the plant community over time by consuming or trampling plants, thereby changing indices such as abundance, diversity, and richness. These changes may not be inherently positive or negative. In some studies, livestock grazing did not significantly alter the plant characteristics between a fenced and grazed area, with changes being more dependent on the type of plant species [27].
Many studies have examined the effects of grazing on vegetation dynamics in alpine grasslands [4,10,15,34]. However, there is a lack of detailed information on the effect of grazing on the dynamics of the toxic weed species in alpine meadow grasslands. Considering the ecological significance of alpine grasslands and their crucial role in the animal husbandry industry, it is essential to manage vegetation, preserve and improve edible species, and control and reduce toxic weeds through livestock grazing management. Therefore, in light of the aforementioned gaps and the absence of precise data on the effects of livestock grazing on vegetation dynamics and toxic weeds, this study aimed to investigate the impacts of varying intensities of livestock grazing on vegetation dynamics, the abundance of edible species, and the prevalence of invasive and toxic weeds in alpine meadows over a period of 5 years. The findings of this study can be utilized to manage toxic weeds and to enhance or conserve valuable species that are both ecologically and economically significant to the animal husbandry industry.

2. Materials and Methods

2.1. Study Area

This study was conducted in an alpine meadow ecosystem located in Maqu county, Gannan, China (100°45′45″ E–102°29′00″ E; 33°06′30″ N–34°30′15″ N), over 5 consecutive years (2019–2024). The area is characterized by its high altitude and cold and humid conditions, with no absolute frost-free period from 2019 to 2024. It has a mean annual temperature of 1.2 °C, an annual average precipitation of 610 mm, an annual average evaporation of 1353 mm, a mean annual wind speed of 2.5 m/s, and an annual average sunshine duration of 2583.9 h. The soil in this area is a sandy loam with an altitude of 3500 m above sea level (ASL). The vegetation of the alpine meadow is dominated by the Poaceae family. The major alpine meadow species include Stipa aliena, Elymus nutans, Poa pratensis, Kobresia humilis, Gentiana straminea, Helictotrichon tibeticum, Kobresia pygmaea, and Ligularia virgaurea, as well as some species from Ranunculaceae and Rosaceae (e.g., Taraxacum spp.) [36]. The alpine meadow soil is characterized by its thinness, poor water retention, and low fertility [39].

2.2. Experiment

A field experiment was conducted in a subalpine meadow, which constitutes 65.05% of the total pasture in Maqu county and serve as the primary pasture during the warm season (from June to October) [40,41]. The experiment involved four grazing intensities using adult Tibetan sheep as the grazers (4 treatments). The grazing period was limited to the warm season, during which continuous grazing was practiced. The treatments were as follows: (1) heavy grazing (15 sheep/ha), (2) moderate grazing (10 sheep/ha), (3) light grazing (5 sheep/ha), and (4) no grazing (control, rest grazing) (0 sheep/ha). Four quadrat plots, each measuring 100 m × 100 m, were established in areas subjected to heavy, moderate, and light grazing, respectively. Furthermore, 3 quadrat plots of the same size were set up in the non-grazing area. The experimental plots were fenced for a duration of 5 years (starting from August 2019), and the study was conducted once after this period, in October 2024. The results were obtained as statistical values for duplicate tests.

2.3. Plant Measurement

To measure the vegetation characteristics, 75 subplots were established (with five 1 m × 1 m subplots set on the diagonal of each quadrat plot), and detailed plant community information was recorded. Plant characteristics such as the number of species, abundance, plant height, cover, aerial biomass, richness, and litter were evaluated. After measuring the plants’ morphological characteristics, the aerial parts of the plants in each plot were harvested. The plant traits measured included the following: Height—measuring the average height of the individuals of each species present in each plot; cover—evaluating the proportion of coverage area of each species in each subplot; density—counting the number of individuals of each species in each subplot. Relative height, relative coverage, and relative density were used to calculate the species’ importance value [42]. Species—recording all plant species present in each subplot, including both unpalatable and edible grass species; toxic weed species—special labeling and recording of the toxic weed species and their relative quantities present in each plot. Subsequently, scissors were used to cut off the live plants at ground level of the sample plot to determine the aboveground biomass. The samples were placed into paper envelopes and dried in an oven at 65 °C to measure the biomass of each species.

2.4. Soil Measurement

At the same location as the plant samples, a 5 cm diameter soil drill was used in each subplot, employing the five points method to extract soil from a depth of 20 cm. This soil was then used for measuring soil organic carbon, soil nutrients (N, P, K), and soil enzyme activity. The soil samples were stored in ice packs and brought back to the laboratory.
After removing stones and plant roots from each soil sample brought back to the laboratory, the samples were sieved through a 2 mm sieve and divided into two parts: one part of the soil sample was naturally air dried indoors to determine the soil’s physical and chemical properties, etc.; the other part was stored at 4 °C for the measurement of soil enzyme activity.
The soil organic carbon content (SOC) was determined using the potassium dichromate external heating method with a YKA-6000 constant temperature oil bath. Soil total nitrogen (STN) was quantified using the Dumas dry burning method with a Flash-II EA112 elemental analyzer (Thermo Fisher Scientific, Shanghai, China). The total phosphorus in the soil (STP) was determined using the molybdenum antimony colorimetric method, employing a KDN-08B digestion analyzer (Shanghai Benang Scientific Instrument Co., Ltd., Shanghai, China) and a UV-2355 UV–visible spectrophotometer (Shimadzu, Kawasaki, Japan). The available phosphorus in the soil (SAP) was assessed using the sodium bicarbonate molybdenum antimony colorimetric method, also utilizing a UV-2355 UV–visible spectrophotometer. Total potassium in the soil (STK) was determined via the flame photometer method. Soil pH was measured using the potentiometric method with a lightning magnetic PHSJ-6L pH meter (Shanghai Rex Instrument Factory, Shanghai, China). Soil water content (SWC) was calculated based on the weight difference before and after oven-drying at 105 °C [43].
Soil amylase activity determination: Amylase hydrolyzes starch to produce reducing sugars, which react with 3,5-dinitrosalicylic acid to produce a reddish-brown compound (3-amino-5-nitrosalicylic acid). This compound has a characteristic absorption peak at 540 nm, and the intensity of the color is directly proportional to the amount of reducing sugar within a certain range [44]. The soil amylase assay was conducted using a kit from Beijing Soleibao Technology Co., Ltd., Beijing, China. The soil sample was sieved and processed following the kit’s instructions. The absorbance of the supernatant was measured at 540 nm, and the production of 1 μ mol of reducing sugar per gram of soil sample per day was established as one unit of enzyme activity [45].
Determination of soil cellulase activity: Soil cellulase primarily originates from soil microorganisms, and the glucose produced through the decomposition of plant dead leaves, catalyzed by cellulase, serves as the main carbon-source nutrient. The content of reducing sugar (3-amino-5-nitrosalicylic acid) resulting from cellulase catalyzed cellulose degradation was quantified using the 3,5-dinitrosalicylic acid method. The soil cellulase assay kit (Beijing Soleibao Technology Co., Ltd., Beijing, China) was employed for this measurement. After sieving the soil sample, the instructions were followed and a spectrophotometer was used to compare the supernatant at a wavelength of 540 nm. The soil cellulase activity is defined as the amount of milligrams of glucose produced per gram of the soil sample per day.
The soil β-glucosidase activity assay involves β-glucosidase, which catalyzes the hydrolysis of glycosidic bonds linking aryl or alkyl groups to glycosidic groups, resulting in the production of glucose. This enzyme is a vital component of the cellulase system and plays a critical role in the carbohydrate metabolism of soil microorganisms. β-glucosidase facilitates the conversion of p-nitrophenyl-β-D-glucopyranoside into p-nitrophenol, yielding a slightly yellow product with a distinctive light absorption peak at 400 nm. The soil β-glucosidase assay kit (provided by Beijing Soleibao Technology Co., Ltd., Beijing, China) was employed for this determination. The sieved soil sample was processed according to the kit instructions, and the absorbance of the supernatant was measured at 400 nm. The activity of soil β-glucosidase is defined as the production of 1 μmol of p-nitrophenol per gram of soil sample per day.

2.5. Data Analysis

After verifying data normality with the Kolmogorov–Smirnov test, an analysis of variance (ANOVA) and mean comparison of the data were conducted, using Duncan’s test (p < 0.05) for grouping the treatments. Relationships between plant species, vegetation indices, and soil characteristics were established through principal component analysis (PCA) and redundancy analysis (RDA) using PC-ORD version 5.0 software. Statistical analyses, including Pearson correlations and Mantel tests, as well as cross-correlation (CCF) for the main soil factors influencing toxic weed biomass, were performed using the SPPS version 22.0.0 and R version 4.0.2 statistical software packages.

3. Results

Grazing intensity significantly influenced the plant characteristics of alpine grasslands (p < 0.01). As the most significant feature, the amount of toxic plant biomass varied considerably with different livestock grazing intensities, resulting in a −157% change from 49.1 g/m2 under control conditions (without grazing) to 126.4 g/m2 under heavy grazing conditions. Additionally, the biomass of edible plants decreased by 57%, from 89.5 g/m2 under the control conditions to 38.5 g/m2 under heavy grazing. With the escalation of grazing intensity in this area, certain species exhibited significant changes. In reality, edible species were replaced by toxic and invasive species. For instance, after 5 years of heavy grazing, toxic plants such as Stellera chamaejasme and Euphorbia micractina were only present under heavy or moderate grazing conditions. Conversely, edible species like Taraxacum mongolicum and Tibetia himalaica were only observed under the control and light grazing treatments and were absent under the moderate and heavy grazing treatments. The abundance of toxic weed species increased significantly with rising grazing intensity (p < 0.05). Some toxic weeds, including Potentilla bifurca, Stellera chamaejasme, and Ajania tenuifolia, emerged under heavy grazing. These species also had a higher biomass compared to other native species. Consequently, the richness of toxic weeds increased from 6.3 under the control conditions to 14.3 under heavy grazing (Table 1).
Regarding alterations in the soil properties, aside from total soil phosphorus and total soil potassium, the other assessed parameters such as soil water content, soil organic carbon, pH, and soil total nitrogen exhibited significant changes due to varying grazing intensities (p < 0.05). As for modifications in soil microbial properties, the quantities of soil glucosidase, amylase, and cellulose decreased by 39%, 53%, and 40%, respectively. The concentration of soil available phosphorous (SAP) initially declined and subsequently rose under heavy grazing (Table 2).
The cross-correlation factor (CCF) between the characteristics of toxic weeds and soil characteristics under heavy grazing is depicted in the Figure below (Figure 1). The results indicate that soil glucosidase, soil amylase, soil cellulose, and soil water content are directly correlated with the biomass of toxic weeds, with the highest CCF coefficients being −0.828, −0.790, −0.807, and −0.805, respectively. Additionally, while the CCF for soil carbon content was low, it proved to be an important parameter influencing the biomass of toxic weeds. Soil potassium levels exhibited variable CCF coefficients, with effects that were both positive and negative. In fact, among the studied soil factors, potassium had a relatively neutral impact on the abundance and biomass of toxic weeds during heavy grazing (Figure 1).
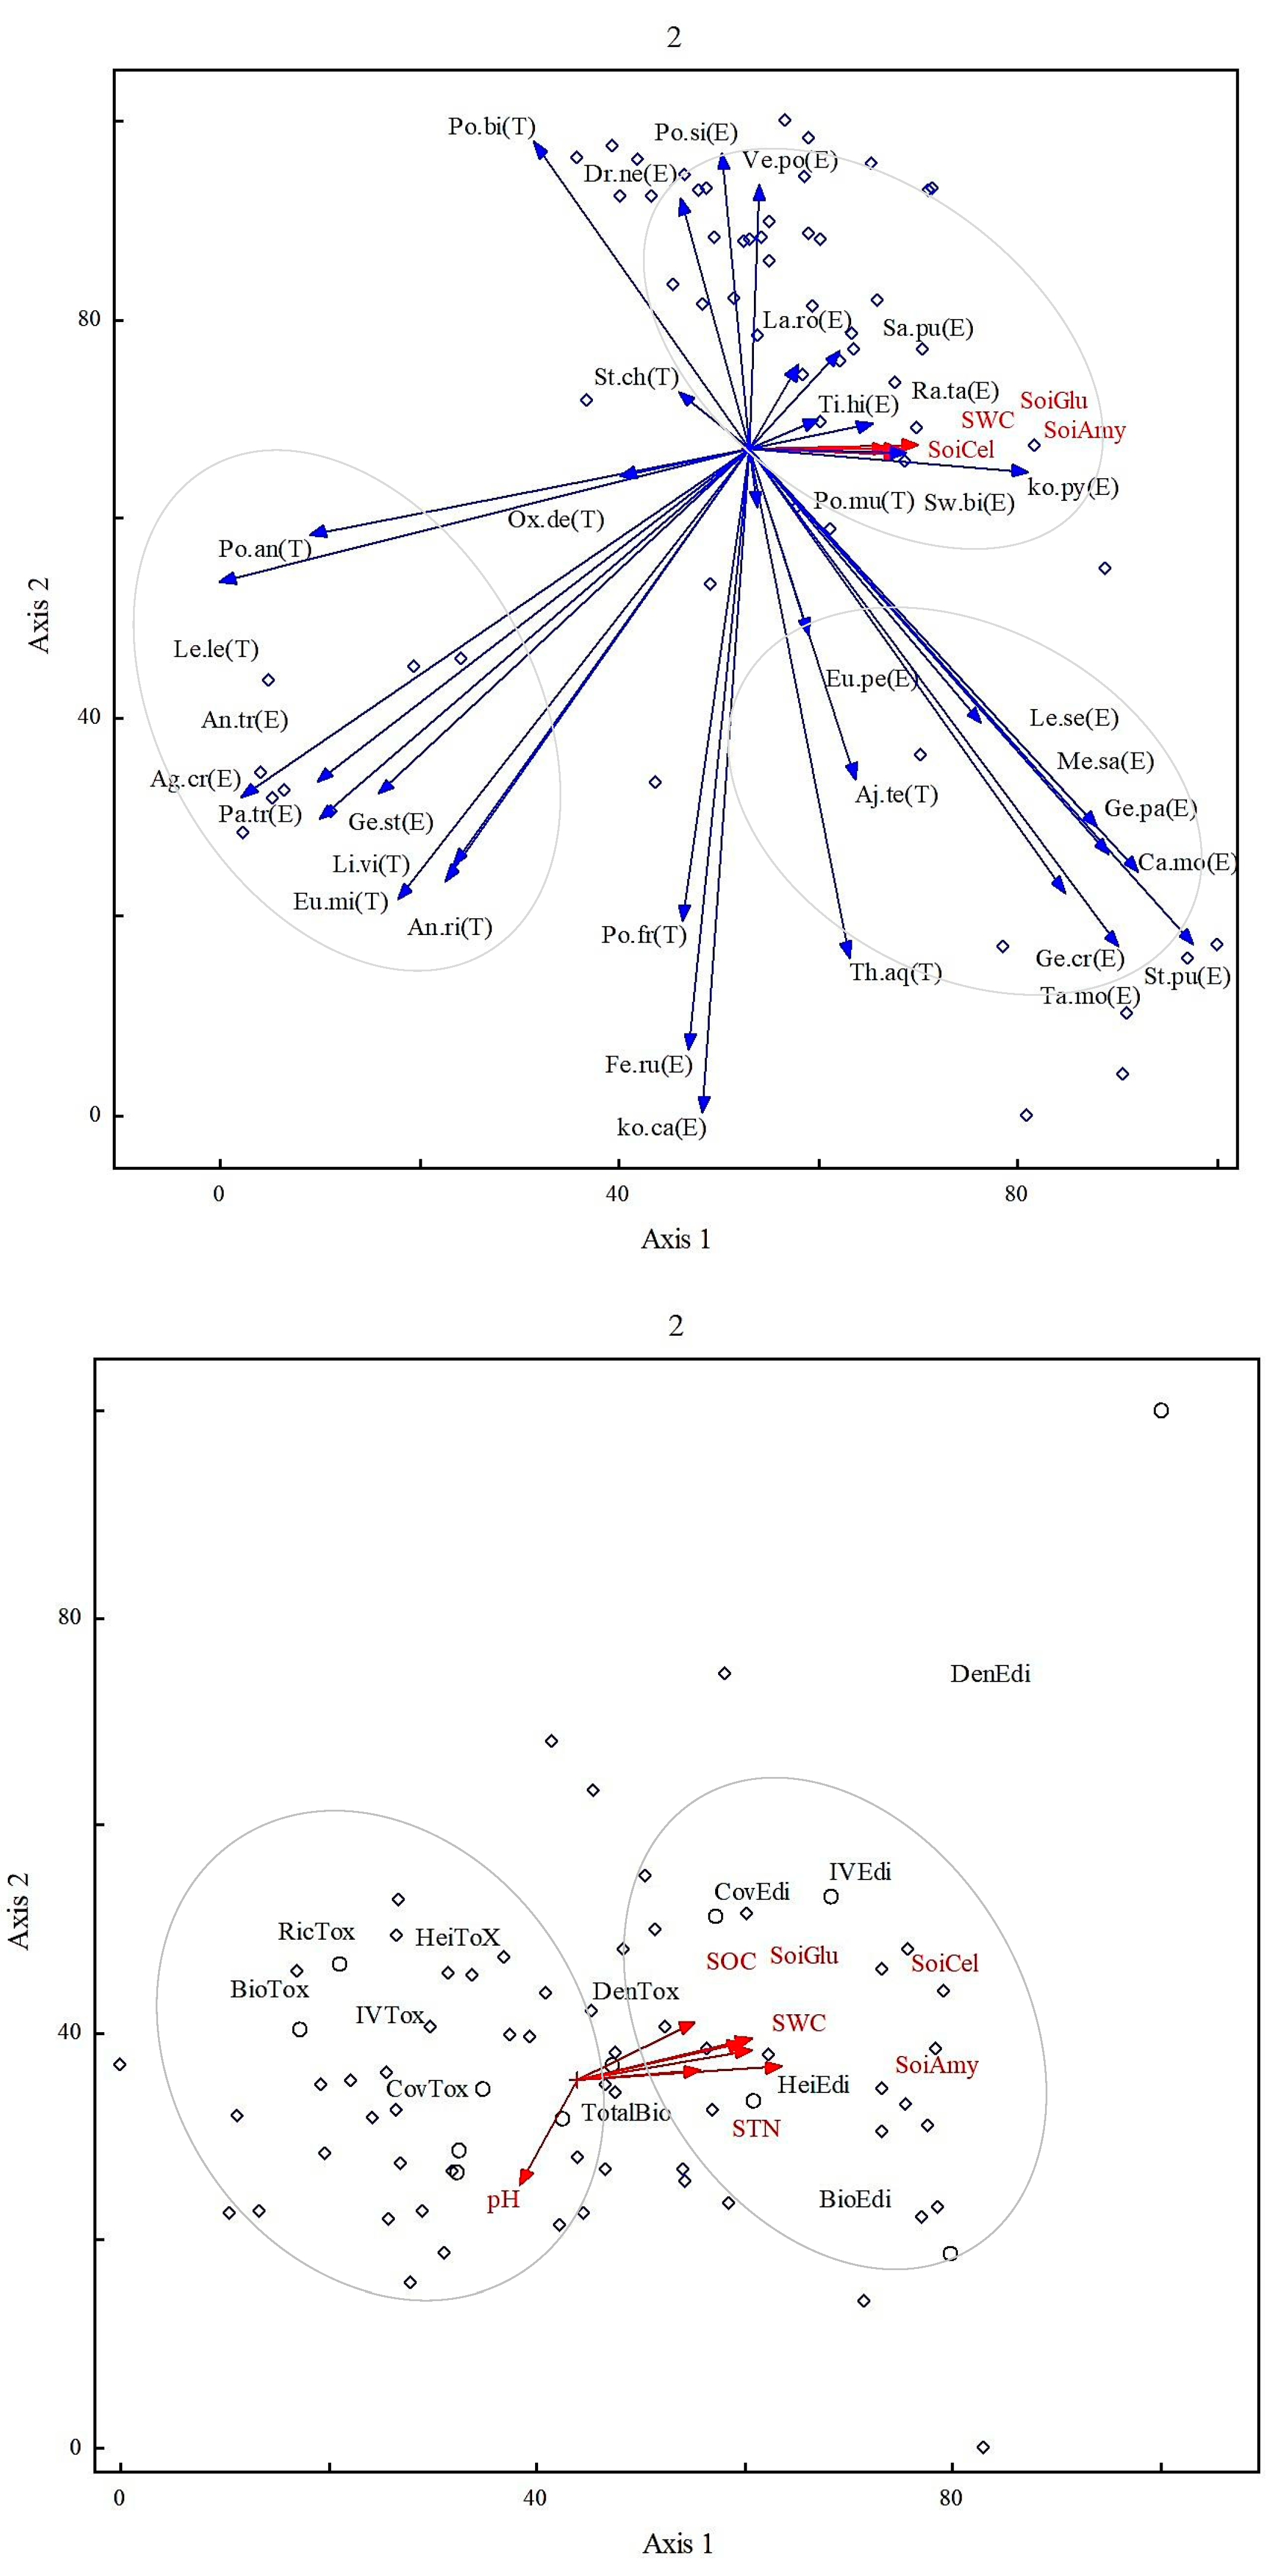
The results of the multiple analyses examining the relationship between plant species abundance and soil characteristics under different grazing conditions are presented in Figure 2. The eigenvalues for the first, second, and third axes are 5.5, 4.3, and 3.2, respectively. These axes account for 31.9%, 54.82%, and 66.05% of the total variance, respectively. Additionally, the broken-stick eigenvalues for the first and second axes are 3.84 and 2.36, respectively (see Table 3). Based on their ecological needs and alterations in soil properties, the plant species were categorized into three main groups. The first group primarily includes edible species (E) that can be consumed by livestock. Species such as Veronica polita, Saussurea pulchra, Lamiophlomis rotata, and potentilla multifida, which are edible (E), as well as toxic weed species, were grouped together. These species exhibit the most significant correlation with the soil water content, soil glucosidase, amylase, and soil cellulose characteristics. Furthermore, certain toxic weeds (T), including Thalictrum aquilegiifolium and Ajania tenuifolia, along with edible species (E) such as Leymus secalinus, Medicago sativa, Euphrasia pectinata, and Gentianopsis paludosa, which share similar ecological requirements and potentially grazing resistance, were classified within the same group.
Furthermore, most of the toxic weeds, including Oxytropis deflexa, Potentilla fragarioides, Leontopodium leontopodioides, Euphorbia micractina, and Ligularia virgaurea, were categorized into the same ecological group. Some edible species, such as Anemone trullifolia, were also placed in this group. These species exhibited negative correlations with certain physical, biological, and soil fertility properties (Figure 2: upper). The vegetation indices, including biomass and diversity, also demonstrated significant relationships with soil physicochemical and biological properties. Based on the PCA diagram, the density, cover, biomass, height, and importance value (IV) of edible species were grouped with soil water, soil glucosidase, soil amylase, and soil cellulose. The weed toxic indices, such as cover, biomass, and richness, were grouped into a separate category (Figure 2: lower).
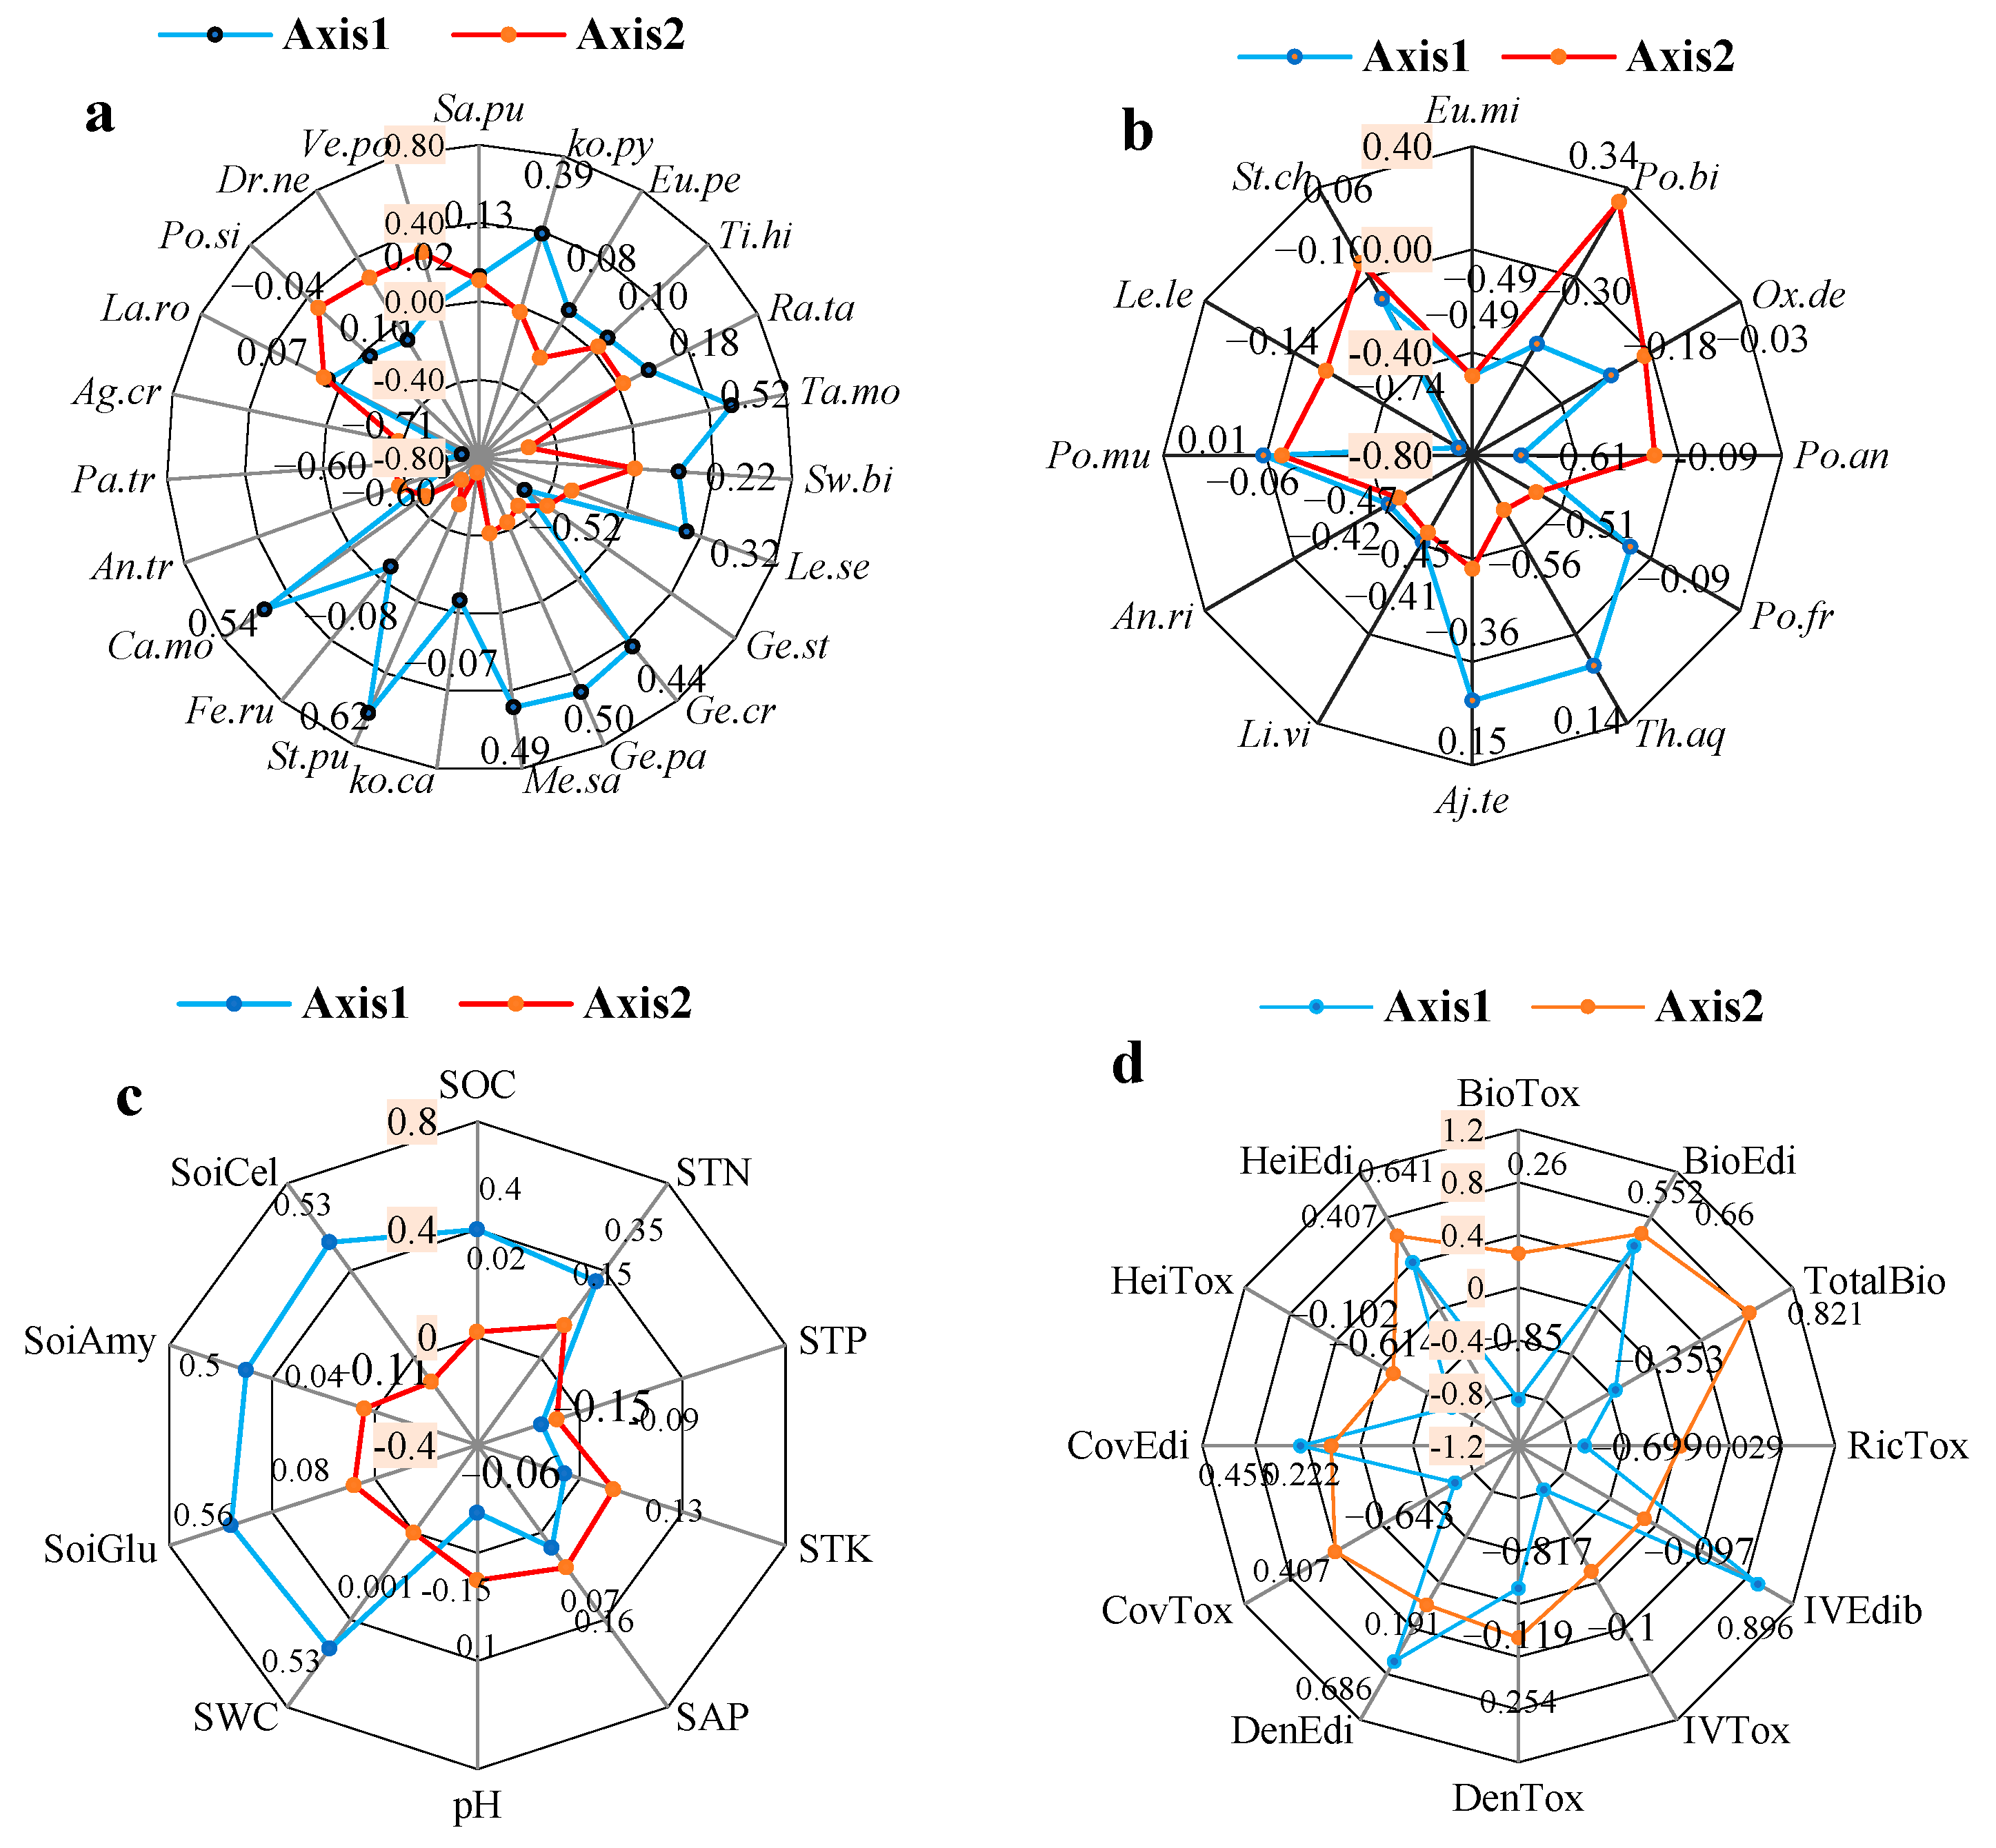
Figure 3 illustrates the correlation values of the environmental factors with the first and second axes of the PCA diagram, specifically for toxic weeds, edible plants, and soil factors. Regarding the significant correlation of edible species with the first axis, Stipa purpurea (St.pu) and Carex moorcroftii (Ca.mo) exhibited the highest positive correlation, with coefficients of 0.62 and 0.54, respectively. Conversely, Anemone trullifolia (An.tr), Parnassia trinervis (Pa.tr), and Agropyron cristatum (Ag.cr) displayed the strongest negative correlation with the first axis, with coefficients of −0.62, −0.62, and −0.7, respectively (Figure 3a). In terms of the significant correlation of poisonous plants with the PCA axes, Potentilla anserine (Po.an) and Leontopodium leontopodioides (Le.le) had the highest significant correlation with the first axis, with coefficients of 0.61 and 0.74, respectively. Additionally, the edible species Festuca rubra, with a coefficient of −0.66, and the toxic Thalictrum aquilegiifolium (Th.aq), with a coefficient of −0.56, showed the highest correlations with the second axis of PCA (Figure 3b). Regarding the significant correlation of soil properties with the PCA axes, soil water content, soil glucosidase, soil amylase, and soil cellulose had the highest significant correlation with the first axis, with coefficients of 0.53, 0.56, 0.50, and 0.53, respectively (Figure 3c). The structural traits of the vegetation cover, such as the richness of toxic weeds (RicTox), the importance value of edible species (IVEdib), and the importance value of toxic weeds (IVTox), were related to the first axis of the PCA biplot, with coefficients of −0.699, 0.896, and −0.817, respectively. Furthermore, the total biomass and height of edible species, with coefficients of 0.821 and 0.641, exhibited the strongest relationship with the second axis (Figure 3d).
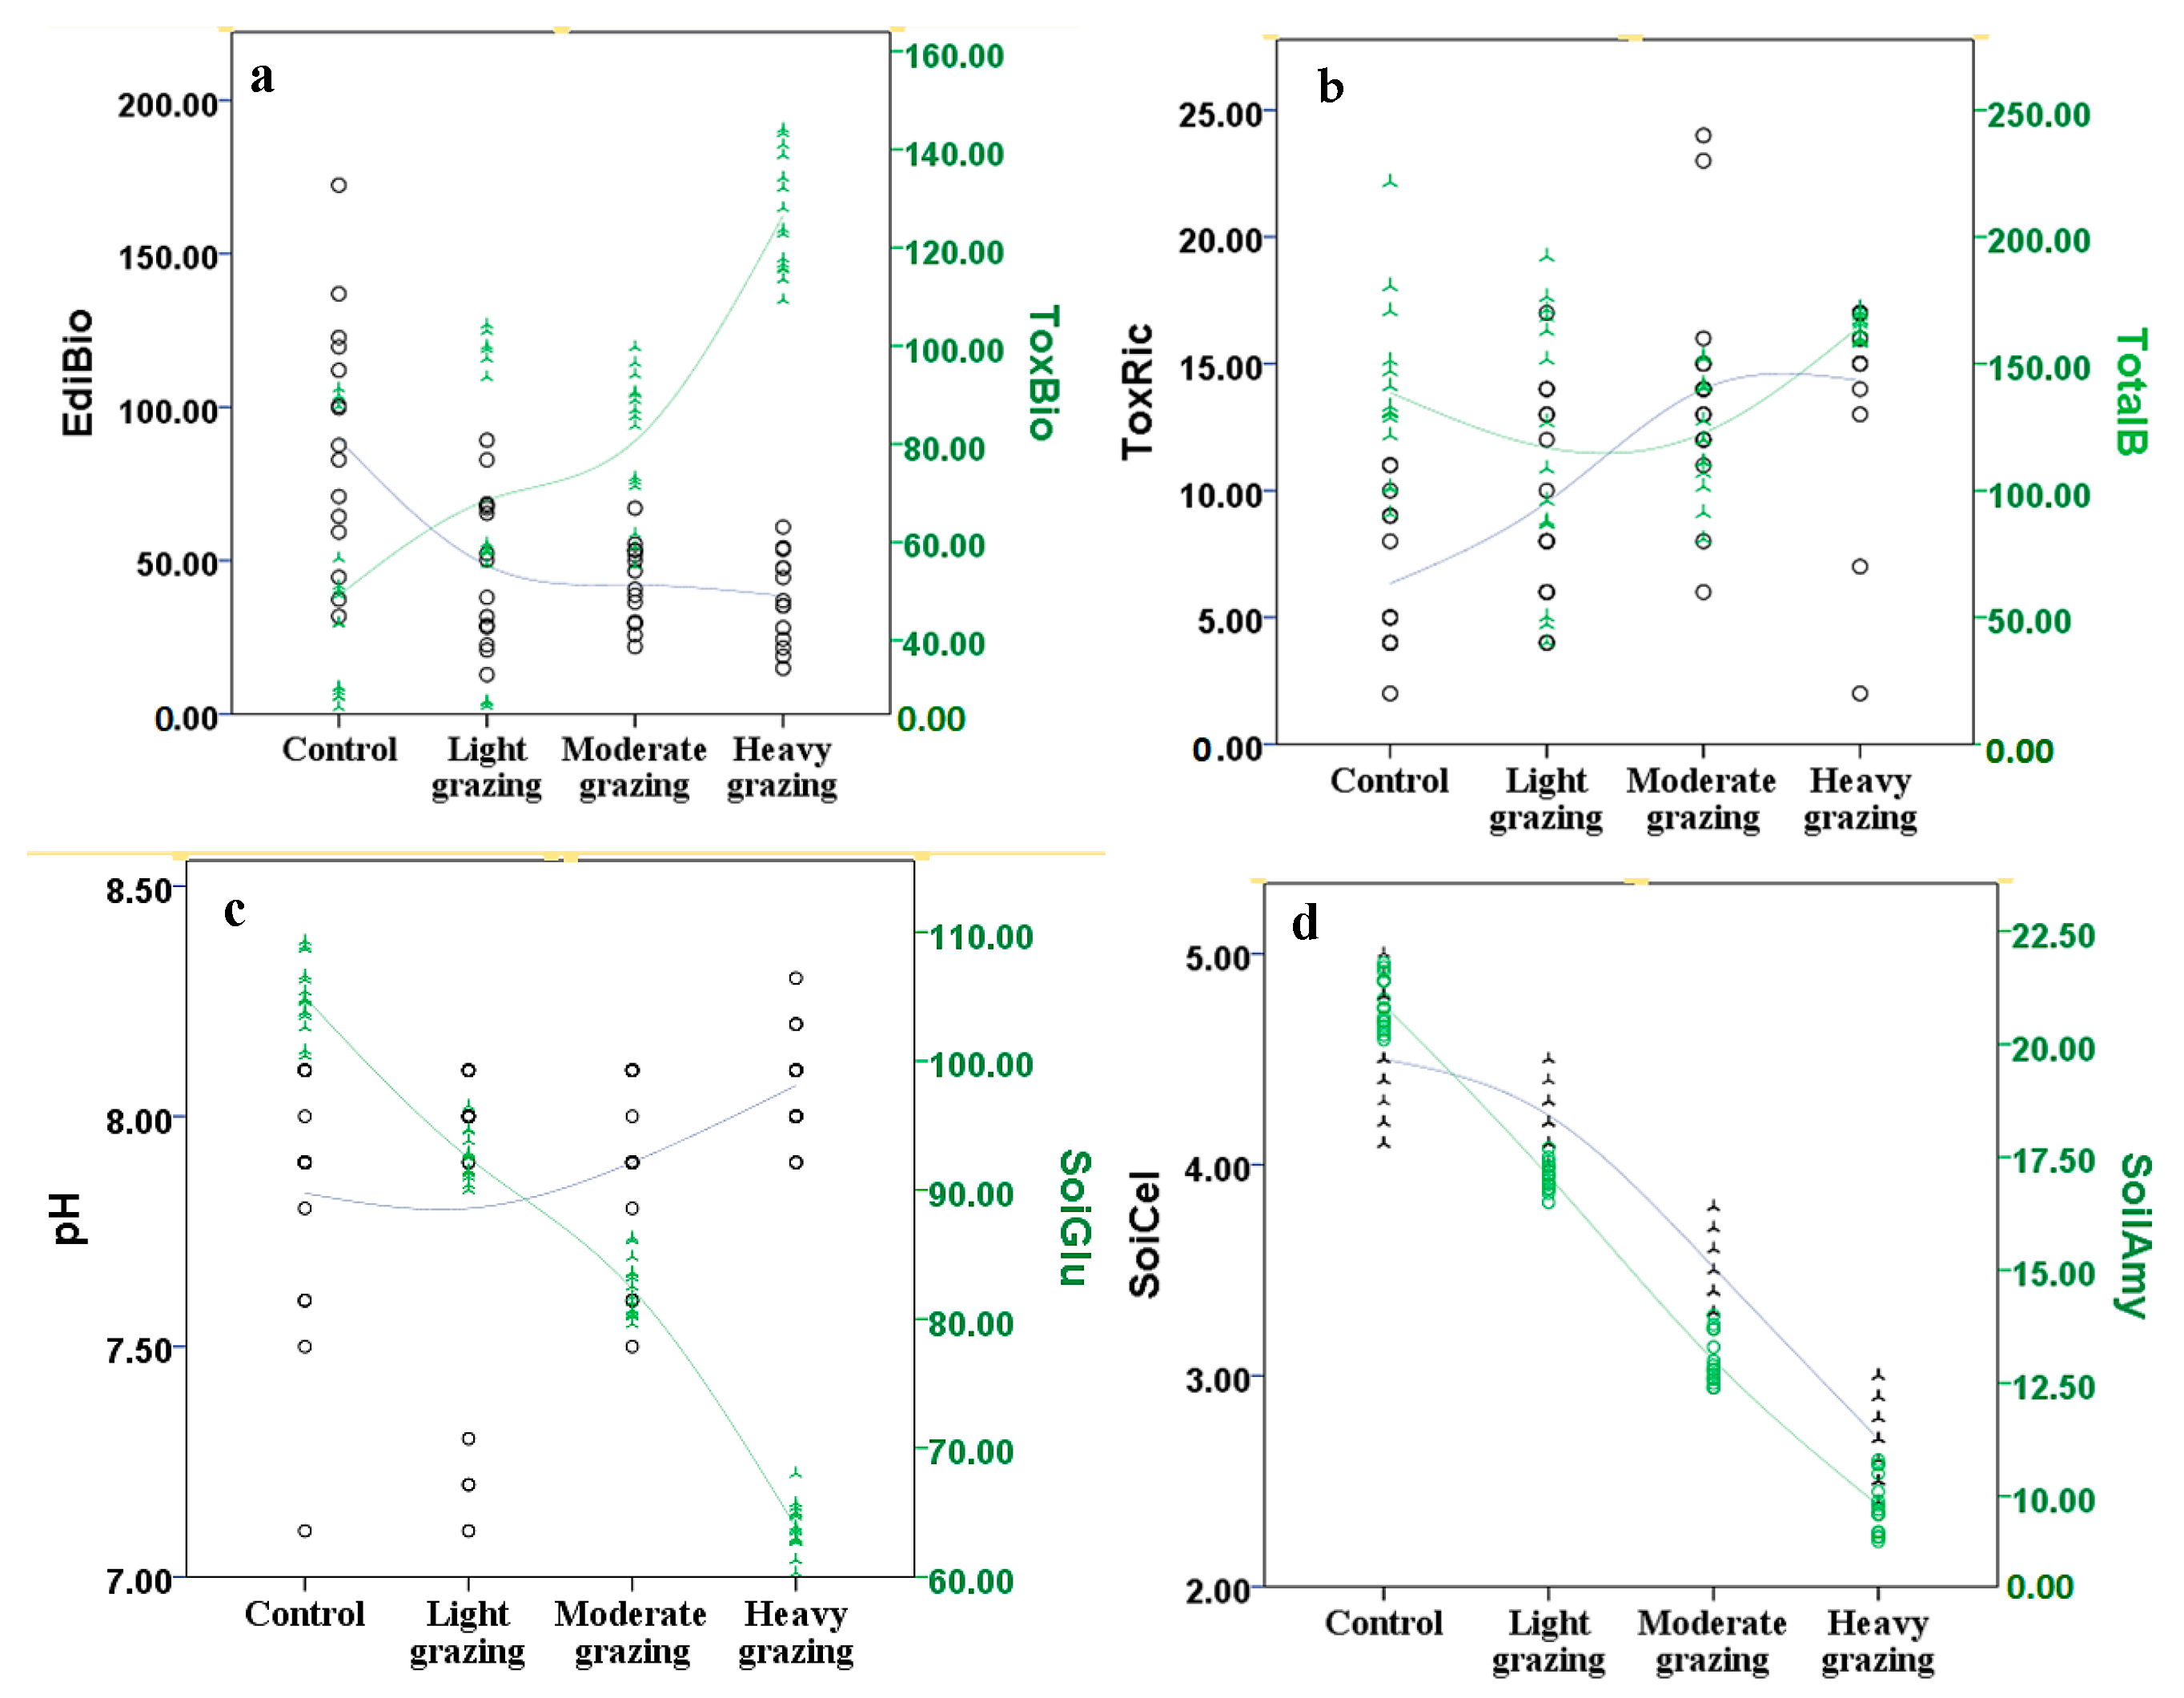
The soil and vegetation characteristics exhibited significant alterations after 5 years of exposure to various grazing intensities. Figure 4 illustrates the interrelated changes in key vegetation and soil characteristics corresponding to different grazing pressures. Focusing on vegetation, the most pronounced changes were observed in the biomass and the abundance of toxic weeds. In essence, as grazing intensity escalated, the biomass of forage species experienced a significant decline, while the biomass of toxic weed species significantly increased (Figure 4a). Furthermore, under heavy grazing conditions, the diversity of toxic species showed a significant rise in comparison to the other treatments (Figure 4b). Conversely, the biological and chemical properties of the soil underwent significant modifications due to varying grazing intensities. An increase in livestock grazing intensity led to a rise in pH values (Figure 4c), and concurrently, the activities of soil glucosidase, amylase, and cellulase experienced a significant reduction (Figure 4d).
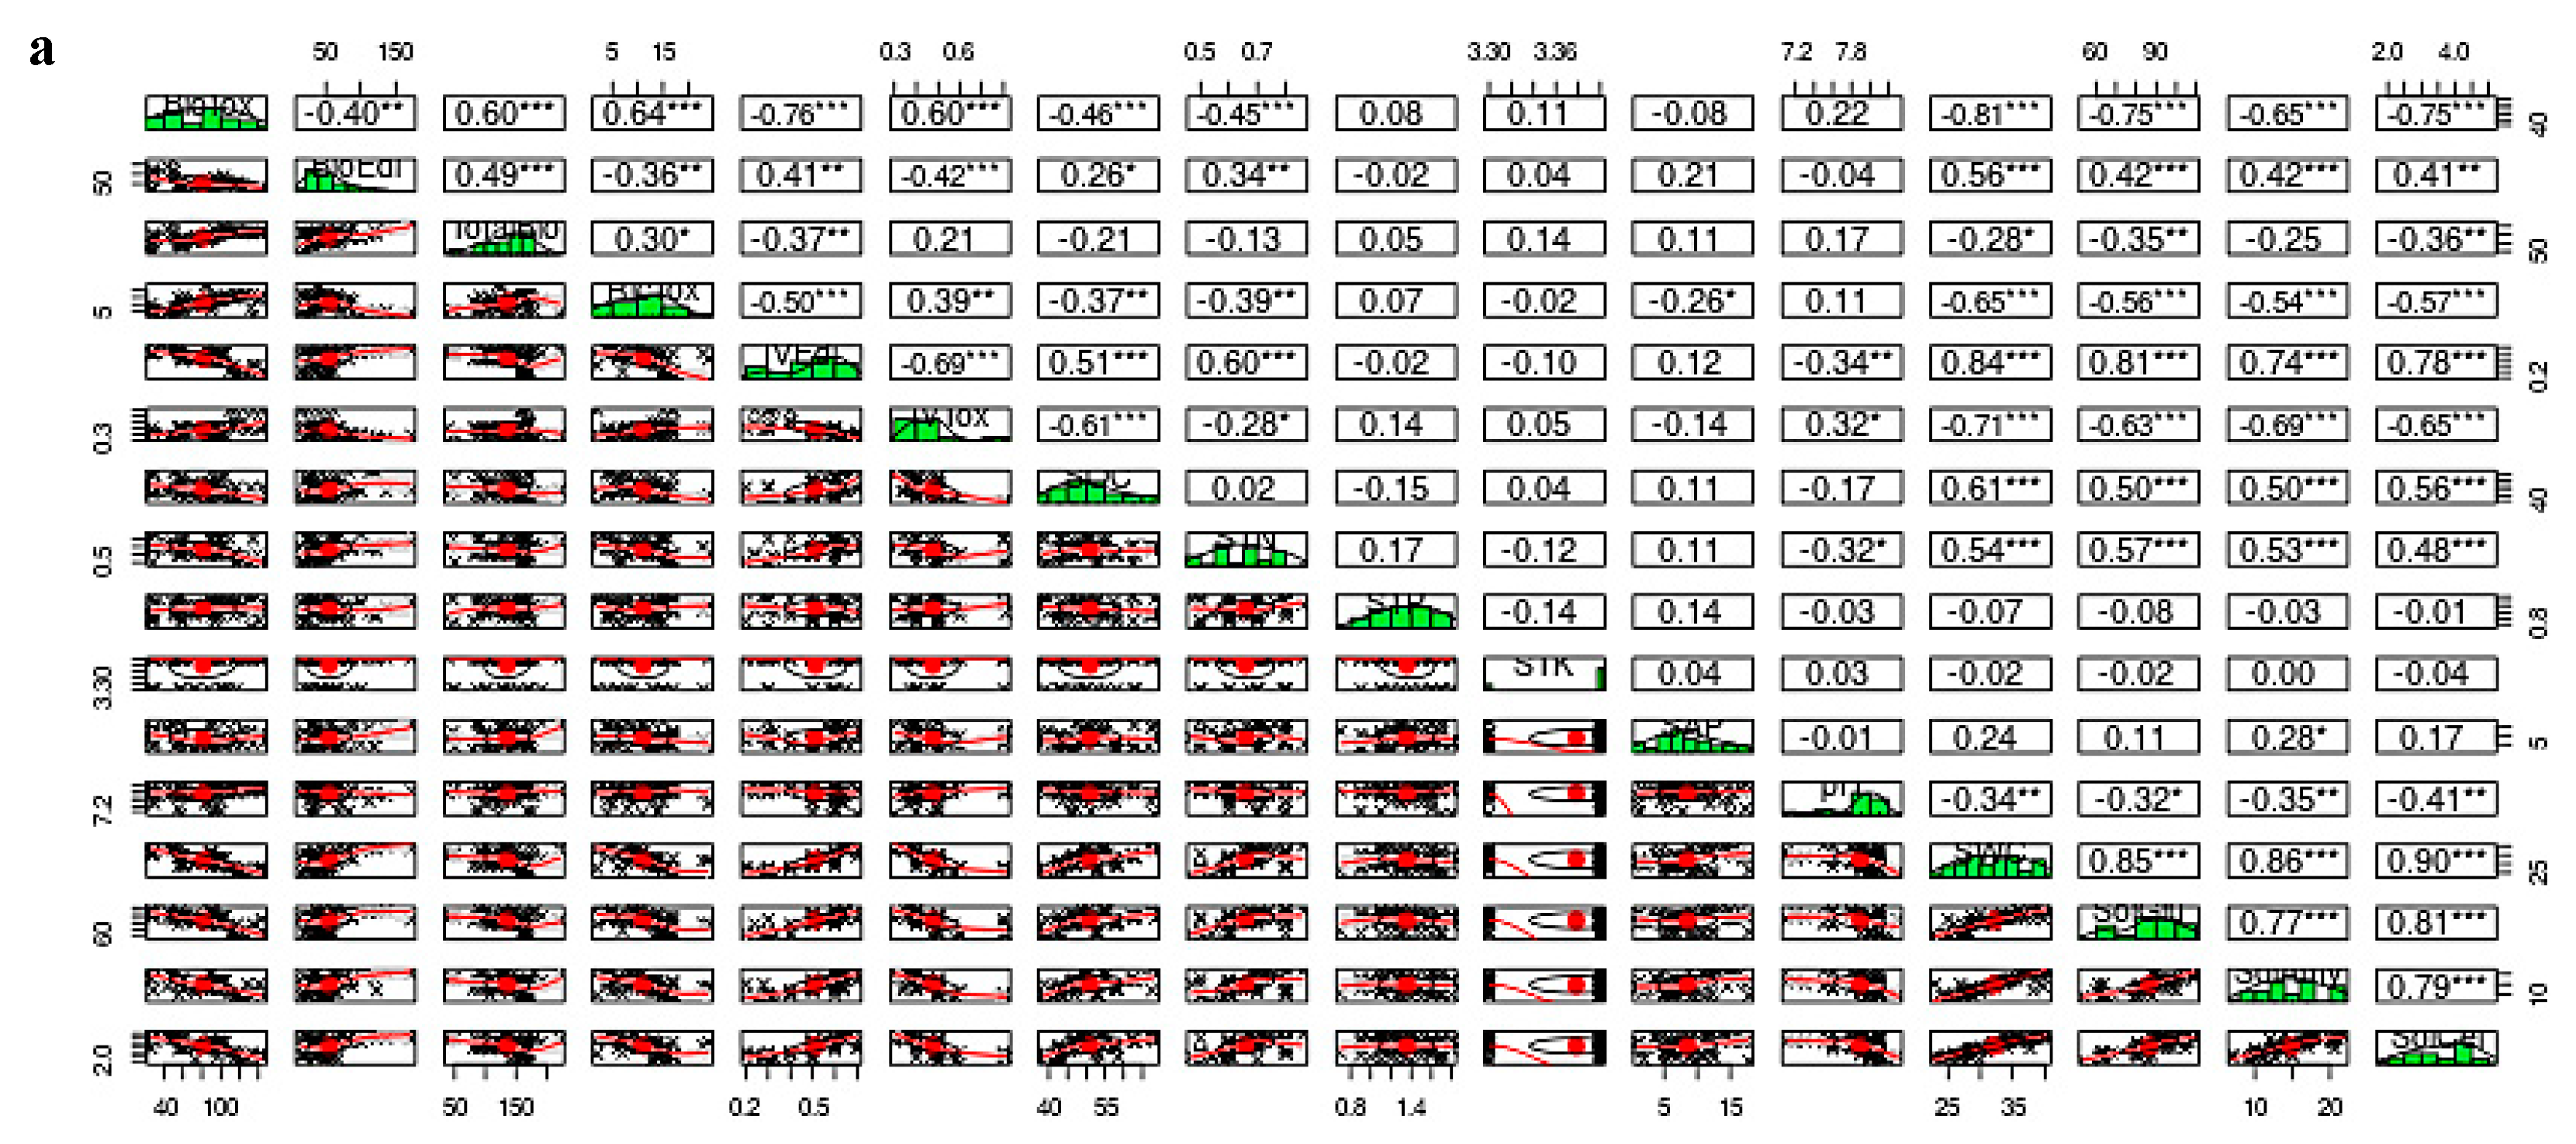
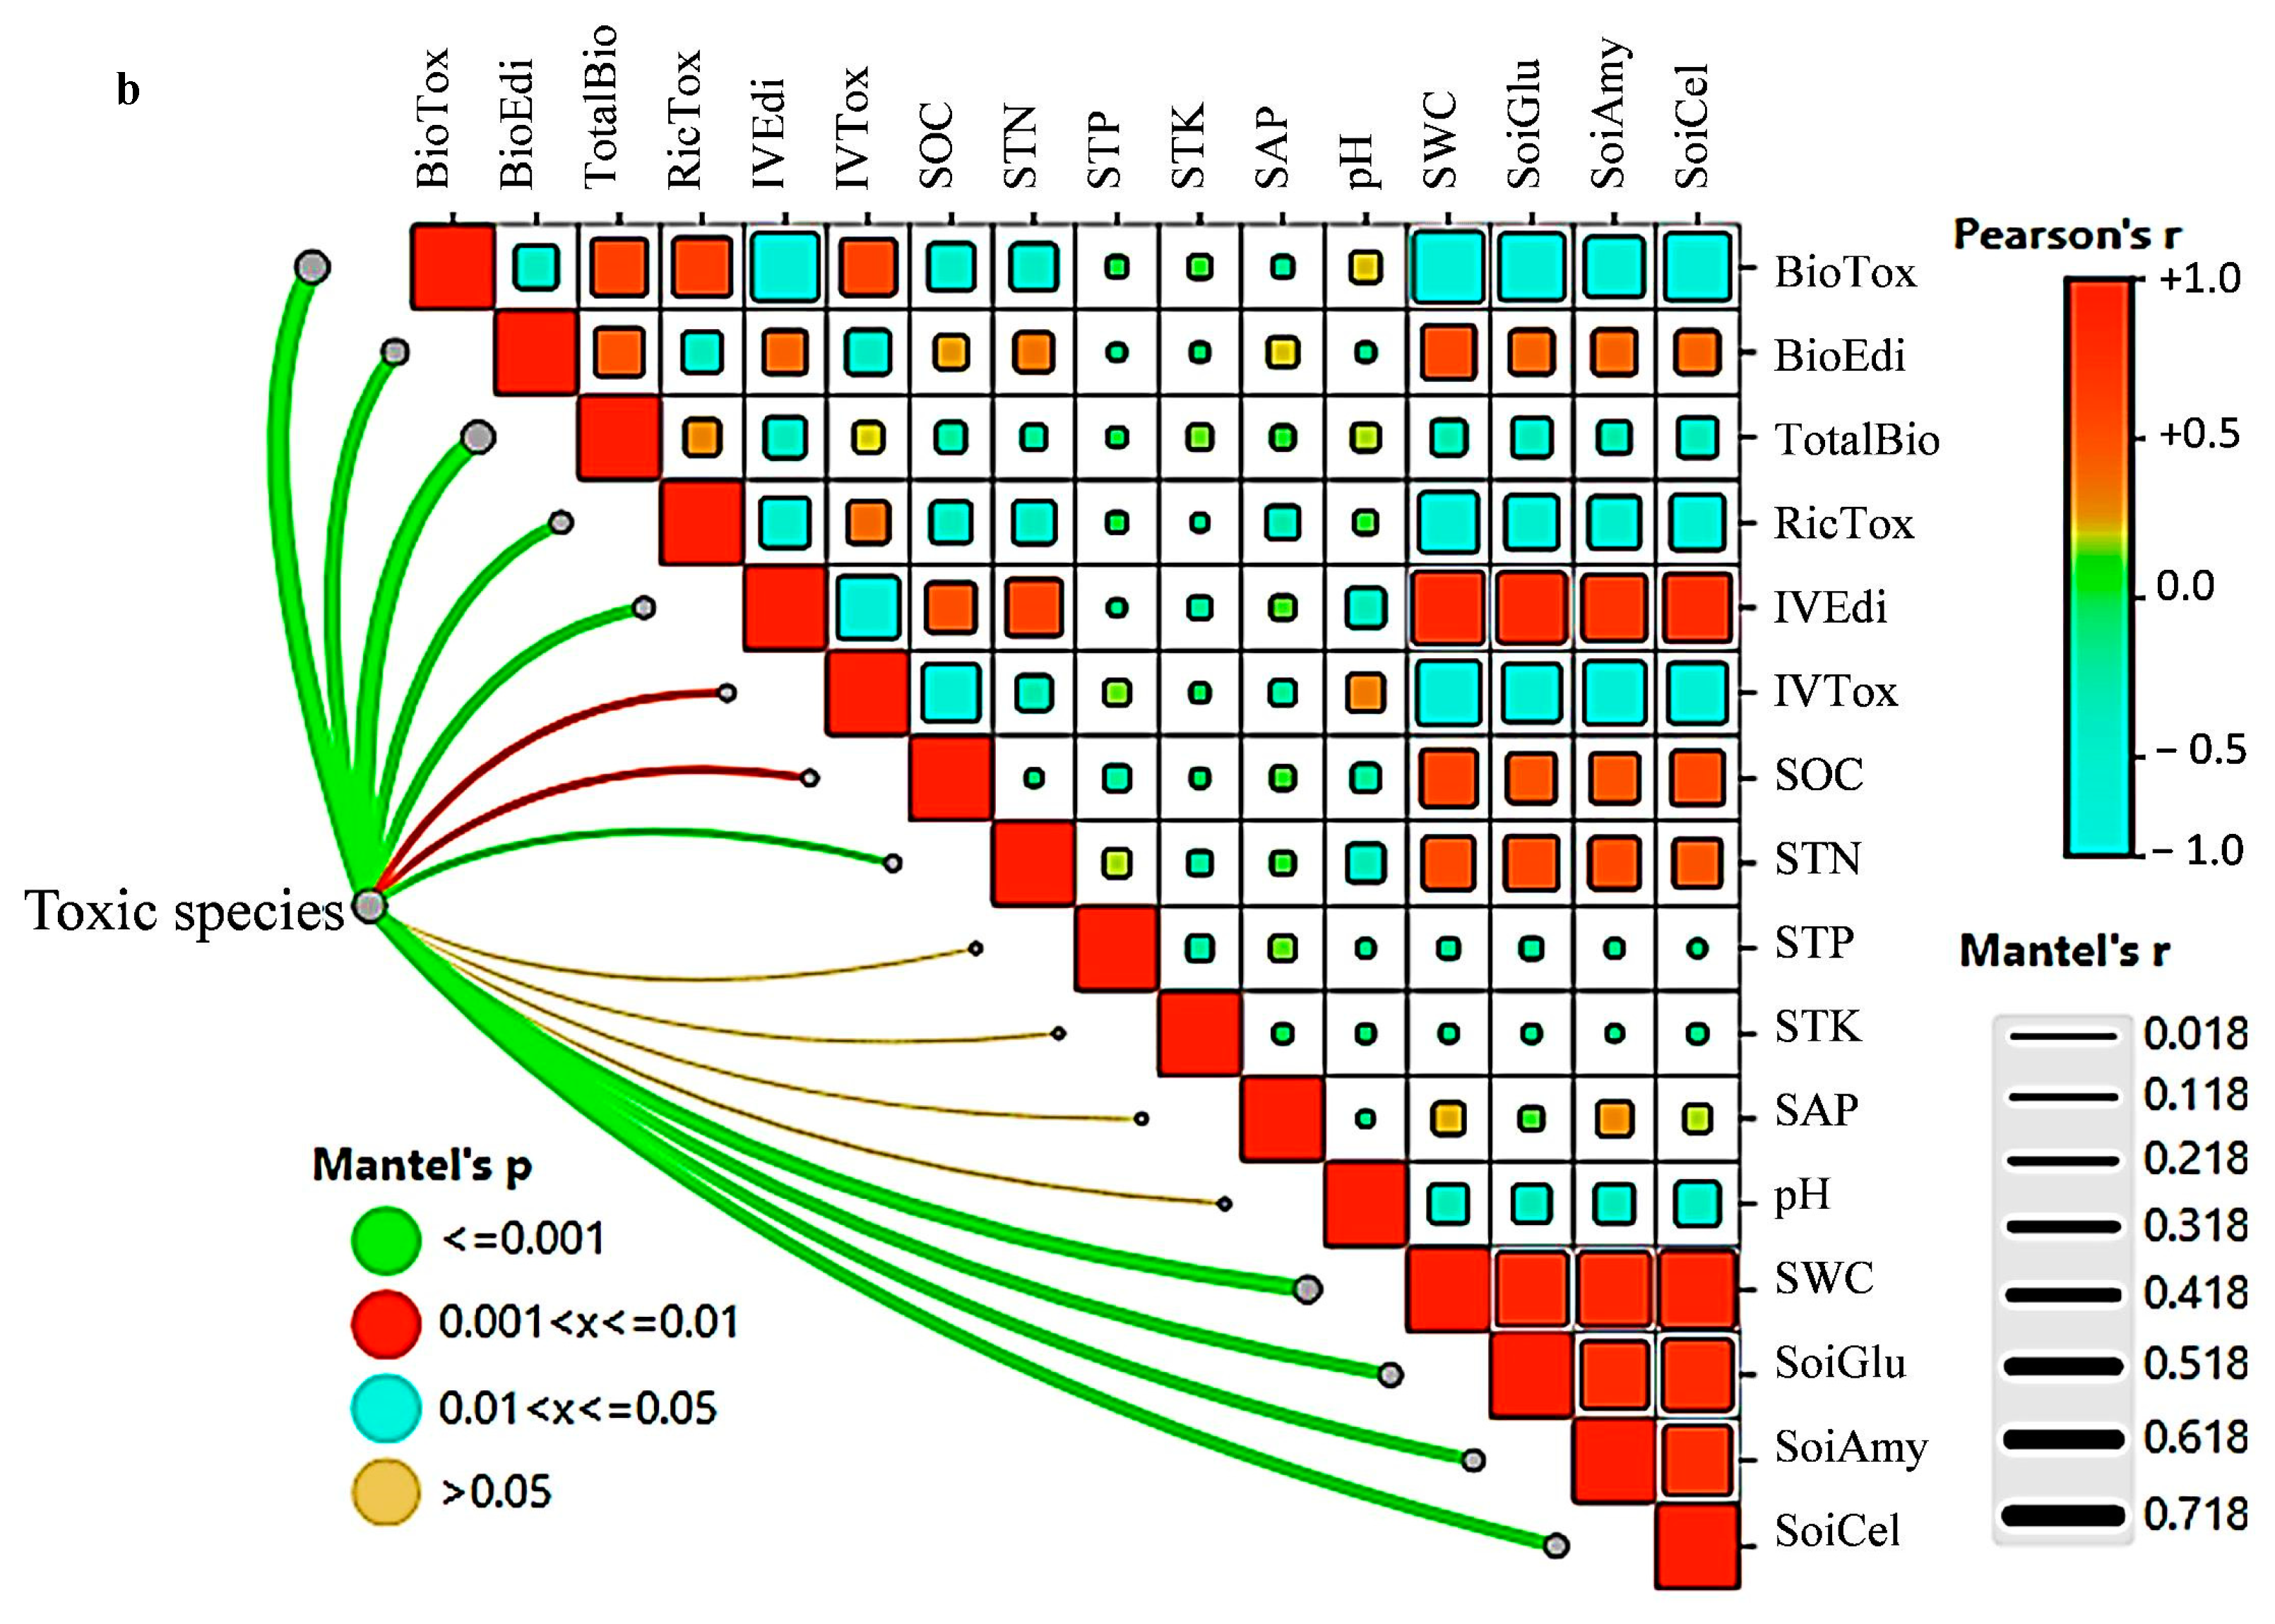
The correlation between the soil properties and vegetation properties revealed that certain properties, such as the biomass of highly toxic weed species, were significantly and negatively correlated with soil water content and soil glucosidase, amylase, and cellulase, with coefficients of −0.81, −0.75, −0.65, and −0.75, respectively (Figure 5a). Additionally, the relative importance value of toxic species exhibited a significant negative correlation with water content, glucosidase, amylase, and cellulase, with coefficients of −0.75, −0.67, −0.72, and −0.67, respectively. Conversely, the importance value of grazed species was significantly and positively correlated with soil water content, glucosidase, amylase, and cellulase, with coefficients of 0.86, 0.83, 0.76, and 0.79, respectively. Against this backdrop, the soil nitrogen and carbon properties displayed a negative correlation with the increase in toxic species and a positive correlation with grazed species. Furthermore, the Mantel test indicated that the composition of toxic weeds was significantly correlated with the composition of edible species, soil chemical properties, and enzyme activities under varying grazing intensities (Figure 5b).

4. Discussion

Over the course of five years, as livestock grazing influenced the soil properties in the alpine meadow, significant alterations occurred in the structure and composition of the vegetation. The number of palatable plant species diminished considerably with escalating livestock grazing intensity. In effect, some edible species vanished under intense grazing pressures. Conversely, the prevalence of toxic weeds rose in tandem with grazing intensity. This trend was evident not only in the heightened abundance of toxic weeds but also in their biomass production, which surged notably with increasing grazing intensity, exhibiting a marked disparity compared to the biomass of high-quality species.
According to the results, as grazing intensity increased and the number of edible species decreased, toxic weeds significantly increased. This change was evident not only in the biomass value but also in the emergence of new toxic weeds. These changes indicated the poor conditions of the water and soil under heavy grazing intensity, suggesting that in some cases, the allelopathy of toxic weed species may be an important factor in their diffusion. This is because it not only inhibits seed germination and the seedling growth of edible forages and other grass species but also hinders reproduction [21].
Although toxic weeds were present under the control conditions, their biomass was much lower than that of the desirable species. Similarly, other studies have shown that some toxic species naturally occur and may not be eliminated by enclosure or a lack of grazing. However, under adverse ecological conditions where desirable species are weakened, toxic invasive species will significantly increase [32].
In this study, the species importance value (IV)—a composite measure of plant abundance, density, and cover—emerged as a crucial indicator influenced by livestock grazing intensity. Indeed, as livestock grazing intensity increased, the relative importance of toxic weeds also rose, whereas the importance of edible species declined.
Consistent with these findings, Demeter et al. also demonstrated that moderate grazing is a practical solution for controlling invasive and toxic weeds [20]. Invasive species are abundant even in the absence of livestock grazing, but with grazing, the coverage of these species has significantly decreased. From an economic perspective, vegetation should be grazed to sustain the livestock industry.
Under grazing conditions, competition among plants for environmental resources is a significant factor contributing to changes in vegetation cover [26,33]. Conversely, under normal conditions, a defense mechanism exists where dominant species inhibit the dispersal of seeds from less competitive species [32]. In reality, light grazing causes minimal changes to the soil environment. However, with heavy grazing, substantial alterations in soil properties lead to pronounced changes in the plant community of the alpine meadow. This is crucial for identifying indicator species under various livestock grazing intensities [46].
A study on species abundance and diversity in this region revealed that as livestock grazing intensity increases, the diversity of beneficial species declines while the diversity of toxic species rises. Although grassland biodiversity is crucial for providing multiple ecosystem functions, a concept known as ecosystem multifunctionality [38], the presence of toxic weeds under heavy grazing intensity does increase diversity. However, this increase is ecologically and economically destructive. On the one hand, ecosystems with a higher diversity of desirable plants are more resilient to the dominance of invasive and toxic species [26].
Thus, the decline in the population of desired species will ultimately result in a rise in invasive and toxic weeds. Long-term vegetation management and the conservation of valuable species can prevent destructive changes in vegetation and the proliferation of toxic and invasive species [28,34]. It is important to note that grazing exclusion and non-grazing practices alone have led to a reduction in plant diversity [38].
Zeynivand et al. also disclosed that heavy grazing was related to greater abundance, vegetation, and diversity indices in invasive toxic plants in the semi-steppe rangelands of Iran’s Kabirkoh [26]. Therefore, by shifting the dominant plant species under grazing management, applying moderate grazing could be a good management strategy to maintain palatable species and minimize undesirable species in the overall species composition, especially in grasslands [37]. Usman et al. also demonstrated that soil physiochemical and biological properties significantly changed under various grazing intensities, resulting in changes to plant community properties and diversity in the Loess Plateau [47]. On the other hand, increasing livestock grazing intensity, through its direct effects and trampling, leads to the destruction of new plant species. Species more sensitive to trampling will be more damaged. Overall, toxic species are also more resistant to trampling. Similar findings from Aranda et al. indicated that under heavy grazing intensity, trampling by livestock directly causes the destruction of small plants and newly sprouted plants [48].
Upon examining the relationship between the composition and structure of vegetation cover and the physical and chemical properties of the soil in this area, it was observed that increased livestock grazing intensity over the years has led to changes in soil properties. Generally, as livestock grazing intensity increases, the soil moisture content in this area also decreases sharply. Previous studies in alpine grasslands have reported that moisture was one of the factors influencing changes in the structure of vegetation cover. Under the influence of grazing intensity, this led to a reduction in soil moisture and the loss of valuable species, and ultimately fostered adverse ecological conditions conducive to desertification in the area [15].
In this study, mineral depletion, such as of phosphorus, was also correlated with the abundance of toxic weeds under heavy grazing. Similar to this finding, previous studies in this region have also shown that changing the amount of available phosphorus is one of the most important factors in increasing vegetation cover and biomass [11]. Similarly, Xiang et al. reported that grazing altered vegetation composition and diversity through changes in soil characteristics, such as soil fertility, in alpine grasslands [11].
Soil enzymes were also significantly correlated with soil chemical factors and plant characteristics, and showed changes strongly influenced by livestock grazing intensity. Alterations in soil enzymes were significantly correlated with moisture content and the levels of phosphorus and nitrogen. These findings aligned with those of other studies, which reported that with the degradation of or reduction in vegetation cover due to factors such as livestock grazing and soil dryness, the quantity of soil enzymes also decreased sharply [49,50,51]. The robust relationship between soil enzymes, including glucosidase and cellulase, and elements such as nitrogen and phosphorus highlighted the critical role these enzymes play in recycling elements within changing soil conditions. The return of plant materials to the soil significantly boosted enzyme activity [33,51,52]. Consequently, by altering the biochemical properties, the soil quality in heavily grazed areas diminishes, which in turn leads to a decline in valuable species and an increase in invasive species [53].
In this study, however, only Tibetan sheep were used. Fundamentally, different animals have distinct food preferences. Selecting an appropriate animal can also be effective in the biological control of vegetation, thereby influencing livestock management and grazing practices. This, in turn, alters the composition of the vegetation community, diminishes the competitive ability of dominant palatable species, and permits the invasion of weedy or toxic grasses to replace palatable species [4,54,55]. Consequently, understanding the mechanisms behind the proliferation of toxic and invasive species, along with the implementation of practices such as grazing management, can serve as the most effective vegetation management strategies in these areas [34,56]. Further data are required to fully evaluate the environmental and economic impact of noxious range weeds [6].

5. Conclusions

The impact of varying livestock grazing intensities on the dynamics of toxic species within alpine meadows was studied over a five-year period. The findings indicated that as livestock grazing intensity increased, there were significant alterations in the structure and composition of the vegetation. The abundance and biomass of toxic species rose concurrently with the intensification of grazing. Conversely, the biomass of species with high preference and edibility values experienced a severe decline. Certain toxic species emerged under heavy and relatively heavy grazing conditions, whereas some beneficial species vanished. Plant diversity underwent notable changes, with a general trend in increasing diversity among toxic species as grazing intensity increased. An evaluation of the correlation between soil properties and vegetation characteristics revealed that under heavy grazing, soil moisture content and fertility properties diminished considerably. The available potassium content in the soil was directly correlated with the productivity and growth of beneficial species. The effective management of alpine meadow vegetation can be achieved through the proper application of livestock grazing and a comprehensive understanding of the reproductive mechanisms of toxic weeds, which can enhance vegetation health, boost native species populations, and reduce the prevalence of toxic species.
However, in this study, only changes in toxic weeds and high-quality species under livestock grazing intensities over a 5-year period were investigated. Therefore, the following suggestions are made for future studies in alpine meadow grasslands:
It is necessary to study the dynamic changes in toxic weeds and take into account weather conditions and changes in the physical properties of the soil in this area over a long period (10 to 15 years).
The mechanisms behind the competition between toxic weeds and edible plants under livestock grazing remain unknown. These mechanisms encompass seed germination and the growth and reproduction of plants. Understanding this information can be effective in determining the optimal timing for livestock grazing and managing vegetation.
Studying the reproductive methods of toxic and non-toxic species, particularly under conditions of heavy grazing, is essential for managing livestock grazing.
Additionally, while investigating the impact of livestock grazing intensities on the dynamics of toxic weed species in this area, it is essential to record environmental factors such as variations in precipitation and temperature, as well as changes in soil physical properties, including compaction.

Author Contributions

B.C.: Conceptualization, methodology, investigation, and writing—original draft. X.M.: Conceptualization, methodology, data curation, software, formal analysis, and visualization. X.Z. (Xiaolei Zhou): Conceptualization, methodology, data curation, software, formal analysis, visualization, supervision, project administration, validation, and funding acquisition. X.Z. (Xiaowei Zhang): Conceptualization, data curation, and writing—review and editing. X.W.: Conceptualization, methodology, formal analysis, and writing—review and editing. Z.L., X.Y., S.L., and W.D.: Data curation, investigation, and writing—review and editing. All authors have read and agreed to the published version of the manuscript.

Funding

This work was supported by the Global Environment Facility ecosystem cooperation planning project (GEF/OP12) “Study on Forest succession Dynamics and Mechanism of Spruce-Abies Burning site in Northeast margin of Qinghai-Tibet Plateau” [03619078] and Gansu Provincial Science and Technology Plan under Grant No. 25YFWA008.

Data Availability Statement

The original contributions of datasets presented in the study are included in the article which are not readily available because the data are part of an ongoing study or due to time limitations.

Acknowledgments

Financial support for this study was provided by the PRC-GEF Foundation Project (GS-GEF/OP12) and Gansu Provincial Science and Technology Plan under Grant No. 25YFWA008. The authors extend their sincere appreciation to Peter Long (ecologist, New Zealand) and thanks to the staff from the Urat Desert-Grassland Research Station of the Northwest Institute of Eco-Environment and Resources, Chinese Academy of Sciences, for their field assistance.

Conflicts of Interest

The authors declare that the research was conducted in the absence of any commercial or financial relationships that could be construed as a potential conflict of interest.

References

  1. Dai, J.; Roberts, D.A.; Stow, D.A.; An, L.; Hall, S.J.; Yabiku, S.T.; Kyriakidis, P.C. Mapping understory invasive plant species with field and remotely sensed data in Chitwan, Nepal. Remote Sens. Environ. 2020, 250, 112037. [Google Scholar] [CrossRef]
  2. Gaskin, J.F.; Espeland, E.; Johnson, C.D.; Larson, D.L.; Mangold, J.M.; McGee, R.A.; Milner, C.; Paudel, S.; Pearson, D.E.; Perkins, L.B.; et al. Managing invasive plants on Great Plains grasslands: A discussion of current challenges. Rangel. Ecol. Manag. 2020, 78, 235–249. [Google Scholar] [CrossRef]
  3. Melo, A.K.P.; Albuquerque, J.A.A.; Siqueira, R.H.S.; da Silva, E.E.; de Medeiros, R.D.; Souza, K.T.S.; Souza, L.T.; Goncalves, A.C.M.; Soares, M.B.B. Occurrence of noxious weeds under different soil management systems. Appl. Ecol. Environ. Res. 2021, 19, 2061–2072. [Google Scholar]
  4. Hu, Y.; Gou, X.; Tsunekawa, A.; Cheng, Y.; Hou, F. Assessment of the vegetation sensitivity index in alpine meadows with a high coverage and toxic weed invasion under grazing disturbance. Front. Plant Sci. 2022, 13, 1068941. [Google Scholar] [CrossRef]
  5. Mangold, J.M.; Fuller, K.B.; Davis, S.C.; Rinella, M.J. The Economic Cost of Noxious Weeds on Montana Grazing Lands. Invasive Plant Sci. Manag. 2018, 11, 96–100. [Google Scholar] [CrossRef]
  6. Lacey, J.R.; Olson, B.E. Environmental and economic impacts of noxious range weeds. In Noxious Range Weeds; CRC Press: Boca Raton, FL, USA, 2021; pp. 5–16. [Google Scholar]
  7. Ma, Y.; Liu, Y.; Rodrigo-Comino, J.; López-Vicente, M.; Shi, Z.; Wu, G.-L. Artificially cultivated grasslands decrease the activation of soil detachment and soil erodibility on the alpine degraded hillslopes. Soil Tillage Res. 2024, 243, 106176. [Google Scholar] [CrossRef]
  8. Wang, L.; Jia, Z.; Li, Q.; He, L.; Tian, J.; Ding, W.; Liu, T.; Gao, Y.; Zhang, J.; Han, D.; et al. Grazing Impacts on Soil Enzyme Activities Vary with Vegetation Types in the Forest-Steppe Ecotone of Northeastern China. Forests 2023, 14, 2292. [Google Scholar] [CrossRef]
  9. Li, P.; Zhu, W.; He, B. Regional differences in the impact paths of climate on aboveground biomass in alpine grasslands across the Qinghai-Tibet Plateau. Sci. Total. Environ. 2024, 947, 174421. [Google Scholar] [CrossRef]
  10. Scasta, J.D.; Jorns, T.; Derner, J.D.; Stam, B.; McClaren, M.; Calkins, C.; Stewart, W. Technical note: Toxic plants in sheep diets grazing extensive landscapes: Insights from Fecal DNA metabarcoding. Livest. Sci. 2020, 236, 104002. [Google Scholar] [CrossRef]
  11. Xiang, M.; Wu, J.; Duo, L.; Niu, B.; Zhang, X. The effects of grazing and fencing on grassland productivity and diversity in alpine grassland ecosystem in the Tibetan highland. Glob. Ecol. Conserv. 2023, 44, e02495. [Google Scholar] [CrossRef]
  12. Watson, B.L.; Lukas, S.B.; Morris, L.R.; DeBano, S.J.; Schmalz, H.J.; Leffler, A.J. Forb community response to prescribed fire, livestock grazing, and an invasive annual grass in the Pacific Northwest Bunchgrass Prairie. Appl. Veg. Sci. 2021, 24, e12619. [Google Scholar] [CrossRef]
  13. Xiang, M.; Wu, J.; Wu, J.; Guo, Y.; Lha, D.; Pan, Y.; Zhang, X. Heavy Grazing Altered the Biodiversity–Productivity Relationship of Alpine Grasslands in Lhasa River Valley, Tibet. Front. Ecol. Evol. 2021, 9, 698707. [Google Scholar] [CrossRef]
  14. Lin, L.; Xu, X.L.; Cao, G.M.; Zhang, F.W.; Li, Y.K.; Huang, J.J. Self-stabilizing maintenance process in plant communities of alpine meadows under different grazing intensities. Grassl. Res. 2023, 2, 140–152. [Google Scholar] [CrossRef]
  15. Sun, J.; Hou, G.; Liu, M.; Fu, G.; Zhan, T.; Zhou, H.; Tsunekawa, A.; Haregeweyn, N. Effects of climatic and grazing changes on desertification of alpine grasslands, Northern Tibet. Ecol. Indic. 2019, 107, 105647. [Google Scholar] [CrossRef]
  16. Sun, J.; Zhan, T.; Liu, M.; Zhang, Z.; Wang, Y.; Liu, S.; Wu, G.-L.; Liu, G.; Tsunekawa, A. Verification of the biomass transfer hypothesis under moderate grazing across the Tibetan plateau: A meta-analysis. Plant Soil 2019, 458, 139–150. [Google Scholar] [CrossRef]
  17. Song, Z.; Li, X.; Su, X.; Li, C. Analyzing the recovery mechanisms of patchy degradation and its response to mowing and plateau pika disturbances in alpine meadow. Ecol. Indic. 2023, 154, 110565. [Google Scholar] [CrossRef]
  18. Li, W.; Hooper, D.U.; Wu, L.; Bakker, J.D.; Gianuca, A.T.; Wu, X.B.; Taube, F.; Wang, C.; Bai, Y. Grazing regime alters plant community structure via patch-scale diversity in semiarid grasslands. Ecosphere 2021, 12, e03547. [Google Scholar] [CrossRef]
  19. Cronk, Q.C.; Fuller, J.L. Plant Invaders: The Threat to Natural Ecosystems; Routledge: London, UK, 2014. [Google Scholar]
  20. Demeter, L.; Molnár, Á.P.; Bede-Fazekas, Á.; Öllerer, K.; Varga, A.; Szabados, K.; Tucakov, M.; Kiš, A.; Biró, M.; Marinkov, J.; et al. Controlling invasive alien shrub species, enhancing biodiversity and mitigating flood risk: A win–win–win situation in grazed floodplain plantations. J. Environ. Manag. 2021, 295, 113053. [Google Scholar] [CrossRef]
  21. García-Llorente, M.; Martín-López, B.; González, J.A.; Alcorlo, P.; Montes, C. Social perceptions of the impacts and benefits of invasive alien species: Implications for management. Biol. Conserv. 2008, 141, 2969–2983. [Google Scholar] [CrossRef]
  22. Lorenz, R.J.; Dewey, S.A. Noxious weeds that are poisonous. In The Ecology and Economic Impact of Poisonous Plants on Livestock Production; CRC Press: Boca Raton, FL, USA, 2019; pp. 309–336. [Google Scholar]
  23. Belgeri, A.; Bajwa, A.A.; Shabbir, A.; Navie, S.; Vivian-Smith, G.; Adkins, S. Managing an Invasive Weed Species, Parthenium hysterophorus, with Suppressive Plant Species in Australian Grasslands. Plants 2020, 9, 1587. [Google Scholar] [CrossRef]
  24. Xing, F.; An, R.; Wang, B.; Miao, J.; Jiang, T.; Huang, X.; Hu, Y. Mapping the occurrence and spatial distribution of noxious weed species with multisource data in degraded grasslands in the Three-River Headwaters Region, China. Sci. Total. Environ. 2021, 801, 149714. [Google Scholar] [CrossRef]
  25. Rocchini, D.; Hernández-Stefanoni, J.L.; He, K.S. Advancing species diversity estimate by remotely sensed proxies: A conceptual review. Ecol. Inform. 2015, 25, 22–28. [Google Scholar] [CrossRef]
  26. Zeynivand, F.; Ajorlo, M.; Ariapour, A. Effect of Livestock Grazing Intensity on Diversity of Invasive Plant Species in Kabirkuh Mountainous area, Darrehshar Town. Iran. J. Plant Res. 2020, 32, 1–12. [Google Scholar]
  27. Sun, W.; Li, S.; Wang, J.; Fu, G. Effects of grazing on plant species and phylogenetic diversity in alpine grasslands, Northern Tibet. Ecol. Eng. 2021, 170, 106331. [Google Scholar] [CrossRef]
  28. Lyseng, M.P.; Bork, E.W.; Hewins, D.B.; Alexander, M.J.; Carlyle, C.N.; Chang, S.X.; Willms, W.D. Long-term grazing impacts on vegetation diversity, composition, and exotic species presence across an aridity gradient in northern temperate grasslands. Plant Ecol. 2018, 219, 649–663. [Google Scholar] [CrossRef]
  29. Dornbusch, M.J.; Limb, R.F.; Sedivec, K.K. Alternative Alternative grazing management strategies combat invasive grass dom-inance. Nat. Areas J. 2020, 40, 86–95. [Google Scholar]
  30. Dai, L.; Fu, R.; Guo, X.; Ke, X.; Du, Y.; Zhang, F.; Cao, G. Effect of grazing management strategies on alpine grassland on the northeastern Qinghai-Tibet Plateau. Ecol. Eng. 2021, 173, 106418. [Google Scholar] [CrossRef]
  31. Sun, J.J.; Wang, P.B.; Wang, H.B.; Yu, X.J. Changes in plant communities, soil characteristics, and microbial communities in alpine meadows degraded to different degrees by pika on the Qinghai–Tibetan Plateau. Glob. Ecol. Conserv. 2021, 27, e01621. [Google Scholar] [CrossRef]
  32. Porensky, L.M.; McGee, R.; Pellatz, D.W. Long-term grazing removal increased invasion and reduced native plant abundance and diversity in a sagebrush grassland. Glob. Ecol. Conserv. 2020, 24, e01267. [Google Scholar] [CrossRef]
  33. Xu, H.W.; You, C.M.; Tan, B.; Xu, L.; Liu, Y.L.; Wang, M.G.; Xu, Z.F.; Sardans, J.; Peñuelas, J. Effects of livestock grazing on the relationships between soil microbial community and soil carbon in grassland ecosystems. Sci. Total Environ. 2023, 881, 163416. [Google Scholar] [CrossRef]
  34. Beyene, D.; Berhanu, Y.; Angassa, A. Effects of livestock grazing on rangeland condition, plant species richness and wild ungulate population in a semi-arid savannah. Afr. J. Ecol. 2024, 62, e13295. [Google Scholar] [CrossRef]
  35. Qi, X.-L.; Xu, H.-J.; Teng, R.-Y.; Chen, T.; Wang, X.-D. Ecological restoration largely alleviates livestock grazing pressure in a montane grassland. J. Clean. Prod. 2024, 467, 143044. [Google Scholar] [CrossRef]
  36. Chen, S.; Sun, Y.; Wang, Y.; Luo, G.; Ran, J.; Zeng, T.; Zhang, P. Grazing weakens the linkages between plants and soil biotic communities in the alpine grassland. Sci. Total Environ. 2024, 913, 169417. [Google Scholar] [CrossRef]
  37. Zhang, C.; Dong, Q.; Chu, H.; Shi, J.; Li, S.; Wang, Y.; Yang, X. Grassland Community Composition Response to Grazing Intensity Under Different Grazing Regimes. Rangel. Ecol. Manag. 2018, 71, 196–204. [Google Scholar] [CrossRef]
  38. Yu, L.; Sun, W.; Zhang, H.; Cong, N.; Chen, Y.; Hu, J.; Jing, X. Grazing exclusion jeopardizes plant biodiversity effect but enhances dryness effect on multifunctionality in arid grasslands. Agric. Ecosyst. Environ. 2024, 363, 108883. [Google Scholar] [CrossRef]
  39. Nie, X.Q.; Yang, L.C.; Li, F.; Xiong, F.; Li, C.B.; Zhou, G.Y. Storage, patterns and controls of soil organic carbon in the alpine shrubland in the Three Rivers Source Region on the Qinghai-Tibetan Plateau. CATENA 2019, 178, 154–162. [Google Scholar] [CrossRef]
  40. Liu, Y.; Liu, Z.H.; Deng, L.; Wu, G.L. Species diversity and functional groups responses to different seasonal grazing in alpine grassland. Pratacultural Sci. 2016, 33, 1403–1409. [Google Scholar]
  41. Li, X.; Li, G.J.; Kang, X.H.; Pu, W.J.; Huang, W.L.; Zhang, J.Y. Livestock carrying capacity analysis and coping strategy of overgrazing in natural grassland of Maqu. Gansu Sci. Technol. 2023, 39, 4–8. [Google Scholar]
  42. Zhou, X.L.; Yan, Y.E.; Zhang, J.; Zhou, X.J.; Yan, Y.Q.; Yang, F.Q.; Cao, X.P.; Zhao, A.; Zhao, Y.L.; Su, J.Y. Vegetation community structure and diversity in a burned area of Picea asperata-Abies fabri forest on different aspects on the northeastern margin of the Qinghai-Tibetan Plateau. Acta Prataculture Sin. 2022, 31, 144–155. [Google Scholar]
  43. Li, M.; Zhang, K.R.; Yan, Z.Q.; Liu, L.; Kang, E.Z.; Kang, X.M. Soil Water Content Shapes Microbial Community Along Gradients of Wetland Degradation on the Tibetan Plateau. Front. Microbiol. 2022, 13, 824267. [Google Scholar] [CrossRef]
  44. Ebregt, A.; Boldewijn, J.M.A.M. Influence of heavy metals in spruce forest soil on amylase activity, CO2 evolution from starch and soil respiration. Plant Soil 1977, 47, 137–148. [Google Scholar] [CrossRef]
  45. Guan, S.Y.; Zhang, D.; Zhang, Z. Soil Enzyme and Its Research Methods; Agriculturre Press: Beijing, China, 1986; pp. 274–297. [Google Scholar]
  46. Pei, L.; Wu, Z.; Qian, Y.; Li, X.; Zhang, J.; Sun, J.; Wang, Y. Plant community stability, indicator species and their driving factors at a gradient of grazing intensity in an alpine meadow. Ecol. Indic. 2024, 162, 112012. [Google Scholar] [CrossRef]
  47. Usman, M.; Li, L.; Wang, M.; Wang, Z.; Hu, A.; Shi, L.; Hou, F. Response of microbial communities to the changes in grazing intensity and season in a typical steppe. Environ. Res. 2024, 246, 118126. [Google Scholar] [CrossRef] [PubMed]
  48. Aranda, M.J.; Tognetti, P.M.; Mochi, L.S.; Mazía, N. Intensive rotational grazing in pastures reduces the early establishment of an invasive tree species. Biol. Invasions 2023, 25, 3137–3150. [Google Scholar] [CrossRef]
  49. Li, Q.; Sun, Y.N.; Lin, L.; Li, Y.K.; Du, Y.G.; Guo, X.W.; Yang, Y.S.; Cao, G.M. Changes of soil enzyme activities and nutrients across different succession stages of grazing alpine Kobresia grassland. J. Appl. Ecol. 2019, 30, 2267–2274. [Google Scholar]
  50. dos Santos, J.V.; Bento, L.R.; Bresolin, J.D.; Mitsuyuki, M.C.; Oliveira, P.P.A.; Pezzopane, J.R.M.; de Campos Bernardi, A.C.; Mendes, I.C.; Martin-Neto, L. The long-term effects of intensive grazing and silvopastoral systems on soil physicochemical properties, enzymatic activity, and microbial biomass. CATENA 2022, 219, 106619. [Google Scholar] [CrossRef]
  51. Garbuz, S.; Mackay, A.; Camps-Arbestain, M.; DeVantier, B.; Minor, M. Biochar increases soil enzyme activities in two contrasting pastoral soils under different grazing management. Crop Pasture Sci. 2022, 74, 101–111. [Google Scholar] [CrossRef]
  52. Wang, X.; Zi, H.B.; Wang, J.B.; Guo, X.W.; Zhang, Z.H.; Yan, T.; Wang, Q.; He, J.S. Grazing-induced changes in soil microclimate and aboveground biomass modulate freeze–thaw processes in a Tibetan alpine meadow. Agric. Ecosyst. Environ. 2023, 357, 108659. [Google Scholar] [CrossRef]
  53. Zhang, X.; Zhang, W.; Sai, X.; Chun, F.; Li, X.; Lu, X.; Wang, H. Grazing altered soil aggregates, nutrients and enzyme activities in a Stipa kirschnii steppe of Inner Mongolia. Soil Tillage Res. 2022, 219, 105327. [Google Scholar] [CrossRef]
  54. Li, C.; de Jong, R.; Schmid, B.; Wulf, H.; Schaepman, M.E. Changes in grassland cover and in its spatial heterogeneity indicate degradation on the Qinghai-Tibetan Plateau. Ecol. Indic. 2020, 119, 106641. [Google Scholar] [CrossRef]
  55. Filazzola, A.; Brown, C.; Dettlaff, M.A.; Batbaatar, A.; Grenke, J.; Bao, T.; Peetoom Heida, I.; Cahill, J.F., Jr. The effects of livestock grazing on biodiversity are multi-trophic: A meta-analysis. Ecol. Lett. 2020, 23, 1298–1309. [Google Scholar] [CrossRef] [PubMed]
  56. Fernández, L.; García, C.C.; Vergara-Tabares, D.L. Alliance between invasive plants management and farming: Cutting and livestock browsing reduce resprout and fruit production in an invasive shrub. For. Ecol. Manag. 2024, 559, 121809. [Google Scholar] [CrossRef]
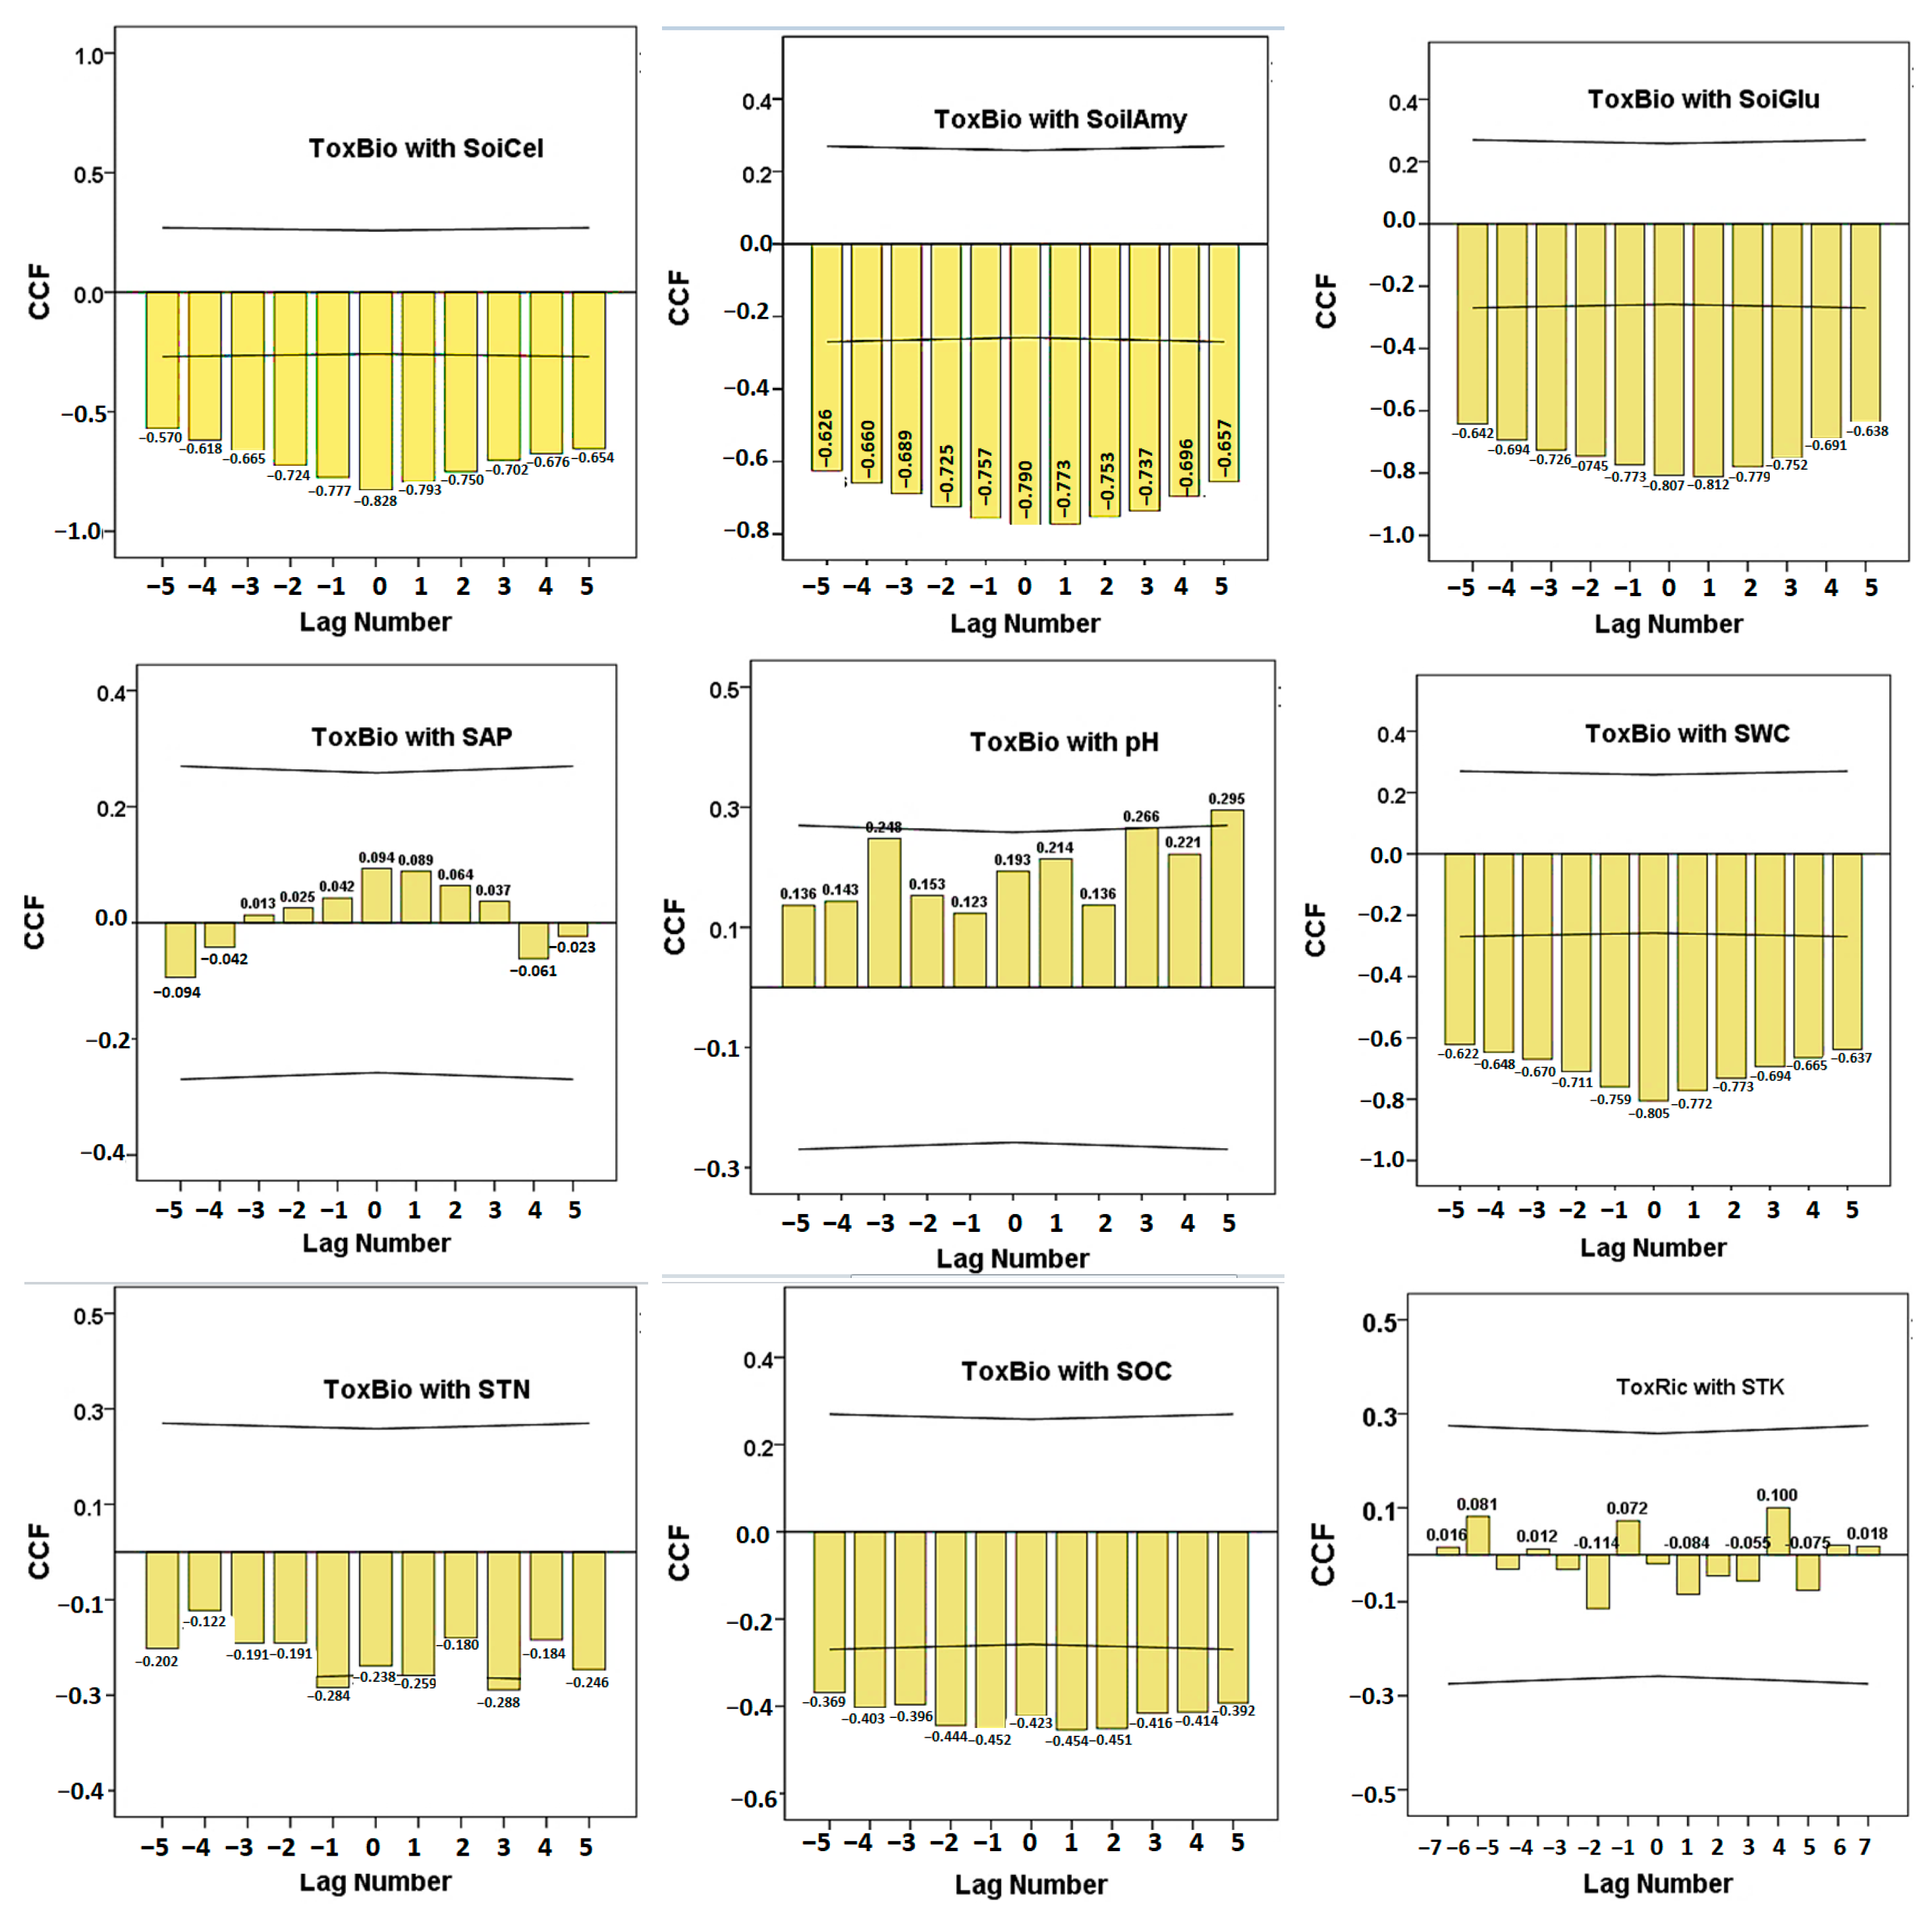
Figure 1. Cross-correlation factor (CCF) between toxic weed biomass and soil characteristics of soil organic carbon (SOC), soil total nitrogen (STN), soil total potassium (STK), soil available P (SAP), soil water content, and soil glucosidase, amylase, and cellulose after 5 years of heavy livestock grazing in an alpine meadow.
Land 14 00591 g001
Figure 2. PCA biplot diagram for the relationship between plant species abundances (top) and RDA diagram for vegetation indices and soil characteristics (down) after 5 years grazing in an alpine meadow. (E): Edible plant species; (T): toxic weeds; BioTox: biomass of toxic weeds; BioEdi: biomass of edible plants; TotalBio: total biomass; RicTox: richness of toxic weeds; IVEdi: importance value of edible plants; IVTox: importance value of toxic weeds; DenTox: density of toxic weeds; DenEdi: density of edible plants; CovTox: cover of toxic weeds; CovEdi: cover of edible plants; HeiToX: height of toxic weeds; HeiEdi: height of edible plants; SOC: soil organic carbon; STN: soil total nitrogen; STP: soil total phosphorous; STK: soil total potassium; SAP: soil available phosphorous; SWC: soil water content; SGl: soil glucosidase; SAm: soil amylase; SCe: soil cellulase.
Land 14 00591 g002
Figure 3. Pearson correlations (R) between RDA axes 1 and 2 and edible species (a), toxic weeds species (b), soil properties (c), and vegetation indices (d). (Abbreviations are presented in Figure 5).
Land 14 00591 g003
Figure 4. Changes in edible and toxic weed biomass (a), total biomass and toxic weed richness (b), pH, soil glucosidase (c), soil cellulase, and soil amylase (d) under grazing intensities following 5 years grazing in alpine meadow.
Land 14 00591 g004
Figure 5. Matrix plot for soil properties and plant treatments (a), and Pearson correlation and Mantel test (b) for soil and vegetation characteristics following 5 years grazing in alpine meadow. BioTox: biomass of toxic weeds; BioEdi: biomass of edible plants; TotalBio: total biomass; RicTox: richness of toxic weeds; IVEdi: importance value of edible plants; IVTox: importance value of toxic weeds; DenTox: density of toxic weeds; DenEdi: density of edible plants; CovTox: cover of toxic weeds; CovEdi: cover of edible plants; HeiToX: height of toxic weeds; HeiEdi: height of edible plants; SOC: soil organic carbon; STN: soil total nitrogen; STP: soil total phosphorous; STK: soil total potassium; SAP: soil available phosphorous; SWC: soil water content; SGl: soil glucosidase; SAm: soil amylase; SCe: soil cellulase. *, ** and *** are significant at p < 0.05, p < 0.01 and p < 0.001, respectively. The larger Pearson correlation between soil and vegetation characteristics, the larger the square. Pearson’s r changed from dark blue to deep red, the corresponding coefficient varies from −1 to 1. The larger Mantel’s r, the thicker the line of the square. Mantel’s p between soil and vegetation characteristics was green (0.001 < p ≤ 0.001), red (0.001 < p ≤ 0.01), blue (0.01 < p ≤ 0.05) and orange (p > 0.05), respectively.
Land 14 00591 g005aLand 14 00591 g005b
Table 1. Biomass and importance value of toxic weeds and edible plant species under different grazing intensities (p < 0.05).
Plant Treatment/Grazing IntensityControl (Non-Grazing)Light GrazingModerate GrazingHeavy Grazing
Toxic weed biomass (g/m2)49.1 ± 8.3 d68.5 ± 11.4 c80.6 ± 10.8 b126.4 ± 13.8 a
Edible grass biomass (g/m2)89.5 ± 10.7 a48.4 ± 8.9 b42.0 ± 7.4 bc38.5 ± 5.4 c
Toxic weed richness6.3 ± 1.3 c9.5 ± 2.7 b14.0 ± 3.4 a14.3 ± 3.3 a
Importance value of edible species0.62 ± 0.09 a0.55 ± 0.07 b0.51 ± 0.07 b0.29 ± 0.04 c
Importance value of toxic weeds0.38 ± 0.04 b0.45 ± 0.07 b0.49 ± 0.05 ab0.71 ± 0.07 a
Different lowercase letters (a, b, ab, c, bc, d) indicate significant differences (p < 0.05) under the same exponential analysis.
Table 2. Changes in soil properties (p < 0.05) under different grazing intensities after five years.
Soil Factor/Grazing IntensityNon-GrazingLight GrazingModerate GrazingHeavy Grazing
Soil organic carbon (g/kg)57.3 ± 11.7 a53.3 ± 8.9 ab49.2 ± 6.4 bc45.0 ± 7.1 c
Soil total nitrogen (g/kg)0.70 ± 0.1 a0.68 ± 0.05 ab0.65 ± 0.08 ab0.61 ± 0.07 b
Soil total phosphorous (g/kg)1.3 ± 0.2 a1.4 ± 0.08 a1.3 ± 0.2 a1.4 ± 0.1 a
Soil total potassium (g/kg)3.37 ± 0.01 a3.36 ± 0.02 a3.36 ± 0.02 a3.36 ± 0.02 a
Soil available P (mg/kg)12.3 ± 3.2 a7.8 ± 1.1 b4.9 ± 0.4 c11.8 ± 1.0 a
pH7.8 ± 0.3 b7.8 ± 0.3 b7.9 ± 0.3 ab8.1 ± 0.4 a
Soil water content (%)38.5 + 6.2 a34.0 ± 3.5 ab30.1 ± 5.2 bc26.4 ± 4.8 c
Soil glucosidase (umol/g·soil·d)104.9 ± 10.9 a92.5 ± 10.3 b82.3 ± 8.5 c63.9 ± 7.6 d
Soil amylase (umol/g·soil·d)20.9 ± 5.8 a17.1 ± 3.8 b13.0 ± 3.2 c9.8 ± 2.7 d
Soil cellulose (mg/g·soil·72 h)4.5 ± 0.8 a4.2 ± 0.6 a3.5 ± 0.6 ab2.7 ± 0.3 bc
Different lowercase letters (a, b, ab, c, bc, d) indicate significant differences (p < 0.05) under the same exponential analysis.
Table 3. Eigenvalues, variance, and broken-stick eigenvalues of axis in PC analysis between species and soil characteristics.
AxisEigenvalue% of VarianceCum.% of Var.Broken-Stick Eigenvalue
15.531.9031.903.84
24.322.9254.822.36
33.2511.2366.052.06
42.347.7273.771.82
51.75.3679.131.35
Disclaimer/Publisher’s Note: The statements, opinions and data contained in all publications are solely those of the individual author(s) and contributor(s) and not of MDPI and/or the editor(s). MDPI and/or the editor(s) disclaim responsibility for any injury to people or property resulting from any ideas, methods, instructions or products referred to in the content.