Article

Evaluation of the Coordinated Development of the “Population–Economy” in Counties Within the Beijing–Tianjin–Hebei Urban Agglomeration

by
Yanmin Ren
1,2,3,
Yanyu Zhang
1,4,*,
Shuhua Li
2,3,
Yu Liu
2,3,*,
Lan Yao
2,3 and
Linnan Tang
2,3
1
Key Laboratory of Land Use, Ministry of Natural Resources, Beijing 100035, China
2
Information Technology Research Center, Beijing Academy of Agriculture and Forestry Sciences, Beijing 100097, China
3
National Agricultural Information Engineering Technology Research Center, Beijing 100097, China
4
China Land Surveying and Planning Institute, Beijing 100035, China
*
Authors to whom correspondence should be addressed.
Land 2025, 14(3), 590; https://doi.org/10.3390/land14030590
Submission received: 19 February 2025 / Revised: 7 March 2025 / Accepted: 8 March 2025 / Published: 11 March 2025

Abstract

:
The coordinated development of urban agglomerations is a crucial means of establishing a territorial development and protection pattern with complementary advantages and high-quality development. In this study, an evaluation was performed on the coordinated development of the “population–economy” in the counties within the Beijing–Tianjin–Hebei urban agglomeration (BTHUA), focusing on the macro trend of coordinated development in this region. The evaluation methods included spatial autocorrelation analysis, the Gini coefficient, a comprehensive evaluation model, and a coupling coordination model. The results revealed that, in 2010 and 2022, the counties within the BTHUA exhibited strong positive spatial autocorrelation between evaluation indicators such as the population and economy, with notable and enhancing spatial clustering effects. The regional balance among all indicators was improved. The population distribution indicator and economic development indicator exhibited upward trends. The level of coupling coordination between the population and economy improved markedly. At the end of this paper, applicable strategies are recommended to drive economic growth and quality improvement in these counties, e.g., the orderly decentralization of the population and functions away from central urban areas to reduce the spatial carrying pressure and putting “policy guidance–fast-track resources–industrial upgrading” into practice. The purpose is to boost population–economy layout optimization and efficient resource allocation within the BTHUA.

1. Introduction

The territorial spatial development pattern is important for economic development, social welfare, and ecological security. Amid intensifying spatial conflicts and tightening resource constraints, the coordinated use of territorial space emerges as a key approach to optimizing this spatial layout [1,2]. The report of the 20th National Congress of the Communist Party of China emphasizes the need to thoroughly implement regionally coordinated development strategies, major regional strategies, main functional zone strategies, and new urbanization strategies. It also highlights the need to optimize the layout of major productive forces and establish a regional economic layout and territorial spatial system with complementary advantages and high-quality development. At present, China has formed a major urbanization pattern of “central city–metropolitan area–urban agglomeration”, indicating that the new urbanization has entered a stage of regionally coordinated development [3,4]. Urban agglomerations serve as an important carrier for the shift of the economic focus. Its territorial space is characterized by diverse constituent elements, nested spatial–temporal scales, complex functions, and intricate human–land relationships [5,6,7,8]. Considering the regionality of urban agglomerations, the specificity of territorial space utilization, and the comprehensiveness of the issues, exploring methods of evaluating the coordinated development in an urban agglomeration and further proposing countermeasures become significant challenges in territorial development and protection [9,10,11].
As an important part of the territorial spatial development evaluation system, research on the coordinated development of territorial space has achieved certain progress. In terms of research objects, Chinese and foreign researchers have evaluated the coordinated development of territorial space from such perspectives as the use quality of territorial space, the intensification degree and sustainable use of land, and the low-carbon economy and high-quality development [12,13,14]. The evaluation indicator systems were constructed using indicators primarily selected from dimensions such as population development, economic development, infrastructure construction, basic public services, and ecological and environmental protection [15]. The data sources were generally socioeconomic statistical data, remote sensing image data, and point of interest (POI) data [16]. The evaluation methods mainly included the spatial distance model, entropy method, coupling coordination model, and gravity model [17]. Their research focused primarily on scales such as urban agglomerations, provinces, municipalities, and prefecture-level cities [18,19,20]. Some researchers have analyzed the interactions between systems or elements from aspects such as land use and urbanization, the ecological environment and urbanization, and “production–living–ecological” spaces and evaluated the coordinated development status in territorial space [21,22,23,24]. In summary, existing research provides methodological references for the evaluation of the coordinated development in territorial space. However, relevant research has mostly concentrated on large and medium scales, such as the national and provincial levels, with less focus on the coordinated development within an urban agglomeration. There have been numerous comprehensive evaluations, but few studies have delved into population distribution and economic development. As such, this study explored methods of evaluating the coordinated development of the “population–economy” in the counties within an urban agglomeration. At the end of this paper, corresponding countermeasures are proposed. The objective is to provide methodological references for the assessment of the implementation and effectiveness of strategies in specific regions, such as urban agglomerations and metropolitan areas [25,26].
The Beijing–Tianjin–Hebei urban agglomeration (BTHUA) is one of the three major urban agglomerations that enjoy development prioritization in China [27]. The development and protection of its territorial space are vital for China’s overall strategic layout. The BTHUA features a highly concentrated and mobile population and prominent human–land conflicts and faces new challenges for sustainable development [28,29]. In the course of rapid urbanization and industrialization, the BTHUA has demonstrated increasingly intensified territorial development and exacerbated territorial use conflicts [30]. However, the combined influence of the political status, traffic location, economic development level, and natural resource endowments has led to the imbalanced and inadequate use of territorial space within the BTHUA [31,32]. As the basic units of economic and social development in China, counties serve as important carriers in implementing policies such as regionally coordinated development and comprehensive rural revitalization. Taking the county as the evaluation unit, it is possible to reveal the development differences within the region in a more detailed way and provide a scientific basis for the formulation of precise and differentiated policies. Focusing on the new demand for the coordinated development of territorial space within an urban agglomeration in the new era, a quantitative assessment was conducted on the population distribution, economic development status, and coupling coordination characteristics in the counties within the BTHUA in 2010 and 2022. The results can help to optimize the population–economy layout and efficiently allocate resources in the BTHUA.

2. Overview of Coordinated Development in the BTHUA and Data Processing

2.1. Overview of Coordinated Development in the BTHUA

The BTHUA covers Beijing City, Tianjin City, and Hebei Province, with a total land area of approximately 216,000 km2, a permanent resident population of 107 million, and a regional GDP of CNY 9404.149 billion in 2022. In the mid-1980s, the BTHUA was designated as one of the four pilot areas for the implementation of the territorial remediation strategy, taking the lead in promoting regionally coordinated development. In 2004, the State Council designated this region as a pilot area for the implementation of national regional planning to promote “regionally coordinated development”. In 2014, the Beijing–Tianjin–Hebei coordinated development strategy was proposed officially. In 2015, the Outline of the Plan for the Coordinated Development of Beijing–Tianjin–Hebei was released. The basic objective was to decentralize non-capital functions away from Beijing and address the “problems of big cities” in Beijing. Efforts should be made to form a new pattern of coordinated development among Beijing, Tianjin, and Hebei with shared goals, integrated measures, complementary advantages, and mutual benefits. The final goal was to advance regionally coordinated development to a new stage. To achieve the coordinated development of Beijing–Tianjin–Hebei and Chinese-style modernization, it is crucial to maximize the potential of territorial space and adjust the regional economic and spatial structures. This can help to improve the use efficiency of territorial space and promote the formation of a new pattern of coordinated development with complementary advantages and mutual benefits [25,31]. After years of development, the coordinated development in the BTHUA has shown significant progress: Beijing has regulated its population and witnessed a release in the “problems of big cities”; the orientation and division of industries among Beijing, Tianjin, and Hebei have become increasingly clear, accompanied by an orderly boost in economic coordination. However, there is still a large gap between the current situation and the strategic goals of coordinated development. The coordinated development in the BTHUA needs to address some new challenges and problems [33,34].

2.2. Sources and Processing of Basic Data

Sources of Basic Data: The population and economic data for 2010 and 2022 were sourced from the Beijing Statistical Yearbook, Beijing Regional Economic Statistical Yearbook, Tianjin Statistical Yearbook, Hebei Economic Yearbook, Hebei Rural Statistical Yearbook, and others for the corresponding years. The land cover data were sourced from the “30 m Annual Land Cover Dataset of China (1985–2023)” compiled by Yang Jie et al. (https://zenodo.org/records/12779975 (accessed on 4 November 2024)). The nighttime light indicator was cited from the “An Extended Time Series (2000–2023) of Global NPP-VIIRS-Like Nighttime Light Data” compiled by Chen Zuqi et al. (https://doi.org/10.7910/DVN/YGIVCD (accessed on 20 March 2024)).
In this study, data for the years 2010 and 2022 were surveyed. The county-level administrative division units were revised, taking the year 2022 as the benchmark. Regions with administrative division adjustments were merged. As finalized, there were 198 counties (including urban districts, county-level cities, and counties) in the BTHUA. Economic and population statistical data were collected and consolidated per county. The land cover data and nighttime light indicator underwent projection transformation and registration with administrative units. Based on this, the “Zonal Statistics” tool in the ArcGIS software was used to obtain data on the units for evaluation.

3. Method

3.1. Research Objectives and Technical Framework

The key target of coordinated development in the BTHUA is to promote rational population distribution, high-quality economic development, and effective coordination between the two. Thus, this study was conducted following the path of “objective determination → modeling → evaluation and analysis → countermeasures and suggestions” (Figure 1). Firstly, the evaluation objective was determined based on the targets and requirements for the coordinated development in the BTHUA, focusing on optimizing the spatial population layout and achieving high-quality economic development. Secondly, a comprehensive “population–economy” evaluation indicator system was constructed following the principles of being scientific, systematic, representative, measurable, and comparable. Relevant data were collected and processed. Population distribution and economic development evaluation models for the counties were constructed through the standardized processing of evaluation indicators and the determination of weights. Furthermore, comprehensive quantitative evaluations and spatial–temporal characteristic analyses of the population and economy were conducted to quantitatively assess the level of coupling coordination among the “population–economy” of the counties within the BTHUA. At the end of this paper, countermeasures and suggestions are proposed for the coordinated development of the “population–economy” within the BTHUA.

3.2. Construction of an Evaluation Indicator System

The factors influencing the coordinated development of the population and economy in the counties within the BTHUA are complex and have obvious regional characteristics. It is challenging to construct a systematic and operable comprehensive evaluation indicator system [35,36]. In this study, an indicator system was constructed by taking the counties as the units for evaluation and focusing on two aspects: the population distribution status and economic development features (Table 1). Among them, (1) the population distribution status reflects the coordination relations between the population and land use within the BTHUA. Policy guidance and market mechanisms can be implemented to promote an orderly population flow within an urban agglomeration and form a reasonable population distribution pattern. This helps to alleviate population pressure in large cities such as Beijing and Tianjin while promoting the development of small and medium-sized cities and rural areas and achieving coordination between the population, resources, and the environment [37,38]. The population density (PD) is the most direct and basic indicator of the population distribution, reflecting the density of the population on regional land. The construction area population density (CPD) excludes the interference of non-construction land and can more accurately reflect the level of urbanization and land use efficiency. The average night light index (ANLI) reflects the regional average light intensity or density at night and the degree of change in human activities. Based on the above, the population distribution status was represented by three indicators: PD, CPD, and ANLI. (2) Economic development features mainly manifest the level and quality of regional economic development. A region’s resource endowments, industrial advantages, and functional orientations can be leveraged to develop special industrial clusters, strengthen economic ties and cooperation within an urban agglomeration, and promote the sharing and optimal allocation of resources, technologies, talent, and other elements. This is conducive to forming an economic pattern with complementary advantages and coordinated development [39,40]. The GDP per unit of construction land (CGDP) is an important indicator in assessing the economic output generated per unit of construction land, reflecting the efficiency of its development and utilization. The regional industrial structure (RIS) of a county is characterized by the proportion of the added value of the tertiary sector, which indicates the economic development level and stage of the county. A larger proportion of the tertiary sector typically signifies a more advanced economic structure. The per capita disposable income (PCDI) is a key economic indicator in measuring the living standards of residents, reflecting the economic conditions and purchasing power of the population in a region. The per capita public budget revenue (PCPBR) reflects the government’s investment in public services and infrastructure construction, as well as the fiscal welfare status of residents. Therefore, in this study, economic development features were represented by four indicators: CGDP, RIS, PCDI, and PCPBR.

3.3. Construction of a Comprehensive Evaluation Model

Based on the above evaluation indicator system, a comprehensive evaluation model was constructed to evaluate and analyze the coordinated development level of the population and economy in the counties within the BTHUA. The specific steps were as follows.
(1) Standardization of evaluation indicators. To ensure the comparability of the indicator data across different years, the membership degrees of the indicators were divided as per the distribution characteristics of different indicator values. The standard values for the indicator data in 2010 and 2022 were calculated using the expert consultation method (Table 2).
(2) The weight of each indicator was calculated using the analytic hierarchy process (AHP), following the steps below.
① “Population–economy” coordination in the counties within the BTHUA was categorized as the goal layer (layer G); the population distribution status and economic development features were categorized as the criterion layer (layer C); and the factors influencing the criterion layer were categorized as the indicator layer (layer A).
② Matrices A, C1, and C2 were constructed for judgment.
③ The single-layer ranking and overall-layer ranking were obtained, and consistency checks were performed. The yaahp software was employed to calculate the random consistency ratio (CR) of each judgment matrix for two subsystems and the consistency indicator (CI) of the overall-layer ranking results. The weights were adjusted based on expert experience till the results showed satisfactory consistency (Table 2).
(3) The population distribution indicators and economic development indicators for the counties within the BTHUA were calculated using the relative combination weighting method.
f x = i = 1 m ( a i × x i )   i = 1,2 , 3
g y = j = 1 n ( b j × y j )   ( j = 1,2 , 3,4 )
In the formulas, f(x) and g(y) represent the population distribution indicator and economic development indicator for a county, respectively; i and j represent the number of indicators in the two criterion layers, respectively (m = 3 and n = 4); xi and yj represent the standardized values of indicator i and indicator j in the two criterion layers, respectively; and ai and bj represent the weights of indicator i and indicator j in the two criterion layers, respectively.
The following model was used to evaluate the level of coupling coordination between the “population–economy”:
D = C × T
where
C = 2 × f ( x ) × g ( y ) f x + g y 2 1 2
T = a × f ( x ) + b × g y
In the formulas, D represents the coupling coordination level; C represents the coupling level; T represents the comprehensive development indicator; a and b represent the weights of the population distribution status and economic development features, respectively: a = 0.5 and b = 0.5.

3.4. Spatial–Temporal Characteristic Analysis Methods

3.4.1. Spatial Autocorrelation Analysis

Spatial autocorrelation analysis is a measure of spatial correlation, characterizing and visualizing the spatial distribution patterns of objects or phenomena to objectively reveal the dynamics of the spatial associations among geographical entities [41,42,43]. In this study, the spatial autocorrelation analysis method was used. The Global Moran’s I and Local Moran’s I statistics were calculated to quantitatively explore the spatial dependency and degree of difference between the population distribution and economic development in the counties and further reveal the characteristics of spatial clustering and dispersion within the region [44,45]. Among them, the Global Moran’s I indicator was used to evaluate the agglomeration or dispersion characteristics of the overall spatial distribution of the population and economy in the BTHUA. The Local Moran’s I (LISA) indicator was employed to reflect both the degree and significance of spatial differences between local counties within the BTHUA and their surrounding counties. It revealed such spatial correlation characteristics as high-value (H-V) clusters, low-value (L-V) clusters, high–low (H-L) outliers, and low–high (L-H) outliers in different regions [46,47,48].
I = i = 1 n j i n ( W i j × Z i × Z j ) σ 2 × i = 1 n j i n W i j   i = 1,2 , 3
where Z i = X i X ¯ σ , X ¯ = 1 n × i = 1 n X i , and σ = 1 n × i = 1 n ( X i X ¯ ) 2 .
In the formula, n represents the number of counties, Xi represents the population or economic development indicator of the i-th county, and Wij represents the spatial weight matrix between the i-th county and the j-th county. When I > 0, it indicates the presence of positive spatial autocorrelation between the population distribution and economic development in the counties; conversely, it indicates the presence of negative spatial autocorrelation between them. When I = 0, it suggests that the population and economic development in the counties are not correlated but are random.
L I S A i = Z i × j = 1 n ( W i j × Z j )
If LISAi > 0, it evidences the presence of H-V spatial clusters in the population and economy surrounding the county i. If LISAi < 0, it proves the presence of L-V spatial clusters in the population and economy surrounding the county i.

3.4.2. Gini Coefficient

The Gini coefficient is a quantitative indicator derived from the Lorenz curve to judge the degree of balance [49,50]. In this study, the Gini coefficient was used to depict the spatial equality of the population distribution and economic development in the counties within the BTHUA. Taking the average nighttime light indicator as an example, the Gini coefficient was calculated with the following steps: (1) the average nighttime light indicator for each county was calculated and ranked in ascending order; (2) the proportions of each county’s nighttime light indicator and land area within the BTHUA were calculated; (3) the cumulative percentage of the nighttime light indicator (x) and the cumulative percentage of the land area (y) for each county were calculated sequentially, following the ranking order from step (1); (4) a Lorenz curve was plotted with x representing the horizontal axis and y representing the vertical axis (Figure 2); (5) the Gini coefficient was calculated based on the Lorenz curve and the following formula:
G = A A + B
where
A = 0.5 0 1 f ( x )
In the formulas, G represents the Gini coefficient; A represents the area enclosed by the Lorenz curve and the 45° line of equality, and it can be obtained by integrating the trend line equation f(x) of the Lorenz curve in Excel; B represents the area below the 45° line of equality but not covered by the upper of the Lorenz curve. G ranges between 0 and 1. A higher G value indicates greater inequality in the population distribution or economic development, while a lower G value suggests a trend toward equality in this aspect. As is generally believed, G < 0.2 denotes an absolutely equal distribution, with almost no wealth gap; 0.2 ≤ G < 0.3 denotes a relatively equal distribution, where society as a whole is relatively equal; 0.3 ≤ G < 0.4 denotes a relatively reasonable distribution, with some gaps existing but overall controllable; 0.4 ≤ G < 0.6 denotes a relatively large difference, which may lead to social instability; G ≥ 0.6 denotes a significant difference, with a huge wealth gap that can easily trigger social problems.

4. Results and Analysis

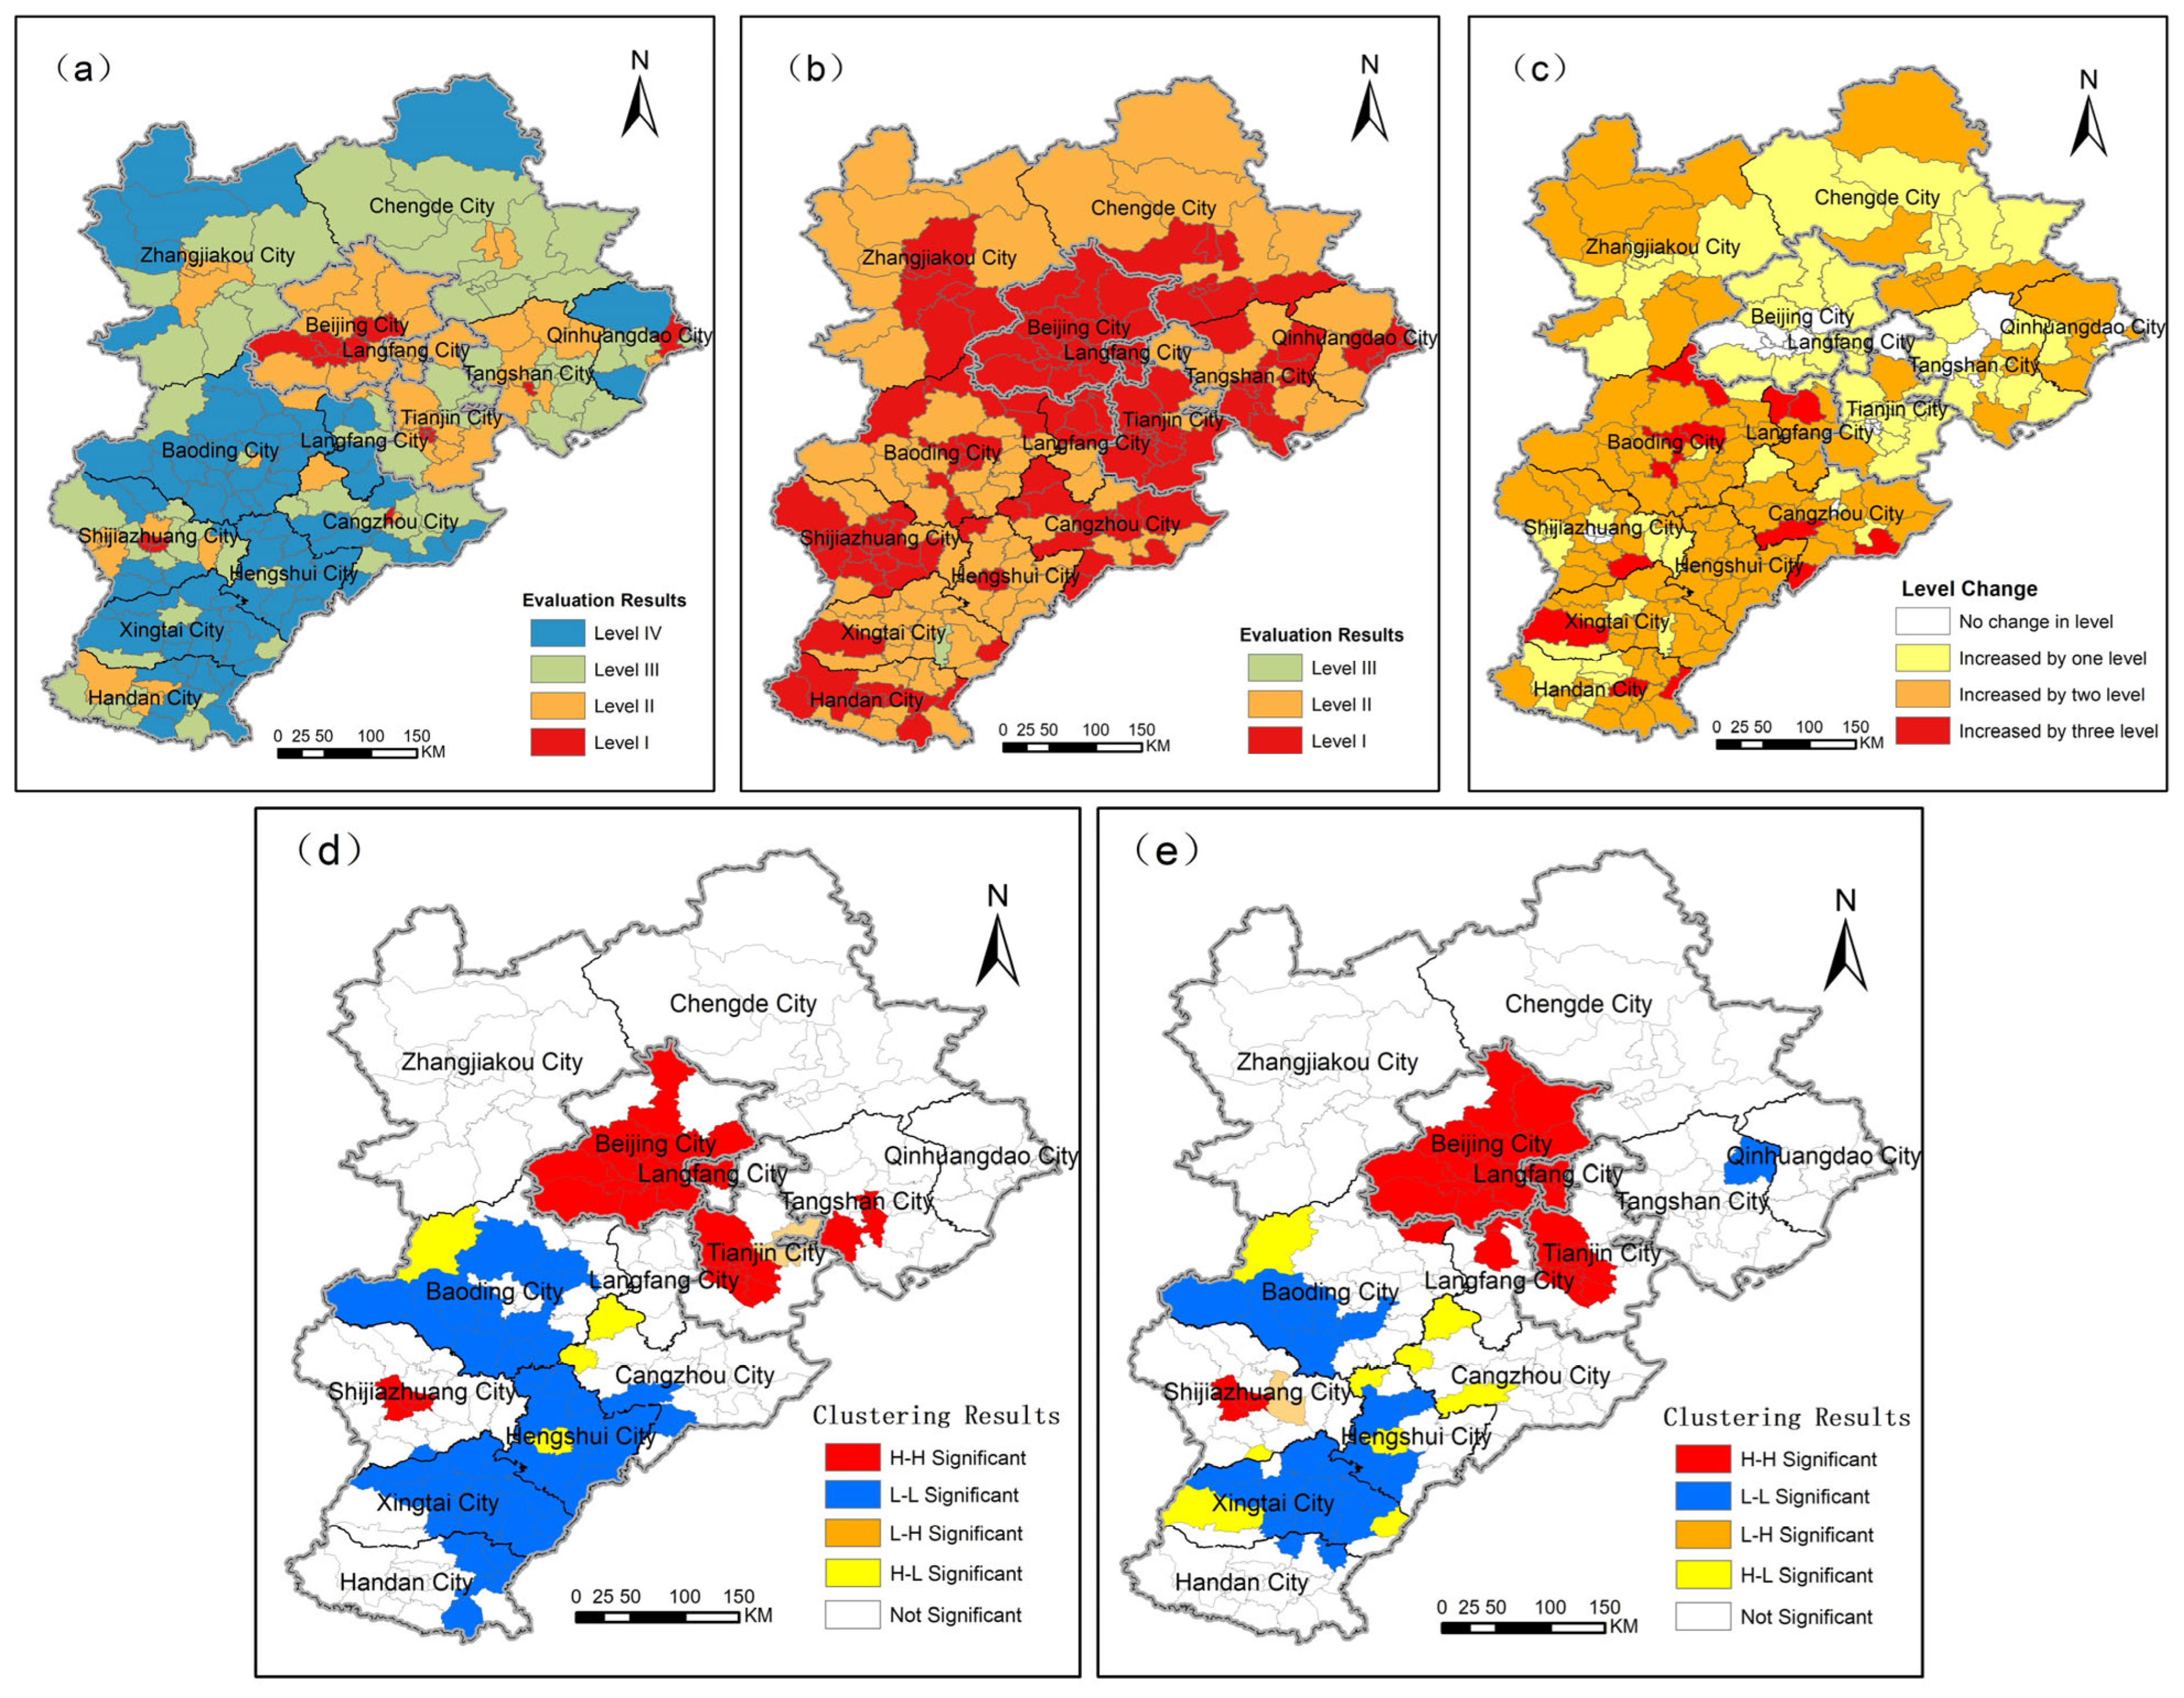
4.1. Spatial–Temporal Characteristics of Population Distribution in Counties Within the BTHUA

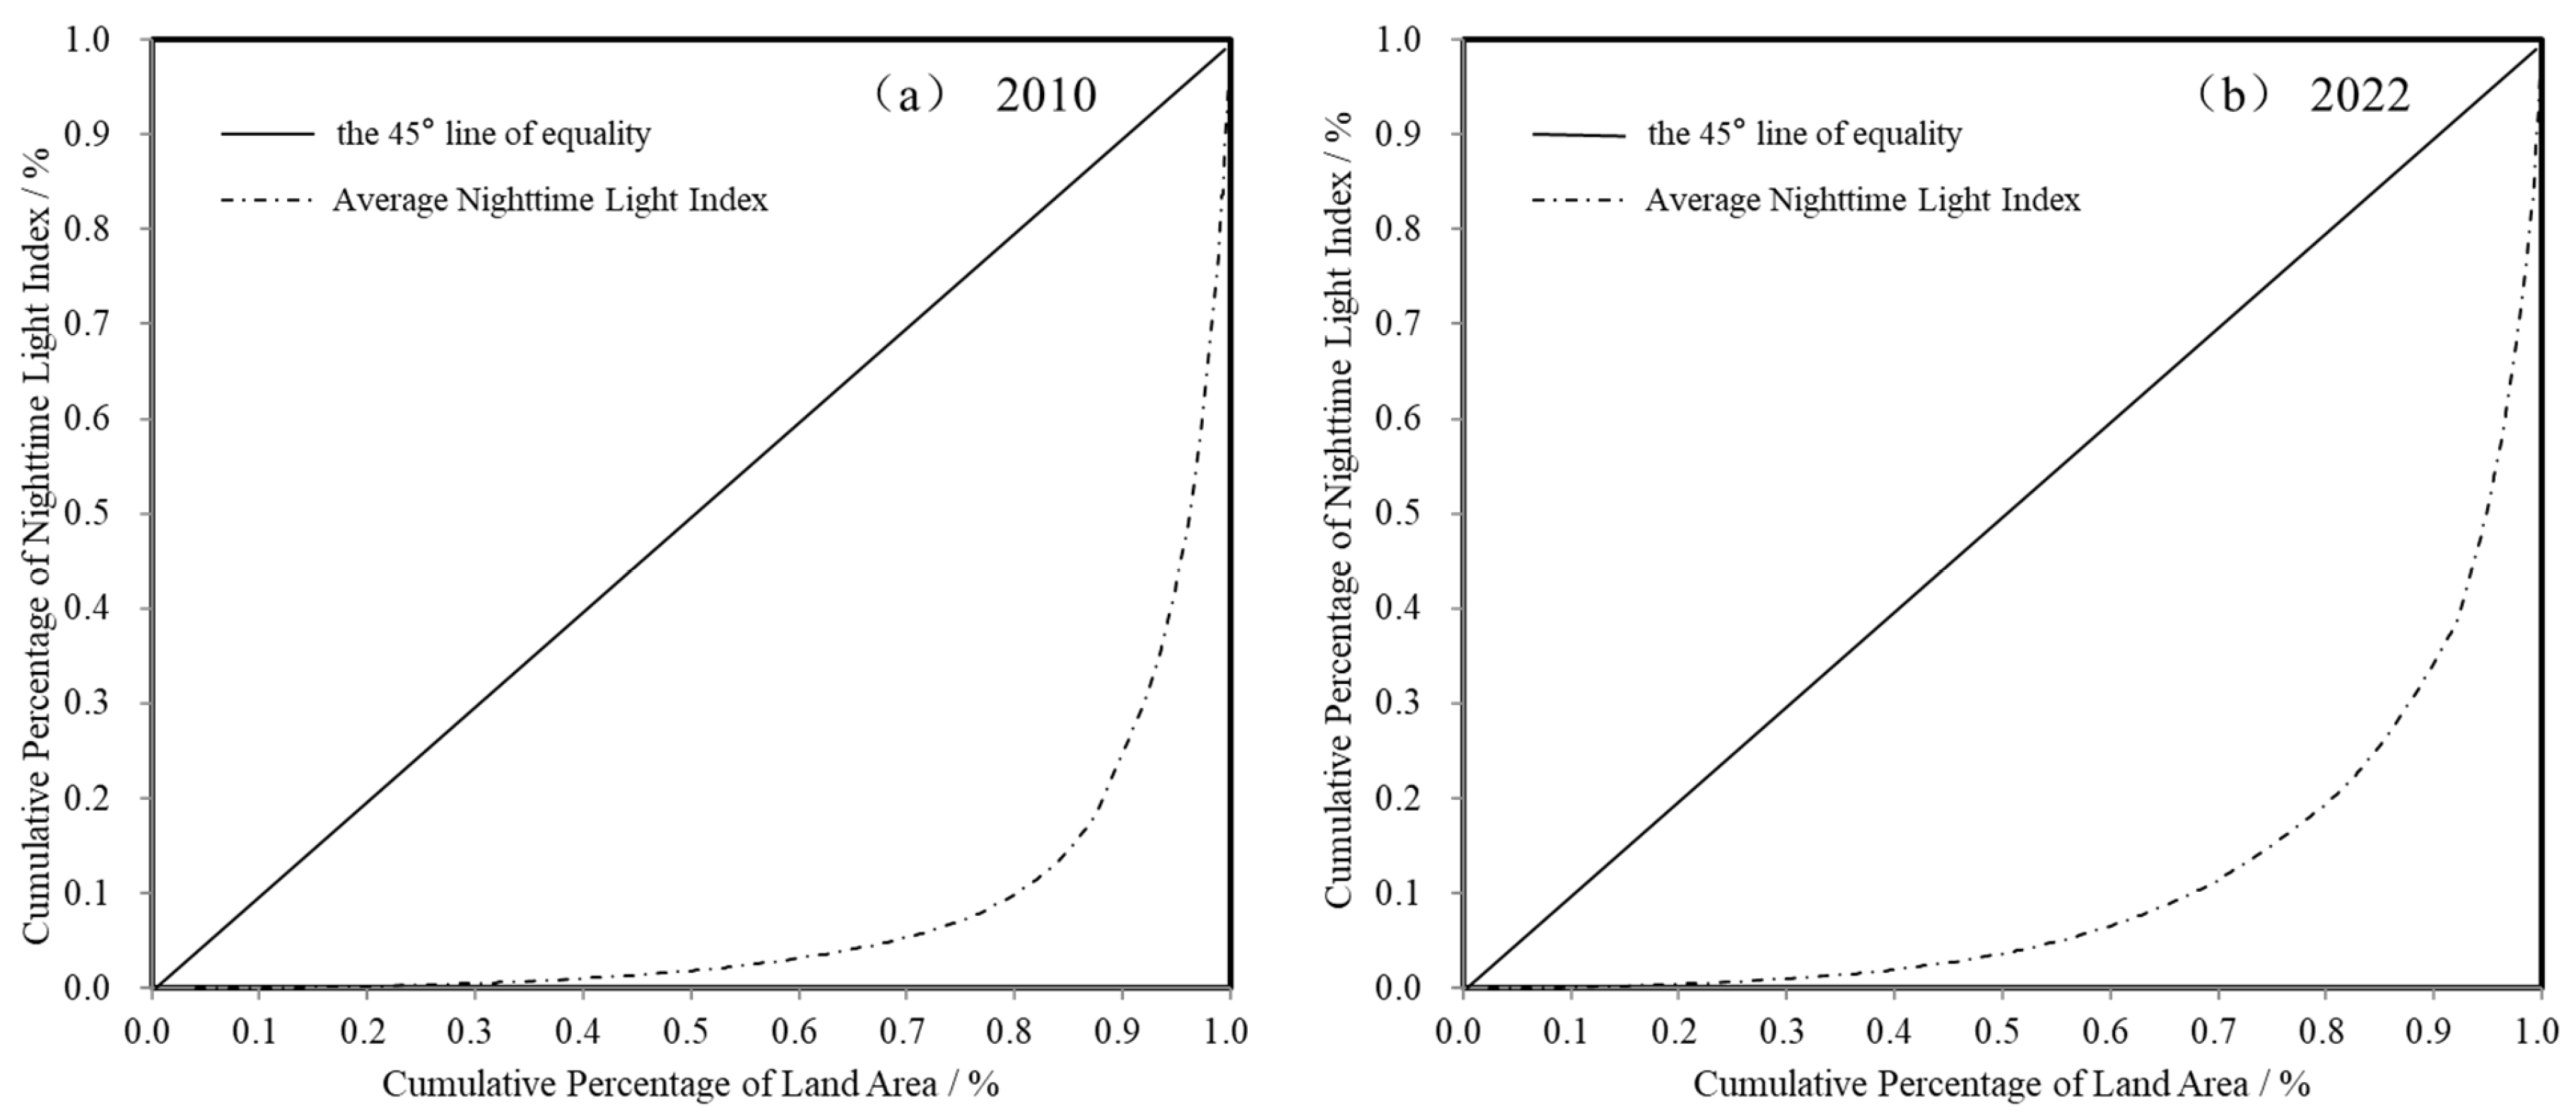
4.1.1. Spatial–Temporal Characteristics of Single Indicators for Population Distribution in Counties

As shown in Table 3, in 2010 and 2022, the Moran’s I values for the population density in the counties within the BTHUA were positive, signifying a strong spatial clustering effect with an enhancing trend. The Gini coefficient increased, suggesting that the population distribution in the counties within the BTHUA was highly imbalanced, and the differences were still enlarging. The construction area population density was similar to the population density, showing high values and an increasing trend. There were significant spatial autocorrelations, and the spatial clustering effect of construction land was intensified. The Gini coefficient was stable and around 0.3, implying that the construction area population density within the region was balanced in general. The Moran’s I value for the average nighttime light indicator was high, with a small degree of reduction, verifying the strong and stable spatial clustering effect of nighttime economic activities in this region. Although the Gini coefficient decreased slightly, its value remained high, evidencing that the differences between areas remained remarkable, albeit with slight easing in the disparities of nighttime economic activities.

4.1.2. Spatial–Temporal Characteristics of Population Distribution Indicators for the Counties

Based on Formula (1), the population distribution indicators for the counties within the BTHUA were calculated and then divided into four intervals (≥0.75, 0.55–0.75, 0.40–0.55, and <0.40). Using these four intervals, the 198 counties were classified into four levels (I, II, III, and IV). Subsequently, a LISA cluster analysis was conducted based on the distribution indicators (Figure 3). The results were as follows. In 2010, counties in the Level I region were mainly distributed in the core areas of Beijing and Tianjin, as well as large cities such as Shijiazhuang and Baoding. This region was the economic, cultural, and political center of the BTHUA, exhibiting the clear characteristics of high–high (H-H) clusters. Counties in Level II and Level III regions were primarily in the center and southeast of the BTHUA and adjacent to the Level I region, such as counties along the Beijing–Tianjin and Beijing–Shanghai expressway corridors and those around Shijiazhuang City. These two levels of regions had certain spatial clustering characteristics but with a small clustering scope, and they had not formed remarkable growth poles. Most of the Level IV region was located in the west and north of the BTHUA, as well as some remote counties. In this region, the population distribution was dispersed, without remarkable spatial clustering characteristics. By 2022, the population distribution in the counties within the BTHUA showed strong spatial clustering characteristics, evidenced by H-H significant and low–low (L-L) significant clusters. Specifically, the Level I region lay in core cities such as Beijing and their surrounding areas. The counties in Level II and Level III regions were mainly at the periphery of the Level I region; significant population growth was seen in those along the Beijing–Tianjin, Beijing–Shanghai, Beijing–Kunming, and Beijing–Hong Kong–Macao expressways. The Level IV region covered a large area of counties and was concentrated in the western Taihang Mountains, the northwestern Bashang Plateau region, and the southeast of Hebei. A sparse population distribution was recorded in this region due to its topography, infrastructure, and urbanization process. Compared to 2010, the population distribution indicators for the counties within the BTHUA showed upward trends in 2022. Notably, some areas originally classified as Level III and Level IV shifted to Level I or Level II (such as Rongcheng County, Anxin County, Xuzhou District, and Dingxing County around the Xiong’an New Area, as well as Jinnan District and Beichen District in Tianjin); H-H significant and L-L significant clusters covered larger areas. With the implementation of the Beijing–Tianjin–Hebei coordinated development strategy, the permanent resident populations in the core areas of Beijing and Tianjin were relieved, leading to many people flowing out to surrounding areas. This improved the balance between the urban core areas and their surrounding areas. Meanwhile, Hebei Province was still undergoing rapid urbanization, with the population mainly distributed in economically developed urban areas and counties with convenient transportation. As a result, upward trends were observed in the population density, construction area population density, and average nighttime light indicator for these areas, as well as in the spatial differences with surrounding counties.

4.2. Spatial–Temporal Characteristics of Economic Development in Counties Within the BTHUA

4.2.1. Spatial–Temporal Characteristics of Single Indicators for Economic Development in Counties

As observed in Table 4, the GDP per unit of construction land in the counties within the BTHUA displayed significant positive spatial correlations and enhanced spatial clustering characteristics. The Gini coefficient declined somewhat but remained high. This reflected that, although the balance of the GDP per unit of construction land in the BTHUA had improved to a certain extent, the differences between the areas were still large. The spatial clustering characteristic of the regional industrial structure in the counties was notable and enhanced, indicating the strengthened spatial clustering effect of such a structure in the BTHUA. The Gini coefficient was less than 0.3 and fell after rising, suggesting the more balanced distribution of the regional industrial structure. The Moran’s I value for the per capita disposable income was high, reflecting the strong spatial clustering effect of the per capita disposable income in the counties. However, the Gini coefficient remained at around 0.3, implying a balanced income distribution in the counties within the BTHUA. The per capita public budget revenue demonstrated a significant positive spatial correlation, with considerable regional variations. Compared to 2010, the spatial autocorrelation of the per capita public budget revenue in 2022 had attenuated and more areas tended to be balanced in the public budget revenue.

4.2.2. Spatial–Temporal Characteristics of Economic Development Indicators for Counties

The economic development indicators for the counties within the BTHUA were calculated based on Formula (2) and then divided into four intervals (≥0.75, 0.55–0.75, 0.40–0.55, and <0.40). Using these four intervals, the 198 counties were classified into four levels (I, II, III, and IV). Next, a LISA cluster analysis was performed based on the development indicators (Figure 4). The results were as follows. In 2010, the Level I region was mainly located in the jurisdictions of large cities such as Beijing, Tianjin, and Shijiazhuang, as well as the counties surrounding them. In this region, the GDP per unit of construction land, per capita disposable income, and per capita public budget revenue were all high, and the regional industrial structure was reasonable; the characteristic of H-H significant clusters was presented in space. The Level II region was concentrated at the periphery of the Level I region, such as the counties surrounding Beijing, Tianjin, Shijiazhuang, and Baoding. In these areas, the economic development lagged, presenting a large economic development gap with large cities, and a spatial distribution pattern of H-L significant clusters was shown. Level III and Level IV regions were mainly situated in the south of Beijing and Tianjin, as well as the western and northern mountainous areas of Hebei Province. These areas had weak economic foundations and homogeneous industries, forming a spatial pattern of L-L clusters. In 2022, most counties within the BTHUA developed into the Level I or Level II regions. Among them, the Level I region covered the main municipal districts in Beijing, Tianjin, Baoding, Shijiazhuang, Xiong’an New Area, Cangzhou, and Handan, demonstrating notable spatial clustering characteristics; the scope of areas featuring H-H significant clusters further expanded. The Level II region covered most counties within the BTHUA, excluding the Level I region, indicating a significant improvement in the economies of the counties within the BTHUA. However, due to significant differences in the regional GDP, permanent resident populations, and fiscal budget revenues of the counties, there was a scattered distribution of L-L, L-H, and H-L clusters in the counties. Compared with 2010, counties such as Wangdu County, Gu’an County, and Zhao County increased by three levels, owing to the rapid development of the tertiary industry, a significant increment in the regional GDP, and growth in the per capita disposable income; counties such as Wu’an County and Shenzhou County increased by one or two levels, showing the remarkable enhancement of economic activities in the BTHUA.

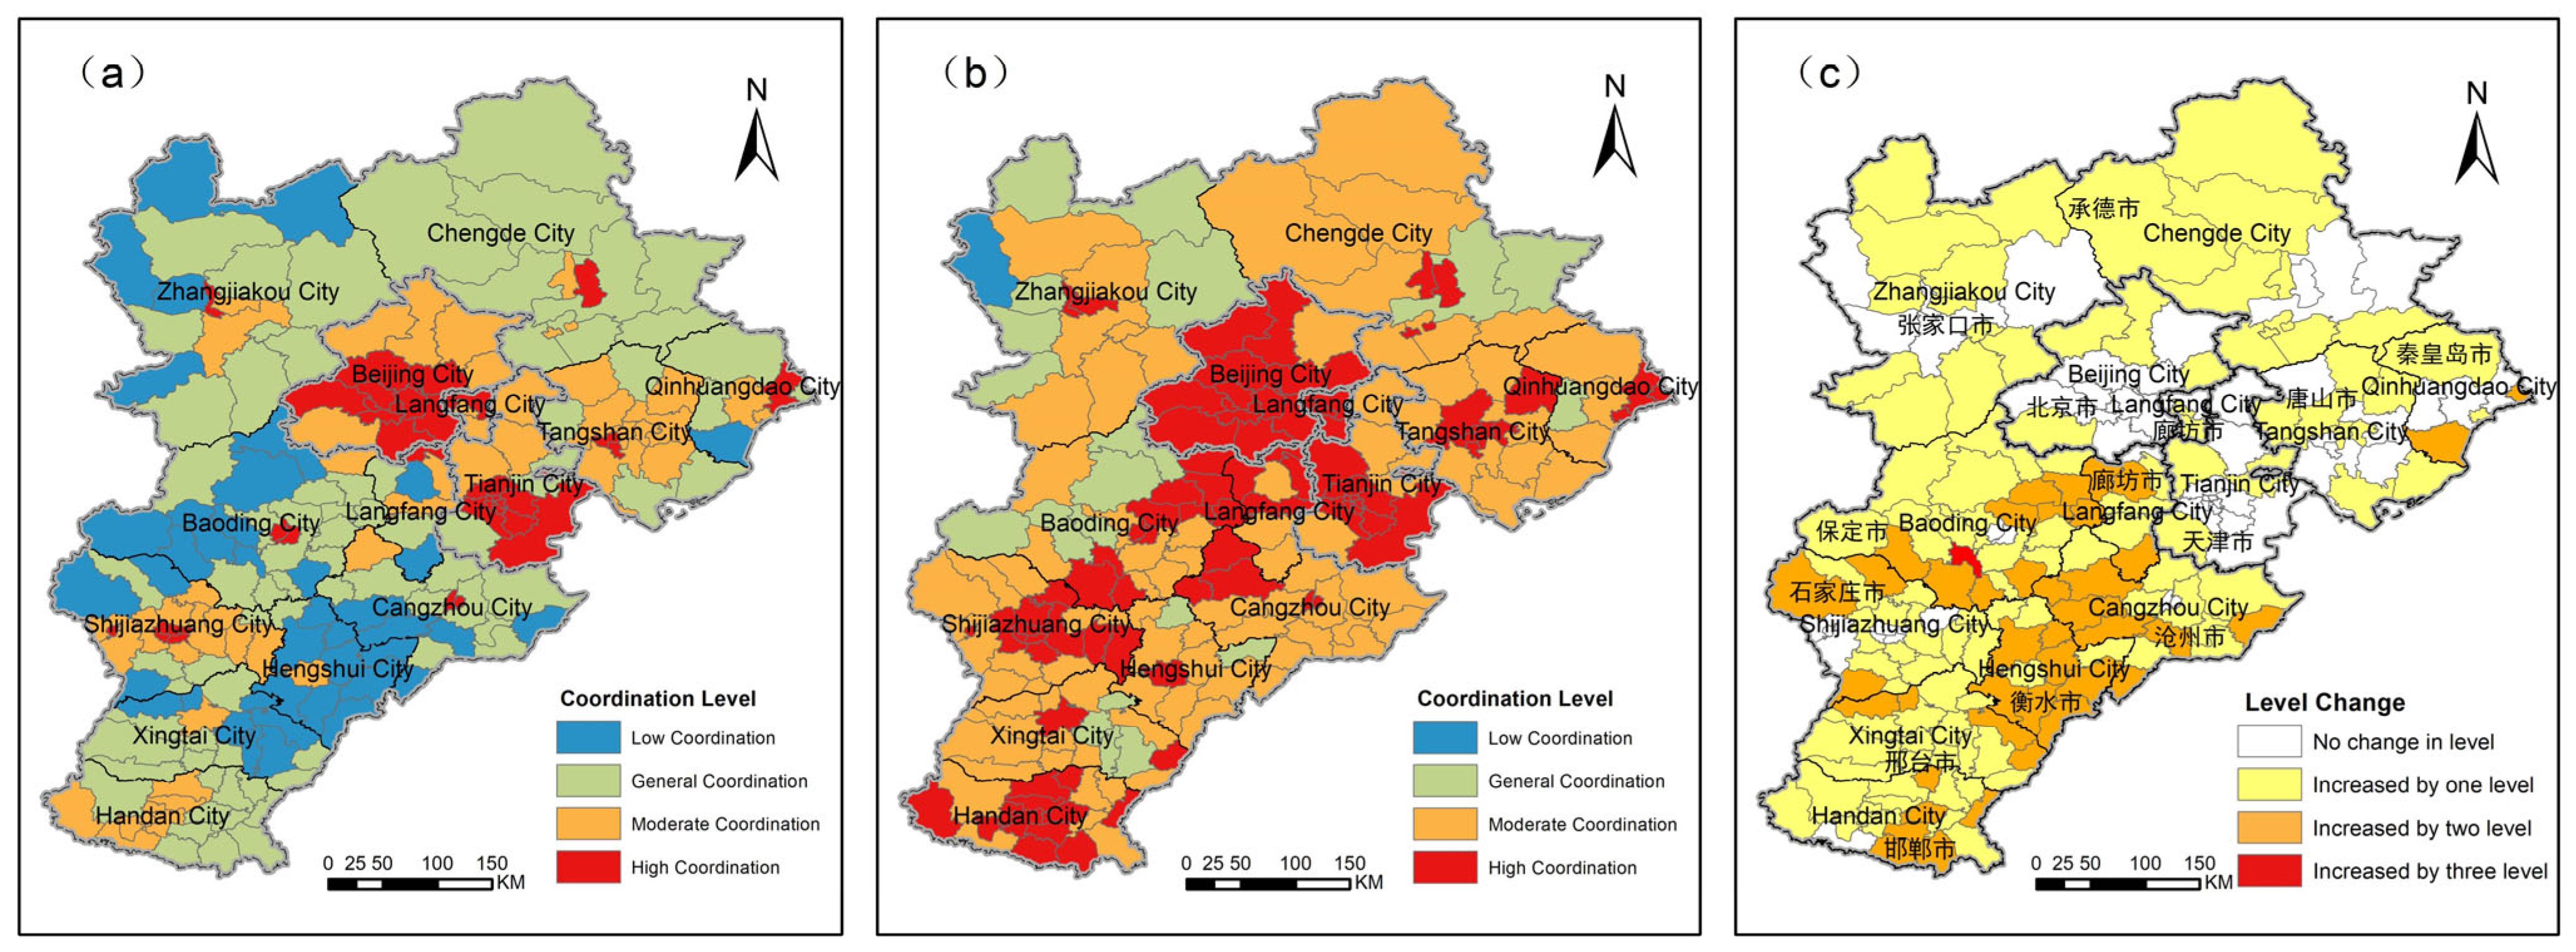
4.3. Analysis of the “Population–Economy” Coupling Coordination in Counties Within the BTHUA

The “population–economy” coupling coordination indicators were divided into four intervals (<0.6, 0.6–0.7, 0.7–0.8, and ≥0.8). Using these four intervals, the 198 counties were classified into four coordination levels (low coordination, general coordination, moderate coordination, and high coordination) (Figure 5). In 2010, counties at the high coordination level were few and mainly distributed in cities such as Beijing, Tianjin, Shijiazhuang, and Baoding. These areas had high GDP per unit of construction land and per capita disposable income levels, reasonable regional industrial structures, and high population–economy coupling levels. The moderate-coordination region mainly surrounded the high-coordination region. This region had active economic activity, as well as a high per capita disposable income and public budget revenue, showing a well-coordinated development status between the population and economy. The general- and low-coordination regions covered a vast territory, encompassing most counties in the southeast, west, and north of Hebei Province. Especially in remote mountainous areas such as those in the west and north, the population–economy coordination level was low due to the influences of the regional GDP, permanent resident population, GDP per unit of construction land, and per capita disposable income. Compared to 2010, the “population–economy” coupling coordination level of the counties within the BTHUA was elevated in 2022. Most counties reached high and moderate coordination levels. In particular, counties around cities such as Beijing, Tianjin, and Shijiazhuang transitioned from the moderate coordination level to the high coordination level. The southern plain area and the northwestern mountainous plateau area shifted from being dominated by general or low coordination levels to being dominated by moderate coordination levels. The general-coordination region was scattered in the west and north of Hebei Province, with only Shangyi County in the Bashang Plateau remaining at the low coordination level. This indicates that the coordination between the population and economy in the BTHUA was improved significantly with the continuous development of the regional economy and the advancement of the regional coordination course.

4.4. Countermeasures for the Coordinated Development of the “Population–Economy” in Counties Within the BTHUA

According to the evaluation results regarding the population distribution, economic development, and the coupling coordination level between the two, from 2010 to 2022, the counties within the BTHUA had somewhat improved the imbalance between the population and economy, with enhanced spatial clustering effects. The core areas of Beijing and Tianjin and their surrounding counties witnessed better development and enhanced coordination effects among the units. However, some remote counties did not exhibit this high economic vitality. Moreover, the central urban areas of Beijing and Tianjin possessed approximately saturated land resources, as well as an excessive population density and functional agglomeration, leading to excessive spatial carrying pressure, while some counties in Hebei lacked economic vitality. This reflects the poor balance of regional resources within the BTHUA. Therefore, it is crucial to propose countermeasures for the coordinated development of the BTHUA based on the goals regarding the matching degree between the population distribution and land use, as well as the coordination between the economic structure and growth.

4.4.1. Guiding Orderly Population Flow to the Achieve Coordinated Development of the Human–Land Relationship in the BTHUA

The BTHUA needs to form a spatial layout of “one core, two cities, three axes, four regions, and multiple nodes”, achieve a higher degree of matching between the population and land use, and promote a reasonable population distribution layout and efficient resource allocation. To realize this goal, the following suggestions are proposed. First, the population in the central urban areas of Beijing and Tianjin should be decentralized to reduce the excessively high population density and spatial carrying pressure. Second, policy guidance, fast-track economic resources, transportation integration, and mobility should be provided to promote population agglomeration in the urbanized areas of Hebei Province and facilitate a reasonable population distribution in the BTHUA. Third, a smart dynamic monitoring system for territorial space use and population distribution should be constructed to achieve the real-time perception and precise analysis of regional population changes and spatial mobility characteristics. The purpose is to avoid new spatial imbalances in the process of population decentralization and agglomeration. Fourth, it is necessary to explore the potential impacts of spatial population flow on regional economic, social, and environmental development and formulate reasonable regulatory policies. The purpose is to guide the beneficial coordination between humans and land in the BTHUA. At present, at the national level, the “Beijing–Tianjin–Hebei Coordinated Development Plan Outline” has been introduced. Strengthening the integration of intercity railways and expressways can effectively promote the complementarity of technology and capital from Beijing and Tianjin with the land resources of Hebei, as well as facilitating population mobility, thereby achieving coordinated human–land development.

4.4.2. Promoting Regional Industrial Collaboration to Accelerate High-Quality Economic Development in the BTHUA

It is suggested to draw upon the successful experiences of the Guangdong–Hong Kong–Macao Greater Bay Area, the Yangtze River Delta, and other regions in the coordinated development of industries. In detail, the BTHUA should formulate differentiated industrial development policies that align with its regional development orientation and leverage its unique strengths and advantageous industries. The BTHUA should precisely match industrial needs with land resources and establish closer and more efficient economic collaboration mechanisms. For example, technology-innovative and high-value-added industries should be introduced into the core areas of Beijing and Tianjin; enhanced economic support should be provided for the Xiong’an New Area; and the green transformation of traditional industries should be promoted in Hebei to develop modern agriculture, advanced manufacturing, and renewable energy industries. The purpose is to ultimately form a situation of regional industrial specialization with staggered development. Labor-intensive and high-tech industries should develop simultaneously to increase the employment opportunities and improve the social security levels, ensuring that the growth in urban and rural residents’ incomes keeps pace with economic development. Furthermore, it is recommended to increase the transfer payments from the exchequer and rationally adjust the proportion of public fiscal expenditure. The purpose is to improve the fiscal balance, enhance the regional fiscal autonomy, and narrow the gap between counties within the BTHUA, thereby achieving high-quality regional economic development. Given the strong complementarity between the technological innovation capabilities of Beijing and Tianjin and the manufacturing industries and labor resources of Hebei, the implementation of the aforementioned measures could effectively facilitate regional industrial collaboration.

5. Conclusions

This study was conducted through spatial autocorrelation analysis, the Gini coefficient, a comprehensive evaluation model, and a coupling coordination model, following the survey path of “objective determination → modeling → evaluation and analysis → countermeasures and suggestions”. The purpose was to evaluate the coordinated development of the population and economy in the counties within the BTHUA. Finally, the following major conclusions were obtained.
(1) In 2010 and 2022, all evaluation indicators for the population and economy in the BTHUA exhibited strong spatial clustering effects, and most of the clustering effects were intensifying. The Gini coefficients indicated the balanced regional distribution of indicators such as the construction area population density, regional industrial structure, and per capita disposable income in counties, while other indicators (average nighttime light intensity, population density, economic production efficiency, and government financial resources) showed large regional disparities. Compared to 2010, the Gini coefficients for all evaluation indicators in 2022 decreased, suggesting that the gaps between the counties were narrowing.
(2) In 2010, the population distribution and economic development indicators for the BTHUA were mainly at Level III and Level IV, with weak spatial clustering effects. By 2022, there was a significant rise in the levels of both the population distribution and economic development indicators, accompanied by enhanced spatial clustering effects. In particular, the economic development of most counties had increased to Level I or Level II, exhibiting strong characteristics of H-H significant clusters. In 2010, the coupling coordination level between the population distribution and economic development in the counties was low. The high-coordination region mainly encompassed cities such as Beijing, Tianjin, Shijiazhuang, and Baoding, as well as their surrounding areas. Most counties belonged to the general or low coordination level. By 2022, the coupling coordination level between the population and economy was greatly improved, with most counties attaining the high or moderate coordination level. Those at the general and low coordination levels were scattered in the west and north of Hebei Province.
(3) Overall, the regional differences within the BTHUA were reduced to a certain extent, showing enhanced spatial clustering effects. However, in some remote counties, there were still issues such as an irrational population distribution and low economic vitality. To match the population distribution with land use and synchronize the economic structure with growth in the BTHUA, countermeasures and suggestions for coordinated development within this region were proposed from two perspectives: guiding orderly population flow and promoting regional industrial coordination.
(4) In this study, a comprehensive evaluation was conducted on the coordinated development of the “population–economy” within the BTHUA. The purpose was to support population relief in the central urban areas of Beijing and Tianjin and agglomerated development in the urbanized areas of Hebei Province, as well as industrial upgrading and layout optimization in rural areas. However, with the implementation of the “Beijing–Tianjin–Hebei Coordinated Development Strategy” and the Territorial Spatial Plan for-Beijing–Tianjin–Hebei -(2021–2035), regional development has been extended to include coordination beyond the population distribution and economic development. The BTHUA faces new demands for coordinated development in its territorial space. In this context, it is crucial for a comprehensive evaluation to be conducted on the coordinated development of infrastructure, utilities, and ecological security in the BTHUA. By identifying deficiencies and prominent issues in the use of territorial space, targeted countermeasures can be proposed. Ultimately, this approach will enhance the regional competitiveness and comprehensive carrying capacity, thereby promoting integrated development in the BTHUA.

Author Contributions

Conceptualization, Y.R. and Y.L.; methodology, Y.R., Y.Z. and Y.L.; data curation, Y.R., S.L., L.Y. and L.T.; writing—original draft, Y.R. and Y.L.; writing—review and editing, Y.Z. and Y.L.; investigation, S.L., L.Y. and L.T.; funding acquisition, Y.Z. and Y.L. All authors have read and agreed to the published version of the manuscript.

Funding

This research was funded by the Key Laboratory of Land Use, Ministry of Natural Resources (Evaluation of the Coordinated Development of the Coordinated Development of Territorial Space Within the Beijing–Tianjin–Hebei Urban Agglomeration) and the National Key Research and Development Program of China, grant number 2022YFC3802805 (Mode and Planning Technology of Land Consolidation and Ecological Restoration in Ecologically Fragile County Areas).

Data Availability Statement

All data and materials are available upon request.

Acknowledgments

We would like to thank the reviewers for their thoughtful comments, which helped to improve the quality of this work.

Conflicts of Interest

The authors declare no conflicts of interest.

References

  1. Gharbia, S.S.; Alfatah, S.A.; Gill, L.; Johnston, P.; Pilla, F. Land use scenarios and projections simulation using an integrated GIS cellular automata algorithms. Model. Earth Syst. Environ. 2016, 2, 151. [Google Scholar] [CrossRef]
  2. Dong, Y.; Jin, G.; Deng, X. Optimization of territorial space layout in China. Acta Geogr. Sin. 2024, 79, 672–687. [Google Scholar] [CrossRef]
  3. Chen, M. Coupling and coordinated evolution of transport-industry-urban scale in Beijing-Tianjin-Hebei urban agglomeration. Econ. Geogr. 2022, 42, 96–102, 185. [Google Scholar]
  4. Li, Q.; Li, D.; Wang, J.; Wang, S.; Wang, R.; Fu, G.; Yuan, Y.; Zheng, Z. Spatial heterogeneity of ecosystem service bundles and the driving factors in the Beijing-Tianjin-Hebei region. J. Clean. Prod. 2024, 479, 144006. [Google Scholar] [CrossRef]
  5. Koroso, N.H.; Lengoiboni, M.; Zevenbergen, J.A. Urbanization and urban land use efficiency: Evidence from regional and Addis Ababa satellite cities, Ethiopia. Habitat Int. 2021, 117, 102–437. [Google Scholar] [CrossRef]
  6. Hao, Q.; Deng, L.; Feng, Z. The “Double Evaluation” under the context of spatial planning: Wicked problems and restricted rationality. J. Nat. Resour. 2021, 36, 541–551. [Google Scholar] [CrossRef]
  7. Feng, G.; Wang, R.; Xie, Y. The connotation of territorial space from the perspective of national governance. China Land Sci. 2021, 35, 8–16. [Google Scholar]
  8. Lu, D.; Ye, J.; Xue, D. Urban agglomerations: Growth poles and power sources for high-quality development. Sci. Technol. Rev. 2021, 39, 62–64. [Google Scholar]
  9. Lin, J.; Liu, G.; Wang, P. Analysis of territorial spatial planning management from the perspective of natural resource supervision: Based on the allocation of spatial development rights. Planners 2024, 40, 1–7. [Google Scholar]
  10. Fan, J.; Wu, J.; Gao, X. Spatial characteristics of major function achievements in China’s urbanized areas over the past decade and future layout optimization. Econ. Geogr. 2024, 44, 1–13. [Google Scholar]
  11. Zhai, D. Identification, attribution, and resolution of territorial space conflict in urban agglomerations. City Plan. Rev. 2024, 48, 71–84. [Google Scholar]
  12. Li, S.; Zhao, X.; Pu, J.; Miao, P.; Wang, Q.; Tan, K. Optimize and control territorial spatial functional areas to improve the ecological stability and total environment in karst areas of Southwest China. Land Use Policy 2021, 100, 104940. [Google Scholar] [CrossRef]
  13. Li, X.; Kuang, W. Spatio-temporal trajectories of urban land use change during 1980-2015 and future scenario simulation in Beijing-Tianjin-Hebei urban agglomeration. Econ. Geogr. 2019, 39, 187–194, 200. [Google Scholar]
  14. Zhai, Y.; Zhai, G.; Yu, Z.; Lu, Z.; Chen, Y.; Liu, J. Coupling coordination between urbanization and ecosystem services value in the Beijing-Tianjin-Hebei urban agglomeration. Sustain. Cities Soc. 2024, 113, 105715. [Google Scholar] [CrossRef]
  15. Zheng, H.; Gu, R. Characteristics of carbon emission network and evaluation of emission reduction synergy in the Beijing-Tianjin-Hebei urban agglomeration. Environ. Sci. 2024, 1–17. [Google Scholar] [CrossRef]
  16. Song, C.; Sun, C.; Xu, J.; Fan, F. Establishing coordinated development index of urbanization based on multi-source data: A case study of Guangdong-Hong Kong-Macao Greater Bay Area, China. Ecol. Indic. 2022, 140, 109030. [Google Scholar] [CrossRef]
  17. Li, Y.; Miao, Y. A comparative study on the coordinated development of Beijing-Tianjin-Hebei urban agglomeration based on gravity model. J. Beijing Jiaotong Univ. (Soc. Sci. Ed.) 2022, 21, 78–91. [Google Scholar]
  18. Ma, W.; Gao, H. Impact of high-speed railway network improvement on consumption synergy in Beijing-Tianjin-Hebei region. Transp. Policy 2024, 158, 29–41. [Google Scholar] [CrossRef]
  19. Shang, H.; Liu, J. Policy effect and spatial differentiation of Beijing-Tianjin-Hebei coordinated development. Acta Geogr. Sin. 2024, 79, 2020–2041. [Google Scholar]
  20. Liu, Z.; Yuan, Q.; Li, C.; Gao, L.; Xu, J. Research on the synergistic effect of low-carbon economy and high-quality development under the “dual-carbon” strategy: A case study of Beijing-Tianjin-Hebei urban agglomeration. Environ. Sci. 2024, 45, 6301–6312. [Google Scholar]
  21. Wu, Z.; Zu, J.; Shi, Y.; Hao, J. Identification and evaluation of production-living-ecological space from the perspective of urban function: Taking the Beijing-Tianjin-Hebei urban agglomeration as an example. Resour. Sci. 2022, 44, 2247–2259. [Google Scholar] [CrossRef]
  22. Wang, T.; Yue, W. Optimizing territorial spatial pattern for carbon sink growth: Theoretical framework and action logic. J. Nat. Resour. 2024, 39, 1008–1021. [Google Scholar] [CrossRef]
  23. Lu, Z.; Zhang, M.; Hu, C.; Ma, L.; Chen, E.; Zhang, C.; Xia, G. Spatiotemporal Changes and Influencing Factors of the Coupled Production–Living–Ecological Functions in the Yellow River Basin, China. Land 2024, 13, 1909. [Google Scholar] [CrossRef]
  24. Chen, Y.; Song, J.; Zhong, S.; Liu, Z.; Gao, W. Effect of destructive earthquake on the population-economy-space urbanization at county level: A case study on Dujiangyan county, China. Sustain. Cities Soc. 2022, 76, 103345. [Google Scholar] [CrossRef]
  25. Fan, J.; Lian, Y.; Zhao, H. Review of the research progress in Beijing-Tianjin-Hebei region since 1980. Acta Geogr. Sin. 2022, 77, 1299–1319. [Google Scholar]
  26. Li, G.; Lv, S. Research on the technological innovation and industrial synergistic development in Beijing-Tianjin-Hebei. J. Cap. Univ. Econ. Bus. 2024, 26, 27–37. [Google Scholar]
  27. Lu, D. Function orientation and coordinating development of subregions within the Jing-Jin-Ji urban agglomeration. Prog. Geogr. 2015, 34, 265–270. [Google Scholar]
  28. Fang, C.; Cui, X.; Li, G.; Bao, C.; Wang, Z.; Ma, H.; Sun, S.; Liu, H.; Luo, K.; Ren, Y. Modeling regional sustainable development scenarios using the urbanization and eco-environment coupler: Case study of Beijing-Tianjin-Hebei urban agglomeration, China. Sci. Total Environ. 2019, 689, 820–830. [Google Scholar] [CrossRef]
  29. Wang, D.; Pang, X. Research on green land-use efficiency of Beijing-Tianjin-Hebei urban agglomeration. China Popul. Resour. Environ. 2019, 29, 68–76. [Google Scholar]
  30. Ouyang, X.; Zhu, X. Spatio-temporal characteristics of urban land expansion in Chinese urban agglomerations. Acta Geogr. Sin. 2020, 75, 571–588. [Google Scholar]
  31. Li, W.; Lv, X.; Wang, C.; Han, L. Interactions between urbanization, land, water, and carbon and their combined effects on Beijing-Tianjin-Hebei urban agglomeration. Acta Ecol. Sin. 2021, 41, 4318–4329. [Google Scholar]
  32. Lu, Z.; Zhang, Z. Research on regional variability in the evolution of territorial space pattern and its driving factors in Beijing-Tianjin-Hebei region. China Land Sci. 2022, 36, 42–52. [Google Scholar]
  33. Wu, J.; Tang, S.; Gao, L.; Wang, Z. Evaluation of land space utilization quality in Beijing-Tianjin-Hebei coordinated development area. J. Hebei Norm. Univ. (Nat. Sci.) 2022, 46, 316–324. [Google Scholar]
  34. Hu, Q.; Wang, X.; Shen, W.; Zhang, Z. Study on the balanced development of territorial space functions in urban agglomerations: Taking Beijing-Tianjin-Hebei region as an example. China Land Sci. 2023, 37, 53–65. [Google Scholar]
  35. Zhao, Z.; Wang, J.; Feng, J. Research on the spatial correlation of central cities in Beijing-Tianjin-Hebei urban agglomeration. Econ. Geogr. 2017, 37, 60–66, 75. [Google Scholar]
  36. Ma, L.; Shi, D. Study on green collaborative development process of Beijing-Tianjin-Hebei region through re-examination of spatial environmental Kuznets curve. China Soft Sci. 2017, 10, 82–93. [Google Scholar]
  37. Pan, Y.; Weng, G.; Sheng, K.; Xiao, Y. Analysis of the spatiotemporal evolution characteristics and spatial difference of “Tourism +” system coordinated development in the Yangtze River Economic Belt. Resour. Environ. Yangtze Basin 2020, 29, 1897–1909. [Google Scholar]
  38. Yue, W.; Xia, H.; Zhang, X. Territorial spatial governance for high-quality urban agglomerations development: Insights from the Yangtze River Delta and Guangdong-Hong Kong-Macao Greater Bay Area. Trop. Geogr. 2024, 44, 2129–2141. [Google Scholar]
  39. Li, R.; Shan, J.; Zhao, J.; Hu, H.; Liu, D.; Wang, G.; Li, Y. Spatio-temporal evolution and obstacle factors of territorial utilization quality in the Bohai Rim. Geogr. Res. 2024, 43, 736–753. [Google Scholar]
  40. Li, Y.; Li, X.; Liao, C.; Jiang, L.; Hong, W.; Wang, W.; Guo, R. On the collaborative technical framework of land spatial governance driven by high-quality development. Bull. Surv. Mapp. 2024, 3, 95–100, 144. [Google Scholar]
  41. Cliff, A.D.; Ord, J.K. Spatial Autocorrelation; Springer: Berlin/Heidelberg, Germany, 1973. [Google Scholar]
  42. Anselin, L. Local indicators of spatial association-LISA. Geogr. Anal. 1995, 27, 93–115. [Google Scholar] [CrossRef]
  43. Zhang, X.; Feng, Z. Spatial autocorrelation analysis of China’s per capita GDP. Econ. Geogr. 2008, 28, 189–194. [Google Scholar]
  44. Griffith, D.A. Spatial autocorrelation: A statistician’s reflections. In Advances in Spatial Science; Springer: Berlin/Heidelberg, Germany, 2007; pp. 255–278. [Google Scholar]
  45. Griffith, D.A. Spatial autocorrelation. In Handbook of Applied Spatial Analysis; Springer: Berlin/Heidelberg, Germany, 2009; pp. 255–278. [Google Scholar]
  46. Xie, H.; Liu, L.; Li, B.; Zhang, X. Spatial autocorrelation analysis of multi-scale land-use changes: A case study in Ongniud Banner, Inner Mongolia. Acta Geogr. Sin. 2006, 4, 389–400. [Google Scholar]
  47. Zhang, X. Data Analysis Method and Applied Research of Spatial Autocorrelation: A Case Study in the Influence of South Asian Tsunami on the Marine Ecological Factors. Doctoral dissertation, Lanzhou University, Lanzhou, China, 2009. [Google Scholar]
  48. Chen, Y. Reconstructing the mathematical process of spatial autocorrelation based on Moran’s statistics. Geogr. Res. 2009, 28, 1449–1463. [Google Scholar]
  49. Gini, C. Measurement of inequality of incomes. Econ. J. 1921, 31, 124–126. [Google Scholar] [CrossRef]
  50. Dagum, C. A new approach to the decomposition of the Gini income inequality ratio. Empir. Econ. 1997, 22, 515–531. [Google Scholar] [CrossRef]
Figure 1. Research technical route. Notes: PD: population density (persons/hectare); CPD: construction area population density (persons/hectare); ANLI: average night light index; CGDP: GDP per unit of construction land (CNY 10,000 /hectare); RIS: regional industrial structure; PCDI: per capita disposable income (CNY 10,000); PCPBR: per capita public budget revenue (CNY/person).
Land 14 00590 g001
Figure 2. Lorenz curves of average nighttime light index in 2010 and 2022 (a,b).
Land 14 00590 g002
Figure 3. Evaluation results of population distribution indices in 2010 and 2022 (a,b); level changes in population distribution indices from 2010 to 2022 (c); clustering results of population distribution indices in 2010 and 2022 (d,e). Notes: H-H significant indicates that regions with high values were spatially aggregated with adjacent high-value regions, forming distinct “hot spots”. L-L significant signifies that regions with low values were clustered together with neighboring low-value regions, creating distinct “cold spots”. H-L significant occurred when high-value regions were surrounded by low-value regions, resulting in significant “spatial anomalies” or “spatial heterogeneity”. L-H significant was observed when low-value regions were enveloped by high-value regions.
Land 14 00590 g003
Figure 4. Evaluation results of economic development indices in 2010 and 2022 (a,b); level changes in economic development indices from 2010 to 2022 (c); clustering results of economic development indices in 2010 and 2022 (d,e). Notes: The interpretations of H-H significant, L-L significant, H-L significant, and L-H significant are consistent with those depicted in Figure 3.
Land 14 00590 g004
Figure 5. Evaluation results of coordinated development of “population–economy” (a,b); level changes in coordinated development from 2010 to 2022 (c).
Land 14 00590 g005
Table 1. Evaluation indices for population distribution status and economic development features in counties within the BTHUA.
Criterion LayerEvaluation IndicatorIndicator MeaningCalculation FormulaData Source
Population Distribution StatusPD
(people/ha)
The number of residents per unit of territorial area, reflecting the population density on regional land.The population of permanent residents in a county/the territorial area in the countyLand cover data; Statistical Yearbook
CPD
(people/ha)
The number of residents per unit of construction land area, reflecting the population density on regional construction land.The population of permanent residents in a county/the construction area in the countyLand cover data; Statistical Yearbook
ANLIThe average nighttime light indicator of a certain area, reflecting the average light intensity or density and the degree of change in human activities at night.Total nighttime light indicator of a county/the territorial area of the countyNighttime light data (2000–2023)
Economic Development FeaturesCGDP
(CNY 10,000/ha)
GDP output per unit area of construction land, reflecting the development and use efficiency of construction land.The secondary and tertiary industry-added value of a county/the construction area of the countyLand cover data; Statistical Yearbook
RISThe composition among various industrial sectors of a county’s national economy and within each industrial sector, reflecting the economic development level of the county and changes in development stages. In this study, this indicator was reflected by the proportion of tertiary industry added value.The tertiary industry added value of a county/the GDP of the countyStatistical Yearbook
PCDI
(CNY 10,000)
The income available for free disposal by residents, reflecting the economic status and purchasing power of residents in a region.Average personal disposable income in a countyStatistical Yearbook
PCPBR (CNY/people)The total public budget revenue over a certain period (e.g., one year) divided by the average population during that period, reflecting the government’s investment level in public services, infrastructure construction, etc., as well as residents’ financial welfare.The public budget revenue in a county/the population of permanent residents in the countyStatistical Yearbook
Table 2. Standardized values and weights of evaluation indices for “population–economy” in counties within the BTHUA.
Evaluation IndicatorStandardized ValueWeight
1.00.80.60.40.2
PD≥1810~186~102~6<20.3690
CPD≥110110~6040~6030~40<300.3413
ANLI≥51~50.3~10.1~0.3<0.10.2897
CGDP≥500150~50080~15050~80<500.2702
RIS≥0.60.45~0.600.35~0.450.25~0.35<0.250.2545
PCDI≥2500015,000~25,00010,000~15,0006000~10,000<60000.2480
PCPBR≥50002000~50001000~2000500~1000<5000.2272
Table 3. Moran’s I and Gini coefficients for the single index of the population distribution status of the counties in 2010 and 2022.
Evaluation IndicatorMoran’s IGini Coefficient
2010202220102022
PD0.6640.6680.550.58
CPD0.6150.6390.290.29
ANLI0.5120.5060.820.76
Table 4. Moran’s I and Gini coefficients for the single index of the economic development features of the counties in 2010 and 2022.
Evaluation IndicatorMoran’s IGini Coefficient
2010202220102022
CGDP0.3680.4380.570.53
RIS0.4660.5210.280.20
PCDI0.7050.7490.310.29
PCPBR0.5100.3730.580.42
Disclaimer/Publisher’s Note: The statements, opinions and data contained in all publications are solely those of the individual author(s) and contributor(s) and not of MDPI and/or the editor(s). MDPI and/or the editor(s) disclaim responsibility for any injury to people or property resulting from any ideas, methods, instructions or products referred to in the content.

