Article

Assessing Forest Carbon Sequestration in China Under Multiple Climate Change Mitigation Scenarios

by
Mingli Qiu
1,
Yuxin Zhao
1 and
Dianfeng Liu
1,2,3,*
1
School of Resources and Environmental Sciences, Wuhan University, Wuhan 430079, China
2
Key Laboratory of Digital Cartography and Land Information Application Engineering, Ministry of Natural Resources, Wuhan 430079, China
3
Hubei Luojia Laboratory, Wuhan University, Wuhan 430079, China
*
Author to whom correspondence should be addressed.
Land 2025, 14(3), 571; https://doi.org/10.3390/land14030571
Submission received: 18 January 2025 / Revised: 5 March 2025 / Accepted: 7 March 2025 / Published: 8 March 2025
(This article belongs to the Section Land, Biodiversity, and Human Wellbeing)

Abstract

:
Understanding how climate policies impact forest carbon sequestration is crucial for optimizing mitigation strategies. This study evaluated forest carbon sequestration in China from 2020 to 2060 under three climate scenarios: SSP1-2.6 (high mitigation), SSP3-7.0 (limited mitigation), and SSP5-8.5 (no mitigation). We integrated the land-use harmonization (LUH2) and patch-generating land-use simulation (PLUS) models to project forest cover change, and the Lund–Potsdam–Jena managed land (LPJmL) model to simulate carbon dynamics. The results showed stronger mitigation efforts led to higher sequestration, with annual rates of 0.49, 0.48, and 0.20 Pg yr−1 across the scenarios. SSP1-2.6 achieved the highest carbon density (17.75 kg m−2) and sequestration (56.95 Pg), driven by the greatest increases in the carbon density of existing forests (+41.56%) and soil carbon (+39.94%). SSP3-7.0, despite the highest forest cover (34.74%), had a lower carbon density (17.19 kg m−2) and sequestration (56.84 Pg). SSP5-8.5 recorded the lowest forest cover (27.12%) and sequestration (45.62 Pg). Increasing carbon density, rather than expanding forest area, could be more effective for carbon sequestration in China. The carbon density and annual sequestration in existing forests were 2.36 and 2.89 times higher than in new forests. We recommend prioritizing SSP1-2.6 to maximize sequestration, focusing on protecting southwest forests and soil carbon.

1. Introduction

As climate change accelerates, reducing greenhouse gas emissions and limiting global warming have become urgent international priorities [1]. The Paris Agreement aims to limit the temperature rise below 2 °C by 2100, urging countries to peak and neutralize carbon emissions rapidly [2]. Forest ecosystems are crucial in this context, as they have the potential to serve as significant carbon sinks [3]. Forests absorb CO2 and sequester it in biomass, litter, and soil, effectively reducing atmospheric carbon concentrations [1,3]. Globally, the annual carbon sequestration by forest ecosystems is equivalent to one-third of fossil fuel emissions, making forest conservation and restoration central to the climate strategies of many countries [1,2,4].
China, currently the world’s largest CO2 emitter, has committed to peak carbon emissions by 2030 and achieving carbon neutrality by 2060 [3]. To meet these ambitious goals, the country has implemented a range of climate change mitigation measures focused on economic transformation, energy restructuring, and ecosystem protection [5,6]. Notably, several of these measures, such as regulating forest occupation, timber consumption, fuelwood use, and forest restoration, directly affect forest cover and carbon sequestration, which, in turn, influences climate change mitigation outcomes [2,7,8,9]. Therefore, assessing the spatial effects of climate policies on forest cover and carbon sequestration is crucial for evaluating their effectiveness and guiding future improvements.
Model coupling analyses are the primary approaches for exploring the impact of climate policies on forest ecosystems [3,10]. These approaches integrate simulations of forest cover change with ecological effect assessments to evaluate policy outcomes [11,12]. Recent studies on the forest cover change simulation have focused on the role of natural environmental factors [13]. For example, neighboring forest proportions, climate, soil, and topography directly influence physiological processes like tree germination, growth, and reproduction, ultimately determining habitat suitability [14,15,16]. However, forest cover change is also driven by socioeconomic factors [3]. Human activities, including agriculture, urbanization, and infrastructure development, can alter the forest ecosystem structure and function, affecting both the sustainability of forest recovery and the extent of cover loss [14,17,18]. The interaction between natural and socioeconomic factors further shapes landscape patterns, with wildfires, agricultural expansion, and construction being key drivers of deforestation [19].
Species distribution models (SDMs) and land-use and cover change (LUCC) simulation models are two major methods for simulating forest cover change [3,13,16,20]. SDMs apply spatial statistics and machine learning to establish correlations between tree species distribution and environmental variables [11,12]. While traditional spatial statistics focus on the linear or additive effects of environmental variables on species distribution, they struggle with complex interactions among multiple factors [3,21,22]. In contrast, machine-learning models can better capture these complexities more effectively, although they often lack interpretability [21]. As a classic LUCC simulation model, the cellular automata (CA) model models simulate fine-scale forest cover dynamics by incorporating spatial proximity and land-use and cover change probabilities [23]. The patch-generating land-use simulation (PLUS) model combines machine learning with CA models, and offers both feature learning and spatial simulation capabilities [24]. The land-use harmonization (LUH2) model, part of the coupled model intercomparison project 6 (CMIP6), provides large-scale and long-term projections of land-use and cover change under various climate change mitigation policy scenarios [25,26]. However, its global scale and spatial resolution of 0.25° limit its application in detailed forest carbon sequestration estimates [20].
Forest carbon sequestration assessment models can be categorized into three groups: parameterized models based on observed data, time-series models reflecting forest succession, and dynamic vegetation models simulating physiological responses [7,27,28,29]. Parameterized models, such as the Integrated Valuation of Ecosystem Services and Trade-offs (InVEST), quantify carbon sequestration in specific forest cover states using historical data and average carbon densities across four carbon pools: above-ground biomass, below-ground biomass, litter, and soil organic matter [28]. Time-series models account for bioclimatic constraints and forest growth stages to capture the carbon accumulation over time. For example, forest age-logistic models estimate regional carbon sequestration limits and processes under specific climatic and soil conditions [27]. While these models focus on fixed climate variables like temperature and precipitation, they often fail to capture the effects of climate variability on forest carbon dynamics [7]. Dynamic vegetation models can simulate vegetation responses to climate change [7]. However, inconsistencies in the input datasets, particularly those related to climate and land-use and cover changes, limit the models’ capacity to estimate forest carbon sequestration incorporating future climate mitigation policies [30].
To address these limitations, we developed a coupled modeling framework to simulate forest carbon sequestration in China from 2020 to 2060 under multiple climate change mitigation policy scenarios. This framework integrated PLUS with LUH2 to model forest cover change driven by policy choices. Subsequently, it used the Lund–Potsdam–Jena managed land (LPJmL) to simulate forest growth and carbon accumulation, establishing links between forest cover change and carbon sequestration across different policy scenarios.

2. Materials and Methods
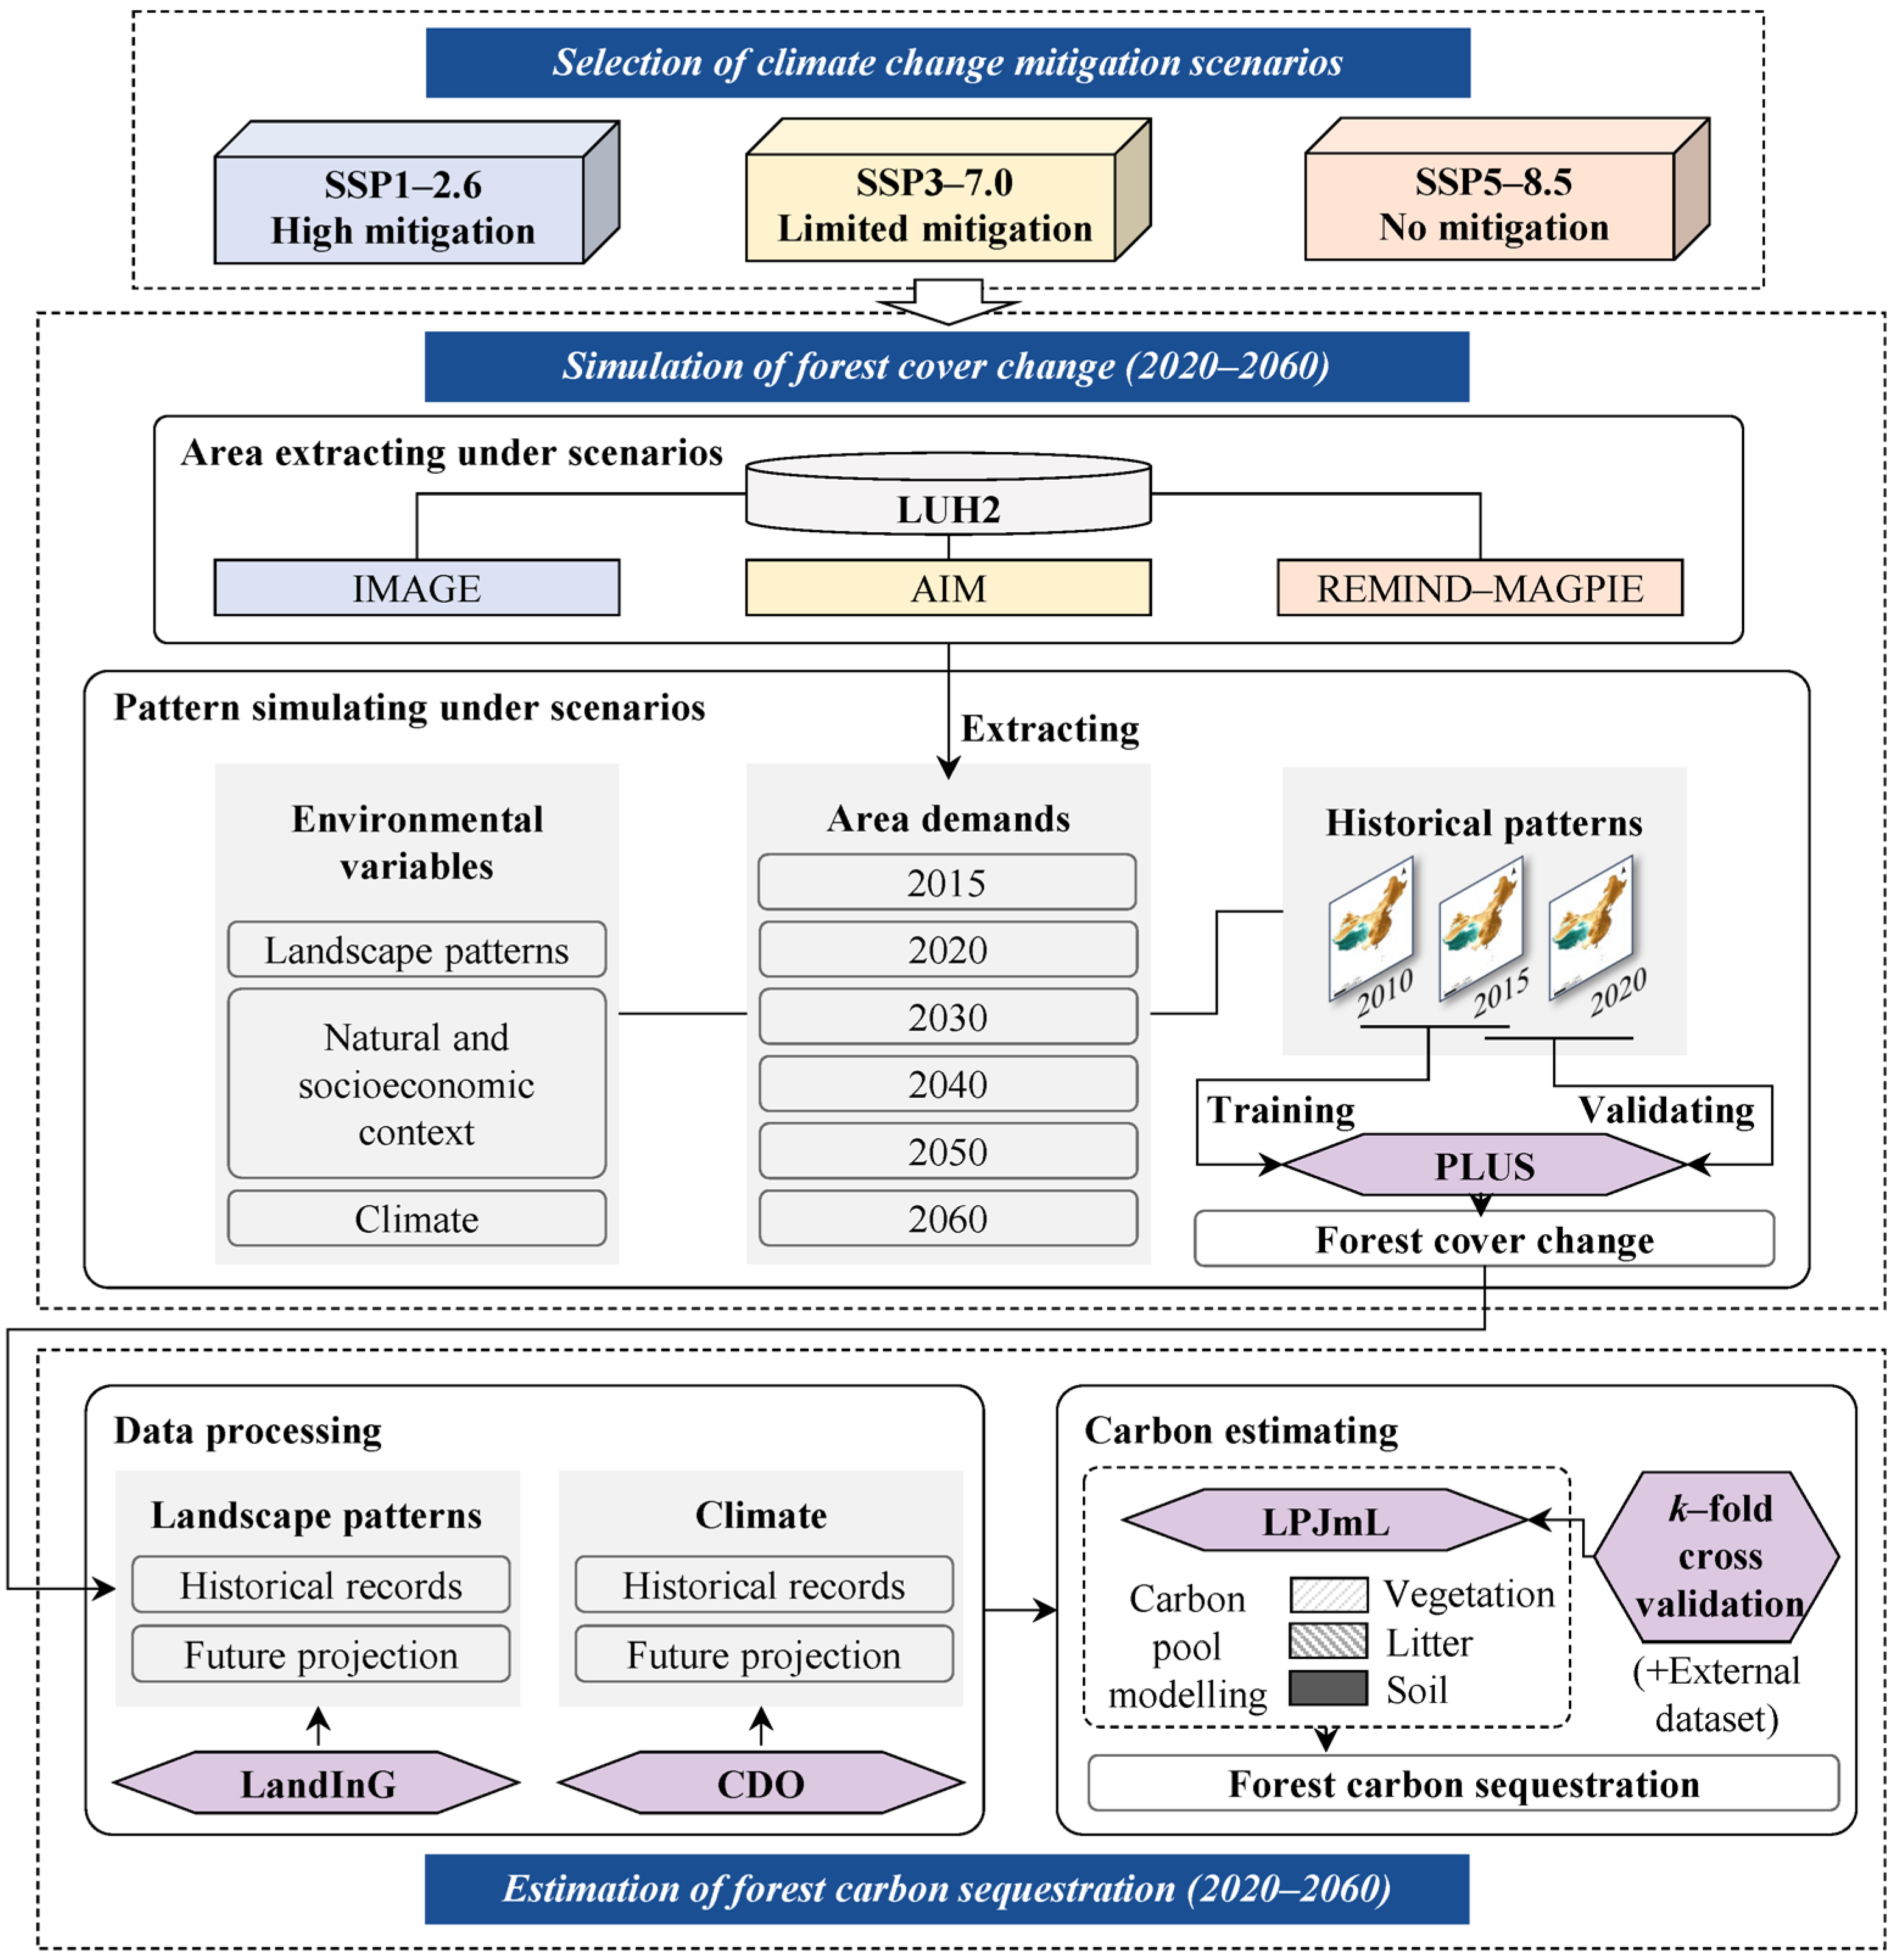
2.1. Methodology

We developed a coupled modeling framework to assess forest carbon sequestration in China under different climate change mitigation policy scenarios (Figure 1). Three mitigation pathways—SSP1-2.6, SSP3-7.0, and SSP5-8.5—were chosen based on harmonized scenarios for comparing carbon sequestration and other ecosystem services, proposed by the intergovernmental science-policy platform on biodiversity and ecosystem services (IPBES) [26]. Then, we used the LUH2 model to extract the areas of forest cover change in China from 2020 to 2060 under these scenarios, which provided the area demand for the PLUS simulation [20,24]. Last, we used the LPJmL model to integrate climate change and forest cover change simulation derived from the PLUS model, and estimated China’s forest carbon sequestration in the vegetation, litter, and soil carbon pools from 2020 to 2060 under SSP1-2.6, SSP3-7.0, and SSP5-8.5 scenarios [30,31].

2.1.1. Description of Climate Change Mitigation Policy Scenarios

We selected three climate change mitigation policy scenarios defined by the IPBES, SSP1-2.6, SSP3-7.0, and SSP5-8.5, to compare China’s forest carbon sequestration under varying levels of mitigation effort (Table A1) [26]. These scenarios provided distinct future pathways, integrating climate change, social development, and land-use changes, enabling the assessment of high-, moderate-, and low-mitigation policies [20,26]. The assessment allowed us to explore how different levels of climate policy could shape the trajectory of forest carbon dynamics in the future [26].
SSP1-2.6 represents the high-mitigation scenario, aiming to limit global radiative forcing to 2.6 W m−2 and temperature rise to 2 °C by 2100 through sustainable development [32,33,34]. This scenario aligns with China’s green development strategy and the Paris Agreement [2,5,6]. Here, the low-carbon transitions in energy and industry reduce reliance on fossil fuels and timber [5,6]. Strong land-use regulations are enforced to avoid environmental trade-offs associated with deforestation and forest conversion [26,35].
In contrast, SSP3-7.0 reflects a limited mitigation pathway, where climate concerns give way to regional rivalry, leading to a projected 7.0 W m−2 radiative forcing and 4 °C increase by 2100 [36]. Regional competition limits technological advancement and international trade, leading to resource-intensive development [26,35]. To maintain food security amidst rapid population growth, agricultural expansion encroaches on extensive areas of forest cover and natural vegetation [26,32,33]. Furthermore, the rising demand for forest resources and limited land-use regulations contribute to ongoing deforestation and high land-use pressure [35].
SSP5-8.5 is a non-mitigation scenario characterized by continued fossil-fueled reliance, projected to result in an 8.5 W m−2 radiative forcing and 5 °C rise by 2100 [32,33]. The scenario poses significant threats to forest cover and ecosystem sustainability due to escalating greenhouse gas emissions [2,37].

2.1.2. Simulation of Forest Cover Change

The LUH2 model provides annual global land-use and cover maps from 850 A.D. to 2100 A.D. under various climate change mitigation policy scenarios [25]. However, its spatial resolution of 0.25° limits detailed regional assessments of forest carbon sequestration [20]. The dataset was generated using multiple integrated assessment models, and most models treated China as an independent modeling region [38]. Therefore, we extracted the LUH2 data on the area demands for land-use and cover changes in China from 2015 to 2060 for the selected scenarios [20], and then used the PLUS model to project these area demands into spatial patterns [24].
The PLUS model allocates quantitative land-use and cover change at the patch level based on historical patterns and environmental variables [24]. For the simulation of forest cover change, we selected environmental variables that influence forest cover change, including macroclimatic conditions, regional environments, and landscape patterns (Table A2). Temperature and precipitation are critical for establishing the essential growth conditions for forests [39]. The natural environment plays a significant role in shaping the distribution of water, heat, and soil, which are vital for forest health and growth [14,16]. Socioeconomic activities also influence various forest characteristics, such as density, age, and productivity, which, in turn, affect the forest’s ability to recover from disturbances [14,17,18]. Additionally, landscape patterns can directly alter forest conditions through land-use and management practices [19].

2.1.3. Estimation of Forest Carbon Sequestration

The LPJmL model evaluates forest carbon sequestration across three pools: vegetation, litter, and soil [31]. The vegetation carbon pool includes biomass derived from photosynthetically active radiation, consisting of leaf, root, sapwood, and heartwood tissues [31,40]. The litter carbon pool consists of biomass that transitions from the vegetation carbon pool, including dead plants and shed leaves and roots [40]. The soil carbon pool is derived from litter and soil organic matter with low solubility [40]. Total carbon sequestration was calculated as the sum of carbon sequestration in the vegetation, litter, and soil carbon pools, with carbon density measured as carbon sequestration per unit area, and annual sequestration estimated as the average change in total carbon sequestration per year.

2.1.4. Model Implementation and Validation

We extracted the areas of land-use and cover change for China from the LUH2 model under different scenarios and used these as inputs for the PLUS model [20,38]. The PLUS model simulated spatial patterns of land-use and cover change, which were then used as inputs for the LPJmL model [31]. The PLUS model was configured following Liang et al. [24], where certain land types including water, snow/ice, barren, and wetlands were restricted from transformation. Input data for the PLUS model were processed and resampled to a resolution of 1000 m using ArcGIS Pro 3.0.1. To validate the simulation, we compared the modeled outcomes with actual land-use changes from 2015 to 2020, using indicators evaluated by the PLUS model including accuracy, the Kappa coefficient, and the FoM coefficient [24,41].
The LPJmL model, following the configuration of Schaphoff et al., was used to estimate China’s forest carbon sequestration [31]. To realize the coupling process, we used the LandInG model to align the simulations of land-use and cover change from the PLUS model, with the spatial extent and resolution required by the LPJmL model [30]. Climate change data were processed using the CDO package [31]. To validate our estimates, we conducted k-fold cross-validation (k = 10) to evaluate the linear regression and R2 values [13], between our forest carbon sequestration map of the vegetation carbon pool for 2020, and a forest above-ground biomass map for 2019 from other studies [42]. Additionally, our estimated values were also compared with national forest inventory statistics, as well as field observations, statistics, and projections from related studies [27,43].

2.2. Data Sources

The input data for the PLUS model included historical patterns and area demands for land-use and cover change, as well as the selected environmental variables (Table 1). Historical patterns were obtained from the China Land Cover Dataset (CLCD) for 2010, 2015, and 2020 with a resolution of 30 m, achieving 79.31% accuracy [41]. Area demands were derived from the LUH2 dataset in China from 2015 to 2060 under the SSP1-2.6, SSP3-7.0, and SSP5-8.5 scenarios [25]. Please see Table A3 for the correspondence between CLCD and LUH2 land-use classes. Environmental variables collected from different time periods are allowed [24], and we collected the variables from similar time periods to 2015. Climate variables were obtained from the climatic research unit gridded time series (CRU TS 4.07) for 2015, with soil data from the harmonized world soil database (HWSD), and the topography from the earth topography (ETOPO1). The gross domestic product (GDP) data were obtained from the real GDP in 2015 based on calibrated nighttime light [44], and other socioeconomic variables were obtained from China’s county-level statistical yearbook in 2016. Landscape pattern variables were processed from the CLCD in 2015, and forest loss data were obtained from updated global maps of forest cover change between 2001 and 2015 [45].
The LPJmL model incorporated data on climate change and land-use and cover change (Table 1). Climate records from 1991 to 2020 were obtained from CRU TS 4.07, ECMWF re-analysis-interim (ERA-Interim), National Centers for Environmental Prediction, which contributes to two global re-analysis (NCEP re-analysis), and Earth System Research Laboratory (ESRL) [31]. Missing radiation data from 2019 to 2020 were supplemented with ERA-Interim data from 2018. Climate projections for 2020 to 2060 were derived from the inter-sectoral impact model intercomparison project (ISIMIP3b). Land-use and cover data from 1991 to 2020 were processed using the LandInG model and its recommended datasets [30], while the projections from 2020 to 2060 were generated using the PLUS model.

3. Results

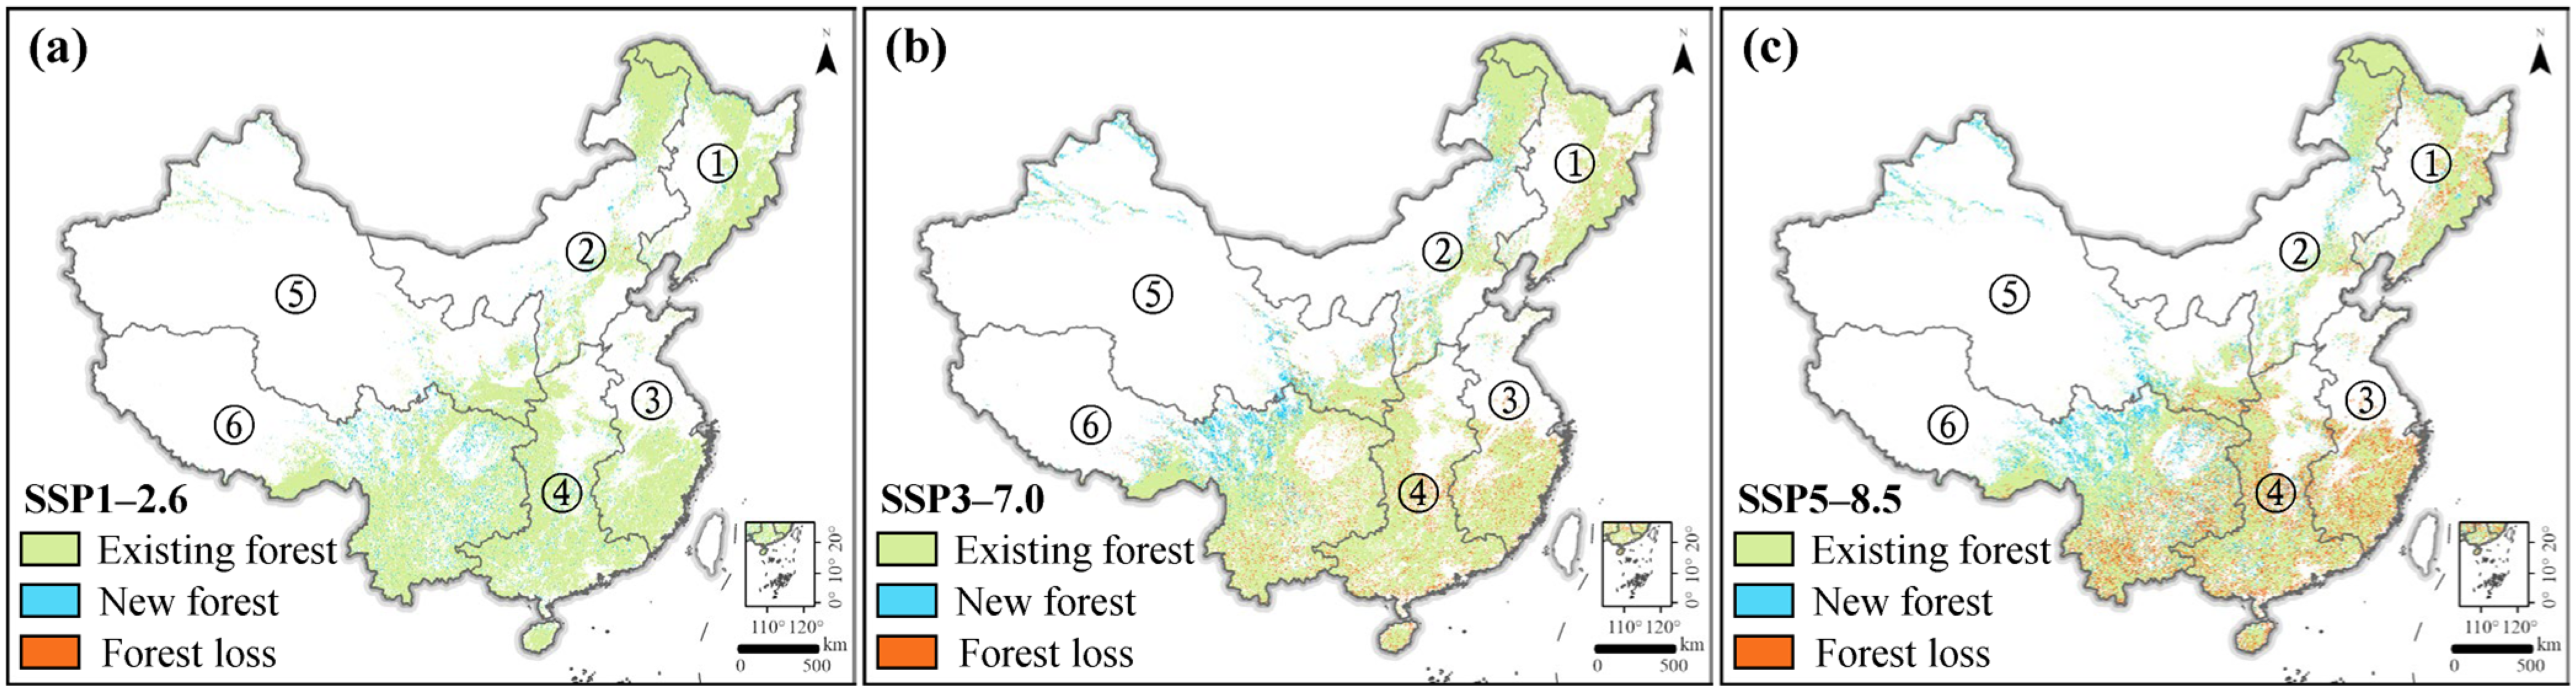
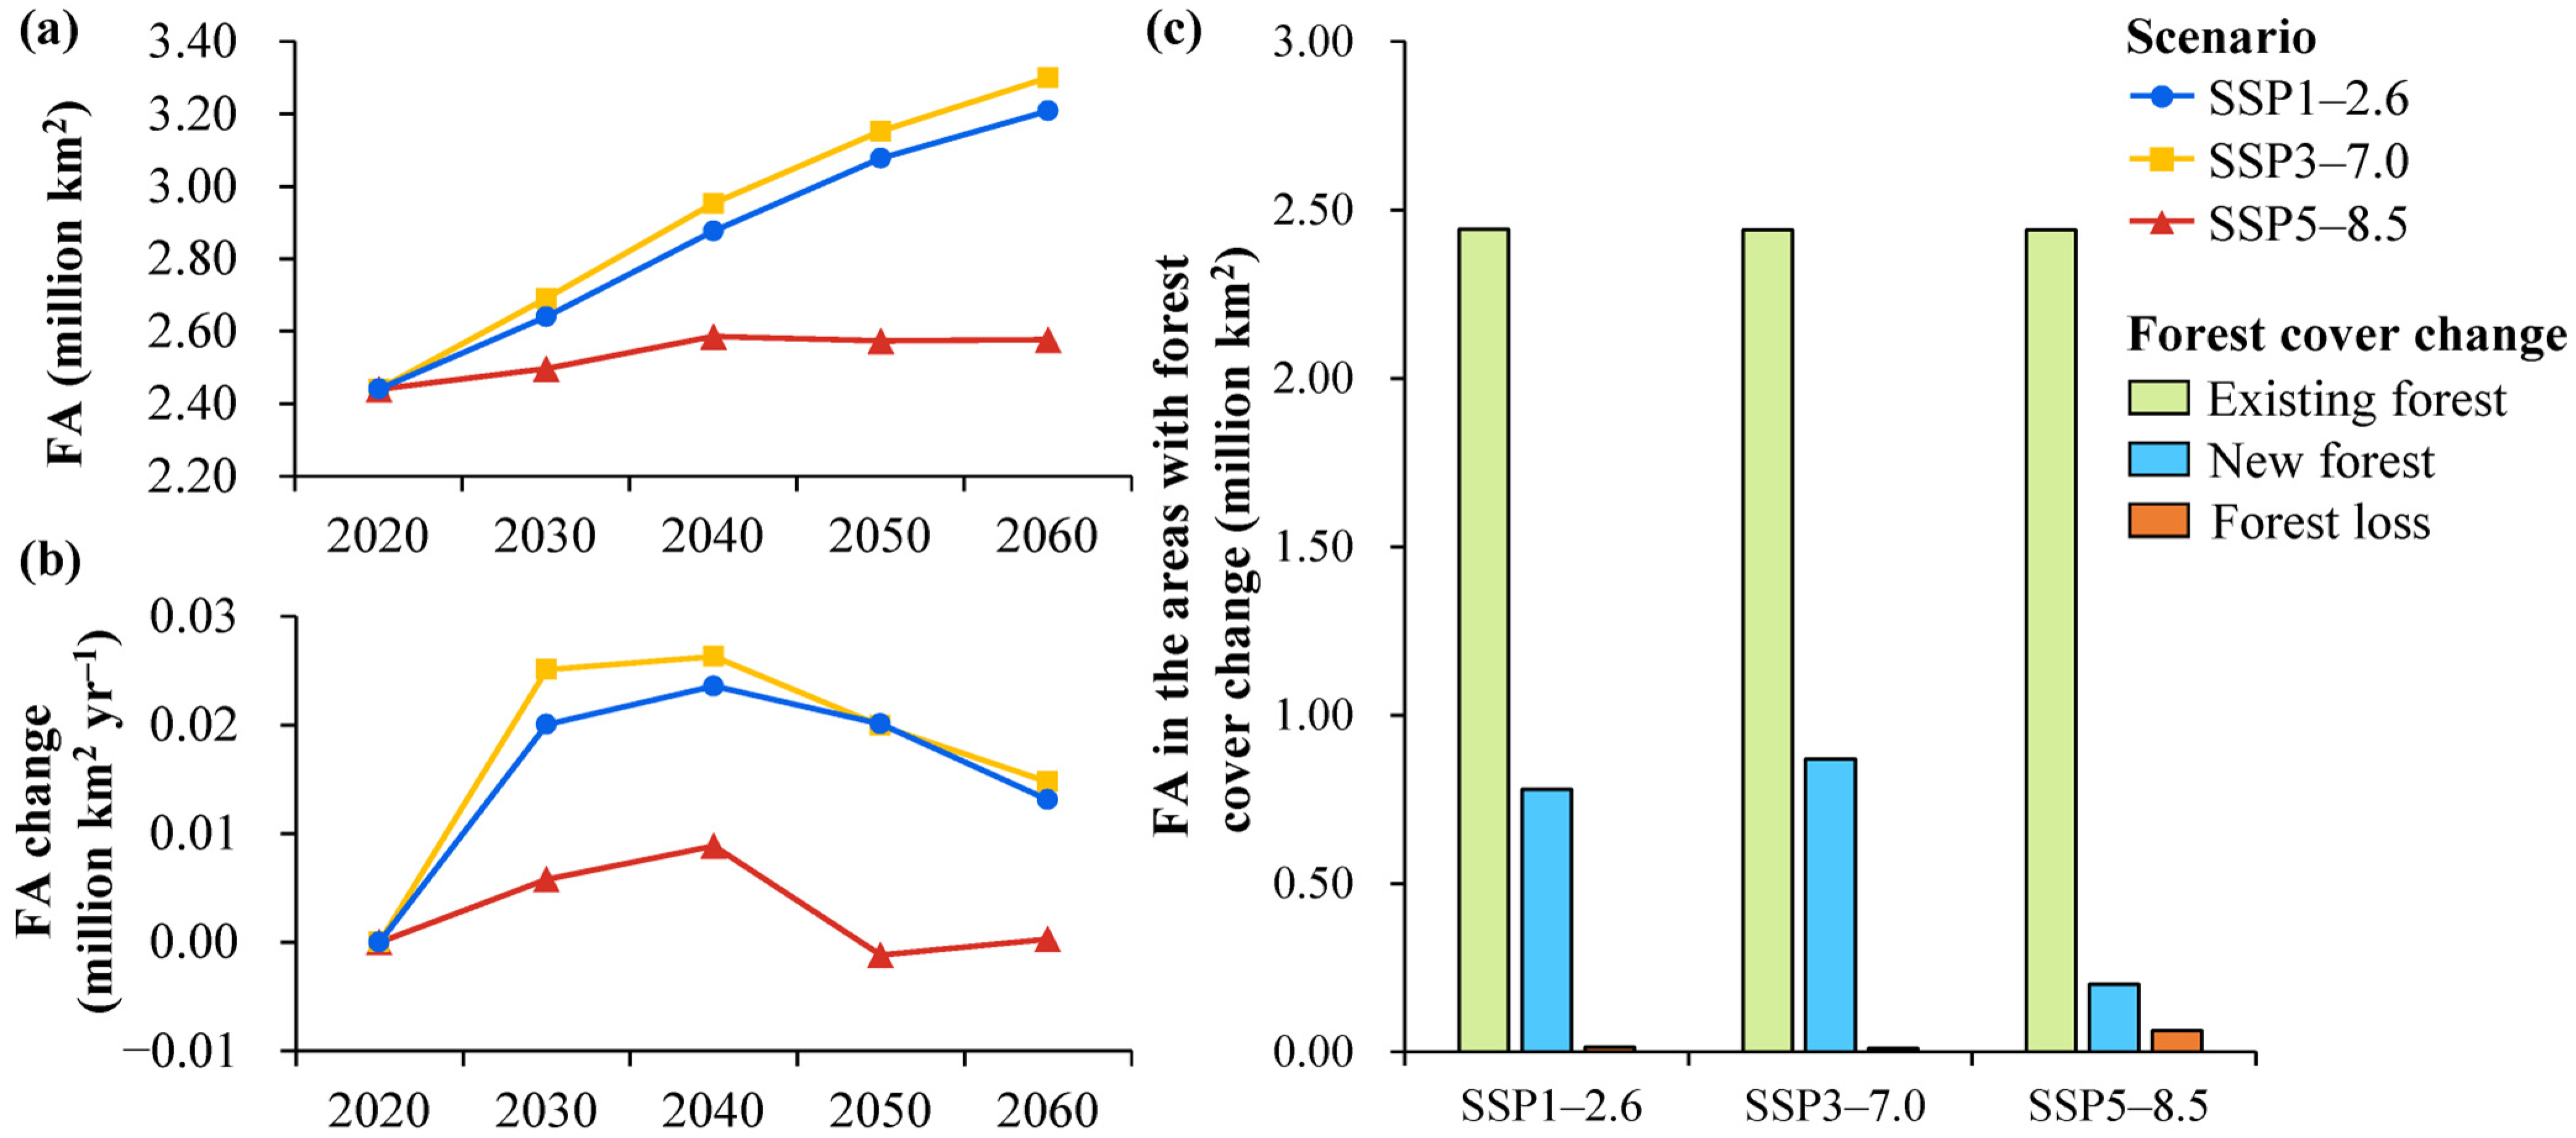
3.1. Forest Area Change Across Scenarios

All scenarios projected an increase in China’s forest cover, with SSP3-7.0 showing the fastest expansion and SSP5-8.5 being the slowest (Figure 2). From 2020 to 2060, the national forest cover was expected to rise from 25.68% to 30.93 ± 3.81%, corresponding to an increased area of 0.50 ± 0.36 million km2. The annual expansion rate averaged 1.47 × 10⁴ km2 yr−1, peaking between 2030 and 2040. By 2060, the forest cover was projected to reach 33.77%, 34.74%, and 27.12% with high, limited, and non-mitigation efforts under SSP1-2.6, SSP3-7.0, and SSP5-8.5. Limited mitigation under SSP3-7.0, associated with a radiative forcing threshold of 7.0 W m−2, was projected to achieve the largest forest cover (34.74%), while a non-mitigation effort under SSP5-8.5, with a radiative forcing threshold of 8.5 W m−2, led to the smallest forest cover (27.12%).
The spatial patterns of forest gains and losses were consistent across scenarios, with most new forests located in southwestern China and losses in the southern regions (Figure A1). Under SSP3-7.0, the new forest area was projected to reach 1.17 million km2, followed by 1.08 million km2 under SSP1-2.6, and 0.30 million km2 under SSP5-8.5. Of these, 28.93%, 25.87%, and 94.73% of new forests were located in southwestern China, respectively. Conversely, the forest loss area was minimal under SSP3-7.0 (0.01 million km2), followed by SSP1-2.6 (0.01 million km2), but the highest in SSP5-8.5 (0.30 million km2), with losses primarily in southern China (67.73%, 58.61%, and 53.06%, respectively). Trends in the existing forest area aligned with these losses, with the minimal areas of existing forests under SSP3-7.0 (2.14 million km2), followed by SSP1-2.6 (2.14 million km2), and the largest under SSP5-8.5 (2.34 million km2), with 34.11%, 34.68%, and 33.82% located in southern China. In all scenarios, the majority of forest loss—95.90%, 65.54%, and 91.62% under SSP3-7.0, SSP1-2.6, and SSP5-8.5, respectively—was attributed to croplands encroaching on existing forests.

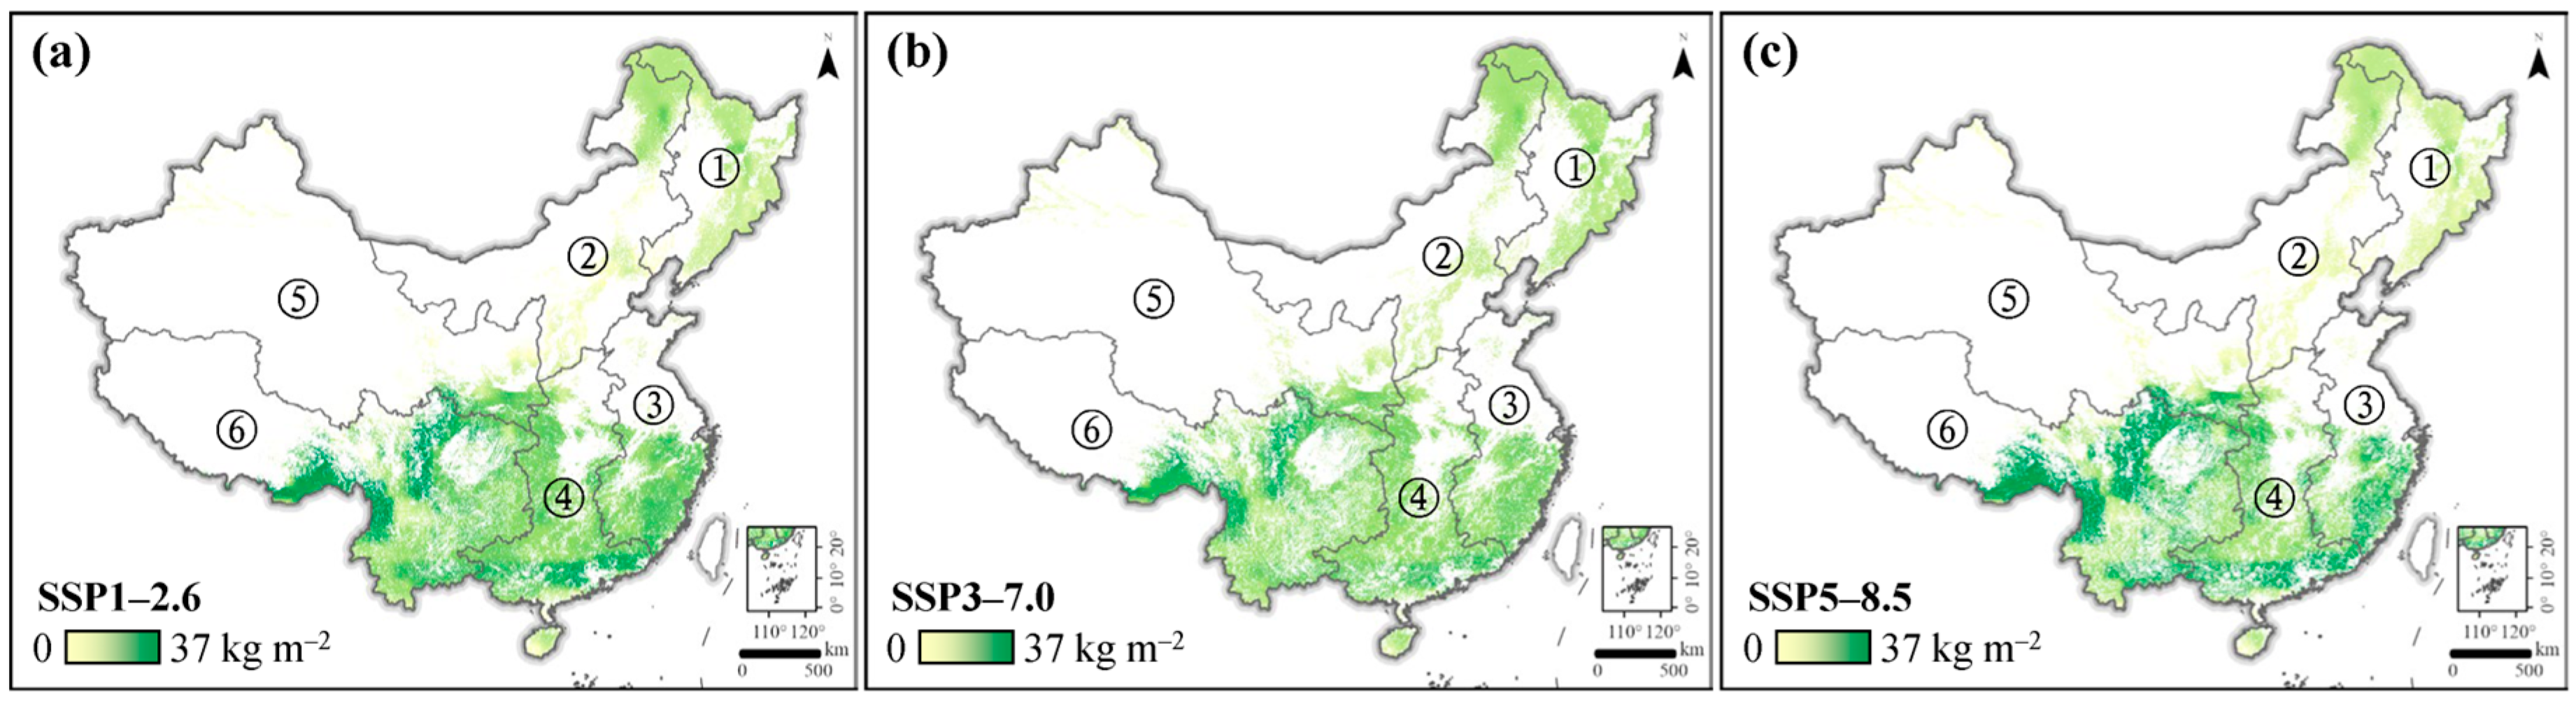
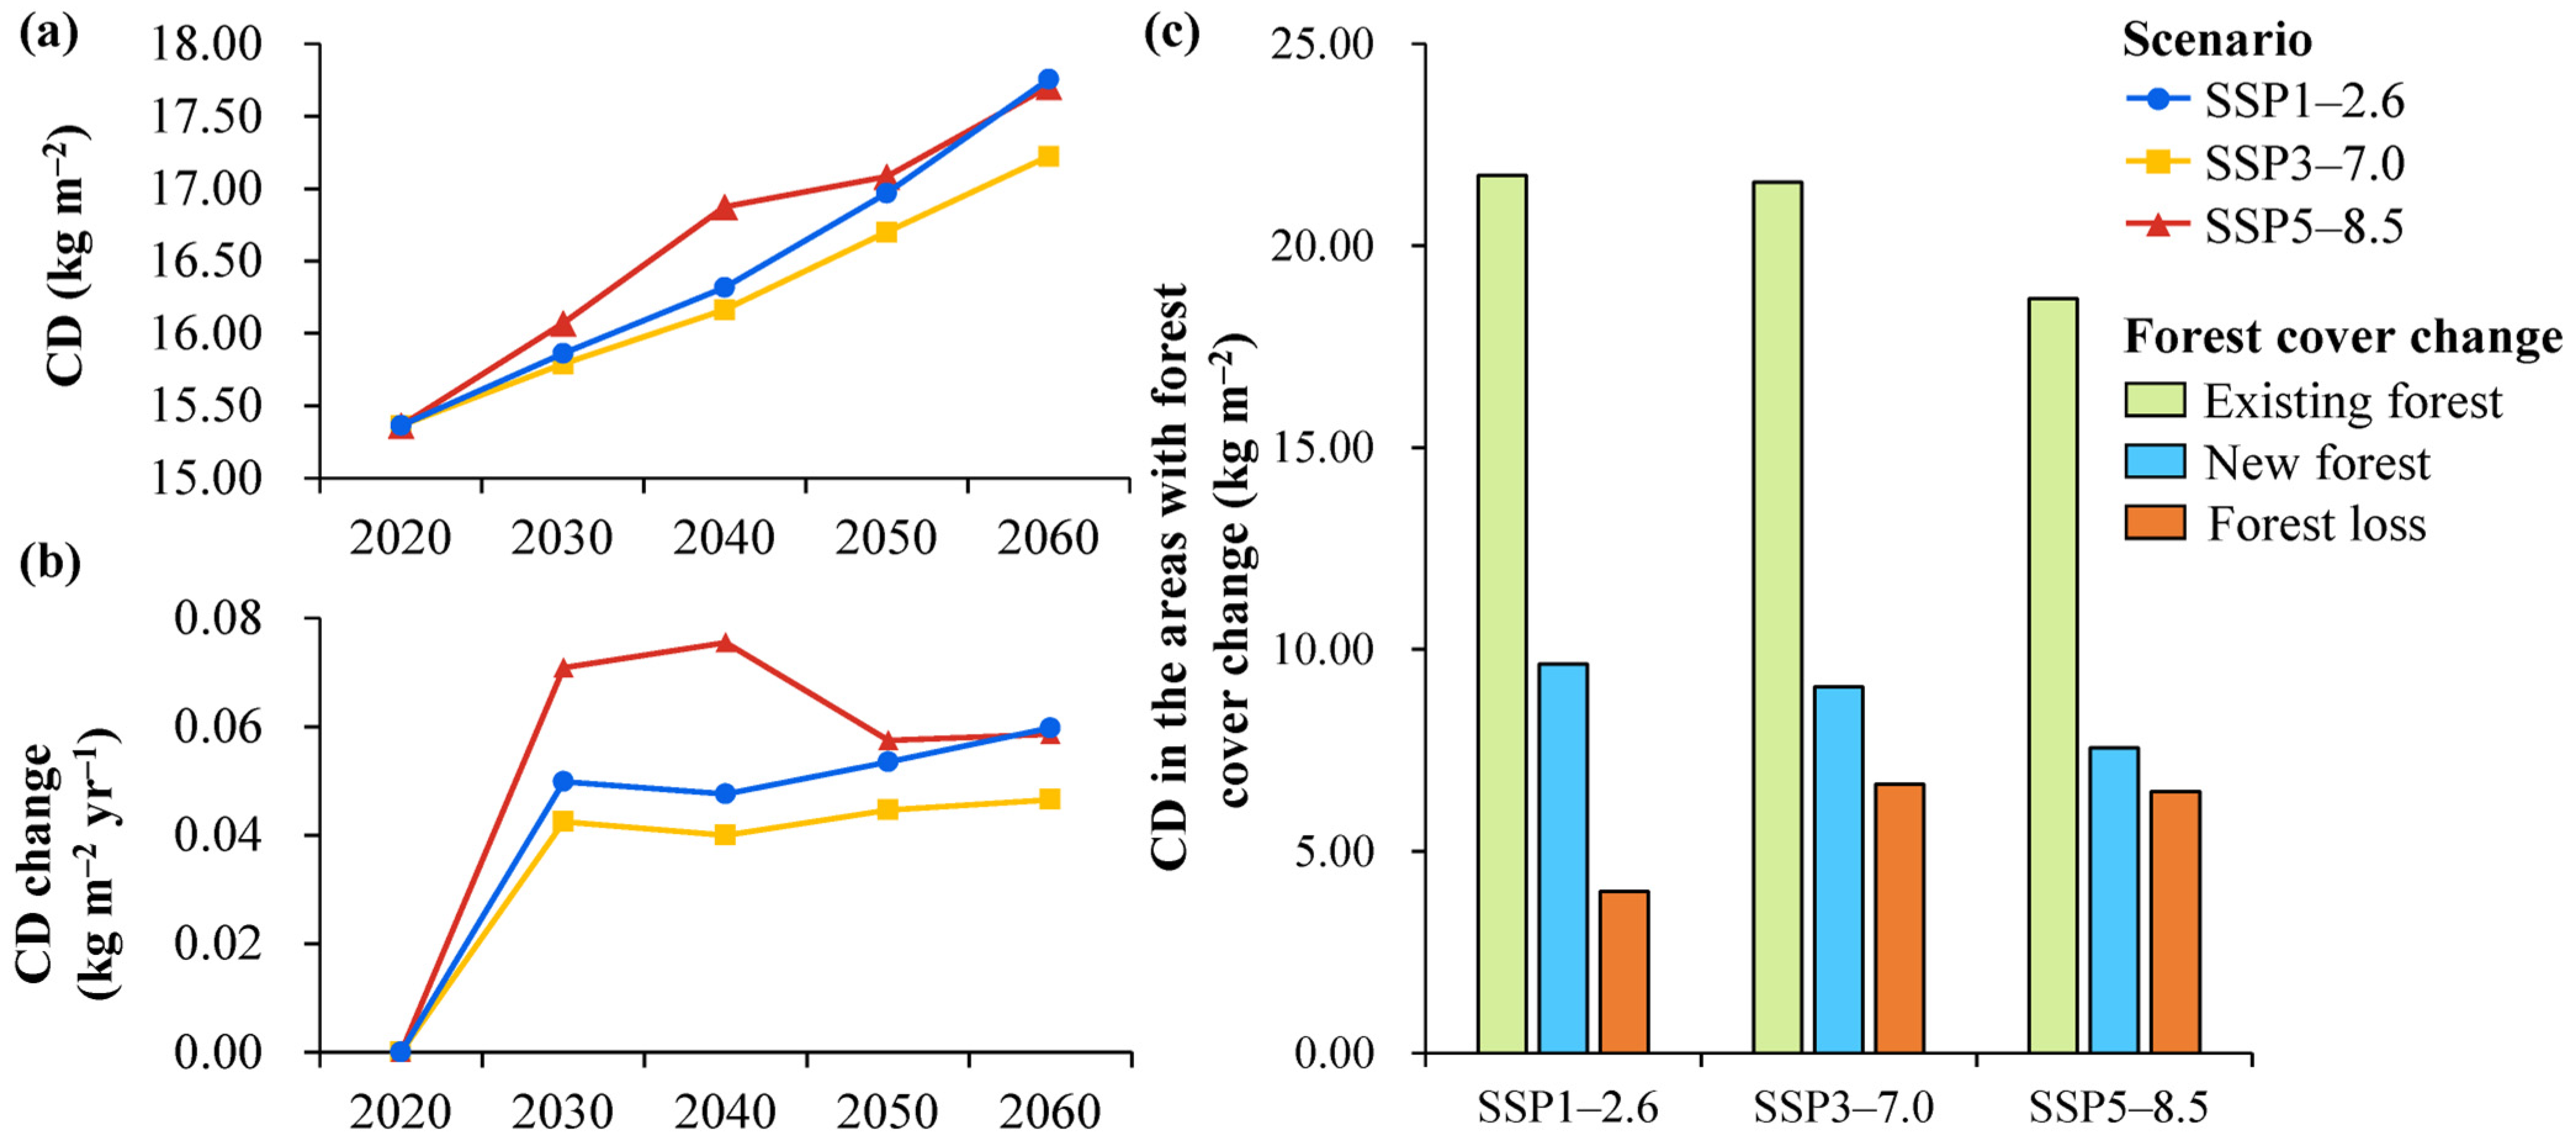
3.2. Forest Carbon Density Across Scenarios

The forest carbon density increased across all scenarios, with the greatest rise under SSP1-2.6 and the smallest under SSP3-7.0 (Figure 3). From 2020 to 2060, China’s forest carbon density was projected to grow from 15.36 to 17.45 ± 0.26 kg m−2, reflecting an average increase of 14.24%. By 2060, the forest carbon density reached 17.75, 17.19, and 17.71 kg m−2 with high, limited, and non-mitigation efforts under SSP1-2.6, SSP3-7.0, and SSP5-8.5. The high-mitigation effort under SSP1-2.6, associated with a radiative forcing threshold of 2.6 W m−2, led to the highest forest carbon density (17.75 kg m−2), while the limited mitigation under SSP3-7.0, with a radiative forcing threshold of 7.0 W m−2, resulted in the lowest forest carbon density (17.19 kg m−2).
The soil carbon pool contributed the most to the overall carbon density, being 10.76 times higher than litter and 2.33 times greater than vegetation. Soil carbon was projected to account for 65.69% of the total carbon density. Increases in the soil carbon density aligned with overall trends, reaching the highest increasing rate under SSP1-2.6 (+14.27%), followed by SSP5-8.5 (+10.34%), and SSP3-7.0 (+8.79%).
Spatially, the carbon density was highest in southwestern China and lowest in the northwest, at 3.21 and 0.48 times the national average, respectively (Figure A2). As climate mitigation strengthened, the carbon density rose in these regions. Under SSP1-2.6, the increase in carbon density in the southwest was projected at 20.89%, and that in the northwest was at 35.27%. SSP3-7.0 showed increases of 19.11% and 12.09%, while SSP5-8.5 exhibited the smallest gains at 17.95% and 4.30%.
The carbon density in existing forests was 2.36 times higher than in new forests, with soil, litter, and vegetation pools measuring 2.33, 2.43, and 2.42 times greater, respectively. Mitigation efforts promoted the carbon density in existing forests, particularly in soil. The highest values were projected under SSP1-2.6, with existing forests reaching 21.75 kg m−2 and soil carbon increasing by 39.49%. This was followed by SSP3-7.0 (21.58 kg m−2, +35.88%) and SSP5-8.5 (18.70 kg m−2, +19.29%). New forests, by comparison, reached only 42.39% of the carbon density in existing forests, with respective densities at 44.34%, 42.07%, and 40.49% of existing forests under SSP1-2.6, SSP3-7.0, and SSP5-8.5.

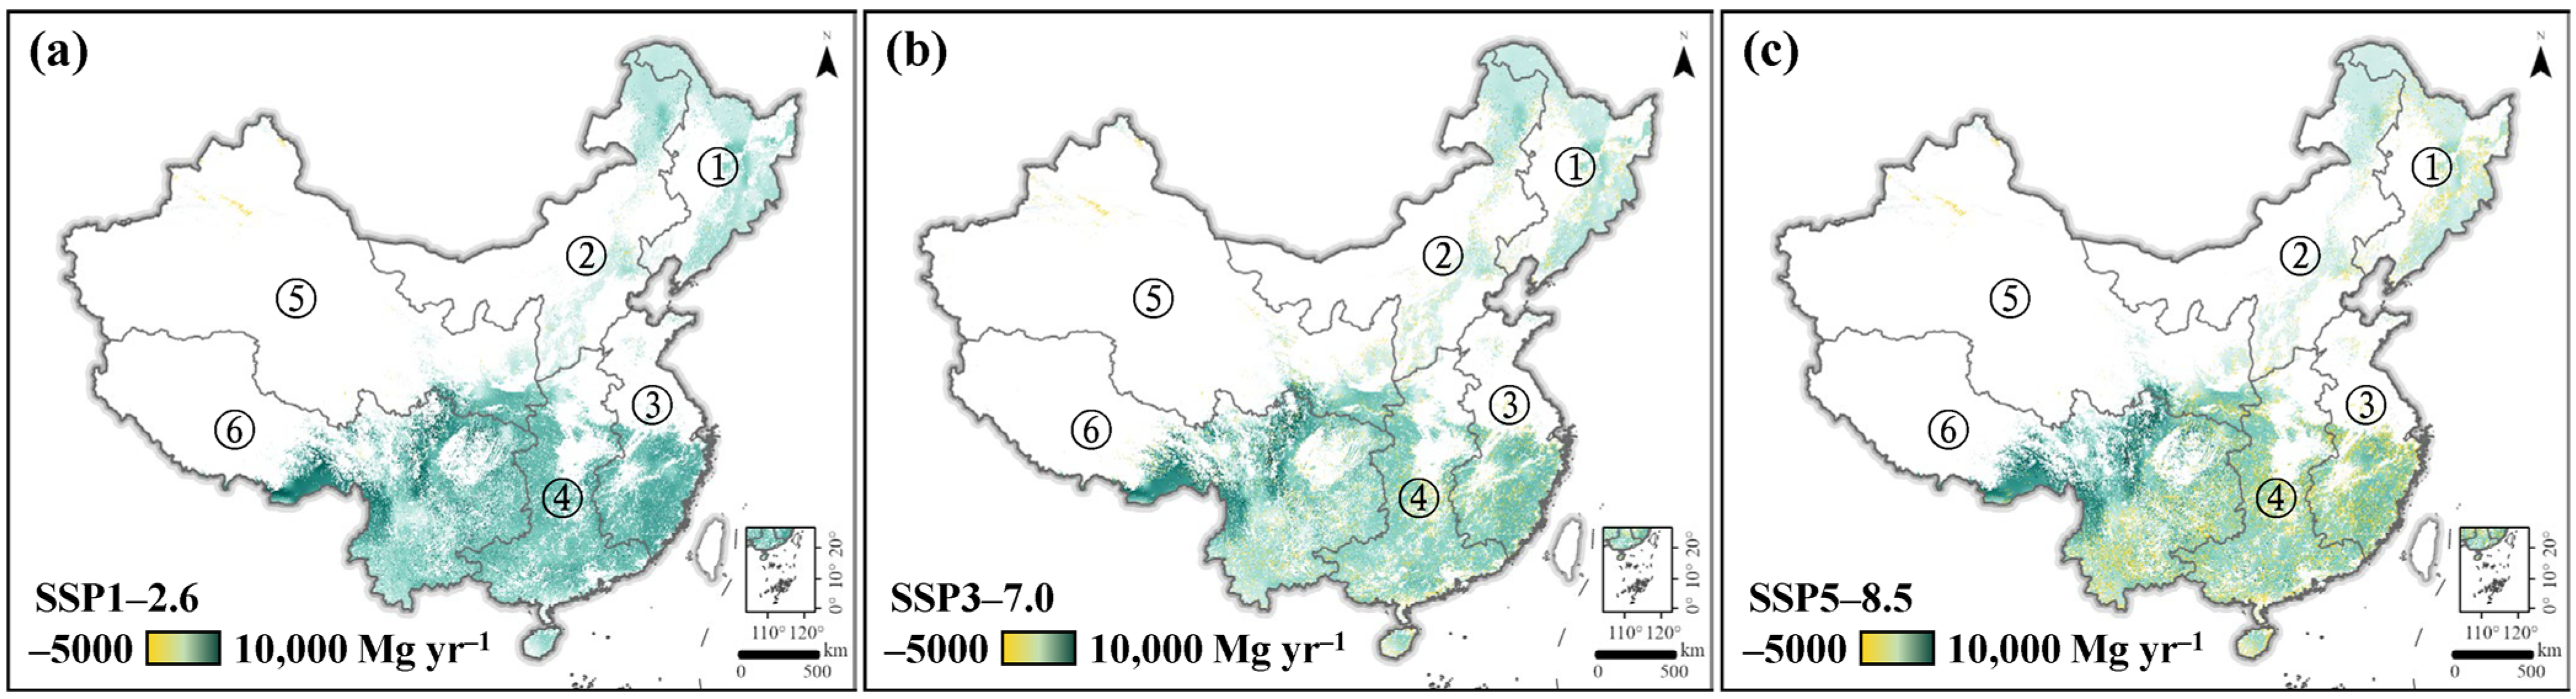
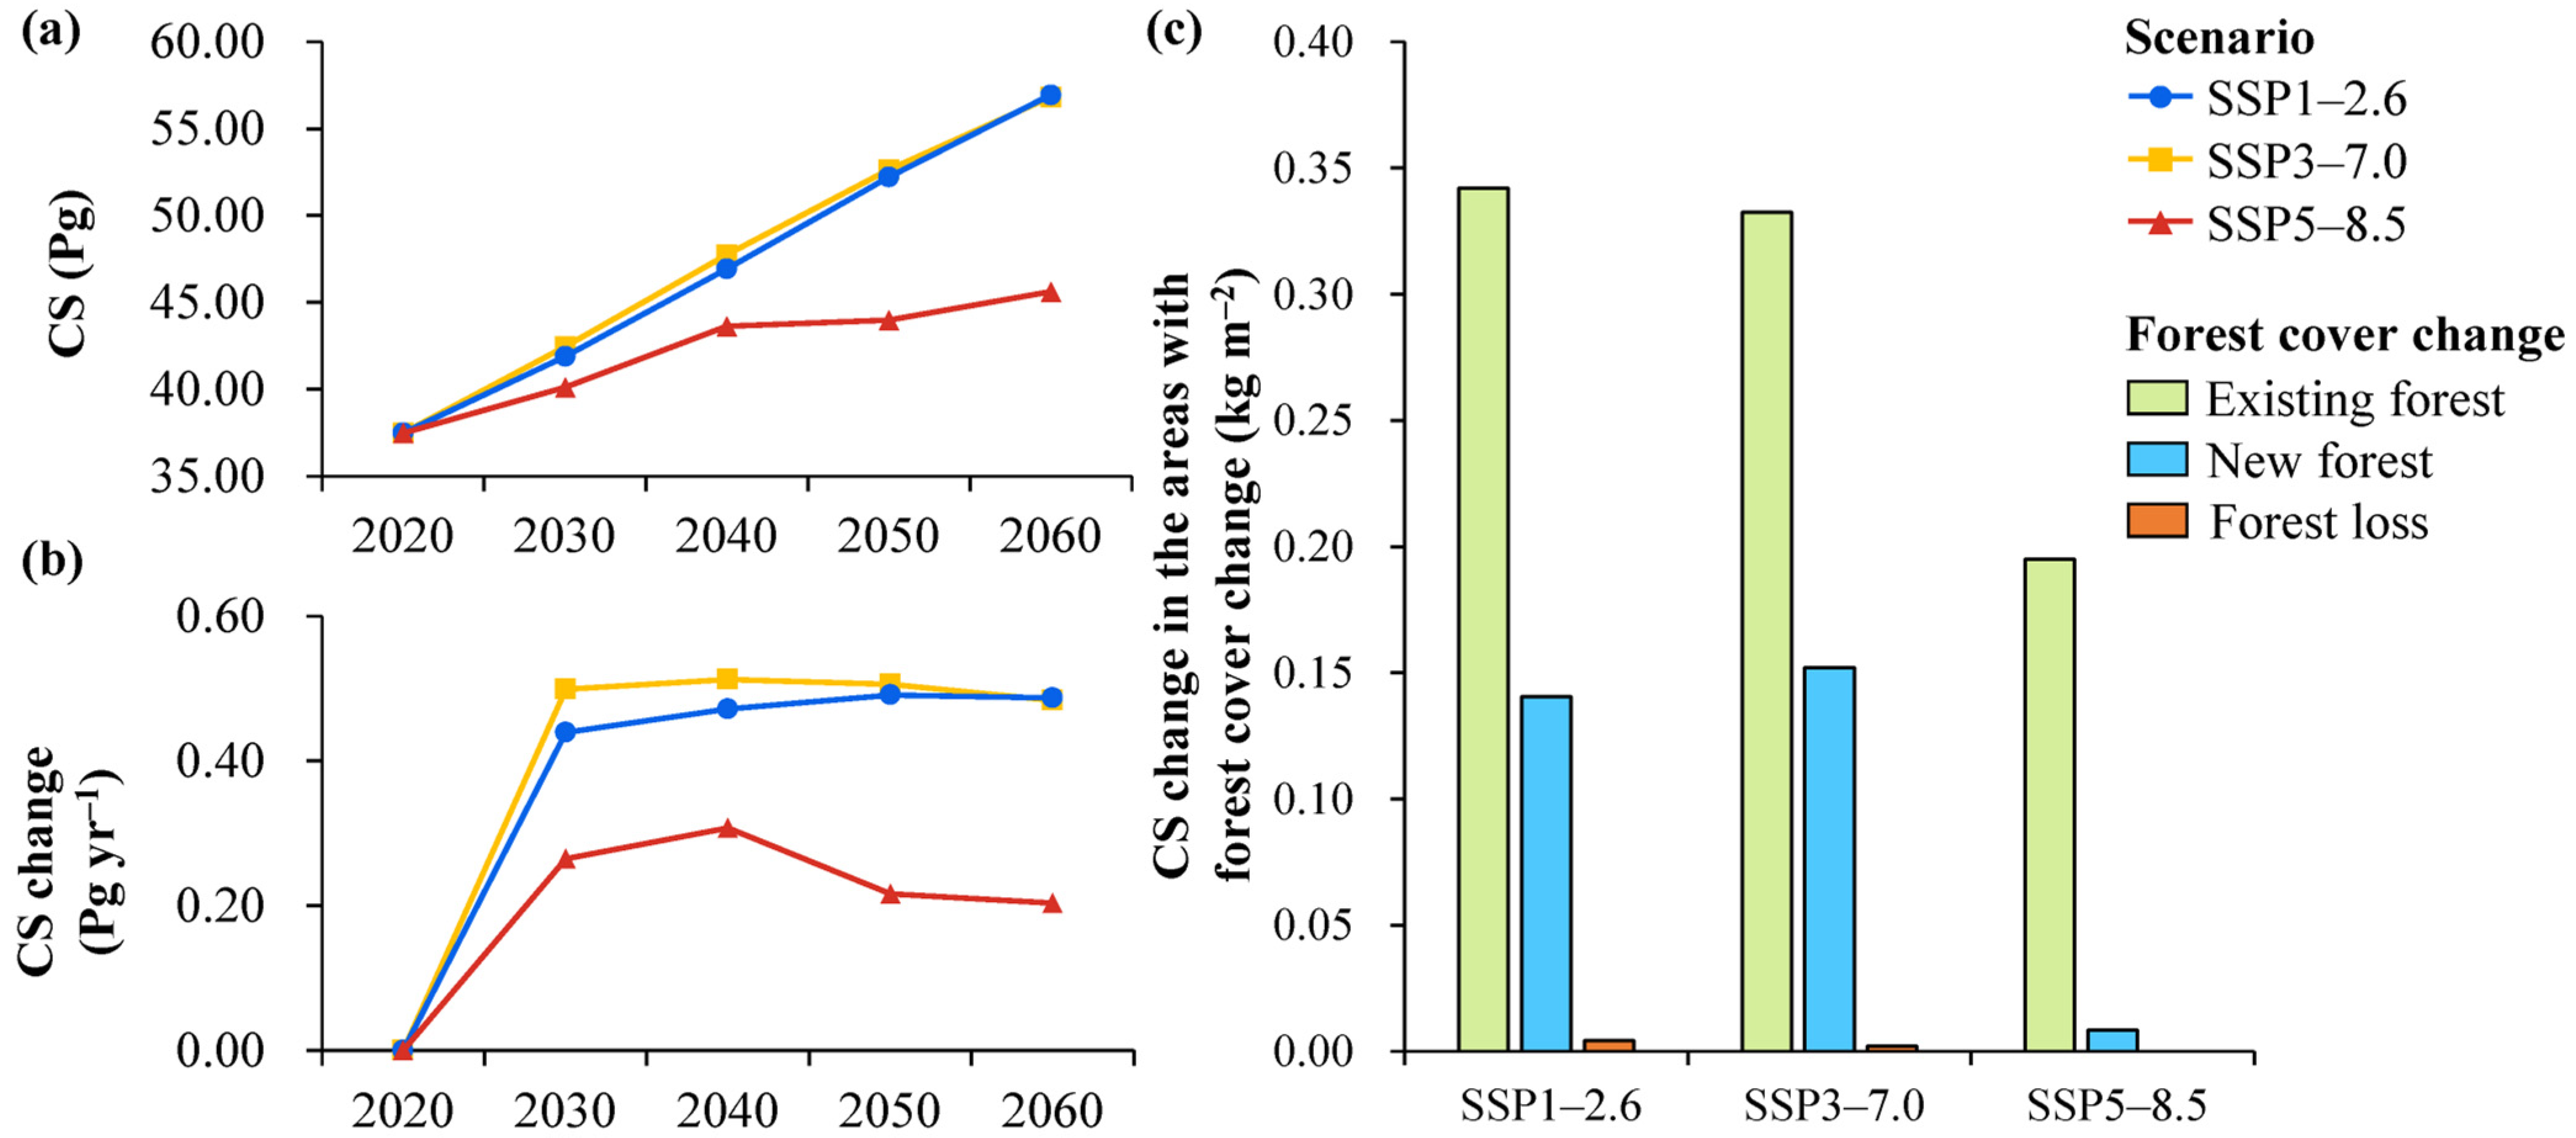
3.3. Forest Carbon Sequestration Across Scenarios

Forest carbon sequestration increased across all scenarios, with the highest levels observed in SSP1-2.6 and the lowest in SSP5-8.5 (Figure 4). From 2020 to 2060, the total sequestration in China’s forests rose from 37.48 to 51.29 ± 5.67 Pg. The annual sequestration rate was 0.35 ± 0.15 Pg yr−1, peaking between 2030 and 2040. By 2060, forest carbon sequestration reached 56.95, 56.84, and 45.62 Pg, with respective annual rates of 0.49, 0.48, and 0.20 Pg yr−1, with high, limited, and non-mitigation efforts under SSP1-2.6, SSP3-7.0, and SSP5-8.5. The high-mitigation effort under SSP1-2.6, associated with a radiative forcing threshold of 2.6 W m−2, resulted in the highest forest carbon sequestration (56.95 Pg), while the non-mitigation effort under SSP5-8.5, with a radiative forcing threshold of 8.5 W m−2, led to the lowest forest carbon sequestration (45.62 Pg).
The soil carbon pool contributed the most to the overall sequestration, being 9.68 times greater than litter and 1.92 times greater than vegetation. Soil carbon accounted for 61.39% of total annual sequestration rates. The annual sequestration rates in the soil carbon pool followed the overall trends, with the highest rate in SSP1-2.6 (0.32 Pg yr−1), followed by SSP3-7.0 (0.30 Pg yr−1), and the lowest in SSP5-8.5 (0.10 Pg yr−1).
Spatially, annual sequestration was the highest in southwestern China (46.52% of the total) and lowest in the northern (7.55%) (Figure A3). As mitigation strengthened, annual sequestration rates increased in these regions, with SSP1-2.6 reaching the highest rates (0.19 Pg yr−1 in the southwest and 0.04 Pg yr−1 in the northern), followed by SSP3-7.0 (0.19 and 0.04 Pg yr−1), and the lowest in SSP5-8.5 (0.16 and 0.01 Pg yr−1). The annual sequestration rates in the soil carbon pool also showed the same increasing trend in these regions, with SSP1-2.6 reaching the highest rates (0.12 Pg yr−1 in the southwest and 0.03 Pg yr−1 in the northern), followed by SSP3-7.0 (0.11 and 0.02 Pg yr−1), and the lowest in SSP5-8.5 (0.03 and 0.01 Pg yr−1).
The annual sequestration in existing forests was 2.89 times greater than in new forests, with soil, litter, and vegetation pools measuring 2.59, 3.08, and 3.71 times larger, respectively. Existing forests and their soil carbon pools accounted for 73.88% and 44.00% of the total annual sequestration, with increases corresponding to the strength of climate change mitigation. Under SSP1-2.6, existing forests sequestered the most (0.34 Pg yr−1), with 64.17% from soil carbon; SSP3-7.0 followed (0.33 Pg yr−1 and 59.87%); while SSP5-8.5 recorded the lowest (0.20 Pg yr−1 and 50.91%). In contrast, new forests achieved only 34.61% of the annual sequestration of existing forests, with respective sequestrations at 28.88%, 31.23%, and 4.13% of existing forest levels under SSP1-2.6, SSP3-7.0, and SSP5-8.5.

4. Discussion

4.1. Changes in China’s Forest Carbon Sequestration Under Climate Mitigation Policies

Climate mitigation policies had a significant impact on China’s forest carbon sequestration. We developed a coupled modeling framework, which integrated the PLUS model for forest cover change simulations and the LPJmL model for vegetation physiological responses for the carbon cycle, allowing for a detailed assessment of forest carbon sequestration under varying policy scenarios. The assessment revealed that stronger climate mitigation policies led to higher forest carbon sequestration, with annual carbon sequestration rates of 0.49, 0.48, and 0.20 Pg yr−1 with high, limited, and non-mitigation efforts under SSP1-2.6, SSP3-7.0, and SSP5-8.5, respectively, corresponding to 16.80%, 16.45%, and 7.02% of China’s 2020 fossil fuel CO2 emissions. Under SSP1-2.6, high-mitigation efforts were projected to result in a radiative forcing threshold of 2.6 W m−2, the highest carbon density (17.75 kg m−2), and maximum sequestration (56.95 Pg). Increasing the carbon density proved to be more effective than merely expanding forest areas for enhancing carbon sequestration. Existing forests showed carbon density and annual sequestration rates 2.36 times and 2.89 times higher than those of new forests, respectively. Under SSP1-2.6, the existing forest carbon density increased by 41.46%, particularly in soil carbon pools (+39.94%), making this scenario optimal for increasing forest carbon sequestration.
Model validation showed the PLUS model achieved an accuracy of 0.82, with a Kappa coefficient of 0.76, and an FoM coefficient of 0.12, when comparing simulated forest cover changes (2015–2020) with actual data [24,41]. The k-fold cross-validation revealed that the LPJmL model could explain over 81% of the forest above-ground biomass without bias (intercept = 0.79 kg m−2 of vegetation carbon density, slope = 2.19) [13,42]. The simulated forest carbon sequestration values (2020–2060) were consistent with national forest inventory statistics and other studies [27,42]. The average annual sequestration rate in the vegetation carbon pool was 0.13 Pg yr−1, close to the 0.14 Pg yr−1 reported in national forest inventory statistics from 2014 to 2018, but lower than the 0.18 Pg yr−1 simulated by the related studies under the same scenarios from 2010 to 2060 [27]. The soil carbon pool showed an average annual sequestration rate of 0.24 Pg yr−1, which was lower than the 0.38 Pg yr−1 reported in field observations from 2001 to 2010 [43]. Overall, the accuracy of forest cover simulations met the required standards [24], and the modeled carbon sequestration aligned with the observed and predicted data [27,42,43], validating the robustness of the simulations.
The findings indicated that stronger climate mitigation efforts corresponded with increased forest carbon sequestration. From 2020 to 2060, sequestration under SSP1-2.6, SSP3-7.0, and SSP5-8.5 reached 56.95 Pg, 56.84 Pg, and 45.62 Pg, with annual rates of 0.49, 0.48, and 0.20 Pg yr−1, respectively. The SSP1-2.6 scenario showed the highest increase in carbon density (+15.57%), leading to the greatest overall carbon sequestration. SSP3-7.0 recorded the largest forest cover (34.74%), with the largest areas of newly established forests (1.17 million km2) and minimal forest loss (0.01 million km2). However, only 87.71% of existing forests from 2020 remained by 2060, with 95.90% of the loss driven by agricultural expansion [26,35]. New forests reached just 42.07% of the carbon density in existing forests due to the limited climate mitigation, heavy reliance on fossil fuels, and high land-use pressures [2,35,37]. The soil carbon density saw the smallest increase (+8.79%) in this scenario, leading to the lowest overall carbon density (17.19 kg m−2), and the total sequestration remained below SSP1-2.6 levels. The SSP5-8.5 scenario showed minimal gains in the new forest area (0.30 million km2) and significant losses in existing forests (2.34 million km2), resulting in the lowest levels of forest cover (27.12%) and sequestration.
Expanding forest cover and increasing carbon density were key strategies for enhancing carbon sequestration. This study underscored that increasing carbon density was more effective in China. Existing forests hold a greater sequestration potential, with their carbon densities and annual sequestration rates 2.36 and 2.89 times higher than those of newly established forests. Strengthened mitigation efforts led to higher carbon densities of existing forests and newly established forests. Carbon densities of existing forests reached 21.75, 21.58, and 18.70 kg m−2, while those of newly established forests reached 6.53, 6.08, and 4.84 kg m−2 under SSP1-2.6, SSP3-7.0, and SSP5-8.5. The annual sequestration rates of existing forests showed similar patterns under the same scenarios, reaching 0.32, 0.33, and 0.20 Pg yr−1 under SSP1-2.6, SSP3-7.0, and SSP5-8.5. These results aligned with the trends reported by previous studies, which found that the carbon sequestration contribution from existing forests was 14.38 times that of newly established forests under similar scenarios from 2010 to 2060 [27]. Mature forests accumulate more organic matter, litter, and biomass, making them more resilient and stable to climate change [46]. Existing forests accounted for 73.88% of the total forest carbon sequestration. With stronger mitigation measures, the carbon density and annual sequestration rates of existing forests continued to rise, improving the overall forest carbon sequestration [46].
The soil carbon pool was the primary pool for forest carbon sequestration, accounting for 61.54% of the total annual sequestration rates. Strengthened mitigation efforts resulted in higher soil carbon sequestration, with annual sequestration reaching 0.32, 0.30, and 0.10 Pg yr−1 under SSP1-2.6, SSP3-7.0, and SSP5-8.5. Spatially, the highest sequestration rates were observed in southwestern China, which accounted for 46.52% of total sequestration. This region, characterized by purplish and dark felty soils, displayed considerable potential for soil carbon accumulation. Under SSP1-2.6 with high-mitigation efforts, the soil carbon sequestration in southwestern China reached 0.12 Pg yr−1, compared to 0.11 Pg yr−1 under SSP3-7.0 with moderate mitigation and 0.03 Pg yr−1 under SSP5-8.5 with no mitigation. In contrast, northern China, where cinnamon soils dominate, exhibited lower soil sequestration rates, reaching 0.03, 0.02, and 0.01 Pg yr−1 under SSP1-2.6, SSP3-7.0, and SSP5-8.5, respectively. Variations in soil carbon sequestration were primarily driven by forest type and soil disturbance [47]. Broadleaf forests in southwestern China showed a higher capacity for carbon sequestration compared to mixed forests in northern China [3]. These broadleaf forests allocate more biomass to root systems, facilitating greater carbon fixation in the soil, and transfer more easily decomposable litter, which further accelerates carbon sequestration [47]. Furthermore, broadleaf forests in southwestern China are located within two important forest reserves—the Southeast Tibetan Plateau Marginal Forest Ecosystem and the Sichuan–Yunnan Forest and Biodiversity National Key Functional Area. These forests benefit from strong protection efforts and are subject to fewer disturbances, enhancing their carbon sequestration potential [28].
To effectively protect and enhance China’s forest carbon sequestration, the SSP1-2.6 scenario should be prioritized. Policies should promote green development to mitigate forest resource overexploitation and reduce the reliance on fossil fuels [2,5,6]. Transitioning to low-carbon energy and industry should be promoted to maintain the stability of the forest cover and carbon sequestration [5,6,48]. Land-use regulations should focus on optimizing the carbon sequestration potential of existing forests and their soil carbon pools [26,35]. Priority should be given to protecting high-carbon-density regions, such as southwestern China, where both the carbon density and sequestration rates were projected to be high. Efforts to prevent deforestation and slow forest loss are also critical [35]. Moreover, integrated land management practices, including sustainable agriculture and advanced technologies, should be adopted to minimize the impact of cropland expansion on valuable carbon-rich forests [26,49]. Forest management should also carefully plan practices such as intermediate cutting, deforestation, and fertilization, which may reduce soil carbon sequestration [50,51,52].

4.2. Uncertainties and Limitations

This study simulated changes in China’s forest cover and carbon storage using the LUH2, PLUS, and LPJmL models. Despite the diverse input data and model types, our results were consistent with statistical data, field observations, and predictions [27,41,42,43]. However, several limitations remain. The analysis relied on publicly available peer-reviewed datasets, such as the Chinese county-level statistical yearbooks and the land cover dataset with a resolution of 30 m [41], both of which are commonly used in ecosystem assessments and carbon storage simulations [3,28]. Incorporating national land surveys and forest inventory data could further enhance model accuracy. Additionally, uncertainties in climate change and its predictions could be reduced by employing a wider range of climate models in the future [27].

5. Conclusions

This study developed a coupled modeling framework for evaluating the forest cover and carbon stock under multiple climate change mitigation pathways. We modeled forest cover changes using the LUH2 model and the PLUS model and assessed carbon dynamics from 2020 to 2060 under three mitigation scenarios—SSP1-2.6, SSP3-7.0, and SSP5-8.5—using the LPJmL model.
The results indicated a positive correlation between climate mitigation efforts and forest carbon sequestration. From 2020 to 2060, the average annual carbon sequestration under SSP1-2.6, SSP3-7.0, and SSP5-8.5 reached 0.49, 0.48, and 0.20 Pg yr−1, respectively, equivalent to 16.80%, 16.45%, and 7.02% of China’s 2020 fossil fuel CO2 emissions. Among the scenarios, SSP1-2.6 showed the largest increase in carbon density (+15.57%), achieving the highest carbon density (17.75 kg m−2) and sequestration (56.95 Pg). The most significant increase in carbon density occurred in existing forests (+41.56%) under this scenario, driven by the substantial growth in soil carbon pools (+39.94%). Although SSP3-7.0 resulted in the highest forest cover (34.74%), it had the smallest increase in carbon density (+11.91%) with moderate sequestration (56.84 Pg). SSP5-8.5 showed the smallest forest cover (27.12%) and the lowest carbon sequestration (45.62 Pg). Our findings suggested that increasing the carbon density could be more effective than expanding the forest area for enhancing carbon sequestration. Existing forests demonstrated a greater carbon sequestration potential than newly established forests, with a 2.36-times-higher carbon density and a 2.89-times-higher annual sequestration rates. Under SSP1-2.6, the carbon density of existing forests increased by 41.56%, particularly in soil carbon pools, which rose by 39.94%, making it the most favorable scenario for enhancing carbon sequestration.
To protect and enhance forest carbon stocks effectively, policies aligned with the SSP1-2.6 scenario should be prioritized. These policies should focus on reducing industrial emissions and transitioning to cleaner energy sources. In forest management, efforts should maximize the carbon sequestration potential of existing forests, particularly in regions with significant increases in carbon density and high annual sequestration rates, such as southwestern China. Additionally, the careful planning of forestry practices, including high-intensity logging and fertilization, is essential in order to avoid reducing soil carbon stocks.

Author Contributions

Conceptualization, D.L. and M.Q.; investigation, M.Q. and Y.Z.; writing—original draft preparation, M.Q.; writing—review and editing, D.L.; funding acquisition, D.L. All authors have read and agreed to the published version of the manuscript.

Funding

This research was funded by the National Natural Science Foundation of China, grant number 42171414, and the Fundamental Research Funds for the Central Universities, grant number 2042024kf0029.

Data Availability Statement

The data are available upon request due to privacy concerns: the data presented in this study are available upon request from the corresponding author.

Conflicts of Interest

The authors declare no conflicts of interest.

Appendix A

Table A1. Harmonized climate, socioeconomic, and land-use scenarios for intercomparing forest carbon sequestration proposed by IPBES.
Scenarios SSP1-2.6SSP3-7.0SSP5-8.5
(a) RCPsRCP2.6RCP7.0RCP8.5
PathwayPeak and declineStabilize without overshootRise
Climate policiesHighest mitigationLimited mitigationNo mitigation
Temperature rise ~2 °C by 2100~4 °C by 2100~5 °C by 2100
Radiative forcing~2.6 W m−2 in 2100~7.0 W m−2 in 2100~8.5 W m−2 in 2100
CO2 concentration~490 ppm in 2100~850 ppm in 2100~1370 ppm in 2100
(b) SSPsSSP1SSP3SSP5
PathwaySustainabilityRegional rivalryFossil-fueled
Fossil fuels relianceDeclineHeavyHeavy
Energy intensityLowIntermediateHigh
GlobalizationModerateConstrainedHigh
Technology development RapidSlowRapid
Population growthRelatively slowRelatively rapidRelatively slow
Economic growthMedium to highSlowHigh
Agricultural productionImproved with practice diffusionLow with restricted trade and technologyHighly managed and resource-intensive
(c) LUH2IMAGEAIMREMIND-MAGPIE
Land-use regulationStrong to avoid environmental trade-offsLimited with continued deforestationMedium with slowing deforestation
Land-use pressureModerateHighMedium
The scenarios integrated (a) representative concentration pathways (RCPs), (b) shared socioeconomic pathways (SSPs), and (c) land-use harmonization (LUH2).
Table A2. Environmental variables and potential impacts on forest cover change.
ComponentTypeVariablePotential Impact
Macroclimatic conditionsClimateMean temperatureOptimal temperature enhances vegetation activity. Cold conditions at high elevations promote growth through land abandonment, while extreme cold hinder forest succession due to soil saturation and physiological constraints [15,53].
Annual precipitationHigh annual precipitation shows similar impacts of cold temperatures [54].
Precipitation of driest quarterLow precipitation during the driest four months raises wildfire risks and limits water availability, leading to stomatal closure and limited CO2 uptake [53,55].
Precipitation seasonalityHigh variation in monthly precipitation enhances biomass accumulation [54], but extreme fluctuations increase seasonal droughts and wildfire risks [19].
Regional environmentsSoil Soil pHSoil pH impacts plant adaptation, microbial activity, and nutrient availability [56].
Sand textureHigh sand content indicates nutrient-poor soils that accelerate nutrient leaching and limit biomass accumulation [56].
Cation Exchange Capacity (CEC)High CEC indicates fertile soils with a high capacity to hold potassium, calcium, magnesium, and other positively charged elements, supporting primary productivity recovery of forests [54].
Bulk densityHigh bulk density indicates soil compaction, which restricts root growth, gas exchange, and seed germination [56].
TopographyElevationHigh elevation accelerates forest growth by promoting land abandonment and limiting economically viable land [17,56].
SlopeSteeper slopes facilitate growth but are susceptible to erosion [17,56].
AspectSoutheast-facing slopes in China enhance moisture availability and promote restoration [17].
PopulationRural population densityHigh rural population density drives deforestation through land clearing for agriculture, while urbanization-induced population decline may foster agricultural abandonment and promote recovery [57].
Urban population densityThe effects of urban population density are mixed; urban expansion may encroach on forests, but rural abandonment can enhance recovery potential [57].
Foreign population densityHigh foreign population density may improve environmental awareness and forest protection efforts [56].
EconomyFixed-asset investmentHigh fixed-asset investment hinders forest growth by increasing land prices and opportunity costs for forest restoration [58].
GDPGDP reveals an inverted U-shaped relationship with forest recovery, correlating with initial deforestation [55].
Forestry output valueHigh forestry output typically leads to greater deforestation [17,45].
Agricultural output valueHigh agricultural output limits forest growth due to intensive disturbance and high costs for forest restoration [17,56].
Pastoral output valueHigh pastoral output shows similar impacts as agriculture [17,56].
Industrial output valueHigh industrial output may create non-agricultural jobs that support forest growth but can also result in deforestation as forestry rises [55].
Landscape patternsLand useCropland proportionHigh cropland proportion in the 1 km buffer (hereafter, proportion) can either provide space for forest growth or increase deforestation risk [15,56].
Grassland proportionHigh grassland proportion presents uncertain effects as that of cropland [56].
Proximity to waterCloser proximity promotes forest growth due to water availability and riparian vegetation protection. But navigable rivers can attract habitation, increasing deforestation risks [56].
Proximity to imperviousCloser proximity to impervious hinders recovery due to human encroachment [59].
Forest stateForest proportionHigh proportion of forest cover supports forest growth by providing seed sources and facilitating species dispersal [17].
Loss proportionHigh proportion of forest loss indicates significant pressures on forests [19].
Table A3. Correspondence of land-use types between the CLCD data and the LUH2 model.
CLCD ClassLUH2 State
ImperviousUrban land (urban)
ForestForested primary land (primf), potentially forested secondary land (secdf)
CroplandC3 annual crops (c3ann), C4 annual crops (c4ann), C3 perennial crops (c3per), C4 perennial crops (c4per), C3 nitrogen-fixing crops (c3nfx)
Shrub, grasslandNon-forested primary land (primn), potentially non-forested secondary land (secdn), managed pasture (pastr), rangeland (range)
Water, Show/Ice, Wetland, BarrenAreas excluding primf, primn, secdf, secdn, pastr, range, c3ann, c4ann, c3per, c4per, c3nfx
Figure A1. Spatial patterns of forest cover change in China from 2020 to 2060 under different scenarios: (a) SSP1-2.6; (b) SSP3-7.0; and (c) SSP5-8.5 (① = northeastern China, ② = northern China, ③ = eastern China, ④ = southern China, ⑤ = northwestern China, and ⑥ = southwestern China).
Land 14 00571 g0a1
Figure A2. Forest carbon density in 2060 under different scenarios: (a) SSP1-2.6; (b) SSP3-7.0; and (c) SSP5-8.5 (① = northeastern China, ② = northern China, ③ = eastern China, ④ = southern China, ⑤ = northwestern China, and ⑥ = southwestern China).
Land 14 00571 g0a2
Figure A3. Annual sequestration rate of China’s forest from 2020 to 2060 under different scenarios: (a) SSP1-2.6; (b) SSP3-7.0; and (c) SSP5-8.5 (① = northeastern China, ② = northern China, ③ = eastern China, ④ = southern China, ⑤ = northwestern China, and ⑥ = southwestern China).
Land 14 00571 g0a3

References

  1. Griscom, B.W.; Adams, J.; Ellis, P.W.; Houghton, R.A.; Lomax, G.; Miteva, D.A.; Schlesinger, W.H.; Shoch, D.; Siikamäki, J.V.; Smith, P.; et al. Natural climate solutions. Proc. Natl. Acad. Sci. USA 2017, 114, 11645–11650. [Google Scholar] [CrossRef] [PubMed]
  2. Anderegg, W.R.L.; Trugman, A.T.; Badgley, G.; Anderson, C.M.; Bartuska, A.; Ciais, P.; Cullenward, D.; Field, C.B.; Freeman, J.; Goetz, S.J.; et al. Climate-driven risks to the climate mitigation potential of forests. Science 2020, 368, eaaz7005. [Google Scholar] [CrossRef]
  3. Xu, H.; Yue, C.; Zhang, Y.; Liu, D.; Piao, S.L. Forestation at the right time with the right species can generate persistent carbon benefits in China. Proc. Natl. Acad. Sci. USA 2023, 120, e2304988120. [Google Scholar] [CrossRef]
  4. Bonan, G.B. Forests and climate change: Forcings, feedbacks, and the climate benefits of forests. Science 2008, 320, 1444–1449. [Google Scholar] [CrossRef]
  5. He, J.K.; Li, Z.; Zhang, X.L.; Wang, H.L.; Dong, W.J.; Chang, S.Y.; Ou, X.M.; Guo, S.Y.; Tian, Z.Y.; Gu, A.L.; et al. Comprehensive report on China’s Long-Term Low-Carbon Development Strategies and Pathways. Chin. J. Popul. Resour. Environ. 2020, 18, 263–295. [Google Scholar] [CrossRef]
  6. Qi, J.J.; Dauvergne, P. China and the global politics of nature-based solutions. Environ. Sci. Policy 2022, 137, 1–11. [Google Scholar] [CrossRef]
  7. Koch, A.; Kaplan, J.O. Tropical forest restoration under future climate change. Nat. Clim. Change 2022, 12, 279–283. [Google Scholar] [CrossRef]
  8. Seidl, R.; Thom, D.; Kautz, M.; Martin-Benito, D.; Peltoniemi, M.; Vacchiano, G.; Wild, J.; Ascoli, D.; Petr, M.; Honkaniemi, J.; et al. Forest disturbances under climate change. Nat. Clim. Change 2017, 7, 395–402. [Google Scholar] [CrossRef]
  9. Gai, Z.; Zheng, W.; Faye, B.; Wang, H.; Du, G. Temporal and Spatial Characteristics and Influencing Factors of Carbon Storage in Black Soil Area Under Topographic Gradient. Land 2025, 14, 16. [Google Scholar] [CrossRef]
  10. Nie, Q.; Man, W.; Li, Z.; Wu, X. From Policy to Practice: Assessing Carbon Storage in Fujian Province Using Patch-Generating Land Use Simulation and Integrated Valuation of Ecosystem Services and Tradeoffs Models. Land 2025, 14, 179. [Google Scholar] [CrossRef]
  11. Anderson, R.P.; Lew, D.; Peterson, A.T. Evaluating predictive models of species’ distributions: Criteria for selecting optimal models. Ecol. Modell. 2003, 162, 211–232. [Google Scholar] [CrossRef]
  12. Elith, J.; Leathwick, J.R. Species Distribution Models: Ecological Explanation and Prediction Across Space and Time. Annu. Rev. Ecol. Evol. Syst. 2009, 40, 677–697. [Google Scholar] [CrossRef]
  13. Bastin, J.F.; Finegold, Y.; Garcia, C.; Mollicone, D.; Rezende, M.; Routh, D.; Zohner, C.M.; Crowther, T.W. The global tree restoration potential. Science 2019, 365, 76–79. [Google Scholar] [CrossRef] [PubMed]
  14. Gauthier, S.; Bernier, P.; Kuuluvainen, T.; Shvidenko, A.Z.; Schepaschenko, D.G. Boreal forest health and global change. Science 2015, 349, 819–822. [Google Scholar] [CrossRef]
  15. Molin, P.G.; Chazdon, R.; Ferraz, S.F.D.; Brancalion, P.H.S. A landscape approach for cost-effective large-scale forest restoration. J. Appl. Ecol. 2018, 55, 2767–2778. [Google Scholar] [CrossRef]
  16. Strassburg, B.B.N.; Beyer, H.L.; Crouzeilles, R.; Iribarrem, A.; Barros, F.; de Siqueira, M.F.; Sánchez-Tapia, A.; Balmford, A.; Sansevero, J.B.B.; Brancalion, P.H.S.; et al. Strategic approaches to restoring ecosystems can triple conservation gains and halve costs. Nat. Ecol. Evol. 2019, 3, 62–70. [Google Scholar] [CrossRef] [PubMed]
  17. Crk, T.; Uriarte, M.; Corsi, F.; Flynn, D. Forest recovery in a tropical landscape: What is the relative importance of biophysical, socioeconomic, and landscape variables? Landscape Ecol. 2009, 24, 629–642. [Google Scholar] [CrossRef]
  18. Villa, P.M.; Martins, S.V.; Neto, S.N.D.; Rodrigues, A.C.; Martorano, L.G.; Monsanto, L.D.; Cancio, N.M.; Gastauer, M. Intensification of shifting cultivation reduces forest resilience in the northern Amazon. For. Ecol. Manag. 2018, 430, 312–320. [Google Scholar] [CrossRef]
  19. Curtis, P.G.; Slay, C.M.; Harris, N.L.; Tyukavina, A.; Hansen, M.C. Classifying drivers of global forest loss. Science 2018, 361, 1108–1111. [Google Scholar] [CrossRef]
  20. Schipper, A.M.; Hilbers, J.P.; Meijer, J.R.; Antão, L.H.; Benítez-López, A.; de Jonge, M.M.; Leemans, L.H.; Scheper, E.; Alkemade, R.; Doelman, J.C. Projecting terrestrial biodiversity intactness with GLOBIO 4. Glob. Change Biol. 2020, 26, 760–771. [Google Scholar] [CrossRef]
  21. Cutler, D.R.; Edwards, T.C.; Beard, K.H.; Cutler, A.; Hess, K.T. Random forests for classification in ecology. Ecology 2007, 88, 2783–2792. [Google Scholar] [CrossRef] [PubMed]
  22. Lu, N.; Tian, H.Q.; Fu, B.J.; Yu, H.Q.; Piao, S.L.; Chen, S.Y.; Li, Y.; Li, X.Y.; Wang, M.Y.; Li, Z.D.; et al. Biophysical and economic constraints on China’s natural climate solutions. Nat. Clim. Change 2022, 12, 847–853. [Google Scholar] [CrossRef]
  23. Chen, G.Z.; Li, X.; Liu, X.P.; Chen, Y.M.; Liang, X.; Leng, J.Y.; Xu, X.C.; Liao, W.L.; Qiu, Y.A.; Wu, Q.L.; et al. Global projections of future urban land expansion under shared socioeconomic pathways. Nat. Commun. 2020, 11, 537. [Google Scholar] [CrossRef]
  24. Liang, X.; Guan, Q.F.; Clarke, K.C.; Liu, S.S.; Wang, B.Y.; Yao, Y. Understanding the drivers of sustainable land expansion using a patch-generating land use simulation (PLUS) model: A case study in Wuhan, China. Comput. Environ. Urban Syst. 2021, 85, 101569. [Google Scholar] [CrossRef]
  25. Hurtt, G.C.; Chini, L.; Sahajpal, R.; Frolking, S.; Bodirsky, B.L.; Calvin, K.; Doelman, J.C.; Fisk, J.; Fujimori, S.; Goldewijk, K.K.; et al. Harmonization of global land use change and management for the period 850-2100 (LUH2) for CMIP6. Geosci. Model Dev. 2020, 13, 5425–5464. [Google Scholar] [CrossRef]
  26. Kim, H.; Rosa, I.M.D.; Alkemade, R.; Leadley, P.; Hurtt, G.; Popp, A.; van Vuuren, D.P.; Anthoni, P.; Arneth, A.; Baisero, D.; et al. A protocol for an intercomparison of biodiversity and ecosystem services models using harmonized land-use and climate scenarios. Geosci. Model Dev. 2018, 11, 4537–4562. [Google Scholar] [CrossRef]
  27. Cai, W.X.; He, N.P.; Li, M.X.; Xu, L.; Wang, L.Z.; Zhu, J.H.; Zeng, N.; Yan, P.; Si, G.X.; Zhang, X.Q.; et al. Carbon sequestration of Chinese forests from 2010 to 2060: Spatiotemporal dynamics and its regulatory strategies. Sci. Bull. 2022, 67, 836–843. [Google Scholar] [CrossRef] [PubMed]
  28. Ouyang, Z.; Zheng, H.; Xiao, Y.; Polasky, S.; Liu, J.; Xu, W.; Wang, Q.; Zhang, L.; Xiao, Y.; Rao, E.M.; et al. Improvements in ecosystem services from investments in natural capital. Science 2016, 352, 1455–1459. [Google Scholar] [CrossRef]
  29. Zhang, Y.; Cheng, C.; Wang, Z.; Hai, H.; Miao, L. Spatiotemporal Variation and Driving Factors of Carbon Sequestration Rate in Terrestrial Ecosystems of Ningxia, China. Land 2025, 14, 94. [Google Scholar] [CrossRef]
  30. Ostberg, S.; Mueller, C.; Heinke, J.; Schaphoff, S. LandInG 1.0: A toolbox to derive input datasets for terrestrial ecosystem modelling at variable resolutions from heterogeneous sources. Geosci. Model Dev. 2023, 16, 3375–3406. [Google Scholar] [CrossRef]
  31. Schaphoff, S.; von Bloh, W.; Rammig, A.; Thonicke, K.; Biemans, H.; Forkel, M.; Gerten, D.; Heinke, J.; Jägermeyr, J.; Knauer, J.; et al. LPJmL4-a dynamic global vegetation model with managed land—Part 1: Model description. Geosci. Model Dev. 2018, 11, 1343–1375. [Google Scholar] [CrossRef]
  32. Lawrence, D.M.; Hurtt, G.C.; Arneth, A.; Brovkin, V.; Calvin, K.V.; Jones, A.D.; Jones, C.D.; Lawrence, P.J.; de Noblet-Ducoudré, N.; Pongratz, J.; et al. The Land Use Model Intercomparison Project (LUMIP) contribution to CMIP6: Rationale and experimental design. Geosci. Model Dev. 2016, 9, 2973–2998. [Google Scholar] [CrossRef]
  33. Tebaldi, C.; Debeire, K.; Eyring, V.; Fischer, E.; Fyfe, J.; Friedlingstein, P.; Knutti, R.; Lowe, J.; O’Neill, B.; Sanderson, B.; et al. Climate model projections from the Scenario Model Intercomparison Project (ScenarioMIP) of CMIP6. Earth Syst. Dyn. 2021, 12, 253–293. [Google Scholar] [CrossRef]
  34. Moss, R.H.; Edmonds, J.A.; Hibbard, K.A.; Manning, M.R.; Rose, S.K.; van Vuuren, D.P.; Carter, T.R.; Emori, S.; Kainuma, M.; Kram, T.; et al. The next generation of scenarios for climate change research and assessment. Nature 2010, 463, 747–756. [Google Scholar] [CrossRef] [PubMed]
  35. Popp, A.; Calvin, K.; Fujimori, S.; Havlik, P.; Humpenöder, F.; Stehfest, E.; Bodirsky, B.L.; Dietrich, J.P.; Doelmann, J.C.; Gusti, M.; et al. Land-use futures in the shared socio-economic pathways. Glob. Environ. Change-Human Policy Dimens. 2017, 42, 331–345. [Google Scholar] [CrossRef]
  36. Shiogama, H.; Fujimori, S.; Hasegawa, T.; Hayashi, M.; Hirabayashi, Y.; Ogura, T.; Iizumi, T.; Takahashi, K.; Takemura, T. Important distinctiveness of SSP3-7.0 for use in impact assessments. Nat. Clim. Change 2023, 13, 1276–1278. [Google Scholar] [CrossRef]
  37. Friedlingstein, P.; Meinshausen, M.; Arora, V.K.; Jones, C.D.; Anav, A.; Liddicoat, S.K.; Knutti, R. Uncertainties in CMIP5 Climate Projections due to Carbon Cycle Feedbacks. J. Clim. 2014, 27, 511–526. [Google Scholar] [CrossRef]
  38. Liao, W.L.; Liu, X.P.; Xu, X.Y.; Chen, G.Z.; Liang, X.; Zhang, H.H.; Li, X. Projections of land use changes under the plant functional type classification in different SSP-RCP scenarios in China. Sci. Bull. 2020, 65, 1935–1947. [Google Scholar] [CrossRef]
  39. Morin, X.; Fahse, L.; Jactel, H.; Scherer-Lorenzen, M.; García-Valdés, R.; Bugmann, H. Long-term response of forest productivity to climate change is mostly driven by change in tree species composition. Sci. Rep. 2018, 8, 5627. [Google Scholar] [CrossRef]
  40. Sitch, S.; Smith, B.; Prentice, I.C.; Arneth, A.; Bondeau, A.; Cramer, W.; Kaplan, J.O.; Levis, S.; Lucht, W.; Sykes, M.T.; et al. Evaluation of ecosystem dynamics, plant geography and terrestrial carbon cycling in the LPJ dynamic global vegetation model. Glob. Change Biol. 2003, 9, 161–185. [Google Scholar] [CrossRef]
  41. Yang, J.; Huang, X. The 30 m annual land cover dataset and its dynamics in China from 1990 to 2019. Earth Syst. Sci. Data 2021, 13, 3907–3925. [Google Scholar] [CrossRef]
  42. Yang, Q.L.; Niu, C.Y.; Liu, X.Q.; Feng, Y.H.; Ma, Q.; Wang, X.J.; Tang, H.; Guo, Q.H. Mapping high-resolution forest aboveground biomass of China using multisource remote sensing data. GISci. Remote Sens. 2023, 60, 2203303. [Google Scholar] [CrossRef]
  43. Fang, J.; Yu, G.; Liu, L.; Hu, S.; Chapin, F.S. Climate change, human impacts, and carbon sequestration in China. Proc. Natl. Acad. Sci. USA 2018, 115, 4015–4020. [Google Scholar] [CrossRef] [PubMed]
  44. Chen, J.D.; Gao, M.; Cheng, S.L.; Hou, W.X.; Song, M.L.; Liu, X.; Liu, Y. Global 1 km x 1 km gridded revised real gross domestic product and electricity consumption during 1992-2019 based on calibrated nighttime light data. Sci. Data 2022, 9, 202. [Google Scholar] [CrossRef]
  45. Hansen, M.C.; Potapov, P.V.; Moore, R.; Hancher, M.; Turubanova, S.A.; Tyukavina, A.; Thau, D.; Stehman, S.V.; Goetz, S.J.; Loveland, T.R.; et al. High-resolution global maps of 21st-century forest cover change. Science 2013, 342, 850–853. [Google Scholar] [CrossRef]
  46. Canadell, J.G.; Le Quéré, C.; Raupach, M.R.; Field, C.B.; Buitenhuis, E.T.; Ciais, P.; Conway, T.J.; Gillett, N.P.; Houghton, R.A.; Marland, G. Contributions to accelerating atmospheric CO2 growth from economic activity, carbon intensity, and efficiency of natural sinks. Proc. Natl. Acad. Sci. USA 2007, 104, 18866–18870. [Google Scholar] [CrossRef]
  47. Zheng, H.; Ouyang, Z.Y.; Xu, W.H.; Wang, X.K.; Miao, H.; Li, X.Q.; Tian, Y.X. Variation of carbon storage by different reforestation types in the hilly red soil region of southern China. For. Ecol. Manag. 2008, 255, 1113–1121. [Google Scholar] [CrossRef]
  48. Liu, D.F.; Li, F.X.; Qiu, M.L.; Zhang, Y.; Zhao, X.; He, J.H. An integrated framework for measuring sustainable rural development towards the SDGs. Land Use Policy 2024, 147, 107339. [Google Scholar] [CrossRef]
  49. Kuang, W.; Liu, J.; Tian, H.; Shi, H.; Dong, J.; Song, C.; Li, X.; Du, G.; Hou, Y.; Lu, D.; et al. Cropland redistribution to marginal lands undermines environmental sustainability. Natl. Sci. Rev. 2021, 9, nwab091. [Google Scholar] [CrossRef]
  50. Peng, Y.Y.; Thomas, S.C.; Tian, D.L. Forest management and soil respiration: Implications for carbon sequestration. Environ. Rev. 2008, 16, 93–111. [Google Scholar] [CrossRef]
  51. Yanai, R.D.; Currie, W.S.; Goodale, C.L. Soil carbon dynamics after forest harvest: An ecosystem paradigm reconsidered. Ecosystems 2003, 6, 197–212. [Google Scholar] [CrossRef]
  52. Yildiz, O.; Cromack, K.; Radosevich, S.R.; Martinez-Ghersa, M.A.; Baham, J.E. Comparison of 5th-and 14th-year Douglas-fir and understory vegetation responses to selective vegetation removal. For. Ecol. Manag. 2011, 262, 586–597. [Google Scholar] [CrossRef]
  53. Flexas, J.; Medrano, H. Drought-inhibition of photosynthesis in C3 plants: Stomatal and non-stomatal limitations revisited. Ann. Bot. 2002, 89, 183–189. [Google Scholar] [CrossRef] [PubMed]
  54. Poorter, L.; Bongers, F.; Aide, T.M.; Almeyda Zambrano, A.M.; Balvanera, P.; Becknell, J.M.; Boukili, V.; Brancalion, P.H.S.; Broadbent, E.N.; Chazdon, R.L.; et al. Biomass resilience of Neotropical secondary forests. Nature 2016, 530, 211–214. [Google Scholar] [CrossRef] [PubMed]
  55. Ewers, R.M. Interaction effects between economic development and forest cover determine deforestation rates. Glob. Environ. Change-Human Policy Dimens. 2006, 16, 161–169. [Google Scholar] [CrossRef]
  56. Crouzeilles, R.; Beyer, H.L.; Monteiro, L.M.; Feltran-Barbieri, R.; Pessôa, A.C.M.; Barros, F.S.M.; Lindenmayer, D.B.; Lino, E.D.S.M.; Grelle, C.E.V.; Chazdon, R.L.; et al. Achieving cost-effective landscape-scale forest restoration through targeted natural regeneration. Conserv. Lett. 2020, 13, e12709. [Google Scholar] [CrossRef]
  57. Wright, S.J.; Muller-Landau, H.C. The future of tropical forest species. Biotropica 2006, 38, 287–301. [Google Scholar] [CrossRef]
  58. Strassburg, B.B.N.; Iribarrem, A.; Beyer, H.L.; Cordeiro, C.L.; Crouzeilles, R.; Jakovac, C.C.; Junqueira, A.B.; Lacerda, E.; Latawiec, A.E.; Balmford, A.; et al. Global priority areas for ecosystem restoration. Nature 2020, 586, 724–729. [Google Scholar] [CrossRef]
  59. Laurance, W.F.; Goosem, M.; Laurance, S.G.W. Impacts of roads and linear clearings on tropical forests. Trends Ecol. Evol. 2009, 24, 659–669. [Google Scholar] [CrossRef]
Figure 1. Analytical framework of forest carbon sequestration assessment under climate change mitigation scenarios.
Land 14 00571 g001
Figure 2. Change in forest area (FA) from 2020 to 2060. (a) FA in China from 2020 to 2060; (b) FA change in China from 2020 to 2060; and (c) FA in the areas with forest cover change under different scenarios.
Land 14 00571 g002
Figure 3. Change in carbon density (CD) from 2020 to 2060. (a) CD in China’s forest from 2020 to 2060; (b) CD change in China’s forest from 2020 to 2060; and (c) CD in the areas with forest cover change under different scenarios.
Land 14 00571 g003
Figure 4. Change in carbon sequestration (CS) from 2020 to 2060. (a) CS in China’s forest from 2020 to 2060; (b) CS change in China’s forest from 2020 to 2060; and (c) CS change in the areas with forest cover change under different scenarios.
Land 14 00571 g004
Table 1. Data sources for the PLUS model and the LPJmL model.
DataResolutionYearSource
Future land-use and cover change projection0.25 degree2020–2060LUH2: https://luh.umd.edu (accessed on 1 March 2025)
Historical land-use and cover pattern30 m2010–2020CLCD [41]
Topography1 min-ETOPO1: https://www.ngdc.noaa.gov (accessed on 1 March 2025)
SoilPolygon-HWSD: https://www.fao.org (accessed on 1 March 2025)
Socio-economyCounty2015China’s county-level statistical yearbook in 2016: http://www.stats.gov.cn/ (accessed on 1 March 2025)
Administrative boundaryPolygon2015China’s county-level administrative boundary in 2015: https://www.resdc.cn/ (accessed on 1 March 2025)
Region boundaryPolygon2015Spatial patterns of China’s six regions: https://www.resdc.cn/ (accessed on 1 March 2025)
Gross domestic product (GDP)1 km2015Global real GDP based on calibrated nighttime light [44]
Forest loss30 m2001–2015Global Maps of 21st-Century Forest Cover Change [45]
LandInG0.5 degree1991–2020LandInG [30]
Historical climate records0.5 degree1991–2020CRU TS 4.07: https://crudata.uea.ac.uk (accessed on 1 March 2025)
Historical radiation data0.5 degree1991–2018ERA-Interim: https://www.ecmwf.int (accessed on 1 March 2025)
Historical wind speed data0.5 degree1991–2020NCEP re-analysis: https://psl.noaa.gov (accessed on 1 March 2025)
Historical CO2 concentration recordsGlobe1991–2020NOAA/ESRL: https://www.esrl.noaa.gov (accessed on 1 March 2025)
Future climate change projection0.5 degree2020–2060ISIMIP3b: https://data.isimip.org (accessed on 1 March 2025)
Future CO2 concentration projectionGlobe2020–2060ISIMIP3b: https://data.isimip.org (accessed on 1 March 2025)
Disclaimer/Publisher’s Note: The statements, opinions and data contained in all publications are solely those of the individual author(s) and contributor(s) and not of MDPI and/or the editor(s). MDPI and/or the editor(s) disclaim responsibility for any injury to people or property resulting from any ideas, methods, instructions or products referred to in the content.

