
A Compromise Programming Approach for Assessing Territorial Biophysical Suitability: A Case Study


Abstract
1. Introduction
2. Materials and Methods
2.1. Previous Studies
2.2. The Methodological Approach
- (1)
- In the first step, a database screening of the available information was carried out. Then, according to the available information, the most relevant criteria for studying the biophysical suitability of parcels were selected. Their values were divided in 5 classes, which were then normalized according to the potential. The normalization determines values between 1 and 5, in which 5 represents the most suitable conditions for agriculture and forest development and 1 the least suitable.
- (2)
- In the second step, a cluster analysis was carried out regarding the different biophysical conditions, using the normalized data. A K-means clustering method was chosen due to its simplicity and objectives of this study.
- (3)
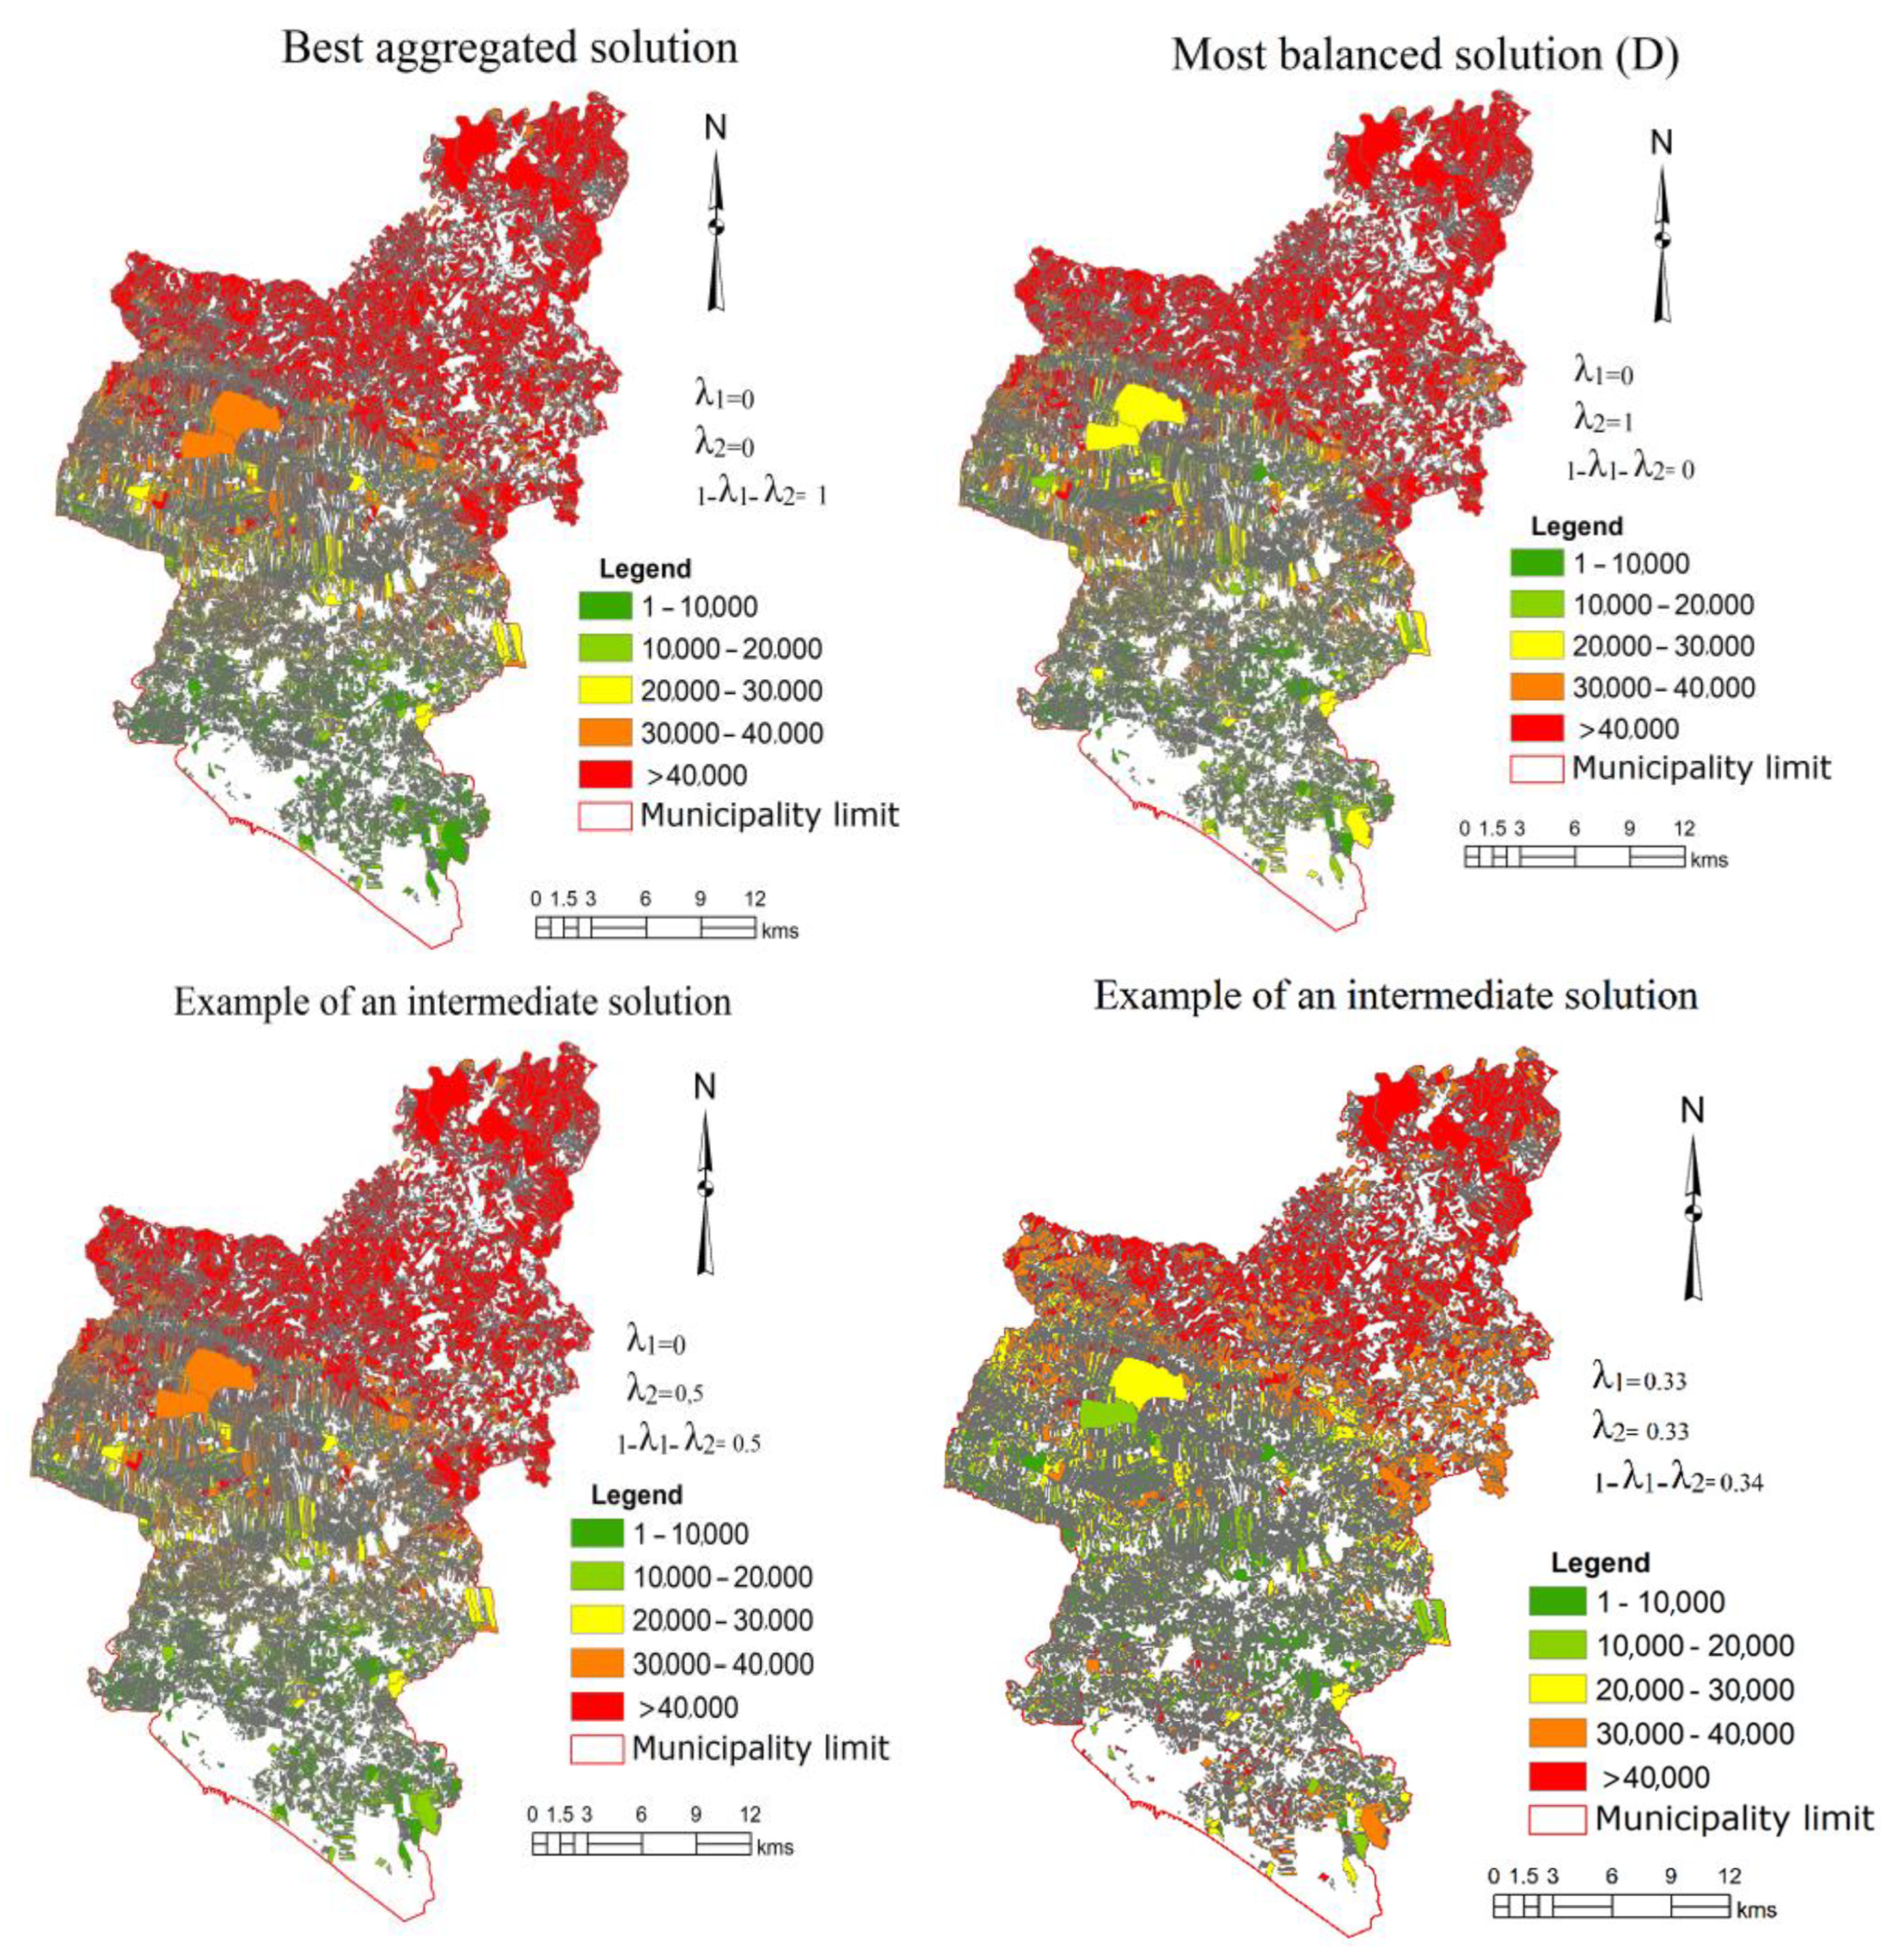
- In the third step, the weights of each indicator were defined, and a ranking analysis was implemented. The indicators were normalized using a MIN-MAX procedure for ranging between 0 and 1. A compromise programming approach considering simultaneously the best aggregated solution and the most balanced one accounting for the minimum maximum deviation and the information index was implemented.
- (4)
- In the fourth step, the statistical methods were carried out. A correlation matrix between the indexes and the size of the parcels was presented. A one-way ANOVA allowed us to analyze the influences of the clusters in the average indexes and if the average among clusters were statistically significant.
- (1)
- The criteria selection follows a qualitative valuation by experts, which defined 5 classes of potential and associated them with the codification from 1 to 5, where 1 means a low suitability and 5 a very good suitability. Several relevant bibliographic references were also consulted.
- (2)
- Cluster analysis
- (3)
- Ranking analysis definition
- (4)
- Statistical analyses
3. Empirical Implementation
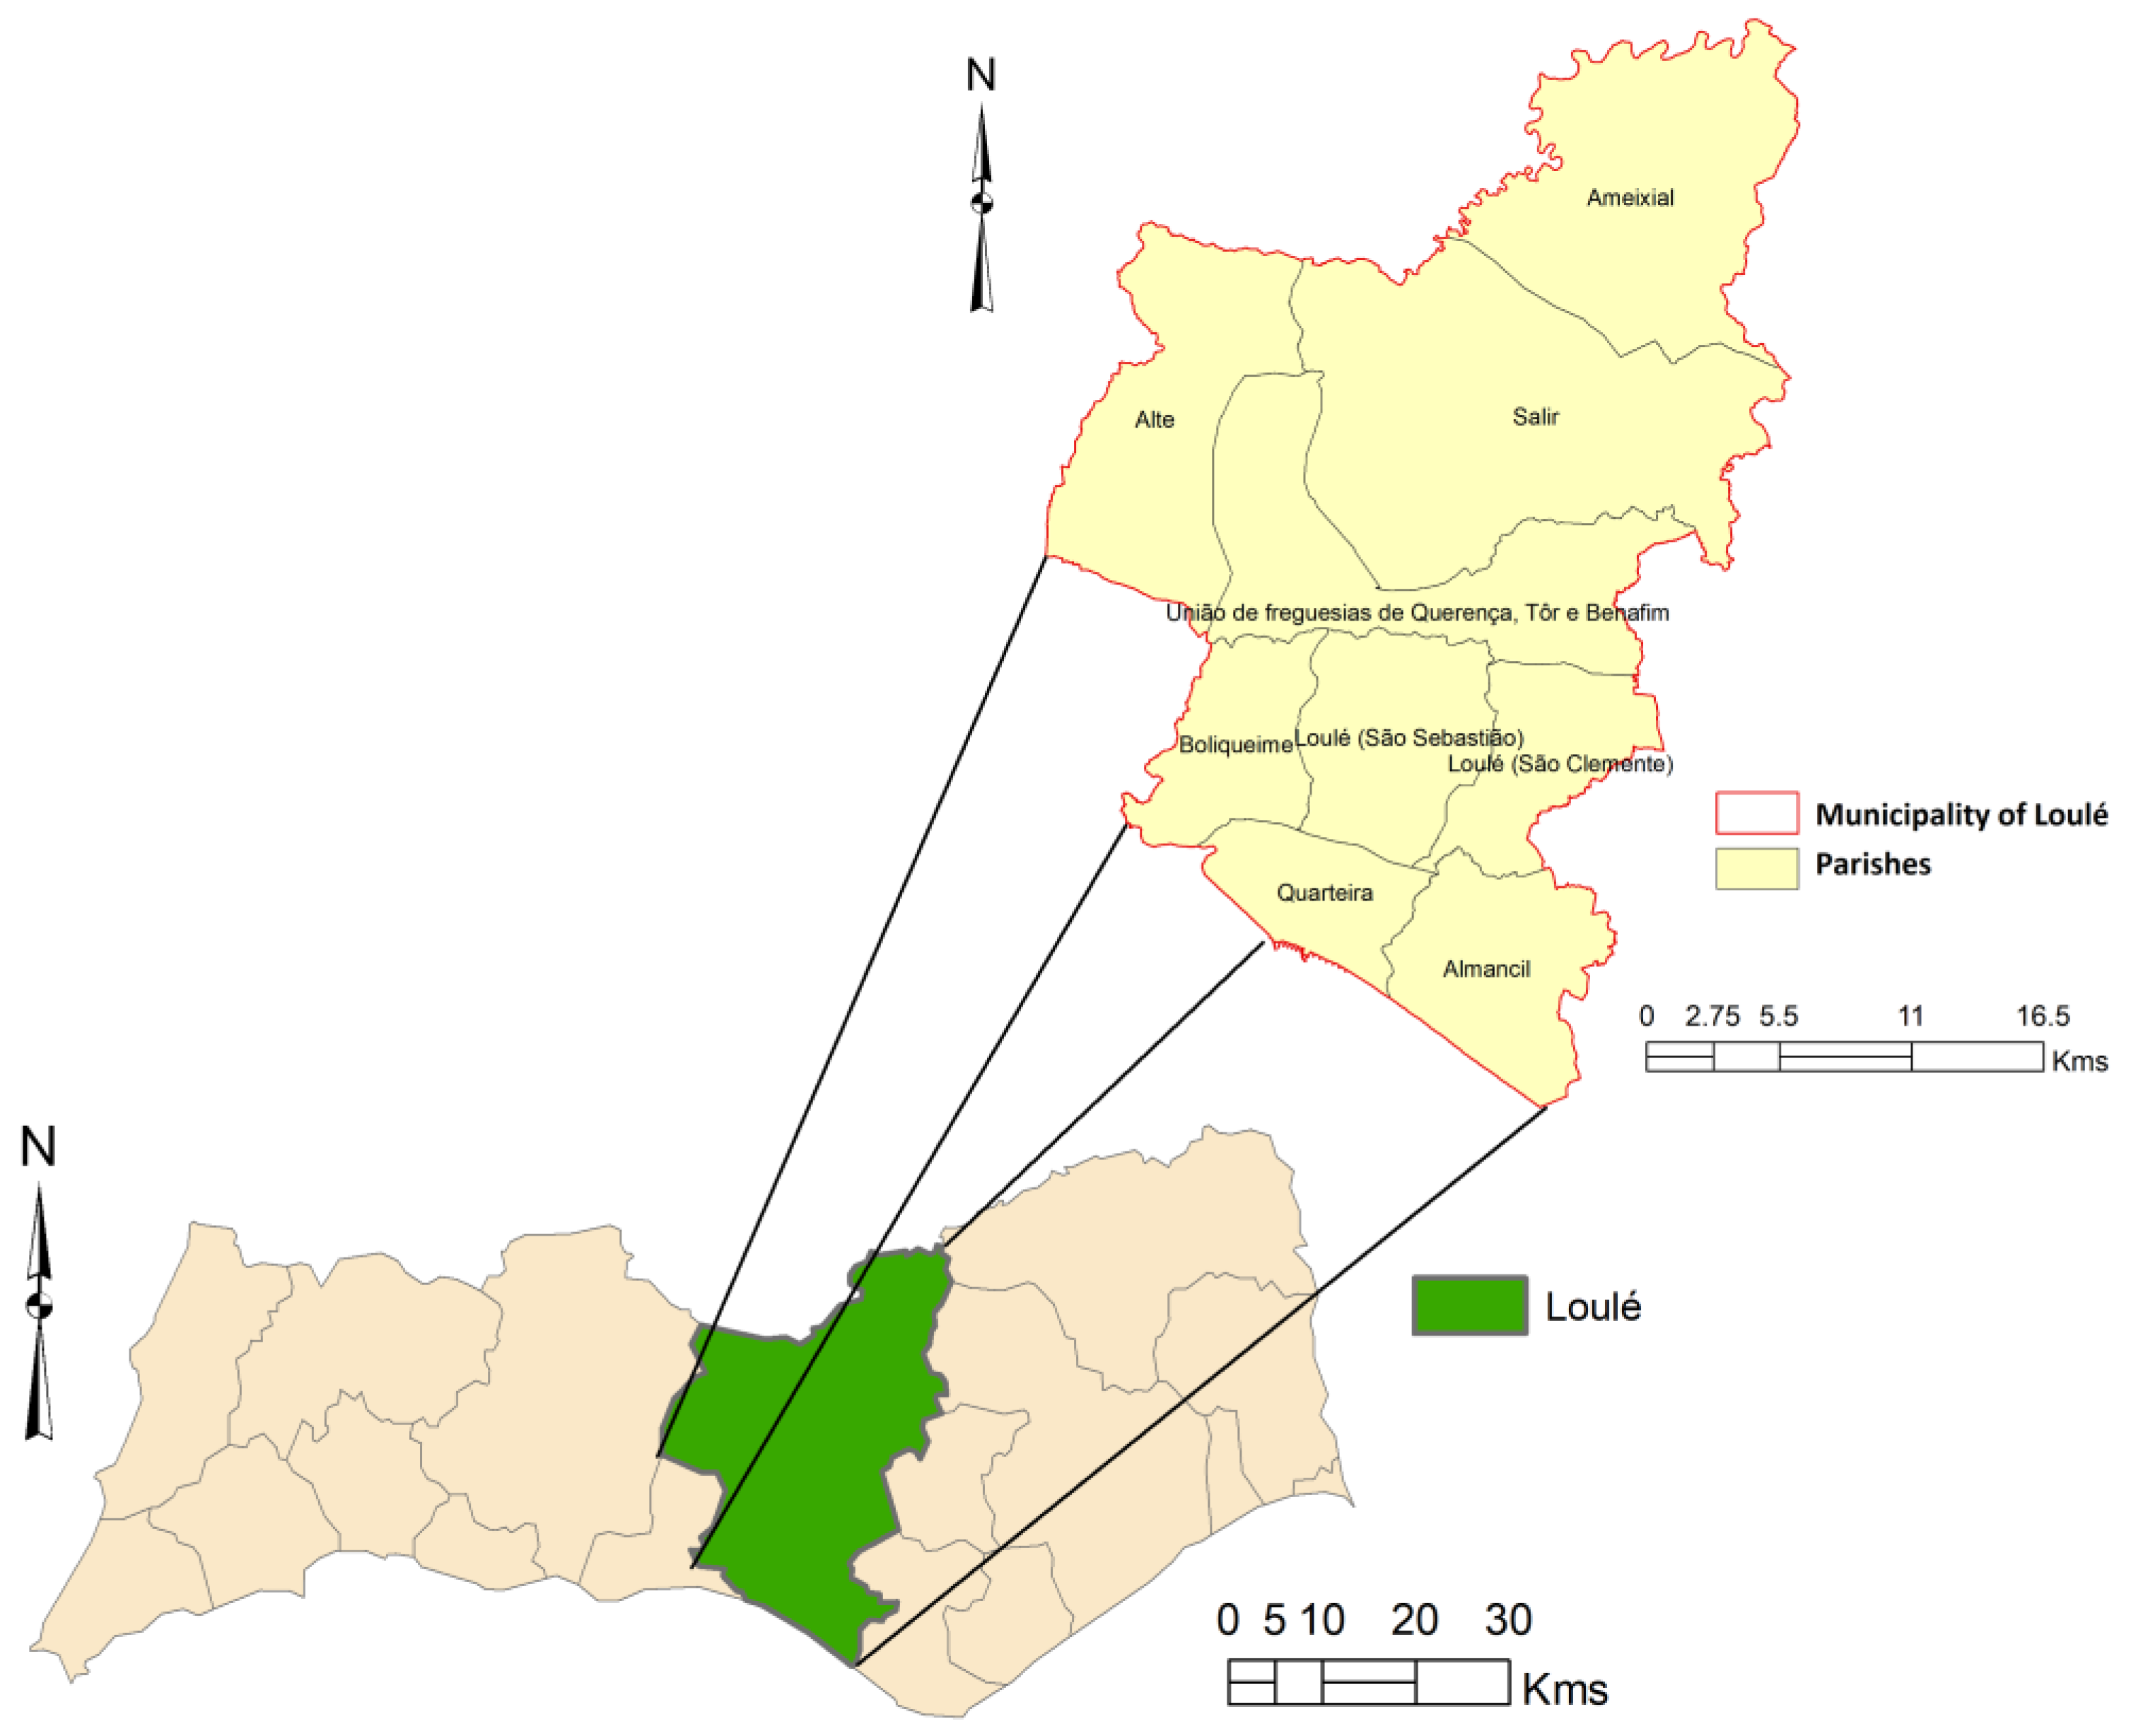
3.1. The Study Area
3.2. Data Collection
3.3. Data Analysis
4. Results
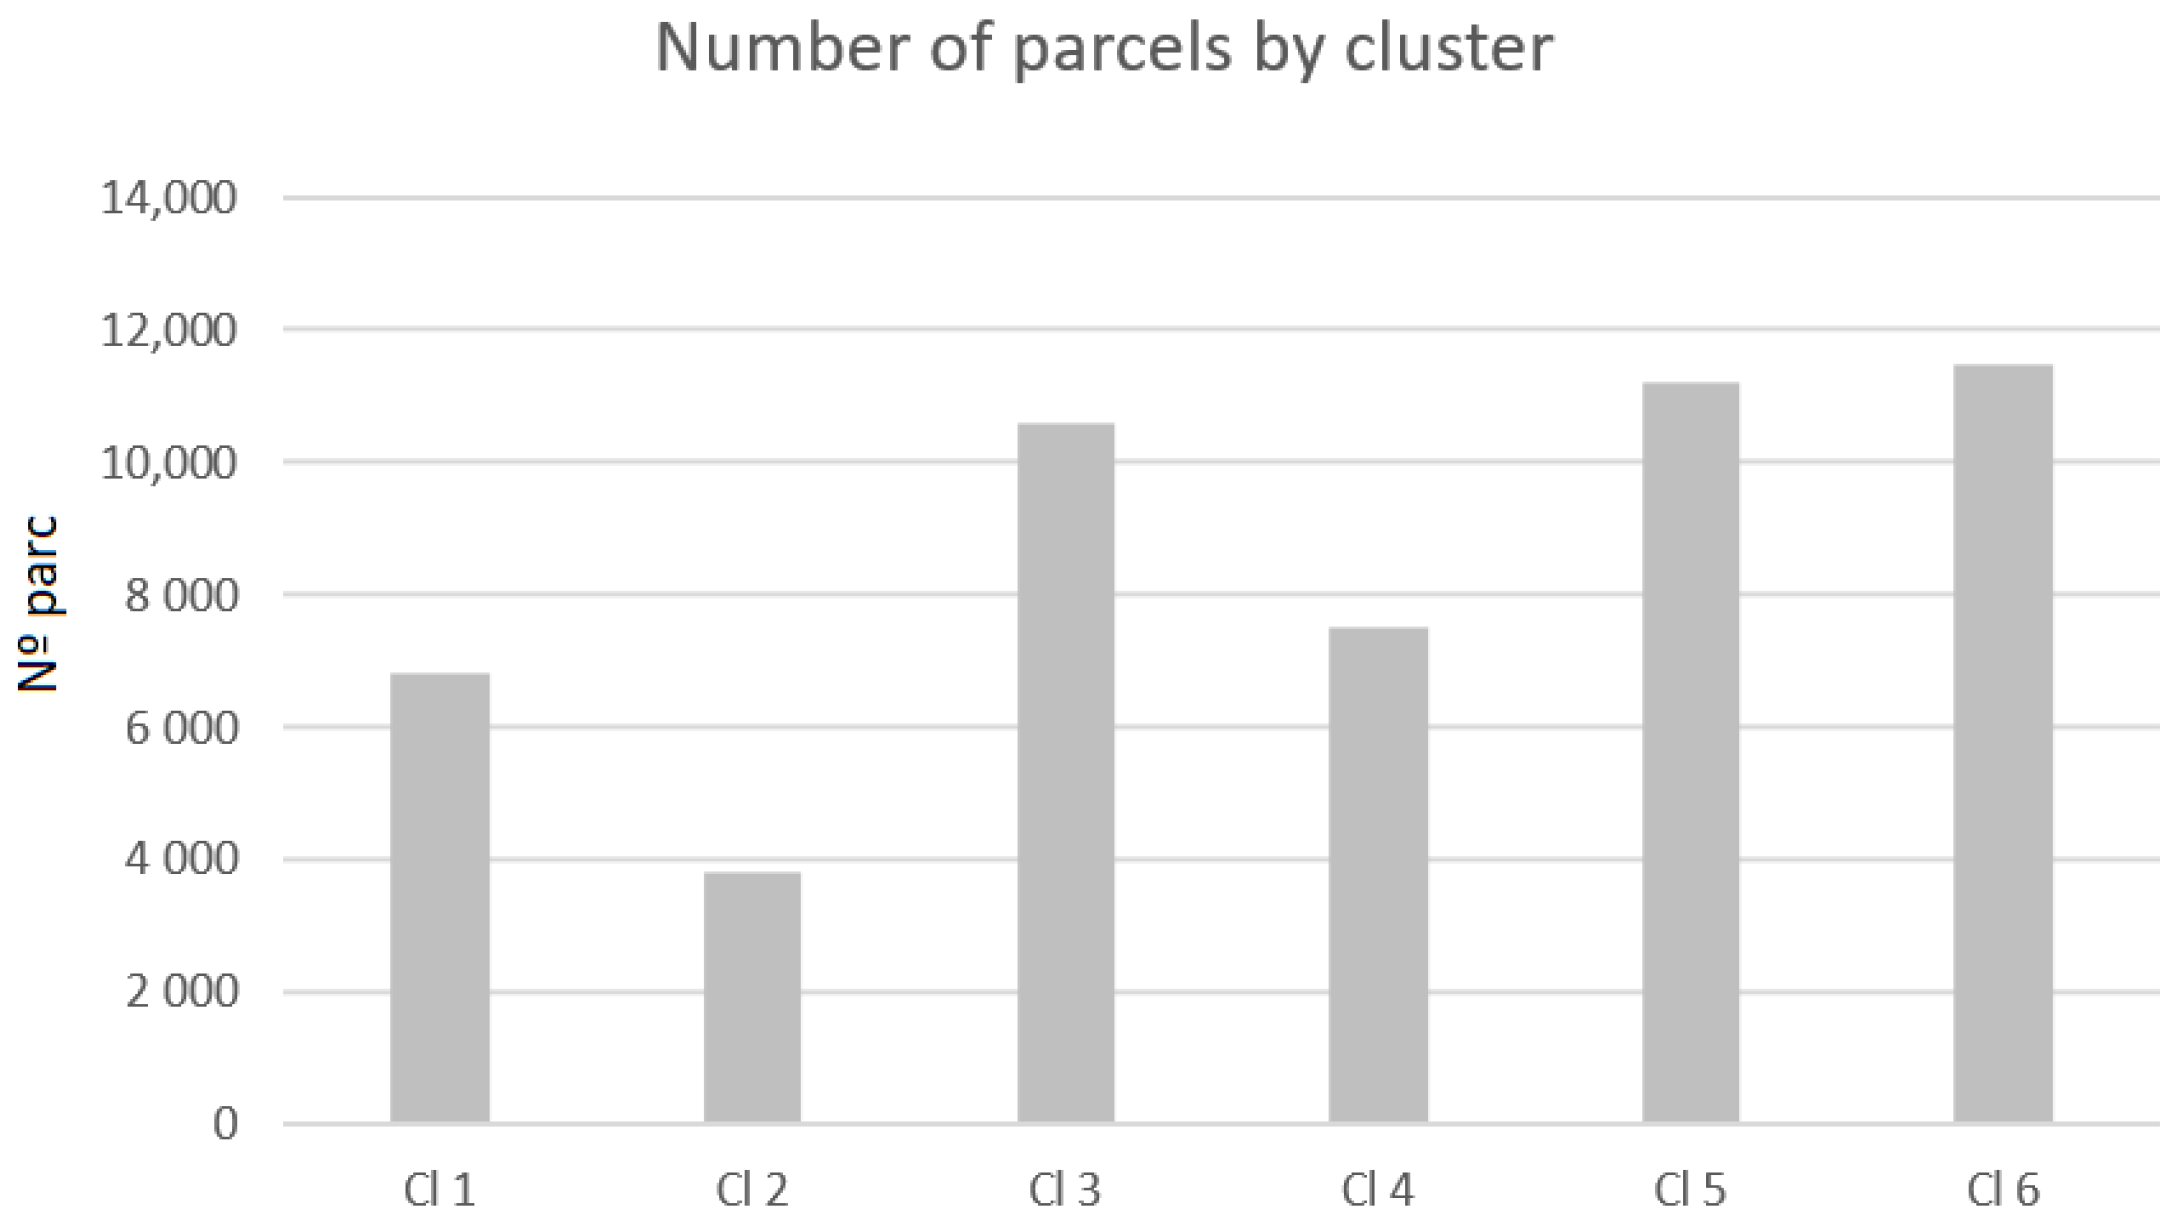
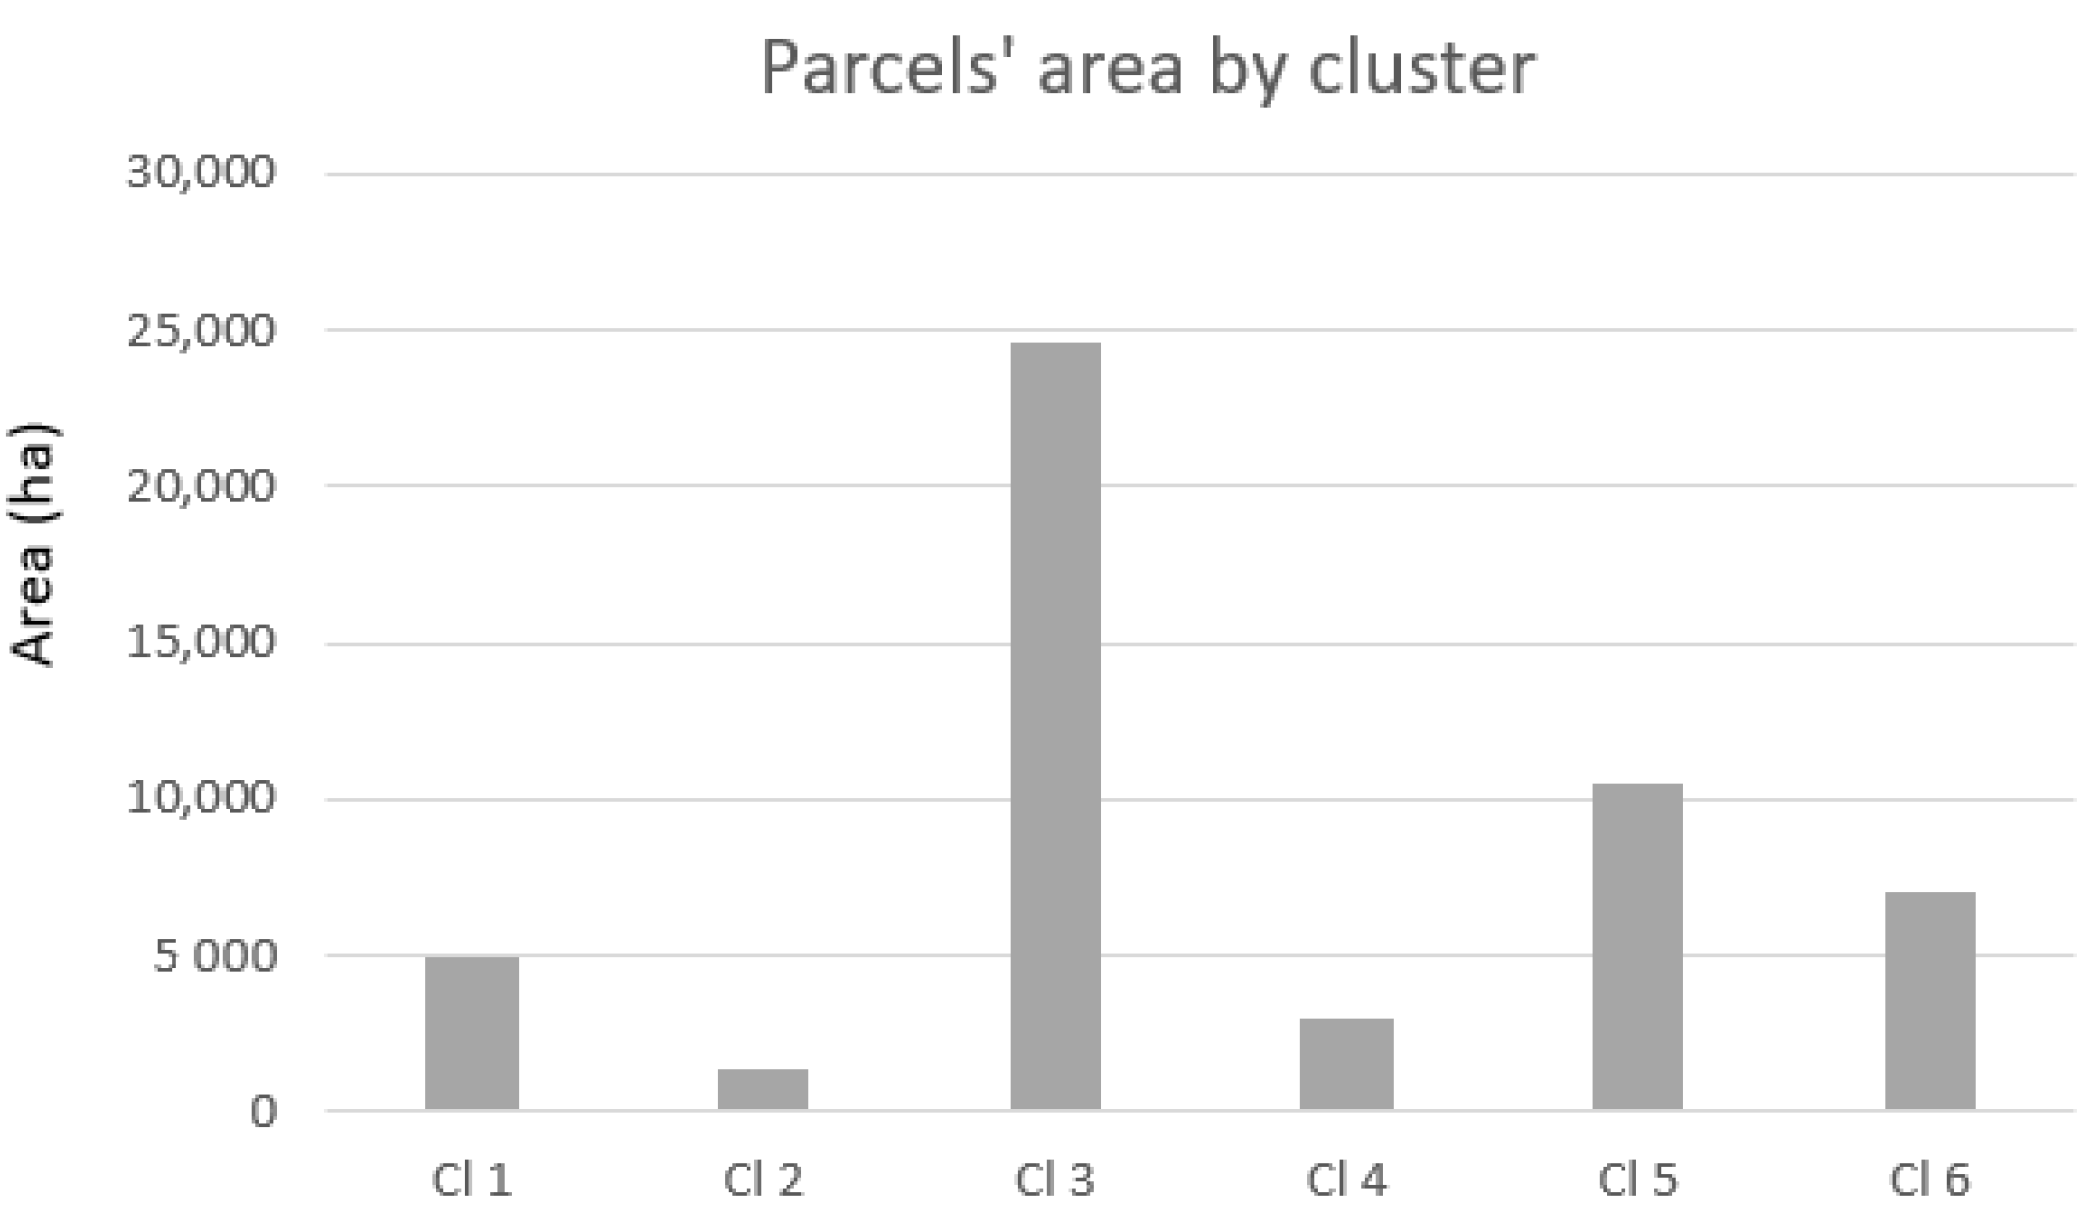
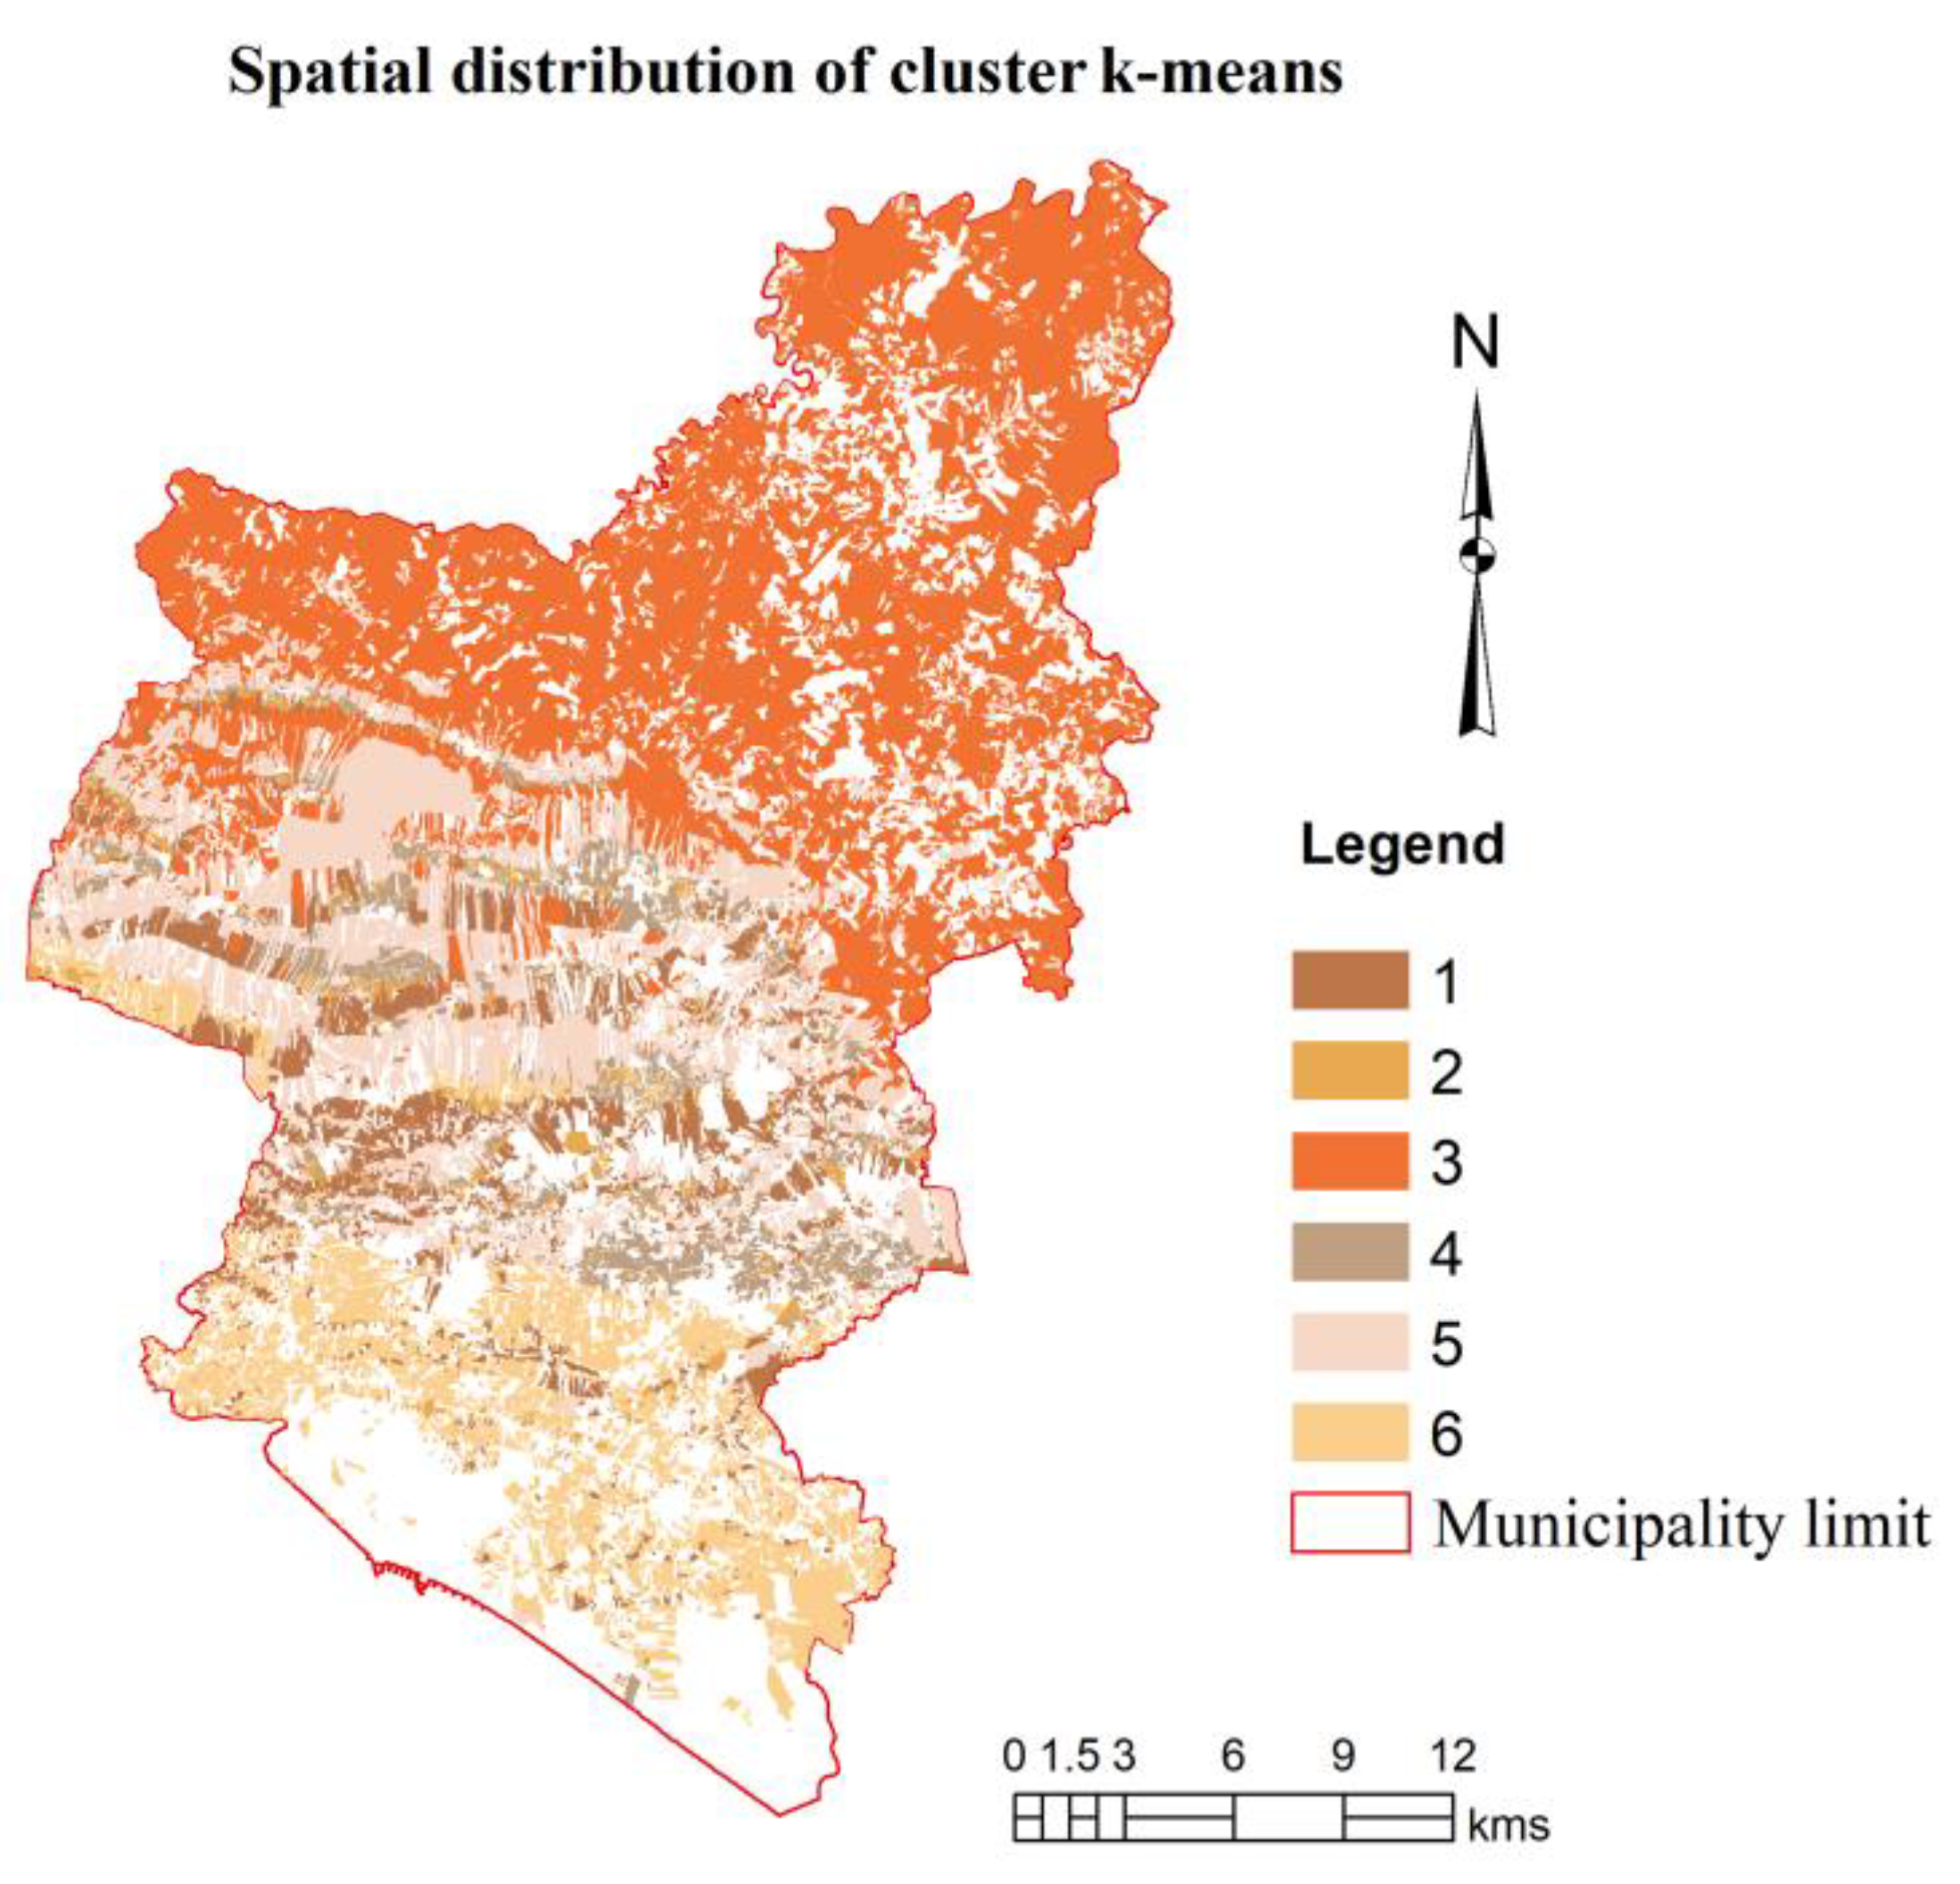
4.1. The Cluster Analysis
- Cluster 1—Parcels with a medium-high biophysical suitability regarding Slope and Hoar frost, satisfactory for Hypsometry but a low suitability regarding Soil capacity and Aspect.
- Cluster 2—Parcels that present a good suitability potential for the following criteria: Slope, Soil capacity and Hoar frost but tend to present a low suitability for the Aspect criteria.
- Cluster 3—Parcels that tend to present a low to very low potential in almost all criteria, namely, in Soil capacity and Hypsometry.
- Cluster 4—Parcels that tend to present a very good Slope biophysical capacity and a good suitability regarding the other criteria, except for Hypsometry.
- Cluster 5—Parcels that tend to present satisfactory suitability regarding Slope and Hoar Frost but present low levels for Soil capacity and Hypsometry.
- Cluster 6—Parcels that tend to present very good suitability results regarding Slope and Hoar frost but also regarding Hypsometry, Aspect and Soil capacity.
4.2. Ranking Analysis
4.3. Statistical Analysis
5. Discussion
6. Concluding Remarks
Author Contributions
Funding
Data Availability Statement
Acknowledgments
Conflicts of Interest
References
- Getie, A.M.; Birhanu, T.A.; Dadi, T.F. Developing a framework for assessing the efficacy of rural cadastral system in the Amhara region, Ethiopia. Surv. Rev. 2023, 55, 147–168. [Google Scholar] [CrossRef]
- Hämäläinen, E.; Krigsholm, P. Exploring the strategy goals and strategy drivers of national mapping, cadastral, and land registry authorities. ISPRS Int. J. Geo-Inf. 2022, 11, 164. [Google Scholar] [CrossRef]
- Steudler, D.; Williamson, I.P.; Rajabifard, A.; Enemark, S. Good practices in land administration and cadastre: The Cadastral Template Project. In Proceedings of the FIG Working Week 2004, Athens, Greece, 22–27 May 2004. [Google Scholar]
- Cole, M.G.; Wilson, A.D. Land Tenure, Boundary Surveys, and Cadastral Systems; Taylor & Francis Group: Boca Raton, FL, USA, 2017. [Google Scholar]
- Enemark, S. From cadastre to land governance. In Proceedings of the Cadastral Surveyor-Paving the Way to the Future 2nd European Conference on Cadastre, Bucharest, Romania, 6–7 May 2010. [Google Scholar]
- Sass, C.K.; Andrew Lodder, R.; Lee, B.D. Combining biophysical and socioeconomic suitability models for urban forest planning. Urban For. Urban Green. 2019, 38, 371–382. [Google Scholar] [CrossRef]
- del Mar Esponda-Bernal, M.; Echeverri-Sanchez, A.F.; Aguirre-Gonzalez, E.F.; Andrade, R.S. A biophysical suitability model to identify best areas for the cultivation of potential cash crops: The case of basil in Valle del Cauca. Agric. Syst. 2024, 216, 103909. [Google Scholar] [CrossRef]
- Matos, C.R.; Carneiro, J.F.; Pereira da Silva, P.; Henriques, C.O. A GIS-MCDA Approach Addressing Economic-Social-Environmental Concerns for Selecting the Most Suitable Compressed Air Energy Storage Reservoirs. Energies 2021, 14, 6793. [Google Scholar] [CrossRef]
- El Baroudy, A.A. Mapping and evaluating land suitability using a GIS-based model. Catena 2016, 140, 96–104. [Google Scholar] [CrossRef]
- Collins, M.G.; Steiner, F.R.; Rushman, M.J. Land-use suitability analysis in the United States: Historical development and promising technological achievements. Environ. Manag. 2001, 28, 611–621. [Google Scholar] [CrossRef]
- Malczewski, J. GIS-based land-use suitability analysis: A critical overview. Prog. Plan. 2004, 62, 3–65. [Google Scholar] [CrossRef]
- Malczewski, J.; Rinner, C. Multicriteria Decision Analysis in Geographic Information Science; Springer: New York, NY, USA, 2015. [Google Scholar]
- McCoy, J.; Johnston, K. Using ArcGIS Spatial Analyst; Environmental Systems Research Institute (ESRI): Redlands, CA, USA, 2001. [Google Scholar]
- González-Pachón, J.; Romero, C. Inferring consensus weights from pairwise comparison matrices without suitable properties. Ann. Oper. Res. 2007, 154, 123–132. [Google Scholar] [CrossRef]
- Diaz-Balteiro, L.; González-Pachón, J.; Romero, C. Forest management with multiple criteria and multiple stakeholders: An application to two public forests in Spain. Scand. J. For. Res. 2009, 24, 87–93. [Google Scholar] [CrossRef]
- Nordström, E.; Romero, C.; Eriksson, L.; Öhman, L. Aggregation of Preferences in Participatory Forest Planning with Multiple Criteria: An Application to the Urban Forest in Lycksele, Sweden. Can. J. For. Res. 2009, 39, 1979–1992. [Google Scholar] [CrossRef]
- Xavier, A.; Costa Freitas, M.B.; Antunes, C.R. The water surfaces’ ecosystem services and the opinion of different stakeholders: An approach based on goal programming. Int. J. Manag. Decis. Mak. 2016, 15, 184–204. [Google Scholar] [CrossRef]
- OECD (Organization for Economic Co-operation and Development; JRC, Joint Research Centre). Handbook on Constructing Composite Indicators. Methodology and User Guide; OECD: Paris, France, 2008. [Google Scholar]
- Diaz-Balteiro, L.; Voces González, R.; Romero, C. Making sustainability rankings using compromise programming. An application to European paper industry. Silva Fenn. 2011, 45, 761–773. [Google Scholar] [CrossRef]
- Diaz-Balteiro, L.; Romero, C.; García de Jalón, S. An analysis of the degree of circularity of the wood products industry in Europe. J. Ind. Ecol. 2022, 26, 1350–1363. [Google Scholar] [CrossRef]
- Costa Freitas, M.D.B.C.; Xavier, A.; Fragoso, R.; Antunes, C. A composite indicator to measure sustainable water use in Portugal: A compromise programming approach. J. Environ. Manag. 2022, 311, 114791. [Google Scholar] [CrossRef] [PubMed]
- Xavier, A.; Costa Freitas, M.D.B.; Fragoso, R.; Rosário, M.D.S. Analysing the Recent Dynamics of Agricultural Sustainability in Portugal Using a Compromise Programming Approach. Sustainability 2022, 14, 12512. [Google Scholar] [CrossRef]
- Blashfield, R.K.; Aldenderfer, M.S. The literature on cluster analysis. Multivar. Behav. Res. 1978, 13, 271–295. [Google Scholar] [CrossRef]
- Malczewski, J. GIS-based multicriteria decision analysis: A survey of the literature. Int. J. Geogr. Inf. Sci. 2006, 20, 703–726. [Google Scholar] [CrossRef]
- Fathi, S.; Hagen, J.S.; Matanó, A.; Nogueira, G.E. Review of GIS multi-criteria decision analysis for managed aquifer recharge in semi-arid regions. In Groundwater Resources Development and Planning in the Semi-Arid Region; Pande, C.B., Moharir, K.N., Eds.; Springer International Publishing: Cham, Switzerland, 2021; pp. 154–196. [Google Scholar] [CrossRef]
- Villacreses, G.; Martínez-Gómez, J.; Jijón, D.; Cordovez, M. Geolocation of photovoltaic farms using Geographic Information Systems (GIS) with Multiple-criteria decision-making (MCDM) methods: Case of the Ecuadorian energy regulation. Energy Rep. 2022, 8, 3526–3548. [Google Scholar] [CrossRef]
- Aazagreyir, P.; Appiahene, P.; Appiah, O.; Boateng, S. GIS-based fuzzy multi-criteria decision making methods: A systematic review and meta-analysis. J. Theor. Appl. Inf. Technol. 2022, 100, 5119–5133. [Google Scholar]
- Pourebrahim, S.; Hadipour, M.; Mokhtar, M.B.; Mohamed, M.I.H. Analytic network process for criteria selection in sustainable coastal land use planning. Ocean Coast. Manag. 2010, 53, 544–551. [Google Scholar] [CrossRef]
- Jaafari, A.; Najafi, A.; Melón, M.G. Decision-making for the selection of a best wood extraction method: An analytic network process approach. For. Policy Econ. 2015, 50, 200–209. [Google Scholar] [CrossRef]
- Ferretti, V. A multicriteria spatial decision support system development for siting a landfill in the province of Torino (Italy). J. Multi-Criteria Decis. Anal. 2011, 18, 231–252. [Google Scholar] [CrossRef]
- Graymore, M.L.; Wallis, A.M.; Richards, A.J. An Index of Regional Sustainability: A GIS-based multiple criteria analysis decision support system for progressing sustainability. Ecol. Complex. 2009, 6, 453–462. [Google Scholar] [CrossRef]
- De Feo, G.; De Gisi, S. Using MCDA and GIS for hazardous waste landfill siting considering land scarcity for waste disposal. Waste Manag. 2014, 34, 2225–2238. [Google Scholar] [CrossRef]
- Jaiswal, R.K.; Ghosh, N.C.; Galkate, R.V.; Thomas, T. Multi criteria decision analysis (MCDA) for watershed prioritization. Aquat. Procedia 2015, 4, 1553–1560. [Google Scholar] [CrossRef]
- Kidd, D.; Webb, M.; Malone, B.; Minasny, B.; McBratney, A. Digital soil assessment of agricultural suitability, versatility and capital in Tasmania, Australia. Geoderma Reg. 2015, 6, 7–21. [Google Scholar] [CrossRef]
- Wordley, C.F.; Sankaran, M.; Mudappa, D.; Altringham, J.D. Landscape scale habitat suitability modelling of bats in the Western Ghats of India: Bats like something in their tea. Biol. Conserv. 2015, 191, 529–536. [Google Scholar] [CrossRef]
- Demesouka, O.E.; Vavatsikos, A.P.; Anagnostopoulos, K.P. Spatial UTA (S-UTA)–A new approach for raster-based GIS multicriteria suitability analysis and its use in implementing natural systems for wastewater treatment. J. Environ. Manag. 2013, 125, 41–54. [Google Scholar] [CrossRef]
- Danvi, A.; Jütten, T.; Giertz, S.; Zwart, S.J.; Diekkrüger, B. A spatially explicit approach to assess the suitability for rice cultivation in an inland valley in central Benin. Agric. Water Manag. 2016, 177, 95–106. [Google Scholar] [CrossRef]
- Massei, G.; Rocchi, L.; Paolotti, L.; Greco, S.; Boggia, A. Decision Support Systems for environmental management: A case study on wastewater from agriculture. J. Environ. Manag. 2014, 146, 491–504. [Google Scholar] [CrossRef]
- Khodakarami, L.; Pourmanafi, S.; Mokhtari, Z.; Soffianian, A.R.; Lotfi, A. Urban sustainability assessment at the neighborhood scale: Integrating spatial modellings and multi-criteria decision making approaches. Sustain. Cities Soc. 2023, 97, 104725. [Google Scholar] [CrossRef]
- Akpoti, K.; Kabo-bah, A.T.; Zwart, S.J. Agricultural land suitability analysis: State-of-the-art and outlooks for integration of climate change analysis. Agric. Syst. 2019, 173, 172–208. [Google Scholar] [CrossRef]
- Wijesinghe, W.M.D.C.; Withanage, N.C. Application of the GIS-MCDA to identify land suitability for legume crops cultivation: An empirical investigation based on Thalawa DSD, Sri Lanka. Int. J. Spat. Temporal Multimed. Inf. Syst. 2022, in press. [Google Scholar] [CrossRef]
- Fadafan, F.K.; Soffianian, A.; Pourmanafi, S.; Morgan, M. Assessing eco-tourism in a mountainous landscape using GIS–MCDA approaches. Appl. Geogr. 2022, 147, 102743. [Google Scholar] [CrossRef]
- Shi, Z.; Marinello, F.; Ai, P.; Pezzuolo, A. Assessment of bioenergy plant locations using a GIS-MCDA approach based on spatio-temporal stability maps of agricultural and livestock byproducts: A case study. Sci. Total Environ. 2024, 947, 174665. [Google Scholar] [CrossRef]
- Rojas-Briceño, N.B.; García, L.; Cotrina-Sánchez, A.; Goñas, M.; Salas López, R.; Silva López, J.O.; Oliva-Cruz, M. Land Suitability for Cocoa Cultivation in Peru: AHP and MaxEnt Modeling in a GIS Environment. Agronomy 2022, 12, 2930. [Google Scholar] [CrossRef]
- Nungula, E.Z.; Massawe, B.J.; Chappa, L.R.; Nhunda, D.M.; Seleiman, M.F.; Ali, N.; Gitari, H.I. Multicriteria land suitability assessment for cassava and bean production using integration of GIS and AHP. Cogent Food Agric. 2024, 10, 2333316. [Google Scholar] [CrossRef]
- Heider, K.; Lopez, J.M.R.; Avilés, J.M.G.; Balbo, A.L. Land fragmentation index for drip-irrigated field systems in the Mediterranean: A case study from Ricote (Murcia, SE Spain). Agric. Syst. 2018, 166, 48–56. [Google Scholar] [CrossRef]
- Ciaian, P.; Guri, F.; Rajcaniova, M.; Drabik, D.; Paloma, S.G. Land fragmentation and production diversification: A case study from rural Albania. Land Use Policy 2018, 76, 589–599. [Google Scholar] [CrossRef]
- Austin, O.C.; Ulunma, A.C.; Sulaiman, J. Exploring the link between land fragmentation and agricultural productivity. Int. J. Agric. For. 2012, 2, 30–34. [Google Scholar] [CrossRef]
- Wei, Y.; Zhang, Z. Assessing the fragmentation of construction land in urban areas: An index method and case study in Shunde, China. Land Use Policy 2012, 29, 417–428. [Google Scholar] [CrossRef]
- Demetriou, D.; Stillwell, J.; See, L. A new methodology for measuring land fragmentation. Comput. Environ. Urban Syst. 2013, 39, 71–80. [Google Scholar] [CrossRef]
- Liang, J.; Zhou, T. Cultivated Land Fragmentation and Its Influencing Factors Detection: A Case Study in Huaihe River Basin, China. Int. J. Environ. Res. Public Health 2022, 19, 138. [Google Scholar] [CrossRef]
- Zhao, Y.; Feng, Q. Identifying spatial and temporal dynamics and driving factors of cultivated land fragmentation in Shaanxi province. Agric. Syst. 2024, 217, 103948. [Google Scholar] [CrossRef]
- Su, M.; Sun, K.; Deng, B.; Cheng, N.; Cao, Y. Quantification and Driving Factors of Cultivated Land Fragmentation in Rapidly Urbanizing Area: A Case Study in Guang-dong Province. Remote Sens. 2024, 16, 2633. [Google Scholar] [CrossRef]
- Marôco, J. Análise Estatística Com o SPSS Statistics; Report Number: Lisbon, Portugal, 2014. [Google Scholar]
- Gore, P.A. 11-Cluster Analysis. In Handbook of Applied Multivariate Statistics and Mathematical Modeling; Tinsley, H., Brown, S.D., Eds.; Academic Press: Cambridge, MA, USA, 2000; pp. 297–321. [Google Scholar] [CrossRef]
- Diaz-Balteiro, L.; Romero, C. Sustainability of forest management plans: A discrete goal programming approach. J. Environ. Manag. 2004, 71, 351–359. [Google Scholar] [CrossRef]
- Xavier, A.; Freitas, M.B.C.; Fragoso, R.; Rosário, M.S. A regional composite indicator for analysing agricultural sustainability in Portugal: A goal programming approach. Ecol. Indic. 2018, 89, 84–100. [Google Scholar] [CrossRef]
- Diaz-Balteiro, L.; Alfranca, O.; González-Pachón, J.; Romero, C. Ranking of industrial forest plantations in terms of sustainability: A multicriteria approach. J. Environ. Manag. 2016, 180, 123–132. [Google Scholar] [CrossRef]
- Xavier, A. Um Modelo Bioeconómico para a Gestão Sustentável das Florestas Mediterrâneas. Ph.D. Thesis, University of Algarve, Faro, Portugal, 2014. [Google Scholar]
- Fragoso, R.; Vieira, A. Efficiency analysis of the Portuguese wine industry using accounting and operational metrics. Results Eng. 2022, 14, 100389. [Google Scholar] [CrossRef]
- Troccoli, E.B.; Cerqueira, A.G.; Lemos, J.B.; Holz, M. K-means clustering using principal component analysis to automate label organization in multi-attribute seismic facies analysis. J. Appl. Geophys 2022, 198, 104555. [Google Scholar] [CrossRef]
- Hair, J.F.; Hult, G.T.M.; Ringle, C.M.; Sarstedt, M. A Primer on Partial Least Squares Structural Equation Modeling (PLS-SEM), 3rd ed.; Sage: Thousand Oaks, CA, USA, 2022. [Google Scholar]
- Binns, B.; Skovgaard, K. The consolidation of fragmented agricultural holdings. In Agricultural and Food Sciences; Conference Proceedings; Food and Agriculture Organization of the United Nations: Rome, Italy, 1950. [Google Scholar]
- Carsjens, G.J.; Van Der Knaap, W. Strategic land-use allocation: Dealing with spatial relationships and fragmentation of agriculture. Landsc. Urban Plan. 2002, 58, 171–179. [Google Scholar] [CrossRef]
- Saltelli, A.; Tarantola, S.; Chan, K. A Role for Sensitivity Analysis in Presenting the Results from MCDA Studies to Decision Makers. J. Multi-Criteria Decis. Anal. 1999, 8, 139–145. [Google Scholar] [CrossRef]


| Indicator | Code | Source |
|---|---|---|
| Slope | DEC | Digital Elevation Model (DEM)-ICNF |
| Soil capacity | SC | Map of soil capacity—General Direction of Agriculture and Rural Development |
| Hoar frost | FR | Environment Atlas—Portuguese Environment Agency |
| Hypsometry | HIPS | Digital Elevation Model (DEM)-ICNF |
| Aspect | ASP | Digital Elevation Model (DEM)-ICNF |
| Indicator | Code | Source | Classification Limits |
|---|---|---|---|
| Slope | DEC | Digital Elevation Model (DEM)-ICNF | 5: 0–8% 4: 8–15% 3. 15–30% 2. 30–45% 1: >45% |
| Soil capacity | SC | Map of soil capacity—General Direction of Agriculture and Rural Development | 5: A 4: B 3: C 2: D 1: E |
| Hoar frost | FR | Environment Atlas—Portuguese Environment Agency | 5: 1 to 5 days 4: 5 to 10 days 3: 10 to 20 days 2: 20 to 30 days 1: 30 to 40 days |
| Hypsometry | HIPS | Digital Elevation Model (DEM)-ICNF | 5: 0–100 m 4: 100–200 m 3: 200–300 m 2: 300–400 m 1: >400 m |
| Aspect (orientation of the strands) | ASP | Digital Elevation Model (DEM)-ICNF | 5: S, Flat 4: SE 3: SW 2: E, W 1: NW, NE, N |
| Variables | Clusters | |||||
|---|---|---|---|---|---|---|
| 1 | 2 | 3 | 4 | 5 | 6 | |
| Slope | 3.786 | 4.532 | 2.985 | 4.583 | 3.797 | 4.765 |
| Soil capacity | 1.767 | 3.912 | 1.033 | 3.85 | 1.451 | 3.235 |
| Hoar frost | 3.884 | 3.731 | 2.318 | 3.397 | 3.224 | 4.896 |
| Hypsometry | 2.701 | 2.761 | 1.316 | 2.378 | 2.199 | 3.86 |
| Aspect | 1.709 | 1.632 | 2.636 | 3.83 | 3.835 | 3.985 |
| Variable | Cluster | Error | F | Sig. | ||
|---|---|---|---|---|---|---|
| Mean Square | df | Mean Square | df | |||
| Slope | 4399.242 | 5.000 | 0.426 | 51,358 | 10,329.720 | 0.000 |
| Soil capacity | 12,979.228 | 5.000 | 0.512 | 51,358 | 25,338.704 | 0.000 |
| Hoar frost | 7815.468 | 5.000 | 0.355 | 51,358 | 22,038.702 | 0.000 |
| Hypsometry | 7535.146 | 5.000 | 0.324 | 51,358 | 23,279.059 | 0.000 |
| Aspect | 8480.740 | 5.000 | 0.520 | 51,358 | 16,316.113 | 0.000 |
| λ1 | 1 | 0 | 0 | 0.5 | 0 | 0.5 | 0.33 | 0.25 | |
| λ2 | 0 | 1 | 0 | 0.5 | 0.5 | 0 | 0.33 | 0.25 | |
| 1 − λ1 − λ2 | 0 | 0 | 1 | 0 | 0.5 | 0.5 | 0.34 | 0.5 | |
| Parcel number | |||||||||
| Ranking | |||||||||
| 1 | 2760 | 2760 | 2760 | 2760 | 2760 | 2760 | 2760 | 2760 | |
| 1 | 4239 | 4239 | 4239 | 4239 | 4239 | 4239 | 4239 | 4239 | |
| 1 | 4351 | 4351 | 4351 | 4351 | 4351 | 4351 | 4351 | 4351 | |
| 1 | 4993 | 4993 | 4993 | 4993 | 4993 | 4993 | 4993 | 4993 | |
| 1 | 5398 | 5398 | 5398 | 5398 | 5398 | 5398 | 5398 | 5398 | |
| 1 | 7225 | 7225 | 7225 | 7225 | 7225 | 7225 | 7225 | 7225 | |
| 1 | 7711 | 7711 | 7711 | 7711 | 7711 | 7711 | 7711 | 7711 | |
| 1 | 7718 | 7718 | 7718 | 7718 | 7718 | 7718 | 7718 | 7718 | |
| 1 | 7914 | 7914 | 7914 | 7914 | 7914 | 7914 | 7914 | 7914 | |
| 1 | 8063 | 8063 | 8063 | 8063 | 8063 | 8063 | 8063 | 8063 | |
| λ1 | 1 | 0 | 0 | 0.5 | 0 | 0.5 | 0.33 | 0.25 | |
| λ2 | 0 | 1 | 0 | 0.5 | 0.5 | 0 | 0.33 | 0.25 | |
| 1 − λ1 − λ2 | 0 | 0 | 1 | 0 | 0.5 | 0.5 | 0.34 | 0.5 | |
| Parcel number | |||||||||
| Ranking | |||||||||
| 51,356 | 76,054 | 76,054 | 69,073 | 76,054 | 69,073 | 76,054 | 76,054 | 69,073 | |
| 51,357 | 84,750 | 84,750 | 26,743 | 84,750 | 26,743 | 84,750 | 84,750 | 26,743 | |
| 51,358 | 84,753 | 84,753 | 21,401 | 84,753 | 21,401 | 84,753 | 84,753 | 21,401 | |
| 51,359 | 84,756 | 84,756 | 75,867 | 84,756 | 75,867 | 84,756 | 84,756 | 75,867 | |
| 51,360 | 86,632 | 86,632 | 100,773 | 86,632 | 100,773 | 86,632 | 86,632 | 100,773 | |
| 51,361 | 87,663 | 87,663 | 70,499 | 87,663 | 70,499 | 87,663 | 87,663 | 70,499 | |
| 51,362 | 101,870 | 101,870 | 5119 | 101,870 | 5119 | 101,870 | 101,870 | 5119 | |
| 51,363 | 102,399 | 102,399 | 35,447 | 102,399 | 35,447 | 102,399 | 102,399 | 35,447 | |
| 51,364 | 105,750 | 105,750 | 37,504 | 105,750 | 37,504 | 105,750 | 105,750 | 37,504 | |
| 51,365 | 105,881 | 105,881 | 84,679 | 105,881 | 84,679 | 105,881 | 105,881 | 84,679 | |
| Variable/Solution | N | Minimum | Maximum | Average | Std. Dev. |
|---|---|---|---|---|---|
| Agreg | 51,365 | 0.000 | 0.974 | 0.444 | 0.214 |
| ID | 51,365 | 0.000 | 1.000 | 0.224 | 0.254 |
| Parcels (norm) | 51,365 | 0.000 | 1.000 | 0.002 | 0.008 |
| Index | Skewness | Kurtosis | ||
|---|---|---|---|---|
| Statistic | Standard Error | Statistic | Standard Error | |
| Aggregate | −0.076 | 0.011 | −0.960 | 0.022 |
| ID | 1.565 | 0.011 | 1.721 | 0.022 |
| Parcels (norm) | 74.222 | 0.011 | 7506.939 | 0.022 |
| Agreg1 | EID | Norm | |
|---|---|---|---|
| Agreg | 1 | −0.772 ** | 0.108 ** |
| ID | −0.772 ** | 1 | −0.070 ** |
| Parcels (norm) | 0.108 ** | −0.070 ** | 1 |
| Cluster 1 | Cluster 2 | Cluster 3 | Cluster 4 | Cluster 5 | Cluster 6 | |
|---|---|---|---|---|---|---|
| Average | 0.5292 | 0.3923 | 0.7304 | 0.3251 | 0.5047 | 0.1652 |
| Median | 0.5440 | 0.3961 | 0.7258 | 0.3294 | 0.5052 | 0.1667 |
| Variance | 0.0118 | 0.0129 | 0.0038 | 0.0074 | 0.0066 | 0.0070 |
| Std. Dev. | 0.1087 | 0.1138 | 0.0613 | 0.0858 | 0.0812 | 0.0838 |
| Minimum | 0.2749 | 0.1298 | 0.5754 | 0.0838 | 0.2662 | 0.0000 |
| Maximum | 0.7562 | 0.6603 | 0.9740 | 0.5987 | 0.6850 | 0.3725 |
| Cluster 1 | Cluster 2 | Cluster 3 | Cluster 4 | Cluster 5 | Cluster 6 | |
|---|---|---|---|---|---|---|
| Average | 0.1382 | 0.2730 | 0.0381 | 0.1841 | 0.1084 | 0.5677 |
| Median | 0.0778 | 0.1985 | 0.0315 | 0.1583 | 0.0811 | 0.5730 |
| Variance | 0.0189 | 0.0554 | 0.0006 | 0.0196 | 0.0062 | 0.0700 |
| Std. Dev. | 0.1374 | 0.2353 | 0.0249 | 0.1399 | 0.0786 | 0.2645 |
| Minimum | 0.0040 | 0.0087 | 0.0006 | 0.0031 | 0.0040 | 0.0000 |
| Maximum | 0.5975 | 1.0000 | 0.1698 | 0.6885 | 0.5779 | 1.0000 |
| Index | Best Aggregated Solution | Information Index | ||||||
|---|---|---|---|---|---|---|---|---|
| Skewness | Kurtosis | Skewness | Kurtosis | |||||
| Statistic | Std. Error | Statistic | Std. Error | Statistic | Std. Error | Statistic | Std. Error | |
| Cluster 1 | −0.293 | 0.030 | −0.768 | 0.059 | 1.7758 | 0.0297 | 2.4619 | 0.0594 |
| Cluster 2 | −0.188 | 0.040 | −0.851 | 0.079 | 1.4527 | 0.0396 | 1.6989 | 0.0793 |
| Cluster 3 | 0.315 | 0.024 | −0.444 | 0.048 | 1.8194 | 0.0238 | 4.7914 | 0.0476 |
| Cluster 4 | 0.315 | 0.024 | −0.444 | 0.048 | 0.9609 | 0.0282 | 0.4549 | 0.0565 |
| Cluster 5 | −0.175 | 0.023 | −0.719 | 0.046 | 1.5833 | 0.0232 | 3.0691 | 0.0463 |
| Cluster 6 | −0.101 | 0.023 | −0.719 | 0.046 | 0.0977 | 0.0229 | −0.5687 | 0.0457 |
| Index | Statistics a | df1 | df2 | Sig. |
|---|---|---|---|---|
| Agreg | 73,274.41 | 5 | 18,750 | 0.00 |
| D | 24,021.79 | 5 | 16,874 | 0.00 |
| ID | 13,060.12 | 5 | 16,875 | 0.00 |
Disclaimer/Publisher’s Note: The statements, opinions and data contained in all publications are solely those of the individual author(s) and contributor(s) and not of MDPI and/or the editor(s). MDPI and/or the editor(s) disclaim responsibility for any injury to people or property resulting from any ideas, methods, instructions or products referred to in the content. |
© 2025 by the authors. Licensee MDPI, Basel, Switzerland. This article is an open access article distributed under the terms and conditions of the Creative Commons Attribution (CC BY) license (https://creativecommons.org/licenses/by/4.0/).
Share and Cite
Xavier, A.; Costa Freitas, M.d.B.; Antunes, C. A Compromise Programming Approach for Assessing Territorial Biophysical Suitability: A Case Study. Land 2025, 14, 569. https://doi.org/10.3390/land14030569
Xavier A, Costa Freitas MdB, Antunes C. A Compromise Programming Approach for Assessing Territorial Biophysical Suitability: A Case Study. Land. 2025; 14(3):569. https://doi.org/10.3390/land14030569
Chicago/Turabian StyleXavier, António, Maria de Belém Costa Freitas, and Carla Antunes. 2025. "A Compromise Programming Approach for Assessing Territorial Biophysical Suitability: A Case Study" Land 14, no. 3: 569. https://doi.org/10.3390/land14030569
APA StyleXavier, A., Costa Freitas, M. d. B., & Antunes, C. (2025). A Compromise Programming Approach for Assessing Territorial Biophysical Suitability: A Case Study. Land, 14(3), 569. https://doi.org/10.3390/land14030569