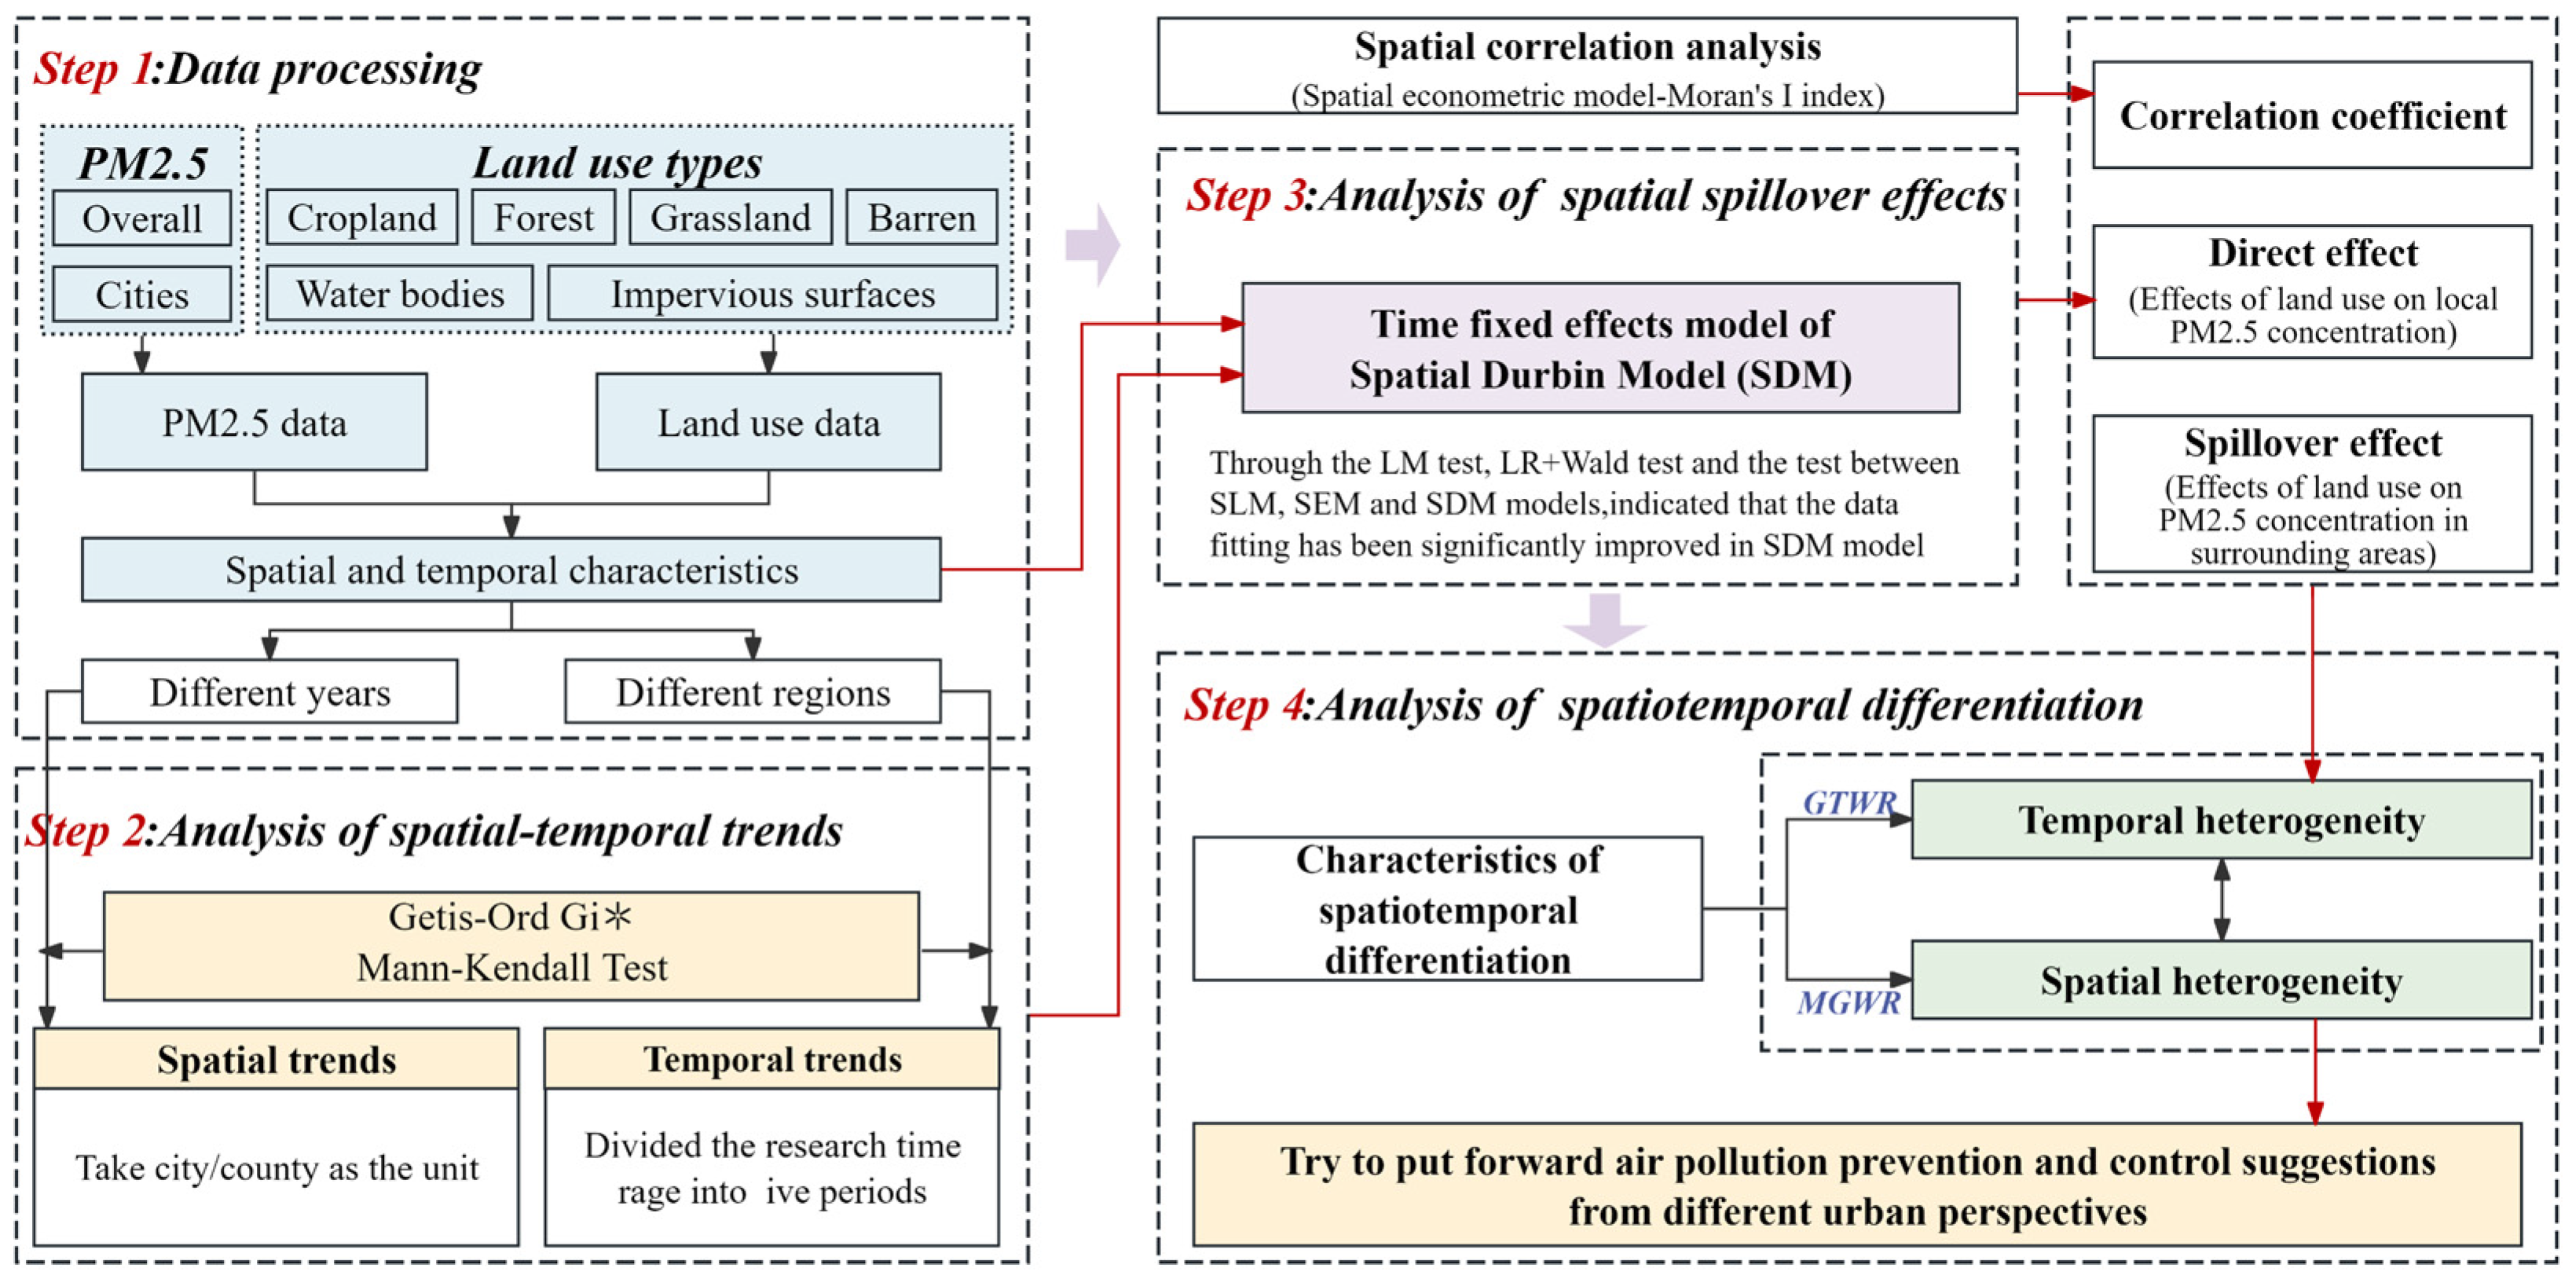
Article

Characteristics of Spatiotemporal Differentiation and Spillover Effects of Land Use Coupled with PM2.5 Concentration from the Perspective of Ecological Synergy—A Case Study of the Huaihe River Ecological Economic Belt

1
School of Architecture and Planning, Anhui Jianzhu University, Hefei 230091, China
2
Anhui Institute of Territory Spatial Planning and Ecology, Hefei 230091, China
*
Author to whom correspondence should be addressed.
Land 2025, 14(3), 568; https://doi.org/10.3390/land14030568
Submission received: 5 February 2025 / Revised: 5 March 2025 / Accepted: 6 March 2025 / Published: 8 March 2025
(This article belongs to the Section Land–Climate Interactions)

Abstract

:
Under the rapid urbanization process, PM2.5 pollution has become an increasingly critical issue. Changes in land-use types will inevitably affect PM2.5 concentration. Meanwhile, the problem of imbalance and inadequacy of regional development remains prominent. This study took the Huaihe River Ecological Economic Belt as the research object, integrating the spatial econometric model with the Geographically and Temporally Weighted Regression (GTWR) and Multiscale Geographically Weighted Regression (MGWR) models, to investigate the spatiotemporal heterogeneity and spillover effect of the association between PM2.5 concentration and land use from 1998 to 2021. The main findings are as follows: (1) PM2.5 concentration in the study area from 1998 to 2021 showed an upward and then a downward trend, taking 2013 as a turning point, with respective magnitudes of 50.4% and 42.1%; (2) land use exerts a significant spillover effect on PM2.5 pollution. Except for grassland and cropland, the direct effect of each land type on PM2.5 pollution exceeds its indirect effect; (3) the influence of land use on PM2.5 pollution exhibits significant spatiotemporal variations. The impact coefficient of forests remains relatively consistent across the entire region, whereas that of cropland, water bodies, and impervious surfaces varies markedly across different regions, particularly in the northeastern and southern cities of the study area. The results of this study may give new ideas for collective governance and joint environmental remediation in different cities and probably provide some basis for the formulation of air pollution control policies and urban land planning.

1. Introduction

Environmental degradation has become a major global environmental issue due to the fast growth of the global economy and the corresponding increase in energy consumption [1]. PM2.5, as a crucial component of air pollutants, can enter the human respiratory system. It has the characteristics of small particle size, large relative surface area, and easy adsorption of toxic and harmful substances, thus making it the largest environmental risk factor [2]. PM2.5 pollution not only affects human health, as various studies have proven that long-term exposure to PM2.5 pollution may lead to cardiovascular, respiratory, and cerebrovascular diseases, but also causes economic losses to society due to increased medical costs and mortality [3,4]. Air pollution is more serious in developing countries than in developed countries, and they are key players in the prevention and control of air pollution [5]. The global distribution of average PM2.5 concentration over the last two decades showed that PM2.5 concentration was on the rise in most developing countries, which was most pronounced in China and India, the two largest developing countries [6]. Meanwhile, China is undergoing rapid land-use transformation, and the resulting changes in ecosystem structure and function have a significant impact on the urban environment and ecology. As the underlying surface of the atmosphere, land-use types and scales can directly affect PM2.5 concentration to varied degrees. On the one hand, the different land types as "source-sink" landscapes directly influence PM2.5 concentration [7,8], while on the other hand, they can modify the regional hydrothermal conditions and induce changes in local climate, which will have an indirect effect on the migration and transformation of PM2.5 [9,10]. In this context, it is particularly essential to adopt corresponding measures to control the production and emission of PM2.5 from the perspective of land use, which is also an important topic in urban research and environmental science research.
The sources of PM2.5 can be categorized into natural and man-made sources. The natural sources include wind-borne dust and soil, forest fires, and so on; man-made sources include primary particulate matter emissions and secondary emissions resulting from atmospheric chemical reactions between primary particulate matter. These primary particulates come from direct emissions such as coal-burning soot, motor vehicle exhaust, energy production, industrial processes, and agricultural fertilization [11]. Based on this, researchers in multidisciplinary fields have studied the relationship between various land-use types and PM2.5 concentration. Infrastructure construction, vehicle exhaust emissions, industrial production, and other activities on impervious surfaces are generally regarded as important sources of PM2.5 pollution. High-density urban construction also reduces natural surfaces, which is not conducive to the deposition and removal of particles [12]. Forests are a major component of the regional land-use pattern, as their vegetation adsorbs particles through the leaf pores or retains the particles on the plants’ surface, directly affecting PM2.5 concentration [13]. Agricultural activities on cropland such as tillage, fertilization, and irrigation may increase soil dust, leading to an increase in PM2.5 concentration [14], but may be reduced by rational agricultural activities and soil management [15]. Water bodies can promote particulate matter deposition by increasing humidity to reduce PM2.5 concentration [16]. Furthermore, studies have been inconsistent on the effect of grassland on PM2.5 concentration. For example, Nguyen et al. [17] showed that there was no significant correlation between grassland and PM2.5 concentration, while Cai et al. [18] found that the contribution of grassland and non-grassland interactions to PM2.5 was much higher than the individual contribution of grassland on a larger scale, suggesting that grassland can regulate PM2.5 concentration. These studies provide a basis for understanding the relationship between land use and PM2.5 concentration.
In previous studies, land-use regression (LUR), the spatial lag model (SLM), and the spatial error model (SEM) have been used to study the relationship between land use and PM2.5 pollution [19,20,21]. Meanwhile, ordinary least square (OLS) is a classical linear regression method applicable to the direct relationship between explanatory variables and independent variables [22,23]. However, for spatial data, OLS ignores its non-stationarity, which may lead to unreasonable conclusions. Therefore, some scholars have proposed the geographically weighted regression (GWR) model to solve this problem, which has been widely used in existing studies [24,25]. Nevertheless, the heterogeneity and non-stationarity between land use and air pollutants in different regions and at different times could not be considered in the above models. In contrast, the Geographically and Temporally Weighted Regression (GTWR) and Multiscale Geographically Weighted Regression (MGWR) models were optimized on the basis of GWR, which solved the problem of local and temporal changes in variables and could reveal the effects of global variables at regional scales and multiple time series [26,27]. Under the influence of long time series of land cover pattern changes, PM2.5 pollution shows different responses, and there are some limitations in the spatiotemporal continuity of the existing studies. Currently, there is a lack of research on the spatiotemporal characteristics of the coupling between land use and PM2.5 concentration. Therefore, combining the spatial econometric model with the GTWR and MGWR models can effectively analyze the response of the regional PM2.5 concentration to land use, which can help to more accurately explain the spatiotemporal heterogeneity of the linkage between the two.
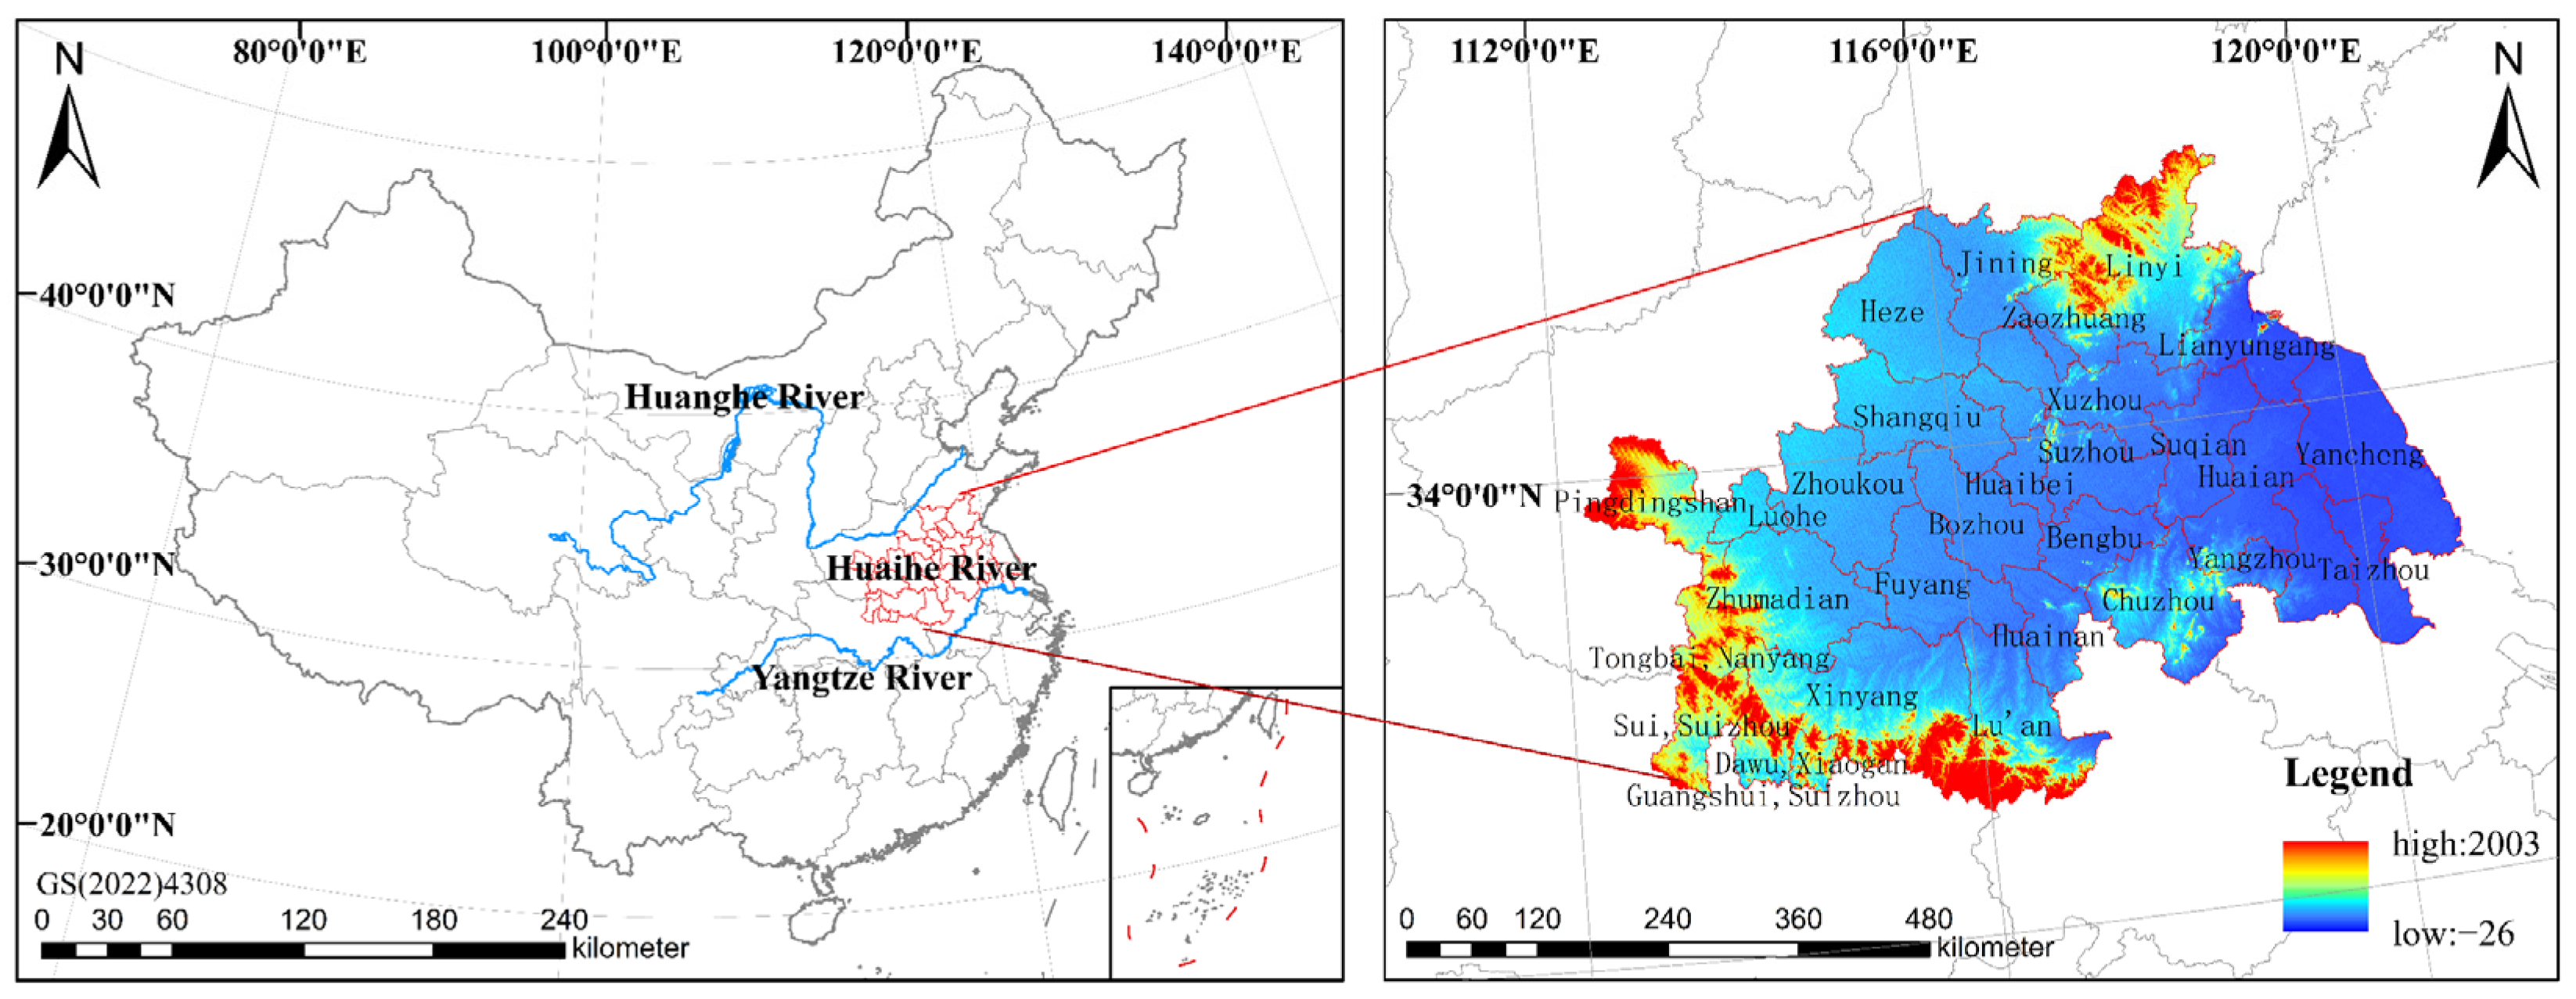
The Huaihe River Ecological Economic Belt consists of 5 provinces and 29 cities (counties), featuring distinct economic, political, and cultural differences. It serves as an essential ecological security barrier for China’s ecological civilization construction and high-quality economic development, as well as a significant area for territorial space development [28,29]. Compared with the Yangtze River Delta, the Shandong Peninsula, and the Central Plains urban clusters around the basin, the Huaihe River Ecological Economic Belt has lacked policy impetus in recent years and presented obvious problems such as unbalanced, inadequate, and uncoordinated regional development [30]. This region has a high population density and rapid urbanization process. For a long time, under the economic priority development mode, industrial and agricultural non-point sources of pollution in the Huaihe River Basin have been prominent, with large changes in land cover, especially the replacement of vegetation cover by artificial buildings, resulting in a decrease in the surface’s ability to absorb and block dust and a serious situation of urban air pollution [31]. Given this, from the perspective of ecological coordination, this study selected the Huaihe River Ecological Economic Belt, which is a national key development area with an emphasis on ecological environment governance, as the research area. It utilized high-precision land-use data and PM2.5 concentration data from 1998 to 2021, based on the long time-series remote sensing inversion of PM2.5 concentration data, and the relationship between PM2.5 concentration and land use was revealed by using the spatial econometric model, the GTWR model, and the MGWR model. This paper addresses the following issues: (1) the effects of different land-use types on PM2.5 concentration and its spatial spillover effect; (2) the spatiotemporal heterogeneity effects of land use on PM2.5 pollution; (3) recommendations for the planning of rational urban layout and sustainable development. The findings of this study can reveal the role of land use in PM2.5 prevention and control, which is of great significance for strengthening the joint environmental remediation among cities in the Huaihe River Ecological Economic Belt, trying to provide a basis for the formulation of air pollution prevention policies and urban land planning for urban clusters in the Huaihe River Ecological Economic Belt, so as to promote the construction of ecological civilization and social development.

2. Materials and Methods

2.1. Study Area

In the Development Plan of the Huaihe River Ecological Economic Belt issued by the National Development and Reform Commission of the People’s Republic of China in 2018, twenty-five prefecture-level cities and four counties in the five provinces of Jiangsu, Shandong, Henan, Anhui, and Hubei, which the main stream and the first-level tributary of the Huai River flow through, along with the Yishusi River basin flow, are planned to be the Huaihe River Ecological Economic Belt, with a planned area of 243,000 square kilometers (Figure 1) [28]. The Huaihe River Ecological Economic Belt traverses the Huanghe-Huaihe Plain and connects the central and eastern parts of China (31°01′~36°13′ N, 112°14′~120°54′ E). It is located in the north–south climate transitional zone, where the north of the Huaihe River belongs to the temperate monsoon climate zone and the south of the Huaihe River belongs to the subtropical monsoon climate zone. The precipitation is low in the south and north, and the temperature is high in the east and low in the west, with an average annual precipitation of 992.88 mm and an average annual temperature of 13.7 °C. The vegetation in this region mainly consists of deciduous broad-leaved forests and evergreen broad-leaved forests, with rich biodiversity, a vast plain area, and excellent natural endowments [32]. In the context of rapid urbanization and industrialization, the problems of regional industrial pollution and agricultural non-point source pollution are prominent. In 2021, the ambient air quality rate of some major cities in the region (such as Linyi City) was only 64.1%. At the same time, profound changes have occurred in land use, with the area of impervious surfaces increasing rapidly and the area of ecological land decreasing.

2.2. Data Source

2.2.1. PM2.5 Data and Validation

The spatial distribution data of PM2.5 were obtained from the China regional estimation dataset (V4.CH.02) of the Atmospheric Composition Analysis Group (ACAG). This dataset was developed by Van Donkelaar et al. [33] at Dalhousie University based on National Aeronautics and Space Administration (NASA)’s moderate resolution imaging spectroradiometer (MODIS), multi-angle imaging spectroradiometer (MISR), and wide field-of-view ocean observing sensor (SeaWiFS) satellite monitors, estimated by the EOS-Chem (http://geos-chem.org/, accessed on 20 March 2024) atmospheric chemical transport model to obtain the surface PM2.5 concentration. The raster dataset used PM2.5 data from global ground-based monitoring to calibrate by the geographically weighted regression (GWR) model, with a spatial resolution of 0.01 × 0.01°, which has been cited by many research institutes in China [34,35].
China established a nationwide air pollution monitoring network at the end of 2012, but a few monitoring stations, a short construction period, and a lack of long-term observational data do not yet cover the span of data needed for this study. Therefore, satellite remote sensing inversion data are still an effective means to assess the PM2.5 pollution level in large regions. The ground stationary monitoring data of PM2.5 were obtained from the China National Environmental Monitoring Centre (http://www.cnemc.cn/, accessed on 20 March 2024). To verify the accuracy of the PM2.5 satellite-derived remote sensing dataset (V4.CH.02) used in this study, it was linearly fitted to the ground-based stationary observations collected from 336 cities in China in 2015, with a fitting result R² of 0.79. It proved that this dataset has good accuracy and can be applied to the study of PM2.5 in China (Figure 2). Similar conclusion was reached by He et al. [36] and Lu et al. [7]. Therefore, based on the dataset (V4.CH.02), the annual average of PM2.5 concentration was chosen as the analysis index in this study. The ArcGIS 10.7 software was used to reproject and crop the raster PM2.5 data of the whole of China from 1998 to 2021 to extract the PM2.5 concentration data of the Huaihe River Ecological Economic Belt each year. Then, the spatial analyst tool was used to obtain the annual average PM2.5 concentration in different counties, cities, and land categories.

2.2.2. Land-Use Data

The land-use data were selected from the annual China Land Cover Dataset (CLCD) produced by the team of Professors Jie Yang and Xin Huang from Wuhan University based on 335,709 Landsat images on Google Earth Engine. The dataset is based on all available Landsat data on GEE, constructs spatiotemporal features, combines with the random forest classifier to obtain the classification results, and proposes a post-processing method that includes spatiotemporal filtering and logical inference to further improve the spatiotemporal consistency of the CLCD. The biggest advantage of this dataset is the land-use classification results of 30 m per year for 30 consecutive years. The data selected for this study began in 1998, and the landscape types in the study area were combined into six categories: cropland, forests (including shrubs), grassland, water bodies (including wetland), and barren and impervious surfaces with reference to the standard of the current land-use classification.

2.3. Methods

The research framework of this study is shown in Figure 3. Firstly, the spatiotemporal characteristics of PM2.5 concentration and land-use pattern were analyzed, and Moran’s I index was used to verify whether PM2.5 concentration had spatial autocorrelation before constructing the spatial econometric model. By comparing the spatial lag model (SLM), spatial error model (SEM), and spatial Durbin model (SDM), the optimal model for the spillover effect of land use on PM2.5 concentration was selected. Finally, the spatial and temporal differentiation characteristics of the land-use effect on PM2.5 concentration were analyzed by using the GTWR model and MGWR model optimized on the basis of the GWR model.

2.3.1. Distribution Characteristic Analysis

The spatial aggregation characteristics of PM2.5 concentration in the study area were explored using Getis-Ord Gi*-based hot-spot analysis, which is used to identify the spatial clustering of low and high values with statistical significance through all the values in the local area, namely cold-spots and hot-spots. Its calculation model is as follows [37]:
G i * = j = 1 n   W i , j x j X ¯ j = 1 n   w i , j j = 1 n   x j 2 n X ¯ 2 n j = 1 n   w i , j 2 j = 1 n   w i , j 2 n 1
X ¯ = j = 1 n   x j n
where n is the total number of spatial data units; x j is the attribute value of the data unit j ; W i , j is the spatial weight between the data units i and j , indicating the spatial adjacency of i and j . Getis-Ord G i * statistics on PM2.5 concentration receive a z score and p value, the z score (i.e., G i * ) is statistically significant when the absolute value is greater than 1.65, and the higher value represents the higher degree of aggregation.
For the trend of PM2.5 concentration, this study used a combination of Theil–Sen median slope estimation and Mann–Kendall test to analyze the long-term series data of PM2.5 concentration. The Sen slope estimation is calculated by the following formula:
β = M e d i a n x j x i j i     j > i
where M e d i a n () represents taking the median value; if β is greater than zero, it indicates an increasing trend in PM2.5 concentration and conversely a decreasing trend.
The Mann–Kendall (MK) test is a nonparametric test for trends in time series, originally proposed and developed by Mann and Kendall [38], which does not require the measured values to follow the normal distribution, is not affected by missing values and outliers, and is suitable for the trend significance test of long time-series data. The procedure is as follows: for the sequence Xt = x1, x2, …, xn, first determine the relationship between the magnitude of xi and xj in all dual values (xi, xj, j > i) (set to S). Make the following assumptions: H0, the data in the series are randomly ordered, i.e., there is no significant trend; H1, there is an upward or downward trend in the series. The test statistic S is calculated as follows (in the formula for Z, when S > 0, the numerator is S − 1):
S = i = 1 n 1   j = i + 1 n   s g n x j x i
where s g n () is the sign function, calculated by the following formula:
s g n x j x i = + 1       x j x i > 0 0       x j x i = 0 1       x j x i < 0
The trend test is performed using statistic Z, and the Z is calculated as follows:
Z = S V a r S       ( S > 0 ) 0       ( S = 0 ) S + 1 V a r S       ( S < 0 )
where V a r is calculated by the following formula:
V a r S = n n 1 2 n + 5 18
where n is the amount of data in the sequence; m is the number of knots (recurring data sets) in the sequence; t i indicates the number of duplicates in group i.

2.3.2. Spatial Correlation and Spillover Analysis

Classical panel data models do not take into account the effects between study units in the cross-sectional dimension, ignoring the geographic dependence and chain reactions that exist between cities, which inevitably leads to biased estimation results [39]. Therefore, this paper adopts the spatial lag model (SLM), spatial error model (SEM), and spatial Durbin model (SDM) for panel data to analyze spatial correlation and spillover effects.
SLM can not only reflect the interaction between the change in PM2.5 concentration and the influencing factors in one city but also the influence of PM2.5 concentration in one city on the change in PM2.5 concentration in other cities. The formula is as follows:
y i t = ρ j = 1 n   W i j y t + β j X i t + α i + γ t + μ i t + δ
where W i j is the spatial weight matrix, and ρ is the spatial lag coefficient. We chose the spatial weight matrix of geographic proximity considering the spatial dependence that may result from the spatial location of the study object.
SEM takes into account the potential spatial autocorrelation of the independent error terms, by including the spatial lag term of the dependent variable. The equation is given below:
y i t = λ j = 1 n   W i j φ i t + β j X i t + α i + γ t + μ i t + δ
where λ is the spatial error coefficient and φ denotes the spatial autocorrelation error term.
SDM is a more commonly used model that takes into account both the endogenous spatial dependence of the dependent variable (Y) and the exogenous spatial dependence of the dependent variable (X). The formula is as follows:
y i t = ρ j = 1 n   W i j y t + β j X i t + λ j = 1 n   W i j φ i t + α i + γ t + μ i t + δ
Panel data models include fixed effect (FE) and random effect (RE) models, and the choice of RE or FE for the models in the study requires the use of the Hausman test. The H-statistic rejects the original hypothesis at the 1% significance level. If the hypothesis is rejected, the model has FE, and it is more reasonable to build an FE model than an RE model; if it is not rejected, it is more reasonable to choose RE.

2.3.3. Temporal Heterogeneity Analysis

Changes in land use and PM2.5 concentration are panel data with multiple time series, while changes in land-use types do not immediately cause changes in PM2.5 concentration, and their effects may have some lagged effects [40]. The geographically weighted regression model (GWR) only considers the spatial relationship of individual time profile data, which is insufficient when studying time-series data, and the spatiotemporal geographically weighted regression model (GTWR) solves this problem. Therefore, in order to further investigate the dynamic time-varying relationship between PM2.5 concentration and land use over multiple time series, this paper adopts the spatiotemporal geographically weighted regression model (GTWR) to optimally explain the temporal heterogeneity of land use and PM2.5 concentration, and the formula is as follows:
Y i = β 0 u i , v i , t i + k = 1 m   β k u i , v i , t i x i k + ε i
where u i , v i , t i is the sample point I with spatial coordinates and time stamp, m is the number of samples, ε i is the random error term, and β k u i , v i , t i is the estimated mean local regression coefficient. In order to make the changes in the time series more visible, this study averaged the regression results for every 5 years to compare the changes in the driving mechanisms on a 5-year scale.

2.3.4. Spatial Heterogeneity Analysis

The OLS model can reflect the global relationship of explanatory variables in the model but cannot reveal local changes between the variables. The MGWR model is a localized spatial relationship model that reflects the spatial heterogeneity of the relationships between air pollutants and geographic variables, which can compensate for the shortcomings of the OLS model. The MGWR model was developed on the basis of the GWR model, which solves the problem of local changes in variables and can reveal the impact of global variables at the regional scale [41,42]. Moreover, the MGWR model allows the consideration of multiscale space, thereby yielding separate bandwidths through the relationship between the PM2.5 concentration and different independent variables.
Land use varies among regions and is potentially related to the spatial variation pattern of PM2.5 concentration. In addition, there may be differences in the effects of land use on PM2.5 concentration. Therefore, this study adopted the MGWR model to further explain the spatial heterogeneity of land use and PM2.5 concentration. The MGWR model can be expressed as follows:
y i = β 0 u i , v i + k = 1 m   β b w k u i , v i x i k + ε i
where u i , v i are the coordinates of the sample points, β b w k is the explanatory variable for the regression coefficients k , and m is the number of sample points. b w k is the bandwidth, and ε i is the error term of the model.

3. Results

3.1. Spatial and Temporal Distribution and Variation in PM2.5

3.1.1. Characteristics of Spatial and Temporal Distribution of PM2.5

According to China’s ambient air quality standard (https://english.mee.gov.cn/Resources/standards/Air_Environment/quality_standard1/201605/t20160511_337502.shtml, accessed on 15 April 2024), the average PM2.5 concentration limit of level I is 15 μg/m3, and the limit of level II is 35 μg/m3. From the variation in the annual average PM2.5 concentration in the Huaihe River Ecological Economic Belt from 1998 to 2021, it can be seen that the annual average PM2.5 concentration in the study area since 1998 had always been higher than the annual average limit of level II, which failed to meet air quality standards, showing that the air pollution situation in the study area was serious (Figure 4). The annual mean PM2.5 concentration in the study area fluctuated from 1998 to 2013, increasing from 44.67 μg/m3 in 1998 to a peak of 67.17 μg/m3 in 2013, an increase of 50.4%. From 2013 to 2021, the overall decline was 42.1%.
Statistics were gathered for different cities in different provinces, using 1998, 2003, 2008, 2013, 2018, and 2021 as examples. As can be seen in Figure 4, Xuzhou City in Jiangsu Province, cities in Shandong Province, Huaibei City, and Suzhou City in Anhui Province, and cities in Henan Province, except Xinyang City and Tongbai County, exceeded the average annual concentration of the Huaihe River Ecological Economic Belt in the selected years. In 1998, 96.6% of the study area exceeded the annual mean limit of level II (35 μg/m3), while 72.4% exceeded the limit in 2021.
The pre-processed raster data of PM2.5 concentration in the Huaihe River Ecological Economic Belt were stretched and rendered using ArcGIS 10.7 software. Adopting the range of all the values in the data and stretching them to conform to the range of the data types, they were visualized linearly from the lowest to the highest values and analyzed by year. The spatial distribution of annual average PM2.5 concentration in different regions of the Huaihe River Ecological Economic Belt from 1998 to 2021 was analyzed, with results shown in Figure 5. Cities located on the northwest side, such as Heze City, Jining City, and Shangqiu City, as well as in the central inland north region, such as Zhoukou City and Luohe City, had higher PM2.5 concentrations. Low PM2.5 concentrations were mainly distributed in the southern periphery of the study area, including Yancheng City, Chuzhou City, Suizhou City, Dawu County, Tongbai County, and other counties (cities).
The cold/hot-spot analysis of annual average PM2.5 concentration in six selected years revealed that PM2.5 pollution showed significant spatial autocorrelation, basically maintaining the distribution pattern of high in the northwest and low in the southwest (Figure 6). Taking the year 2013 as the node, the hot-spot areas had obvious changes. Specifically, from 1998 to 2013, the hot-spot area spread around Jining, Zaozhuang, and Heze in the northern region, which were densely populated, with rapid industrialization and modernization, and had more polluting emissions caused by urban expansion, resulting in a higher concentration of air pollutants such as PM2.5; the cold-spot area was clustered in the county cities at the southwestern edge of the Huaihe River Ecological Economic Belt, with the scope decreasing year by year. The hot-spot area gradually shifted and spread to the west side from 2013, while the high-value area of the hot-spot decreased, and the spatial scope expanded significantly. By 2021, the hot-spot area was mainly spreading in all directions, with the northwestern and central inland northern cities as the center; the cold-spot area showed a trend of spreading from the edge of the southwestern side to the interior of the northeastern side, with four county cities as the center. It was found that the county-level cities had a relatively slow urbanization process, and the pollutant emissions were less significant. Moreover, these areas were mainly forests, which can significantly weaken PM2.5 pollution.

3.1.2. Temporal and Spatial Trends of PM2.5

To test the trend of PM2.5 concentration, the Sen trend of PM2.5 concentration was calculated from 1998 to 2021, and the Mann–Kendall trend was used to test the significance of the change in PM2.5 concentration. The bilateral trend test was used to determine the trend significance at a given significance level α of 0.05. As can be seen in Figure 7, in the classification of years divided into five years, the PM2.5 concentration in the Huaihe River Ecological Economic Belt mainly showed an increasing trend from 1998 to 2008, which was particularly significant in the northeastern cities represented by Yancheng, Yangzhou, and Taizhou, as well as the southwestern cities such as Xinyang, Fuyang, and Suizhou. The PM2.5 concentration in the study area from 2008 to 2021 mainly showed a decreasing trend, and the regions with a significant increasing trend between 1998 and 2008 showed a significant decreasing trend between 2008 and 2021. This indicated that the combined effects of national policies and local strategies have effectively reduced PM2.5 pollution levels to a large extent.

3.2. Spatial and Temporal Characteristics of Land Use

According to the land cover pattern, the urban agglomeration of the Huaihe River Ecological Economic Belt was dominated by cropland, forests, and impervious surfaces. In this area, cropland covered a vast area, while grassland and barren areas were relatively small, of which forest land was concentrated in the south and east side of the central inland; impervious surfaces were concentrated and dispersed around the city, which were mainly reflected in Linyi, Xuzhou, Huai’an, Zaozhuang, Fuyang and so on; water bodies had the Huaihe River as the main stream, relying on important lakes such as Hongze Lake, Nansi Lake, Gaoyou Lake, and other important lakes (Figure 8).

3.3. Analysis of PM2.5 Response to Land Use

3.3.1. Spatial Correlation Analysis

The correlation coefficients between the PM2.5 concentration and the area of each land-use type from 1998 to 2021 were calculated, as shown in Table 1. It can be found that the impervious surfaces, cropland, and grassland were positively correlated with the PM2.5 concentration. With the progress of urbanization, the rapid expansion of urban development land has gathered a large number of industrial activities, energy emissions, and vehicle exhaust emissions generated by human activities, which directly lead to an increase in PM2.5 concentration. At the same time, precursors such as NOX, SO2, and VOCs released by construction and farming activities chemically react to generate secondary particulate matter such as nitrates and sulfates, which are the main components of PM2.5 with a wider range of pollution [43]. In addition, PM2.5 concentration was significantly negatively correlated with forests, water bodies, and barren areas. Compared with other land-use types, the correlation between PM2.5 concentration with impervious surfaces and forests was most obvious.
Before the spatial econometric analysis, the spatial autocorrelation test was carried out on the research objects. Table 2 shows the Moran’s I index of PM2.5 concentration in each year, which was calculated based on a 0–1 spatial weight matrix. It can be observed that the Moran’s I index of PM2.5 concentration was significantly positive, indicating that the PM2.5 concentration of cities in the Huaihe River Ecological Economic Belt had a significant spatial agglomeration phenomenon and spatial correlation.

3.3.2. Analysis of Spatial Spillover Effects

The LM test and LR + Wald test indicated that the time-fixed effects model of the spatial Durbin model (SDM) should be selected. The results of the model estimation are shown in Table 3; in OLS model estimation, R2 is 0.31, while in SLM, SEM, and SDM model estimation, R2 is 0.57, 0.74, and 0.87, respectively, which shows that the data fitting significantly improved in the SDM model, the significance between the independent variables and the dependent variable was high, the model had a strong explanatory power, and all of them passed the confidence test, except for barren areas. From the spatial rho/lambda coefficients, the spatial autocorrelation coefficients of the three models were significant and positive, indicating a significant positive spatial spillover effect of land-use change on PM2.5 concentration.
The SDM model’s results showed that the direct and indirect effects of impervious surfaces on PM2.5 pollution were both positive. The direct effect (0.099) was slightly higher than the indirect effect (0.097), indicating that the impervious surfaces will not only significantly exacerbate PM2.5 pollution within the region but also exacerbate the neighboring region’s PM2.5 pollution through the spatial spillover effect.
The direct and indirect effects of forest land and water bodies on PM2.5 pollution were both negative, indicating that forest land and water bodies had a significant positive effect on reducing PM2.5 concentration, the direct effect of forest land (−0.020) was slightly higher than the indirect effect (−0.014), the direct effect of water bodies (−0.015) was slightly higher than the indirect effect (−0.011), and the direct and indirect effects of water bodies were both lower than those of woodland. There was a positive correlation between grassland and PM2.5 concentration, and both direct and indirect effects were positive. The direct effect of grassland (0.008) was slightly lower than the indirect effect (0.014).
The mechanism of cropland’s influence on PM2.5 concentration was more complicated. Its direct effect was −0.116, which indicated that cropland can effectively reduce PM2.5 pollution within the region. However, its indirect effect was 0.173, which indicated that cropland had an exacerbating effect on PM2.5 pollution in the neighboring region. Furthermore, the direct effect of cropland (−0.116) was higher than that of forest land (−0.020).

3.3.3. Analysis of Temporal Heterogeneity

Through model comparison, the fit of the GTWR model was much better than the OLS and GWR models (Table 4). The 24-year time series was divided into five periods, 1998–2003, 2003–2008, 2008–2013, 2013–2018, and 2018–2021, in comparison with the overall time span. Since the grassland and barren areas were too small to affect the model analysis, these two types of land-use data were excluded, while the remaining four land-use types were investigated. The results of the GTWR are shown in Figure 9; in the central and northwest of the Huaihe River Ecological Economic Belt, cropland had the most significant impact on PM2.5 concentration and mainly showed a negative effect. With time, the scope and region of the negative influence gradually expanded, with Suzhou, Xinyang, Bozhou, and other regions showing significant performance, while areas with insignificant negative influence were mainly concentrated in the periphery of the Huaihe River Ecological Economic Belt.
The overall effect of forests on PM2.5 concentration across the Huaihe River Ecological Economic Belt was mainly positive. At the early stage of the study period, the weakening effect of forests on PM2.5 concentration in the study area was low and showed aggravating effects in the northeastern and southwestern cities, such as Suzhou, Zaozhuang, and Zhumadian. Over time, the scope and intensity of the positive effects of forests on decreasing PM2.5 concentration gradually expanded, while the scope and extent of the negative effects gradually decreased. The cities such as Shangqiu, Lu’an, Pingdingshan, and Luohe all showed significant weakening effects during the period, while weaker effects were observed among cities in the central part, such as Bozhou, Suzhou, and Zaozhuang. Water bodies had a significant negative effect on PM2.5 concentration in the northern cities including Linyi, Lianyungang, and Jining, as well as the south-central cities such as Huainan, Zhoukou, and Fuyang, with a gradually expanding overall range of effect. For the southern and central inland regions of the Huaihe River Ecological Economic Belt, such as Bozhou, Bengbu, Suqian, and Xinyang, the intensified impact was more significant over more years.
In addition, the model regression results show that the effects of impervious surfaces on PM2.5 concentration were all positively correlated. Compared with 2013–2018, the influence of impervious surfaces on PM2.5 concentration changed significantly after 2018, indicating that with the development plan of the Huaihe River Ecological Economic Belt, the urban pattern had changed, with an increase in the intensification degree of impervious surfaces on PM2.5 concentration. Eventually, it mainly concentrated in the northern part of the Huaihe River Ecological Economic Belt, dominated by Zaozhuang, Suzhou, Xuzhou, and Linyi, and the southwestern region dominated by Zhoukou, Zhumadian, and Huainan, which were mainly characterized by a rapid urbanization process.

3.3.4. Analysis of Spatial Heterogeneity

Taking 2021 as an example, the PM2.5 concentration was selected as the dependent variable, and the area of each land-use type at the 10 km scale was used as the independent variable. Since the grassland and barren areas had excessive null values at the 10 km scale, which affected the model analysis, these two types of data were excluded to pre-processing the data. Table 5 shows the general statistics of the estimated coefficients of the MGWR model. The coefficients of forests and water bodies were mainly negative, indicating that the increase in forests and water bodies was conducive to the decrease in PM2.5 concentration. The coefficients of cropland were evenly distributed, indicating that cropland had both “source” and “sink” effects on PM2.5 concentration, which can effectively reduce PM2.5 pollution as a means of production but also aggravate the pollution due to the presence of straw burning, land exposure, and dust problems during the sowing season. The coefficients of impervious surfaces were mainly positive, indicating that the increase in the area of impervious surfaces was associated with the increase in PM2.5 concentration.
For the results of the model, data with a significance level of less than 0.05 were screened out and visualized in ArcGIS 10.7. Figure 10 shows the specific spatial distribution of the MWGR coefficients of the above four variables. As can be seen from Figure 10a, in the southeastern peripheral areas of the Huaihe River Ecological Economic Belt, such as the western part of Pingdingshan, Suqian, and the border between Huai’an and Yangzhou, the cropland had positive effects on the PM2.5 concentration, while the southern, northeastern sides, and inland areas of the region such as the borders of Shangqiu, Huaibei, Bozhou, and Zhoukou showed a negative impact. Forests showed significant and uniform negative effects in the whole range (Figure 10b), with a trend of slowing down the effects from southwest to northeast. The overall coefficient of water bodies was close to zero, indicating that the impact of water bodies on PM2.5 concentration was insensitive and weak for the whole region. In terms of subregions, the negative effects were mainly concentrated in the northeast side of the Huaihe River Ecological Economic Belt, mainly in Suqian, the border between Xuzhou and Lianyungang, and the west side of Huai’an, while the southern edges of the region, such as Suizhou, and the south side of Xinyang and Lu’an exhibit significant positive impacts (Figure 10c). As shown in Figure 10d, the impervious surfaces presented significant positive effects on PM2.5 concentration, especially in the counties under Suizhou and Xiaogan, the southern edge of Lu’an, and the border between Suqian and Huai’an.
The bandwidth directly reflects the different scales of action of different variables, and the bandwidth of each variable was derived from the MGWR model and model diagnosis (Table 6). The bandwidth of each variable was diagnosed from the MGWR model (Table 6), showing that the bandwidth of forests was the largest (561,198.32 m), indicating that the scale of action of forests was larger than that of other land-use types, and the coefficients of forests were relatively stable in space. The bandwidth of impervious surfaces was the smallest (24,851.41 m), indicating that the scale of action of impervious surfaces was small, and the change in PM2.5 concentration with impervious surfaces showed obvious spatial heterogeneity. As can be seen from Table 6, compared to the GWR model that only used a single bandwidth for the variables, the MGWR model can use different bandwidths to compute the coefficients of the variables; therefore, better-fitting results can be obtained. Diagnostic comparisons between the MGWR and GWR models showed that the MGWR model had better results in terms of AICc, R2, and (Adj.) R2.

4. Discussion

4.1. Effects of Land Use on PM2.5 Concentration

Different land-use types have different effects on PM2.5 concentration. Specifically, the results of the spatial econometric model indicated that PM2.5 concentration was significantly positively correlated to impervious surfaces on the whole scale of the Huaihe River Ecological Economic Belt. Zhang et al. [44] identified five major sources of PM2.5 through the positive matrix factorization (PMF) model, which are secondary aerosol and coal combustion, vehicles, industry, biomass combustion, and dust, while the rapid expansion of construction land will significantly increase the production of these substances. Hu et al. [45] reached a similar conclusion. The rapid expansion of impervious surfaces is an important source of PM2.5. Compared with other land types, impervious surfaces were more frequently disturbed by human activities. With the rapid development of urbanization, the rapid expansion of urban areas and intense industrial activities, coupled with huge energy consumption and pollutants such as vehicle exhaust from human activities, directly lead to an increase in PM2.5 concentration [46,47]. Similarly, Zhao et al. [12] concluded that industrial activity was most likely to contribute to higher PM2.5 pollution due to the fact that most of the production activities generate pollutant emissions, while street and transportation, logistics, and warehouse land generate vehicle exhaust, leading to an increase in PM2.5 pollution. The results of this study indicated that PM2.5 concentration was negatively correlated with forests and water bodies. The surface stomata of leaves and stems of trees can adsorb fine particulate matter in the air and reduce wind speed, which promotes the deposition of suspended particles in the air, thus having an extremely important dust-blocking effect [48]. Water bodies can reduce PM2.5 concentration through a variety of mechanisms such as increasing humidity, regulating microclimate, and promoting particle sedimentation. However, the specific effects are also influenced by factors such as geographical characteristics, meteorological conditions, and other human activities [49]. Lu et al. [10] pointed out that the “source” effect of water bodies will become apparent with the increase in the area, which may be due to water bodies promoting the hygroscopic growth of PM2.5. In this study, PM2.5 concentration was negatively correlated with cropland. Cropland is also a means of production, which can effectively reduce the PM2.5 concentration through a large number of crop vegetation leaves and stems’ surface porosity retention and adsorption of dust and particulate matter. However, some studies have shown that cropland also leads to increased PM2.5 pollution [50,51]. Therefore, the effect of cropland on PM2.5 concentration depends on the intensity and mode of agricultural activities.
This study has shown that PM2.5 concentration was positively correlated with grassland. Many scholars have studied that grassland can absorb and reduce PM2.5 concentration [10,52] and that vegetation on grassland can adsorb fine particles and stabilize soils, reduce bare ground, and improve microclimate conditions. However, Nguyen et al. [17] pointed out that grassland could not effectively adsorb suspended particles and might even be positively correlated with PM2.5 concentration under certain conditions, which is similar to the results of this study. According to the regression results, barren areas were not sensitive to the effect of PM2.5 concentration in this study. The possible reason for this is that grassland and barren areas occupied a small proportion of the land area in the Huaihe River Ecological Economic Belt, being relatively dispersed and fragmented and susceptible to being affected by neighboring landscapes, especially areas with a high concentration of pollution. This finding is consistent with the conclusion proposed by Wang et al. [53], who suggested that fragmented watersheds and wetlands weakened the role of “sink landscapes” regarding PM2.5 and instead increased PM2.5 concentration levels in the presence of other landscapes. Therefore, fragmented grassland and barren areas weakened their effect on reducing PM2.5 concentration and may lead to an increase in PM2.5 concentration under the influence of other landscapes and land. To determine their relationship with PM2.5 concentration, more accurate PM2.5 concentration data and higher resolution land cover data are needed for further research.
The impacts of impervious surfaces, forests, cropland, grassland, and water bodies on PM2.5 pollution have significant spatial spillover effects, and the direct effects of each category on PM2.5 pollution were greater than the indirect effects, except for grassland and cropland. Specifically, impervious surfaces can significantly exacerbate PM2.5 pollution in the region and its neighboring areas, while forests and water bodies can reduce that, with forests having a higher direct reduction effect on PM2.5 than that of water bodies. The influence of cropland on PM2.5 pollution was complex, both as a pollution “source” and “sink” [54], reducing PM2.5 pollution within the region but aggravating it in the neighboring area. This is probably due to the existence of straw burning and agricultural land tilling dust, etc. The incineration of crop residues emits carbon dioxide, carbon monoxide, non-methane hydrocarbons, nitric oxide, nitrogen dioxide, and atmospheric particulate matter, etc. The SO2 and NOX produced can be oxidized into secondary inorganic/organic aerosols (SIAs/SOAs), which become an important source of PM2.5 generation [43]. Through the effect of wind speed, coupled with the fact that most of the idle cropland does not differ from the barren areas, will in turn exacerbate PM2.5 pollution in the local and neighboring regions, which is similar to the results of the study by He et al. [36]. Therefore, regional collaborative governance is of great significance for controlling PM2.5 pollution.

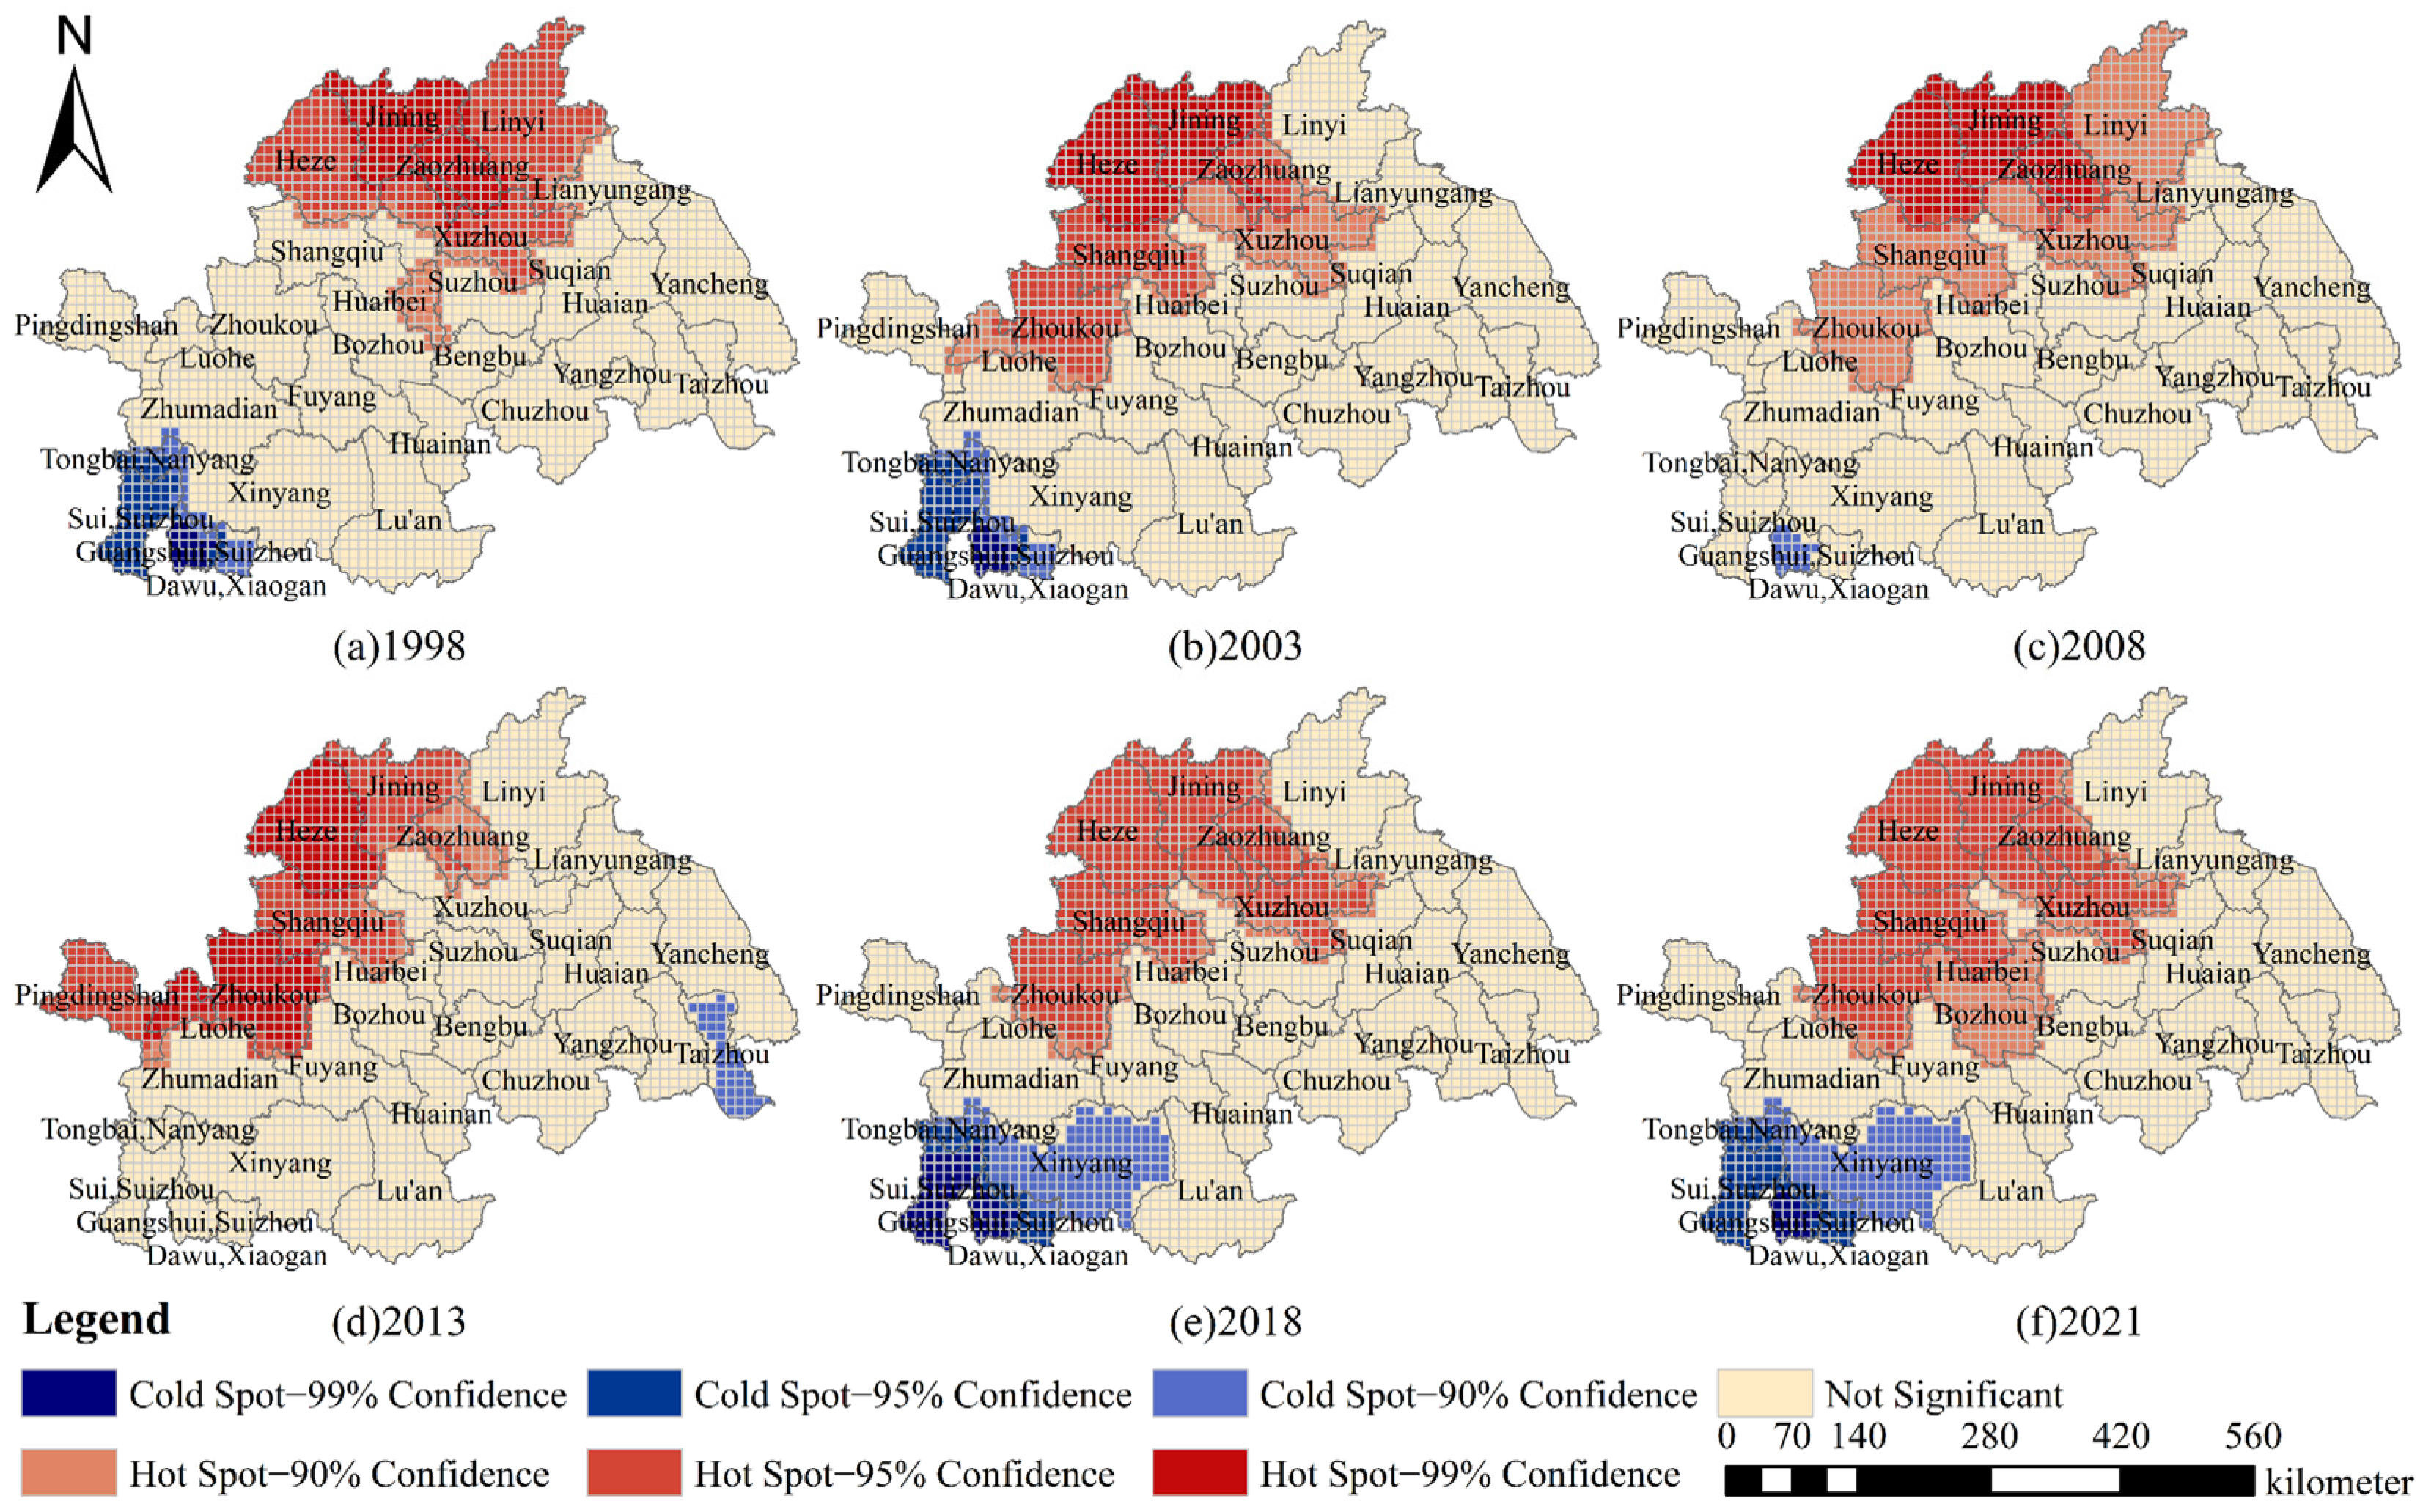
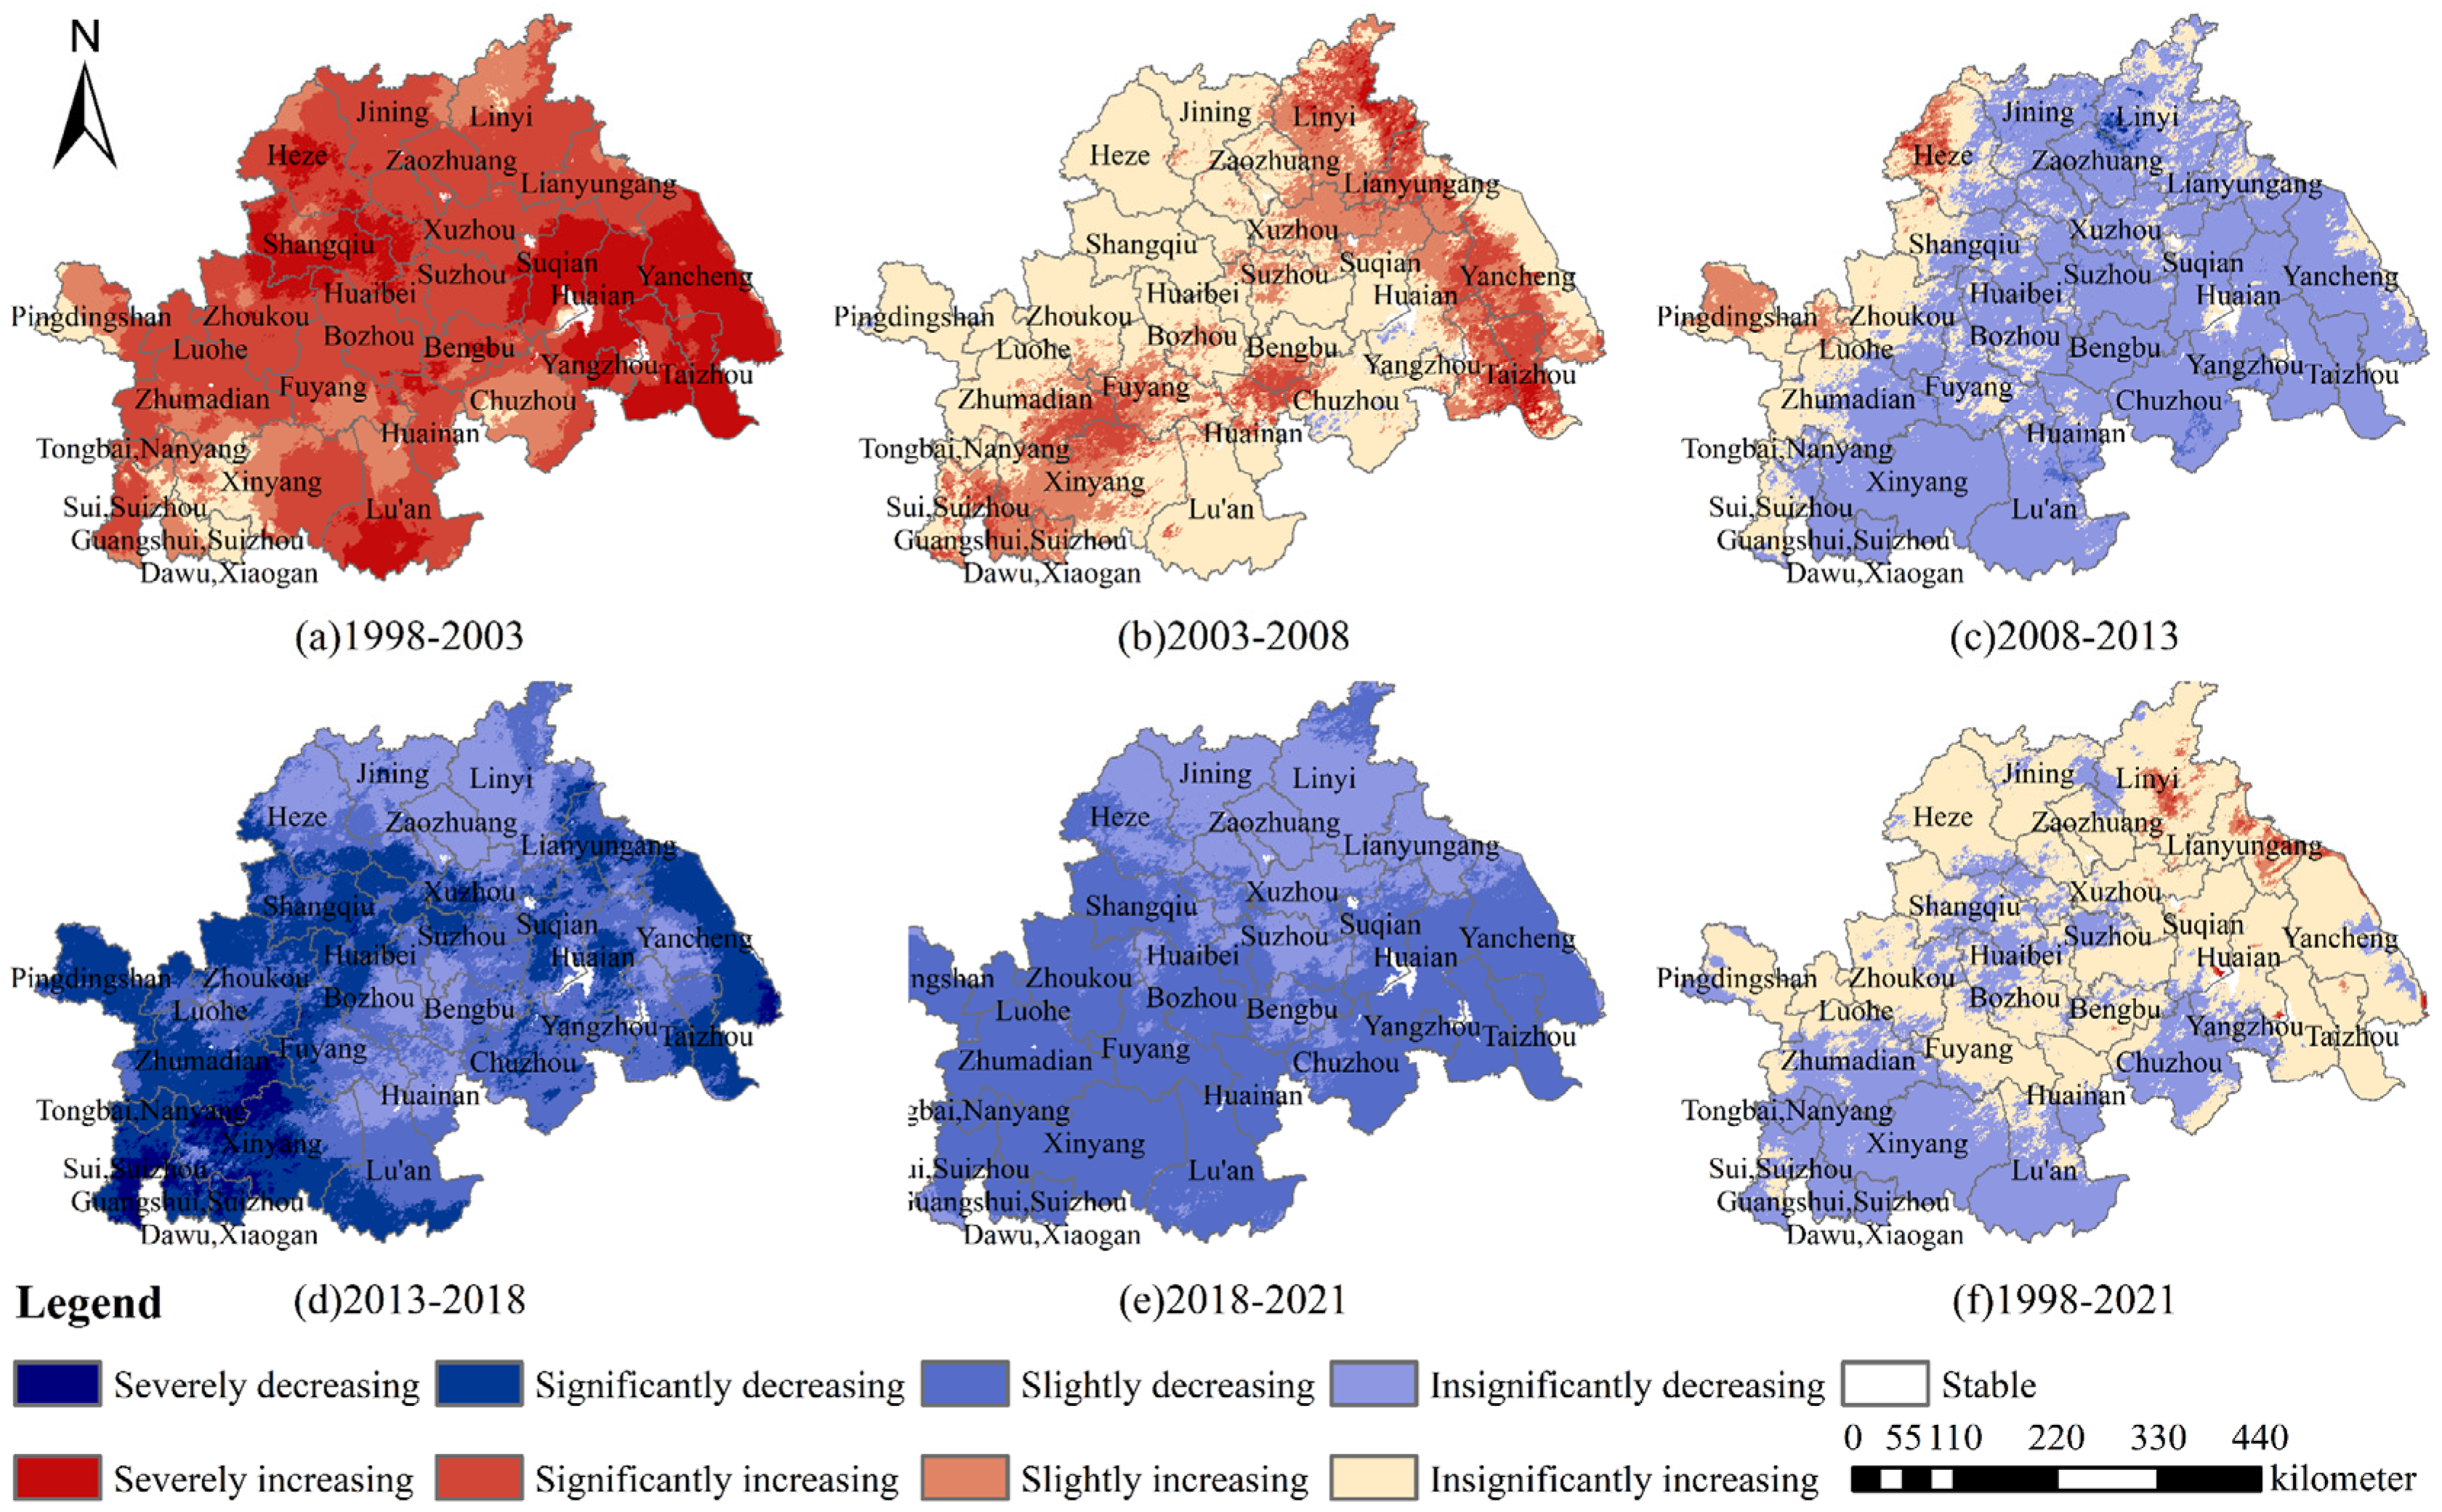
4.2. Characteristics of Spatial and Temporal Variability of Land Use on PM2.5 Concentration

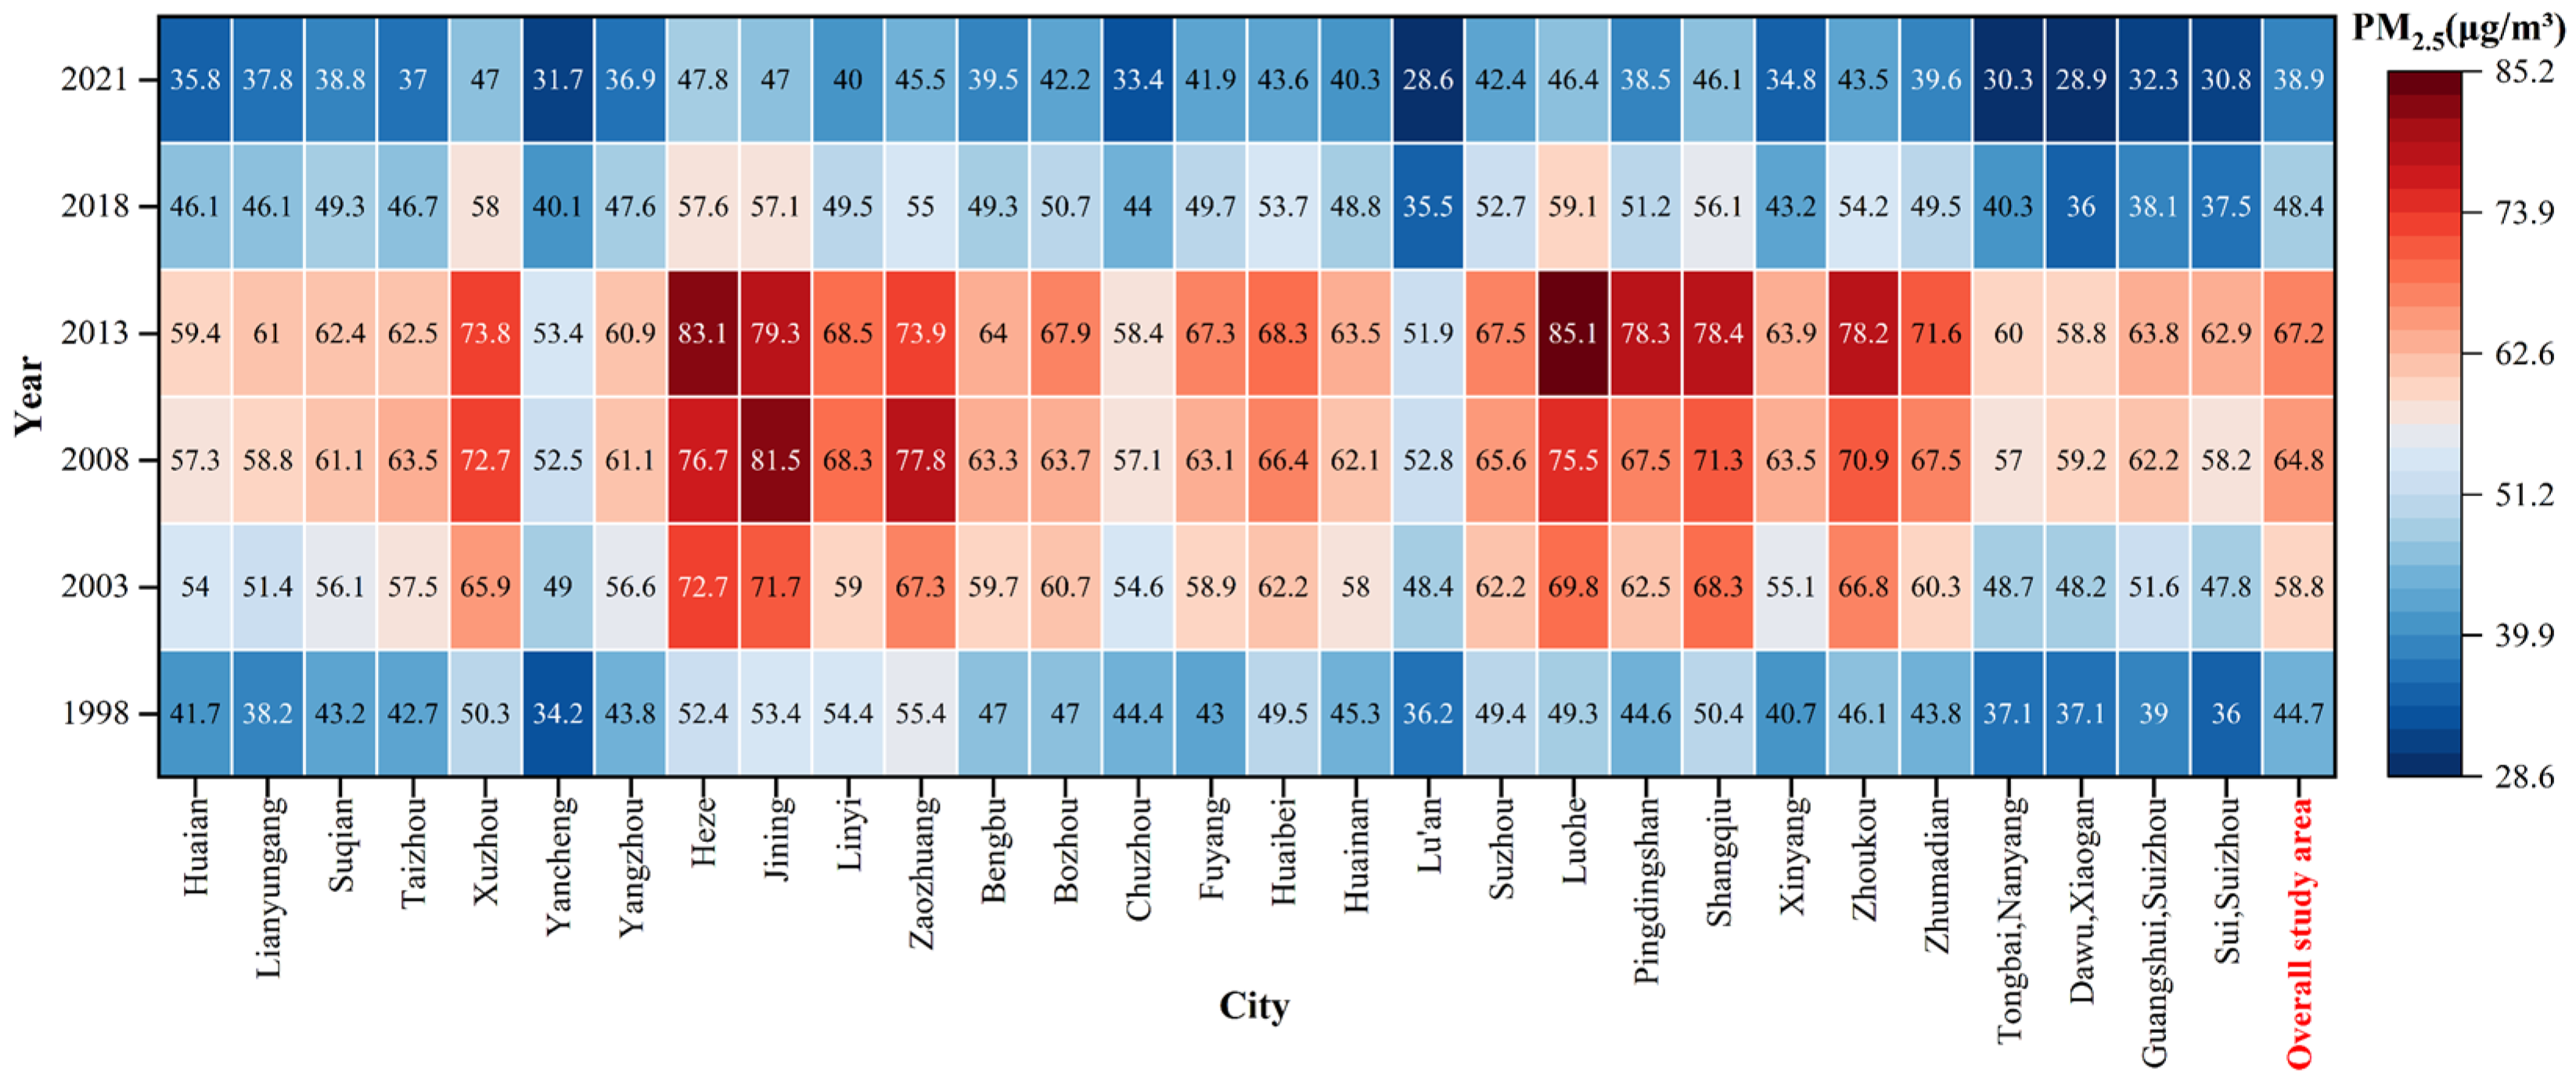
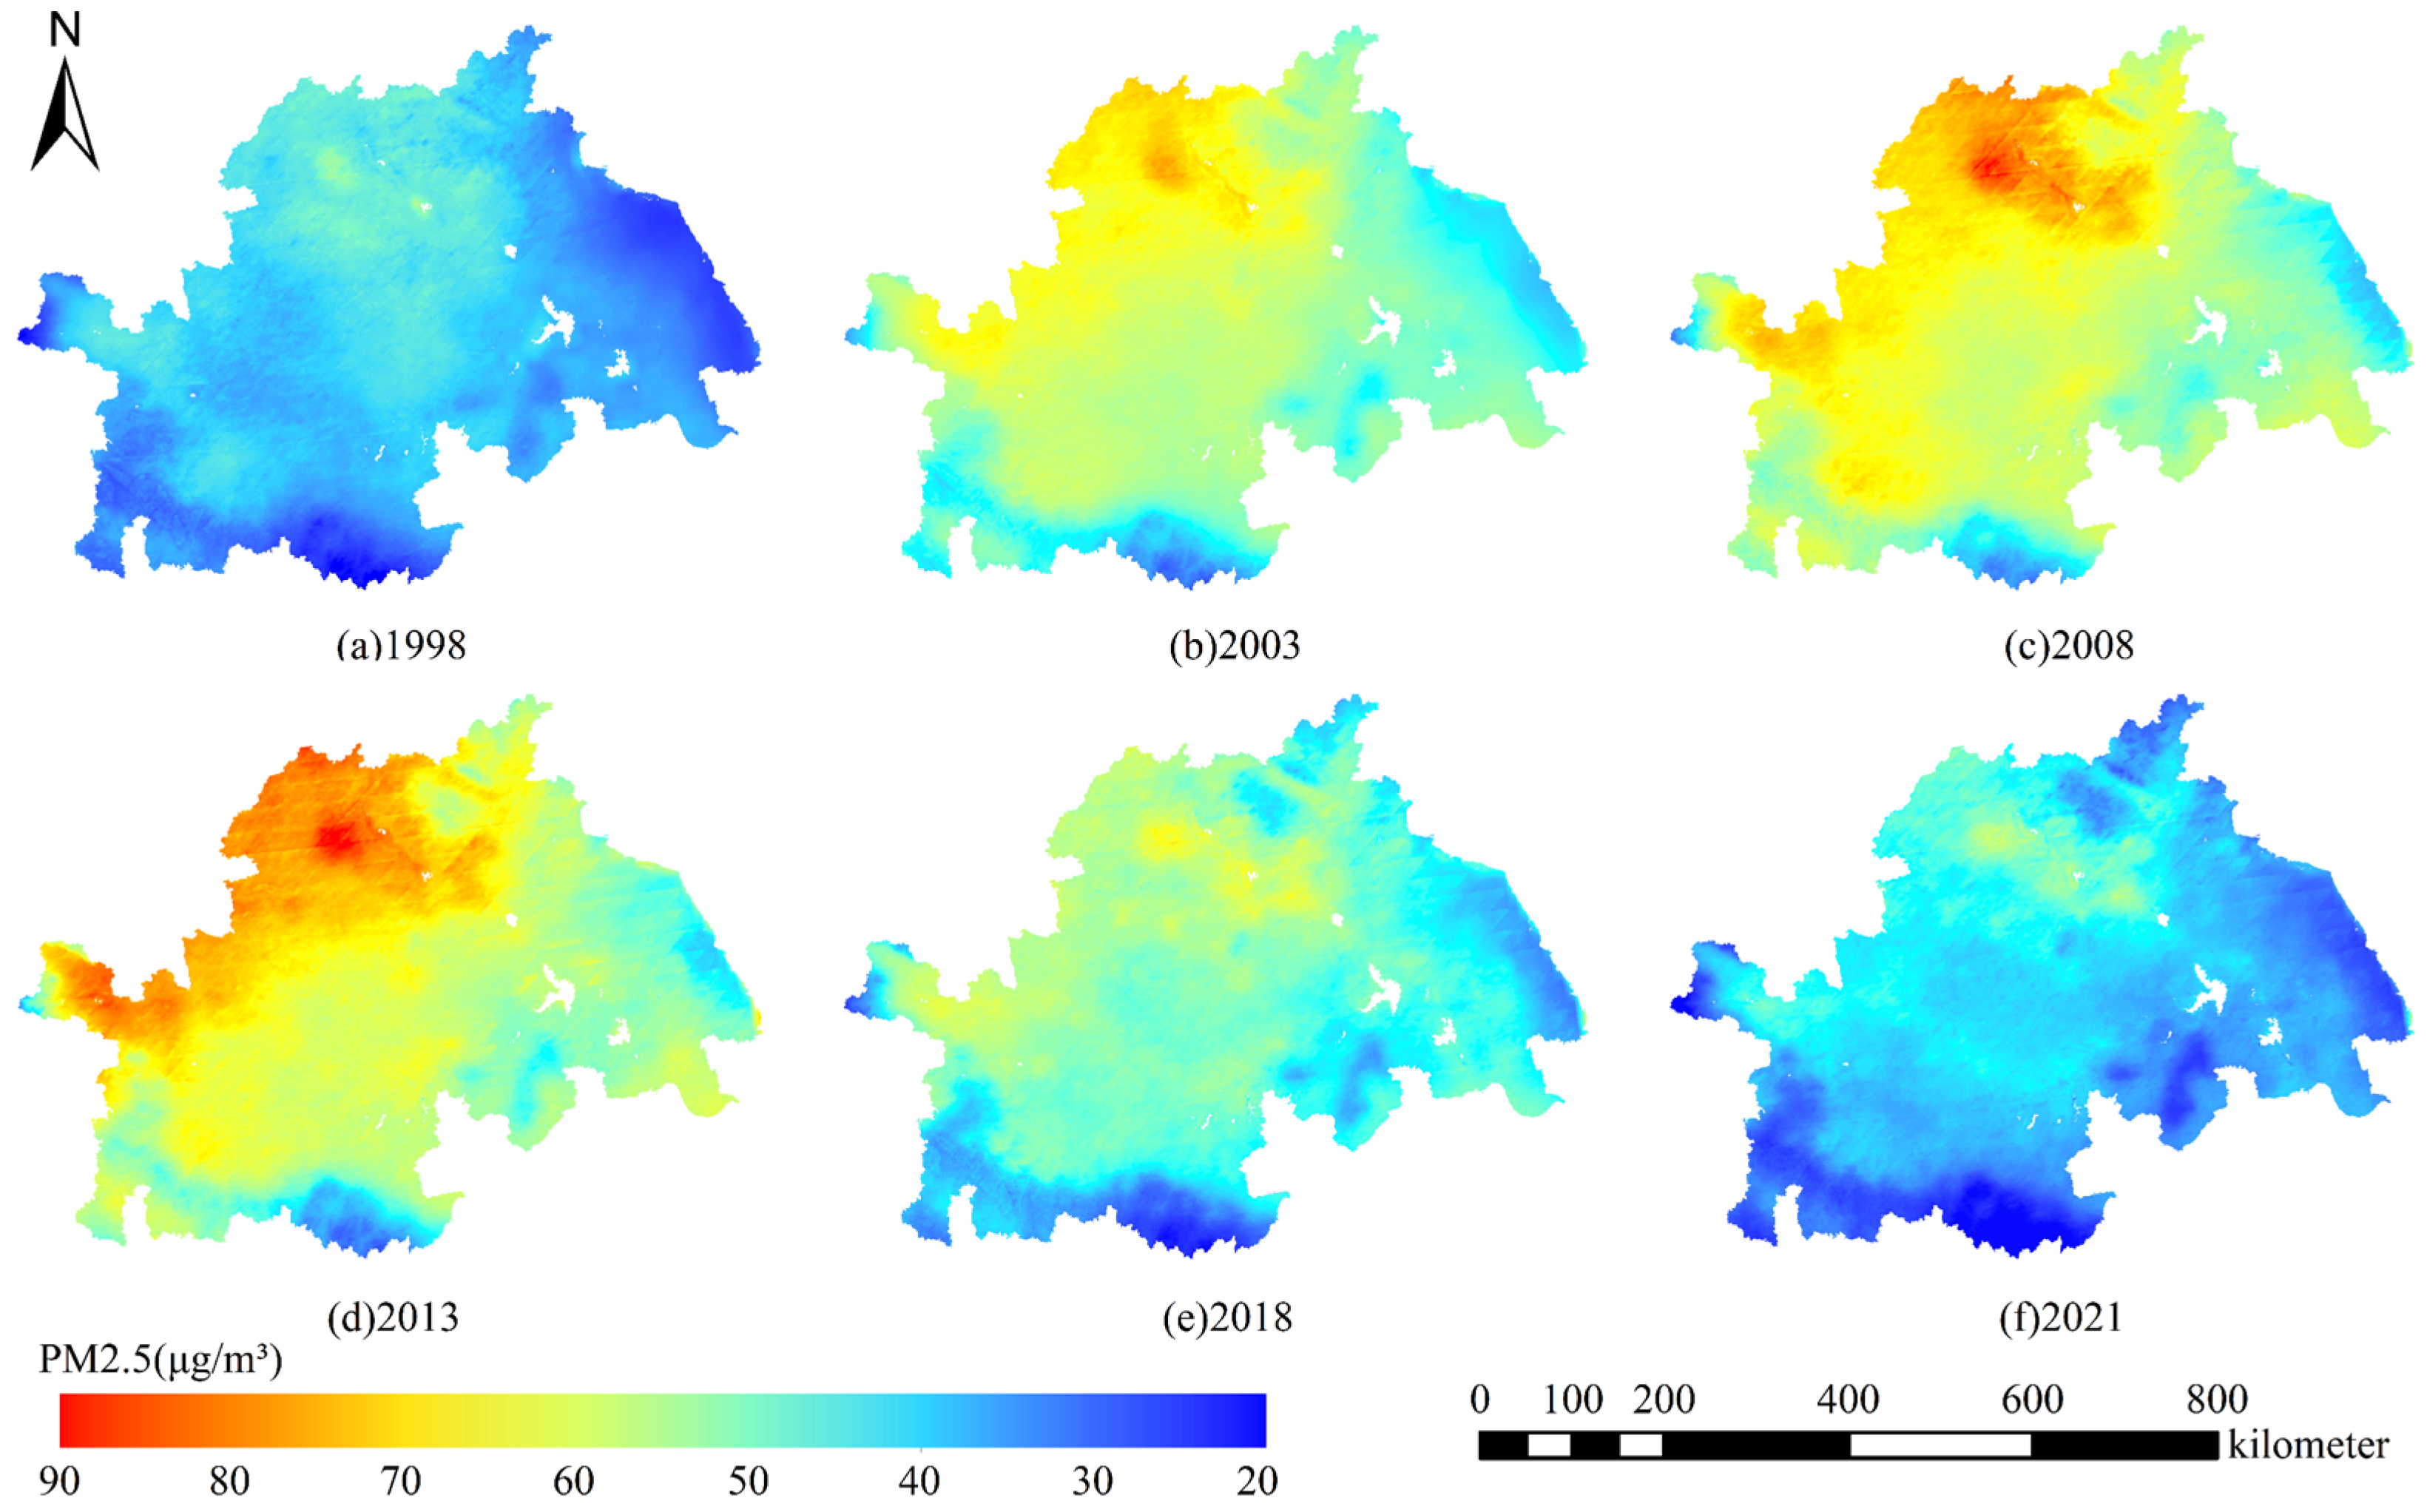
The situation of atmospheric pollution in the Huaihe River Ecological Economic Belt was complex. From the results of the GTWR model, during the study period, the influence of land use on PM2.5 concentration in the cities (counties) of the Huaihe River Ecological Economic Belt showed obvious spatial and temporal differentiation characteristics. Before 2018, the weakening influence of cropland on PM2.5 pollution gradually decreased, while the influence coefficient rose again after 2018. This indicates that the development plan of the Huaihe River Ecological Economic Belt put forward clear goals and specific measures in the areas of air pollution control and cropland use, which had a significant impact on the enhancement of the regional ecological environment. Wang et al. [55] found that from 2016 to 2019, the ecological welfare performance index of the Huaihe River Ecological Economic Belt underwent a significant shift, with a substantial increase of 24.29%. This shift coincided with the society’s transition from rapid growth to high-quality development, indicating that local governments have begun to pay attention to environmental protection and the implementation of environmental regulations under the impetus of the urban ecological civilization construction and sustainable development evaluation framework, thus promoting the progress of ecological welfare performance in different cities. Meanwhile, the results of this study found that the impact of forests and water bodies on PM2.5 pollution was slightly weakened, and the positive effect of impervious surfaces on PM2.5 pollution significantly increased after the plan was proposed, suggesting that the rapid development of the Huaihe River Ecological Economic Belt after the plan was proposed led to the intensification of the ecological land patchiness and fragmentation, and the efficiency of climate regulation was affected. This in turn led to the reduction in biodiversity and the degradation of ecological service functions. Liu et al. [56] pointed out that habitat fragmentation may lead to non-random loss of species that make high contributions to ecosystem function (reduced sampling effect) and reduced reciprocal interactions (reduced complementarity and facilitation effects).
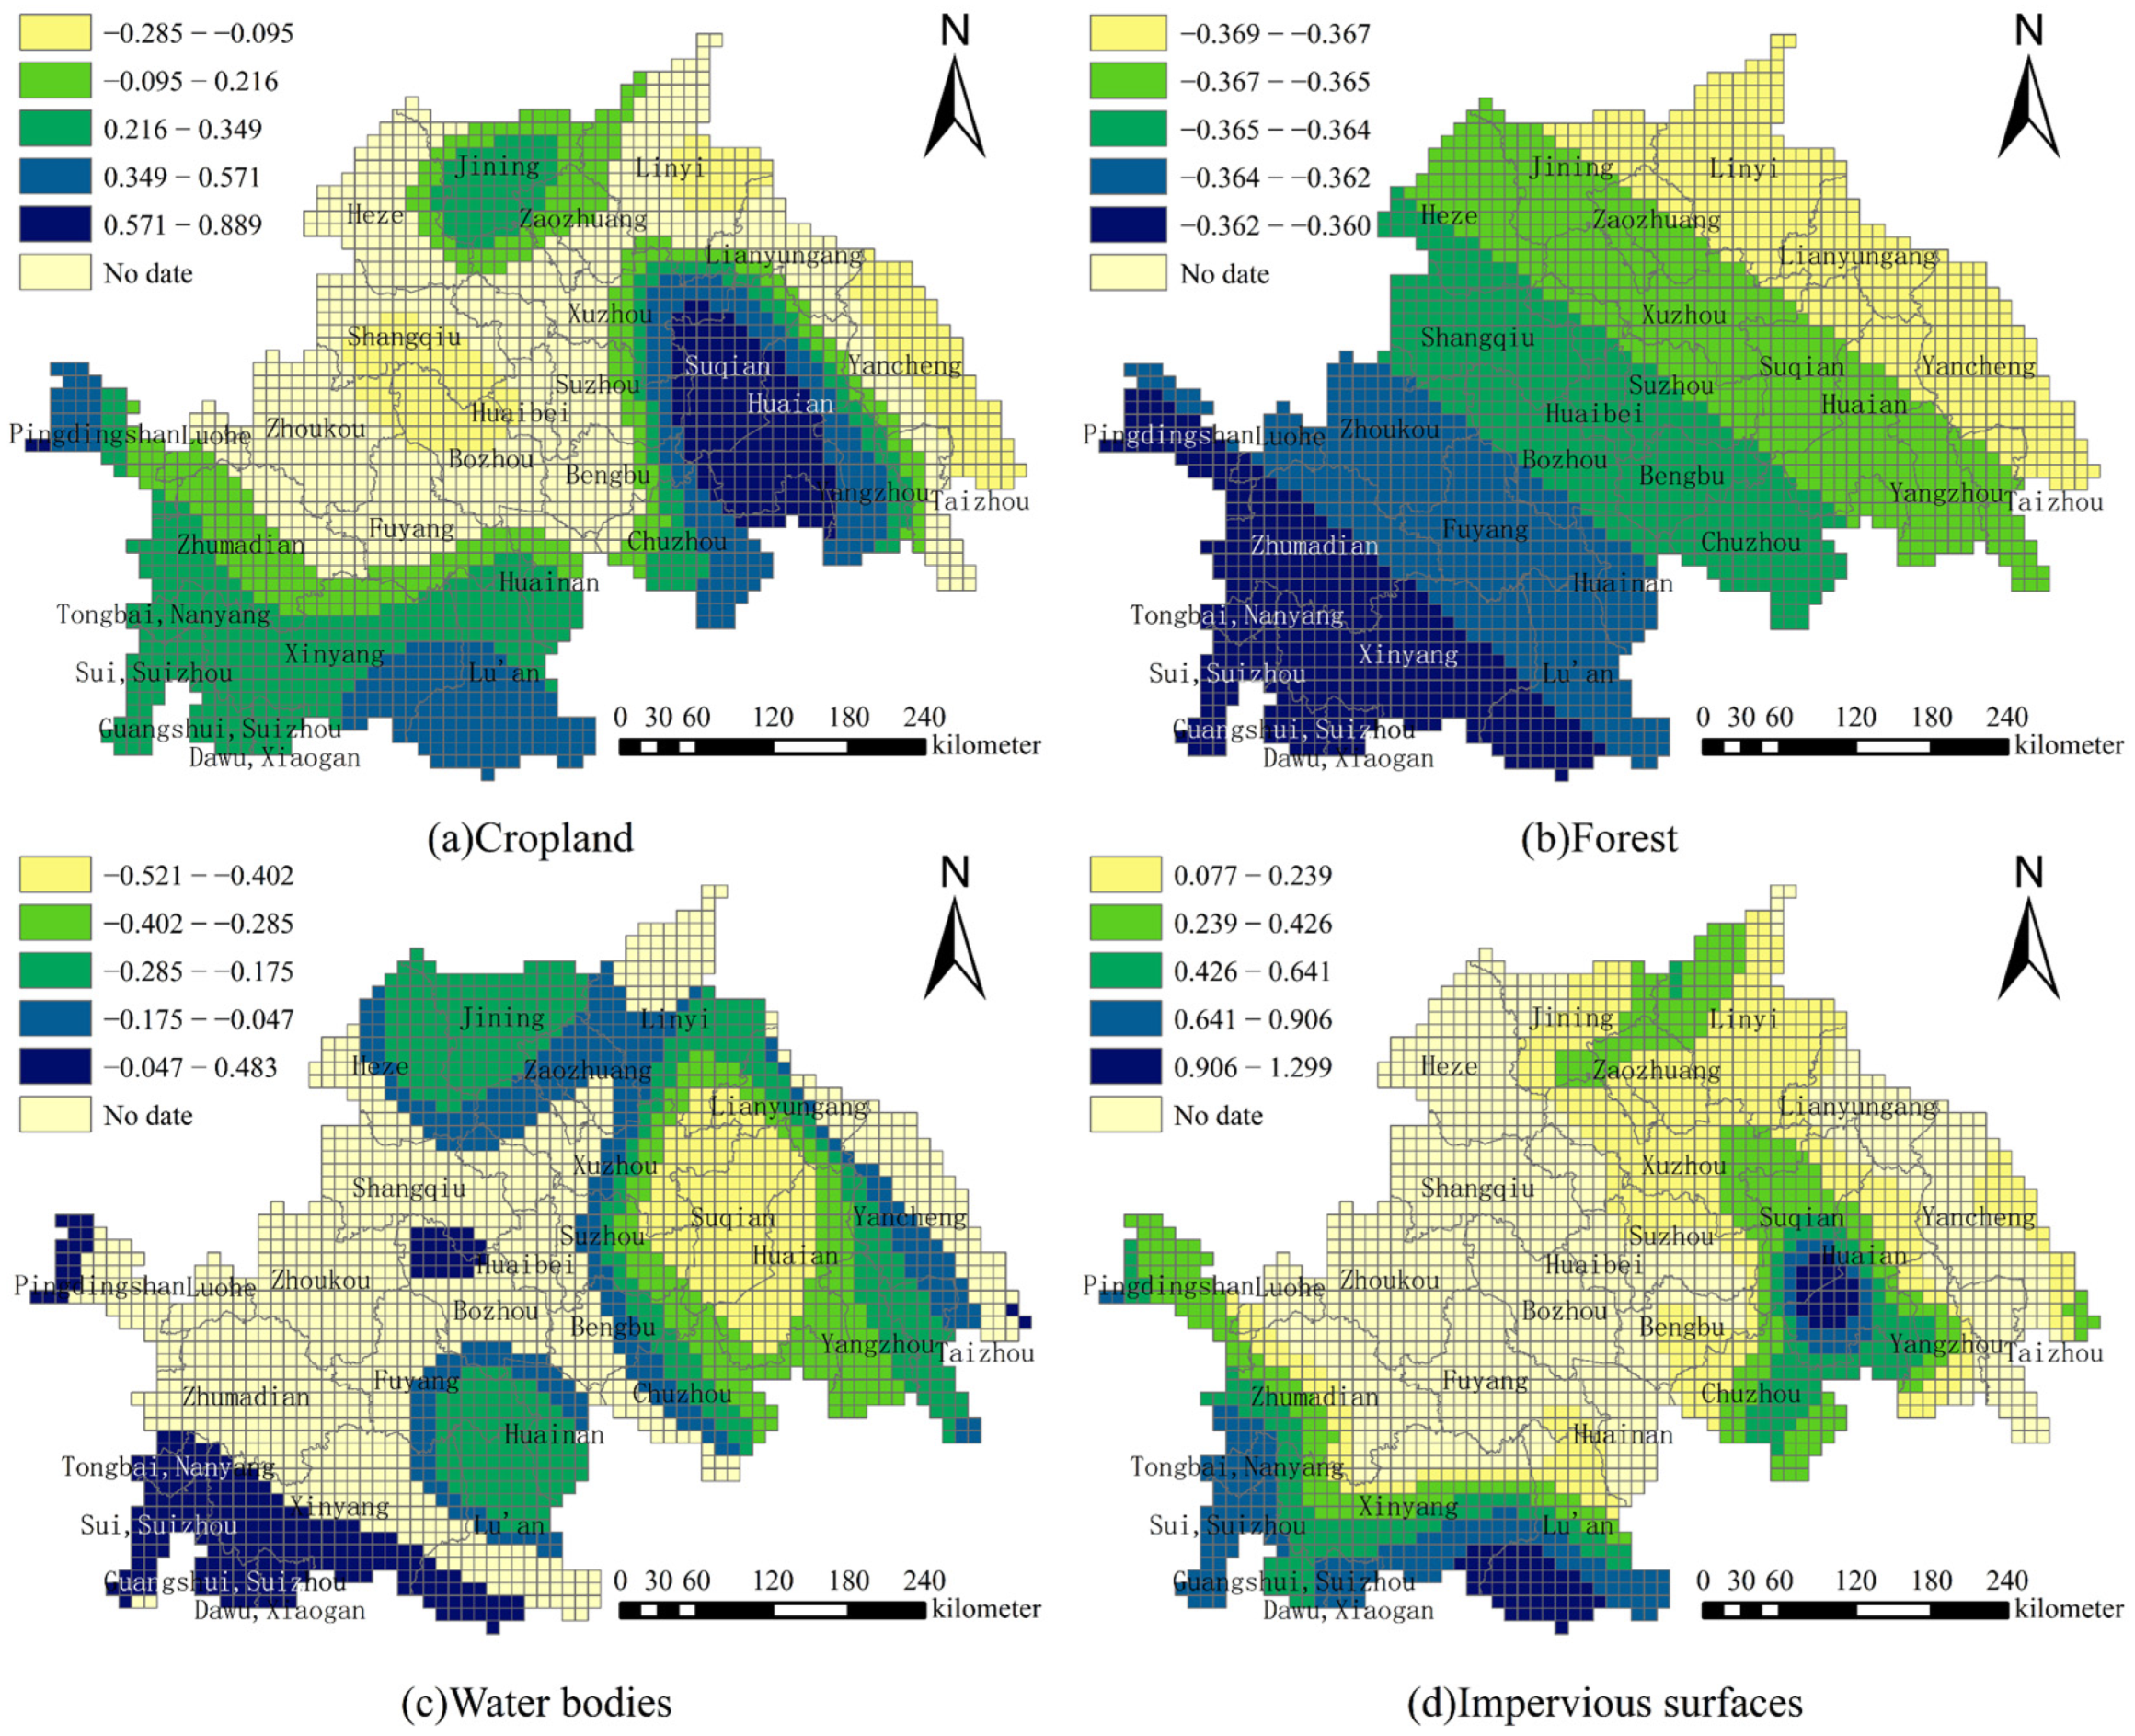
As expected, the MGWR coefficients varied across regions. The effects of cropland and water bodies on PM2.5 concentration were negative in a large range, while the positive effects were found in a small range. Similar results were also obtained by Hong et al. [57]. In addition, forests showed negative effects on PM2.5 concentration, while impervious surfaces had positive effects on PM2.5 concentration. Among them, the influence coefficients of forests were relatively average in the whole area, while cropland, water bodies, and impervious surfaces had large differences in different areas, dominated by the cities in the northeast, such as Jining, Zaozhuang, Yancheng, Yangzhou, and Xuzhou, and the southern cities, mainly including Nanyang, Huainan, Suizhou and Xiaogan. In the results of MGWR for the four land types, Linyi, Yancheng, Huaian, Xuzhou, and Xinyang cities had higher contributions to the reduction in PM2.5 concentration, with most of them belonging to the central leading cities of the Huaihe River Ecological Economic Belt, indicating that the central leading cities had better strategies and regional prevention plans, together with a more reasonable overall land-use pattern. Generally speaking, different types of land use had different driving mechanisms for PM2.5 concentration; over time, the intensity and scope of the impacts of different land-use types changed with the expansion of urban areas and the development strategies of different regions.

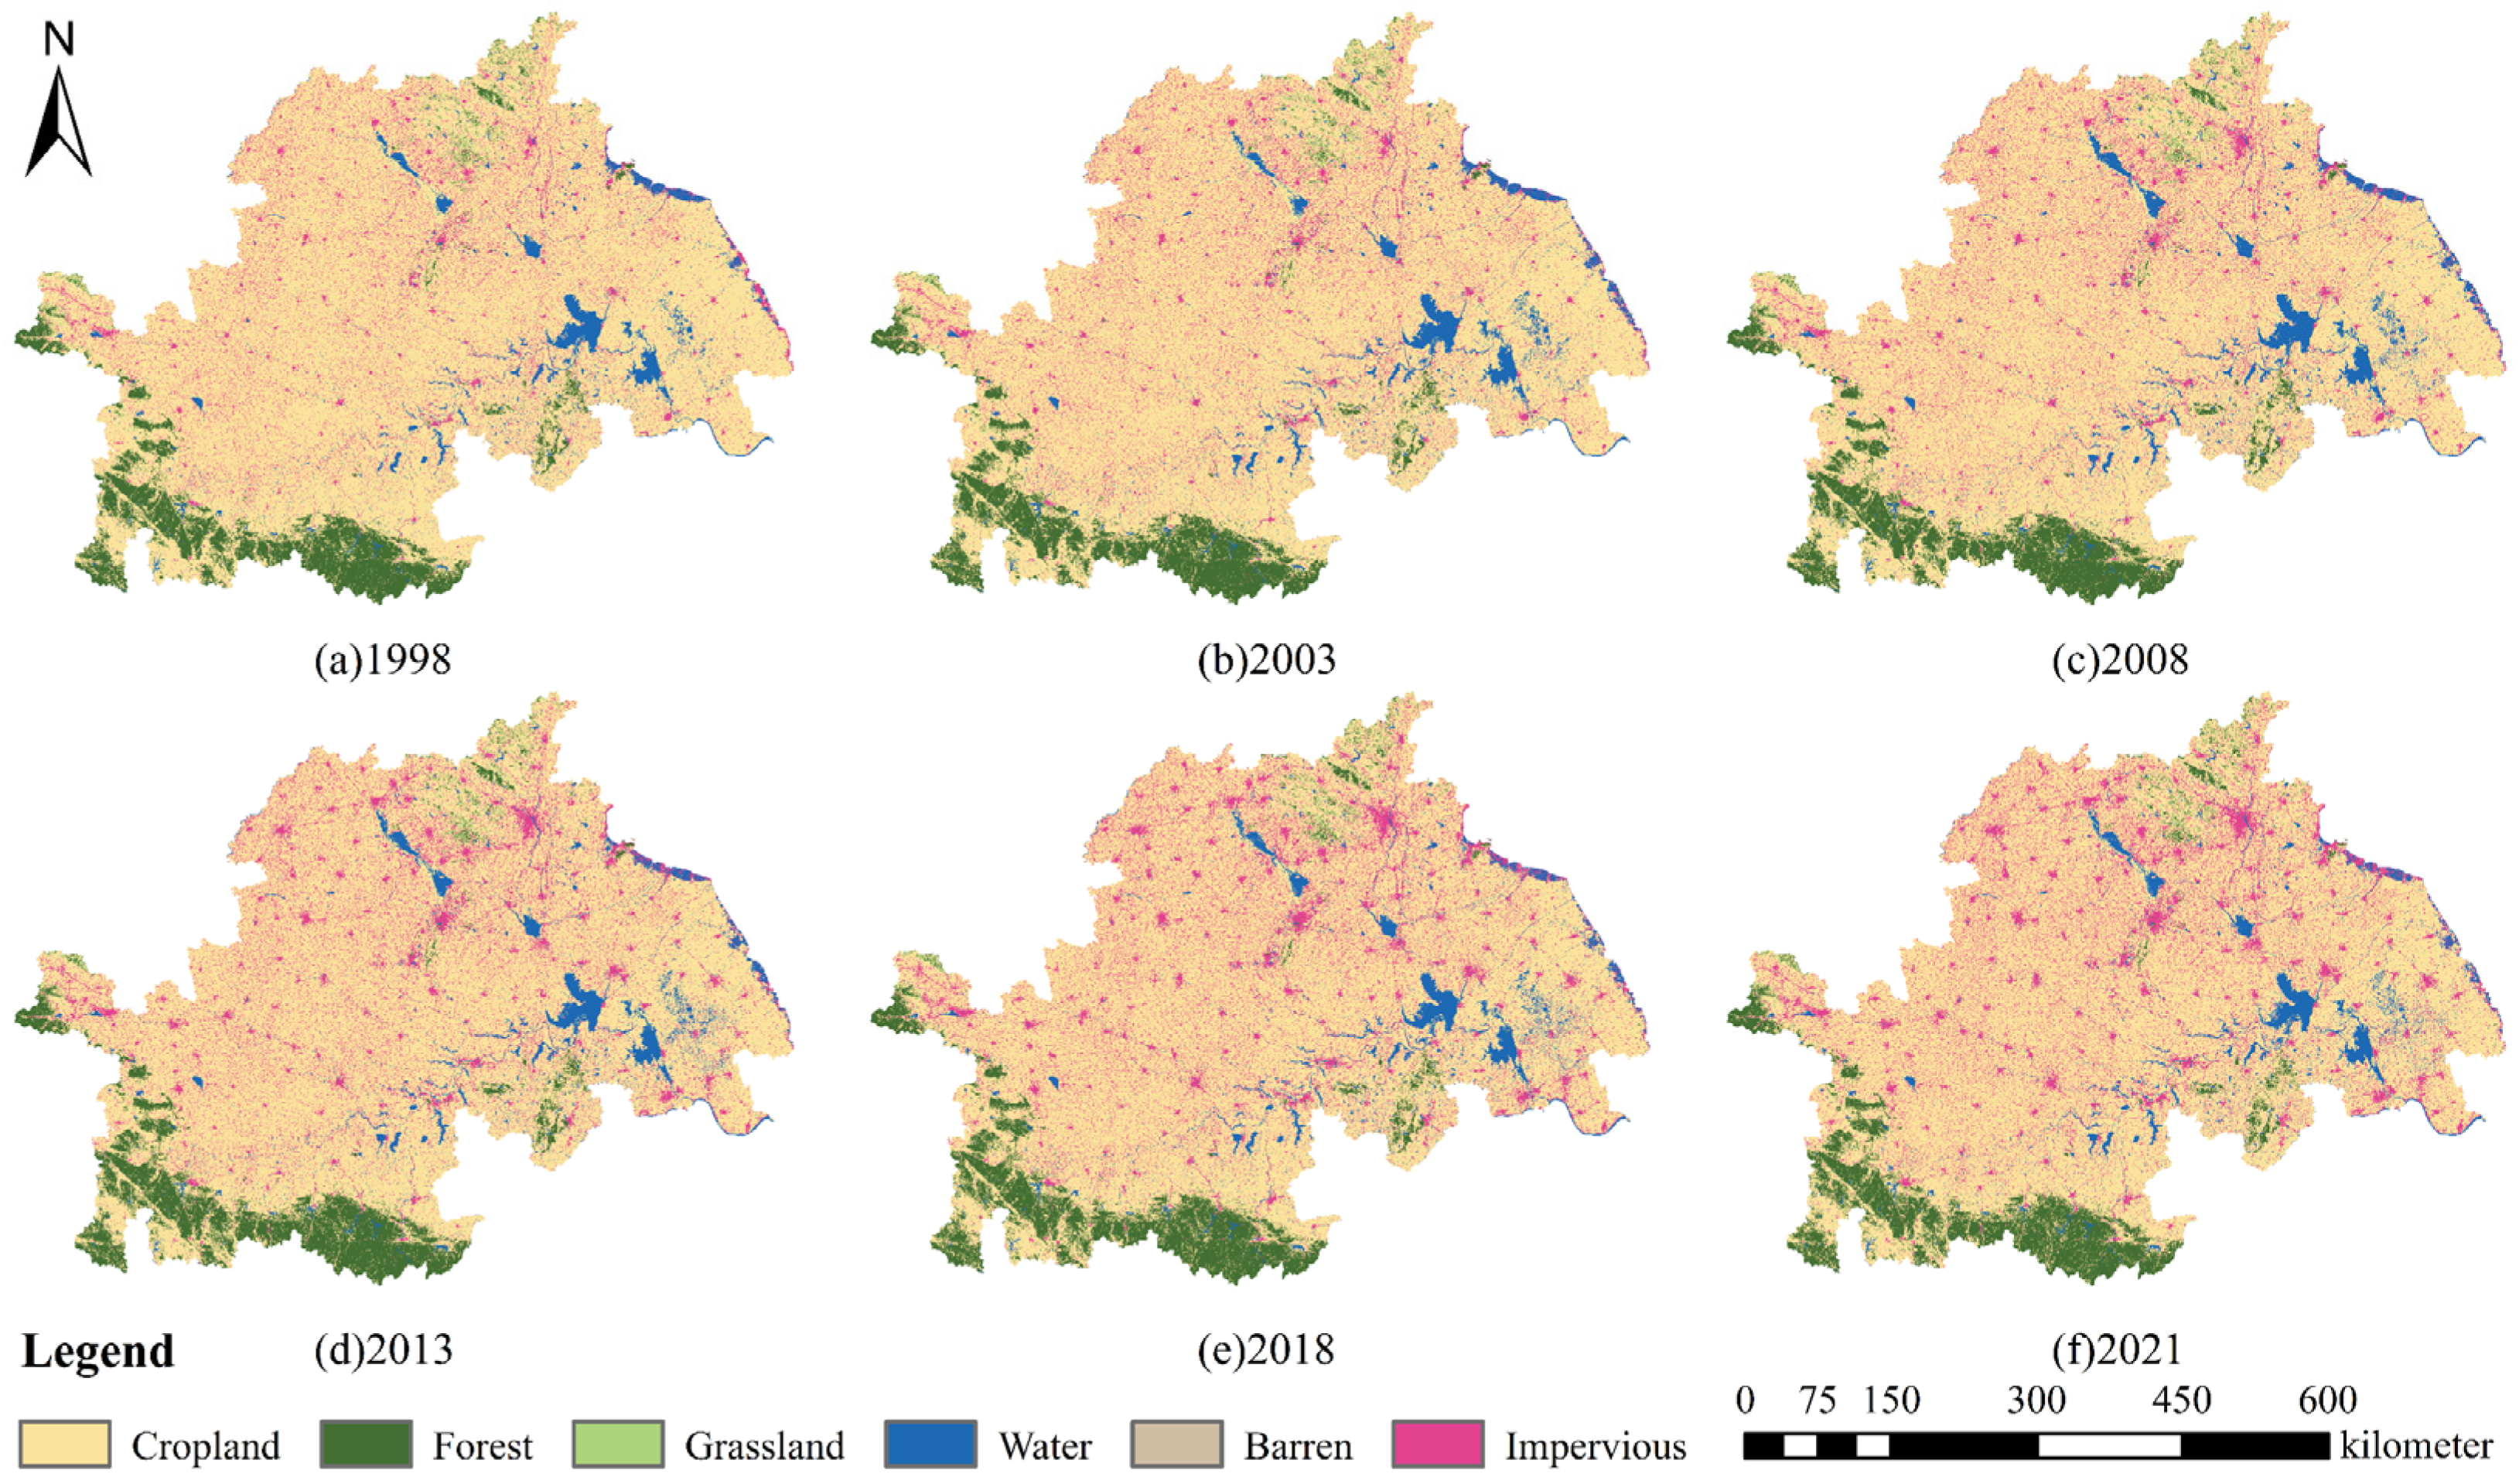
4.3. Proposals for Mitigating Air Pollution from the Land-Use Perspective

The Huaihe River Ecological Economic Belt is rich in biodiversity and has a vast plain area and a stable ecosystem, with a variety of natural resources such as beaches, rivers, forests, and grasses, which should be combined with the natural conditions to guide the zoning of different main functional areas. With the continuous expansion of cities, there are more ecological patches with a high degree of fragmentation and poor quality. Therefore, the intensification of land should be strengthened to optimize land-use structure and integrate patches, so as to reduce the impact of urban expansion on air pollution [58]. This study confirms the spatial spillover effect of land use on PM2.5 pollution, highlighting the need for regional collaborative governance. Regional cooperation mechanisms for land resource management and PM2.5 pollution should be developed to share technologies and resources and to accelerate regional environmental monitoring, information sharing, and collaborative law enforcement to achieve joint prevention and treatment of PM2.5 pollution [59,60]. In addition, the ecosystem services of different levels of cities in the Huaihe River Ecological Economic Belt have different degrees of response to urban expansion, and graded policies and classified development should be implemented according to the law of city development to improve the targeting and landing of spatial planning. Therefore, based on the ecological synergistic perspective, this study tried to put forward relevant optimization suggestions from the perspective of different city levels:
(1) In megacities and large cities such as Xuzhou, Huainan, and Huaibei, the contradiction between cropland and ecological land such as cropland and water bodies with PM2.5 pollution was relatively prominent. It is necessary to appropriately increase vegetation coverage, reduce excessive and inappropriate use of cropland, and promote the modernization and green transformation of agricultural production. At the same time, attention should be paid to optimization of the internal landscape structure to alleviate ecological degradation caused by urban expansion.
(2) The impact of urban expansion on air pollution in medium-sized cities was more significant than that in megacities and large cities, and most of the other ecological land use had a weaker function in regulating air pollution. Under the new pattern of development, the restoration of wetlands and the construction of a water body network along the Huaihe River should be increased, so as to build a systematic and holistic green space network in conjunction with the Jianghuai Ecological Corridor and Yishusi River Ecological Corridor. Through the diversification of vegetation structure and composition and the optimized spatial configuration of the corridor network, the regional ecosystem services will be further improved, and the connectivity between ecological sources will be strengthened.
(3) Medium-sized cities should give full play to their advantages in supplying services, optimize the layout and structure of production space, and strengthen the control of ecological space in urban fringe areas. During the past two decades, small cities have developed rapidly with a persistently high index of urban expansion intensity. Special attention should be paid to optimizing the spatial structure of urban built-up areas, reducing the destruction and encroachment of ecological space, improving the planning of the green space system, and making greater efforts in the areas of strengthening land-use regulations, evaluating the management of urban growth, preserving farmland, and improving the environment for agricultural production to form a compact urban pattern.
(4) In addition, combined with PM2.5 data from satellite remote sensing and ground monitoring, in the construction of the health pattern of public health governance, a grid-based pollution tracing system can be established to accurately identify pollution sources and draw health risk maps. It can also upgrade the early warning and response mechanism and promote the establishment of the regional ecological compensation mechanism through health risk assessment. At the same time, PM2.5 estimates can be used to assess the risk of PM2.5 pollution exposure in different regions by revealing its quantitative relationship with land use, identifying areas where highly polluting industries are clustered. Policy makers can evaluate the economic cost of pollution, design incentive or constraint mechanisms, and implement policy scenario simulation for better land-use control.
The Huaihe River Ecological Economic Belt is a demonstration belt for the construction of ecological civilization in the basin and a demonstration belt for new urbanization. The ecological construction of the Huaihe River Ecological Economic Belt can play a radiation-driven role and promote the overall development of the region. Promoting the scientific layout and optimization of its urban and ecological space has an important demonstration role in regional high-quality development.

4.4. Applicability in Other Regions

Similar studies in other urban agglomerations in China, such as the Zhengzhou metropolitan area and the city clusters along the middle reaches of the Yangtze River, have shown significant spatiotemporal heterogeneity in the impact of land use on PM2.5. Although there are some commonalities in terms of pollution challenges and urbanization that are suitable for the models chosen for this study, the specific results obtained by the models in different regions vary under different scales, regional geography, meteorology, developmental status, and other conditions (Table 7).
This study points out the impacts and spillover effects of land use on PM2.5 concentration in the Huaihe River Ecological Economic Belt, which is also applicable in other developing countries (such as India, Iran, and Philippines). As these regions are generally characterized by dense traffic, industrial expansion, and ecological space compression, their rapid urbanization has severely exacerbated PM2.5 pollution [63]. Similarly, Hajiloo et al. studied air pollution in Tehran and found that improving urban vegetation and increasing green cover is a major strategy to mitigate PM pollution [46]. This study found that cropland has a complex mechanism and may exacerbate PM2.5 pollution due to straw burning and fertilizer use. The Gangetic Plain in India also faces this problem, as its cropland system produces large amounts of crop residue every year, much of which is burned in situ, thus exposing people in the area and nearby cities to extremely high levels of atmospheric pollutants [64].
In addition, this study points out the significant spatiotemporal heterogeneity in the effect of land use on PM2.5, which also applies to developed countries with similar pollution challenges. In developed countries, there is a certain phenomenon of “urban shrinkage”, such as population outflow, leading to hollowing of the land use, which may exacerbate the spatial heterogeneity of PM2.5 concentration. A study of Seoul by Jeong et al. found significant differences in the effects of land structure on PM among administrative districts with different traffic volumes and development status [65]. The relationship between land use and PM2.5 is influenced by urban development factors such as economic conditions, policy context, and urban structure. While consistent with other similar regions, there are also differences. Various countries and regions need to prevent and control air pollution through sustainable urban development planning and rational land use by taking into account the local geographic environment, data conditions, and policy context.

4.5. Research Limitations and Further Prospects

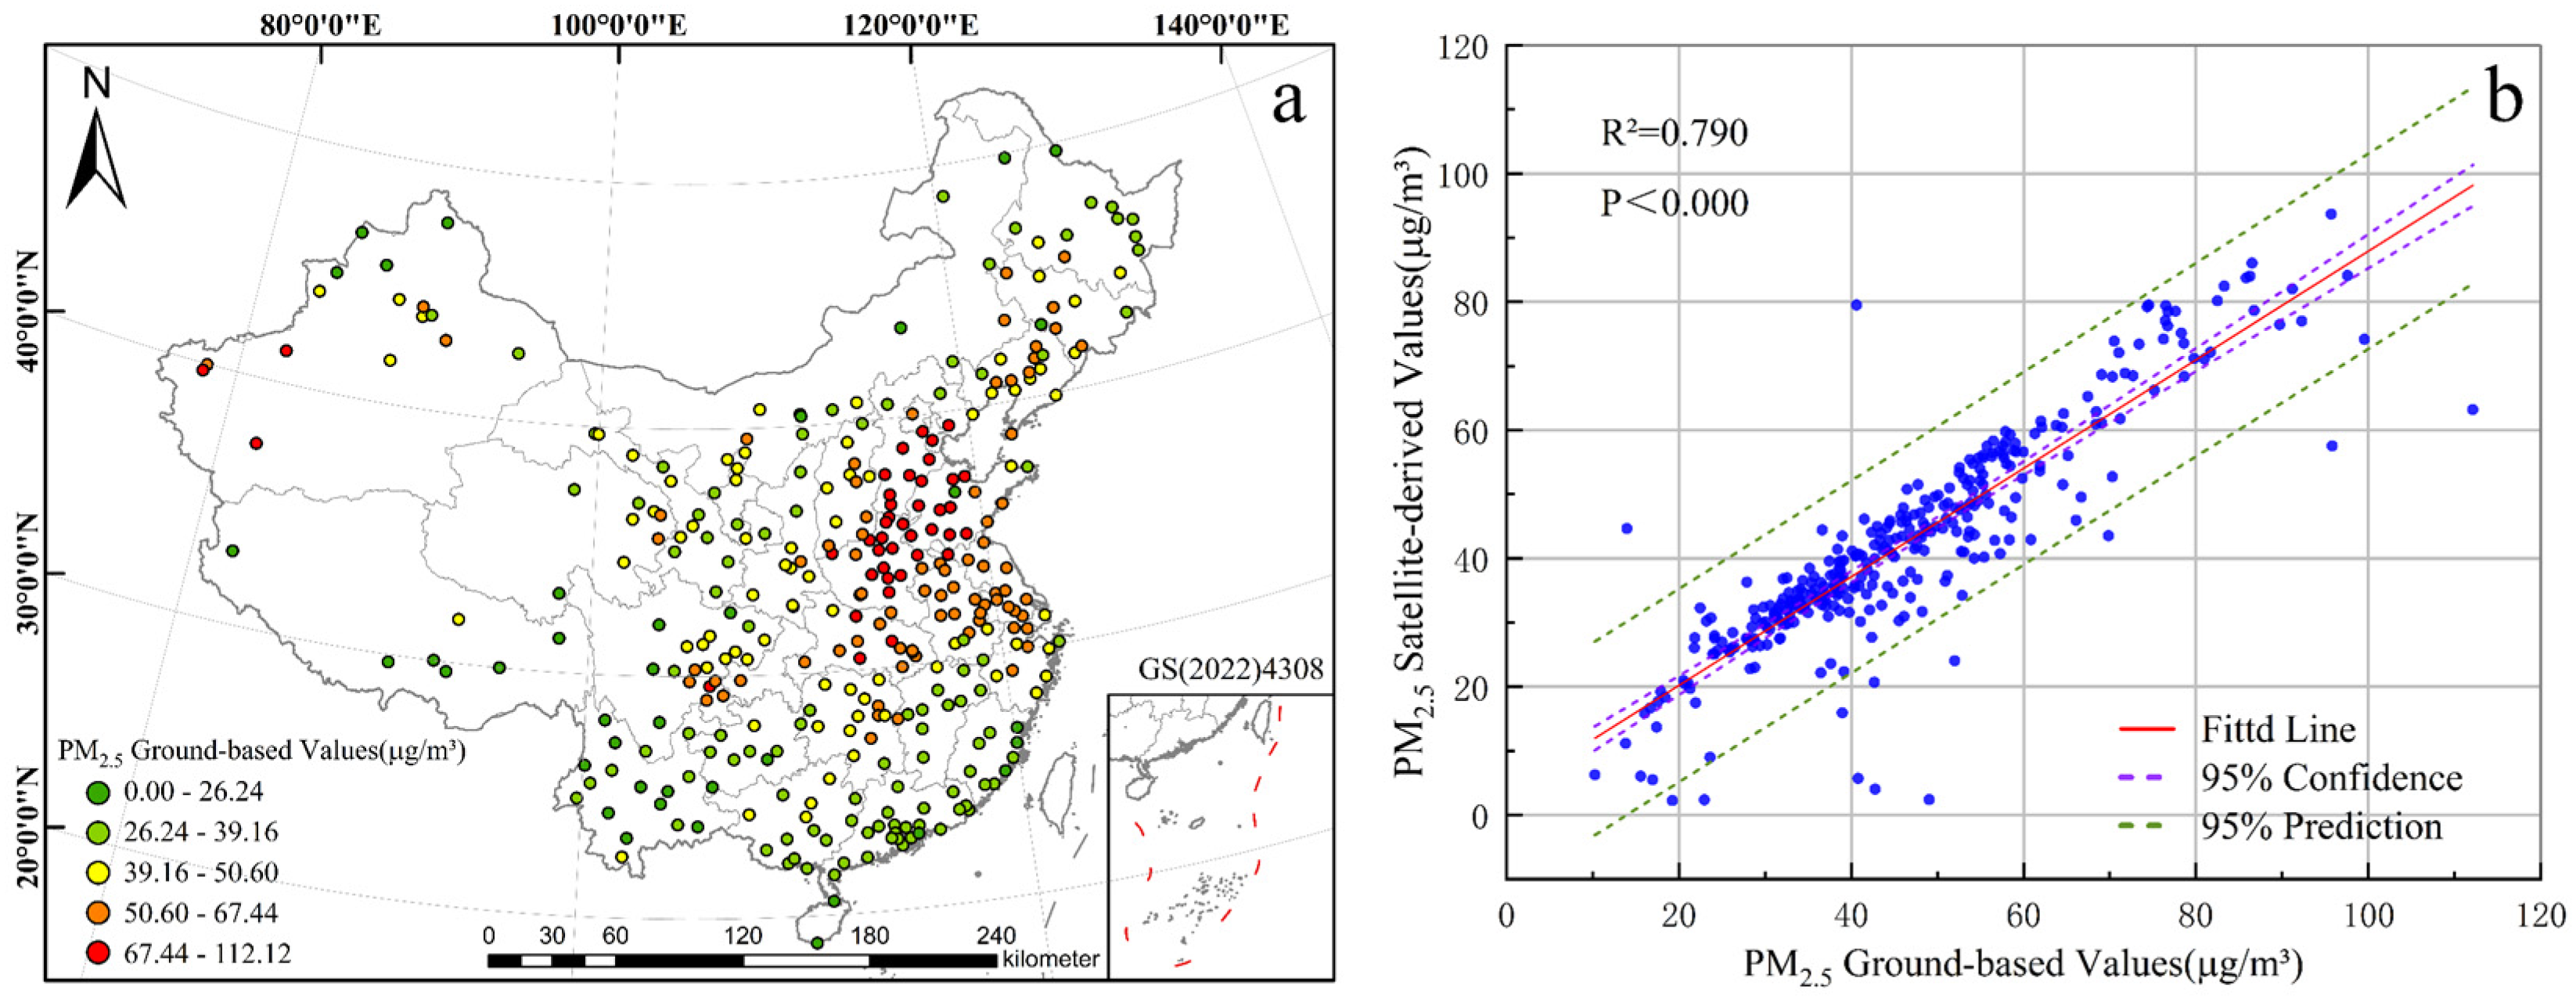
There are some shortcomings in the study. Firstly, due to the limitations of data, there is room to improve the data precision of the selected land cover data and PM2.5 concentration data, without taking into account differences between months and seasons. At the same time, the proportion of some land-use types was too small, such that future study data with higher spatial resolution should be used to provide more accurate conclusions. Secondly, the relationship between PM2.5 concentration and land use is also affected by landscape patterns, meteorology, scale, and other factors, which need further study. In addition, PM10 and other air pollutant indicators were not included in this study due to data availability limitations. Although PM2.5 is the current core indicator of air pollution effect, future studies will need to supplement data on other air pollutants to more comprehensively assess particulate matter risk and distinguish the difference in the source contribution of particles with different particle sizes. Meanwhile, this study used a combination of GTWR and MGWR models to explore the spatiotemporal heterogeneity among the study subjects, but with the development of spatial econometrics, some scholars have proposed Multiscale Geographically and Temporally Weighted Regression (MGTWR) [66], which can consider spatiotemporal factors in the regression model to further improve the performance and efficiency of the model and at the same time solves the inconsistency of the model coefficients in the two-step analysis of GTWR and MGWR. Nevertheless, the computational method of the MGTWR has not been rigorously validated in other research fields, so it has not been adopted but could serve as a direction for subsequent research.

5. Conclusions

Based on high-precision, high-resolution, and long time-series PM2.5 concentration data and land-use data, this study took the Huaihe River Ecological Economic Belt as the research object from 1998 to 2021, utilizing the spatial Durbin model with time-fixed effects to analyze the correlation and spillover effects between PM2.5 concentration and land use and then used the GTWR and MGWR models to explore the driving mechanism of land use on the PM2.5 concentration in time and space. The following conclusions were drawn:
(1)
The Huaihe River Ecological Economic Belt showed an overall fluctuating and increasing trend of PM2.5 annual average concentration from 1998 to 2013, with an increase of 50.4%, while showing a decrease by 42.1% from 2013 to 2021. Overall, the distribution pattern was basically maintained as high in the northwest and low in the southwest. Land-use types in the study area were dominated by cropland, forests, and impervious surfaces.
(2)
Impervious surfaces, forests, cropland, grassland, and water bodies had significant spatial spillover effects on PM2.5 pollution, highlighting the necessity of regional collaborative governance. Except for grassland, the direct effect of each category on PM2.5 pollution was greater than the indirect effect. Due to the effect of land fragmentation, grassland had a weak exacerbating effect on PM2.5 pollution, while the effect of barren areas was not obvious. In addition, the influence of cropland on PM2.5 pollution was complex, reducing PM2.5 pollution within the region but having an aggravating effect on that in the neighboring region.
(3)
The impact of land use on PM2.5 concentration in the Huaihe River Ecological Economic Belt showed obvious spatial and temporal heterogeneity. In terms of temporal changes, with the improvement in the level of urbanization and the proposal of relevant policies, the weakening scope of ecological land use on PM2.5 pollution had expanded in recent years, and the intensity had likewise increased. In contrast, due to the accelerated level of development and the intensification of urban expansion, the intensification of PM2.5 pollution by the use of impervious surface has intensified in recent years. In terms of spatial scale, the role of forests was the largest, while that of impervious surfaces was the smallest. From the perspective of the urban scale, for different city scale levels, there were significant differences in the response of land-use types to PM2.5 concentration in their regions.

Author Contributions

Conceptualization, D.D.; methodology, D.D.; validation, R.H.; formal analysis, D.D.; investigation, H.S., N.L. and X.Y.; resources, R.H.; data curation, D.D. and K.G.; writing—original draft preparation, D.D.; writing—review and editing, D.D. and R.H.; visualization, R.H.; supervision, D.D. and K.G.; funding acquisition, D.D. and K.G. All authors have read and agreed to the published version of the manuscript.

Funding

This research was funded by the Key Project of Natural Science Research Project of Anhui Educational Committee, grant number 2022AH050244; Philosophy and Social Science Planning Project of Anhui Province, grant number AHSKQ2020D16; Anhui Provincial Natural Science Foundation, grant number 2008085QC132.

Data Availability Statement

The original contributions presented in the study are included in the article, further inquiries can be directed to the corresponding author.

Conflicts of Interest

The authors declare no conflicts of interest.

References

  1. Yue, H.; He, C.; Huang, Q.; Yin, D.; Bryan, B.A. Stronger policy required to substantially reduce deaths from PM2.5 pollution in China. Nat. Commun. 2020, 11, 1462. [Google Scholar] [CrossRef]
  2. Jin, H.; Chen, X.; Zhong, R.; Liu, M. Influence and prediction of PM2.5 through multiple environmental variables in China. Sci. Total Environ. 2022, 849, 157910. [Google Scholar] [CrossRef] [PubMed]
  3. Matus, K.; Nam, K.-M.; Selin, N.E.; Lamsal, L.N.; Reilly, J.M.; Paltsev, S. Health damages from air pollution in China. Glob. Environ. Change 2012, 22, 55–66. [Google Scholar] [CrossRef]
  4. Manisalidis, I.; Stavropoulou, E.; Stavropoulos, A.; Bezirtzoglou, E. Environmental and Health Impacts of Air Pollution: A Review. Front. Public Health 2020, 8, 14. [Google Scholar] [CrossRef]
  5. Yi, E.E.P.N.; Nway, N.C.; Aung, W.Y.; Thant, Z.; Wai, T.H.; Hlaing, K.K.; Maung, C.; Yagishita, M.; Ishigaki, Y.; Win-Shwe, T.-T.; et al. Preliminary monitoring of concentration of particulate matter (PM2.5) in seven townships of Yangon City, Myanmar. Environ. Health Prev. Med. 2018, 23, 53. [Google Scholar] [CrossRef]
  6. Lim, C.-H.; Ryu, J.; Choi, Y.; Jeon, S.W.; Lee, W.-K. Understanding global PM2.5 concentrations and their drivers in recent decades (1998–2016). Environ. Int. 2020, 144, 106011. [Google Scholar] [CrossRef] [PubMed]
  7. Lu, D.; Xu, J.; Yue, W.; Mao, W.; Yang, D.; Wang, J. Response of PM2.5 pollution to land use in China. J. Clean. Prod. 2020, 244, 118741. [Google Scholar] [CrossRef]
  8. Liu, J.; Yan, G.; Wu, Y.; Wang, Y.; Zhang, Z.; Zhang, M. Wetlands with greater degree of urbanization improve PM2.5 removal efficiency. Chemosphere 2018, 207, 601–611. [Google Scholar] [CrossRef]
  9. McCarty, J.; Kaza, N. Urban form and air quality in the United States. Landsc. Urban Plan. 2015, 139, 168–179. [Google Scholar] [CrossRef]
  10. Lu, D.; Mao, W.; Yang, D.; Zhao, J.; Xu, J. Effects of land use and landscape pattern on PM2.5 in Yangtze River Delta, China. Atmos. Pollut. Res. 2018, 9, 705–713. [Google Scholar] [CrossRef]
  11. Biswas, K.; Chatterjee, A.; Chakraborty, J. Comparison of Air Pollutants Between Kolkata and Siliguri, India, and Its Relationship to Temperature Change. J. Geovisualization Spat. Anal. 2020, 4, 25. [Google Scholar] [CrossRef]
  12. Zhao, L.; Zhang, M.; Cheng, S.; Fang, Y.; Wang, S.; Zhou, C. Investigate the effects of urban land use on PM2.5 concentration: An application of deep learning simulation. Build. Environ. 2023, 242, 110521. [Google Scholar] [CrossRef]
  13. Yousefi, R.; Shaheen, A.; Wang, F.; Ge, Q.; Wu, R.; Lelieveld, J.; Wang, J.; Su, X. Fine particulate matter (PM2.5) trends from land surface changes and air pollution policies in China during 1980–2020. J. Environ. Manag. 2023, 326, 116847. [Google Scholar] [CrossRef] [PubMed]
  14. Jia, L.; Zhou, X.; Wang, Q. Effects of Agricultural Machinery Operations on PM2.5, PM10 and TSP in Farmland under Different Tillage Patterns. Agriculture 2023, 13, 930. [Google Scholar] [CrossRef]
  15. Behrer, A.P.; Lobell, D. Higher levels of no-till agriculture associated with lower PM2.5 in the Corn Belt. Environ. Res. Lett. 2022, 17, 094012. [Google Scholar] [CrossRef]
  16. Zhu, D.; Zhou, X. Effect of urban water bodies on distribution characteristics of particulate matters and NO2. Sustain. Cities Soc. 2019, 50, 101679. [Google Scholar] [CrossRef]
  17. Nguyen, T.; Yu, X.; Zhang, Z.; Liu, M.; Liu, X. Relationship between types of urban forest and PM2.5 capture at three growth stages of leaves. J. Environ. Sci. 2015, 27, 33–41. [Google Scholar] [CrossRef]
  18. Cai, L.; Zhuang, M.; Ren, Y. A landscape scale study in Southeast China investigating the effects of varied green space types on atmospheric PM2.5 in mid-winter. Urban For. Urban Green. 2020, 49, 126607. [Google Scholar] [CrossRef]
  19. Tripathy, S.; Tunno, B.J.; Michanowicz, D.R.; Kinnee, E.; Shmool, J.L.C.; Gillooly, S.; Clougherty, J.E. Hybrid land use regression modeling for estimating spatio-temporal exposures to PM2.5, BC, and metal components across a metropolitan area of complex terrain and industrial sources. Sci. Total Environ. 2019, 673, 54–63. [Google Scholar] [CrossRef]
  20. Xu, H.; Bechle, M.J.; Wang, M.; Szpiro, A.A.; Vedal, S.; Bai, Y.; Marshall, J.D. National PM2.5 and NO2 exposure models for China based on land use regression, satellite measurements, and universal kriging. Sci. Total Environ. 2019, 655, 423–433. [Google Scholar] [CrossRef]
  21. Zheng, S.; Zhang, C.; Wu, X. Estimating PM2.5 Concentrations Using an Improved Land Use Regression Model in Zhejiang, China. Atmosphere 2022, 13, 1273. [Google Scholar] [CrossRef]
  22. Zhang, J.J.Y.; Sun, L.; Rainham, D.; Dummer, T.J.B.; Wheeler, A.J.; Anastasopolos, A.; Gibson, M.; Johnson, M. Predicting intraurban airborne PM1.0-trace elements in a port city: Land use regression by ordinary least squares and a machine learning algorithm. Sci. Total Environ. 2022, 806, 150149. [Google Scholar] [CrossRef]
  23. Yoon, S.; Heo, Y.; Park, C.-R.; Kang, W. Effects of Landscape Patterns on the Concentration and Recovery Time of PM2.5 in South Korea. Land 2022, 11, 2176. [Google Scholar] [CrossRef]
  24. Zhao, W.; Yu, Z.; Wang, R.; Gao, Q.; Peng, Q.; Yang, P. Spatial and temporal characteristics of PM2.5 and its response to land use change in Shijiazhuang. Ecol. Environ. Sci. 2020, 29, 2404. [Google Scholar]
  25. Yang, W.; Jiang, X. Evaluating the influence of land use and land cover change on fine particulate matter. Sci. Rep. 2021, 11, 17612. [Google Scholar] [CrossRef]
  26. Zhou, L.; Wu, T.; Pu, L.; Meadows, M.; Jiang, G.; Zhang, J.; Xie, X. Spatially heterogeneous relationships of PM2.5 concentrations with natural and land use factors in the Niger River Watershed, West Africa. J. Clean. Prod. 2023, 394, 136406. [Google Scholar] [CrossRef]
  27. Liu, J.; Wang, J. Research on the Driving Factors of PM2.5 in the Yangtze River Delta Based on GTWR Model Combined with Geographical Detector. Resour. Environ. Yangtze Basin 2024, 33, 139–149. [Google Scholar]
  28. Zhang, C.; Wang, C.; Mao, G.; Wang, M.; Hsu, W.-L. An Empirical Study on the Ecological Economy of the Huai River in China. Water 2020, 12, 2162. [Google Scholar] [CrossRef]
  29. Hsu, W.-L.; Shen, X.; Xu, H.; Zhang, C.; Liu, H.-L.; Shiau, Y.-C. Integrated Evaluations of Resource and Environment Carrying Capacity of the Huaihe River Ecological and Economic Belt in China. Land 2021, 10, 1168. [Google Scholar] [CrossRef]
  30. Wang, Z.; Wang, H.; Liu, Z.; Feng, R.; Pan, Y. Evolution of Ecosystem Service Values and the Response to Landscape Pattern Change in the Huaihe River Eco-Economic Belt. Land 2023, 12, 1405. [Google Scholar] [CrossRef]
  31. Wang, H.; Feng, R.; Li, X.; Yang, Y.; Pan, Y. Land Use Change and Its Impact on Ecological Risk in the Huaihe River Eco-Economic Belt. Land 2023, 12, 1247. [Google Scholar] [CrossRef]
  32. Zhang, S.; Huang, C.; Li, X.; Liu, H. Spatio-Temporal Pattern Evolution and Convergence of Water Ecological Civilization Development Level in Huaihe River Eco-economic Belt. Resour. Environ. Yangtze Basin 2023, 32, 2158–2172. [Google Scholar]
  33. Donkelaar, A.v.; Martin, R.V.; Brauer, M.; Boys, B.L. Use of Satellite Observations for Long-Term Exposure Assessment of Global Concentrations of Fine Particulate Matter. Environ. Health Perspect. 2015, 123, 135–143. [Google Scholar] [CrossRef]
  34. Liu, H.; Fang, C.; Huang, J.; Zhu, X.; Zhou, Y.; Wang, Z.; Zhang, Q. The spatial-temporal characteristics and influencing factors of air pollution in Beijing-Tianjin-Hebei urban agglomeration. Acta Geogr. Sin. 2018, 73, 177–191. [Google Scholar] [CrossRef]
  35. Luo, J.; Du, P.; Samat, A.; Xia, J.; Che, M.; Xue, Z. Spatiotemporal Pattern of PM2.5 Concentrations in Mainland China and Analysis of Its Influencing Factors using Geographically Weighted Regression. Sci. Rep. 2017, 7, 40607. [Google Scholar] [CrossRef] [PubMed]
  36. He, L.; Du, M.; Wei, J. Impact of Land Use Change on PM2.5 Pollution and Its Spatial Spillover Effect in Urban Agglomerations in the Middle Reaches of the Yangtze River. Resour. Environ. Yangtze Basin 2023, 32, 1018–1029. [Google Scholar]
  37. Ord, J.K.; Getis, A. Local Spatial Autocorrelation Statistics: Distributional Issues and an Application. Geogr. Anal. 1995, 27, 286–306. [Google Scholar] [CrossRef]
  38. Mann, H.B. Nonparametric Tests Against Trend. Econometrica 1945, 13, 245. [Google Scholar] [CrossRef]
  39. Elhorst, J.P. Specification and Estimation of Spatial Panel Data Models. Int. Reg. Sci. Rev. 2003, 26, 244–268. [Google Scholar] [CrossRef]
  40. Toit, M.J.d.; Kotze, D.J.; Cilliers, S.S. Landscape history, time lags and drivers of change: Urban natural grassland remnants in Potchefstroom, South Africa. Landsc. Ecol. 2016, 31, 2133–2150. [Google Scholar] [CrossRef]
  41. Fan, C.; Tian, L.; Zhou, L.; Hou, D.; Song, Y.; Qiao, X.; Li, J. Examining the impacts of urban form on air pollutant emissions: Evidence from China. J. Environ. Manag. 2018, 212, 405–414. [Google Scholar] [CrossRef] [PubMed]
  42. Ouyang, X.; Wei, X.; Li, Y.; Wang, X.-C.; Klemeš, J.J. Impacts of urban land morphology on PM2.5 concentration in the urban agglomerations of China. J. Environ. Manag. 2021, 283, 112000. [Google Scholar] [CrossRef]
  43. Chen, J.; Li, C.; Ristovski, Z.; Milic, A.; Gu, Y.; Islam, M.S.; Wang, S.; Hao, J.; Zhang, H.; He, C.; et al. A review of biomass burning: Emissions and impacts on air quality, health and climate in China. Sci. Total Environ. 2017, 579, 1000–1034. [Google Scholar] [CrossRef]
  44. Zhang, Y.; Lang, J.; Cheng, S.; Li, S.; Zhou, Y.; Chen, D.; Zhang, H.; Wang, H. Chemical composition and sources of PM1 and PM2.5 in Beijing in autumn. Sci. Total Environ. 2018, 630, 72–82. [Google Scholar] [CrossRef] [PubMed]
  45. Hu, J.; Zhang, J.; Li, Y. Exploring the spatial and temporal driving mechanisms of landscape patterns on habitat quality in a city undergoing rapid urbanization based on GTWR and MGWR: The case of Nanjing, China. Ecol. Indic. 2022, 143, 109333. [Google Scholar] [CrossRef]
  46. Hajiloo, F.; Hamzeh, S.; Gheysari, M. Impact assessment of meteorological and environmental parameters on PM2.5 concentrations using remote sensing data and GWR analysis (case study of Tehran). Environ. Sci. Pollut. Res. 2019, 26, 24331–24345. [Google Scholar] [CrossRef] [PubMed]
  47. Zhu, S.; Tang, J.; Zhou, X.; Li, P.; Liu, Z.; Zhang, C.; Zou, Z.; Li, T.; Peng, C. Spatiotemporal analysis of the impact of urban landscape forms on PM2.5 in China from 2001 to 2020. Int. J. Digit. Earth 2023, 16, 3417–3434. [Google Scholar] [CrossRef]
  48. Sgrigna, G.; Baldacchini, C.; Dreveck, S.; Cheng, Z.; Calfapietra, C. Relationships between air particulate matter capture efficiency and leaf traits in twelve tree species from an Italian urban-industrial environment. Sci. Total Environ. 2020, 718, 137310. [Google Scholar] [CrossRef]
  49. Akhtar, N.; Ishak, M.I.S.; Bhawani, S.A.; Umar, K. Various Natural and Anthropogenic Factors Responsible for Water Quality Degradation: A Review. Water 2021, 13, 2660. [Google Scholar] [CrossRef]
  50. Huang, L.; Zhu, Y.; Wang, Q.; Zhu, A.; Liu, Z.; Wang, Y.; Allen, D.T.; Li, L. Assessment of the effects of straw burning bans in China: Emissions, air quality, and health impacts. Sci. Total Environ. 2021, 789, 147935. [Google Scholar] [CrossRef]
  51. Zhang, K.; Zhang, Y.; Li, C.; Dai, Z. Seasonal difference analysis of the relationship between PM2.5 and land use: A case study of Weifang. Environ. Eng. 2021, 39, 72–78. [Google Scholar] [CrossRef]
  52. Zou, B.; Xu, S.; Sternberg, T.; Fang, X. Effect of Land Use and Cover Change on Air Quality in Urban Sprawl. Sustainability 2016, 8, 677. [Google Scholar] [CrossRef]
  53. Wang, Y.; Wang, M.; Wu, Y.; Sun, G. Exploring the effect of ecological land structure on PM2.5: A panel data study based on 277 prefecture-level cities in China. Environ. Int. 2023, 174, 107889. [Google Scholar] [CrossRef] [PubMed]
  54. Wei, J.; Li, Z.; Lyapustin, A.; Sun, L.; Peng, Y.; Xue, W.; Su, T.; Cribb, M. Reconstructing 1-km-resolution high-quality PM2.5 data records from 2000 to 2018 in China: Spatiotemporal variations and policy implications. Remote Sens. Environ. 2021, 252, 112136. [Google Scholar] [CrossRef]
  55. Wang, G.; Gao, J.; Li, Y. Does Low-Carbon Transition Promote Regional Sustainable Development? Evidence from the Huaihe River Ecological Economic Belt. Sustainability 2024, 16, 9107. [Google Scholar] [CrossRef]
  56. Liu, J.; Wilson, M.; Hu, G.; Liu, J.; Wu, J.; Yu, M. How does habitat fragmentation affect the biodiversity and ecosystem functioning relationship? Landsc. Ecol. 2018, 33, 341–352. [Google Scholar] [CrossRef]
  57. Hong, K.; Qiu, L.; Yang, D.; Jiang, M. Spatio-Temporal Evolution and Correlation Analysis of Urban Land Use Patterns and Air Quality in Pearl River Delta, China. Front. Environ. Sci. 2021, 9, 698383. [Google Scholar] [CrossRef]
  58. Feng, Y.; Li, C.; Feng, J. Spatiotemporal response of ecosystem service value in Jinan metropolitan area to urban expansion based on GTWR model. J. Beijing For. Univ. 2024, 46, 104–118. [Google Scholar] [CrossRef]
  59. Wang, X.; Zhang, Q.; Chang, W.-Y. Does economic agglomeration affect haze pollution? Evidence from China’s Yellow River basin. J. Clean. Prod. 2022, 335, 130271. [Google Scholar] [CrossRef]
  60. Mi, Y.; Sun, K.; Li, L.; Lei, Y.; Wu, S.; Tang, W.; Wang, Y.; Yang, J. Spatiotemporal pattern analysis of PM2.5 and the driving factors in the middle Yellow River urban agglomerations. J. Clean. Prod. 2021, 299, 126904. [Google Scholar] [CrossRef]
  61. Yang, D.; Meng, F.; Liu, Y.; Dong, G.; Lu, D. Scale Effects and Regional Disparities of Land Use in Influencing PM2.5 Concentrations: A Case Study in the Zhengzhou Metropolitan Area, China. Land 2022, 11, 1538. [Google Scholar] [CrossRef]
  62. Zhu, H.; Zhang, P.; Wang, N.; Zhang, F.; Ma, W.; Wen, F.; Li, M.; Wang, Y.; Fan, X.; Hou, K.; et al. Investigating the multiscale associations between urban landscape patterns and PM1 pollution in China using a new combined framework. J. Clean. Prod. 2024, 456, 142306. [Google Scholar] [CrossRef]
  63. Wang, Q.; Kwan, M.-P.; Zhou, K.; Fan, J.; Wang, Y.; Zhan, D. The impacts of urbanization on fine particulate matter (PM2.5) concentrations: Empirical evidence from 135 countries worldwide. Environ. Pollut. 2019, 247, 989–998. [Google Scholar] [CrossRef] [PubMed]
  64. Montes, C.; Sapkota, T.; Singh, B. Seasonal patterns in rice and wheat residue burning and surface PM2.5 concentration in northern India. Atmos. Environ. X 2022, 13, 100154. [Google Scholar] [CrossRef]
  65. Jong-Chul, J.; Lee, P.S.-H. Spatial distribution of particulate matters in comparison with land-use and traffic volume in Seoul, Republic of Korea. Atmos. Environ. X 2018, 48, 123–138. [Google Scholar] [CrossRef]
  66. Wu, C.; Ren, F.; Hu, W.; Du, Q. Multiscale geographically and temporally weighted regression: Exploring the spatiotemporal determinants of housing prices. Int. J. Geogr. Inf. Sci. 2019, 33, 489–511. [Google Scholar] [CrossRef]
Figure 1. Location of the study area.
Land 14 00568 g001
Figure 2. (a) Ground stationary monitoring data of PM2.5 in 2015; (b) linear fitting between PM2.5 satellite-derived remote sensing dataset (V4.CH.02) and ground stationary monitoring data.
Land 14 00568 g002
Figure 3. Technology roadmap.
Land 14 00568 g003
Figure 4. Time variation in PM2.5 concentration.
Land 14 00568 g004
Figure 5. Spatial pattern of average annual PM2.5 concentration from 1998 to 2021.
Land 14 00568 g005
Figure 6. Cold/hot-spot distribution of PM2.5 average annual concentration.
Land 14 00568 g006
Figure 7. Trends of PM2.5 concentration from 1998 to 2021.
Land 14 00568 g007
Figure 8. Land-use pattern.
Land 14 00568 g008
Figure 9. Results of GTWR regression coefficients. (ad) Average GTWR regression coefficients from 1998 to 2003; (eh) average GTWR regression coefficients from 2003 to 2008; (il) average GTWR regression coefficients from 2008 to 2013; (mp) average GTWR regression coefficients from 2013 to 2018; (qt) average GTWR regression coefficients from 2018 to 2021; (ux) average GTWR regression coefficients from 1998 to 2021.
Land 14 00568 g009
Figure 10. Spatial pattern of the MWGR coefficients for cropland (a), forest (b), water bodies (c), and impervious surfaces (d).
Land 14 00568 g010
Table 1. The correlation coefficient between land-use area and PM2.5 concentration.
Land-Use TypeCroplandForestGrasslandWater BodiesBarrenImpervious Surfaces
Coefficient0.081−0.2600.138−0.184−0.1800.269
Table 2. Spatial autocorrelation test.
YearMoran’s IZ Valuep ValueYearMoran’s IZ Valuep Value
19980.6315.6750.00120100.5935.3620.001
19990.5585.0210.00120110.5785.3170.001
20000.4794.4010.00120120.6525.8650.001
20010.5815.2580.00120130.5775.2460.001
20020.5354.8870.00120140.4714.3520.001
20030.5995.4020.00120150.6315.7330.001
20040.4984.5580.00120160.6565.9090.001
20050.5525.0450.00120170.6265.5860.001
20060.6365.7160.00120180.6175.560.001
20070.6195.5570.00120190.6766.0230.001
20080.5725.2250.00120200.6525.8240.001
20090.5725.1930.00120210.5825.2460.001
Table 3. Regression results of the spatial econometric model.
Explanatory VariablesOLSSLMSEMSDMSpatial Effect
Spatial rho/lambda\0.605 ***0.786 ***0.813 ***\
Cropland0.0310.037 ***0.097 ***−0.116 ***Direct effect
Forest−0.040 ***−0.017 ***−0.018 ***−0.020 ***
Grassland0.036 ***0.011 ***0.010 ***0.008 ***
Water bodies−0.012 *−0.009 ***−0.008 **−0.015 ***
Barren−0.005−0.001−0.002−0.001
Impervious surfaces0.052 ***0.044 ***0.101 ***0.099 ***
W_Cropland 0.173 ***Spillover effect
W_Forest −0.014 ***
W_Grassland 0.014 ***
W_Water bodies −0.011 **
W_Barren 0.001
W_Impervious surfaces 0.097 ***
Log-likelihood\865.5264867.86171042.3589\
R-squared0.310.570.740.87\
Note: *** significantly correlated at 0.001 level; ** significantly correlated at 0.01 level; * significantly correlated at 0.05 level.
Table 4. Comparison of OLS, GWR, and GTWR models.
Regression ModelAICcR2Adj.R2
OLS5221.7180.1840.182
GWR5043.3300.4330.428
GTWR4186.3900.8600.858
Table 5. MGWR model coefficient.
VariablesMeanStd.MinMedianMax
Cropland0.1650.24−0.2850.1380.889
Forest−0.3650.002−0.369−0.365−0.36
Water bodies−0.0920.205−0.521−0.0810.483
Impervious surfaces0.2490.257−0.0270.141.299
Table 6. Bandwidth and diagnostics for MGWR and GWR.
ArgumentsMGWRGWR
Cropland36,622.48(m)36,086.77(m)
Forest561,198.32(m)36,086.77(m)
Water bodies38,085.89(m)36,086.77(m)
Impervious surfaces24,851.41(m)36,086.77(m)
AICc2700.7485082.049
R20.8330.506
Adj.R20.8260.505
Table 7. Comparison of similar studies in other regions.
Study AreaMethodologyAdjusted R2Key Findings
Huaihe River Ecological Economic Belt (this study)Spatial econometric model0.870Construction land was significantly positively correlated with PM2.5 concentration, while ecological land such as forests and water bodies could effectively reduce PM2.5. At the same time, the impact of land use on PM2.5 had a significant spatial spillover effect and spatiotemporal heterogeneity.
GTWR0.858
MGWR0.826
Zhengzhou metropolitan area [61]MGWR0.994The impact of land use on PM2.5 concentration varied at different scales and in different regions.
City clusters along the middle reaches of the Yangtze River [62]MGWR0.963Urban landscape patterns were closely related to PM1 pollution with obvious spatial differences, and the correlation between urban landscape pattern and PM1 concentration tends to increase from the national scale to the city cluster scale.
Nanjing [45]GTWR0.860There were significant differences in the driving mechanisms of landscape pattern on habitat quality in spatiotemporal dimension.
MGWR0.922
China [7]Spatial econometric model0.920Artificial surfaces, cultivated land, and deserts were positively correlated with PM2.5, while forests, grassland, and unused land were negatively correlated with PM2.5.
Disclaimer/Publisher’s Note: The statements, opinions and data contained in all publications are solely those of the individual author(s) and contributor(s) and not of MDPI and/or the editor(s). MDPI and/or the editor(s) disclaim responsibility for any injury to people or property resulting from any ideas, methods, instructions or products referred to in the content.

