Abstract
Urban expansion into rural and peri-urban areas increases landslide risks, posing significant threats to infrastructure and public safety. However, most studies focus on surface displacement or meteorological inputs, with less emphasis on subsurface sensor data that could detect early instability precursors. To address these gaps, this study presents a proof-of-concept validation, establishing the feasibility of using subsurface sensor data to predict near-surface slope displacements. A laboratory-scale slope model (300 cm × 50 cm × 50 cm) at a 30° inclination was subjected to simulated rainfall (150 mm/h for 180 s), with displacement measured at depths of 5 cm and 25 cm using PDP-2000 extensometers. The Gradient Boosting Regressor (GBR) effectively captured the nonlinear relationship between subsurface and surface displacements, achieving high predictive accuracy (R2 = 0.939, MSE = 0.470, MAE = 0.320, RMSE = 0.686). Results demonstrate that, while subsurface sensors do not detect sudden failure events, they effectively capture progressive deformation, offering valuable inputs for multi-sensor EWS in proactive urban planning. Despite demonstrating feasibility, limitations include the controlled laboratory environment and simplified slope conditions. Future work should focus on field-scale validation and multi-sensor fusion to enhance real-world applicability in diverse geological settings.
1. Introduction
Expanding urban areas into rural and peri-urban regions presents challenges for land stability management, particularly in areas with limited governance and infrastructure [1]. Landslides in these transitioning landscapes pose significant threats to infrastructure and safety [2,3,4,5]. Developing effective early warning systems (EWSs) is, therefore, critical to mitigate these hazards and promote sustainable land use. Various methods for monitoring and predicting slope instability have been developed, each with distinct advantages and limitations.
Rainfall intensity and duration are commonly used as primary triggers in landslide EWSs [4,6,7]. While cost-effective, these methods often overlook subsurface processes and require extensive historical data for calibration [3]. Multi-temporal interferometry [8], TRMM-based rainfall estimation [9], and ground-based interferometric synthetic aperture radar (GB-InSAR) [10] have been utilized for large-scale landslide surveillance. Their accuracy is limited by factors like cloud cover, vegetation interference, and the need for manual ground truthing [2]. On-site systems, including inclinometers, strain gauges, and distributed optical fiber sensors, have been deployed to monitor localized slope movements in real time [11,12]. However, surface-level sensors are susceptible to environmental disturbances [6], whereas subsurface instrumentation offers more protected and sensitive readings that can detect precursors to surface failures [13].
Machine learning has been explored to model nonlinear landslide dynamics [5,14,15]. Ensemble and deep learning algorithms enhance landslide susceptibility mapping by incorporating multi-source data. However, most studies focus on surface displacement [5] or meteorological inputs, with less emphasis on subsurface sensor data that could detect early instability precursors. This highlights a significant research gap: the integration of subsurface sensor data into EWS remains underexplored, particularly regarding the establishment of thresholds for subsurface motion that precedes surface failures.
This study serves as a proof-of-concept validation to demonstrate the feasibility of using subsurface sensor data to predict near-surface slope displacements. The proposed methodology employs the Gradient Boosting Regressor (GBR) for its ability to handle complex, heterogeneous datasets while maintaining interpretability [16]. Subsurface sensors are strategically placed in protected locations to minimize environmental noise and reduce maintenance requirements, enhancing data reliability. Additionally, laboratory-scaled simulations of the subsurface–surface interactions provide a controlled environment to assess the predictive capabilities of the proposed EWS, ensuring applicability across diverse geotechnical contexts.
This research aims to strengthen EWS by incorporating subsurface displacement data, particularly in scenarios where surface sensors are unreliable [1,2]. Enhanced EWS can inform urban planning in ecologically sensitive or rapidly developing areas, supporting risk-informed land governance and sustainable urban expansion. Integrating advanced monitoring systems contributes to the broader understanding of urban–rural interactions and aids in developing nature-based solutions and green infrastructure within expanding urban landscapes.
In summary, this study advances landslide monitoring by demonstrating the potential of subsurface sensor data integration into EWS, addressing existing methodological limitations, and providing insights for sustainable urban growth. The proposed framework aligns with sustainable urban planning goals, offering policymakers, urban planners, and geotechnical engineers tools to support resilient development in ecologically sensitive urban–rural interfaces.
2. Materials and Methods
Building on prior research outlined in the literature review, this study investigates the use of subsurface displacement data as a predictive tool for surface-level instability. Recent findings highlight the value of GBR for modeling complex, nonlinear interactions in geotechnical datasets [17]. By leveraging GBR’s computational efficiency, interpretability, and minimal preprocessing requirements, this research aims to determine the feasibility of using subsurface monitoring data as an early warning indicator for slope failure.
2.1. Experimental Setup
In this study, soil displacement was monitored using two PDP-2000 extensometers (ZIS I&C, Seoul, Republic of Korea) placed at depths of 5 cm and 25 cm. Details of these devices are provided in Table 1. Each extensometer was integrated into a wired data acquisition system to ensure continuous and reliable measurement.

Table 1.
Technical specifications of the PDP-2000 extensometer used in the experiment.
The sensors record displacement through wire extensions, as illustrated in Figure 1a. However, because the initial extensometer model was equipped only with a wire and ring, an angle plate was installed to enhance wire tension and improve the accuracy of soil displacement measurements (Figure 1b). The overall setup for measuring slope displacement is shown in Figure 1c.
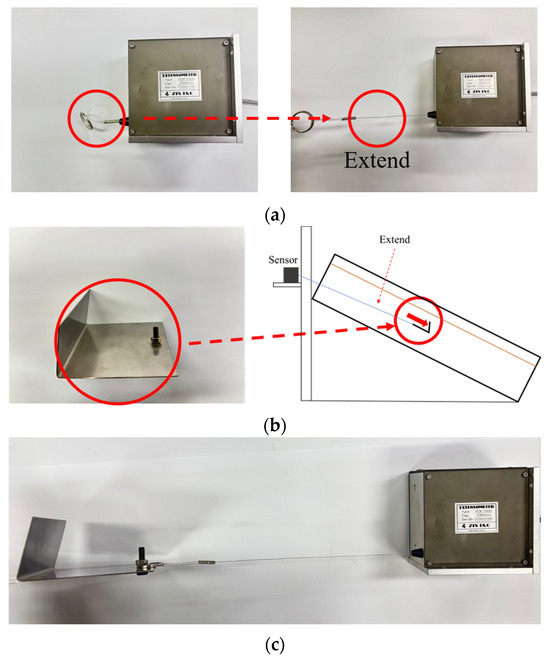
Figure 1.
Extensometer setup: (a) example of measurement displacement through extension; (b) angle plate installation; (c) overall extensometer sensor.
The experimental procedure followed a structured sequence of model construction, sensor installation, and rainfall simulation, as illustrated in Figure 2. A scaled slope model (300 cm × 50 cm × 50 cm) was constructed to replicate rainfall-induced slope failures under controlled conditions. To capture both shallow and deeper soil movements, the two extensometers were embedded at 5 cm and 25 cm depths. The shallower sensor captured near-surface deformation, while the deeper sensor monitored subsurface displacement patterns affected by water infiltration. Nayak et al. [18] discuss that measuring beyond 5 cm captures water dynamics driven by surface infiltration and deeper soil interactions; consequently, monitoring at 25 cm provides critical data on moisture-induced instability that may not be evident at shallower depths. A 15 cm horizontal buffer zone at the lower edge of the slope further regulated water inflow and outflow, minimizing uneven saturation and erosion.
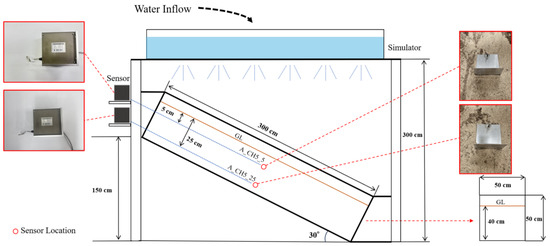
Figure 2.
Schematic diagram illustrating the slope model dimensions, extensometer placements, and the positioning of the rainfall simulator for controlled water infiltration.
A rainfall simulator was constructed using a water supply tank with adjustable rainfall holes, arranged so that the uppermost portion of the tank is approximately 3 m above the bottom edge of the slope model. Importantly, the rainfall distribution bar is horizontally oriented, resulting in variable drop heights across the slope: water falls from roughly 1 m above the top portion of the slope, about 2 m at mid-slope, and nearly 3 m at the bottom. This configuration ensured a uniform distribution of water over the slope, effectively replicating natural rainfall dynamics [19]. The rainfall intensity was consistently maintained at 150 mm/h, simulating heavy rainfall conditions typically associated with slope failures.
Sieve analyses confirmed that the soil used in the model was a well-graded sand (SW), classified according to the Unified Soil Classification System (USCS) (Cu = 6.04, Cc = 1.21), with a minimal portion of fines (silt and clay, less than 5%). At its optimum moisture content (15%), determined by ASTM D698 [20] compaction tests, direct shear tests (ASTM D3080) [21] yielded a friction angle of 35°. Laboratory tests determined an elastic modulus of 15,000 kPa and a Poisson’s ratio of 0.35, indicating the soil’s ability to sustain deformation under load. The soil was cohesionless (c = 0), with a specific gravity of 2.6 and a permeability coefficient of 1.35 × 10⁻3 cm/s, indicating rapid water infiltration during intense rainfall events.
Under unsaturated conditions, a 30° slope remains marginally stable, with a factor of safety slightly above 1.0. However, as rainfall infiltration progresses, the effective friction angle decreases, leading to a reduction in the factor of safety until failure occurs. Previous laboratory-scale studies have demonstrated that a 30° slope effectively replicates instability processes under controlled rainfall conditions, making it a suitable reference for experimental analysis [22,23,24]. By setting the inclination near—but still below—the soil’s peak friction angle, the experiment captures the transition from stability to failure within a controlled timeframe. The 300 cm slope length follows Mangeney et al. [24], whose research demonstrated that longer slopes more accurately replicate natural flow dynamics, allowing for realistic observations of erosion and slope failure mechanisms. To maintain structural integrity and consistency, the slope was securely fixed throughout testing.
During rainfall simulation, each extensometer recorded displacement at a frequency of 5 Hz (every 0.2 s), capturing transient slope responses under intense rainfall. The experiment lasted 180 s, producing approximately 900 data points per sensor. A single experimental configuration was used to establish proof-of-concept for employing subsurface data as an early indicator of slope instability, minimizing confounding variables and enabling a clear assessment of subsurface–surface displacement relationships. The workflow of the laboratory experiment, as shown in Figure 3a, illustrates the pre-experiment condition of the slope model, followed by the model during rainfall simulation in Figure 3b, and finally the post-simulation condition in Figure 3c.
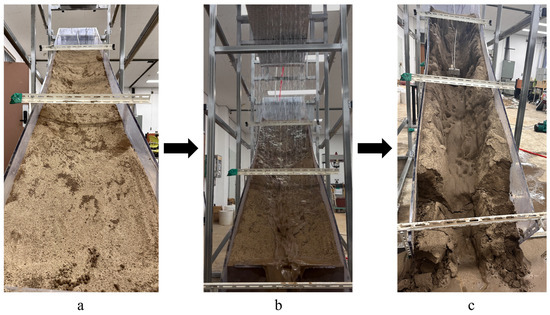
Figure 3.
Workflow of the laboratory experiment detailing (a) initial slope model setup, (b) controlled rainfall simulation, and (c) post-simulation observations.
Each extensometer was calibrated before testing to ensure accuracy and reliability. Zero-load checks confirmed baseline measurements, and any offsets were adjusted to mitigate sensor drift. During preprocessing, negative displacement values resulting from minor sensor fluctuations or noise were reset to zero, aligning the data with expected physical behavior.
Missing values were addressed through column-wise mean imputation to preserve the overall distribution of the dataset. Unrealistic negative readings, introduced by sensor noise or calibration inconsistencies, were replaced with zeros. A Kalman filter was then applied to smooth displacement signals and reduce high-frequency noise, using parameters optimized by the expectation–maximization (EM) algorithm over ten iterations. This approach helped retain genuine signals while reducing noise.
The Kalman filter applied in this study followed a state-space representation:
where represents the state estimate at time t, is the state transition matrix, is process noise, and is the observation noise. This iterative framework provided a robust mechanism to reduce noise and generate reliable input data for modeling.
Each experimental run produced approximately 900 data points per sensor, partitioned into training and testing subsets. Splits were systematically varied between 50% and 95% (in 5% increments) to determine the most effective partitioning strategy. Model performance was evaluated using mean squared error (MSE), mean absolute error (MAE), root mean squared error (RMSE), and the coefficient of determination (R2). These metrics provided quantitative assessments of model accuracy and generalizability, enabling a comprehensive evaluation of GBR’s predictive capabilities for slope instability.
2.2. GBR Model Development
GBR was utilized in this study to model the nonlinear relationships between subsurface displacements and surface-level instability. By iteratively building an ensemble of decision trees, GBR refines its predictions by focusing on residual errors at each stage, capturing complex dependencies in the data. Unlike traditional models, GBR requires minimal assumptions about data distribution, making it particularly suitable for datasets derived from geotechnical experiments. However, achieving optimal performance requires careful tuning of the model’s parameters to effectively balance accuracy and generalization.
2.2.1. Model Training and Prediction
The model training process involved iteratively building decision trees, where each successive tree corrected the residual errors of its predecessors. The GBR framework, as illustrated in Figure 4, demonstrates its iterative refinement process, which includes the following:
- Calculating residuals from the current model predictions.
- Training weak learners (decision trees) to minimize these residuals.
- Iteratively updating the model to reduce overall errors.
The objective function being minimized is represented as
where is the updated model at iteration m, is the cumulative prediction from the previous m − 1 iterations, is the learning rate, and is the weak learner fitted to the residuals. This ensemble approach effectively captured the nonlinear dependencies between subsurface and surface displacements.
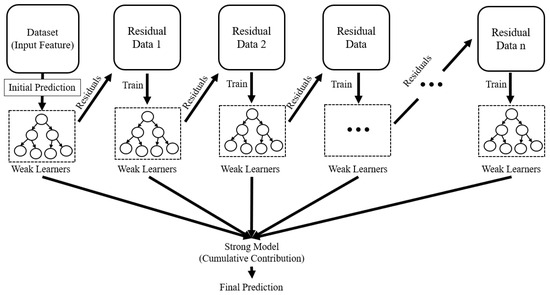
Figure 4.
Architecture of GBR.
2.2.2. Model Evaluation Metrics
The GBR model’s performance was evaluated using metrics that provided a comprehensive assessment of both prediction accuracy and explanatory power. Mean squared error (MSE) was employed to quantify the average squared differences between predicted and actual values, calculated as
where represents the actual values for the ith observation, represents the predicted values for the ith observation, and n is the total number of observations. MSE more heavily penalizes larger errors due to its quadratic nature, making it particularly sensitive to significant deviations between predictions and ground truth. To enhance interpretability, root mean squared error (RMSE) was also computed by taking the square root of the MSE, allowing the error magnitude to be expressed in the same units as the target variable:
In addition to MSE and RMSE, mean absolute error (MAE) was calculated to measure the average magnitude of prediction errors without considering their direction:
Unlike MSE, MAE is less sensitive to outliers and provides a straightforward interpretation of typical prediction errors. Finally, the coefficient of determination was used to evaluate the proportion of variance in the target variable explained by the model, defined as
where is the mean of the actual values. The score ranges from 0 to 1, with values closer to 1 indicating a better fit.
To ensure the model’s generalizability, a five-fold cross-validation approach was employed. In this procedure, the dataset was partitioned into K = 5 folds, where each fold was used once as the validation set, while the remaining K − 1 folds were used for training. The mean squared error for each fold was calculated, and the average across all folds provided a robust measure of the model’s stability:
where K is the number of folds and represents the mean squared error for the Kth fold. In addition, bootstrapping with 1000 iterations was employed to determine the 95% confidence interval for the MSE.
2.2.3. Hyperparameter Selection and Evaluation
Hyperparameters directly influence the learning process, model complexity, and generalization. To optimize GBR, a grid search with five-fold cross-validation was conducted, systematically evaluating combinations of key hyperparameters: the number of estimators, learning rate, maximum tree depth, subsampling ratio, and minimum samples split. The number of estimators (100–300) governed the boosting stages, balancing bias reduction and computational demands. The learning rate (0.01–0.1) controlled the incremental updates contributed by each tree, with lower rates reducing overfitting at the cost of longer training times. Maximum tree depth (3–7) determined the complexity of individual trees, where deeper trees captured finer patterns but risked overfitting.
Subsampling ratios (0.8 and 1.0) introduced bootstrapping by training each tree on a random subset of the data, reducing variance and improving robustness. Minimum samples split (2–10) controlled the minimum data required for a node split, influencing the granularity of tree decisions and training efficiencies, and served as the primary metric for evaluating performance across cross-validation folds. The hyperparameter combination that minimized average MSE was selected to balance bias and variance. The model was then retrained on the full training set with the optimal configuration and evaluated on a held-out test set using MSE, RMSE, MAE, and R2.
Bootstrapping, implemented through subsampling, was essential for variance reduction and model robustness. By training each tree on a subset of the data, bootstrapping introduced diversity into the ensemble, mitigating overfitting and improving generalization. This approach ensured that the model remained resilient to noise and capable of consistent predictions across varying data subsets.
3. Results and Discussion
This study explores the feasibility of using extensometers placed at different depths (5 cm and 25 cm) to track rainfall-induced slope failures in a controlled laboratory setting. The primary objective is to assess whether subsurface displacement data from a single subsurface sensor can correlate with or predict near-surface instability. This proof-of-concept addresses how subsurface displacement data reflect shallow-level instability under progressive failure conditions and whether machine learning—specifically, GBR—can model the complex relationships between these sensor readings.
3.1. Simulation Results
The time-series data from extensometers reveal distinct displacement trends for surface and subsurface sensors during rainfall-induced slope failure, as shown in Figure 5. Between 0 and 45 s, both surface (5 cm) and subsurface (25 cm) sensors showed minimal displacement. The surface sensor recorded a mean displacement of 3.43 mm, while the subsurface sensor recorded 3.67 mm, indicating stable slope conditions despite rainfall infiltration. As rainfall continued from 45 to 75 s, the surface sensor exhibited a rapid displacement increase to approximately 15 mm, coinciding with the onset of surface cracking. Concurrently, the subsurface sensor fluctuated around 5 mm displacement, suggesting initial stress redistribution beneath the slope surface.
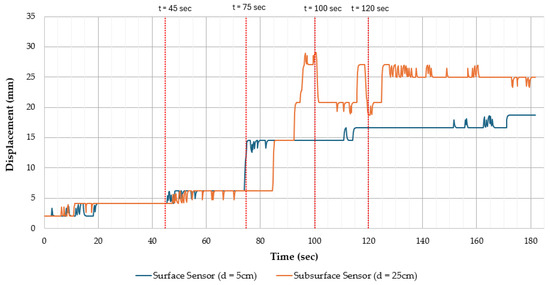
Figure 5.
Preprocessed sensor reading.
From 75 to 100 s, surface sensor readings averaged 14.44 mm, fluctuating between 12 and 15 mm, whereas the subsurface sensor experienced stepwise jumps, increasing by 22.70 mm within this period. This pattern indicates that subsurface movements intensified before significant surface displacement.
From 100 to 180 s, the surface sensor displayed minor fluctuations, gradually increasing to around 20 mm. Notably, the surface sensor displacement stagnated post 120 s, which may be attributed to exposure-related disturbances, whereas the subsurface sensor stabilized at approximately 25 mm.
As summarized in Table 2, quantitative assessments reinforce these observations, with subsurface sensors exhibiting a higher mean displacement (24.86 mm) compared to surface sensors (17.08), a broader displacement range (22.70 mm at 75–100 s for subsurface sensors vs. 2.09 mm at 0–45 s for surface sensors), and higher variability (standard deviation of 7.86 mm vs. 0.95 mm). These metrics indicate that subsurface movements are more pronounced and variable, highlighting their potential for early detection of slope failure.

Table 2.
Comparison of displacement metrics between surface and subsurface sensors across different failure phases.
3.2. GBR Model
The GBR model was chosen for its ability to capture nonlinear relationships inherent in rainfall-induced slope failures. Its ensemble-based approach iteratively builds decision trees, focusing on residual errors at each step, making it highly effective for irregular or noisy geotechnical datasets. Unlike traditional regression models, GBR’s flexibility in handling data without assuming specific distributions aligns with the unpredictable nature of slope displacement data.
To balance model generalization and evaluation robustness, training ratios ranging from 50% to 95% were systematically tested. A smaller training ratio (e.g., 50%) yielded the highest R2 value (0.9507) but was associated with increased MSE, RMSE, and MAE, indicating limited generalization capacity. Conversely, the lowest MSE, RMSE, and MAE were observed at a 95% training ratio, but the reduced test set size raised concerns regarding overfitting and generalization to unseen data. The results for the different metrics across these training ratios are illustrated in Figure 6.
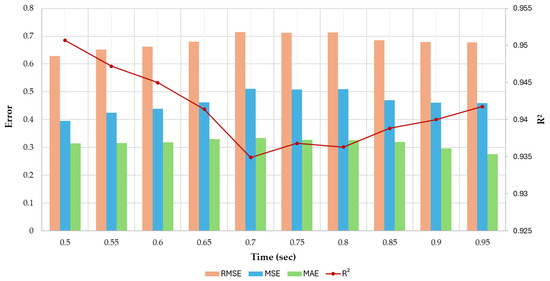
Figure 6.
Comparison of different training ratio metrics.
An 85% training ratio was selected as the optimal configuration, providing a sufficiently large dataset to capture general patterns while preserving a robust test set for validation. This balance ensured reliable performance evaluation and practical alignment with real-world applications, where variability and complexity demand robust modeling.
With the selected training ratio, a grid search was conducted to optimize key hyperparameters of the GBR model. Parameters such as learning rate (0.1), tree depth (3), subsample ratio (1.0), and boosting stages (100) were tuned to balance model complexity while accurately capturing the incremental relationships between shallow and subsurface displacements. The optimal configuration achieved a best cross-validation MSE of 0.384, demonstrating consistent and reliable model performance across training folds.
The bootstrapping complemented cross-validation by generating resampled datasets for performance variability estimation. This method yielded consistent metrics, with an average MSE of 0.367, RMSE of 0.602, and standard deviations of 0.074 and 0.063 for MSE and RMSE, respectively. These results confirmed the model’s ability to generalize across varied data distributions while minimizing overfitting. Furthermore, bootstrapping provided a detailed error distribution estimate, increasing confidence in the model’s applicability to real-world scenarios.
Evaluation of the test set (15% of the data) yielded an R2 value of 0.939, MSE of 0.470, MAE of 0.320, and RMSE of 0.686. The discrepancy between cross-validation MSE (0.384) and test set MSE (0.470) stems from unseen data variability, optimistic cross-validation biases, and the limited test set size amplifying performance variability. These findings underscore the importance of sufficiently large test sets for accurate real-world performance assessments.
As shown in Figure 7, the CDF of residuals highlights the model’s prediction accuracy, with a steep climb near zero indicating that most errors are small. However, the tapering tail suggests a few larger errors under specific conditions. This distribution emphasizes the model’s robustness in handling most scenarios while pinpointing areas that may require further refinement. Similarly, the learning curve depicted in Figure 8 illustrates how the model’s MSE evolves with increasing training data. Initially, validation error is significantly higher than training error, reflecting potential overfitting with smaller datasets. Beyond approximately 300–400 samples, the two curves converge, demonstrating the model’s improved generalization with larger datasets. These trends reinforce the model’s suitability for real-world applications, where expanding training data can enhance predictive accuracy.
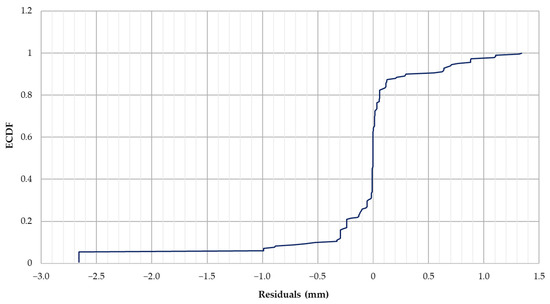
Figure 7.
CDF of residuals.
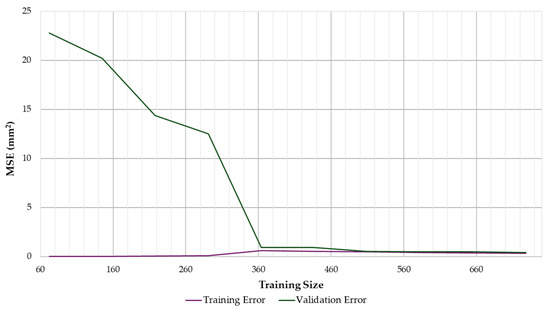
Figure 8.
Learning curve of the model (training set size vs. MSE).
While subsurface sensor data do not precede shallow failures, their role in tracking progressive deformation stages becomes evident when examined alongside displacement trends over time, as shown in Figure 6. Additionally, the residual distribution (Figure 7) underscores the model’s ability to minimize prediction errors in most cases, while the learning curve (Figure 8) validates its generalization capabilities with adequate data. Although the GBR model captures progressive displacement patterns effectively, it is not suited for the early detection of sudden failure events, underscoring the necessity of integrating multi-sensor approaches to improve reliability. These findings highlight the potential of subsurface displacement data to enhance multi-sensor monitoring systems, offering crucial insights into slope failure progression and enabling proactive interventions in practical applications.
3.3. Physical and Practical Implications
This study advances previous research on landslide monitoring and early warning systems by integrating machine learning with subsurface monitoring data to enhance predictive accuracy. For example, Moriwaki et al. [23] demonstrated that subsurface sensors effectively detect pre-failure conditions through increases in pore-water pressure, a finding that aligns with our results. Their research highlighted the critical role of subsurface monitoring in identifying early failure indicators, revealing that significant rises in pore-water pressure preceded surface displacement. Building on these insights, our study employs machine learning to establish predictive relationships between subsurface displacement and surface early warning capabilities.
Similarly, Askarinejad and Springman [25] emphasized that subsurface sensors capture deformation profiles that surface sensors cannot detect. While their study focused on real-time monitoring, our research extends this approach by incorporating predictive analytics, enabling proactive interventions before failures occur. Additionally, Li et al. [26] applied exploratory data analysis (EDA) techniques to monitor the deformation characteristics of rainfall-induced rotational landslides, integrating various monitoring methods, including subsurface analysis, to achieve a comprehensive understanding of slope behavior. Consistent with these efforts, our combination of subsurface sensor data with GBR enhances the predictive capabilities of EWS using multi-depth monitoring data.
Furthermore, Merritt et al. [27] investigated landslide activation using electrical resistance monitoring, focusing on subsurface moisture and pore pressure variations. Their findings reaffirm the value of subsurface monitoring for early warning applications. However, whereas their research primarily identified early signs of instability, our study integrates multiple subsurface parameters with machine learning, offering improved system robustness and reliability.
From a practical standpoint, subsurface sensors integrated with machine learning provide an opportunity to develop real-time, automated early warning systems, particularly in regions vulnerable to rainfall-induced slope failures. The GBR model employed in this study offers an optimal balance of accuracy, simplicity, and computational efficiency, making it a viable candidate for operational deployment. Additionally, subsurface monitoring presents distinct advantages over conventional surface-based systems by reducing maintenance demands and minimizing environmental exposure, thereby enhancing long-term reliability.
Overall, while prior studies have demonstrated the effectiveness of subsurface monitoring, our research introduces a novel framework that combines advanced data analytics with subsurface data. This integration improves prediction accuracy, minimizes false alarms, and provides actionable insights for decision-making in urban and peri-urban settings. By leveraging machine learning techniques, our framework enhances the capability to more reliably predict slope failures.
3.4. Limitations and Future Directions
Despite its promising results, this study has several limitations. The laboratory-scale setup, with a maximum depth of 40 cm, simplifies the complexities of natural slopes, including variable soil compositions and geological heterogeneity. These controlled conditions may not fully capture the nuances of natural rainfall events, which widely vary in intensity, duration, and infiltration paths. The reliance on a single subsurface sensor also limits the model’s ability to adapt under fluctuating conditions, emphasizing the need for multi-depth and multi-instrument configurations. Methods similar to those employed by Askarinejad and Springman [25] and Merritt et al. [27] could provide a more comprehensive failure profile spanning near-surface to deeper layers, enhancing monitoring accuracy.
Building on these limitations, while the current study demonstrates the feasibility of subsurface sensors in early warning applications, precise thresholds for triggering alerts remain to be established. Expanding the dataset through prolonged monitoring and testing in diverse environmental conditions will be crucial to refining lead times and improving prediction accuracy. Future research should focus on deploying multi-depth sensor networks and employing advanced data analytics, such as ensemble learning techniques, to enhance the system’s early warning capabilities.
Translating this proof-of-concept into field applications requires addressing the complexities of real-world slope conditions. Scaling up instrumentation with multi-depth sensor arrays, including pore-water pressure transducers and inclinometers, is crucial to capturing unstable material across heterogeneous terrains. Optimizing sensor placement strategies will ensure comprehensive data coverage while minimizing environmental interference. Site-specific calibration of the GBR model is essential to account for variability in geological formations, hydrology, and vegetation. Extensive field data collection and real-time data assimilation will allow adaptive recalibration based on evolving slope conditions, ensuring robust and reliable predictions.
Long-term field monitoring with continuous data logging and remote telemetry solutions will facilitate real-time tracking of progressive slope movements. Combining auxiliary datasets—such as historical rainfall records, remote sensing imagery, and geotechnical borehole logs—can provide a holistic understanding of slope behavior and refine early warning thresholds. Larger-scale or full-scale setups, as highlighted by Li et al. [26] and Moriwaki et al. [23], are necessary to capture critical slope behaviors not evident in controlled laboratory conditions. Such efforts will bridge the gap between proof-of-concept and practical application by capturing deep-seated failure mechanisms and delayed hydrological responses. Prioritizing sites with well-documented landslide histories will enhance model performance under real-world conditions.
Additionally, including physics-informed machine learning approaches could further enhance the integration of geotechnical principles with data-driven models, improving both interpretability and predictive performance. Embedding effective stress theories and infiltration dynamics into machine learning frameworks will ensure predictive reliability while bridging the gap between empirical data and geotechnical knowledge. These advancements will support the integration of subsurface-focused methods into existing early warning systems, offering practical and scalable solutions for geotechnical engineers and risk managers. To facilitate widespread implementation, future efforts should prioritize the development of standardized deployment guidelines, stakeholder engagement strategies, and comprehensive cost–benefit analyses to evaluate the feasibility of large-scale monitoring systems.
4. Conclusions
This study provides an initial framework for slope stability monitoring, demonstrating its potential while recognizing the need for further field validation. The GBR model demonstrates computational efficiency and high predictive accuracy, particularly for medium-sized datasets, and effectively captures the nonlinear relationships between surface and subsurface displacements. These findings validate the feasibility of using subsurface displacement data as reliable early indicators of surface instability, bridging critical gaps in existing monitoring systems.
Key findings include the following:
- Subsurface sensors strongly correlate with surface-level displacements, providing valuable insights into slope failure progression and supporting early detection efforts.
- The GBR model achieves high predictive accuracy, with metrics including an R2 value of 0.939, MSE of 0.470, MAE of 0.320, and RMSE of 0.686, underscoring its robustness and reliability.
- Controlled experiments demonstrate the proof-of-concept, showing that subsurface displacement data can complement shallow sensors to effectively capture progressive slope failures.
- This study emphasizes the practicality of subsurface data as a focused monitoring layer for high-risk areas.
While this study establishes GBR as a robust tool, the laboratory-scale setup and controlled conditions represent key limitations. Future research should prioritize field-scale validation, diverse rainfall scenarios, and expanded instrumentation such as pore-water pressure sensors and multi-depth arrays. These steps will refine the model’s robustness and improve its adaptability under real-world conditions.
By integrating subsurface data with machine learning, this work offers a scalable and sustainable framework for slope stability monitoring. The proposed approach enhances disaster preparedness and supports resilient urban development, addressing critical challenges in slope management and infrastructure safety. The findings contribute to the broader discourse on urban–rural interactions by offering practical insights into land use planning and risk mitigation strategies in peri-urban areas prone to rainfall-induced slope instability. Machine learning integration with geotechnical monitoring supports data-driven decision-making, facilitating sustainable urban expansion while minimizing risks associated with land development in ecologically sensitive areas. As cities expand into rural landscapes, this research provides a foundation for policymakers and urban planners to develop proactive, resilient land use strategies.
Author Contributions
S.A.R.: data curation, formal analysis, investigation, methodology, software, writing—original draft. J.C.: formal analysis, investigation, methodology, visualization, writing—original draft. C.R.G.: methodology, visualization, writing—review and editing. Y.K. (Yongseong Kim): project administration, supervision, validation. Y.K. (Yongjin Kim): funding acquisition, resources, software. S.L.: resources, validation. J.Y.: conceptualization, supervision, writing—review and editing. All authors have read and agreed to the published version of the manuscript.
Funding
This research was supported by the Technology Development Program (S3350409) funded by the Ministry of SMEs and Startups (MSS, Korea).
Data Availability Statement
The datasets presented in this article are not readily available due to privacy restrictions. Requests to access the datasets should be directed to the corresponding author.
Conflicts of Interest
Author Yongjin Kim was employed by the company Smart E&C. The remaining authors declare that the research was conducted in the absence of any commercial or financial relationships that could be construed as a potential conflict of interest.
References
- Cantarino, I.; Carrion, M.A.; Palencia-Jimenez, J.S.; Martínez-Ibáñez, V. Landslide Risk Management Analysis on Expansive Residential Areas—Case Study of La Marina (Alicante, Spain). Nat. Hazards Earth Syst. Sci. 2021, 21, 1847–1866. [Google Scholar] [CrossRef]
- Brunetti, M.T.; Melillo, M.; Gariano, S.L.; Ciabatta, L.; Brocca, L.; Amarnath, G.; Peruccacci, S. Satellite Rainfall Products Outperform Ground Observations for Landslide Prediction in India. Hydrol. Earth Syst. Sci. 2021, 25, 3267–3279. [Google Scholar] [CrossRef]
- Piciullo, L.; Calvello, M.; Cepeda, J.M. Territorial Early Warning Systems for Rainfall-Induced Landslides. Earth-Sci. Rev. 2018, 179, 228–247. [Google Scholar] [CrossRef]
- Segoni, S.; Rosi, A.; Fanti, R.; Gallucci, A.; Monni, A.; Casagli, N. A Regional-Scale Landslide Warning System Based on 20 Years of Operational Experience. Water 2018, 10, 1297. [Google Scholar] [CrossRef]
- Xi, N.; Yang, Q.; Sun, Y.; Mei, G. Machine Learning Approaches for Slope Deformation Prediction Based on Monitored Time-Series Displacement Data: A Comparative Investigation. Appl. Sci. 2023, 13, 4677. [Google Scholar] [CrossRef]
- Zhao, B.; Dai, Q.; Han, D.; Zhang, J.; Zhuo, L.; Berti, M. Application of Hydrological Model Simulations in Landslide Predictions. Landslides 2020, 17, 877–891. [Google Scholar] [CrossRef]
- Kazumasa, K.; Hiromi, T.; Hirokazu, H.; Masao, A.; Hirotaka, N.; Kohei, F. A study on a method for determining non-linear critical line of slope failures during heavy rainfall based on RBF network. Doboku Gakkai Ronbunshu 2001, 50, 117–132. [Google Scholar] [CrossRef][Green Version]
- Wasowski, J.; Bovenga, F. Investigating Landslides and Unstable Slopes with Satellite Multi Temporal Interferometry: Current Issues and Future Perspectives. Eng. Geol. 2014, 174, 103–138. [Google Scholar] [CrossRef]
- Liao, Z.; Hong, Y.; Wang, J.; Fukuoka, H.; Sassa, K.; Karnawati, D.; Fathani, F. Prototyping an Experimental Early Warning System for Rainfall-Induced Landslides in Indonesia Using Satellite Remote Sensing and Geospatial Datasets. Landslides 2010, 7, 317–324. [Google Scholar] [CrossRef]
- Bardi, F.; Raspini, F.; Frodella, W.; Lombardi, L.; Nocentini, M.; Gigli, G.; Morelli, S.; Corsini, A.; Casagli, N. Monitoring the Rapid-Moving Reactivation of Earth Flows by Means of GB-InSAR: The April 2013 Capriglio Landslide (Northern Appennines, Italy). Remote Sens. 2017, 9, 165. [Google Scholar] [CrossRef]
- Schenato, L.; Palmieri, L.; Camporese, M.; Bersan, S.; Cola, S.; Pasuto, A.; Galtarossa, A.; Salandin, P.; Simonini, P. Distributed Optical Fibre Sensing for Early Detection of Shallow Landslides Triggering. Sci. Rep. 2017, 7, 14686. [Google Scholar] [CrossRef] [PubMed]
- Vera, J.E.; Mora, S.F.; Cervantes, R.A. Design and Testing of a Network of Sensors on Land Surfaces to Prevent Landslides. In Proceedings of the 2016 IEEE Biennial Congress of Argentina (ARGENCON), Buenos Aires, Argentina, 15–17 June 2016; pp. 1–4. [Google Scholar]
- Wang, L.; Seko, I.; Fukuhara, M.; Towhata, I.; Uchimura, T.; Tao, S. Risk Evaluation and Warning Threshold of Unstable Slope Using Tilting Sensor Array. Nat. Hazards 2022, 114, 127–156. [Google Scholar] [CrossRef]
- Kuradusenge, M.; Kumaran, S.; Zennaro, M. Rainfall-Induced Landslide Prediction Using Machine Learning Models: The Case of Ngororero District, Rwanda. Int. J. Environ. Res. Public Health 2020, 17, 4147. [Google Scholar] [CrossRef] [PubMed]
- Kadavi, P.R.; Lee, C.W.; Lee, S. Landslide-Susceptibility Mapping in Gangwon-Do, South Korea, Using Logistic Regression and Decision Tree Models. Environ. Earth Sci. 2019, 78, 116. [Google Scholar] [CrossRef]
- Sobolewski, R.A.; Tchakorom, M.; Couturier, R. Gradient Boosting-Based Approach for Short- and Medium-Term Wind Turbine Output Power Prediction. Renew. Energy 2023, 203, 142–160. [Google Scholar] [CrossRef]
- Niu, X.; Ma, J.; Wang, Y.; Zhang, J.; Chen, H.; Tang, H. A Novel Decomposition-Ensemble Learning Model Based on Ensemble Empirical Mode Decomposition and Recurrent Neural Network for Landslide Displacement Prediction. Appl. Sci. 2021, 11, 4684. [Google Scholar] [CrossRef]
- Nayak, A.K.; Xu, X.; Frey, S.K.; Khader, O.; Erler, A.R.; Lapen, D.R.; Russell, H.A.J.; Sudicky, E.A. Quantifying the Potential of Using Soil Moisture Active Passive (SMAP) Soil Moisture Variability to Predict Subsurface Water Dynamics. Hydrol. Earth Syst. Sci. 2025, 29, 215–244. [Google Scholar] [CrossRef]
- Rončević, V.; Živanović, N.; van Boxel, J.H.; Iserloh, T.; Štrbac, S. Dripping Rainfall Simulators for Soil Research—Performance Review. Water 2023, 15, 1314. [Google Scholar] [CrossRef]
- ASTM D698-12; Test Methods for Laboratory Compaction Characteristics of Soil Using Standard Effort (12,400 Ft-Lbf/Ft3 (600 kN-m/m3)). ASTM International: West Conshohocken, PA, USA, 2021. [CrossRef]
- ASTM D3080; Test Method for Direct Shear Test of Soils Under Consolidated Drained Conditions. ASTM International: West Conshohocken, PA, USA, 2023. [CrossRef]
- Stojnic, I.; Pfister, M.; Matos, J.; Schleiss, A.J. Effect of 30-Degree Sloping Smooth and Stepped Chute Approach Flow on the Performance of a Classical Stilling Basin. J. Hydraul. Eng. 2021, 147, 04020097. [Google Scholar] [CrossRef]
- Moriwaki, H.; Inokuchi, T.; Hattanji, T.; Sassa, K.; Ochiai, H.; Wang, G. Failure Processes in a Full-Scale Landslide Experiment Using a Rainfall Simulator. Landslides 2004, 1, 277–288. [Google Scholar] [CrossRef]
- Mangeney, A.; Roche, O.; Hungr, O.; Mangold, N.; Faccanoni, G.; Lucas, A. Erosion and Mobility in Granular Collapse over Sloping Beds. J. Geophys. Res. Earth Surf. 2010, 115, F03040. [Google Scholar] [CrossRef]
- Askarinejad, A.; Springman, S.M. A Novel Technique to Monitor Subsurface Movements of Landslides. Can. Geotech. J. 2018, 55, 620–630. [Google Scholar] [CrossRef]
- Li, W.; Yali, L.; Yanhong, C.; Libing, Y. Shock and Vibration of Rainfall on Rotational Landslide and Analysis of Its Deformation Characteristics. Geofluids 2021, 2021, 4119414. [Google Scholar] [CrossRef]
- Merritt, A.J.; Chambers, J.E.; Murphy, W.; Wilkinson, P.B.; West, L.J.; Uhlemann, S.; Meldrum, P.I.; Gunn, D. Landslide Activation Behaviour Illuminated by Electrical Resistance Monitoring. Earth Surf. Process. Landf. 2018, 43, 1321–1334. [Google Scholar] [CrossRef]
Disclaimer/Publisher’s Note: The statements, opinions and data contained in all publications are solely those of the individual author(s) and contributor(s) and not of MDPI and/or the editor(s). MDPI and/or the editor(s) disclaim responsibility for any injury to people or property resulting from any ideas, methods, instructions or products referred to in the content. |
© 2025 by the authors. Licensee MDPI, Basel, Switzerland. This article is an open access article distributed under the terms and conditions of the Creative Commons Attribution (CC BY) license (https://creativecommons.org/licenses/by/4.0/).