Article

Impact of Land Use/Cover Changes on Regional Soil Organic Carbon Storage in the Main Stream of the Tarim River from 1990 to 2020

1
State Key Laboratory of Ecological Safety and Sustainable Development in Arid Lands, Xinjiang Institute of Ecology and Geography, Chinese Academy of Sciences, Urumqi 830011, China
2
Ministry of Education Key Laboratory for Western Arid Region Grassland Resources and Ecology, College of Grassland Science, Xinjiang Agricultural University, Urumqi 830052, China
3
University of the Chinese Academy of Sciences, Beijing 100049, China
4
College of Geography and Remote Sensing Sciences, Xinjiang University, Urumqi 830017, China
*
Authors to whom correspondence should be addressed.
Land 2025, 14(12), 2334; https://doi.org/10.3390/land14122334
Submission received: 9 October 2025 / Revised: 24 November 2025 / Accepted: 25 November 2025 / Published: 27 November 2025

Abstract

Land use/cover (LULC) type change is one of the important causes of global change and the imbalance of the carbon cycle. Investigating the temporal variation in regional soil organic carbon storage (Rsoc) driven by LULC change is of great significance for scientifically guiding sustainable regional land management and facilitating the realization of China’s “dual carbon” objectives. Focusing on the main stream of the Tarim River, based on the LULC data of 1990, 2000, 2010, and 2020, combined with the data of soil organic carbon (SOC) content and soil bulk density, the temporal variation in the LULC and its impact on the Rsoc in the main stream of the Tarim River were analyzed. The results indicate that the LULC exhibited a pattern of “slow change—sharp change—slow change” across the three periods 1990–2000, 2000–2010, and 2010–2020. Grassland (GL) area consistently declined, while other types of LULC fluctuated during the period 1990–2020. The type and area of LULC conversion varied across the three periods: 1990–2000, 2000–2010, and 2010–2020. The area of the GL and bare land (BL) conversion was greater than that of conversion between other LULC in all three periods. The total amount of soil organic carbon (Tsoc) associated with different LULC types in the main stream of the Tarim River varied in 1990, 2000, 2010, and 2020, with the GL contributing the highest SOC levels, and conversion from the BL to GL had the largest increase in the Tsoc for the BL among the three periods, which was 0.20 × 10¹⁰~0.31 × 10¹⁰ kg, 0.97 × 10¹⁰~1.48 × 10¹⁰ kg, and 0.04 × 10¹⁰~0.06 × 10¹⁰ kg during1990–2000, 2000–2010, and 2010–2020 periods, respectively. Overall, the Rsoc in the 0–100 cm soil layer decreased from 2.18 × 10¹⁰ to 2.18 × 10¹⁰ kg during the period 1990–2020 in the main stream of the Tarim River.

1. Introduction

Soil is the largest carbon pool in the terrestrial biosphere; even a small portion of soil carbon loss may cause significant fluctuations in atmospheric CO2 concentration and trigger potential positive feedback on climate change [1,2]. Although the change in the soil carbon pools, which are jointly affected by climate change and human activities, need to be considered on a long-term scale; soil organic carbon (SOC) is relatively easy to change significantly on a short-term scale [3]. The function of the soil carbon pool as a “carbon source” or “carbon sink” for atmospheric CO2, which can change because of variations in the SOC [4]. There is approximately 3000 Pg C stored in the form of SOC in global terrestrial ecosystems, and the average annual carbon emission into the atmosphere from LULC change was 1.1 Pg C during the period 2011–2020 [5]. Different LULC types have significantly different carbon sequestration capabilities, which changes interfere with the balance between carbon inflows and outflows in the soil by affecting the quantity and quality of SOC [6]. LULC change is widely recognized as a key driver of global carbon dynamics [7]. Soil carbon stocks significantly increased after conversions from farmland to grassland (0.30 Mg ha−1 yr−1) and forest to grassland (0.68 Mg ha−1 yr−1), but significantly declined after conversion from grassland to farmland (0.89 Mg ha−1 yr−1), forest to farmland (1.74 Mg ha−1 yr−1), and forest to forest (0.63 Mg ha−1 yr−1) [3]. Most studies have been dedicated to soil carbon sequestration through agricultural land management and the SOC stock change in multiple LULC types, including forests and grasslands [8,9,10,11]. However, there have been relatively few studies on the impact of the LULC change on regional SOC stock (Rsoc), especially lacking studies on temporal change in the Rsoc. The spatiotemporal changes in the LULC type and their effects on the regional SOC pool are of great significance for scientifically guiding the sustainable utilization and development of regional land, especially the quantification assessment of carbon pool temporal changes, which is fundamental to elucidating the effects of the LULC change on ecosystem functioning.
Over the past few decades, the LULC of the main stream of the Tarim River has undergone complex changes under the combined influence of human activities and natural factors [12]. Since the 1970s, the length of the lower reaches of the Tarim River has decreased to 321 km because of the continuous increase in water usage in the upper and middle reaches, especially for the expansion of cultivated land (CL) [13]. During the period 1973–2005, the area of the CL and residential land (RL) increased significantly, while the area of the GL, forest land (FL), and wetland decreased significantly, and the unused land area increased in the main stream of the Tarim River [12]. Many studies estimated the contribution of the LULC to the carbon storage of the Tarim River basin from the basin scale by using models, and evaluated the impact of LULC change on the carbon sequestration capacity of the basin ecosystem during different periods [14,15,16]. However, those studies mostly focus on the overall change in SOC stock over a period and pay less attention to the temporal dynamic change in the SOC stock within a region. Understanding the temporal variation in SOC stocks caused by the LULC change is therefore essential, especially in the context of climate change.
The objectives of this study are: (1) to analyze changes in the LULC during three periods, 1990–2000, 2000–2010, and 2010–2020, (2) to estimate the Tsoc of different LULC types, (3) to evaluate the Rsoc variability owing to the LULC change during the three periods in the main stream of the Tarim River. Not only will this study obtain specific information on every LULC type and its Tsoc change in the main stream of the Tarim River, but it will also provide guidance for regional development on the LULC and a case for global carbon cycle research.

2. Materials and Methods

2.1. Outline of the Study Area

The Tarim River basin, with an area of 1,020,000 km2, is the largest inland river basin in China. The main stream of the Tarim River covers an area of 17,600 km2 (Figure 1). The main stream of the Tarim River is located on the northern edge of the Tarim Basin, starting from the confluence of the Yarkant River, the Aksu River, and the Hotan River—Xiao Jiake, and ending at the Taitema Lake, with a length of 1321 km. It is characterized by arid and low rainfall, intense evaporation, and a distinct continental climate. The annual precipitation is generally less than 50 mm, while the average evaporation (potential) is 2300 to 3000 mm. It enjoys abundant sunlight with an annual sunshine duration of 2800 to 3100 h. The frost-free period is 185 to 210 days, and the annual average temperature is 10 to 11 °C, with a 10 °C accumulated temperature of 4000 to 4350 °C. It belongs to the warm temperate sparse shrub and semi-shrub desert zone. The alluvial plain of the Tarim River has been built up by thick quaternary deposits consisting of fine sand in the upper layer and clay and silt in the deeper layer [11]. The main plant species forming the community include Populus euphratica, Halimodendron halodendron, Halostachys caspica, Karelinia caspica, and Tamarix spp. [11].

2.2. Data Sources and Processing

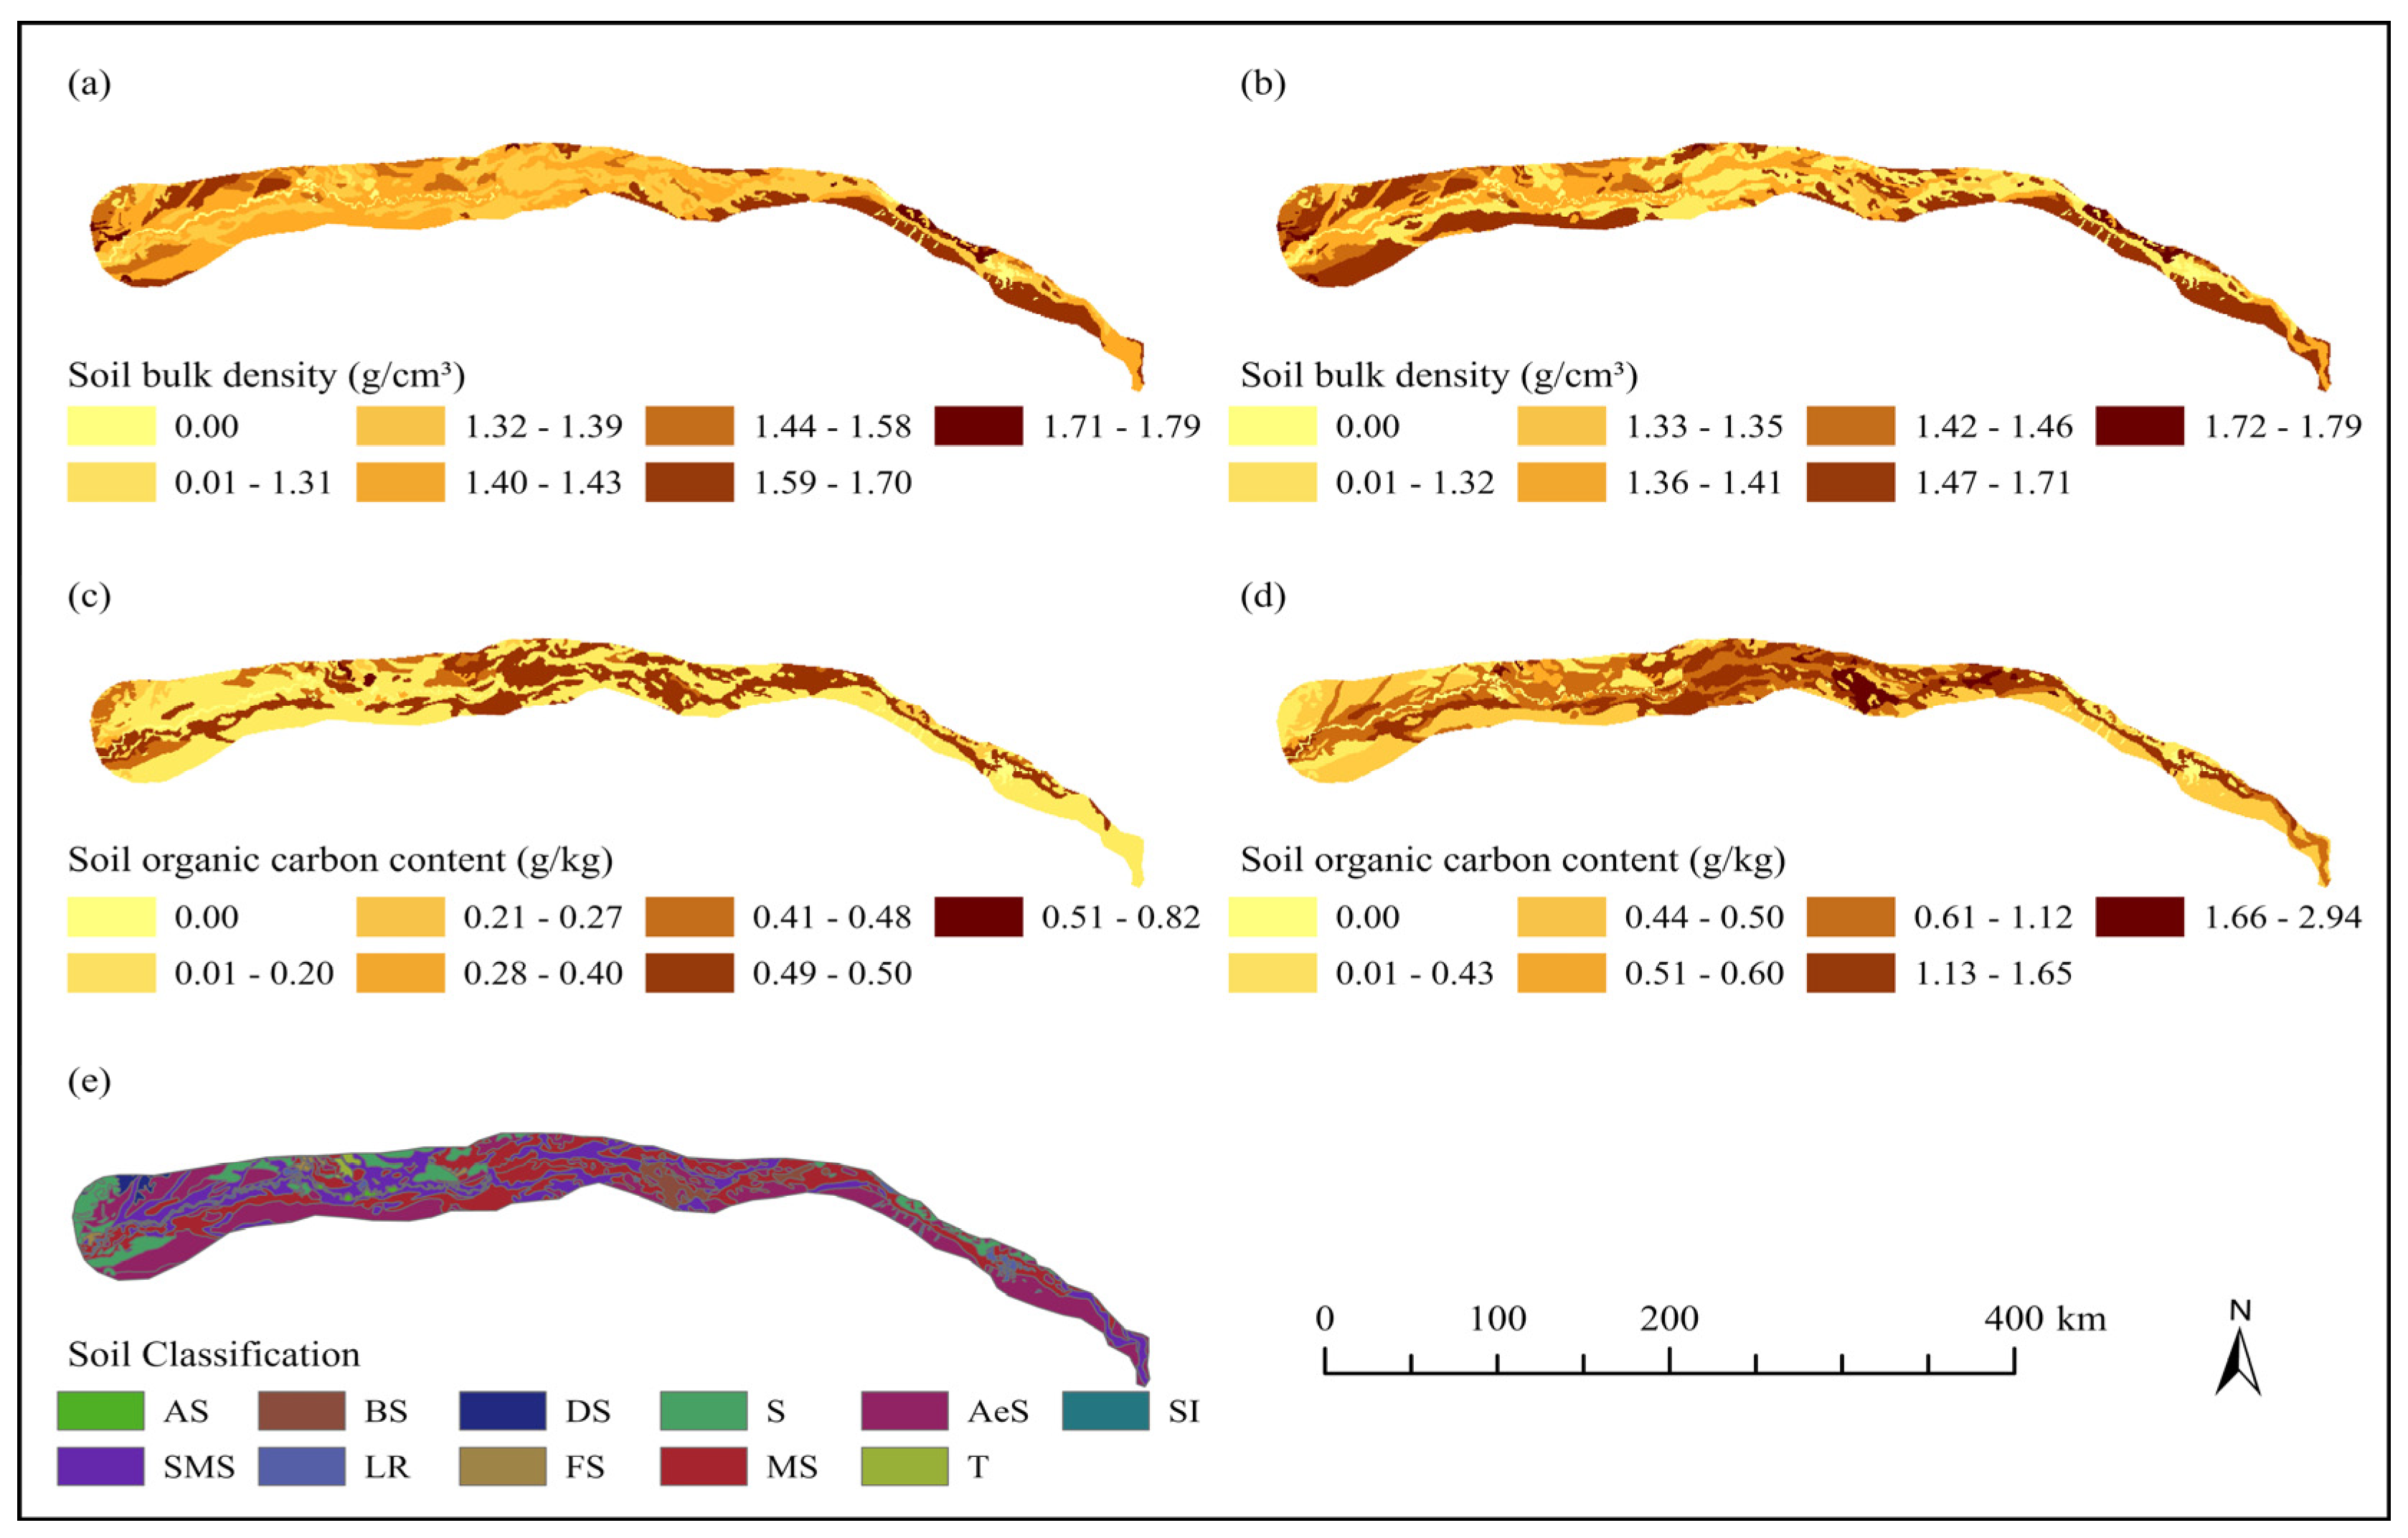
The data used in this study mainly consist of three parts: LULC, soil type maps, and data on the SOC content and soil bulk density. Specifically, the LULC data originated from the LULC data of the Tarim River Basin in 1990, 2000, 2010, and 2020, obtained from the Center for Resources and Environmental Sciences and Data of the Chinese Academy of Sciences, with a spatial resolution of 30 m × 30 m. According to the national standard “Classification of Current Land Use Status”, a first-level standard classification system is adopted to interpret, classify, and calculate the area of the main LULC types, water body (W), FL, shrub land (SL), GL, CL, RL, and bare land (BL) in the main stream of the Tarim River. The soil bulk density (Figure 2a,b) and the SOC content (Figure 2c,d) at the 0–30 cm soil layer and the 30–100 cm soil layer were derived from the HWSD (Harmonized World Soil Database, HWSD, Version 1.1; FAO/IIASA/ISRIC/ISS-CAS/JRC 2009) dataset in the Tarim River Basin, with an image resolution is 1000 m. The soil type map (Figure 2e) was derived from the soil type map of Xinjiang (1:1,000,000) (1995), with an image resolution of 500 m.

2.3. Methods

We selected area change (ΔS) and rate of area change to analyze the area change in different LULC types during the different periods in the main stream of the Tarim River. The SOC density (Dsoc), Tsoc, and Rsoc were selected to analyze the SOC change under the impact of the LULC change during the periods 1990–2000, 2000–2010, and 2010–2020 in the main stream of the Tarim River.
The ΔS (km2) refers to the area change for a LULC type within a period. The calculation formula is as follows:
ΔS = Sa − Sb
where Sa and Sb represent the area for a LULC type in years a and b, respectively. In this study, based on the area of a LULC type in 1990, 2000, 2010, and 2020, the ΔS for each LULC type was calculated, respectively, during the periods 1990–2000, 2000–2010, and 2010–2020. The ΔS is divided by 10 years to obtain the rate of area change (km2/yr) for a LULC type.
The Dsoc (kg/m2) refers to the reserve of SOC per unit area with a specific depth, which is usually 1 m. It can be calculated by Equation (2) [11]:-
Dsoc = C × H × D × (100 − Vcf)/100
where C is the SOC content (g/kg); H is the depth of layer (cm), D is the soil bulk density (g/cm3), and Vcf is the volume (%) of coarse fragments (>2 cm). In this study, based on the SOC content and the soil bulk density at the depths of 0–30 cm and 30–100 cm, the Dsoc at the depth of 0–30 cm and 30–100 cm were calculated, respectively, under ignoring the Vcf. The Dsoc at the depth of 0–100 cm was calculated by adding the Dsoc at the 0–30 cm and 30–100 cm. The minimum Dsoc (Dsocmin) and the maximum Dsoc (Dsocmax) in different soil types were calculated, respectively, according to the C and D of the soil type.
The Tsoc refers to the reserve of the SOC in the 0–100 cm layer for a LULC type within a region, and can be calculated by Formula (3):
Tsoci = Si × H × Dsoci
where Si is the area for i LULC type (m2); Dsoci is the Dsoc (kg/m2) at the depth of 0–100 cm layer for i LULC type. Based on the area of a LULC type in 1990, 2000, 2010, and 2020, and the Dsocmax of soil type corresponding to their spatial positions, the maximum Tsoc (Tsocmax) of a LULC type in 1990, 2000, 2010, and 2020 was calculated, and the minimum Tsoc (Tsocmin) was obtained in the same method. Specifically, the Dsoc which calculated by the Equation (2) of the FL and the SL refer to that of shrubby meadow soil (Dsocmin = 8.47 kg/m2, Dsocmax = 11.42 kg/m2), the Dsoc of the GL and the BL, respectively, refer to that of meadow soil (Dsocmin = 11.46 kg/m2, Dsocmax = 16.17 kg/m2) and of aeolian soil (Dsocmin = 4.32 kg/m2, Dsocmax = 5.22 kg/m2), the Dsoc of the CL and the RL refer to that of shruby meadow soil (Dsocmin = 8.47 kg/m2, Dsocmax = 11.42 kg/m2) and solonchak (Dsocmin = 2.95 kg/m2, Dsocmax = 6.78 kg/m2), respectively.
During the periods 1990–2000, 2000–2010, and 2010–2020, the change in the Tsoc (ΔTsoci-j) in the 0–100 cm soil layer in LULC conversion was calculated by Formula (4):
ΔTsoci-j = (Dsoci − Dsocj) × Si-j
where Dsoci and Dsocj represent the Dsoc of i LULC type and j LULC type, respectively, and Si-j is the area of i LULC type that has been transformed into j LULC type [17]. Specifically, when the Dsocmax of i LULC type and the Dsocmin of j LULC type were used, respectively, the maximum ΔTsoci-j was obtained. Similarly, the minimum ΔTsoci-j was obtained using the same method.
The Rsoc refers to the reserve of the SOC in the 0–100 cm layer for all LULC types (excluding W) within a region (kg), and it can be calculated by Formula (5):
R s o c = j i S × H × D s o c
where S is the area of a LULC type (m2). In this study, based on the Tsocmax of every LULC type in 1990, 2000, 2010, and 2020, combining its area in 1990, 2000, 2010, and 2020, the maximum Rsoc (Rsocmax) in 1990, 2000, 2010, and 2020 was calculated, respectively. The minimum Rsoc (Rsocmin) in 1990, 2000, 2010, and 2020 was calculated, respectively, based on the Tsocmin of every LULC type in 1990, 2000, 2010, and 2020, combining its area in 1990, 2000, 2010, and 2020, respectively.
In this study, every LULC type area change was analyzed to provide a general overview. Bar charts and line graphics were produced using SigMaplot14.0 (Systat Software Inc., San Jose, CA, USA). The thematic map (Figure 1) was produced in ArcMap 10.3 (Esri, Redlands, CA, USA). The digital elevation model (DEM) was derived from the Shuttle Radar Topography Mission (SRTM) dataset with a spatial resolution of 90 m. The SRTM DEM data were downloaded from the Geospatial Data Cloud (https://www.gscloud.cn/).

3. Results

3.1. Temporal Change in the Land Use/Cover

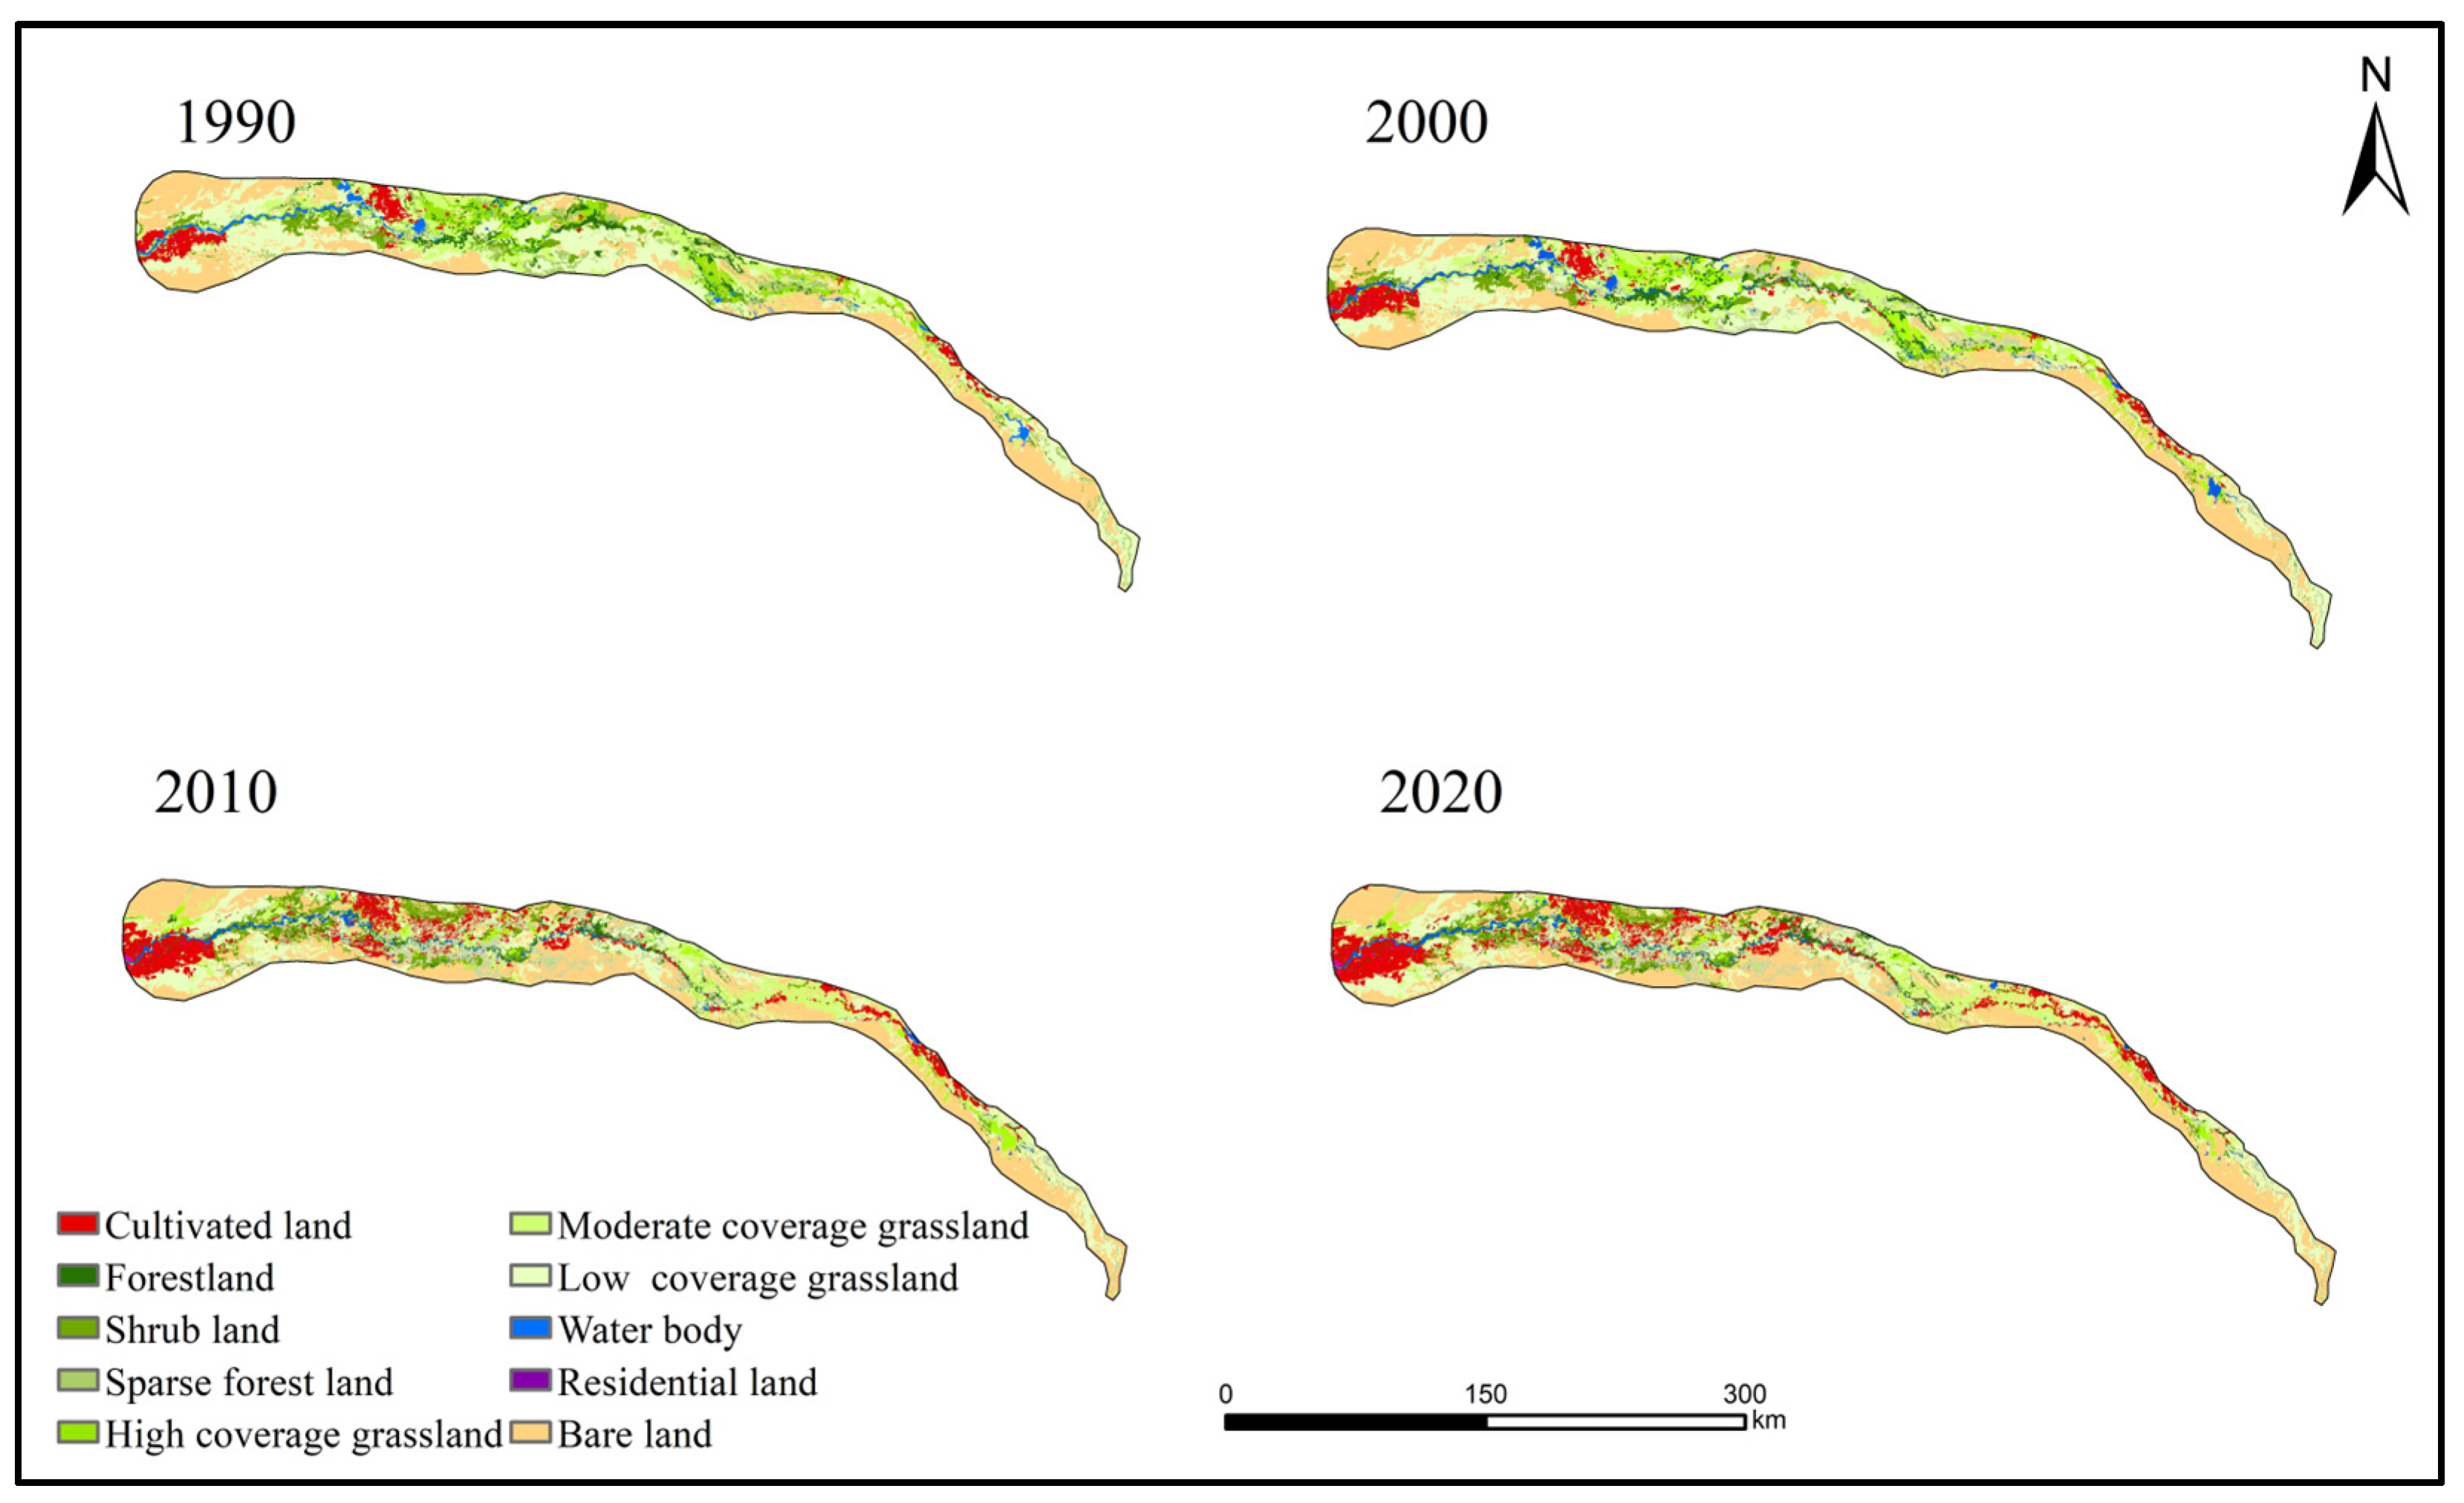
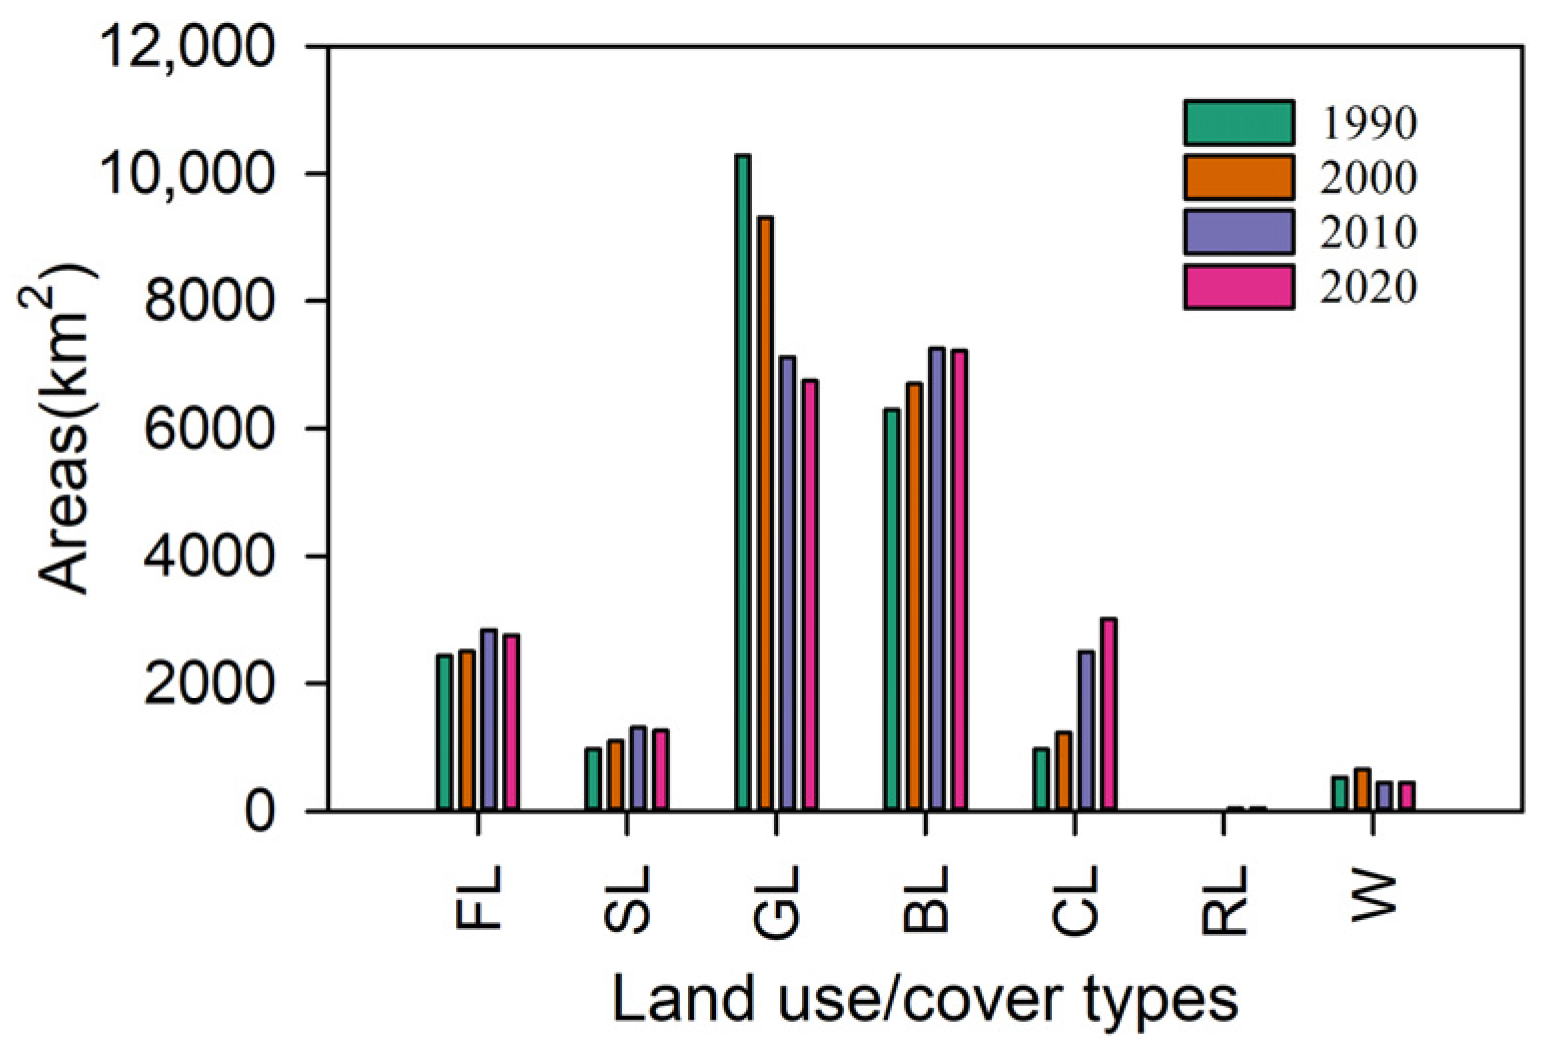
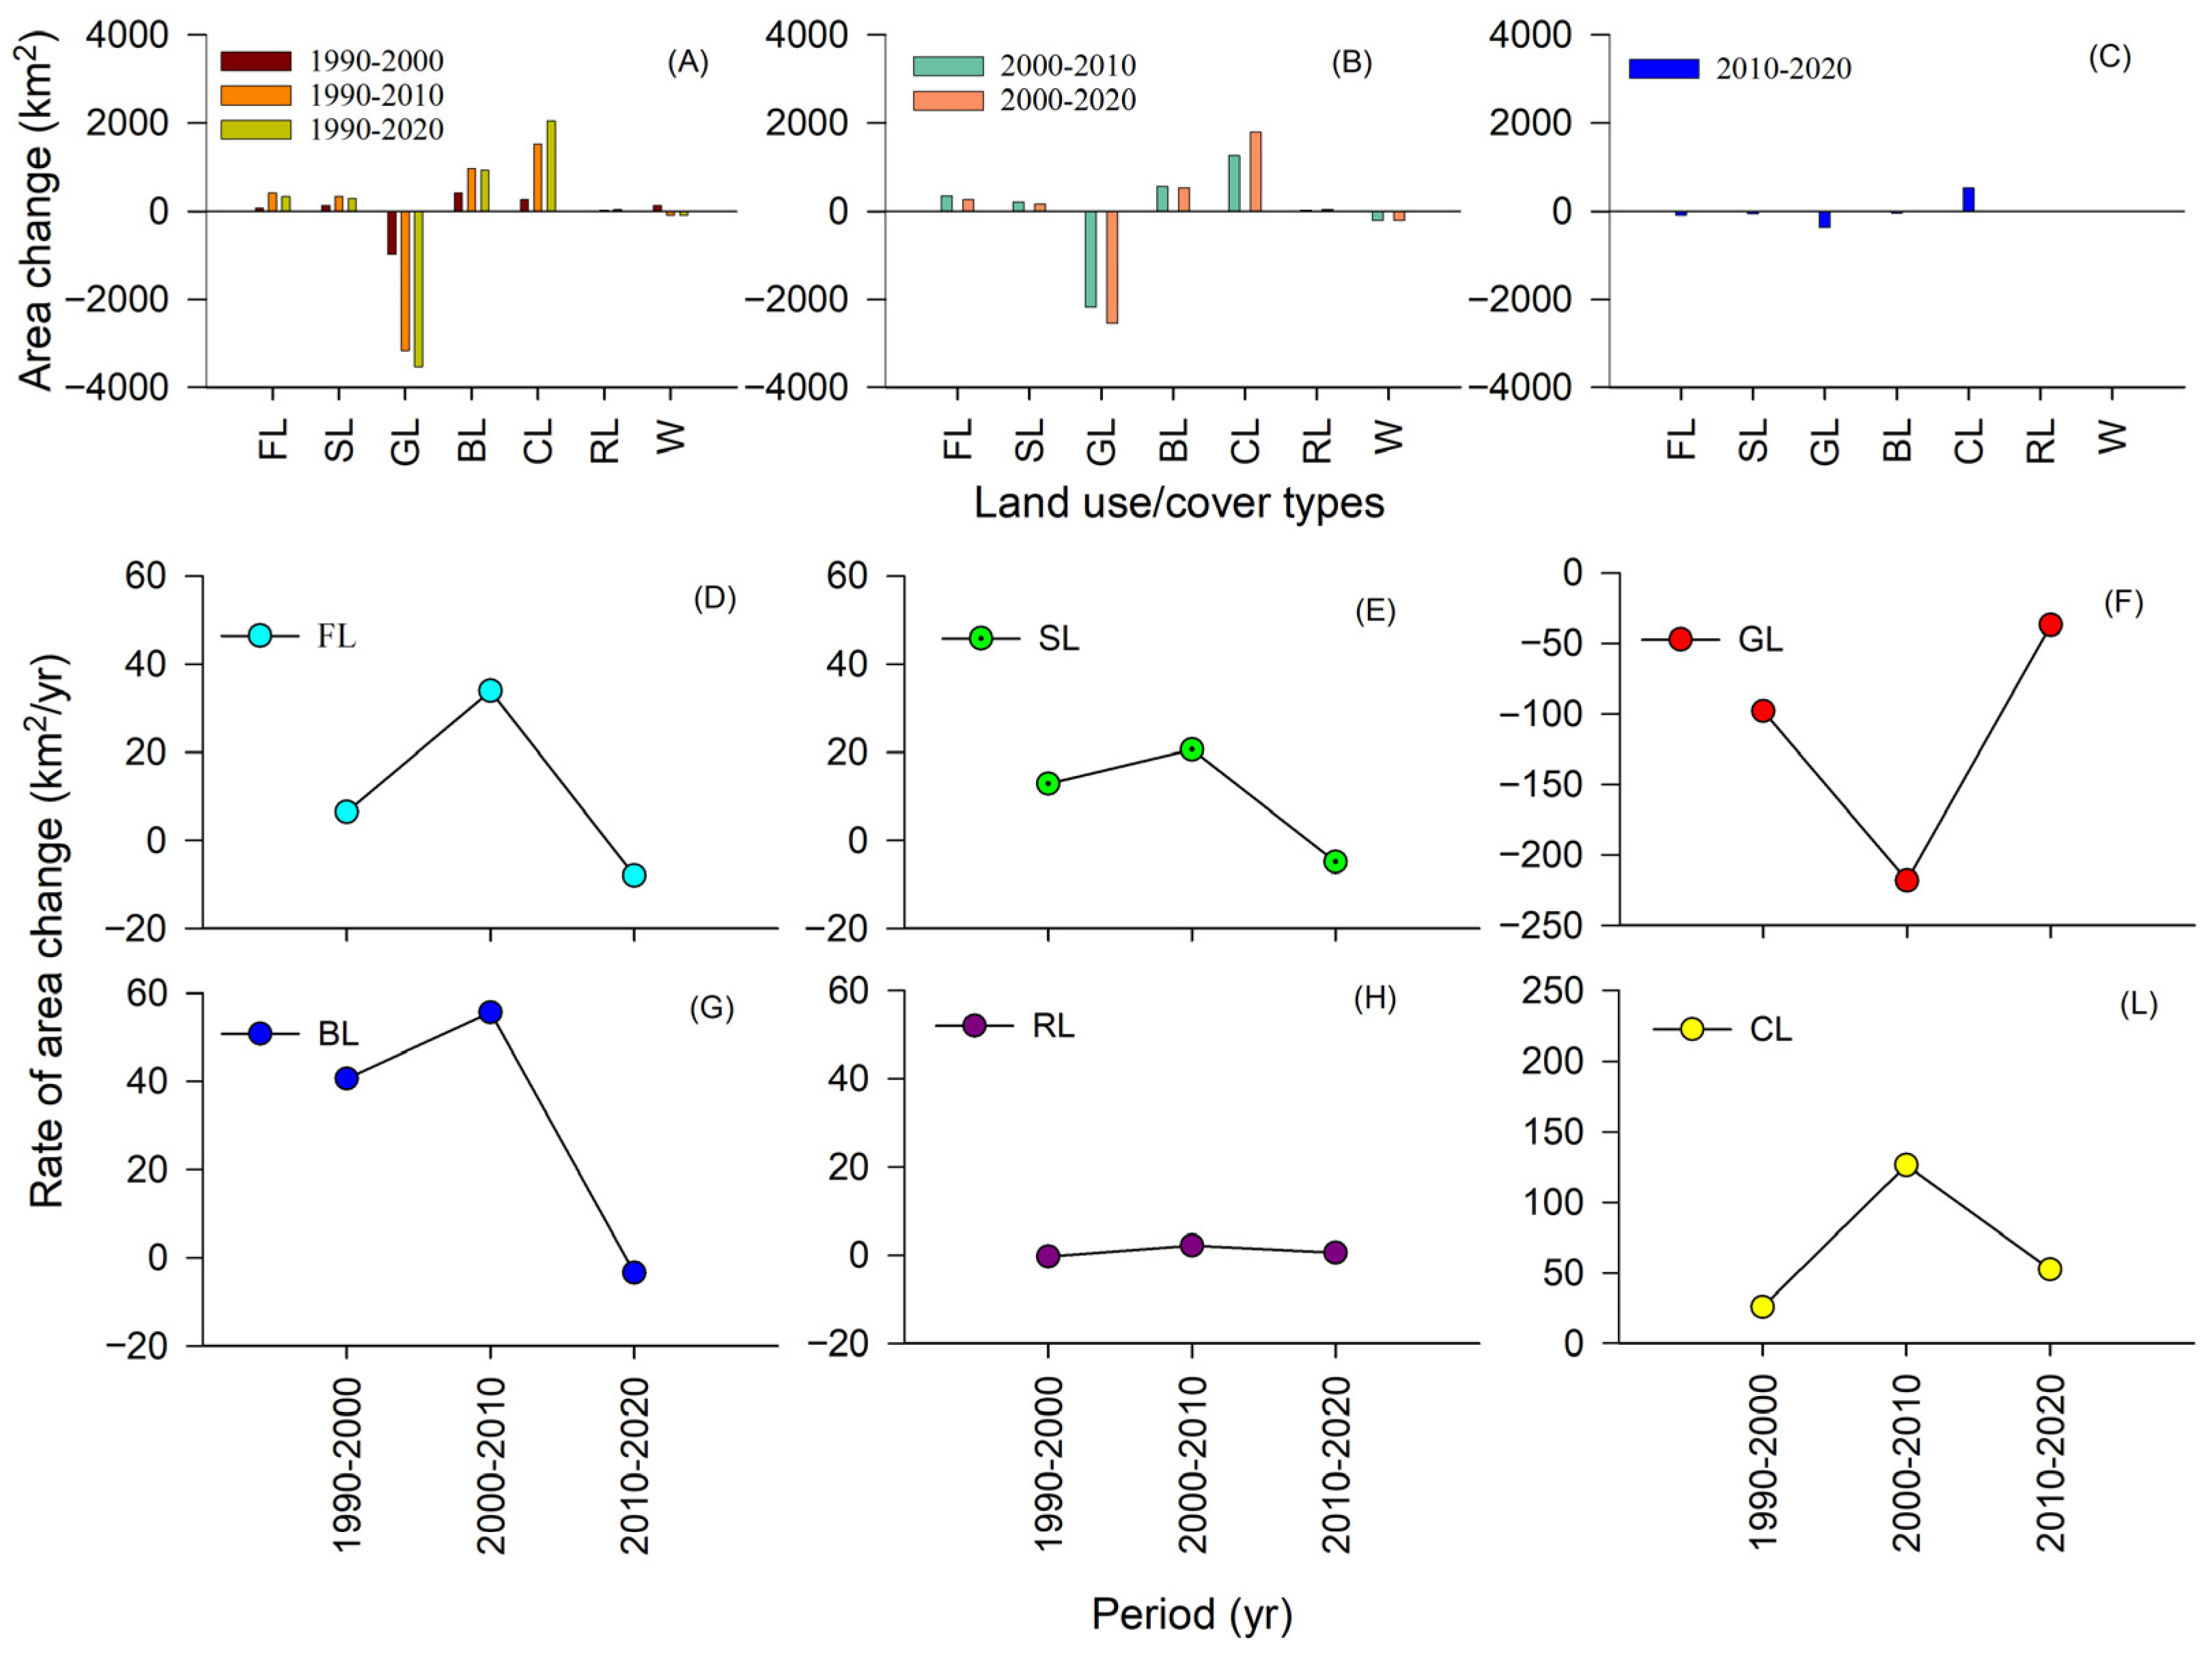
The area of each LULC type varied during the period 1990–2020. In 1990 and 2000, the area of the GL was the largest, followed by that of the BL. In 2010 and 2020, the area of the BL was the largest, followed by that of the GL (Figure 3 and Figure 4). The area changes in all LULC types except the RL showed a “slow change—rapid change—slow change” during the periods 1990–2000, 2000–2010, and 2010–2020, respectively, according to the area change amount (Figure 5A–C) and the rate of area change (Figure 5D–H,L). Specifically, the area of the GL in 2000 decreased by 9.51% compared with that in 1990; in 2010, it decreased by 23.43% compared with that in 2000; and in 2020, it decreased by 5.18% compared with that in 2010. The area of FL in 2000 increased by 2.64% compared with that in 1990; in 2010, it increased by 13.59% compared with that in 2000; and in 2020, it decreased by 2.82% compared with that in 2010. The area of SL in 2000 increased by 13.14% compared with that in 1990; in 2010, it increased by 18.66% compared with that in 2000, and in 2020, it decreased by 3.71% compared with that in 2010. The area of BL in 2000 increased by 6.45% compared with that in 1990; in 2010, it increased by 8.3% compared with that in 2000; and in 2020, it decreased by 0.47% compared with that in 2010. The area of CL in 2000 increased by 26.42% compared with that in 1990; in 2010, it increased by 102.3% compared with that in 2000; in 2020, it increased by 20.94% compared with that in 2010. The area of RL in 2000 decreased by 8.72% compared with that in 1990; in 2010, it increased by 76.67% compared with that in 2000; in 2020, it increased by 11.99% compared with that in 2010. The area of the W in 2000 increased by 23.08% compared to 1990; in 2010, it decreased by 31.21% compared to 2000; and in 2020, it increased by 0.68% compared to 2010.

3.2. Land Use/Cover Conversion

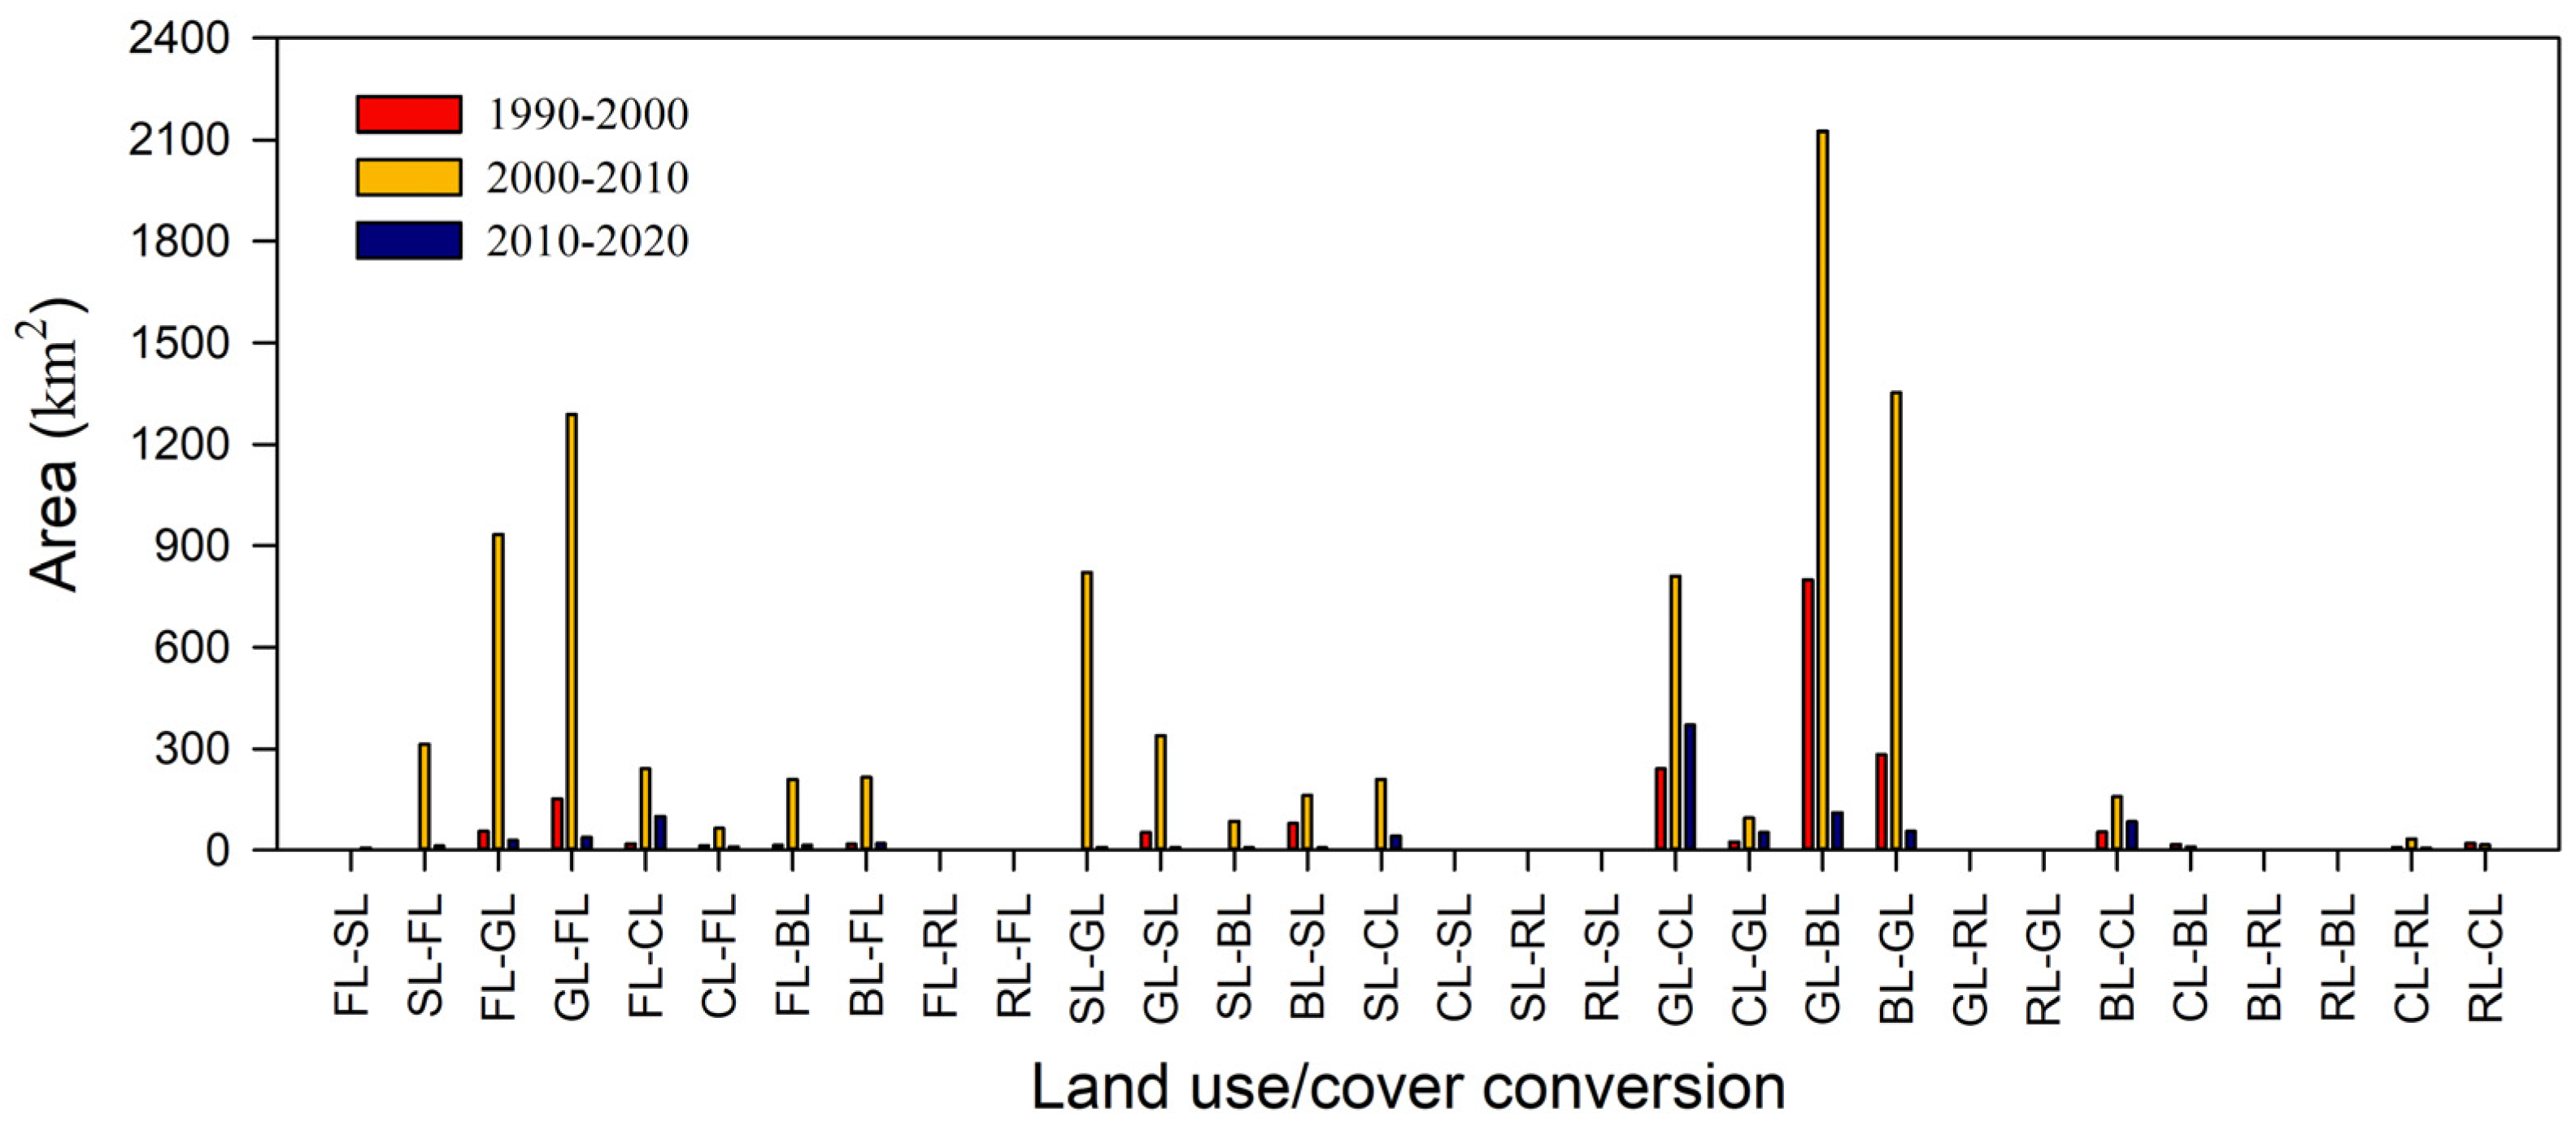
There were various conversion types among different LULC types, and the types and areas of conversion varied within the three periods 1990–2000, 2000–2010, and 2010–2020 in the main stream of the Tarim River. Theoretically, the conversion can occur between any LULC type. Without considering the mutual conversion between the W and the other LULC types, there should be 30 types of conversion (Figure 6), but those conversions do not occur simultaneously within the three periods. Specifically, 10 conversion types do not occur, or the conversion is with a small area. The conversion types include from forest land to shrub land (FL-SL), cultivated land to shrub land (CL-SL), residential land to forest land, shrub land, grassland, and bare land (RL-FL, RL-SL, RL-GL, and RL-BL), from forest land, shrub land, grassland, and bare land to residential land, respectively (FL-RL, SL-RL, GL-RL, and BL-RL). There were 20 conversion types that occurred in the three periods, and the area of conversion was different. In particular, the areas of conversion that occurred during the period 2000–2010 were all greater than those in the other periods. Especially, the conversion areas between the GL and BL (GL-BL and BL-GL) were the largest and occurred during three periods (Figure 6).

3.3. Total Amount of Soil Organic Carbon in Each Type of Land Use/Cover

The Tsoc (Tsocmax and Tsocmin) varied in different LULC types in 1990, 2000, 2010, and 2020 in the main stream of the Tarim River. The Tsoc of the GL was the highest. Specifically, in 1990, 2000, and 2010, the order of the Tsocmin from high to low was GL > BL > FL > SL ≈ CL > RL, and in 2020, it was GL > BL > CL > FL > SL > RL. The Tsocmin of the GL was 5.71, 14.20, 4.33, 14.25, and 1261.69 times the Tsocmin of the FL, SL, BL, CL, and RL, respectively, in 1990. The Tsocmin of the GL was 5.04, 11.36, 3.68, 10.20, and 1250.77 times the Tsocmin of the FL, SL, BL, CL, and RL, respectively, in 2000. The Tsocmin of the GL was 3.39, 7.33, 2.60, 3.86, and 542.04 times the Tsocmin of the FL, SL, BL, CL, and RL, respectively, in 2010. The Tsocmin of the GL was 3.31, 7.22, 2.48, 3.03, and 458.98 times the Tsocmin of the FL, SL, BL, CL, and RL, respectively, in 2020 (Figure 7A). The order of the Tsocmax from high to low was GL > BL > FL > SL ≈ CL > RL in 1990 and 2000, and it was GL > BL > CL > FL > SL > RL in 2010 and 2020. The Tsocmax of the GL was 5.98, 14.88, 5.06, 14.93, and 774.05 times the Tsocmax of the FL, SL, BL, CL, and RL, respectively, in 1990. The Tsocmax of the GL was 5.27, 11.90, 4.30, 10.68, and 767.35 times the Tsocmax of the FL, SL, BL, CL, and RL, respectively, in 2000. The Tsocmax of the GL was 3.56, 7.68, 3.04, 4.04, and 332.55 times the Tsocmax of the FL, SL, BL, CL, and RL, respectively, in 2010. The Tsocmax of the GL was 3.47, 7.56, 2.90, 3.17, and 281.57 times the Tsocmax of the FL, SL, BL, CL, and RL, respectively, in 2020 (Figure 7C). The Tsoc of the FL, SL, BL, and CL was the lowest in 1990 compared with that in the other years. The Tsoc of the RL remained stable over the past 30 years (Figure 7A,C). The Tsoc of the GL decreased during the periods 1990–2000, 2000–2010, and 2010–2020, especially during 2000–2010. The Tsoc of the CL increased during three periods, especially it increased most during 2000–2010. The Tsoc of the FL, SL, and BL changed slightly, respectively, during the periods 1990–2000, 2000–2010, and 2010–2020 (Figure 7B,D).

3.4. The Change in Total Amount of Soil Organic Carbon for the Land Use/Cover Conversion

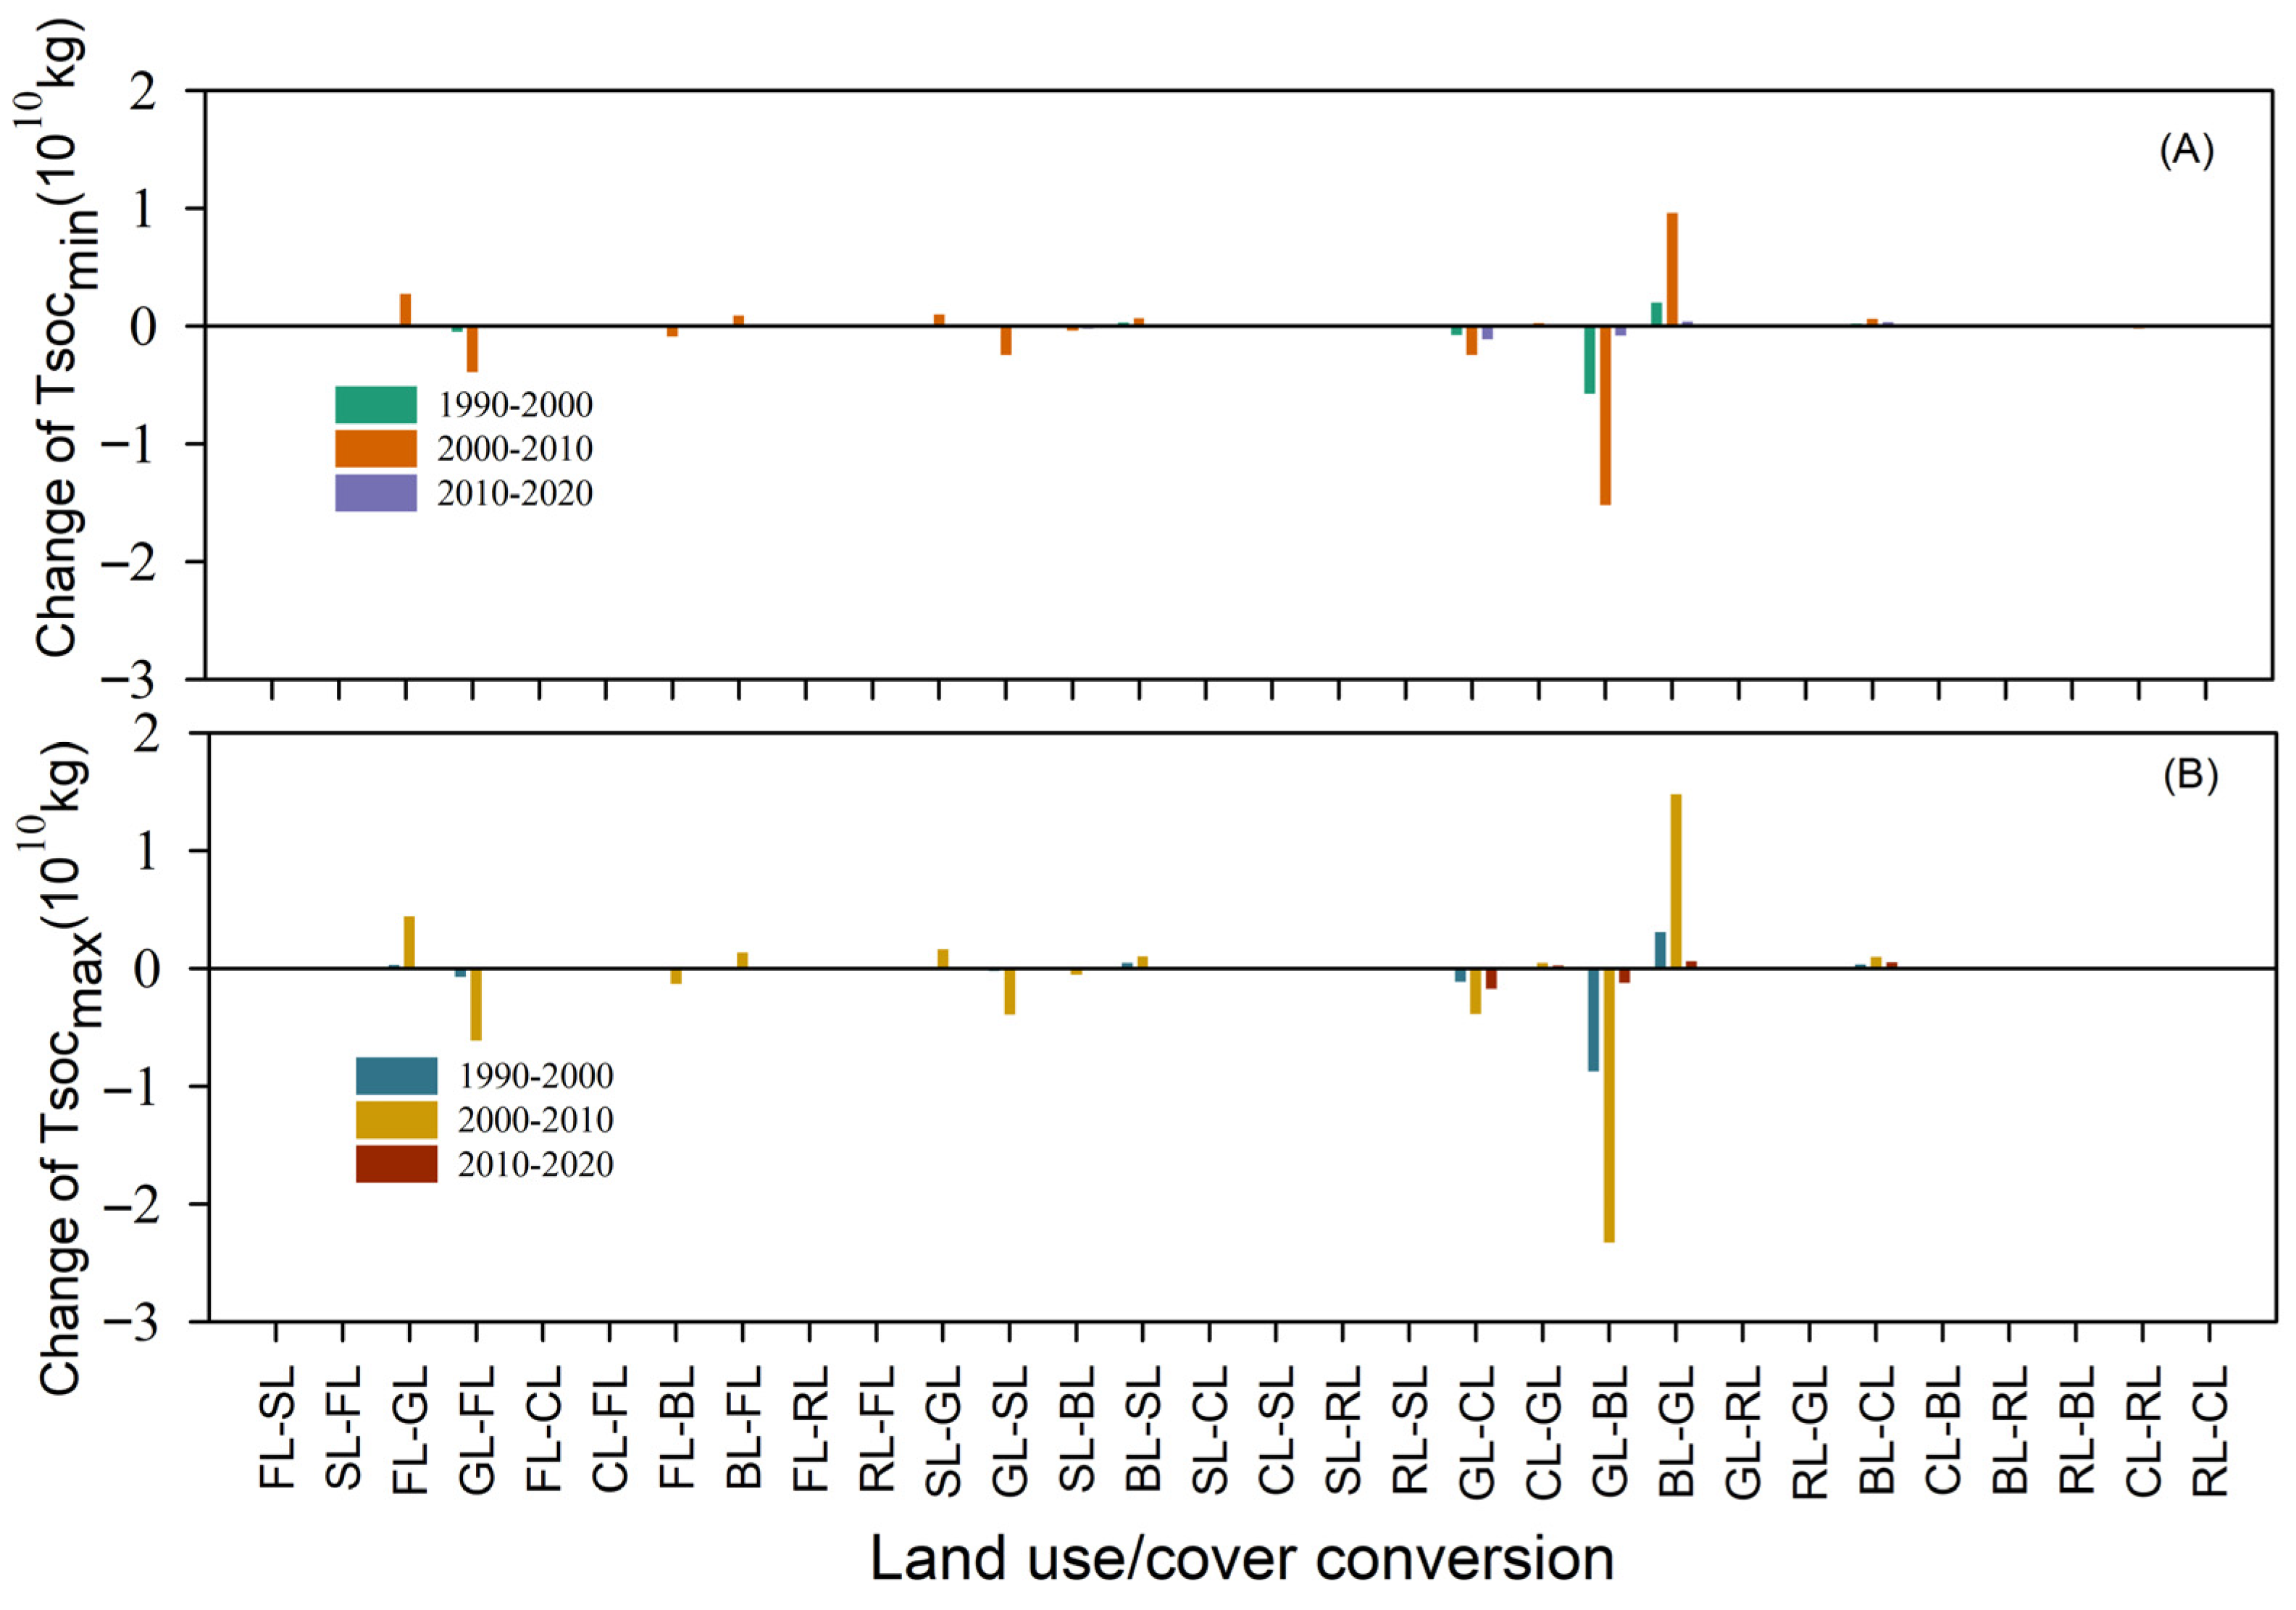
The Tsoc of a LULC type may be changed for the land use and land cover conversion. Without considering any lag effect, the LULC type conversion may lead to a decrease, increase, or no change in the Tsoc. During the periods 1990–2000, 2000–2010, and 2010–2020, the change in the Tsoc (including Tsocmax and Tsocmin) caused by the LULC type conversion had negative values, positive values, and zero. The positive values indicated the Tsoc increased owing to the LULC type conversion, while the negative values indicated the Tsoc decreased (Figure 8A,B). The zero indicates that the Tsoc does not change. Of the three periods, the maximum change in the Tsoc for all LULC types occurred during 2000–2010. The BL-GL conversion had the largest increase in the Tsoc for the BL among the three periods, which was 0.20 × 10¹⁰~0.31 × 10¹⁰ kg, 0.97 × 10¹⁰~1.48 × 10¹⁰ kg, 0.04 × 10¹⁰~0.06 × 10¹⁰ kg during 1990–2000, 2000–2010, and 2010–2020 periods, respectively. The GL-BL conversion had the largest decrease in the Tsoc for the GL during the 1990–2000 and 2000–2010 periods, which were 0.57 × 10¹⁰~0.88 × 10¹⁰ kg, 1.52 × 10¹⁰~2.33 × 10¹⁰ kg, respectively. The GL-CL conversion had the largest decrease in the Tsoc for the GL during the period 2010–2020, which was 0.11 × 10¹⁰~0.18 × 10¹⁰ kg.

3.5. Regional Soil Organic Carbon Stock of the Main Stream of the Tarim River

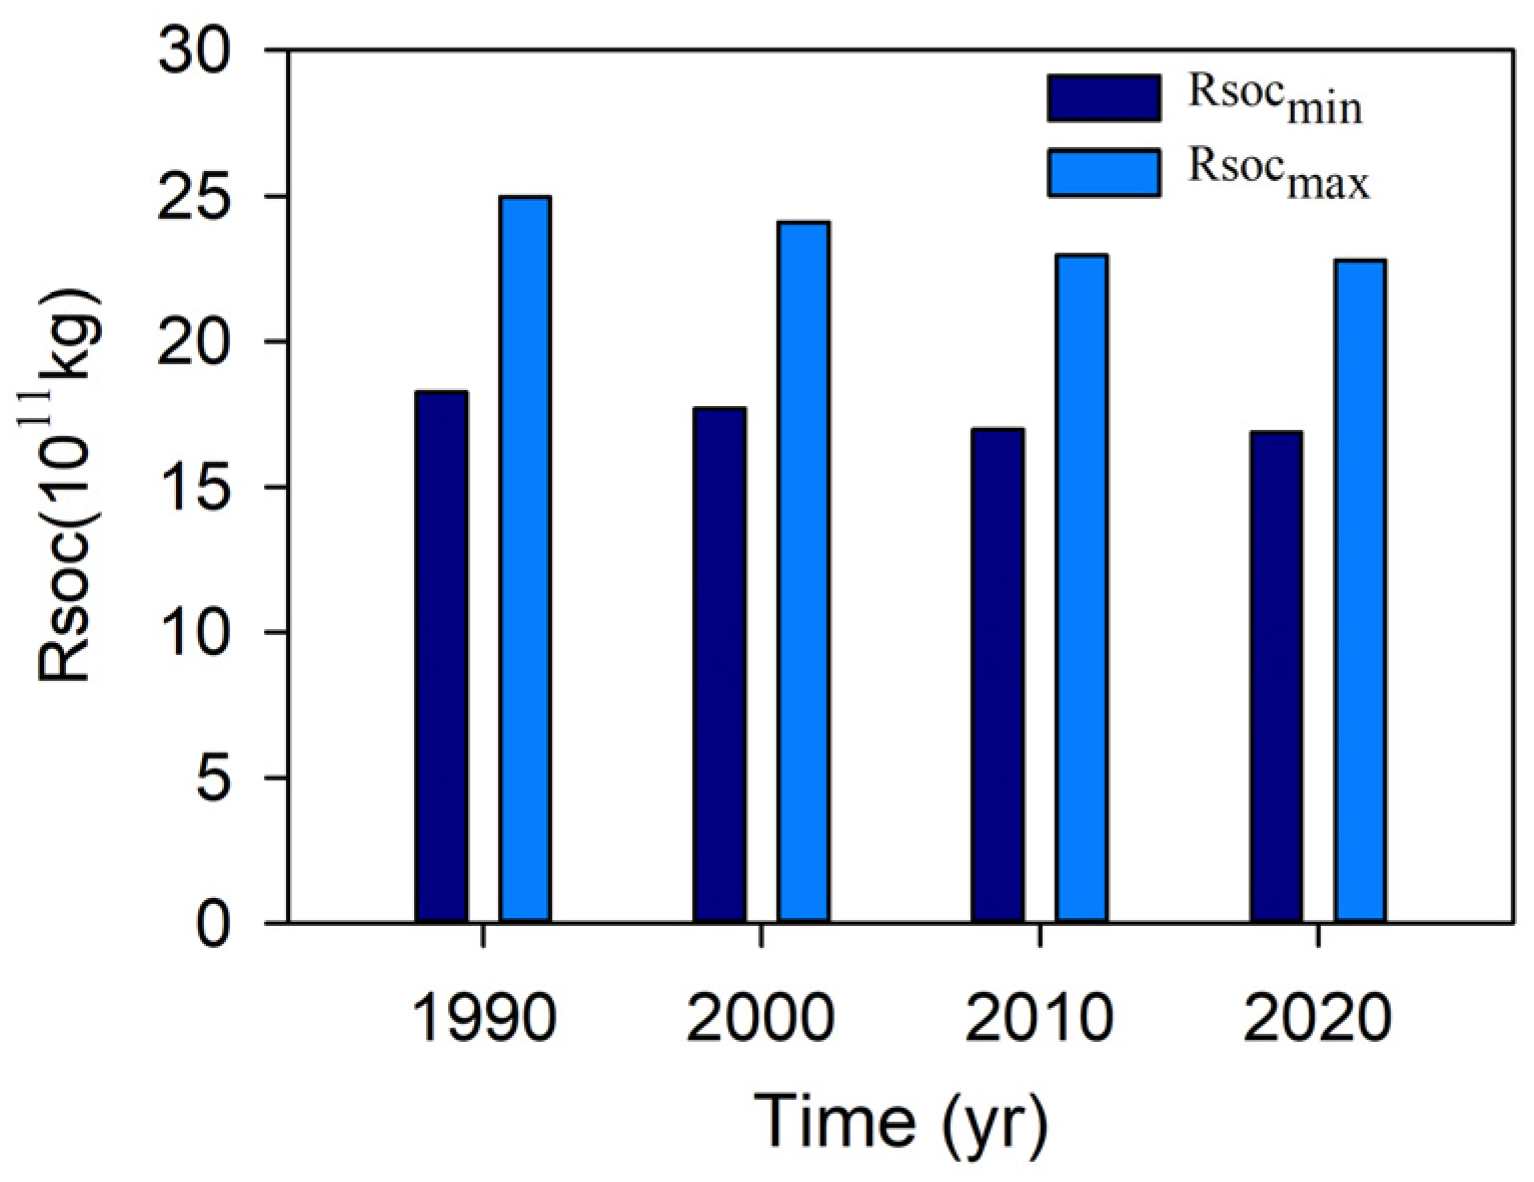
The RSoc of the main stream of the Tarim River varied in 1990, 2000, 2010, and 2020. It experienced different changes during the three periods 1990–2000, 2000–2010, and 2010–2020, respectively. Specifically, the Rsoc decreased by 1.38 × 10¹⁰ ~2.18 × 10¹⁰ kg during the period 1990–2020. Specifically, the Rsoc in 2000 decreased by 0.56 × 10¹⁰~0.86 × 10¹⁰ kg compared with that in 1990. The Rsoc in 2010 decreased by 0.72 × 10¹⁰~1.16 × 10¹⁰ kg compared with that in 2000, and the Rsoc in 2020 decreased by 0.10 × 10¹⁰~0.16 × 10¹⁰ kg compared with that in 2010 (Figure 9).

4. Discussion

4.1. Change in the Land Use/Cover

The LULC pattern within a region is the result of natural, socio-economic factors, and human utilization in time and space [18]. In this study, the area changes in all LULC types during the period 2000–2010 were greater than those during the periods 1990–2000 and 2010–2020 in the main stream of the Tarim River. Specifically, the GL area decreased greatly, and the CL area increased greatly. This may be related to natural factors such as climate change on a long-term scale, and human activities may play a direct and dominant role on a short-term scale. The reduction in the GL area and increase in the BL area during the period 1990–2000 were both related to the runoff interruption in the lower reaches of the Tarim River [13,19]. The reason that the greatest land area changed during the period 2000–2010 might be that the 11 rounds of ecological water delivered by a single channel failed to curb the continuous degradation trend of the GL in the main stream of the Tarim River [20]. In addition, extensive reclamation had been carried out along both banks in the middle reaches of the main stream of the Tarim River. As a result, the GL area decreased significantly during the period 2000–2010 [19]. During the period 2010–2020, 10 rounds of ecological water delivered in the form of dual channels and tributaries enabled the continuous restoration of the desert riparian forest ecosystem in the middle and lower reaches of the main stream of the Tarim River [20], and the supervision of land reclamation had also become stricter. Therefore, the change in all LULC types in the area was relatively small during the period 2010–2020. In conclusion, the LULC pattern is the result of natural, socio-economic factors as well as human utilization in time and space in the main stream of the Tarim River.

4.2. The Impact of the Land Use/Cover Change on the Soil Organic Carbon Content

With increasing attention to ecological conservation, it is necessary to have a deeper understanding of the impact on the SOC content brought about by various changes in the LULC type. LULC change could occur naturally or be a result of human activities, such as cultivating and logging. From the perspective of natural changes, vegetation succession is the main change process in LULC without any human interference. During this process, the above-ground vegetation gradually changes, and the accumulation of carbon underground also undergoes alterations, thereby resulting in significantly different TOC accumulation rates at different succession stages [21,22], and the SOC content is the highest in the top forest during vegetation succession [23]. Vegetation degradation is a process of reverse succession. Forest degradation has induced soil carbon changes [24], and the degradation can significantly affect the vertical distribution and the storage of SOC [25]. In the context of intensified grassland degradation, the SOC content in the surface layer decreased in an S-shaped pattern, with a decline rate as high as 89% [26,27].
From the perspective of human activities disturbing, the conversion of natural vegetation to artificial forests or farmland usually involves a change in organic matter input, which affects soil carbon content. The amount of SOC depends on the plant residues and their deposition rate [28]. For natural vegetation, the soil largely retains its undisturbed physical state, which impedes plant residues integrated into the soil unless affected by soil fauna action, microorganism activities, or by leaching of suspended particles or soluble carbon [29]. For farmland, tillage can disturb macroaggregates, which foster microaggregates formation [29]. After the conversion from farmland to forest and grassland, the SOC content increased by 116% and 123%, respectively, in the top 30 cm soil layer in the temperate region [30], but the SOC content of grassland and forest will decrease after being reclaimed for farmland [31,32]. Converting lowland tropical forest into oil palm (Elaeis guineensis), rubber (Hevea brasiliensis), and cocoa (Theobroma cocoa) agroforestry plantations would result in a nearly 50% reduction in the SOC content of the 0–300 cm soil layer [33]. Moreover, plant species significantly affect the SOC content [34]. There was a higher SOC content in mixed forests of broadleaved and coniferous trees than in coniferous forests and broadleaf forests [35]. In addition, LULC type conversion is usually accompanied by site preparation, which could significantly affect the soil aggregate stability, which could affect the SOC content. Natural forest conversion to plantation resulted in soil carbon loss [36]. Primary forest conversion to secondary forest increased SOC content; the opposite conversion decreased SOC [37].
In this study, the Dsoc of each soil type was calculated based on the SOC content and the soil bulk density in 2009. Then, the Tsoc of each LULC type in 1990, 2000, 2010, and 2020 was calculated. However, this calculation did not take into account the possible changes in the Dsoc during the period 1990–2020 which may lead to over-or underestimate the Tsoc for each LULC type in 1990, 2000, 2010, and 2020 in the main stream of the Tarim River, which owes to different between vegetation structure, coverage degree, plant species and so on because those factors can affect the SOC content and the soil bulk density. Moreover, the impact of LULC change on the Dsoc occurs within several years to several decades after LULC change [32,38], such as during the transformation from primary forest to plant forest and farmland, the Dsoc began to increase approximately 40 years after a decline [39]. After 7 years of converting farmland to intercropping with walnuts, there were no significant changes in the reserves of SOC, and the reserves of SOC decreased significantly after converting farmland to orchards [40]. Within 20 years after afforestation of abandoned farmland, the SOC accumulation rate can reach 1~3.3 Mg Cha−1y−1, depending on the plant species [41]. Therefore, long-term continuous monitoring of the SOC content and the soil bulk density is of great significance for precisely estimating the Dsoc. Although there is a lack of continuous monitoring data on them, this study still provides robust insights into the SOC dynamics in the main stream of the Tarim River and contributes valuable knowledge and a case for the management of arid ecosystems.

4.3. The Impact of the Land Use/Cover Change on the Soil Organic Carbon Stock in the Region

LULC changes affect the SOC stocks and can either lead to emission or sequestration of CO2 [42], which is the combined effect of biological factors (plants, microorganisms, etc.) and non-biological limiting factors (climate, topography, soil type, etc.). The SOC is controlled by the balance between biological input and output [43]. Plants are one of the main drivers of carbon input through litter deposition and microorganism activities [43]. Small relative changes in the quality or quantity of litter inputs may alter the net accumulation or loss of soil C [44]. During the transformation from natural vegetation to farmland, the reduction in biomass due to harvesting, the increase in decomposition after soil structure disruption, are the main reasons for the loss of SOC content after the land use change from original forests to farmland [30,45]. In addition, the adoption of more sustainable management practices, such as irrigation, fertilizer application, and so on, also affects the SOC content. In the main stream of the Tarim River, the changes in the LULC are bound to be accompanied by changes in vegetation coverage, plant species, soil structure, and carbon dioxide concentration, etc., which will inevitably lead to changes in the storage of SOC.
Over the past two centuries, when natural vegetation has been converted into farmland, the soil carbon pool has been the main source of atmospheric CO2, contributing approximately 180–200 Gt C, accounting for about 40% of the total CO2 produced by human activities [42,46]. Broadleaf tree plantations placed onto prior native forest or pastures did not affect soil C stocks, whereas pine plantations reduced soil C stocks by 12–15% [4]. In this study, from the perspective of a LULC type, each LULC conversion type accompanied a Tsoc reduction or augmentation during the three periods 1990–2000, 2000–2010, and 2010–2020 (Figure 4). At the land type scale, for land with high SOC density, it is necessary to maintain its current state to prevent SOC loss (such as enclosure of the FL and the GL, irrigation, etc.), which can prevent a large amount of carbon reserves from becoming carbon sources. For land with lower SOC density, it is possible to increase the SOC content by implementing sustainable agricultural management or utilization strategies (such as converting the BL to FL or GL, such as the Three-North Shelterbelt Program in China, and fallowing, etc.), thereby making them carbon sinks. At the regional scale, the Rsoc of the main stream of the Tarim River has been continuously decreasing from 1990 to 2020, indicating that the SOC pool has been playing the role of a “carbon source” of atmospheric CO2 during the period 1990–2020. However, the Rsoc decreased the most during the period 2000–2010 and the least during the period 2010–2020, which indicated that the functional intensity of the SOC pool changed during 1990–2020. Therefore, when evaluating the role of soil carbon pools, it is necessary to pay attention to the temporal and spatial scales. Although this study ignored some influencing factors when estimating the SOC stock, it provides a useful method that does not rely on simulation for estimating SOC stock at the regional level and overcomes the limitation of field measurements relying on several soil profiles to estimate SOC stock, which makes it applicable to a large region. However, this study relies on secondary data obtained through remote sensing (including SRTM 1 data, a 1:10,000,000 scale soil type map), which imposes certain limitations on the research results. Given the ecological significance of the study area, in the future, as technological means and data accuracy change, a more precise assessment of the soil organic carbon storage in this area will still be necessary. On the other hand, at the regional scale, the types and areas of land use conversion should all be scientifically managed, regardless of whether such transformations are caused by natural factors or human activities. If the Rsoc of the main stream area of the Tarim River needs to be increased in order to play the role of a “carbon sink”, increasing the types and areas of conversion from LULC type with low Dsoc to LULC type with high Dsoc might be an effective way to change the role of the SOC pool within a region.

5. Conclusions

In the main stream of the Tarim River, the LULC area had different change characteristics during the three periods 1990–2000, 2000–2010, and 2010–2020, and the rate of land area change generally showed a fluctuating change characteristic of “slow—sharp—slow” during the three periods. In 1990, 2000, 2010, and 2020, the Tsoc of each LULC type varied. The GL had the highest Tsoc, while the RL had the lowest. The LULC conversion can lead to an increase, decrease, or remain in the Tsoc of a LULC type. The BL to GL conversion had the greatest increase in the Tsoc during the periods 1990–2000, 2000–2010, and 2010–2020, and it was 0.20 × 10¹⁰~0.31 × 10¹⁰ kg, 0.97 × 10¹⁰~1.48 × 10¹⁰ kg, 0.04 × 10¹⁰~0.06 × 10¹⁰ kg during 1990–2000, 2000–2010, and 2010–2020 periods, respectively. The Rsoc decreased by 1.38 × 10¹⁰~2.18 × 10¹⁰ kg in the main stream area of the Tarim River during the period 1990–2020. Specifically, the Rsoc reduction was the greatest during the period 2000–2010, and it was the least during the period 2010–2020.

Author Contributions

Conceptualization, Methodology, Data curation, Formal analysis, Writing—original draft, Y.Y.; Data curation, Y.W.; Visualization, H.L.; Visualization, W.W.; Writing—review, Z.Y.; Writing—editing, A.F.; Supervision, H.Z. All authors have read and agreed to the published version of the manuscript.

Funding

This work was financially supported by the National Natural Science Foundation of China (grant no 42277480), Xinjiang Natural Science Foundation (2023D01A09), Xinjiang Tianshan Talents Program (2024TSYCCX0052), and Key Laboratory Special Project of the Chinese Academy of Sciences ‘Western Light—Western Interdisciplinary Teams’ (xbzg-zdsys-202208).

Data Availability Statement

The original contributions presented in the study are included in the article. Further inquiries can be directed to the first author.

Acknowledgments

The authors wish to thank the anonymous reviewers for their insightful queries and suggestions, which improved the article.

Conflicts of Interest

The authors declare no conflicts of interest.

References

  1. Lal, R. Soil carbon sequestration impacts on global climate change and food security. Science 2004, 304, 1623–1627. [Google Scholar] [CrossRef]
  2. Chen, L.Y.; Fang, K.; Wei, B.; Qin, S.Q.; Feng, X.H.; Hu, T.Y.; Ji, C.J.; Yang, Y.H. Soil carbon persistence governed by plant input and mineral protection at regional and global scales. Ecol. Lett. 2021, 24, 1018–1028. [Google Scholar] [CrossRef]
  3. Deng, L.; Zhu, G.Y.; Tang, Z.S.; Shangguan, Z.P. Global patterns of the effects of land-use changes on soil carbon stocks. Glob. Ecol. Conserv. 2016, 5, 127–138. [Google Scholar] [CrossRef]
  4. Guo, L.B.; Gifford, R.M. Soil carbon stocks and land use change: A meta analysis. Glob. Change Biol. 2002, 8, 345–360. [Google Scholar] [CrossRef]
  5. Liu, Z.; Deng, Z.; Davis, S.J.; Clement, G.; Philippe, C. Monitoring global carbon emissions in 2021. Nat. Rev. Earth Environ. 2022, 3, 217–219. [Google Scholar] [CrossRef] [PubMed]
  6. Houghton, R.A.; Hackler, J.L.; Lawrence, K.T. The US carbon budget: Contributions from land-use change. Science 1999, 285, 574–578. [Google Scholar] [CrossRef] [PubMed]
  7. Were, K.; Singh, B.R.; Dick, B. Spatially distributed modelling and mapping of soil organic carbon and total nitrogen stocks in the Eastern Mau Forest Reserve, Kenya. J. Geogr. Sci. 2016, 26, 102–124. [Google Scholar] [CrossRef]
  8. Christopher, P.; Axel, D. Sensitivity of soil organic carbon stocks and fractions to different land-use changes across Europe. Geoderma 2013, 192, 89–201. [Google Scholar] [CrossRef]
  9. Li, M.; Wu, J.J.; Deng, X.Z. Land use change and soil carbon sequestration in China: Where does it pay to conserve? Reg. Environ. Change 2016, 16, 2429–2441. [Google Scholar] [CrossRef]
  10. Xu, L.; Yu, G.R.; He, N.P. Changes of Soil organic carbon storage in Chinese terrestrial ecosystems from the 1980s to the 2010s. Acta Geogr. Sin. 2018, 73, 2150–2167. (In Chinese) [Google Scholar]
  11. Yang, Y.H.; Che, Y.N.; Li, Z.; Chen, Y.P. Land use/cover conversion affects soil organic carbon stock: A case study along the main channel of the Tarim River, China. PLoS ONE 2018, 13, e0206903. [Google Scholar] [CrossRef]
  12. Zhou, H.H.; Ye, Z.X.; Yang, Y.H.; Zhu, C.G. Drought stress might induce sexual spatial segregation in dioecious Populus euphratica—insights from long-term water use efficiency and growth rates. Biology 2024, 13, 318. [Google Scholar] [CrossRef]
  13. Zhao, R.F.; Jiang, M.H.; Chen, Y.N.; Shi, P.J.; Pan, J.H.; Zhao, H.L. Land use/Land cover changes and its eco-environmental effects in the main stream area of the Tarim River. Geogr. Sin. 2012, 32, 244–250. (In Chinese) [Google Scholar] [CrossRef]
  14. Tian, Z.X.; Gao, F.; He, B.; Han, F.H. Land use changes and its impact on carbon stock in the Tarim River Basin from 1990 to 2020. Huan Jing Ke Xue 2024, 45, 6514–6526. (In Chinese) [Google Scholar] [CrossRef] [PubMed]
  15. Guo, J.; Wang, G.Y.; Xu, S.W.; Zhang, G.P.; Yuan, K.Y.; Ling, H.B.; Wumaierjiang, X.Y.D. Dynamic assessment of Tarim River carbon storage under enhanced water resources management. Arid. Zone Res. 2021, 38, 589–599. [Google Scholar] [CrossRef]
  16. Fu, W.; Xia, W.H.; Fan, T.S.; ZOU, Z.; Hou, Y. Scenario projection analysis of ecosystem carbon stocks in the Tarim River Basin. Arid. Land Geogr. 2024, 47, 634–647. [Google Scholar] [CrossRef]
  17. Tong, R.X.; Liang, X.; Guan, Q.F.; Song, Y.; Chen, Y.L.; Wang, Q.Y.; Zheng, L.N.; Jin, Q.; Yu, Y.P.; He, J.; et al. Estimation of soil carbon storage from land use and management at a high spatial resolution in China during 2000–2020. Acta Geogr. Sin. 2023, 78, 2209–2222. [Google Scholar] [CrossRef]
  18. Rawat, J.S.; Manish, K. Monitoring land use/cover change using remote sensing and GIS techniques: A case study of Hawalbagh block, district Almora, Uttarakhand, India. Egypt. J. Remote Sens. 2015, 18, 77–84. [Google Scholar] [CrossRef]
  19. Yan, Z.L.; Huang, Q.; Chang, J.X.; Wang, Y.M. Analysis and dynamic monitoring of land use in the main stream of Tarim river valley using remote sensing. Trans. Chin. Soc. Agric. Eng. 2008, 24, 119–123. (In Chinese) [Google Scholar]
  20. Wang, Y.P.; Alimujang; Zhou, L.; Yang, P.N.; Feng, S.Y.; Wang, Y.W. Ecological water conveyance effect in the lower reaches of Tarim River. J. Desert Res. 2023, 43, 231–240. (In Chinese) [Google Scholar] [CrossRef]
  21. Deng, L.; Wang, K.B.; Tang, Z.S.; Shangguan, Z.P. Soil organic carbon dynamics following natural vegetation restoration: Evidence from stable carbon isotopes (δ13C). Agric. Ecosyst. Environ. 2016, 221, 235–244. [Google Scholar] [CrossRef]
  22. Fan, S.H.; Guan, F.Y.; Xu, X.L.; Forrester, D.I.; Ma, W.; Tang, X.L. Ecosystem carbon stock loss after land use change in subtropical forests in China. Forests 2016, 7, 142. [Google Scholar] [CrossRef]
  23. Pan, Y.J.; He, Z.R.; Liu, Y.L.; Dong, L.B.; Lv, W.W.; Shangguan, Z.P.; Deng, L. Dynamic changes of soil aggregate associated organic carbon during secondary forests succession in the Loess Plateau. Acta Ecol. Sin. 2021, 41, 5195–5203. [Google Scholar] [CrossRef]
  24. Chang, R.Y.; Fu, B.; Liu, G.H.; Wang, S.; Yao, X.L. The effects of afforestation on soil organic and inorganic carbon: A case study of the Loess Plateau of China. Catena 2012, 95, 145–152. [Google Scholar] [CrossRef]
  25. Liu, S.L.; Tang, Y.H.; Zhang, F.W.; Du, Y.G.; Lin, L.; Li, Y.K.; Guo, X.W.; Li, Q.; Cao, G.M. Changes of soil organic and inorganic carbon in relation to grassland degradation in Northern Tibet. Ecol. Res. 2017, 32, 395–404. [Google Scholar] [CrossRef]
  26. Dlamini, P.; Chivenge, P.; Manson, A.; Chaplot, V. Land degradation impact on soil organic carbon and nitrogen stocks of sub-tropical humid grasslands in South Africa. Geoderma 2014, 235–236, 372–381. [Google Scholar] [CrossRef]
  27. Dlamini, P.; Chivenge, P.; Chaplot, V. Overgrazing decreases soil organic carbon stocks the most under dry climates and low soil pH: A meta-analysis shows. Agric. Ecosyst. Environ. 2016, 221, 258–269. [Google Scholar] [CrossRef]
  28. Francaviglia, R.; Renzi, G.; Ledda, L.; Benedetti, A. Organic carbon pools and soil biological fertility are affected by land use intensity in Mediterranean ecosystems of Sardinia, Italy. Sci. Total Environ. 2017, 599–600, 789–796. [Google Scholar] [CrossRef]
  29. dos Santos, C.A.; Rezende, C.d.P.; Machado Pinheiro, É.F.; Pereira, J.M.; Alves, B.J.R.; Urquiaga, S.; Boddey, R.M. Changes in soil carbon stocks after land-use change from native vegetation to pastures in the Atlantic forest region of Brazil. Geoderma 2019, 337, 394–401. [Google Scholar] [CrossRef]
  30. Poeplau, C.; Don, A.; Vesterdal, L.; Leifeld, J.; Wesemael, B.V.; Schumacher, J.; Gensior, A. Temporal dynamics of soil organic carbon after land-use change in the temperate zone- carbon response functions as a model approach. Glob. Change Biol. 2017, 3, 61–66. [Google Scholar] [CrossRef]
  31. Tang, G.M.; Xu, W.L.; Sheng, J.D.; Liang, Z.; Zhou, B.; Zhu, M. The variation of soil organic carbon and soil particle-sizes in Xinjiang Oasis farmland of different years. Acta Pedol. Sin. 2010, 47, 279–285. (In Chinese) [Google Scholar] [CrossRef]
  32. Yonekura, Y.; Ohta, S.; Kiyono, Y.; Aksa, D.; Morisada, K.; Tanaka, N.; Tayasu, I. Dynamics of soil carbon following destruction of tropical rainforest and the subsequent establishment of Imperata grassland in Indonesian Borneo using stable carbon isotopes. Glob. Change Biol 2012, 18, 2606–2616. [Google Scholar] [CrossRef]
  33. Straaten, O.V.; Corre Marife, D.C.; Wolf, K.; Tchienkoua, M.; Cuellar, E.; Matthews, R.B.; Veldkamp, E. Conversion of lowland tropical forests to tree cash crop plantations loses up to one-half of stored soil organic carbon. Proc. Natl. Acad. Sci. USA 2015, 112, 9956–9960. [Google Scholar] [CrossRef]
  34. Tesfaye, M.A.; Bravo, F.; Ruiz-Peinado, R.; Pando, V.; Bravo-Oviedo, A. Impact of changes in land use, species and elevation on soil organic carbon and total nitrogen in Ethiopian Central Highlands. Geoderma 2016, 261, 70–79. [Google Scholar] [CrossRef]
  35. Cremer, M.; Kern, N.V.; Prietzel, J. Soil organic carbon and nitrogen stocks under pure and mixed stands of European beech, Douglas fir and Norway spruce. For. Ecol. Manag. 2016, 367, 30–40. [Google Scholar] [CrossRef]
  36. Finstad, K.; van Straaten, O.; Veldkamp, E.; McFarlane, K. Soil carbon dynamics following land use changes and conversion to oil palm plantations in tropical lowlands inferred from radiocarbon. Glob. Biogeochem. Cycles 2020, 34, e2019GB006461. [Google Scholar] [CrossRef]
  37. Ma, S.H.; Zhu, B.; Chen, G.P.; Ni, X.F.; Zhou, L.H.; Su, H.J.; Cai, Q.; Chen, X.; Zhu, J.J.; Ji, C.J.; et al. Loss of soil microbial residue carbon by converting a tropical forest to tea plantation. Sci. Total Environ. 2022, 818, 151742. [Google Scholar] [CrossRef]
  38. Tu, C.L.; Liu, C.Q.; Quine, T.A.; Jones, M.W.; Liu, T.L.; Li, L.B.; Liu, W.J. Dynamics of soil organic carbon following land-use change: Insights from stable C-isotope analysis in black soil of Northeast China. Acta Geochim. 2018, 37, 746–757. [Google Scholar] [CrossRef]
  39. Lin, Z.W.; Li, Y.F.; Tang, C.X.; Luo, Y.; Fu, W.J.; Cai, X.Q.; Li, Y.C.; Yue, T.; Jiang, P.K.; Hu, S.D.; et al. Converting natural evergreen broadleaf forests to intensively managed Moso bamboo plantations affect the pools size stability of soil organic carbon and enzyme activites. Biol. Fert. Soils 2018, 54, 467–480. [Google Scholar] [CrossRef]
  40. Lu, S.; Meng, P.; Zhang, J.S.; Yin, C.J.; Sun, S.Y. Changes in soil organic carbon and total nitrogen in croplands converted to walnut-based agroforestry systems and orchards in southeastern Loess Plateau of China. Environ. Monit. Assess. 2015, 187, 688. [Google Scholar] [CrossRef]
  41. Lemma, B.; Kleja, D.B.; Dan Ingvar, N.; Mats, O. Soil carbon sequestration under different exotic tree species in the southwestern highlands of Ethiopia. Geoderma 2006, 136, 886–898. [Google Scholar] [CrossRef]
  42. Houghton, R.A.; Hobbie, J.E.; Melillo, J.M.; Moore, B.J.P.; Shaver, G.R.; Woodwell, G.M. Changes in the carbon content of terrestrial biota and soils between 1860 and 1980: A net release of CO2 to the atmosphere. Ecol. Monogr. 1983, 53, 235–262. [Google Scholar] [CrossRef]
  43. Kasel, S.; Singh, S.; Sanders, G.J.; Bennett, L.T. Species-specific effects of native trees on soil organic carbon in biodiverse plantings across north-central Victoria, Australia. Geoderma 2011, 161, 95–106. [Google Scholar] [CrossRef]
  44. Zhang, C.; Liu, G.B.; Xue, S.; Sun, C.L. Soil organic carbon and total nitrogen storage as affected by land use in a small watershed of the Loess Plateau, China. Eur. J. Soil Biol. 2013, 54, 16–24. [Google Scholar] [CrossRef]
  45. Xiao, C.H.; Gong, Y.Q.; Pei, X.L.; Chen, H.Y.; Li, S.; Lu, C.W.; Chen, L.; Zheng, X.H.; Zheng, J.X.; Yan, X. Impacts of land-use change from primary forest to farmland on the storage of soil organic carbon. Appl. Sci. 2024, 14, 4736. [Google Scholar] [CrossRef]
  46. DeFries, R.S.; Houghton, R.A.; Hansen, M.C.; Field, C.B.; Skole, D.; Townshend, J. Carbon emissions from tropical deforestation and regrowth based on satellite observations for the 1980s and 1990s. Proc. Natl. Acad. Sci. USA 2002, 99, 14256–14261. [Google Scholar] [CrossRef] [PubMed]
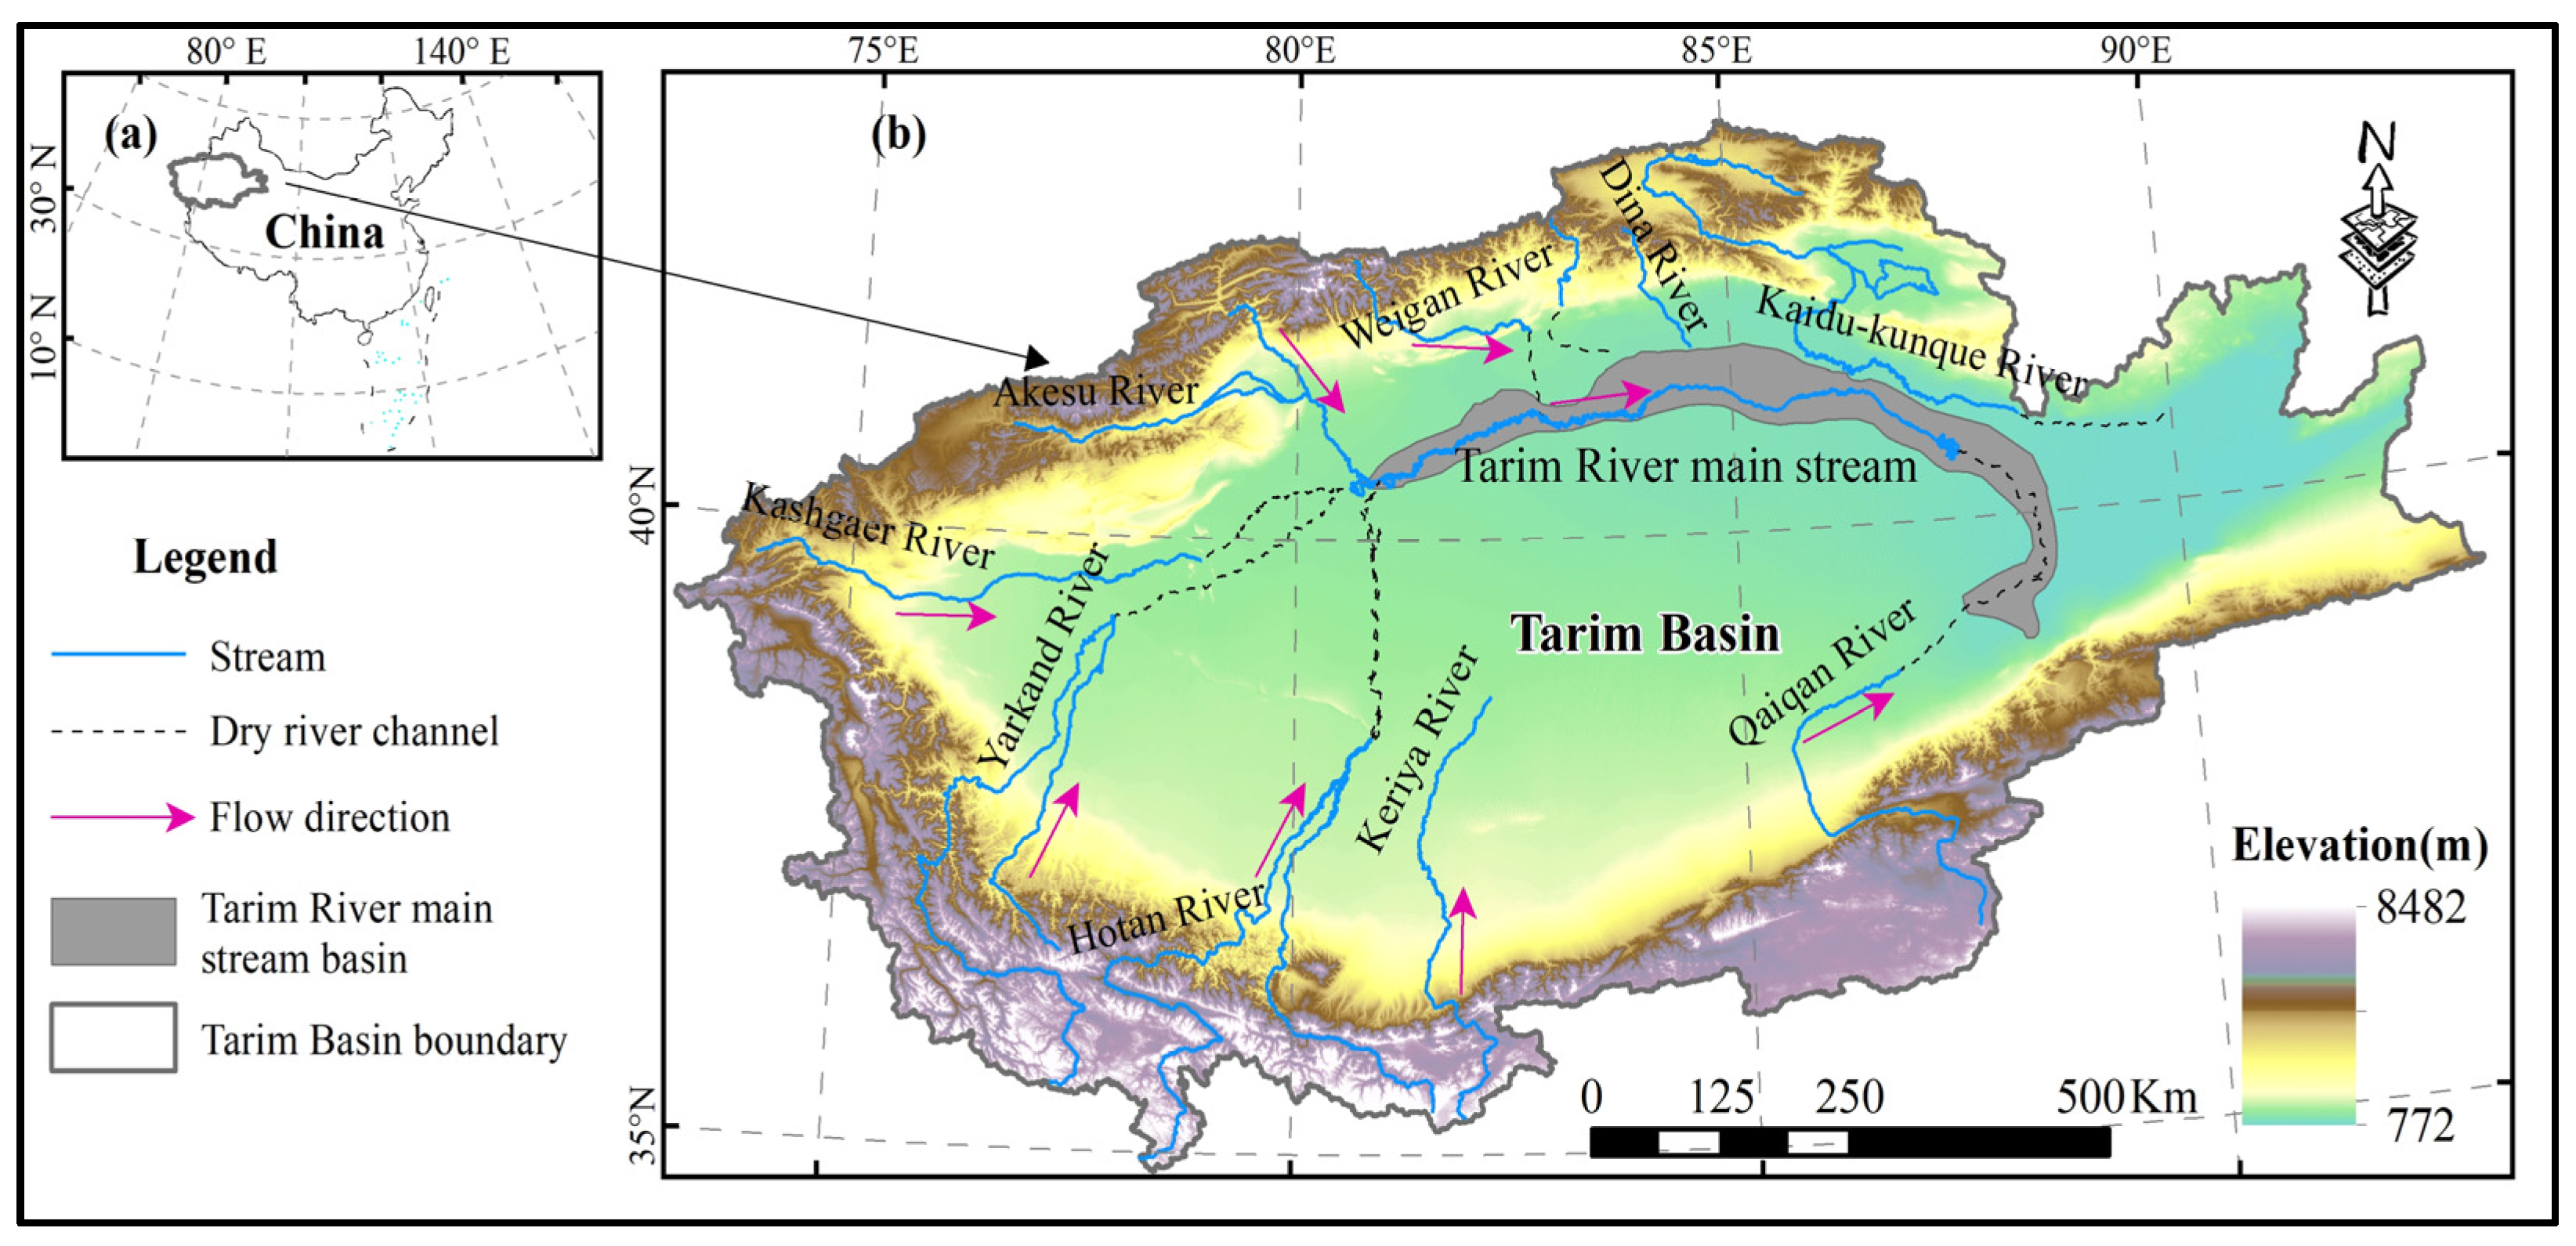
Figure 1. Sketch of the study area. (a) Location of the Tarim Basin in China. (b) study area of the main stream of the Tarim River.
Land 14 02334 g001
Figure 2. Spatial distribution of soil bulk density, SOC content, and soil types in the main stream of the Tarim River. (a) Soil bulk density at 0–30 cm soil layer; (b) Soil bulk density at 30–100 cm soil layer; (c) SOC content at 30–100 cm soil layer; (d) SOC content at 0–30 cm soil layer; (e) Soil types. AS: Alluvial soils; BS: Bog soils; DS: Desert solonchaks; S: Solonchaks; AeS: Aeolian soils; SI: Sandbars and islands in rivers; SMS: Shrub meadow soils; LR: Lakes and reservoirs; FS: Fluvo-acquic soils; MS: Meadow soils; T: Takyr.
Land 14 02334 g002
Figure 3. Land use/cover change along the main stream of the Tarim River.
Land 14 02334 g003
Figure 4. Area of different LULC types. W: water body; FL: forest land; SL: shrub land; GL: grassland; CL: cultivated land; RL: residential land; BL: bare land. Same as follows.
Land 14 02334 g004
Figure 5. The area changes in different LULC types during different periods. (A) The area change compared with the area in 1990; (B) The area change compared with the area in 2000; (C) The area change compared with the area in 2010; (D) The rate of area change for the FL; (E) The rate of area change for the SL; (F) The rate of area change for the GL; (G) The rate of area change for the BL; (H) The rate of area change for the RL; (L) The rate of area change for the CL. FL: forest land; SL: shrub land; GL: grassland; CL: cultivated land; RL: residential land; BL: bare land.
Land 14 02334 g005
Figure 6. LULC conversion during the three periods. FL: forest land; SL: shrub land; GL: grassland; CL: cultivated land; RL: residential land; BL: bare land. FL-SL: from FL to SL; CL-SL: from CL to SL; RL-FL, RL-SL, RL-GL, and RL-BL: from RL to FL, SL, GL, and BL, respectively; FL-RL, SL-RL, GL-RL, and BL-RL: from FL, SL, GL, and BL to RL, respectively. And so on for the other conversions.
Land 14 02334 g006
Figure 7. The Tsoc of different LULC types. FL: forest land; SL: shrub land; GL: grassland; CL: cultivated land; RL: residential land; BL: bare land. (A) Tsocmin of different LULC types; (B) Change of Tsocmin of different LULC types; (C) Tsocmax of different LULC types; (D) Change of Tsocmax of different LULC types.
Land 14 02334 g007
Figure 8. Change in the Tsoc in different LULC conversions during the three periods. FL: forest land; SL: shrub land; GL: grassland; CL: cultivated land; RL: residential land; BL: bare land. FL-SL: from FL to SL; CL-SL: from CL to SL; RL-FL, RL-SL, RL-GL, and RL-BL: from RL to FL, SL, GL, and BL, respectively; FL-RL, SL-RL, GL-RL, and BL-RL: from FL, SL, GL, and BL to RL, respectively. And so on for the other conversions. (A) Change of the Tsocmin in different LULC conversions during the three periods. (B) Change of the Tsocmax in different LULC conversions during the three periods.
Land 14 02334 g008
Figure 9. The Rsoc of the main stream of the Tarim River.
Land 14 02334 g009
Disclaimer/Publisher’s Note: The statements, opinions and data contained in all publications are solely those of the individual author(s) and contributor(s) and not of MDPI and/or the editor(s). MDPI and/or the editor(s) disclaim responsibility for any injury to people or property resulting from any ideas, methods, instructions or products referred to in the content.