Article

Changes and Driving Factors of Ecological Environment Quality in the Agro-Pastoral Ecotone of Northern China from 2000 to 2020

1
School of Land Engineering, Chang’an University, Xi’an 710054, China
2
Shaanxi Key Laboratory of Land Reclamation Engineering, Chang’an University, Xi’an 710054, China
3
Key Laboratory of Subsurface Hydrology and Ecological Effects in Arid Region, Chang’an University, Ministry of Education, Xi’an 710054, China
4
School of Geological Engineering and Geomatics, Chang’an University, Xi’an 710054, China
*
Author to whom correspondence should be addressed.
Land 2025, 14(12), 2309; https://doi.org/10.3390/land14122309
Submission received: 23 October 2025 / Revised: 9 November 2025 / Accepted: 21 November 2025 / Published: 24 November 2025
(This article belongs to the Special Issue Climate Change and Soil Erosion: Challenges and Solutions)

Abstract

The agro-pastoral ecotone of northern China (APENC), a typical semi-arid and ecologically vulnerable zone, has experienced considerable shifts in eco-environmental quality (EEQ) over the past two decades under the combined pressures of climate change and human activities. However, systematic understanding of the spatiotemporal evolution and driving mechanisms of EEQ in this region remains limited. Based on multi-source remote sensing data from 2000 to 2020, this study constructed an ecological quality assessment index (EQAI) using principal component analysis (PCA) and quantitatively identified driving factors through geographical detector modeling. The results reveal a consistent improvement in EEQ over the study period, characterized by a marked expansion of higher-quality areas and a contraction of degraded zones, though spatial heterogeneity remained evident. Global and local spatial autocorrelation analyses (Moran’s I) confirmed a distinct clustering pattern, with persistent low-value clusters in the northwest and high-value clusters in the southeast and north. Notably, the most pronounced EEQ enhancement occurred between 2000 and 2005. Overall, 90.24% of the region exhibited an improving trend, while only 9.76% showed degradation. Hurst exponent analysis further indicated that this improving trend is likely to continue in the future across most areas. Factor detection identified meteorological drivers (precipitation) as the strongest influencer on EEQ, followed by land use type. Socioeconomic factors demonstrated relatively minor impact. These findings provide a scientific basis for ecological restoration policy-making and sustainable land management in the APENC and other ecologically fragile transitional regions.

1. Introduction

Ecosystems serve as key regulators of regional environmental balance and stability by influencing hydrological cycles, atmospheric processes, and biogeochemical cycles, especially in arid and semi-arid regions [1,2]. The agro-pastoral ecotone, as a transitional zone where agricultural and pastoral production systems interpenetrate, has relatively fragile eco-environmental quality (EEQ), which refers to the collective quality of water, land, biological, and climate resources that impact ecosystem development [3]. Especially in recent decades, under the combined influence of climate change and human activities, the structure and function of the ecosystems of the agro-pastoral ecotone have undergone significant changes [4,5,6]. However, the specific processes and mechanisms through which EEQ responds to these external pressures remain insufficiently understood. In particular, a more systematic explanation is needed to clarify how different drivers interact and affect EEQ, and achieving a balance between human development and ecosystem protection has become a critical global issue [7,8]. Therefore, there is an urgent need for scientific methods to quantitatively investigate the changes and driving mechanisms of EEQ in the agro-pastoral ecotone over recent decades to mitigate the potential ecological risks posed by complex environmental changes.
EEQ assessment has evolved into a crucial scientific methodology that integrates region-specific ecological attributes into traditional environmental quality evaluation frameworks. In early research, Crabtree et al. (1998) developed multi-indicator systems incorporating socioeconomic and environmental dimensions to assess EEQ in the Scottish highlands [9]. Fano et al. (2003) subsequently integrated atmospheric, aquatic, and soil parameters into the evaluation index system [10]. Recent advancements in remote sensing and geographic information systems technologies have significantly enhanced EEQ monitoring, enabling continuous, high-resolution assessment at large scales [11,12,13]. Vegetation indicators, particularly vegetation coverage and net primary productivity (NPP), have been widely adopted to track ecological conditions across complex ecosystems [14]. For instance, Caccamo et al. (2011) utilized MODIS data to analyze drought responses in forest ecosystems, highlighting the vulnerability of high-biomass vegetation [15]. Similarly, Diego et al. (2020) combined vegetation, water quality, and environmental vulnerability indices to document a declining ecological trend in the Tietê-Jacare Basin, Brazil [16]. Studies by Pan et al. (2016) in the Sule River Basin and Li et al. (2019) in the Minjiang River Basin demonstrated the value of multi-source remote sensing data and spatial analysis in deciphering the interplay between human activities, policy interventions, and ecological changes [17,18].
Researchers have progressively developed various remote sensing indices to characterize different aspects of ecosystems and quantitatively assess changes in EEQ. For instance, Yue et al. (2018) employed an ecological index (EI) to evaluate EEQ, but noted its frequent challenges related to implementation difficulties and long data update cycles [19]. The ecological quality index (EQI) serves as a crucial metric for comprehensively assessing regional ecosystem quality, offering advantages such as multi-dimensional evaluation and dynamic monitoring. However, it also faces challenges including difficulties in data acquisition and limitations in assessment methodologies [20]. The remote sensing ecological index (RSEI), which integrates multiple ecological indicators through principal component analysis to objectively quantify EEQ across spatial and temporal dimensions [21,22], has been successfully applied across diverse geographical environments. For instance, Geng et al. (2022) identified altitude, slope, and GDP as key drivers of EEQ in Fuzhou City, with influences shifting over time [23]; Kang et al. (2024) highlighted the dominance of natural factors such as precipitation and topography in the Loess Plateau, alongside considerable anthropogenic impacts [24]; and Qin et al. (2024) unraveled the compounded effects of drought, ecological projects, and human actions in the Yellow River Basin [3]. Recent frameworks, such as that proposed by Mumtaz et al. (2025), integrate ecosystem service values influenced by land use/cover change (LUCC) and human activities, offering a holistic perspective on ecological–socioeconomic interactions [8]. Moreover, Chen et al. (2021) advanced zonal differentiation techniques to account for regional variations in soil, climate, and biology, improving the contextual accuracy of EEQ assessments [4].
Although progress has been made in EEQ assessment, existing studies still exhibit several limitations, particularly in arid and semi-arid regions where assessments often diverge from actual conditions. Hydrological factors play a decisive role in EEQ in these areas, particularly soil moisture, which critically constrains the growth and condition of vegetation. However, the current EEQ assessment frameworks has led to insufficient consideration of hydrological contributions. This limitation compromises the reliability of EEQ assessments in arid and semi-arid zones. Moreover, in regions experiencing significant land use changes, such as the agro-pastoral ecotone, ecological restoration projects have triggered substantial shifts in land cover—frequently involving conversions between cropland and grassland. These transformations alter eco-hydrological processes and water resource distribution [25,26,27], yet their impacts on EEQ are often overlooked, compromising assessment objectivity. Therefore, future research should prioritize the development of integrated evaluation frameworks that incorporate key hydrological parameters and combine land use, socioeconomic, and policy dimensions. Such a holistic approach is essential for accurately analyzing EEQ and supporting sustainable resource management in arid and semi-arid ecosystems.
The agro-pastoral ecotone of northern China (APENC) is a typical semi-arid ecologically fragile zone where agricultural and pastoral production systems converge [28]. The region’s EEQ plays a critical role in safeguarding ecological security and promoting sustainable development in northern China [29,30]. Over the past few years, influenced by climate change and human activities, the ecosystem in the APENC has become increasingly vulnerable, and currently faces multiple ecological and environmental challenges such as soil erosion, vegetation degradation, and land desertification. Recent research in the APENC has primarily focused on clarifying ecological functions and influencing factors [6], improving crop yield and quality [31], optimizing water resource allocation [28,32], and enhancing land use patterns [33,34]. Unlike previous studies that primarily focused on vegetation or socioeconomic factors, this research explicitly integrates vegetation, climatic, and hydrological parameters into a unified eco-environmental quality assessment framework for dryland transition zones through constructing an ecological quality assessment index (EQAI). Based on this index, the spatiotemporal evolution characteristics of the EQAI are analyzed, the multiple influencing factors of EEQ are identified, and the response mechanism of EEQ to these driving factors is further explored. This research provides guidance for future vegetation restoration and management, thereby contributing to the promotion of ecological sustainability in the APENC.

2. Materials and Methods

2.1. Study Area

The APENC is an important transitional zone between the agricultural areas and pastoral production systems in Northeast and North China (100°12′–125°45′ E, 35°31′–50°26′ N), mainly located on the Inner Mongolia Plateau and the northern part of the Loess Plateau, including Inner Mongolia, Heilongjiang, Jilin, Liaoning, Hebei, Shanxi, Shaanxi, Gansu, Ningxia and Qinghai Provinces [35], with a total area of approximately 720,000 km2 (Figure 1). The average altitude of this area is about 1100 m, and it lies within the transitional zone between the temperate continental climate and the temperate monsoon climate. The annual precipitation (PRE) ranges from 250 to 500 mm, mainly concentrated from June to August, and the average annual temperature (TEMP) ranges from 2 to 8 °C. The vegetation is mainly composed of meadows, shrubs and crops such as corn. Agriculture and animal husbandry are mutually supportive, forming a unique agricultural and animal husbandry production model. The APENC not only possesses unique geographical and climatic conditions but also serves a key function in agricultural and animal husbandry economic as well as ecological functions.

2.2. Data Sources and Preprocessing

Table 1 presents an overview of the data used in this study, covering 2000–2020. The derivation of EEQ-related indicators relied mainly on the MODIS imagery dataset, which offers high spatiotemporal resolution earth observation data. Remote sensing data were mainly sourced from the National Aeronautics and Space Administration (NASA, https://ladsweb.modaps.eosdis.nasa.gov/, accessed on 5 June 2024). The GEE platform was used for preprocessing, incorporating atmospheric correction and other techniques to optimize image quality. For vegetation factors which were sensitive to seasonal variability, including fraction vegetation coverage (FVC), leaf area index (LAI) and gross primary productivity (GPP). To minimize seasonal effects on the analysis results, the seasonal mean for each year from June to September (summer) was used [36].
Meteorological data, including air temperature (TEMP), precipitation (PRE) and land surface temperature (LST), were acquired from the China Meteorological Data Service Centre (https://data.cma.cn/data/, accessed on 5 June 2024). Soil moisture (SM) data was acquired from the global surface SM data with a spatial resolution of 1 km (2000–2020) [37]. Land use type (LUT) data was obtained from China Land Cover Dataset [38]. This dataset classifies the land use types in APENC into 9 categories with a spatial resolution of 30 m. Digital elevation model data (DEM) was obtained from SRTM DEM data set (CGIAR—CSI. 2013), published by China National Qinghai–Tibet Plateau Data Center. Population density (PD) and gross domestic product (GDP) data were obtained from Chinese national earth system science data center (http://www.geodata.cn, accessed on 5 June 2024). To ensure dataset consistency, all imagery was resampled to a common spatial resolution of 1 km.

2.3. Methods

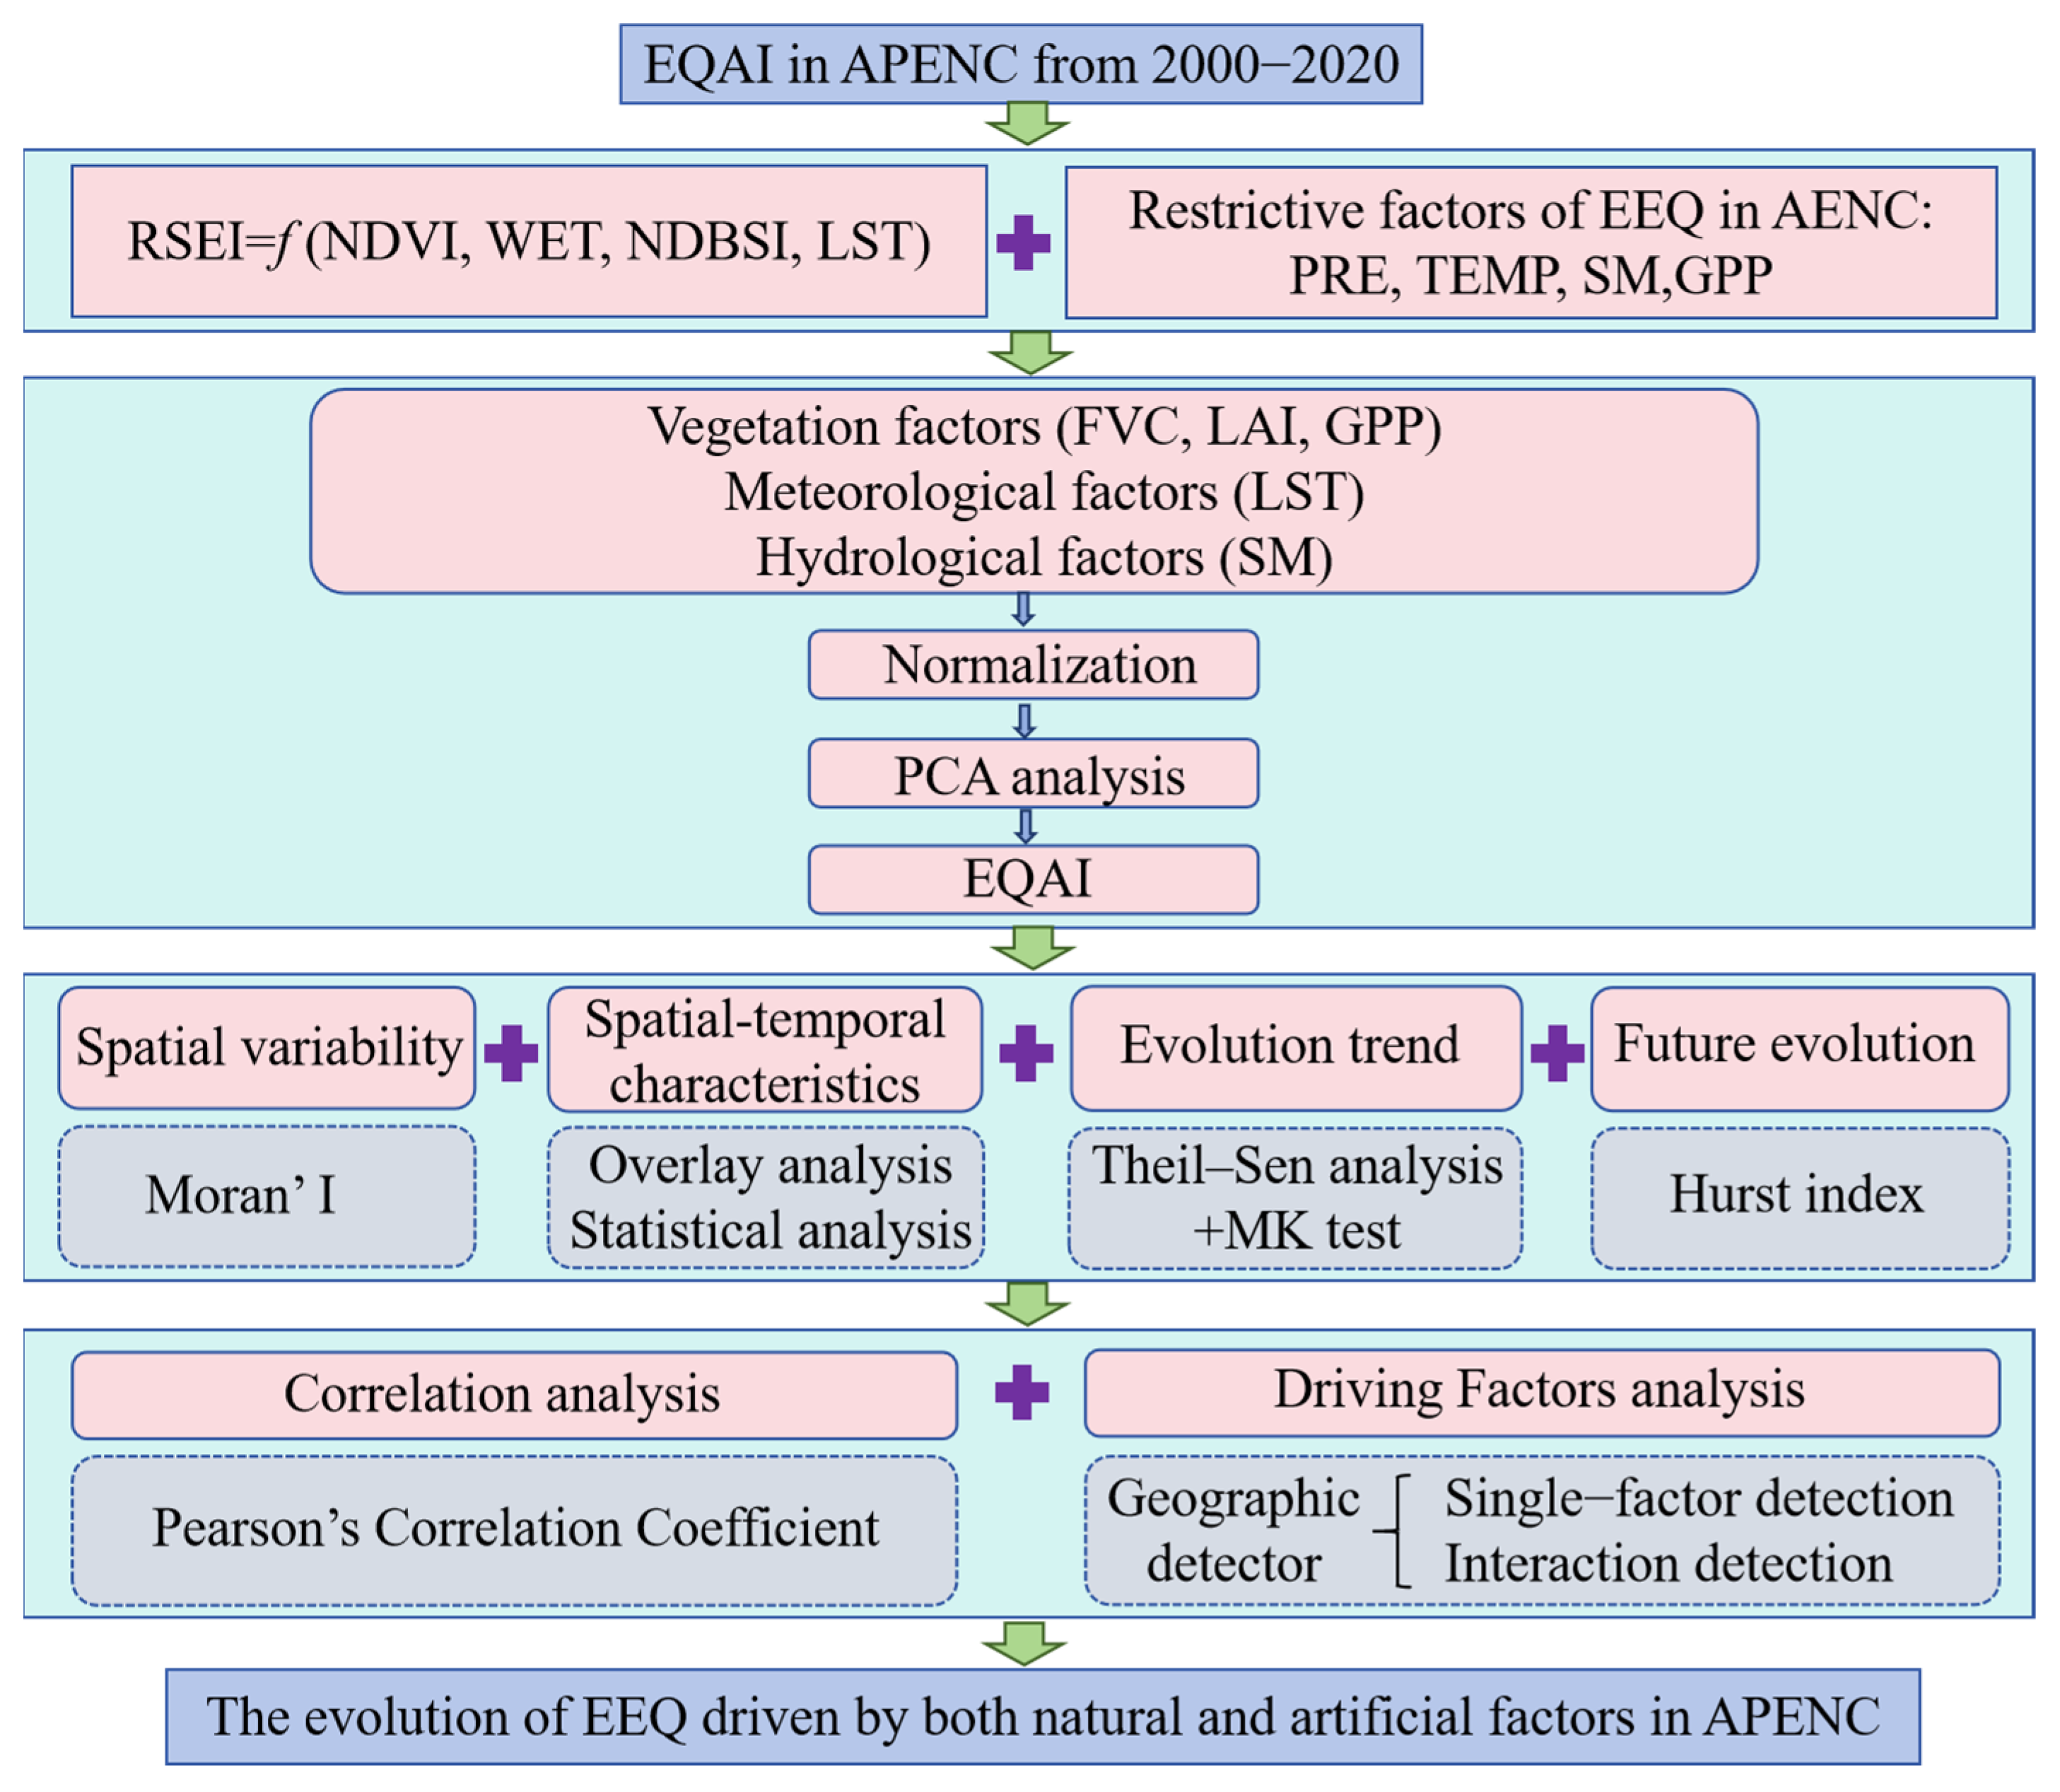
The spatiotemporal patterns and dynamics of EQAI in the APENC from 2000 to 2022 were analyzed in this study. In accordance with the environmental characteristics of the APENC, three ecological indicators (vegetation factors, meteorological factors, and hydrological factors), including five indexes (FVC, LAI, GPP, LST, and SM), were incorporated to develop the EQAI based on principal component analysis (PCA). Subsequently, the spatial auto-correlation of EQAI was analyzed employing Moran’s I to examine the spatial clustering of the data. Furthermore, the spatiotemporal variation in the EEQ of APENC was examined based on EQAI data. The trend and dynamic patterns of EEQ were systematically analyzed using Sen-MK spatial analysis in the study area. Finally, the impact of natural—and artificial drivers on EEQ was evaluated using correlation analysis and geographic detector. The detailed workflow is presented in Figure 2.

2.3.1. Eco-Environmental Quality Assessment Index (EQAI)

The EEQ of the APENC is influenced by multiple factors rather than a single element, due to its complex natural conditions. RSEI serves as a comprehensive and reliable index for assessing environmental quality. Therefore, based on RSEI, EQAI was constructed to conduct a long-term time series analysis of EEQ in the APENC in this study. According to indicators in the RSEI model, this study reorganized these indicators by considering the specific geographical, climatic, and ecological conditions of the APENC. Specifically, FVC and LAI characterize the complexity of vegetation in the horizontal and vertical dimensions, respectively. SM characterizes soil moisture conditions, and LST characterizes soil heat conditions. In addition, considering the contribution of crop yields to EEQ of the APENC, GPP is introduced as one of the indices in the EQAI. These indices can be grouped into three categorical factors: ecology, meteorology, and hydrology. Among them, the ecological factors include FVC, LAI, and GPP; the meteorological factors include LST; and the hydrological factors include SM. The method for constructing EQAI is
E Q A I = f F V C , L A I , G P P , L S T , S M
PCA is a multivariate statistical method that determines the weights of indicators in an automatic and objective manner, considering both the characteristics of the data and the contribution of each indicator to the principal components [39]. Thus, it eliminates bias arising from human subjectivity in assigning weights. In order to reduce the dimension and retain more information, the 5 selected ecological indicators were normalized and analyzed using principal component analysis in this study. The normalized method is expressed as the following formula:
y i = x i x m i n x m a x x m i n
where  y i  denotes the normalized value of the ecological factor,  x i  denotes the original value of the ecological factor, and  x m i n  and  x m a x  are the overall minimum and maximum value of the ecological factor, respectively.
The prior results show that the characteristic value of the first principal component is the largest among the five principal components, indicating that it has a strong explanatory power [40]. In other words, it contains the main information related to the five ecological indicators. The cumulative contributions of the first three principal components across the five periods were 86.41%, 88.22%, 87.67%, 87.31%, and 87.91%, respectively, all exceeding 85%, indicating that the first to the third principal components contained the vast majority of the information in the ecological indicators. Therefore, the EQAI value of the APENC can be calculated using the first to the third principal components.
Based on the weighted summation of the principal components’ contribution rates, the EQAI of the APENC is synthesized:
E Q A I = P 1 P C 1 + P 2 P C 2 + P 3 P C 3
where P1, P2, and P3 are the variance contribution rates of PC1, PC2, and PC3 respectively.
Finally, EQAI was normalized and then divided into five levels: [0, 0.2] denotes poor EQAI, (0.2, 0.4] denotes fair EQAI, (0.4, 0.6] denotes moderate EQAI, (0.4, 0.8] denotes good EQAI, (0.8, 1.0] denotes excellent EQAI.

2.3.2. Moran’s I

The global and local Moran’s I were calculated to evaluate the spatial autocorrelation distribution of EEA in APENC and explore its spatial agglomeration characteristics. The calculation formula is as follows [36]:
I G = n i = 1 n j = 1 n W i j x i x x j x i = 1 n j = 1 n W i j x i x 2
I L = x i x j = 1 n W i j x j x i = 1 n x i x 2
where IG and IL represent the global and local Moran’s I, respectively; n is the total number of samples; Wij is the spatial weight matrix; xi is the EQAI value of the i-th area; x is the average value of EQAI in the study area. IG ranges from −1 to 1. IL can be classified into five types: insignificant, high-high aggregation, low-low aggregation, high-low aggregation, and low-high aggregation.

2.3.3. Theil–Sen Slope Estimator and Mann–Kendall Test

The Theil–Sen median approach was applied to characterize spatial variations in EQAI throughout the study period. This approach minimizes outlier influence and is commonly used in spatial trend analysis [36]. Its calculation procedure is
S l o p e = m e d i a n ( E Q A I j E Q A I i j i )
where Slope shows the progression of EQAI trends; EQAIi and EQAIj indicate the EQAI for years i and j, respectively. Slope > 0 corresponds to an upward temporal trend in EQAI, and Slope < 0 corresponds to a downward temporal trend in EQAI.
Significance of year-to-year variations in EQAI over 2000–2022 was investigated using the Mann–Kendall (MK) test. The MK test is regarded as a widely used non-parametric statistical approach for assessing trend significance and detecting increasing or decreasing patterns in data [36]. The significance of the trend is determined using the standardized MK statistic Z, whose formula is
Z = S 1 v a r ( S )                                                   S > 0 0                                                                               S = 0 S + 1 v a r ( S )                                                   S < 0
S = i = 1 n 1 j = i + 1 n s i g n ( E Q A I j E Q A I i )
n represents the extent of the temporal series; sign() is used to determine the relative magnitude between EQAIj and EQAIi. A significance trend test achieves confidence levels of 90%, 95%, and 99% when |Z| exceeds 1.65, 1.96, and 2.58, respectively.

2.3.4. Hurst Index

Hurst index as a reliable tool for the quantitative description of long temporal correlation, is frequently utilized in domains such as meteorology, hydrology, geology and ecology, to analyze the trend in long-term time series [41]. Various approaches exist for estimating the Hurst exponent H, with the R/S analysis being one of the most commonly applied methods. The formula was given below:
H = l o g ( R / S n )
where H is Hurst index; R represents the range; S denotes the standard deviation; and n is the length of the series.
The range of the H is [0, 1]. When 0 ≤ H < 0.5, EQAI exhibits long-term negative correlation. When H = 0.5, it indicates that the EQAI values are independent of each other and random. When 0.5 < H ≤1, EQAI demonstrates long-term positive correlation.

2.3.5. Pearson’s Correlation Coefficient Method

The Pearson correlation coefficient method [42] was employed to analyze the relationship between annual EQAI and both natural and artificial driving factors for each image element.
r = i = 1 n x i x y i y i = 1 n x i x 2 i = 1 n y i y 2
The range of r is [−1, 1]. When r > 0, the variables are positively correlated; when r < 0, they are negatively correlated. The absolute value of r represents the correlation strength, and r = 0 indicates no linear relationship.

2.3.6. Geographic Detector

Geographic detector is a statistical technique grounded in spatial statistics and the theory of spatial autocorrelation [43]. It can quantify the influence and relative importance of each driving factor, assess interactions among factors, minimize the impact of subjective bias, and provide more objective and accurate evaluation outcomes [44]. In this study, the factors influencing EQAI were analyzed by single factor detection and interaction detection, respectively.
(1)
Single-factor detection
The spatiotemporal influence degree of various factors on EEQ was assessed by factor detection. The specific definition is as follows:
q = 1 h = 1 L N h σ h 2 N σ 2
where q is the explanatory power of the variable for a certain spatial attribute; h is the category or division of the variable, Nh is the number of sample units in the sub-region, N is the total number of sample units in the entire region, L is the number of sub-regions, σ2 is the variance of a single variable in the entire region, and σ2h is the variance of the sub-region.
(2)
Interaction detection
By analyzing the interaction intensity among different influencing factors, it can be determined whether the combined explanatory strength of two factors (X1 and X2) together for EQAI (Y) increases or decreases [45]. The result was acquired by q-value [q(X1∩X2)] (Table 2).

2.3.7. Analysis of the Transfer Matrix of LUCC

Land use changes in the study area were analyzed using the Markov model. The Markov model is a stochastic process model, which can not only quantitatively describe the change status among various land types, as well as indicating the conversion pathways between land types [46]. The Markov transition matrix was as following:
R i j = R 11 R 12 R 1 N R 21 R 22 R 2 N R N 1 R N 2 R N N
where Rij represents the area change in land type from the beginning to the end over a period of time.

3. Results

3.1. Spatiotemporal Characteristics of EQAI

The spatiotemporal patterns and classification of EQAI in the APENC from 2000 to 2020 are presented in Figure 3. It can be found that the proportion of excellent EEQ land reached a peak of 3.40% in 2020, followed by 2.90% in 2010 and 2.70% in 2015, while the minimum proportion of 0.70% was noted in 2000. The proportion of years with good EEQ reached the highest in 2005, at 18.20%, followed by 17.10% in 2020, while the lowest was 8.50% in 2000. The proportion of areas with moderate EEQ remained relatively stable and showed an upward trend over the years. The proportion peaked at 44.70% in 2020, followed by 38.80% in 2015 and 36.00% in 2005, with a minimum value of 30.60% recorded in 2000. The proportions of areas with fair EEQ were 51.70% in 2000, 40.30% in 2010, 35.90% in 2015, 33.80% in 2005, and 30.80% in 2020, exhibiting a downward trend over the study period. The proportion of the area with poor EEQ was the highest in 2005, at 10.00%, followed by 8.50% in 2000, 7.70% in 2015, 6.70% in 2010, and 4.00% in 2020, demonstrating a clear decreasing trend over the study period. In terms of spatial distribution, the EEQ was poor in the northern part of Gansu, Ningxia, and Shaanxi, as well as in the southwestern part of Inner Mongolia and the eastern part of the Horqin Sandy Land. Secondly, the EEQ was fair in the southeastern parts of northern Gansu, northern Ningxia, and northern Shaanxi; the northeastern part of southwestern Inner Mongolia; and Horqin Sandy Land. The majority of areas with good EEQ were situated in Qinghai, Hebei, southern Shaanxi, Shanxi, Liaoning, Jilin, and Heilongjiang Province. Areas exhibiting excellent EEQ were primarily found in central Gansu, southern Shaanxi, southeastern Shanxi, and the northernmost part of Inner Mongolia.
Table 3 shows the global Moran’s I of the EQAI in the APENC from 2000 to 2020. It can be seen that the global Moran’s I values were consistently positive, and all associated p-values were below 0.01 and z-scores exceeded 2.58, corresponding to a 99% confidence level from 2000 to 2020. These results indicate a 99% certainty that EQAI was positively correlated and significantly aggregated in space. Between 2000 and 2005, the global Moran’s I increased from 0.7717 to a peak value of 0.8367, reflecting that the highest level of spatial agglomeration occurred in that year. However, it slightly decreased to 0.7557 in 2020, indicating a weakening of spatial aggregation. This might be attributed to the fact that the effects of ecological restoration projects began to emerge in 2005, resulting in a stronger aggregation effect of EEQ.
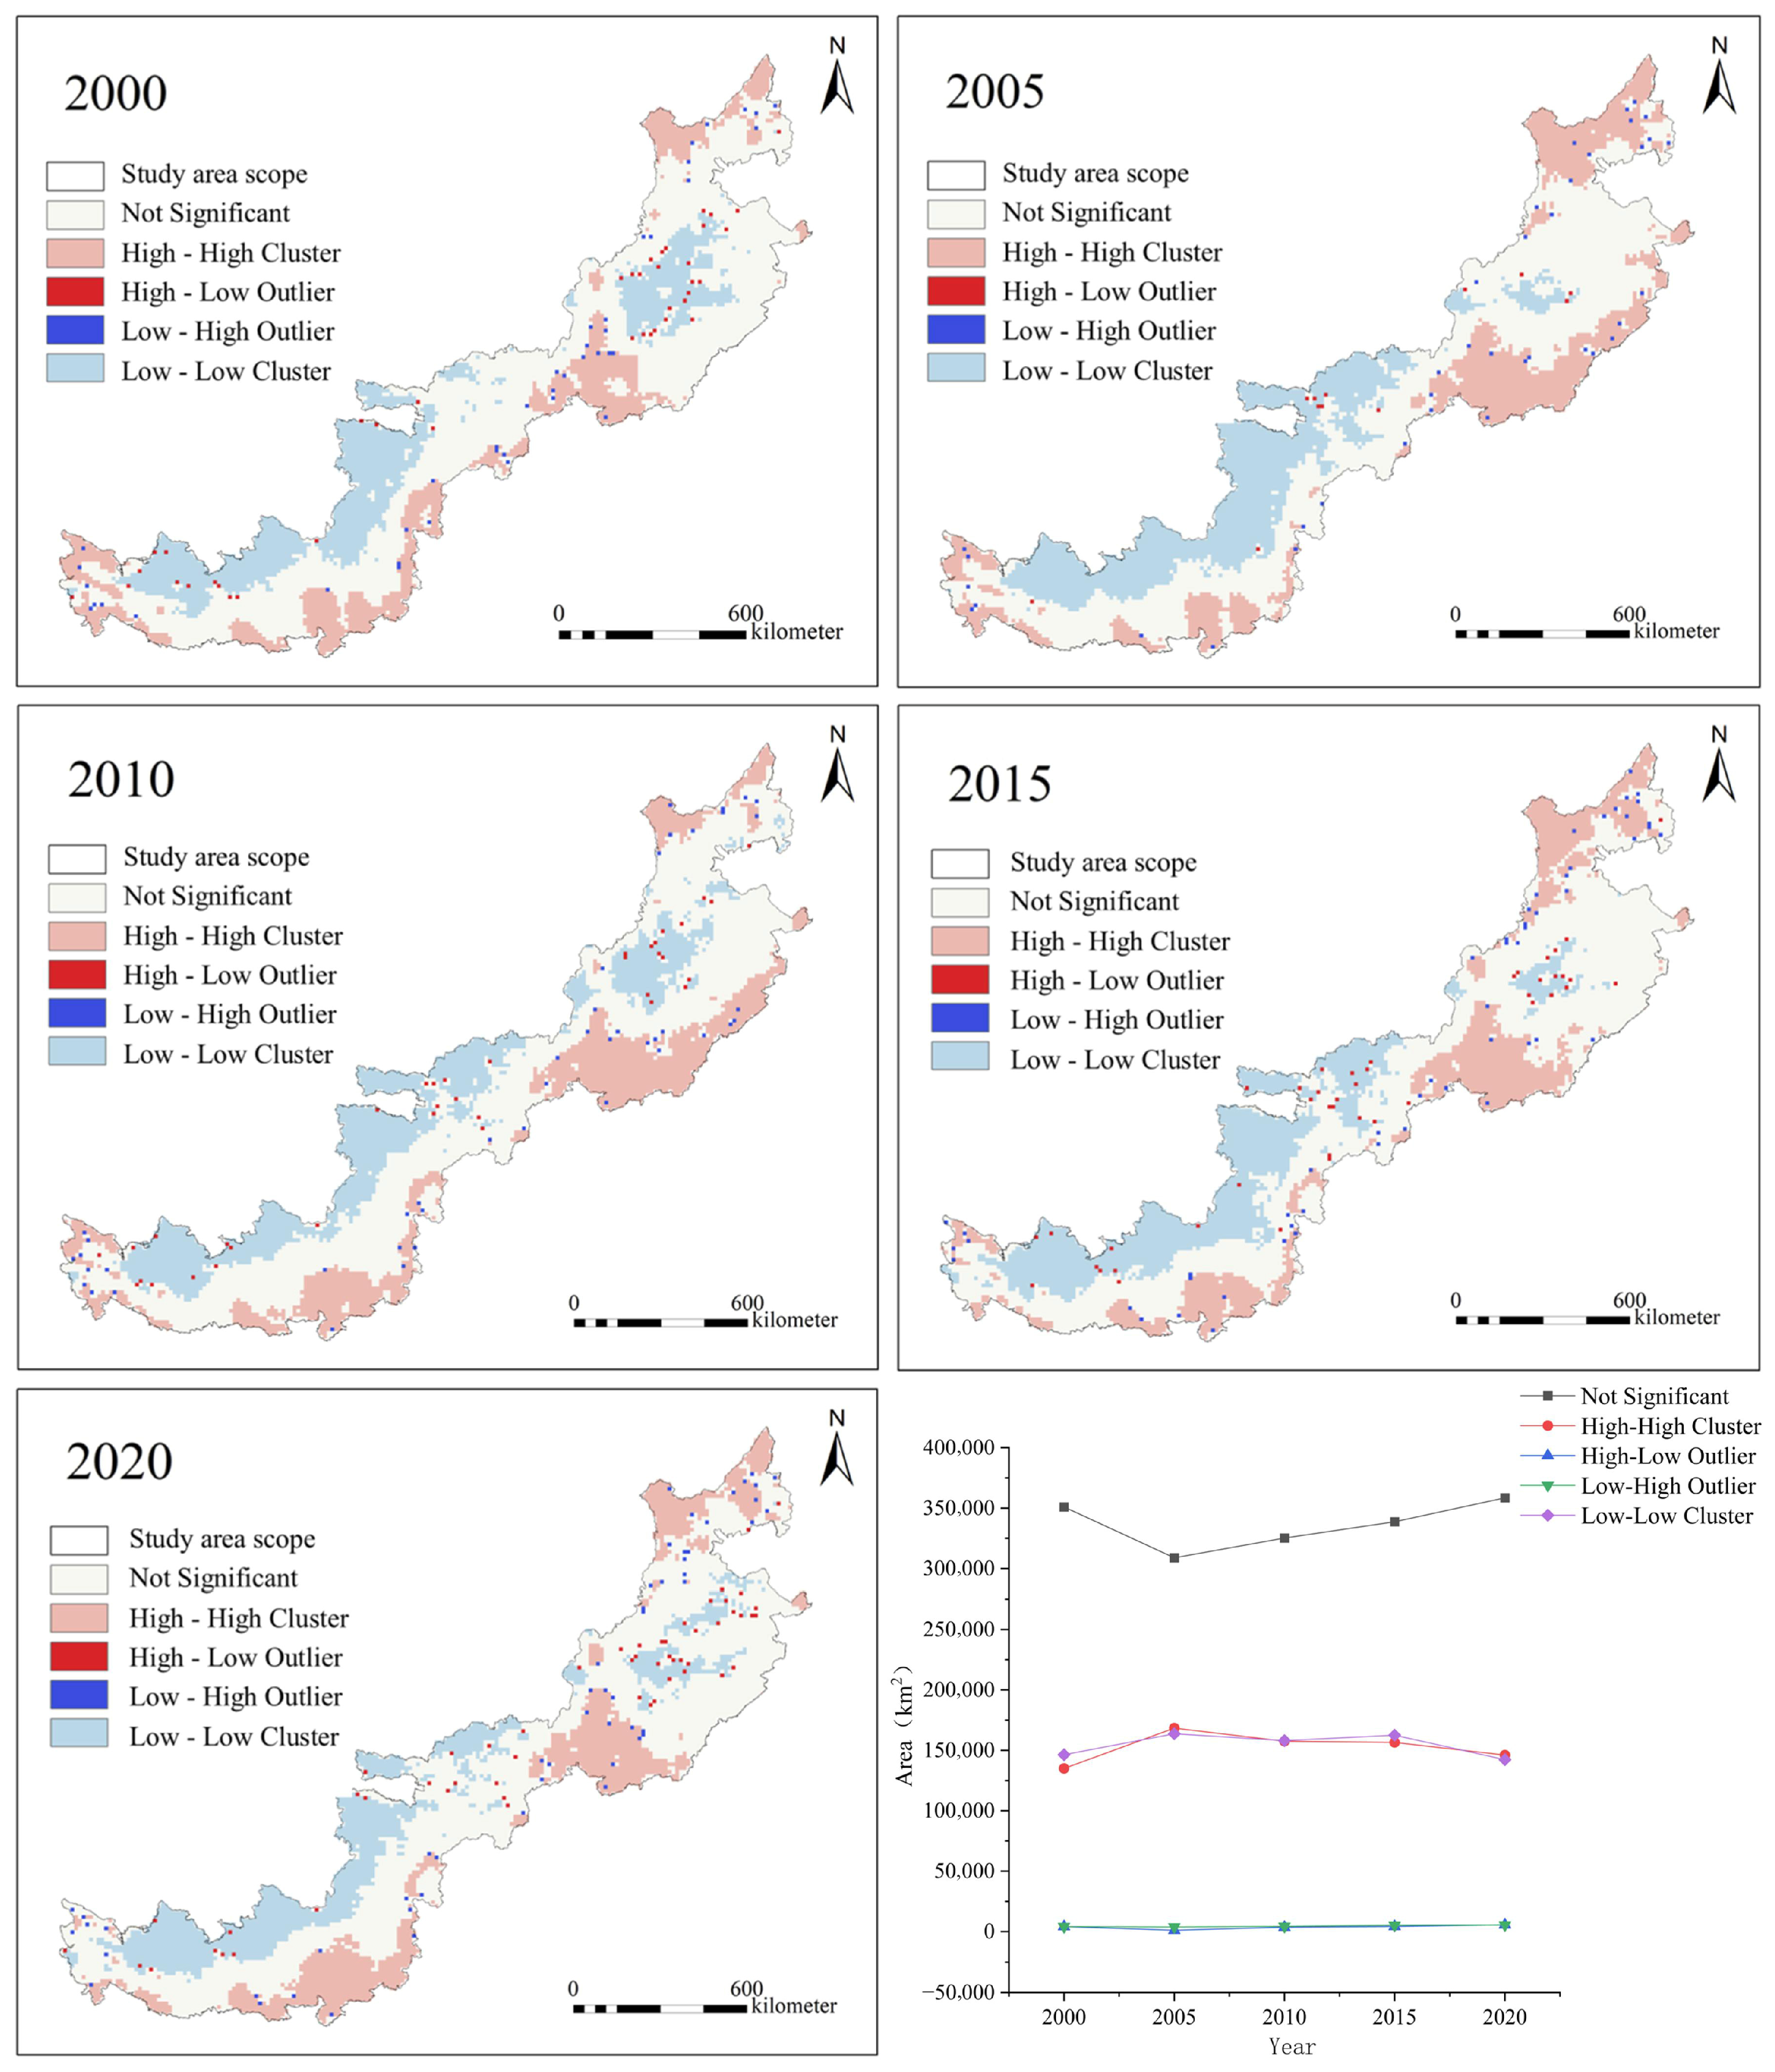
Figure 4 presents the clustering feature and area changes in the EQAI in the APENC from 2000 to 2020, which implies that the spatial distribution of EEQ in the APENC was primarily characterized as “insignificant”, “high–high aggregation”, or “low–low aggregation”, with the aggregation characteristics remaining consistent across all periods. The areas with insignificant aggregation of EEQ in the western region are mainly distributed between the northwestern high–high aggregation area and the southeastern low–low aggregation area. Meanwhile, in the eastern region, they are primarily distributed on the periphery of the low–low aggregation area around the Horqin Sandy Land. Areas with high–high EEQ concentration are mainly concentrated in the northern and southern regions of Qinghai, the southern regions of Gansu, the southern regions of Shaanxi, the southern regions of Shanxi, Hebei, the northeastern regions of Inner Mongolia, and the northwestern part of Heilongjiang Province. These regions are primarily covered with forests and grasslands, with a relatively high vegetation coverage, which contributes to their relatively high EEQ. Moreover, adjacent areas likewise exhibit relatively high EEQ. The low–low EEQ concentration areas are mainly distributed in the northern regions of Gansu Province, the northern regions of Ningxia, the northwestern regions of Shaanxi Province, the northwestern regions of Inner Mongolia, and the areas around the Horqin Sandy Land. Regions with insignificant aggregation experienced an initial reduction in area, which was subsequently followed by growth. The areas exhibiting high–high and low–low aggregation only increased significantly from 2000 to 2005. In other periods, they fluctuated around 150,000 km2. The areas exhibiting high–low and low–high aggregation remained small and stable. Overall, the spatial differentiation of EEQ in the APENC from 2000 to 2020 can be summarized as follows: the northwest region of the study region exhibited low–low aggregation, the southeast and northern regions of the study region showed high–high aggregation, the areas surrounding the central Horqin Sandy Land were characterized by low–low aggregation, and the remaining areas did not exhibit significant aggregation. The areas of each cluster remained relatively stable over time. Only around the Horqin Sandy Land did the low–low aggregation area decrease significantly, while in southeastern Inner Mongolia, areas of high–high aggregation experienced a significant growth in spatial extent.

3.2. Evolution of EQAI

The spatiotemporal dynamics of EQAI in the APENC are shown in Figure 5. It can be seen that the EEQ represented by the EQAI value gradually improved from northwest to southeast from 2000 to 2020. The area with an improving EEQ accounted for the largest proportion from 2000 to 2005, reaching 32.46%, and was mainly distributed in the northeastern regions of the APENC. Meanwhile, from 2005 to 2010, the area with retrogressive EEQ had the largest proportion, reaching 16.58%, and was also primarily distributed in the northeastern part of the APENC. From 2010 to 2015, the EEQ in the northern region of the APENC showed an upward tendency, while the EEQ in the northwest region showed a retrogressive trend. From 2020 to 2025, the regions exhibiting an improving EEQ were primarily concentrated in the southern region of the APENC, while the areas with a retrogressive EEQ were mainly concentrated in the northern part of the APENC. Overall, the proportion of areas exhibiting an improvement in EEQ was as high as 97.25% from 2000 to 2020.

3.3. Changing Trend of EEQ

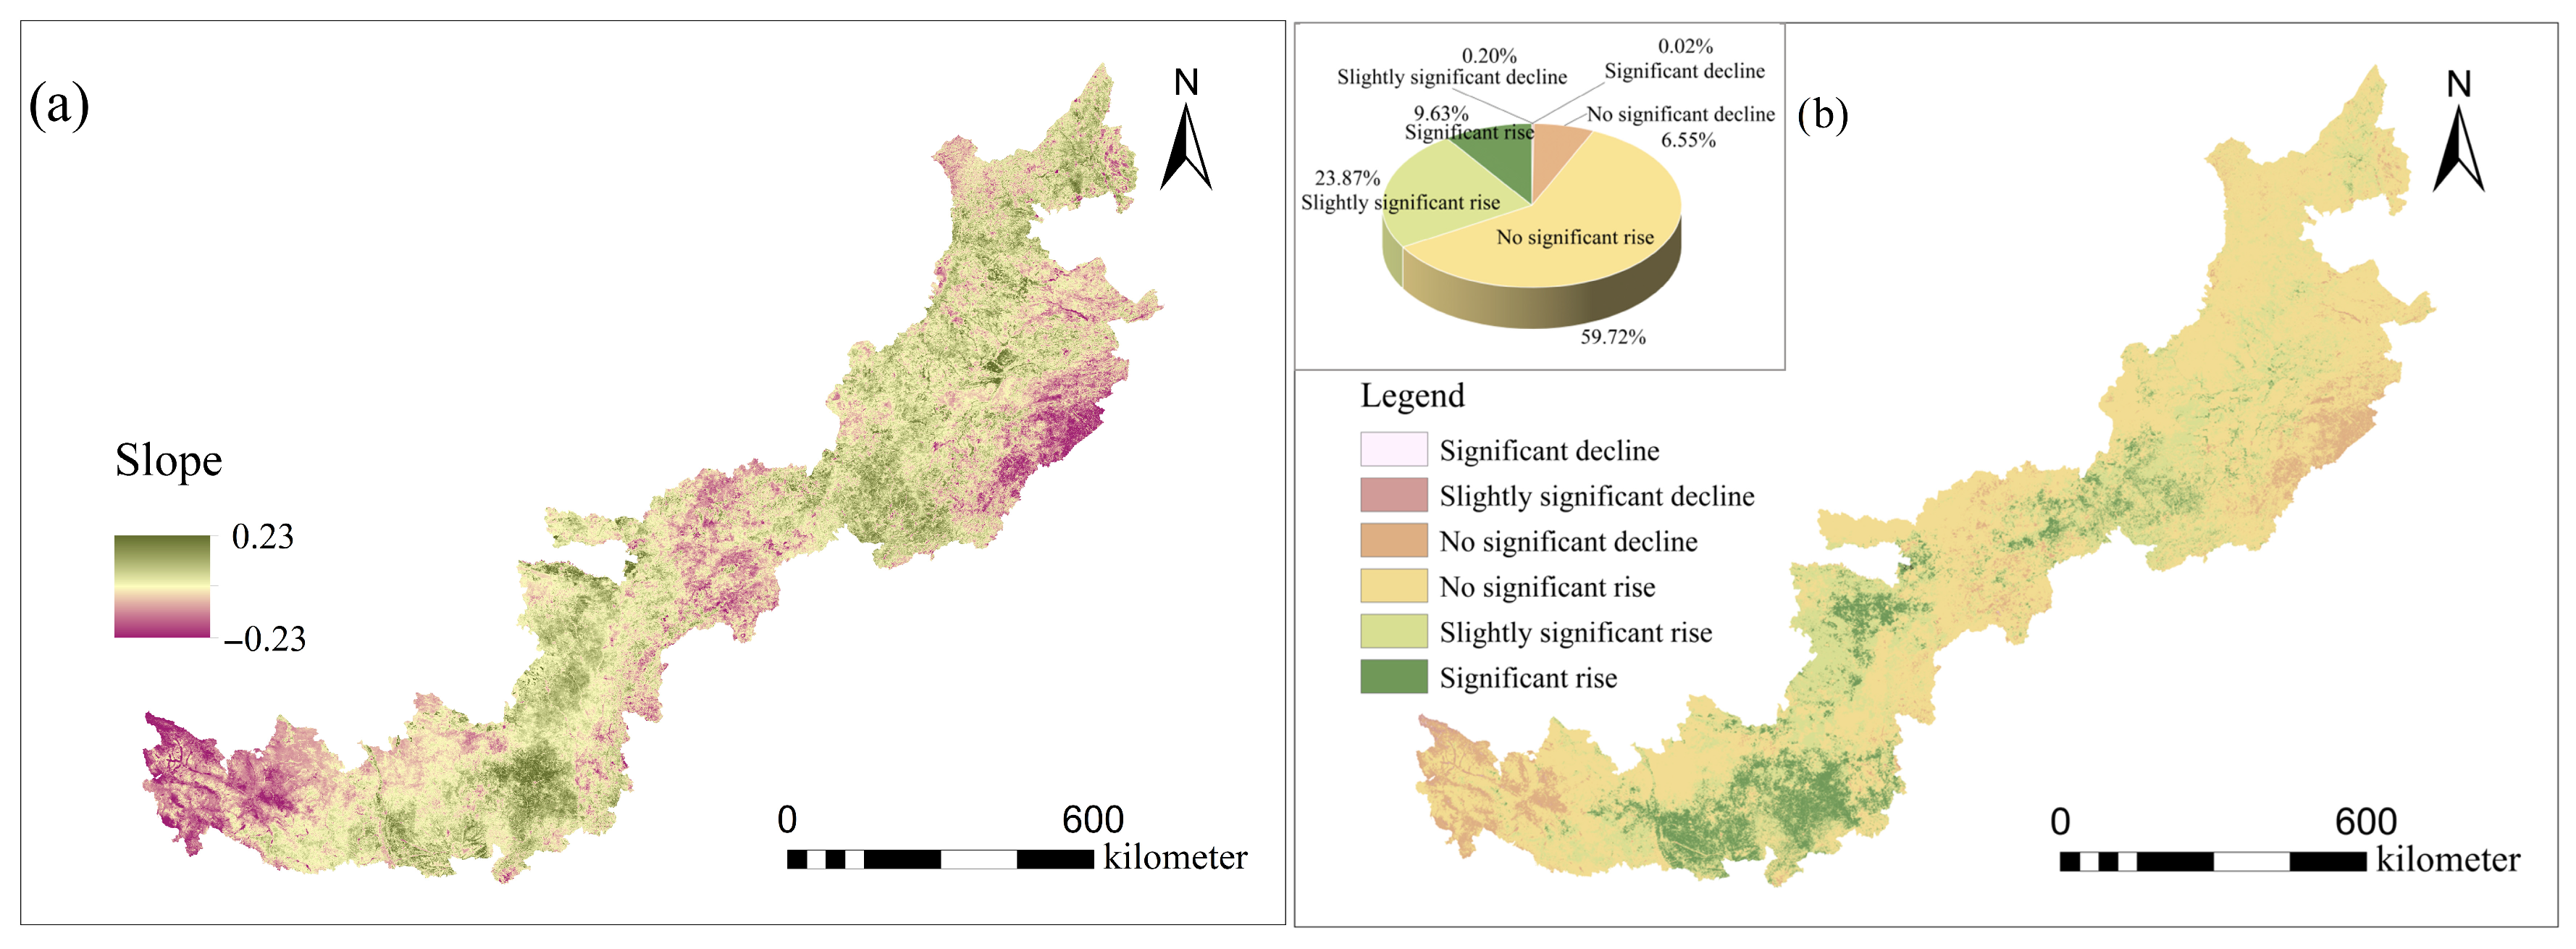
Spatial trends in EQAI changes over the past 20 years were assessed through the Sen slope and MK test (Figure 6). The results indicate that the spatial distribution of EQAI changes in the APENC exhibited heterogeneity over the 2000–2020 period. Overall, EEQ has shown marked improvement in the study region, with an upward trend observed in 90.24% of regions and a decline in only 9.76%. Not significant (59.72%), slightly significant (23.87%), and significant (9.63%) rising trends were mainly distributed in the western regions of the APENC. Not significant (6.55%), slightly significant (0.2%), and significant (0.02%) decline trends were also largely found in the eastern and western regions of the APENC. These findings suggest that, while certain areas showed decreases, EQAI across the study area has generally trended upward over the past 20 years.
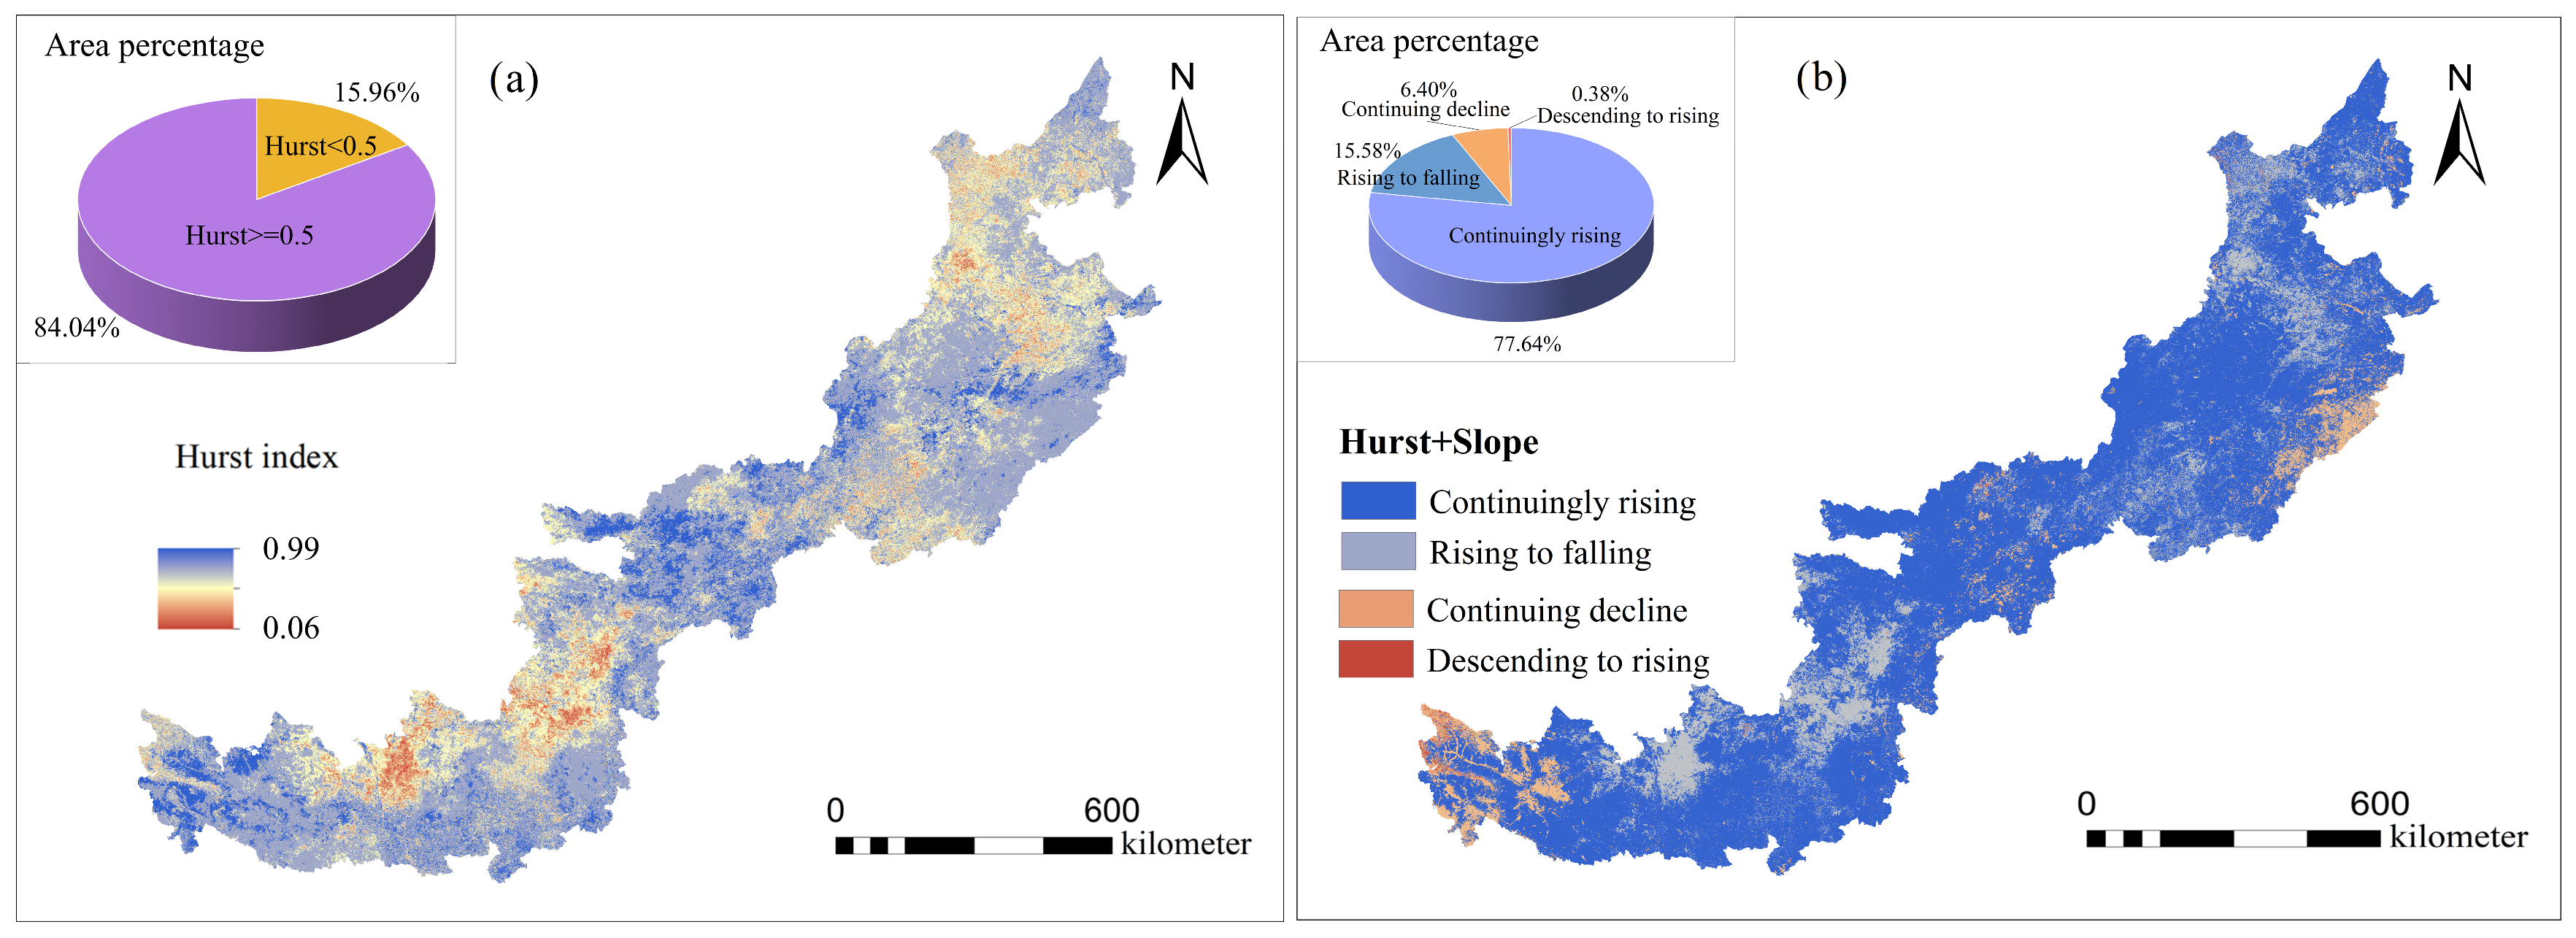
The Hurst index was computed to gain deeper insight into the long-term behavior of EQAI trends, as shown in Figure 7a. EQAI exhibited an average Hurst index of 0.43, spanning a range from 0.06 to 0.99. Approximately 15.96% of the study area had a Hurst index under 0.5, reflecting inverse sustainability, which suggests that previous upward trends are prone to reversal over time. This trend is primarily located in the northern regions of Ningxia and Shaanxi, as well as the central, northern, and northeastern parts of Inner Mongolia. Approximately 84.04% of the area exhibited a Hurst index of 0.5 or higher, primarily located in the central, southern, and western regions of APNEC, especially in Qinghai, western Gansu, and western Inner Mongolia, where the Hurst index ranges from approximately 0.8 to 1, indicating a stronger persistence of the positive trend in EQAI. Overall, the future trend of EQAI in the APENC is roughly similar to the gradual increasing trend observed from 2000 to 2020, and the EEQ is developing in a very positive direction. The integration of 20-year EQAI trends and Hurst index values in the APENC allowed for the classification of future EQAI trends into four categories: continuously rising, rising to falling, continuously declining, and descending to rising (Figure 7b). The respective proportions of the four types were 77.64%, 15.58%, 6.40%, and 0.38%, respectively. The dominant pattern is continuously rising EQAI, primarily concentrated in the central and southern parts of the APENC. Areas with a continuous decline in EQAI are predominantly found in the western and northeastern regions of the APENC. Future declines are anticipated in areas that showed past increases, predominantly in the central-southern and northeastern zones of the APENC. Only a minor portion of the regions with prior declining trends are forecasted to experience increases in the future.

3.4. Influencing Factors of EEQ in the APENC

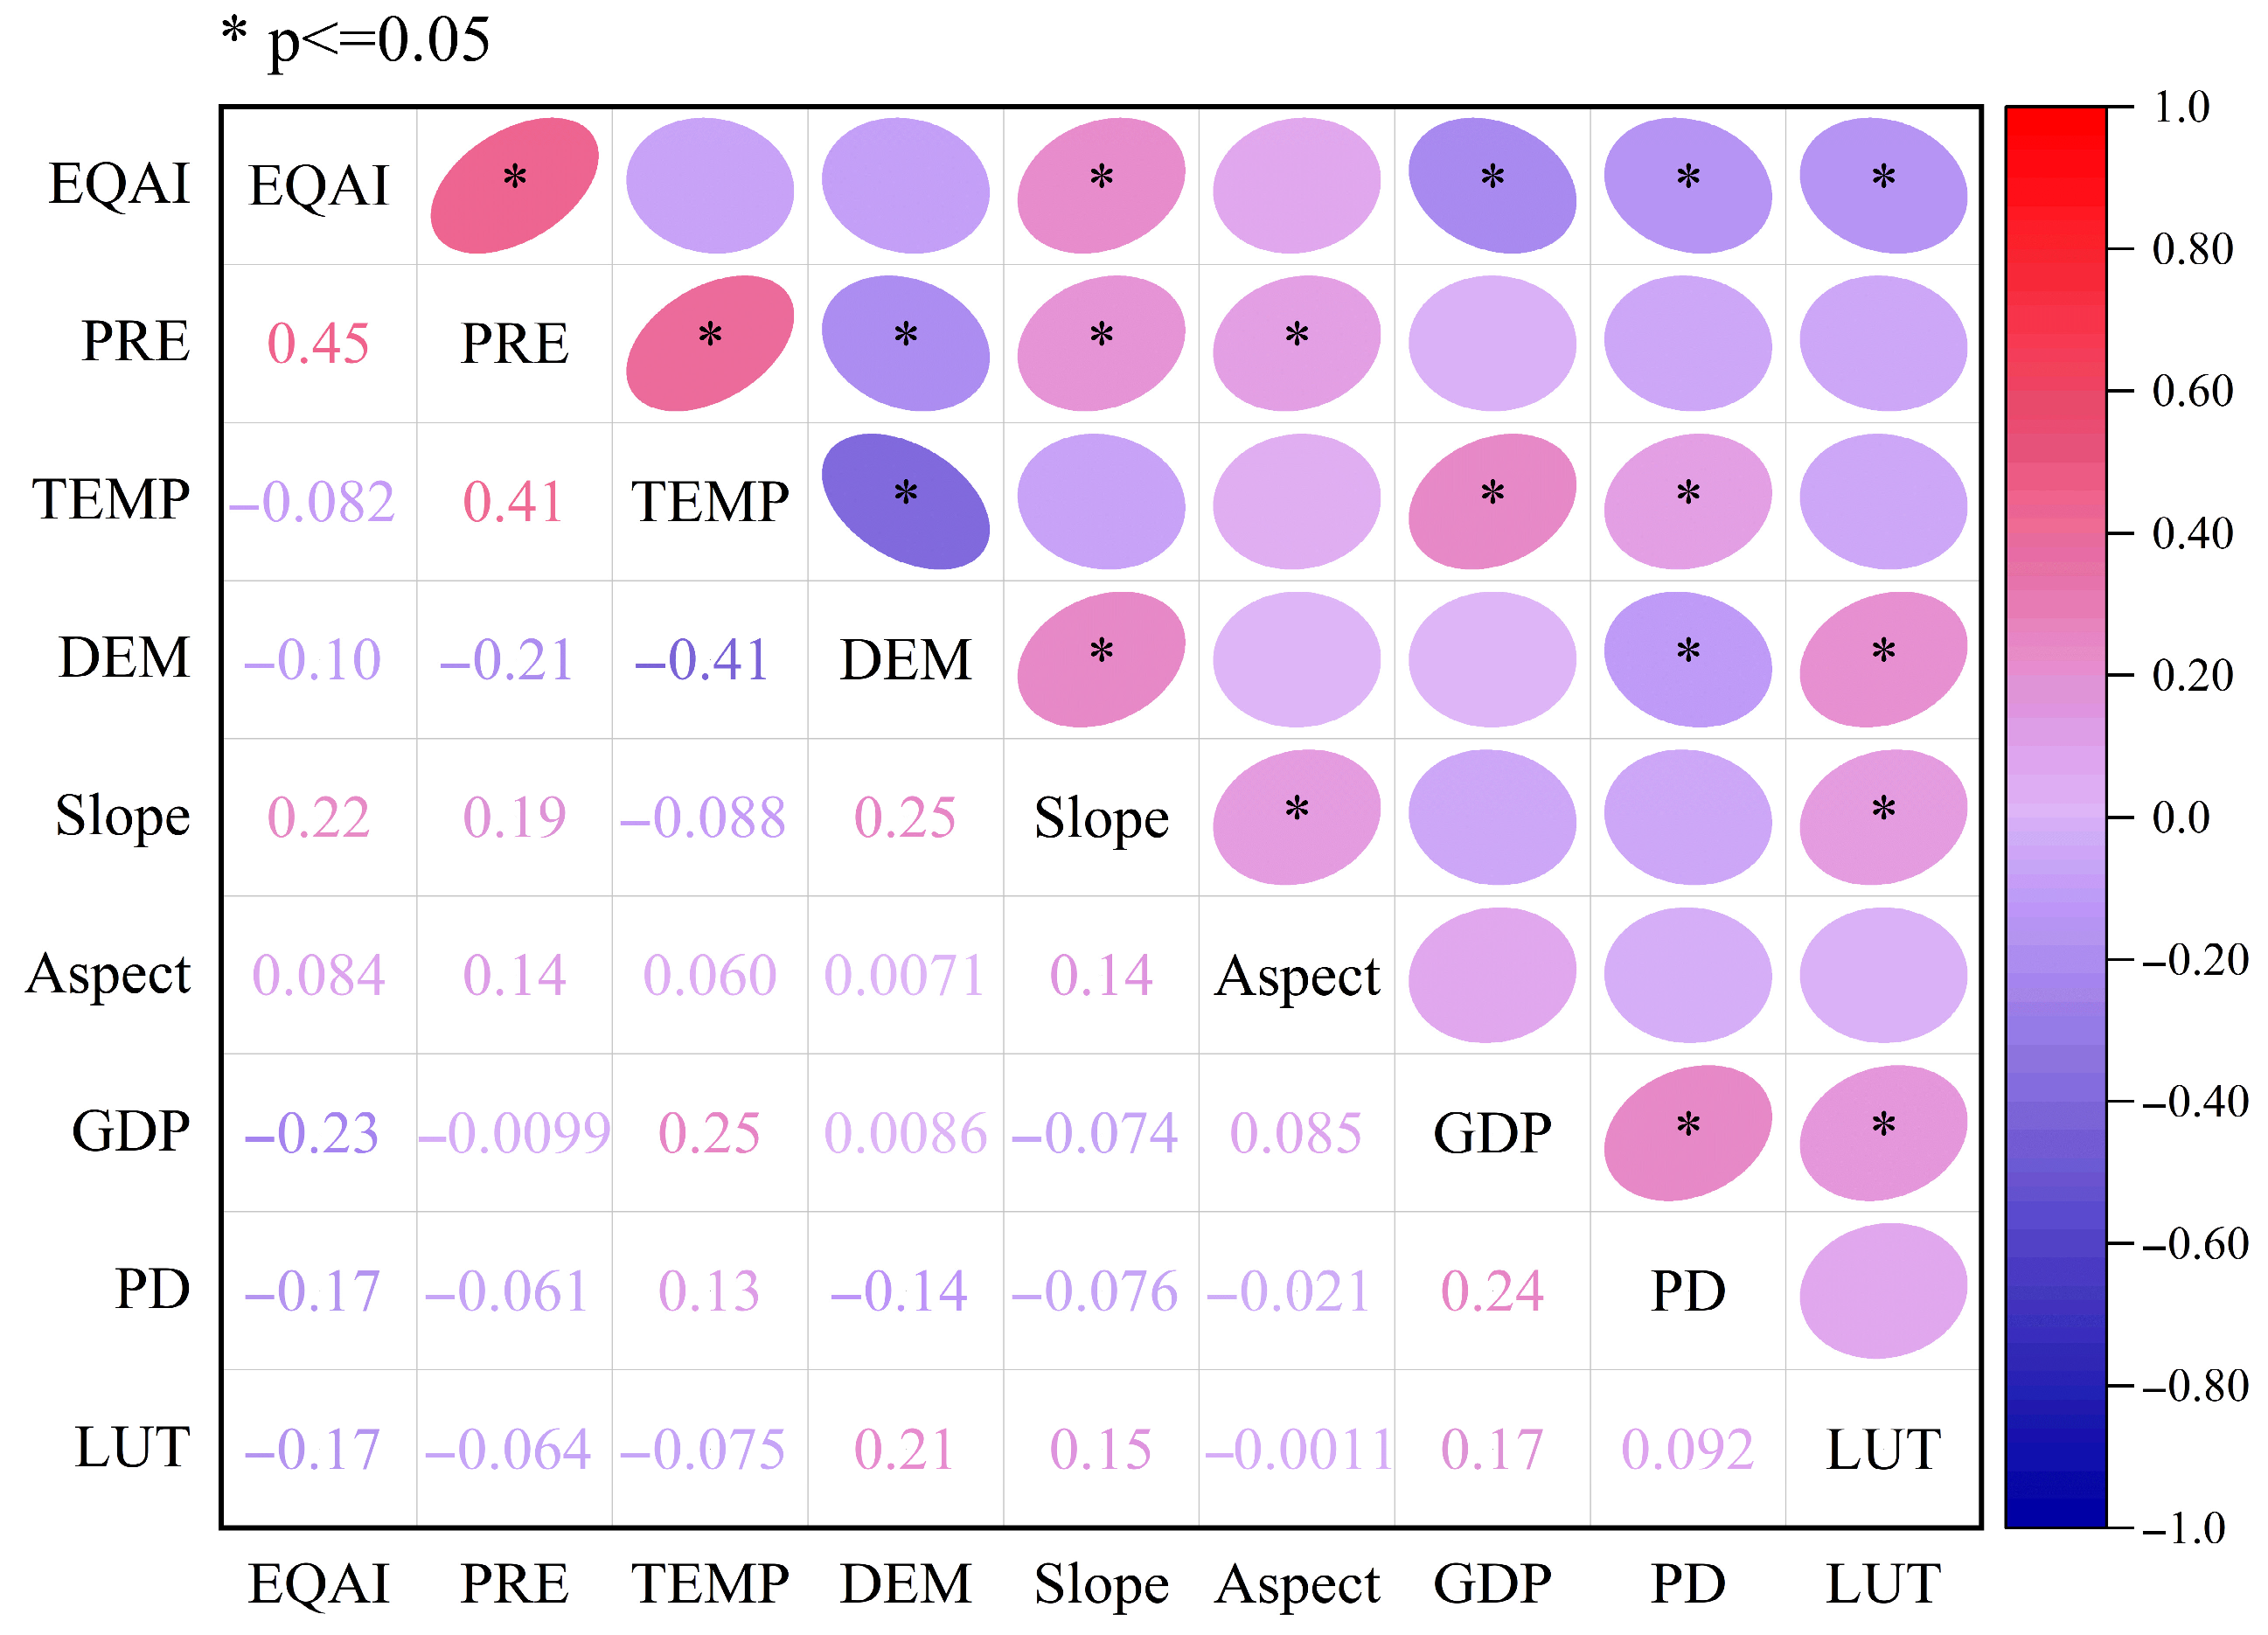
It can be seen from the correlation matrix graph (Figure 8) that EQAI is significantly positively correlated with PRE, with a correlation coefficient of 0.45. This indicates that when precipitation increases, EQAI tends to increase. Precipitation resources are the dominant factors driving the changes in EEQ in the APENC. The correlation coefficients between TEMP, DEM, Aspect, and EQAI are close to 0, indicating that their influence on EQAI is very small. The correlations between the remaining factors and EQAI are relatively weak, and their direct impact on regional EEQ is relatively limited. Overall, the EEQ of the APENC is mainly driven under the joint effect of water supply, while factors such as terrain and population density have relatively minor impacts.
As shown by the single-factor detection results (Table 4), PRE exhibited an increase in q value from 0.4084 in 2000 to 0.6182 in 2005, followed by a decrease to 0.3532 in 2020, suggesting that precipitation played a more significant role in influencing EEQ around 2005. The q value of TEMP is generally low, indicating that it exerts a relatively limited effect on EEQ. The influence of the DEM, Slope, and Aspect factors on the EEQ is relatively small, indicating a limited impact on EEQ. LUT exhibited a gradual increase in q value, rising from 0.0211 in 2000 to 0.0500 in 2020, indicating that the impact of LUT on the EEQ has gradually intensified. The influence of socioeconomic factors (GDP and PD) on the EEQ is also low. Overall, the influence of PRE shows a decreasing trend, and the influence of LUT gradually increased.
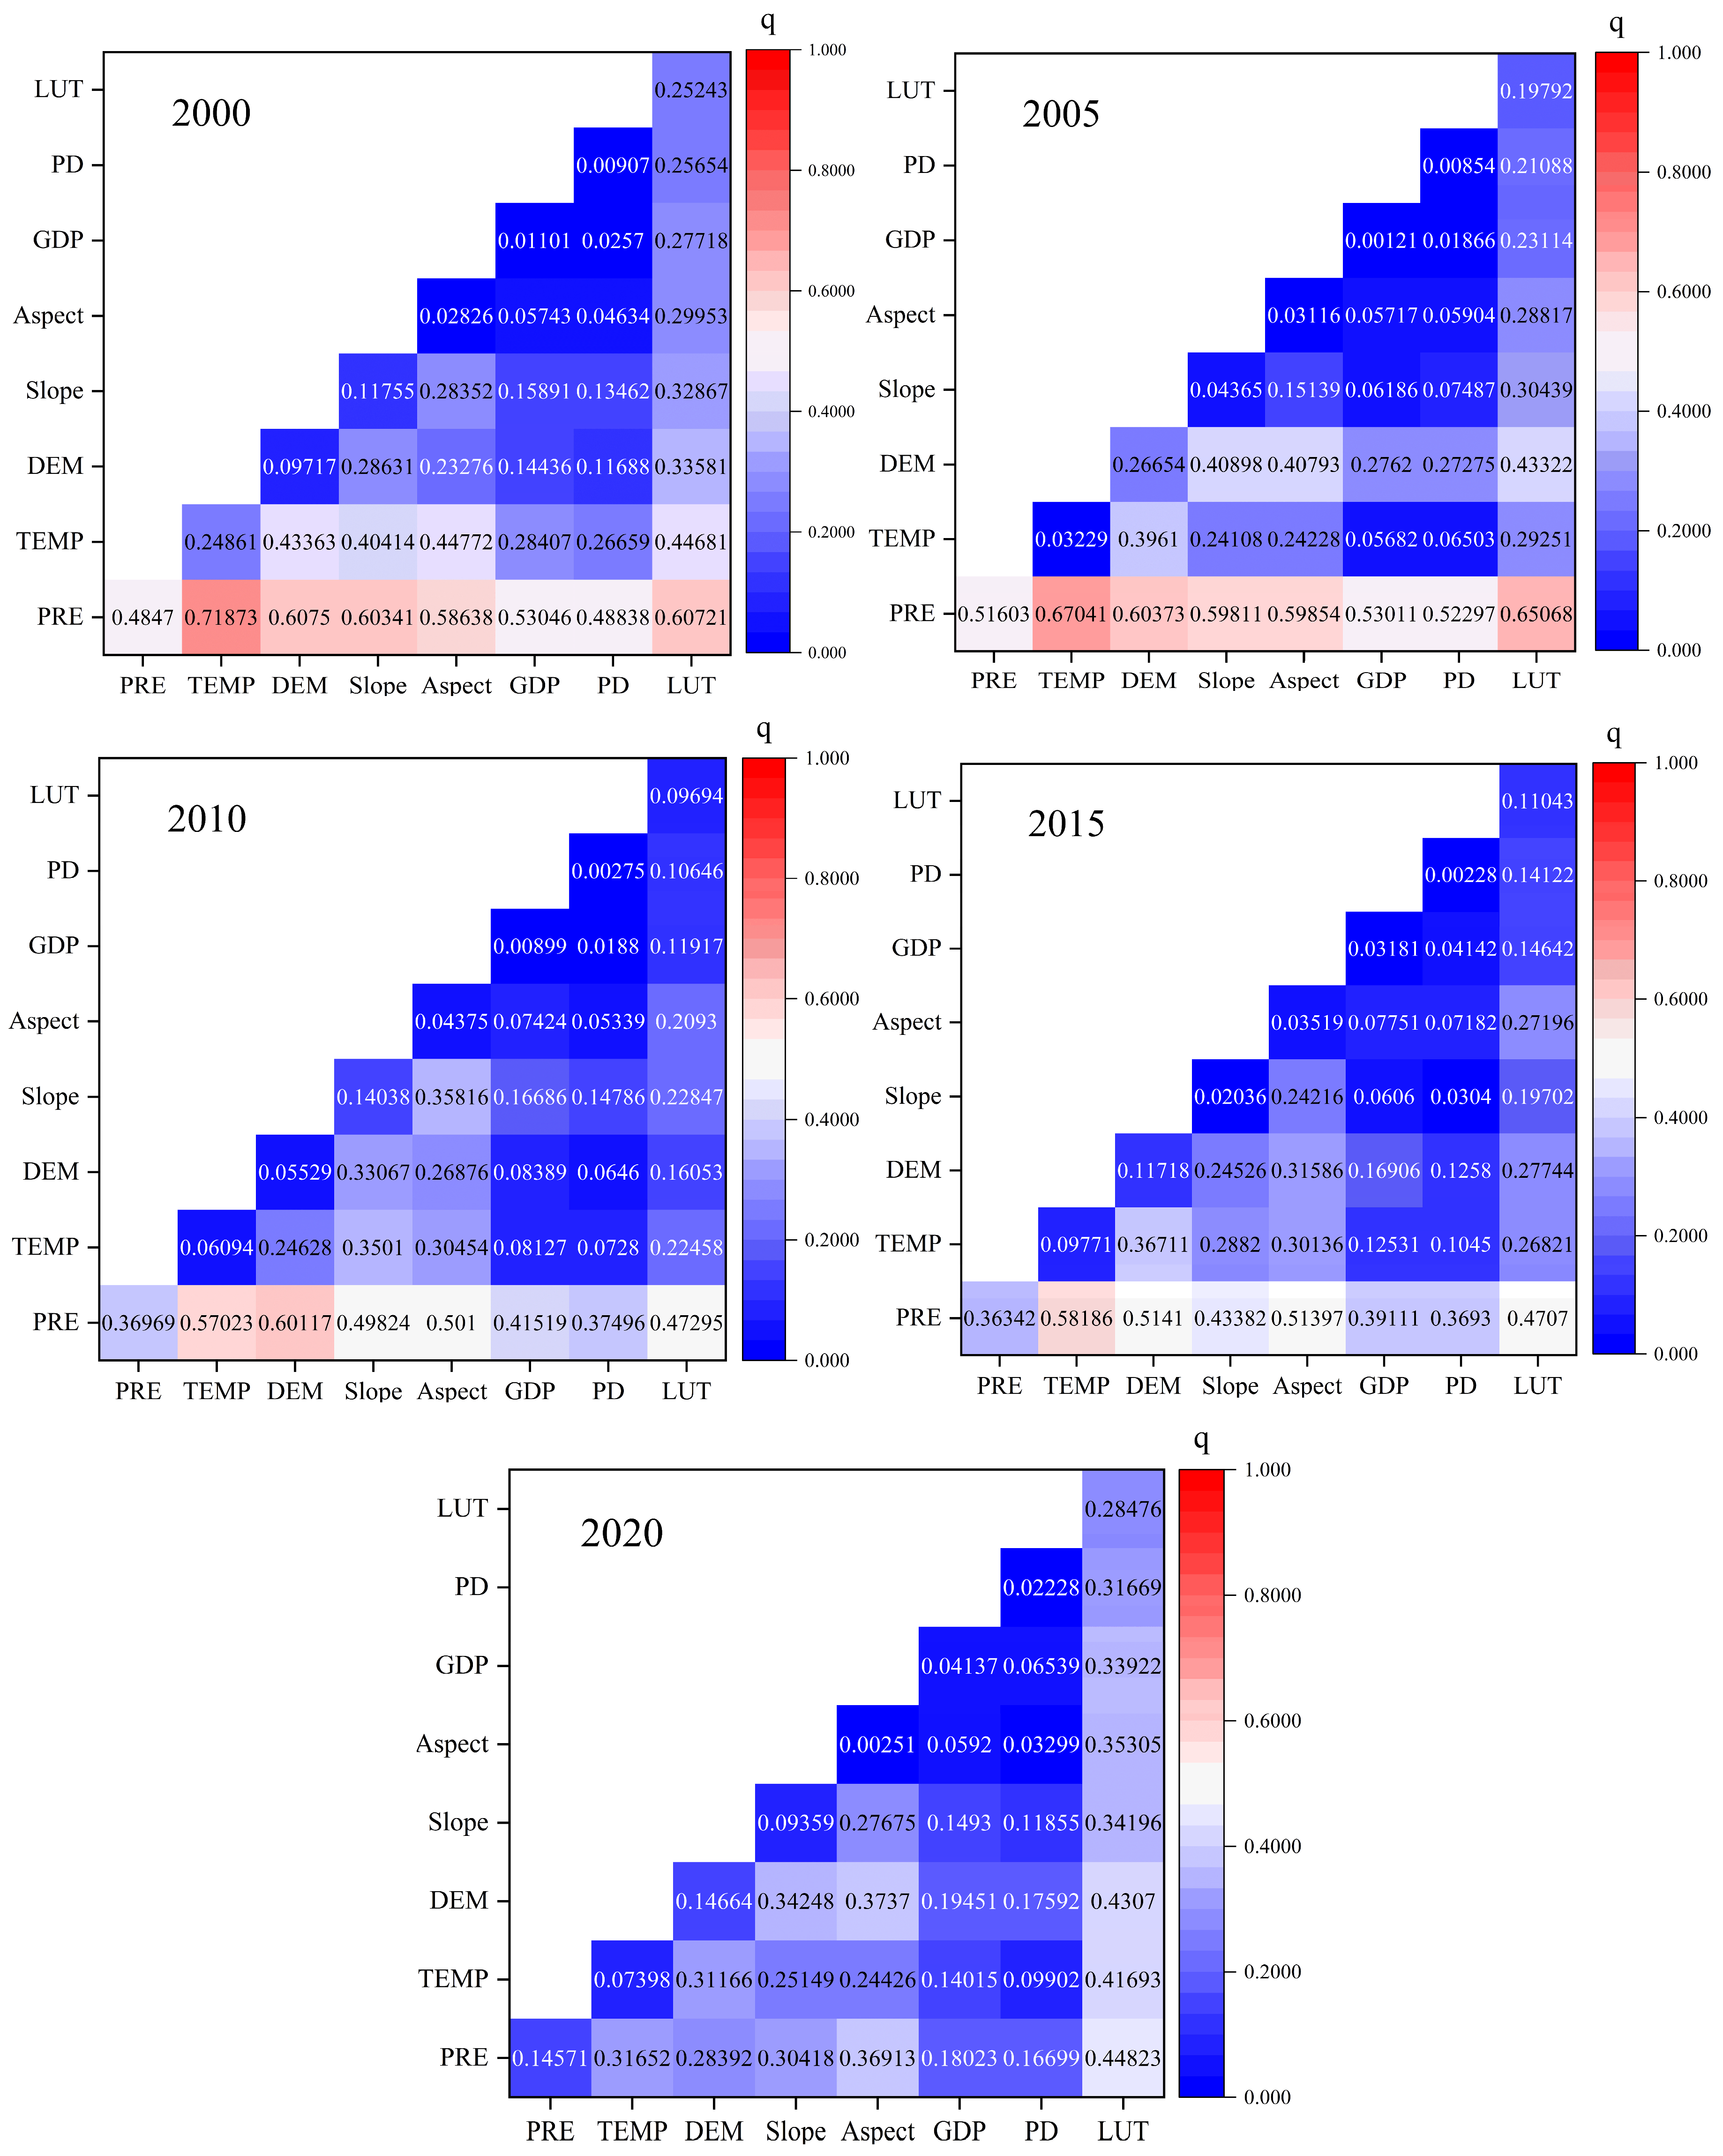
The interaction detection results (Figure 9) indicate that there is generally a two-factor enhancement effect among the driving factors, and the q values of the interaction are higher compared with those of the single factor, suggesting that the EEQ is driven by multiple factors. Specifically, the strongest interaction in 2000 was between PRE and TEMP (q = 0.71873). In 2005, the interaction between PRE and TEMP was also the most prominent (q = 0.67041), followed by that between PRE and LUT (q = 0.65068). In 2010, the interaction between PRE and DEM ranked first (q = 0.60117). In 2015, the q values of interactive combinations involving PRE and TEMP exceeded 0.58. In 2020, the interaction between PRE and LUT reached its peak (q = 0.44823), which was significantly higher than that of other combinations. Overall, PRE, TEMP, and LUT are the main factors affecting the spatial distribution of regional EQAI.

4. Discussion

4.1. Evolution of EQAI in the APENC

Over the past two decades, the EQAI value in the APENC has shown an overall upward trend, with the most significant improvement observed during the period from 2000 to 2005 and reached its maximum in 2020 (Figure 3). The results of the significance tests indicate that during this period, the number of improved areas significantly exceeded that of degraded areas, with only a small portion showing degradation. Over the period 2000–2020, EQAI displayed an upward trend from northwest to southeast. This spatial pattern is primarily attributed to limited precipitation and lower temperatures in the northwestern APENC, which restrict vegetation growth—a condition further constrained by the prevalence of barren, low-productivity unused land with inherently poor ecological capacity. During the same period, approximately 97.25% of the APENC exhibited an increase in EQAI values, with 33.50% of the area experiencing statistically significant or slightly significant improvements. These improvements were mainly observed in areas with high vegetation coverage, reflecting the positive impact of ecological restoration initiatives implemented since the early 2000s. Notably, ecological projects such as the “Grain for Green” Program (returning farmland to forest and grassland), including large-scale afforestation, grassland restoration, and the rehabilitation of degraded farmland through land reclamation, have significantly enhanced vegetation coverage and ecosystem stability. These measures have effectively increased forest and grassland area, improved soil retention, and enhanced regional carbon sequestration capacity. Despite the overall improving trend in ecological quality, localized degradation remains evident, particularly in certain areas such as the west and northeast of the APENC. For example, the proportion of areas showed retrogressive EEQ reaching 16.58% during 2005–2010, which were predominantly concentrated in the northeastern APENC. This phenomenon is mainly attributed to intensive human activities such as mining, overgrazing, or urban expansion, which offset restoration gains in vulnerable regions, and also could be attributed to lagging implementation of conservation policies, or land use pressures.
Overall, due to the improvement in water and soil conditions and the progressive development of ecological projects, the ecological quality sustainability of the APENC remains relatively high. In its central and southeastern regions, future improvements in EEQ are clear (Figure 7), mainly driven by the development of cultivated land. This indicates that the evolution of land use patterns, along with ecological interventions such as vegetation restoration and improved water management, is essential for preserving ecosystem stability. However, the improvement in EEQ in the southwestern region of the APENC is still expected to face considerable challenges in the future, since almost the entire region consists largely of desert. Despite the implementation of water resource management and ecological restoration measures in China, considerable obstacles remain in averting further ecological degradation. While the EEQ assessment provides a systematic classification of environmental conditions across the region, it is equally important to emphasize that each landscape, regardless of its categorical rating from excellent to poor, possesses its own intrinsic ecological value and contributes uniquely to regional ecosystem functioning.

4.2. Driving Factors of the EEQ in the APENC

Generally, the evolution of regional ecosystems reflects the interaction of climate change and human activities, notably in arid and semi-arid regions [47,48]. This study found that climate change mainly regulates vegetation growth and ecosystem productivity by altering factors including PRE and TEMP, thereby affecting the EEQ. Precipitation, as a climatic factor that directly affects EEQ, has a mostly positive correlation coefficient with the EQAI (Figure 8) almost throughout the entire APENC. These results are largely in agreement with those reported by Liu et al. (2018) and Liu et al. (2019), who reported that precipitation is positively correlated with vegetation in the APENC [49,50]. The reason for this is that increased precipitation meets the water requirements of vegetation, thereby promoting the improvement of EEQ. Sloat et al. (2018) demonstrated that variations in water resources affect vegetation development in the global agro-pastoral ecotone, which in turn induces ecological changes [51,52]. Sufficient soil water is conducive to the growth of vegetation, thereby improving the EEQ. Once vegetation is short of water, its productivity is severely inhibited [53]. Thus, it can be seen that precipitation and soil moisture have notable effects on vegetation, corroborating the findings of Zhou et al. (2017) [54]. The regions where EQAI has a strong correlation with temperature are primarily those with developed agriculture. This might be because crops are more sensitive to temperature than other ecological indices [55].
The dynamic changes in EEQ are also largely driven by human activities, including grazing, afforestation, land use conversion driven by policies, and ecological restoration [48,56]. LUCC transformation and ecological restoration projects are regarded as significant human activities influencing vegetation evolution and act as key indicators of the intensity of human interference [57,58]. The impact of LUCC on the EEQ has gradually increased, caused by the ongoing ecological restoration efforts in recent years and reasonable land use planning and management measures, both of which have been effective in improving the EEQ. Cao et al. (2015) compared the LUCC in the APENC and showed that EEQ was influenced by increases in forest and grassland coverage [59]. China’s ecological restoration projects, including the Three-North Shelter Forest Program and the National Key Project for Soil and Water Conservation, have significantly impacted the EEQ in many ecological project implementation areas [60]. The areas with positive correlations between EEQ and human activities are mainly distributed in typical ecological restoration zones. For instance, human activities adversely affected vegetation GPP in the Mu Us Sandy Land within the APENC before 1990. Since 2000, the Mu Us Sandy Land has successively implemented various ecological projects, mainly including the Second Phase of the Three-North Shelter Forest Project and the Project of Returning Farmland to Forest and Grassland. By 2010, under the influence of human activities, the vegetation GPP in the Mu Us Sandy Land changed from a negative to positive effect, and the vegetation showed significant recovery, proving that human activities contributed significantly to the improvement of EEQ [61]. Of course, human activities can also adversely affect EEQ dynamics. For example, across most regions of Inner Mongolia and Qinghai Province within the APENC, the main land cover is grassland. Excessive grazing adversely affects vegetation growth [62]. Additionally, the dynamics of LUCC have a significant influence on EEQ.
In conclusion, the EEQ of the APENC results from the synergistic effects of climate variability and human interventions. Overall, natural factors play a dominant role, while human activities can simultaneously promote and degrade regional EEQ. By implementing intervention measures and grassland policies, the problem of overgrazing in the APENC was successfully alleviated, which was conducive to the improvement of EEQ. Government-implemented ecological protection measures, such as natural forest conservation and the conversion of farmland back to forests and grasslands, also exerted a beneficial effect on vegetation. Unreasonable afforestation plans that do not conform to local environmental conditions may lead to an exacerbation of environmental degradation [63,64,65]. Promoting the positive contributions of human activities to ecosystems requires adopting adaptive management measures that address climate change and mitigate anthropogenic impacts. For example, designing vegetation rehabilitation plans adapted to regional climate conditions [66], highlighting the importance of efficient water use in arid and semi-arid areas, considering the characteristics of each factor and their synergy, and avoiding excessive human intervention to prevent increased pressure on the ecosystem [24] are essential measures. It can be seen that a comprehensive understanding of the basic driving factors of EEQ can provide valuable guidance for regulating ecological environment management and preventing ecological degradation.

4.3. Limitations and Future Prospects

There are still a number of limitations that future research needs to address. Firstly, the study area continues to present uncertainties due to its complex natural environment, which may provide opportunities for advancing future research. Secondly, this study did not conduct a comparative analysis of the EQAI and RSEI models. Thirdly, the EQAI established in this study gives an objective overview of EEQ variations, yet it is influenced by more than just the three indicators of ecology, meteorology, and hydrology. A more comprehensive ecological assessment system should be developed, integrating further ecological assessment data, including survey data on land, vegetation, and hydrology, and combining regional restrictive factors. Moreover, quantitative evaluation of the mechanisms by which natural and artificial factors affect EEQ is lacking. Future work will focus on developing models to investigate the mechanisms driving EEQ evolution under these factors, offering more comprehensive data to support the protection and sustainable development of the APENC.

5. Conclusions

Based on multi-source RS data, and combining principal component analysis and geographic detectors, an EQAI of the APENC was constructed to systematically analyze its spatiotemporal characteristics and driving factors from 2000 to 2020. The main conclusions are as follows: EEQ exhibited an overall improving trend, though with an uneven spatial distribution. Regions exhibiting poor EEQ are primarily distributed in northern Gansu, northern Ningxia, northern Shaanxi, and western Inner Mongolia. In contrast, regions exhibiting good and excellent EEQ are mainly distributed in Qinghai, southern Shaanxi, southeastern Shanxi, and northern Inner Mongolia. The most significant improvement in EEQ occurred between 2000 and 2005, followed by a gradual stabilization from 2010 to 2020. Moreover, 84.37% of the region is projected to maintain a consistent improving trend in EEQ in the future. PRE is identified as the core factor affecting EEQ. The impact of LUCC on EEQ has increased over time, while the impact of socioeconomic factors (such as GDP and population density) remains relatively limited. This developed EQAI attaches great importance to soil water, a major limiting factor in arid and semi-arid regions and promotes the accurate assessment of EEQ in the APENC region.

Author Contributions

Writing—original draft, S.Y.; writing—review and editing, M.Z. (Ming Zhao); visualization, M.Z. (Maolin Zhao) and Q.Z.; formal analysis, S.Y. and M.Z. (Ming Zhao); resources, M.Z. (Ming Zhao); investigation, M.Z. (Maolin Zhao), Q.Z. and X.L.; data curation, Q.Z. and X.L. All authors have read and agreed to the published version of the manuscript.

Funding

National Natural Science Foundation of China (42407087); the Fundamental Research Funds for the Central Universities, CHD (300102355204); China Postdoctoral Science Foundation (2022M720535); Shaanxi Key Research and Development Program (2024SFYBXM-554).

Data Availability Statement

The data presented in this study are available on request from the corresponding author.

Acknowledgments

Thank the editors and reviewers for their helpful and insightful comments, which have significantly improved this work.

Conflicts of Interest

The authors declare no conflict of interest.

References

  1. Liu, M.; Jia, Y.; Zhao, J.; Shen, Y.; Pei, H.; Zhang, H.; Li, Y. Revegetation projects significantly improved ecosystem service values in the agro-pastoral ecotone of northern China in recent 20 years. Sci. Total Environ. 2021, 788, 147756–147769. [Google Scholar] [CrossRef]
  2. Ma, L.; Yu, G.; Chen, Z.; Yang, M.; Hao, T.; Zhu, X.; Zhang, W.; Lin, Q.; Liu, Z.; Han, L.; et al. Cascade effects of climate and vegetation influencing the spatial variation of evapotranspiration in China. Agric. For. Meteorol. 2024, 344, 109826. [Google Scholar] [CrossRef]
  3. Qin, G.; Wang, N.; Wu, Y.; Zhang, Z.; Meng, Z.; Zhang, Y. Spatiotemporal variations in eco-environmental quality and responses to drought and human activities in the middle reaches of the Yellow River basin, China from 1990 to 2022. Ecol. Inform. 2024, 81, 102641. [Google Scholar] [CrossRef]
  4. Chen, W.; Li, A.; Hu, Y.; Li, L.; Zhao, H.; Han, X.; Yang, B. Exploring the long-term vegetation dynamics of different ecological zones in the farming-pastoral ecotone in northern China. Environ. Sci. Pollut. Res. 2021, 28, 27914–27932. [Google Scholar] [CrossRef]
  5. Zhao, F.; Wu, Y.; Yin, X.; Alexandrov, G.; Qiu, L. Toward sustainable revegetation in the Loess Plateau using coupled water and carbon management. Engineering 2022, 15, 143–153. [Google Scholar] [CrossRef]
  6. Fu, F.; Wang, S.; Wu, X.; Wei, F.; Chen, P.; Grünzweig, J. Locating hydrologically unsustainable areas for supporting ecological restoration in China’s drylands. Earth’s Future 2024, 12, e2023EF004216. [Google Scholar] [CrossRef]
  7. Jia, Q.; Jiao, L.; Lian, X.; Wang, W. Linking supply-demand balance of ecosystem services to identify ecological security patterns in urban agglomerations. Sustain. Cities Soc. 2023, 92, 104497. [Google Scholar] [CrossRef]
  8. Mumtaz, F.; Li, J.; Liu, Q.; Dong, Y.; Liu, C.; Gu, C.; Zhang, H.; Zhao, J.; Akhtar, M.; Bashir, B.; et al. A comprehensive framework for evaluating ecosystem quality changes and human activity contributions in Inner Mongolia and Xinjiang, China. Land Use Policy 2025, 151, 107494. [Google Scholar] [CrossRef]
  9. Crabtree, B.; Bayfield, N. Developing sustainability indicators for mountain ecosystems: A study of the Cairngorms, Scotland. J. Environ. Manag. 1998, 52, 1–14. [Google Scholar] [CrossRef]
  10. Fano, E.; Mistri, M.; Rossi, R. The ecofunctional quality index (EQI): A new tool for assessing lagoonal ecosystem impairment. Estuar. Coast. Shelf Sci. 2003, 56, 709–716. [Google Scholar] [CrossRef]
  11. Zheng, L.; Wu, M.; Zhou, M.; Zhao, L. Spatiotemporal distribution and influencing factors of Ulva prolifera and Sargassum and their coexistence in the South Yellow Sea, China. J. Oceanol. Limnol. 2022, 40, 1070–1084. [Google Scholar] [CrossRef]
  12. Zhu, Z.; Piao, S.; Myneni, R.; Huang, M.; Zeng, Z.; Canadell, J.; Ciais, P.; Sitch, S.; Friedlingstein, P.; Arneth, A.; et al. Greening of the earth and its drivers. Nat. Clim. Chang. 2016, 6, 791–795. [Google Scholar] [CrossRef]
  13. Shan, W.; Jin, X.; Ren, J.; Wang, Y.; Xu, Z.; Fan, Y.; Gu, Z.; Hong, C.; Lin, J.; Zhou, Y. Ecological environment quality assessment based on remote sensing data for land consolidation. J. Clean. Prod. 2019, 239, 118126. [Google Scholar] [CrossRef]
  14. Qian, S.; Yan, H.; Wu, M.; Cao, Y.; Xu, L.; Cheng, L. Dynamic monitoring and evaluation model for spatio-temporal change of comprehensive ecological quality of vegetation. Acta Ecol. Sin. 2020, 40, 6573–6583. [Google Scholar]
  15. Caccamo, G.; Chisholm, L.; Bradstock, R.; Puotinen, M. Assessing the sensitivity of MODIS to monitor drought in high biomass ecosystems. Remote Sens. Environ. 2011, 115, 2626–2639. [Google Scholar] [CrossRef]
  16. Diego, P.; Polyanna da, C.; Dayana, A.; Maryam, I.; Heiko, B.; Luiz, E. Environmental vulnerability index: An evaluation of the water and the vegetation quality in a Brazilian Savanna and Seasonal Forest biome. Ecol. Indic. 2020, 112, 106163. [Google Scholar] [CrossRef]
  17. Pan, J.; Dong, L. Comprehensive Evaluation of Ecosystem Quality in Shule River Basin from 2001 to 2010. Chin. J. Appl. Ecol. 2016, 27, 2907–2915. [Google Scholar]
  18. Li, H.; Yang, J.; Ye, B.; Jiang, D. Pollution characteristics and ecological risk assessment of 11 unheeded metals in sediments of the Chinese Xiangjiang River. Environ. Geochem. Health 2019, 41, 1459–1472. [Google Scholar] [CrossRef] [PubMed]
  19. Yue, A.; Zhang, Z. Analysis and research on ecological situation change based on EI value. J. Green Sci. Technol. 2018, 14, 184. [Google Scholar]
  20. Guo, Y.; Zhao, S.; Zhao, X.; Wang, H.; Shi, W. Evaluation of the Spatiotemporal Change of Ecological Quality under the Context of Urban Expansion—A Case Study of Typical Urban Agglomerations in China. Remote Sens. 2023, 16, 45. [Google Scholar] [CrossRef]
  21. Xu, H.; Wang, Y.; Guan, H.; Shi, T.; Hu, X. Detecting Ecological Changes with a Remote Sensing Based Ecological Index (RSEI) Produced Time Series and Change Vector Analysis. Remote Sens. 2019, 11, 2345. [Google Scholar] [CrossRef]
  22. Zhang, J.; Yang, G.; Yang, L.; Li, Z.; Gao, M.; Yu, C.; Gong, E.; Long, H.; Hu, H. Dynamic Monitoring of Environmental Quality in the Loess Plateau from 2000 to 2020 Using the Google Earth Engine Platform and the Remote Sensing Ecological Index. Remote Sens. 2022, 14, 5094. [Google Scholar] [CrossRef]
  23. Geng, J.; Yu, K.; Xie, Z.; Zhao, G.; Ai, J.; Yang, L.; Yang, H.; Liu, J. Analysis of Spatiotemporal Variation and Drivers of Ecological Quality in Fuzhou Based on RSEI. Remote Sens. 2022, 14, 4900. [Google Scholar] [CrossRef]
  24. Kang, S.; Jia, X.; Zhao, Y.; Han, L.; Ma, C.; Bai, Y. Spatiotemporal Variation and Driving Factors of Ecological Environment Quality on the Loess Plateau in China from 2000 to 2020. Remote Sens. 2024, 16, 4778. [Google Scholar] [CrossRef]
  25. Cheng, Y.; Liu, L.; Cheng, L.; Fa, K.; Liu, X.; Hou, Z.; Huang, G. A shift in the dominant role of atmospheric vapor pressure deficit and soil moisture on vegetation greening in China. J. Hydrol. 2022, 615, 128680. [Google Scholar] [CrossRef]
  26. Zhang, G.; Chen, X.; Zhou, Y.; Jiang, L.; Jin, Y.; Wei, Y.; Li, Y.; Pan, Z.; An, P. Aridification in a farming-pastoral ecotone of northern China from 2 perspectives: Climate and soil. J. Environ. Manag. 2022, 302, 114070. [Google Scholar] [CrossRef]
  27. O’Mara, N.; Skonieczny, C.; McGee, D.; Winckler, G.; Bory, A.; Bradtmiller, L.; Malaizé, B.; Polissar, P. Pleistocene drivers of Northwest African hydroclimate and vegetation. Nat. Commun. 2022, 13, 3552. [Google Scholar] [CrossRef] [PubMed]
  28. Ji, J.; Zhao, T.; Wu, Z.; Zhang, F.; Yan, J.; Lu, N. Promoting ecological sustainability in the arid farming-pastoral ecotone through optimal water allocation. J. Hydrol. 2025, 652, 132609. [Google Scholar] [CrossRef]
  29. Pei, H.; Liu, M.; Jia, Y.; Zhang, H.; Li, Y.; Xiao, Y. The trend of vegetation greening and its drivers in the Agro-pastoral ecotone of northern China, 2000–2020. Ecol. Indic. 2021, 129, 108004. [Google Scholar] [CrossRef]
  30. Li, X.; Xu, X.; Tian, W.; Tian, J.; He, C. Contribution of climate change and vegetation restoration to interannual variability of evapotranspiration in the agropastoral ecotone in northern China. Ecol. Indic. 2023, 154, 110485. [Google Scholar] [CrossRef]
  31. Gabhane, V.; Ramteke, P.; Chary, G.; Patode, R.; Ganvir, M.; Chorey, A.; Tupe, A. Effects of long-term nutrient management in semi-arid Vertisols on soil quality and crop productivity in a cotton-greengram intercropping system. Field Crops Res. 2023, 303, 109115. [Google Scholar] [CrossRef]
  32. Li, X.; Xu, X.; Sonnenborg, O.; Andreasen, M.; He, C. Effect of ecological restoration on evapotranspiration and water yield in the agro-pastoral ecotone in northern China during 2000–2018. J. Hydrol. 2024, 638, 131531. [Google Scholar] [CrossRef]
  33. Liu, Q.; Zhao, S.; Li, Y. The hidden costs of land use transformation: Ecological degradation in arid and semi-arid areas. J. Arid. Environ. 2025, 230, 105433. [Google Scholar] [CrossRef]
  34. Zhang, X.; Xie, H.; Shi, J.; Lv, T.; Zhou, C.; Liu, W. Assessing Changes in Ecosystem Service Values in Response to Land Cover Dynamics in Jiangxi Province, China. Int. J. Environ. Res. Public Health 2020, 17, 3018. [Google Scholar] [CrossRef]
  35. Zhang, X.; Shi, P. Theory and practice of marginal ecosystem management-establishment of optimized ecoproductive paradigm of grassland and farming-pastoral zone of North China. Acta Bot. Sin. 2003, 45, 1135–1138. [Google Scholar]
  36. Liu, Y.; Wang, J.; Ding, J.; Zhang, Z.; Liu, Z.; Zhang, Z.; Zhang, J.; Shi, L. Dynamic Monitoring of Ecological Environmental Quality in Arid and Semi-Arid Regions: Disparities Among Central Asian Countries and Analysis of Key Driving Factors. Remote Sens. 2025, 17, 1825. [Google Scholar] [CrossRef]
  37. Zheng, C.; Gu, L.; Zhao, T. Global Surface Soil Moisture Data Set 1 km Resolution (2000–2020); National Data Center of Tibet Plateau: Beijing, China, 2022. [Google Scholar]
  38. Yang, J.; Huang, X. The 30 m annual land cover dataset and its dynamics in China from 1990 to 2019. Earth Syst. Sci. Data 2021, 13, 3907–3925. [Google Scholar] [CrossRef]
  39. Zhang, J.; Zhang, P.; Deng, X.; Ren, C.; Deng, M.; Wang, S.; Lai, X.; Long, A. Study on the Spatial and Temporal Trends of Ecological Environment Quality and Influencing Factors in Xinjiang Oasis. Remote Sens. 2024, 16, 1980. [Google Scholar] [CrossRef]
  40. Tang, X.; Li, H.; Huang, N.; Li, X.; Xu, X.; Ding, Z.; Xie, J. A comprehensive assessment of MODIS-derived GPP for forest ecosystems using the site-level FLUXNET database. Environ. Earth Sci. 2015, 74, 5907–5918. [Google Scholar] [CrossRef]
  41. Sun, R.; Chen, S.; Su, H. Climate dynamics of the spatiotemporal changes of vegetation NDVI in northern China from 1982 to 2015. Remote Sens. 2021, 13, 187. [Google Scholar] [CrossRef]
  42. Cohen, I. Pearson correlation coefficient. In Noise Reduction in Speech Processing; Springer: Berlin/Heidelberg, Germany, 2009; pp. 1–4. [Google Scholar]
  43. Zhang, S.; Zhou, Y.; Yu, Y.; Li, F.; Zhang, R.; Li, W. Using the geodetector method to characterize the spatiotemporal dynamics of vegetation and its interaction with environmental factors in the qinba mountains, China. Remote Sens. 2022, 14, 5794. [Google Scholar] [CrossRef]
  44. Wang, H.; Qin, F.; Xu, C.; Li, B.; Guo, L.; Wang, Z. Evaluating the suitability of urban development land with a Geodetector. Ecol. Indic. 2021, 123, 107339. [Google Scholar] [CrossRef]
  45. Wang, J.; Xu, C. Geographic Detector: Principles and Prospects. Acta Geogr. Sin. 2017, 72, 116–134. (In Chinese) [Google Scholar]
  46. Ren, H.; Ye, Z.; Li, Z. Anomaly detection based on a dynamic Markov model. Inf. Sci. 2017, 411, 52–65. [Google Scholar] [CrossRef]
  47. Horion, S.; Cornet, Y.; Erpicum, M.; Tychon, B. Studying interactions between climate variability and vegetation dynamic using a phenology based approach. Int. J. Appl. Earth Obs. Geoinf. 2013, 20, 20–32. [Google Scholar] [CrossRef]
  48. He, C.; Tian, J.; Gao, B.; Zhao, Y. Differentiating climate and human-induced drivers of grassland degradation in the Liao River Basin, China. Environ. Monit. Assess. 2015, 187, 4199. [Google Scholar] [CrossRef] [PubMed]
  49. Liu, Z.; Liu, Y.; Li, Y. Anthropogenic contributions dominate trends of vegetation cover change over the farming-pastoral ecotone of northern China. Ecol. Indic. 2018, 95, 370–378. [Google Scholar] [CrossRef]
  50. Liu, Q.; Wang, X.; Zhang, Y.; Zhang, H.; Li, L. Vegetation Degradation and Its Driving Factors in the Farming–Pastoral Ecotone over the Countries along Belt and Road Initiative. Sustainability 2019, 11, 1590. [Google Scholar] [CrossRef]
  51. Sloat, L.; Gerber, S.; Samberg, H.; Smith, K.; Herrero, M.; Ferreira, L.; Godde, M.; West, C. Increasing importance of precipitation variability on global livestock grazing lands. Nat. Clim. Change 2018, 8, 214–218. [Google Scholar] [CrossRef]
  52. Chen, Y.; Mu, S.; Sun, Z.; Gang, C.; Li, J.; Padarian, J.; Groisman, P.; Chen, J.; Li, S. Grassland carbon sequestration ability in China: A new perspective from terrestrial aridity zones. Rangel. Ecol. Manag. 2016, 69, 84–94. [Google Scholar] [CrossRef]
  53. Mowll, W.; Blumenthal, D.; Cherwin, K.; Smith, A.; Symstad, A.; Vermeire, L.; Collins, S.; Smith, M.; Knapp, A. Climatic controls of aboveground net primary production in semi-arid grasslands along a latitudinal gradient portend low sensitivity to warming. Oecologia 2015, 177, 959–969. [Google Scholar] [CrossRef]
  54. Zhou, W.; Yang, H.; Huang, L.; Chen, C.; Lin, X.; Hu, Z.; Li, J. Grassland degradation remote sensing monitoring and driving factors quantitative assessment in China from 1982 to 2010. Ecol. Indic. 2017, 83, 303–313. [Google Scholar] [CrossRef]
  55. Rezaei, E.; Webber, H.; Asseng, S.; Boote, K.; Durand, J.; Ewert, F.; Martre, P.; MacCarthy, D. Climate change impacts on crop yields. Nat. Rev. Earth Environ. 2023, 4, 831–846. [Google Scholar] [CrossRef]
  56. Cai, H.; Yang, X.; Xu, X. Human-induced grassland degradation/restoration in the central Tibetan Plateau: The effects of ecological protection and restoration projects. Ecol. Eng. 2015, 83, 112–119. [Google Scholar] [CrossRef]
  57. Zhu, L.; Sun, S.; Li, Y.; Liu, X.; Hu, K. Effects of climate change and anthropogenic activity on the vegetation greening in the Liaohe River Basin of northeastern China. Ecol. Indic. 2023, 148, 110105. [Google Scholar] [CrossRef]
  58. Xue, L.; Kappas, M.; Wyss, D.; Wang, C.; Putzenlechner, B.; Thi, N.; Chen, J. Assessment of Climate Change and Human Activities on Vegetation Development in Northeast China. Sensors 2022, 22, 2509. [Google Scholar] [CrossRef]
  59. Cao, Q.; Yu, D.; Georgescu, M.; Han, Z.; Wu, J. Impacts of land use and land cover change on regional climate: A case study in the agro-pastoral transitional zone of China. Environ. Res. Lett. 2015, 10, 124025. [Google Scholar] [CrossRef]
  60. Qi, Y.; Chang, Q.; Jia, K.; Liu, M.; Liu, J.; Chen, T. Temporal-spatial variability of desertification in an agro-pastoral transitional zone of northern Shaanxi Province, China. Catena 2012, 88, 37–45. [Google Scholar] [CrossRef]
  61. Zhang, X.; Wang, X.; Li, W.; Wu, X.; Cheng, X.; Zhou, Z.; Ling, Q.; Liu, Y.; Liu, X.; Hao, J.; et al. Dynamic Monitoring and Analysis of Ecological Environment Quality in Arid and Semi-Arid Areas Based on a Modified Remote Sensing Ecological Index (MRSEI): A Case Study of the Qilian Mountain National Nature Reserve. Remote Sens. 2024, 16, 3530. [Google Scholar] [CrossRef]
  62. Batunacun Ralf, W.; Tobia, L.; Claas, N. Using Shapley additive explanations to interpret extreme gradient boosting predictions of grassland degradation in Xilingol, China. Geosci. Model Dev. 2021, 14, 1493–1510. [Google Scholar] [CrossRef]
  63. Cao, S.; Chen, L.; Shankman, D.; Wang, C.; Wang, X.; Zhang, H. Excessive reliance on afforestation in China’s arid and semi-arid regions: Lessons in ecological restoration. Earth Sci. Rev. 2010, 104, 240–245. [Google Scholar] [CrossRef]
  64. Feng, X.; Fu, B.; Piao, S.; Wang, S.; Ciais, P.; Zeng, Z.; Lü, Y.; Zeng, Y.; Li, Y.; Jiang, X.; et al. Revegetation in China’s Loess Plateau is approaching sustainable water resource limits. Nat. Clim. Change 2016, 6, 1019. [Google Scholar] [CrossRef]
  65. Liang, H.; Xue, Y.; Li, Z.; Gao, G.; Liu, G. Afforestation may accelerate the depletion of deep soil moisture on the Loess Plateau: Evidence from a meta-analysis. Land Degrad. Dev. 2022, 33, 3829–3840. [Google Scholar] [CrossRef]
  66. Quan, L.; Jin, S.; Chen, J.; Li, T. Evolution and Driving Forces of Ecological Service Value in Anhui Based on Landsat Land Use and Land Cover Change. Remote Sens. 2024, 16, 269. [Google Scholar] [CrossRef]
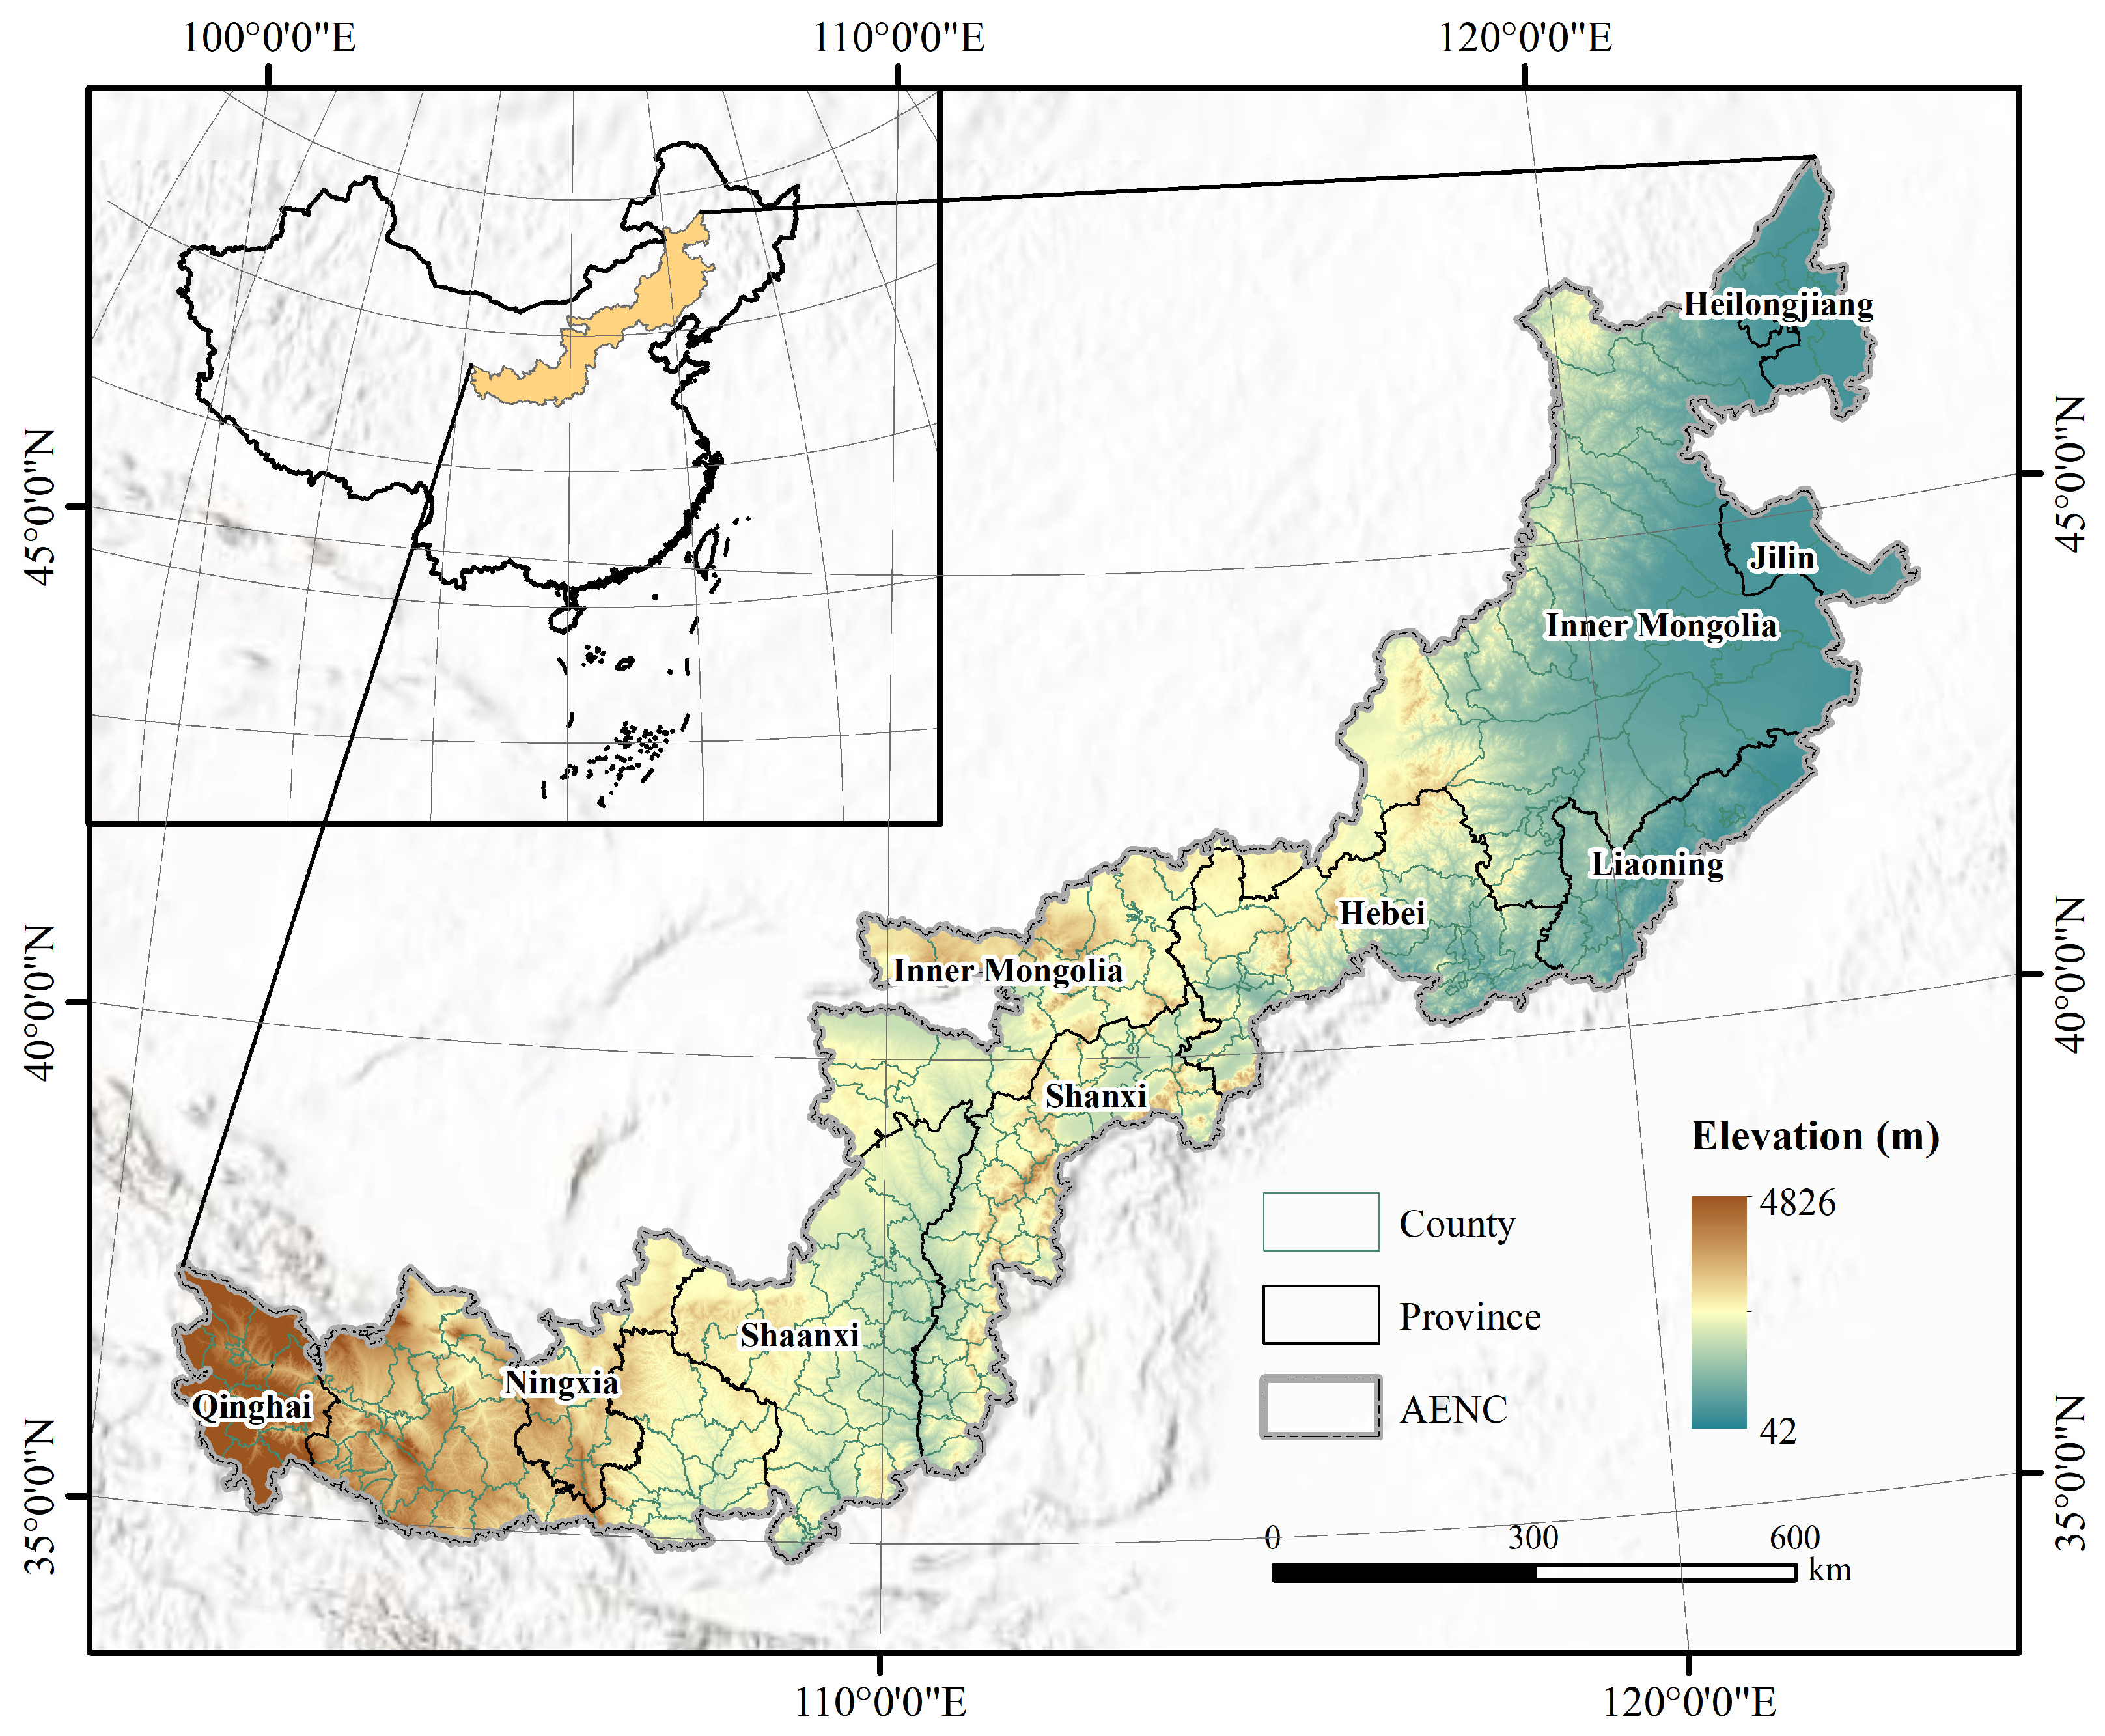
Figure 1. Location of the agro-pastoral ecotone in northern China (APENC).
Land 14 02309 g001
Figure 2. The general framework in this study.
Land 14 02309 g002
Figure 3. The spatiotemporal distribution of EQAI in APENC from 2000 to 2020 and the proportion of ecological grades.
Land 14 02309 g003
Figure 4. The clustering feature and area changes in the EQAI in APENC from 2000 to 2020.
Land 14 02309 g004
Figure 5. Changes in EQAI classification of APENC from 2000 to 2020.
Land 14 02309 g005
Figure 6. Change trend (a) and test of significance (b) of EQAI in APENC from 2000 to 2020.
Land 14 02309 g006
Figure 7. (a) The spatial distribution of the Hurst exponent of the EQAI from 2000 to 2020, and (b) the distribution of future trends in the EQAI.
Land 14 02309 g007
Figure 8. Correlation matrix diagram (The color intensity corresponds to the strength of the correlation: positive correlations are shown in red, and negative correlations are shown in blue. The correlation intensity ranges from −1 to +1, with 0 indicating no correlation. An asterisk (*) denotes statistically significant correlations.).
Land 14 02309 g008
Figure 9. The results of interaction detection.
Land 14 02309 g009
Table 1. Data types and sources.
FactorsDriving TypesData
Type
IndexSpatial
Resolution
Temporal ResolutionTime
Period
Data Sources/
References
Natural Driving FactorsInternal
factor
Vegetation factorsVegetation coverage (FVC)500 m8 daysJune–September in 2000–2020NASA (https://lpdaac.usgs.gov/, accessed on 5 June 2024)
Leaf area index (LAI)
Gross primary productivity (GPP)
Meteorological factorsPrecipitation (PRE)1000 mMonthly2000–2020China National Qinghai– Tibet Plateau Data Center
Air temperature (TEMP)
Land surface temperature (LST)
Hydrological factorsSoil moisture (SM)
Artificial
Driving Factors
External
factor
Geographical factorsDigital elevation model (DEM)90 mYearlyChina National Qinghai–Tibet Plateau Data Center/(Zheng et al., 2022 [37])
Slope and aspect
Land use type (LUT)30 mChina Land Cover Dataset/(Yang et al., 2021 [38])
Social and economic factorsGross domestic product (GDP)1000 mNational Earth System Science Data Center (http://www.Geodata.cn/, accessed on 5 June 2024)
Population density (PD)
Table 2. Driving force magnitude criterion interval and interaction type.
Criterion of IntervalInteraction
q(X1∩X2) < Min[q(X1), q(X2)]Nonlinear weakening
Min[q(X1), q(X2)] < q(X1∩X2) < Max[q(X1), q(X2)]Single-factor nonlinear weakening
q(X1∩X2) > Max[q(X1), q(X2)]Dual-factor enhancement
q(X1∩X2) = q(X1) + q(X2)Independence
q(X1∩X2) > q(X1) + q(X2)Nonlinear enhancement
Table 3. Statistics of EQAI Global Moran’s I and its parameters in APENC from 2000 to 2020.
Year20002005201020152020
Moran’s I0.77170.83670.78530.77600.7557
Variance0.0000370.0000370.0000370.0000370.000037
z-score126.4087137.0467128.6455127.1068123.7980
p value00000
Table 4. The results single-factor detection.
Driving Factor20002005201020152020
q ValueSequenceq ValueSequenceq ValueSequenceq ValueSequenceq ValueSequence
PRE0.408410.618210.394010.393110.35321
TEMP0.179720.099630.064630.106420.09462
DEM0.070240.169120.063440.075530.04765
Slope0.134130.068740.087020.070940.07693
Aspect0.000860.001070.001470.001080.00148
LUT0.021150.024350.032450.036850.05004
GDP0.000080.000180.000380.001270.00287
PD0.000670.001560.008560.017060.00666
Disclaimer/Publisher’s Note: The statements, opinions and data contained in all publications are solely those of the individual author(s) and contributor(s) and not of MDPI and/or the editor(s). MDPI and/or the editor(s) disclaim responsibility for any injury to people or property resulting from any ideas, methods, instructions or products referred to in the content.