Article

Development Path of the People–Land–Food Complex System in Xinjiang from the Dual Perspectives of Adaptability and Obstacle Degree

1
School of Geography and Tourism, Xinjiang Normal University, Urumqi 830054, China
2
Research Centre for Urban Development of Silk Road Economic Belt, Xinjiang Normal University, Urumqi 830054, China
*
Author to whom correspondence should be addressed.
Land 2025, 14(12), 2310; https://doi.org/10.3390/land14122310
Submission received: 14 October 2025 / Revised: 15 November 2025 / Accepted: 20 November 2025 / Published: 24 November 2025

Abstract

In China, food security has long held a critical strategic position. Conducting research on the interconnections between People–Land–Food (P-L-F) is of significant importance for promoting the efficient use of resources and ensuring national food security. In this research, we utilize the entropy weighting technique coupled with an integrated adaptability assessment framework to gauge the composite development and adaptability indices of the P-L-F nexus in Xinjiang over the two-decade period from 2000 to 2020. Furthermore, we apply a barrier analysis model to identify impediments to the harmonious and adaptive progression of this intricate system. Results indicate the following: ① From 2000 to 2020, Xinjiang’s P-L-F system grew at an average annual rate of 1.39%, with people, land, and food subsystems increasing by 0.32%, 1.99%, and 1.9%, respectively. ② Regional adaptability varied significantly—southern Xinjiang improved over time, while the north remained higher overall; dual subsystems showed steady enhancement. ③ The people subsystem’s barrier intensity increasingly outpaced that of the food subsystem, highlighting that the dynamics between people and land emerged as the primary constraints on the harmonious and adaptive evolution of the P-L-F nexus. The study offers insights into P-L-F coordination and sustainable development in arid regions.

1. Introduction

Food resources are the fundamental material basis for human survival, while food security underpins national development and social stability [1]. Internationally, the United Nations has placed significant emphasis on food security through multiple documents and international research programs [2]. The 2030 Agenda for Sustainable Development incorporates “eradicating hunger, ensuring food security and better nutrition, and advancing sustainable agriculture” as a key objective within the United Nations Sustainable Development Goals (SDGs). Cultivated land plays a critical role in determining the extent of food production [3], while the population size influences the level of food demand [4]. At the national level in China, the State Council has introduced several policies, including the “Notice on Preventing Non-Agricultural Use of Arable Land” and the “Opinions on Safeguarding Food Production by Restricting Non-Food Use of Farmland.” These policies emphasize the importance of adhering to the arable land “red line,” prohibiting non-agricultural use of farmland, and curbing the shift in arable land away from food production [5]. Therefore, analyzing the connection between population, arable land, and food production is essential for strengthening food security, protecting arable land, and ensuring social stability, as well as long-term national peace and security.
The People–Land–Food (P-L-F) coupled system—as a comprehensive system established at specific regional scales with land development and utilization as the foundation; food production, circulation, and consumption as the core components; and meeting human food demand as the ultimate goal—has become a crucial focus in contemporary research on resources and the environment [6]. This system emphasizes the driving role of population dynamics on resource demand, the fundamental support of land resources, and the regulatory and feedback mechanisms of the food system [7]. Its level of coordination directly affects the sustainability of food security. Academic research on resource–environment–development coupled systems has been deepening both domestically and internationally, particularly regarding theoretical advances and model innovations in food–energy–water (FEW) nexus studies [8,9]. These provide valuable methodological references for exploring coordination and adaptability among multiple factors within complex systems. Within this framework, some scholars have begun to focus on the spatial heterogeneity and coupling coordination mechanisms of the P-L-F system. For instance, Yang et al. developed spatial coupling models to assess coordination disparities in P-L-F systems across regions [10,11]. Several researchers have developed integrated decision-making models, proposing to enhance system sustainability through strategies such as improving population quality, optimizing land use, and implementing precise public policies [12,13,14]. Liang et al., by analyzing the dynamic relationship among land holdings, population changes, and food demand, delineated the elastic boundaries of arable land protection under the background of food security in China [4]. Other studies have focused on specific coupling relationships within the system. For instance, Mahmood Zahid et al. emphasized that in Pakistan, where agriculture is a key economic sector, the distribution and ownership of land resources are significantly associated with food security. This has prompted calls for redefining landholding thresholds to promote food sufficiency and equitable regional distribution [15]. In a similar vein, Manina found that in Ningbo, the reduction in the quantity and quality of arable land led to a deterioration of food security status from basic security to insecurity. However, driven by factors such as the marine economy and population migration, the food security index rebounded to a critical threshold in 2018, significantly affecting regional food self-sufficiency and socio-economic development [16]. Further studies have examined interactions between population and food systems. Nath Reshmita et al. highlighted that in India and China, rapid population growth, shifts in dietary structures, and economic reforms have led to urbanization and diversified demand, significantly increasing food demand and placing enormous pressure on food security. This underscores the urgent need for sustainable management of agricultural land in both countries [17]. Molotoks Amy et al. pointed out that future global food security will be impacted by both population growth and climate change, with population growth being the dominant factor influencing the prevalence of undernutrition. Thus, mitigating the consequences of population growth—such as improving maternal healthcare, ensuring equitable food access at the national level, narrowing yield gaps, and adjusting trade patterns—is vital to avoid severe future food insecurity [18]. At the population–land interaction level, Feng et al. emphasized that China’s arable land security is characterized by limited per capita land availability, scarce reserves, and spatial imbalance. These challenges also reflect global food security concerns. Therefore, they proposed implementing a “grain storage in land” strategy to comprehensively enhance the productive capacity of land resources, thereby fundamentally addressing the limitations of “grain storage in warehouses [19].”
From a methodological perspective, studies on the adaptability of multi-system coupling primarily derive from various disciplinary paradigms, employing socio-economic statistical modeling, system analysis and simulation, and spatial multi-scale coupling models to depict internal system relationships. Methodologically, current research often adopts tools such as the SBM-Undesirable model [20], System Dynamics (SD) modeling [21], Generalized Method of Moments (GMM) [22], Life Cycle Assessment (LCA) [23], and scenario prediction analysis [24]. These are applied to spatial units ranging from national, provincial, and urban agglomerations to typical cities to conduct an empirical exploration of inter-system coupling. Notably, Li et al. proposed using computational methods to analyze the multi-dimensional evolution of the water–energy–food nexus system. By applying coupling strength and state discrimination models, they identified a risk chain of “resource overexploitation–system vulnerability–coordination imbalance” in the Beijing–Tianjin–Hebei region, stressing the need for synergistic systems and dynamic balance strategies such as “throttling and sourcing” to promote a transition from extensive to intensive resource use [25]. Despite these advances in methodological integration and system coupling research, limitations remain. First, most studies still focus on linear relationships between two systems or three-system interactions, with limited systematic exploration of the joint adaptability of binary and ternary systems within complex systems. Second, many evaluation approaches remain at static or semi-dynamic levels, falling short in revealing the key drivers and barrier mechanisms of spatiotemporal evolution. Therefore, it is imperative to construct a more dynamic, spatially differentiated, and diagnostic evaluation framework to identify key drivers and evolutionary pathways in the adaptability process of complex systems.
Existing studies have largely focused on humid and semi-humid regions with stable hydrological and agricultural conditions [26], while the structural and adaptive mechanisms of the P-L-F system in arid and semi-arid areas remain insufficiently explored. In these regions, resource scarcity, ecological fragility, and intensified human–environment interactions shape unique coupling dynamics [27,28]. Water availability becomes the primary constraint linking land use and food production. The scarcity and spatiotemporal unevenness of water resources have intensified the competitive and interdependent nature of human–land relationships, forming a coupled characteristic where “population is determined by water availability, land use is determined by water availability, and grain production is determined by water availability” [29,30]. Simultaneously, ecological fragility amplifies this effect: processes such as high evapotranspiration, wind erosion, salinization, and oasis fragmentation continuously intensify the system’s marginal dependence on water. When resources are overexploited, this triggers a negative feedback loop of “water consumption—ecological degradation—declining productivity.” Compared to humid regions, arid zones exhibit adaptive patterns characterized by “blue water dominance, green water scarcity, and rigid ecological water demands,” creating a pronounced structural mismatch between urban industrial water conservation and the inflexible requirements of agricultural irrigation. As a key arid frontier, Xinjiang plays a dual strategic role as both a spatial buffer for China’s national food regulation capacity and a critical pillar for national resource security. Although its grain output exceeded 20 million tons in 2023—a historic milestone—ongoing industrialization and urbanization have led to continuous farmland loss, population concentration in urban areas, and the reallocation of capital and technology toward non-agricultural sectors [31]. These transformations have profoundly reshaped the traditional agricultural system, manifested by fragmented arable land patterns, a de-agriculturalized population structure, and increasingly complex food demand [24]. As a result, structural mismatches among population, land, and food subsystems have intensified, heightening the instability and vulnerability of the entire P-L-F system [32]. Within this context, Xinjiang provides a representative case for examining the adaptive mechanisms of the P-L-F system under arid environmental constraints. Its distinctive mountain–oasis–desert ecological pattern and reliance on mountain snowmelt and runoff—shaped by the geomorphological structure of “three mountain ranges and two basins”—create pronounced spatial heterogeneity in water and arable land. This intensifies trade-offs among agricultural expansion, urbanization, and ecological protection. Studying Xinjiang’s P-L-F system thus yields critical insights into the coupling and regulatory mechanisms of human–environment interactions in arid regions and offers valuable guidance for promoting sustainable regional development under resource-limited conditions.
Ensuring resource and food security in Xinjiang has consistently been a critical issue of concern. The interrelationship between people, land, and food requires broadening perspectives to protect agricultural resources, enhance the ecological environment and ensure the long-term viability of food production. In this regard, this paper aims to offer the following incremental contributions: ① Constructing an adaptability evaluation model for the P-L-F complex system in Xinjiang based on adaptability and matching, to comprehensively assess the coordination of the system and address academic concerns related to food security and sustainable development goals. ② Applying the obstacle degree model to diagnose the constraints within the P-L-F system in Xinjiang, providing conclusions and theoretical references for adaptive and coordinated development. Future research will continue to explore external factors influencing P-L-F adaptability, providing practical guidance for solving the contradictions in food security and sustainable development.

2. Theoretical Foundation

2.1. Research Framework

To examine the adaptive and coordinated interactions within the P-L-F system in Xinjiang, this study is conducted in four steps. First, starting from general principles, the interaction mechanisms of the People, Land, and Food systems are revealed, and the interrelationships between the components of the Xinjiang P-L-F system are clarified. Secondly, taking into account Xinjiang’s unique conditions, an evaluation framework for the adaptive and coordinated development of the P-L-F system is developed, focusing on the three key dimensions of the system. The third step involves measuring the comprehensive development index and adaptability of the P-L-F system in Xinjiang from 2000 to 2020 using the entropy weight method and the comprehensive adaptability evaluation model and exploring the constraints of the P-L-F subsystems on the adaptive and coordinated development of Xinjiang’s complex system through the obstacle degree model. Finally, based on the research findings, policy recommendations for the adaptive and coordinated development of Xinjiang’s P-L-F system are proposed. Figure 1 illustrates the overall research framework.

2.2. Elemental Adaptation Relationship Structure of the P-L-F Complex System

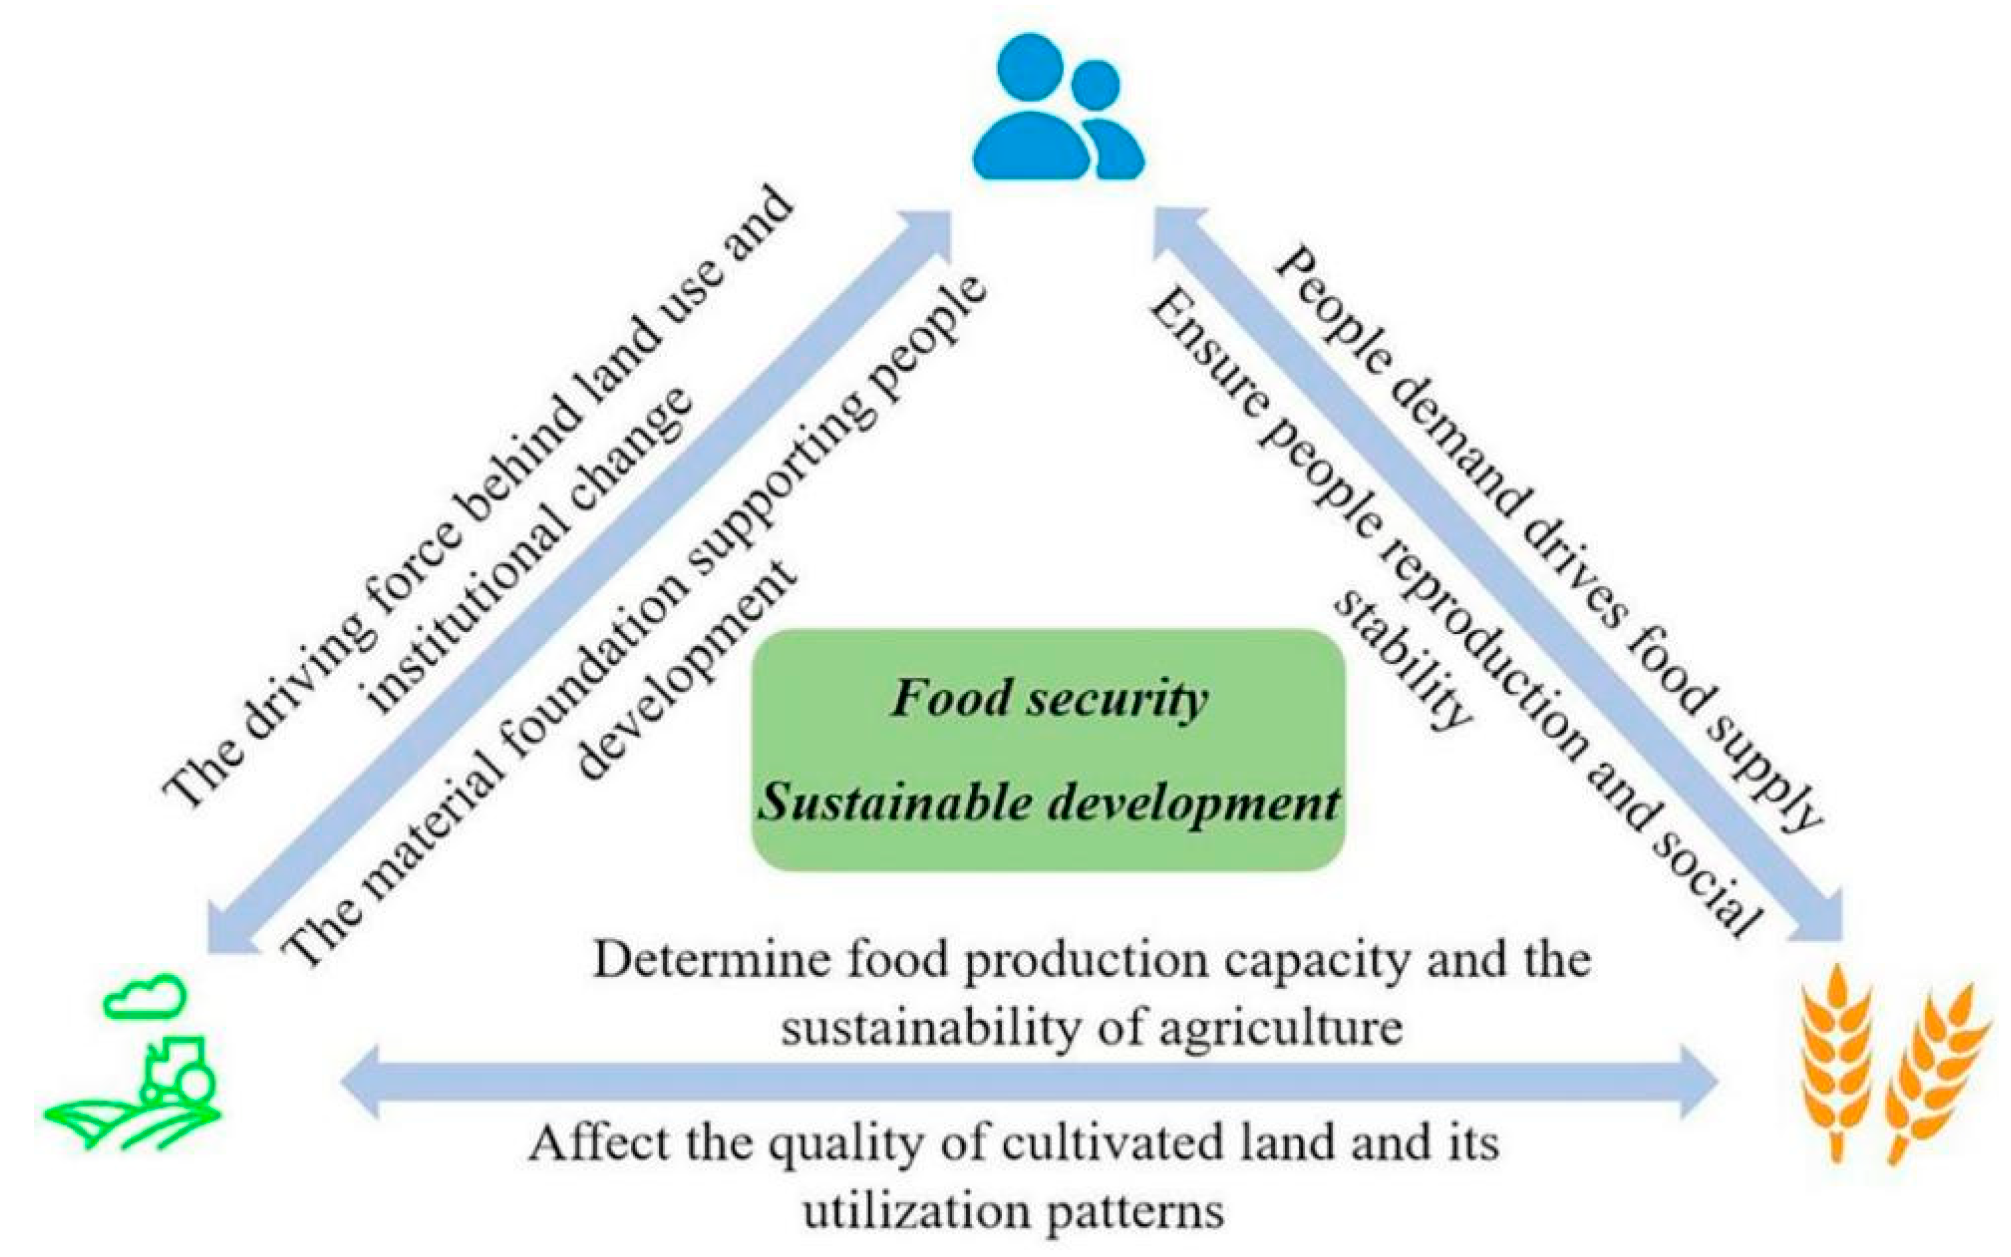
Against the backdrop of increasingly prominent human–land relationship reconstruction and national food security strategies, the P-L-F system has emerged as a core coupled system for regional sustainable development, characterized by a high degree of coupling and dynamic evolution [33]. Within this system, people serve as the dominant factor, endowed with distinct subjectivity and agency. It participates in the development and utilization of land and food production not only through labor supply, technological innovation, and institutional arrangements, but also profoundly influences land use patterns and food consumption structures through changes in population size, structural evolution, and improvements in people’s capital. Land acts as a vital nexus connecting people and food. It fulfills the dual function of providing space for human survival and development and serving as the material foundation for food production. The quantity, quality, and utilization efficiency of land directly determine the region’s capacity for food supply and its ecological carrying capacity. The food system, in turn, is a foundational element supporting people’s growth and societal functioning. It is directly driven by people’s demand, partially reflects the intensity and efficiency of land resource utilization, and feeds back into the system by regulating the functional compatibility between the people and land systems through its supply–demand dynamics [34]. From the perspective of system coordination and adaptability, the core of the “people–land” relationship lies in adjusting the spatial alignment between population distribution and land resources to enhance the coordination of population carrying capacity and resource utilization. The “land–food” relationship emphasizes optimizing land structure and enhancing productivity to promote efficient land use and strengthen regional food supply capabilities. Meanwhile, the degree of coordination in the “people–food” relationship fundamentally depends on whether the land system can sustain the food demand pressures brought about by population growth [11]. Based on the theory of the production possibility frontier, although land productivity can be improved, its growth potential is ultimately finite. Overreliance on linear expansion of resource inputs and extensive utilization not only fails to achieve sustained improvement in system efficiency but also risks intensifying “people–land” and “people–food” contradictions, thereby posing potential threats to food security and ecological stability [35]. In oasis agriculture in Xinjiang, water scarcity has become a key constraint on production. Overreliance on water and land resources has pushed ecosystem carrying capacity to its limits, undermining the sustainability of food production [36]. Concurrently, population growth continues to increase food demand, while the strain on land and water resources poses significant challenges to the adaptability of the “population–food” relationship [37,38]. Although technological innovation and efficient resource utilization can enhance production efficiency, excessive dependence on water and fertilizer inputs makes it difficult to sustainably increase grain yields and may exacerbate ecological degradation [39]. Therefore, constructing a highly coordinated and well-coupled relationship among population, cultivated land, and food—across the dimensions of quantity, structure, and quality—and leveraging technological innovation and institutional policies for systemic regulation represents a critical pathway toward achieving regional green transformation, enhancing system resilience, and realizing sustainable development. As illustrated in Figure 2, the adaptation mechanism among the subsystems reflects the systemic coupling and mutual feedback relationships within the P-L-F system.

2.3. Evaluation Indicator System

In constructing an evaluation index system for the adaptive development of the P-L-F system in Xinjiang, this study adheres to the fundamental principles of comprehensiveness, scientific rigor, comparability, hierarchical structure, stability, and data availability. The evaluation framework is designed with a high degree of specificity and innovation, fully incorporating Xinjiang’s unique geographical and socio-economic context. Each indicator, as listed in Table 1, is coded according to its corresponding subsystem [40]. Specifically, the people subsystem focuses not only on the quantity of labor directly involved in food production but also integrates population size and structure into the evaluation, aiming to reveal the multi-dimensional impacts of demographic factors on regional food production capacity and consumption demand. This approach reflects the profound influence of population dynamics on the regional food security landscape. Indicators A11 and A12 represent population size, while A21 and A22 denote population structure. The land subsystem is constructed around three core dimensions: land scale, land technology, and sustainability. It emphasizes both the quantitative foundation of cultivated land resources and the role of technological progress in enhancing food production capacity. Simultaneously, it accounts for the dynamic balance between land development and ecological conservation, highlighting the fundamental importance of sustainable land use in ensuring food security. Among these, B11, B12, and B13 are indicators of land scale; B21 and B22 represent land technology; and B31 and B32 reflect land sustainability. The food subsystem focuses not only on food production capacity but also places emphasis on the stability and security of food supply. Through systematic evaluation of food supply capacity, accessibility, and stability, it comprehensively reflects the resilience of the regional food system and its ability to manage risk. Indicators C11 and C12 correspond to food supply capacity, while C21, C22, C23, and C24 pertain to food stability.

3. Materials and Methods

3.1. Overview of the Study Area

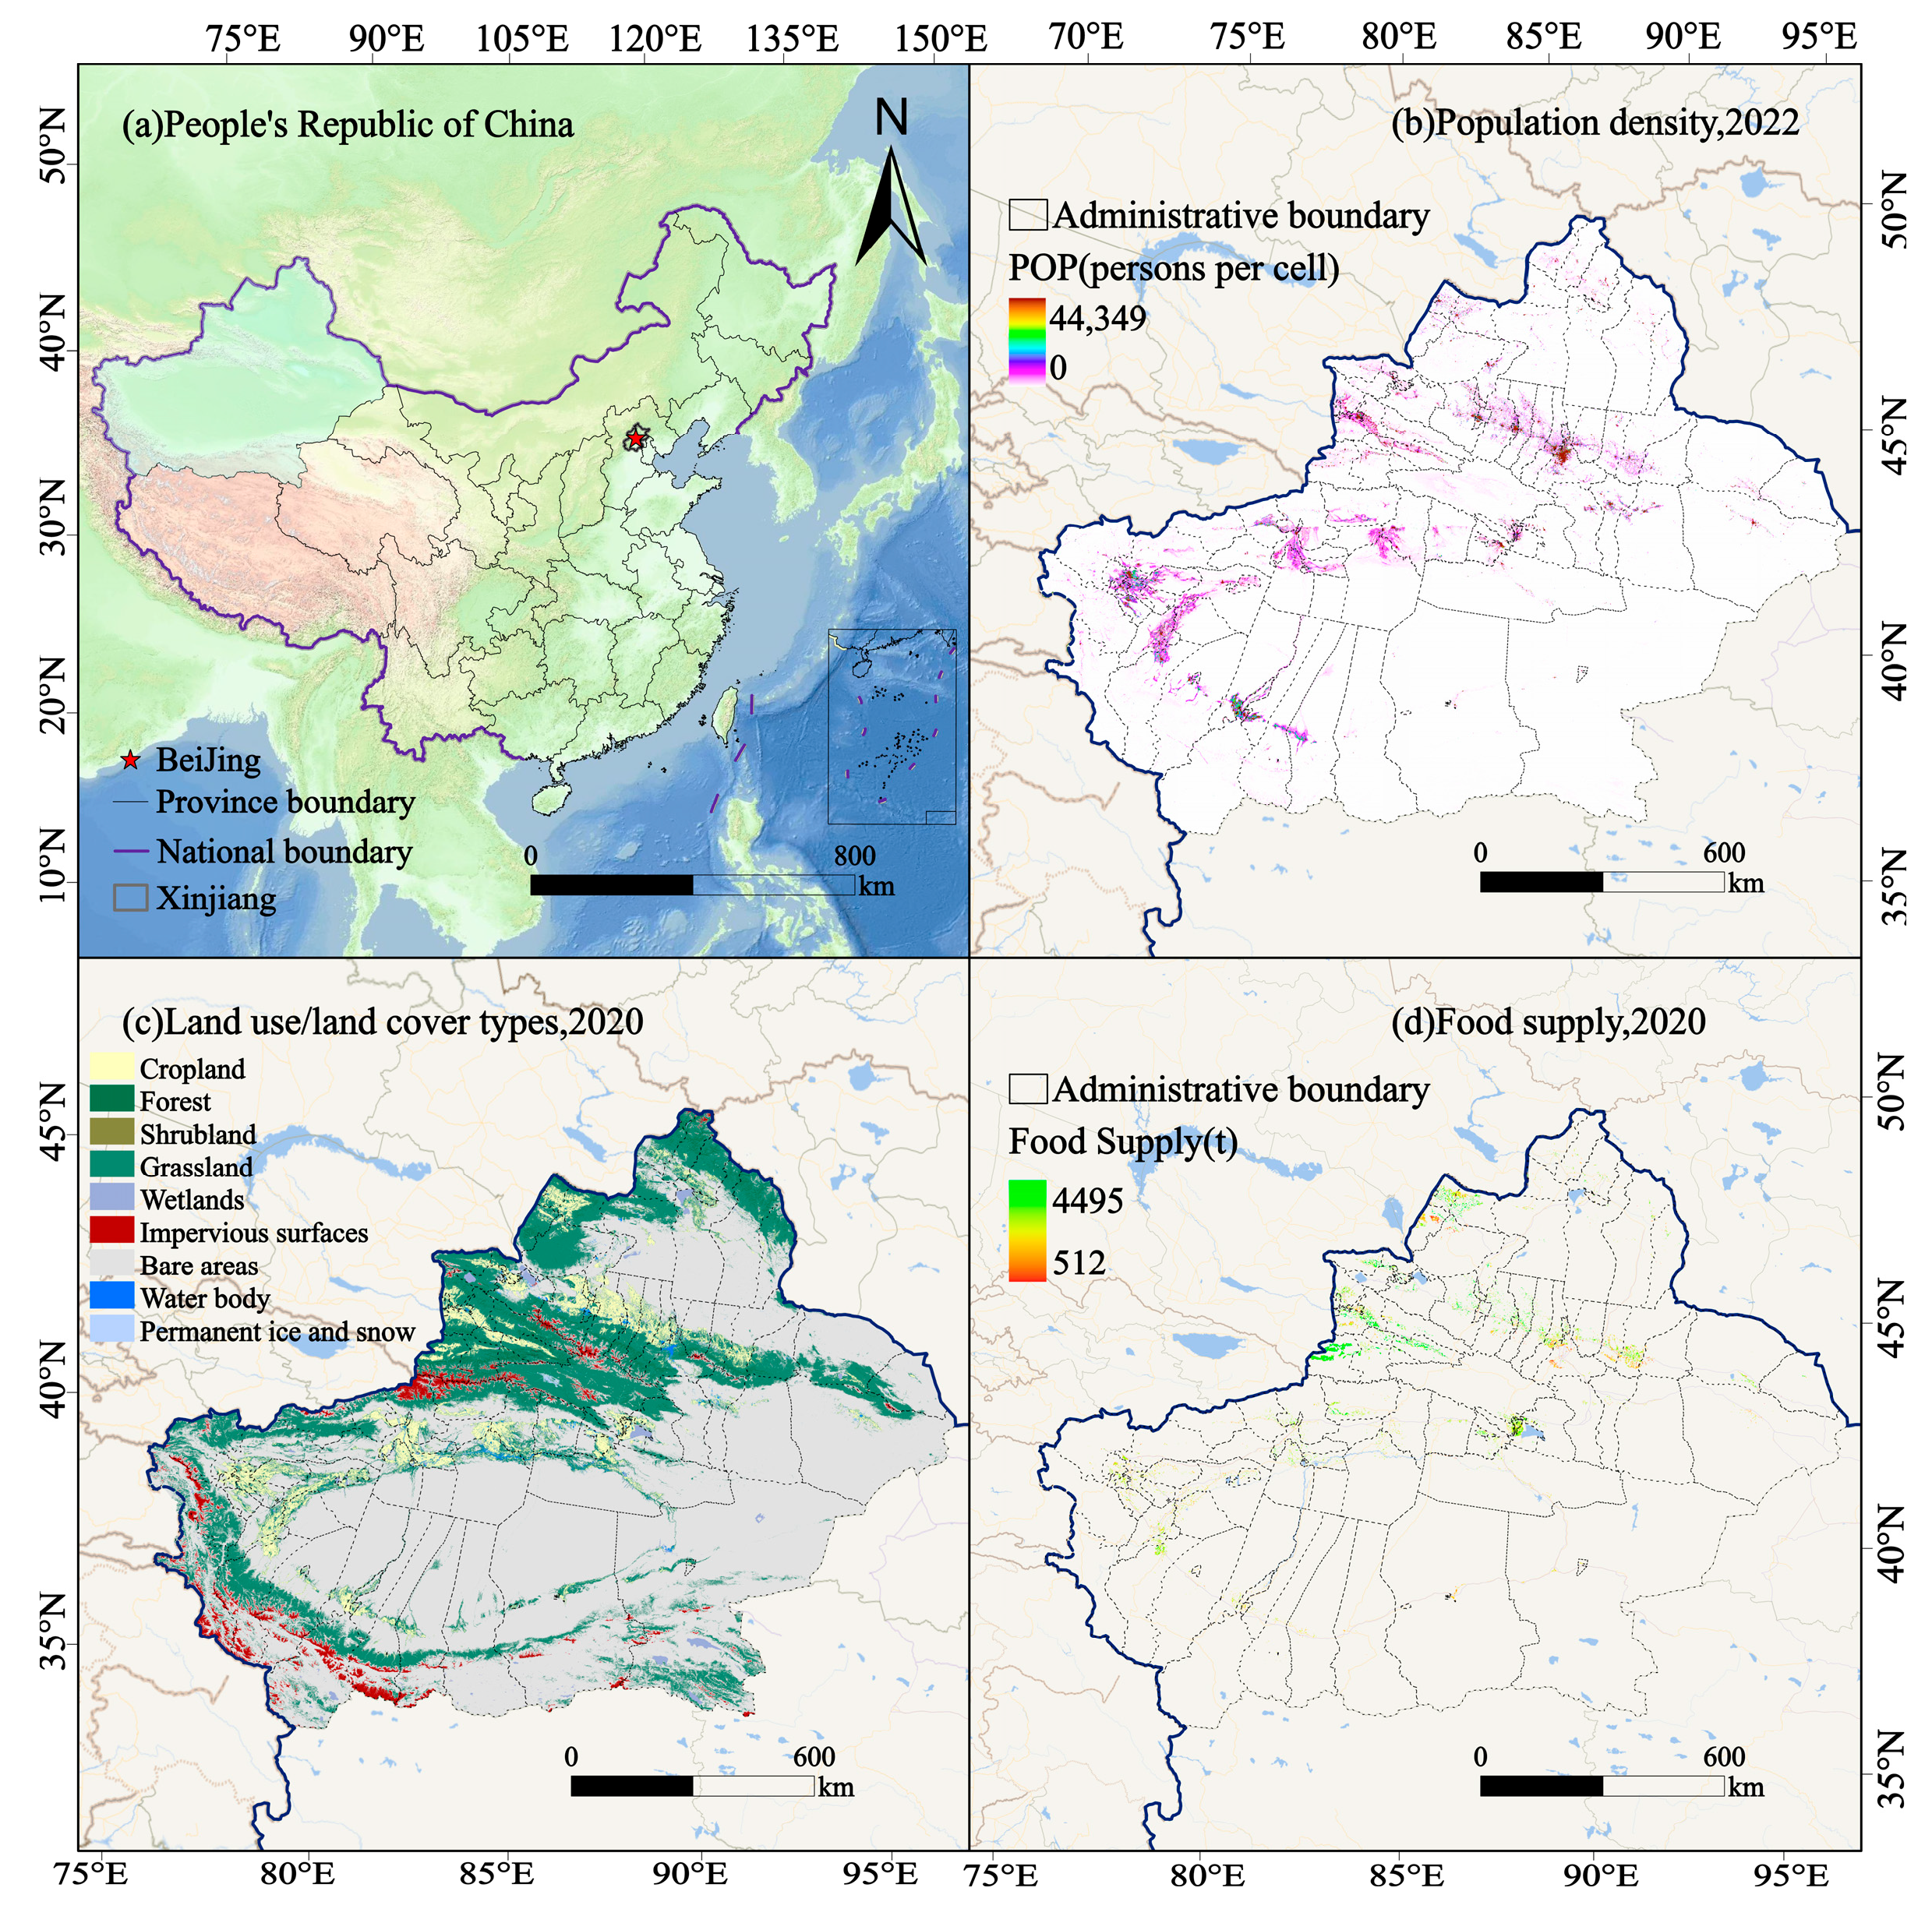
Xinjiang lies between 73°40′ and 96°18′ East longitude and 34°25′ to 48°10′ North latitude, at the core of the Eurasian landmass. It shares borders with eight countries: Russia, Kazakhstan, Kyrgyzstan, Tajikistan, Mongolia, Afghanistan, Pakistan and India [41]. As shown in Figure 3, the region’s topography is the “three mountain ranges and two basins” structure, with the Tianshan Mountains running through the heart of Xinjiang, separating the northern and southern areas. The southern part is known as southern Xinjiang, while the northern part is northern Xinjiang. Xinjiang’s unique geographical location has resulted in a variety of landscape ecosystems, including mountains, oases, and deserts. The climate of the region is predominantly arid or semi-arid, with significant fluctuations in temperature, low and unevenly distributed precipitation, abundant sunshine, and a dry climate. According to statistics, in 2023, the permanent population of Xinjiang reached 25.98 million, with an urban population of 15.39 million, resulting in an urbanization rate of 59.24% [42]. The GDP of Xinjiang was 1.912591 trillion yuan, with a total grain production of 21.1916 million tons [43]. The total sown area of grain reached 42.3715 million mu.

3.2. Data Sources

This study focuses on Xinjiang, and the key data used are sourced from the following publications: the Xinjiang Statistical Yearbook, Xinjiang Production and Construction Corps Statistical Yearbook, Important Agricultural and Rural Economic Indicators, China Rural Statistical Yearbook, the Xinjiang Uygur Autonomous Region People’s Government (https://www.xinjiang.gov.cn/), the Xinjiang Uygur Autonomous Region Statistical Bureau (https://tjj.xinjiang.gov.cn/), and Statistical Bulletins on National Economic and Social Development of Relevant Cities. Missing data for some indicators were estimated using linear interpolation. The data were first standardized to eliminate the impact of different units; next, the entropy weight method was used to calculate the weights; finally, a multivariate linear composite index was applied to calculate the overall development level.

3.3. Research Methods

3.3.1. Variance Inflation Factor

The variance inflation factor (VIF) essentially quantifies the degree of linear correlation between one independent variable and the others through a regression model, thereby detecting multicollinearity [44,45]. The following are the calculation steps for the variance inflation factor:
x i   =   β 0   +   β 1 x 1   +   β 2 x 2   +     +   β i x i   +     +   β n x n   +   η
In the formula, x i   denotes   the   i indicator; n represents the total number of indicators; β 0 ,   β 1 ,   β 2 ,   ,   β n are the estimated coefficients of the regression equation for x 1 ,   x 2 ,   x 3 ,   ,   x n ; η is the error term of the regression equation.
x i ¯ = t = 1 T x t , i T
In the formula, x i ¯ denotes the average value of the i-th indicator; T represents the total number of observation periods for the indicator; x t , i denotes the actual observed value of the i -th indicator in period t .
R i 2 = t = 1 T x ~ t , i x i ¯ 2 t = 1 T x t , i x i ¯ 2
In the formula, R i 2 is the resolvable coefficient for the i-th indicator; x ~ t , i is the estimated value of the i -th indicator in the period.
VIF i = 1 1   R i 2
In the formula, VIF i represents the variance inflation factor for the i -th indicator. As shown by the formula, R i 2 is positively correlated with VIF i . A higher determination coefficient indicates more severe multicollinearity, meaning a larger variance inflation factor signifies greater multicollinearity. The threshold for the variance inflation factor is typically set at 10; a VIF < 10 indicates the presence of weak multicollinearity. The VIF for all indicators in this study is below 10, thereby ensuring the scientific validity of the constructed indicator system.

3.3.2. Min–Max Normalization

Since different data possess varying units of measurement, and constructing composite indicators requires a unified standard, data must first undergo normalization processing. Data normalization eliminates the impact of differing units across datasets and resolves data mismatch issues. Common normalization methods include Min–Max Normalization and z-score normalization. Considering data volume and processing convenience, this study employs Min–Max Normalization [46]. Following normalization, the data falls within the range [−1, 1].
x * = x   x min x max x min
In the formula: x * denotes the normalized data; x represents the original data; x min is the minimum value of the data; x max is the maximum value of the data.

3.3.3. Entropy Weight Method

Entropy, initially a concept from thermodynamics, primarily measures the level of disorder or randomness within a system. It has now been applied to research in various fields. In information theory, entropy reflects the degree of disorder in information and can be used to assess the amount of information. The more information a particular indicator carries, the greater its influence on decision-making [47]. When the values of an evaluation object vary significantly on a certain indicator, the entropy value is small, indicating that the indicator provides a large amount of information. Therefore, the weight of that indicator should be larger. Information entropy theory helps assess the disorder and value of each indicator. By constructing a judgment matrix based on the evaluation indicator values, the weights of each indicator can be determined. The calculation steps are outlined below:
Calculate the proportion of indicator j in year i:
P i j   =   x i j * i = 1 n x i j * ,   i = 1 , 2 , , n ,   j = 1 , 2 , , m
Calculate the information entropy of indicator j:
e j = k i = 1 n P i j   ln P i j , k = 1 ln n
Calculate the information entropy redundancy of indicator j:
D j = 1 e j
Calculate the weight of indicator j:
w j = d j j = 1 m d j
In these formulas, n represents the number of years, and m represents the number of indicators.

3.3.4. Comprehensive Adaptability Evaluation Model

This paper constructs a comprehensive evaluation framework for the adaptability of the P-L-F system from two dimensions: “adaptability” and “matchability.” On one hand, “adaptability” emphasizes the dynamic stability and continuous optimization of the system’s functions through mutual adjustments and feedback mechanisms among the internal elements of the system under changes in external environments or internal structural adjustments [48]. Given that adaptability is essentially a dynamic process that evolves over time, this study introduces a coupling coordination model to measure the interaction intensity and coordination evolution state between the elements of the P-L-F system across time scales, reflecting the system’s overall dynamic adaptability. On the other hand, “matchability” focuses on the degree of coordination between different subsystems as well as the internal elements of the system in terms of structural proportion, development rate, and spatial distribution. It reflects the symmetry and coordination between the internal functional composition of the system and its external relationships [49]. Accordingly, this paper employs a matching degree model based on sequence structure to conduct a quantitative analysis of the consistency and coupling of the development speed of the elements within the P-L-F system, starting from the spatial scale [34]. This analysis aims to reveal the adaptation pattern and spatial evolution characteristics of the system at the regional level.
(1)
Adaptability Quantification Model
D j = C × T , C = 3 x y z 3 x + y + z , T = a x + β y + λ z
In the formula: D j represents the coupling coordination degree of the P-L-F complex system, i.e., the adaptability; C represents the coupling degree; x, y, z are the evaluation values of the people, land, and food systems, respectively; α = β = λ = 1/3; T is the composite index.
(2)
Compatibility Quantification Model
M j = 1 W j U 1 , j = 1 , 2 , , U
where M j represents the matching degree for the j-th year; W j are the differences in the ordered sequences of x, y, and z values from smallest to largest. This study uses the average of the dual matching degrees of P-L-F to calculate the overall matching status of the three systems. U represents the number of study units.
(3)
Comprehensive Adaptability Weighted Calculation
A j = a D j + b M j
where A j represents the adaptability; a and b are the weights assigned to adaptability and matching degree, respectively. Since compatibility only reflects the symmetrical relationship between systems and does not indicate that the systems are in a good development state, the importance of compatibility is lower than that of adaptability. Based on existing research, we set a, b are the weights of adaptability and compatibility, respectively. Since compatibility only reflects the symmetrical relationship between systems and does not indicate that the systems are in a good development state, the importance of compatibility is lower than that of adaptability. Based on existing research [50,51], we set a = 0.6, b = 0.4. Adaptability is classified into five levels based on the Gini coefficient: extremely incompatible, incompatible, moderately compatible, relatively compatible, and highly compatible.

3.3.5. Obstacle Degree Model

The obstacle degree model provides a comprehensive analysis of the key factors hindering progress and their varying degrees of impact in the coordinated adaptation and development of different systems. Considering the various factors that affect sustainable development in Xinjiang, this study, based on the adaptation evaluation of the Xinjiang P-L-F system, utilizes the obstacle degree model to pinpoint the main hindering factors and assess their impact. The goal is to propose strategies for Xinjiang’s development, promoting the sustainable development of food security and achieving steady, harmonious, and long-term improvements [52]. The specific formulas are as follows:
O j   =   F j I j j = 1 n F j I j
I j = 1 f U j ,     j = 1 , 2 , , n
where the factor contribution ( F j ) represents the degree of contribution of subsystem j to the overall system, which is the weight of that subsystem; the index deviation ( I j ) is the difference between the actual development index and the ideal development index of subsystem j; the obstacle degree ( O j ) reflects the degree to which subsystem j constrains the overall system.

4. Results

4.1. Spatiotemporal Characteristics of the Comprehensive Level of the Xinjiang P-L-F System

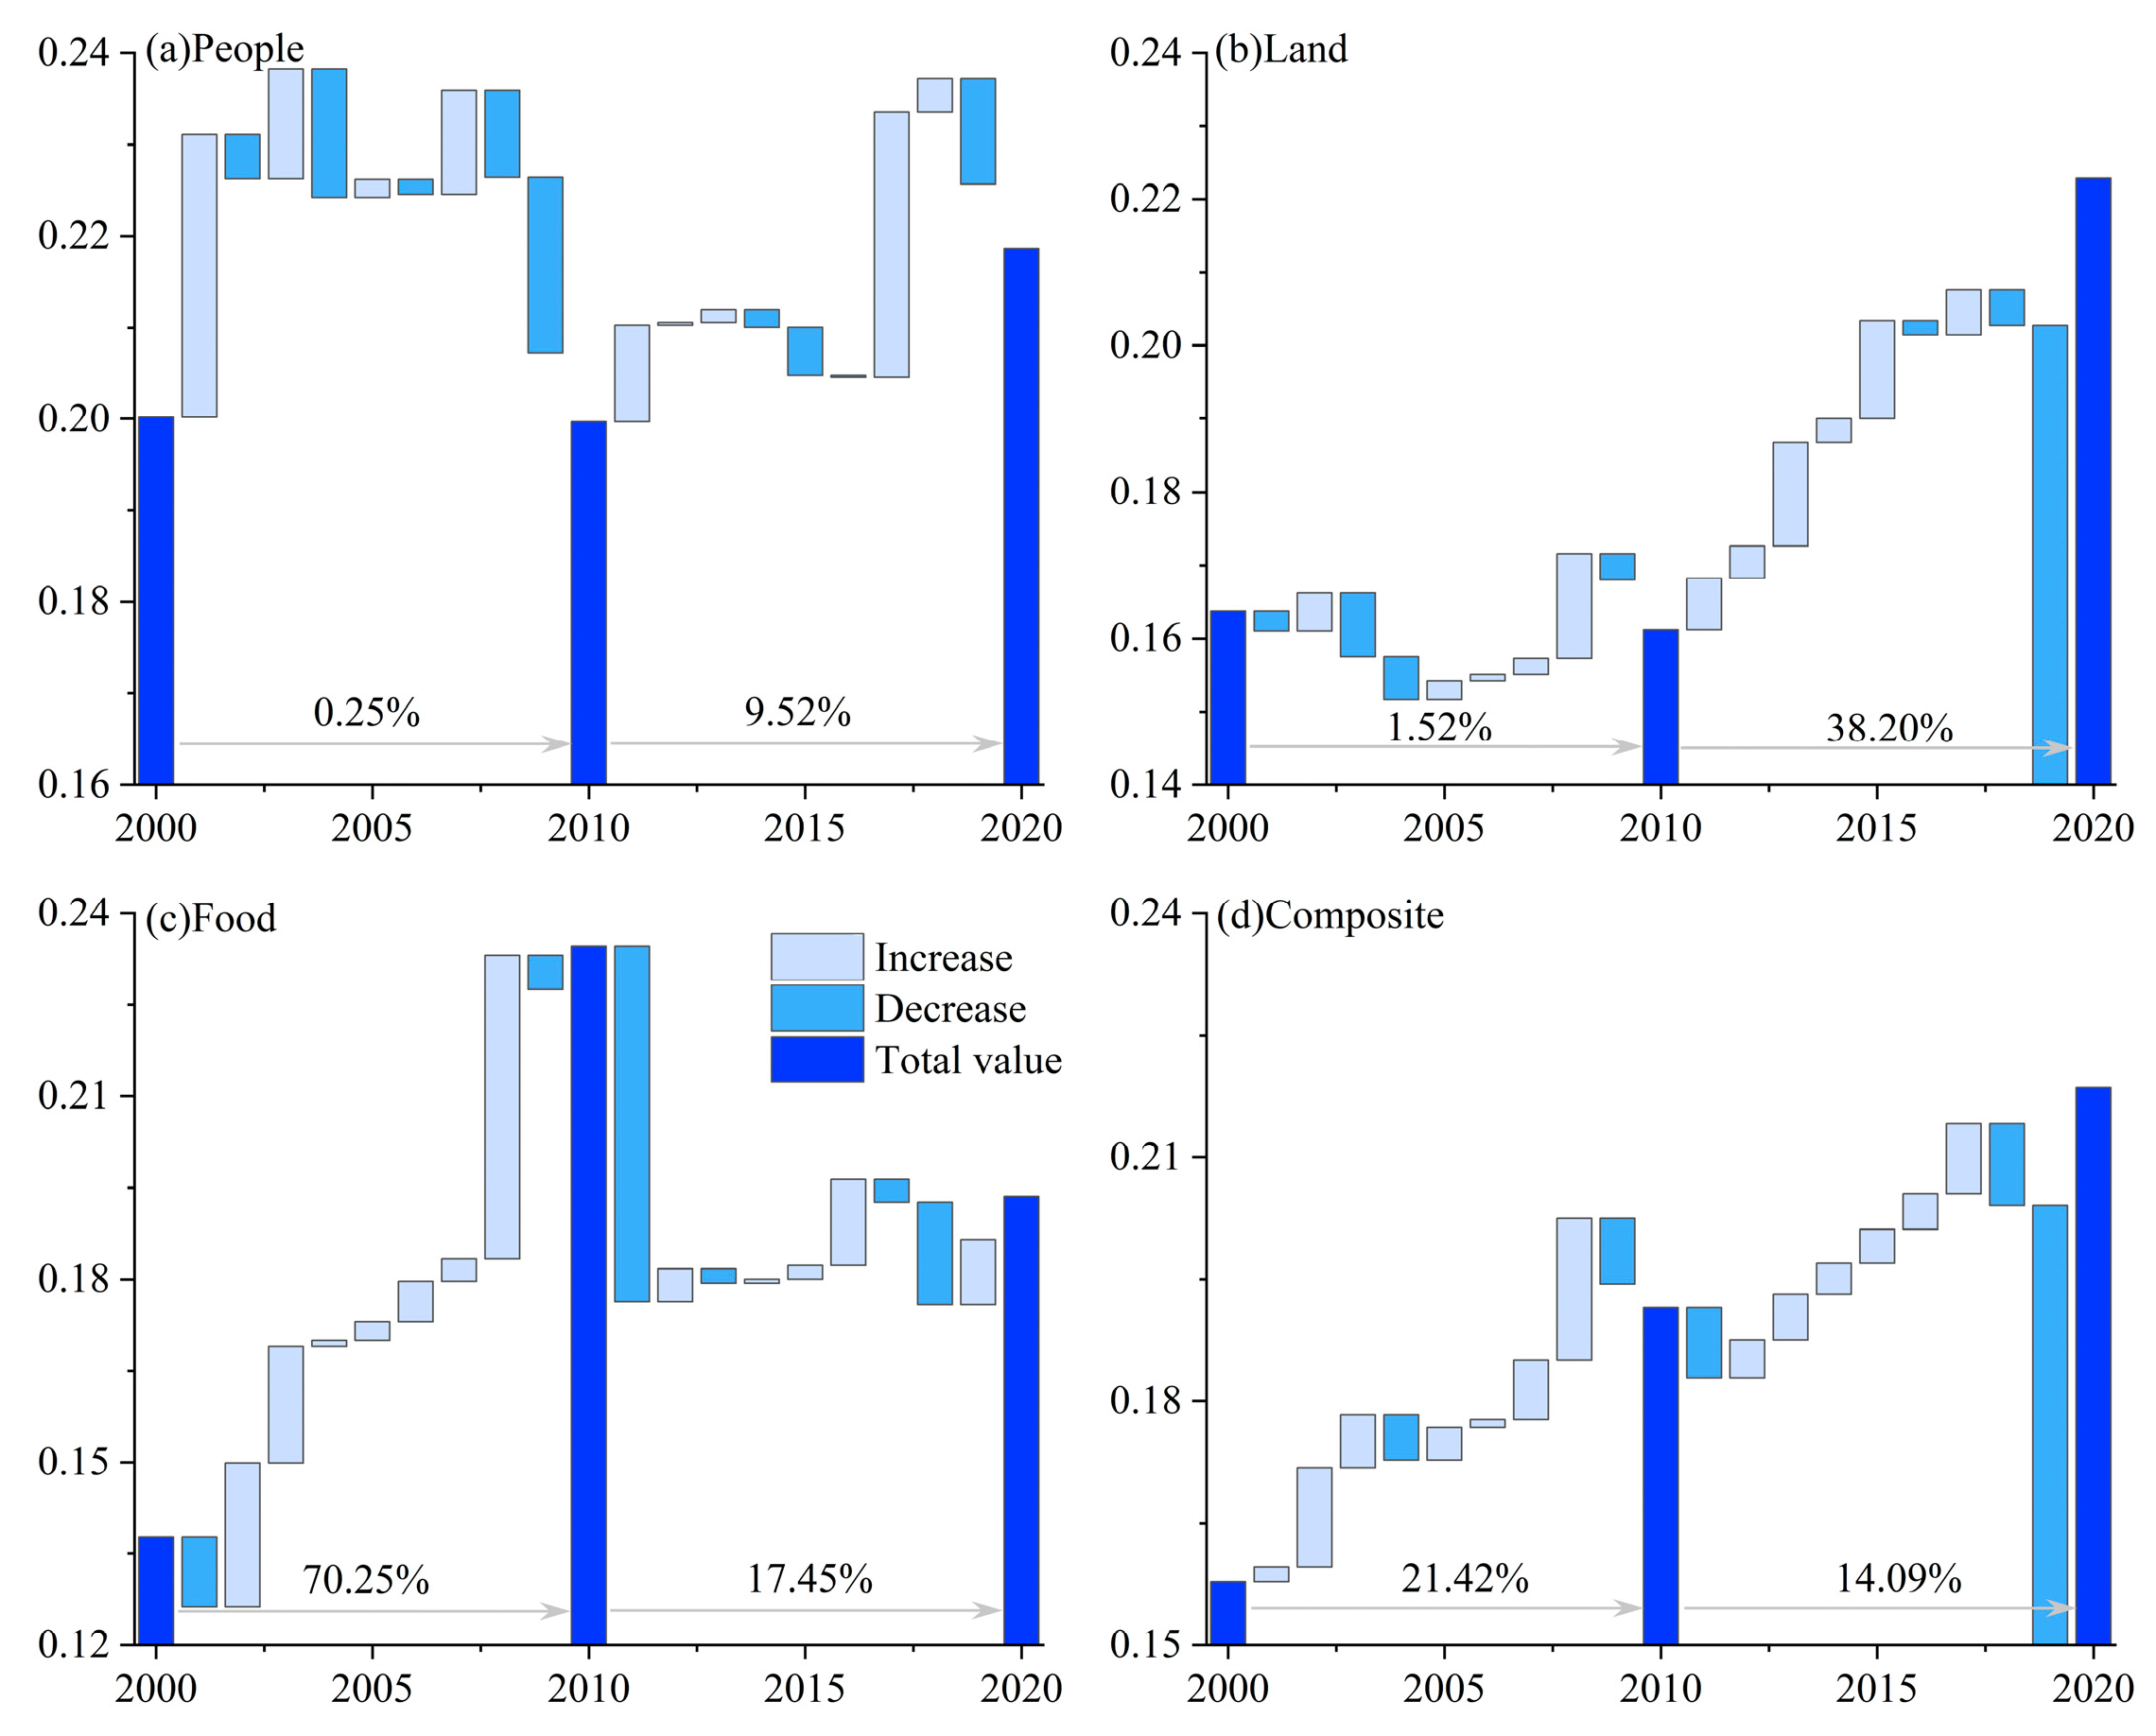
The comprehensive evaluation indices of the Xinjiang P-L-F subsystems and the composite system from 2000 to 2020, illustrated in Figure 4, indicate that the comprehensive index of the Xinjiang P-L-F composite system steadily increased from 0.1578 in 2005 to 0.2185 in 2020, with an average annual growth rate of 1.39%. The land and food systems experienced average annual growth rates of 1.99% and 1.9%, respectively, reflecting significant improvements in land resource utilization efficiency and food production capacity. In comparison, the people system experienced a slower growth rate, with an average annual increase of just 0.32%, indicating that population-related development is progressing at a slower pace. Despite the fluctuating growth trends observed in the individual subsystems, the overall composite system demonstrates an increasingly optimized P-L-F relationship, reflecting the continuous improvement in Xinjiang’s capacity for resource coordination and sustainable development during this period. However, there were instances in specific years where the human, land, food, and composite systems showed a downward trend. Notably, the comprehensive level of the population is relatively high and contributes significantly to the composite system. The population development in Xinjiang shows a generally fluctuating upward trend, with its population base being medium-sized compared to other populous provinces in China. Xinjiang’s land utilization level is the lowest, yet it has the highest annual growth rate, indicating considerable potential for future development.
Using the natural breaks method in ArcGIS 10.8, the comprehensive system and subsystems of each city in Xinjiang from 2000 to 2020 were classified into four levels: (I) low level, (II) relatively low level, (III) relatively high level, and (IV) high level. Figure 5 illustrates the spatial visualization analysis of the multi-year average values of these systems for all cities during the study period. Overall, the central region exhibited a higher overall performance of the composite system compared to the northern and southern regions. High-level cities include Shihezi, Urumqi, Wujiaqu, Shache, Alar, Shawan, Qitai, and Yining. The primary reasons lie in the prominent locational and transportation advantages of these regions, coupled with their pronounced industrial agglomeration effects. Cities such as Ürümqi and Shihezi occupy core nodes within Xinjiang’s integrated transportation corridors, boasting well-developed infrastructure and highly efficient agricultural product distribution. These areas represent the most economically dynamic zones within the region. Relatively high-level cities include Kuche, Kekedala, Yecheng, Jiashi, Huyanghe, Bachu, Changji, Wusu, Moyu, and Aksu, which are concentrated in the central and southwestern regions. These cities are the core urban areas in Xinjiang and its surrounding regions, characterized by dense populations, frequent socio-economic activities, and significant urban construction land. In contrast, cities such as Aheqi, Yiwuy, Takken, Jimunai, Minfeng, Wuqia, Hebu, Keping, Burqin, and Balikun are categorized as low and relatively low-level cities. These regions are primarily constrained by harsh natural environments, scarce water resources, and weak infrastructure.
In conclusion, the southern Xinjiang region faces harsh natural environments, with limited per capita resources and increasing constraints on arable land and water resources. This has led to a noticeable development gap between southern and northern Xinjiang.

4.2. Assessment of the Adaptability of the Xinjiang P-L-F Composite System

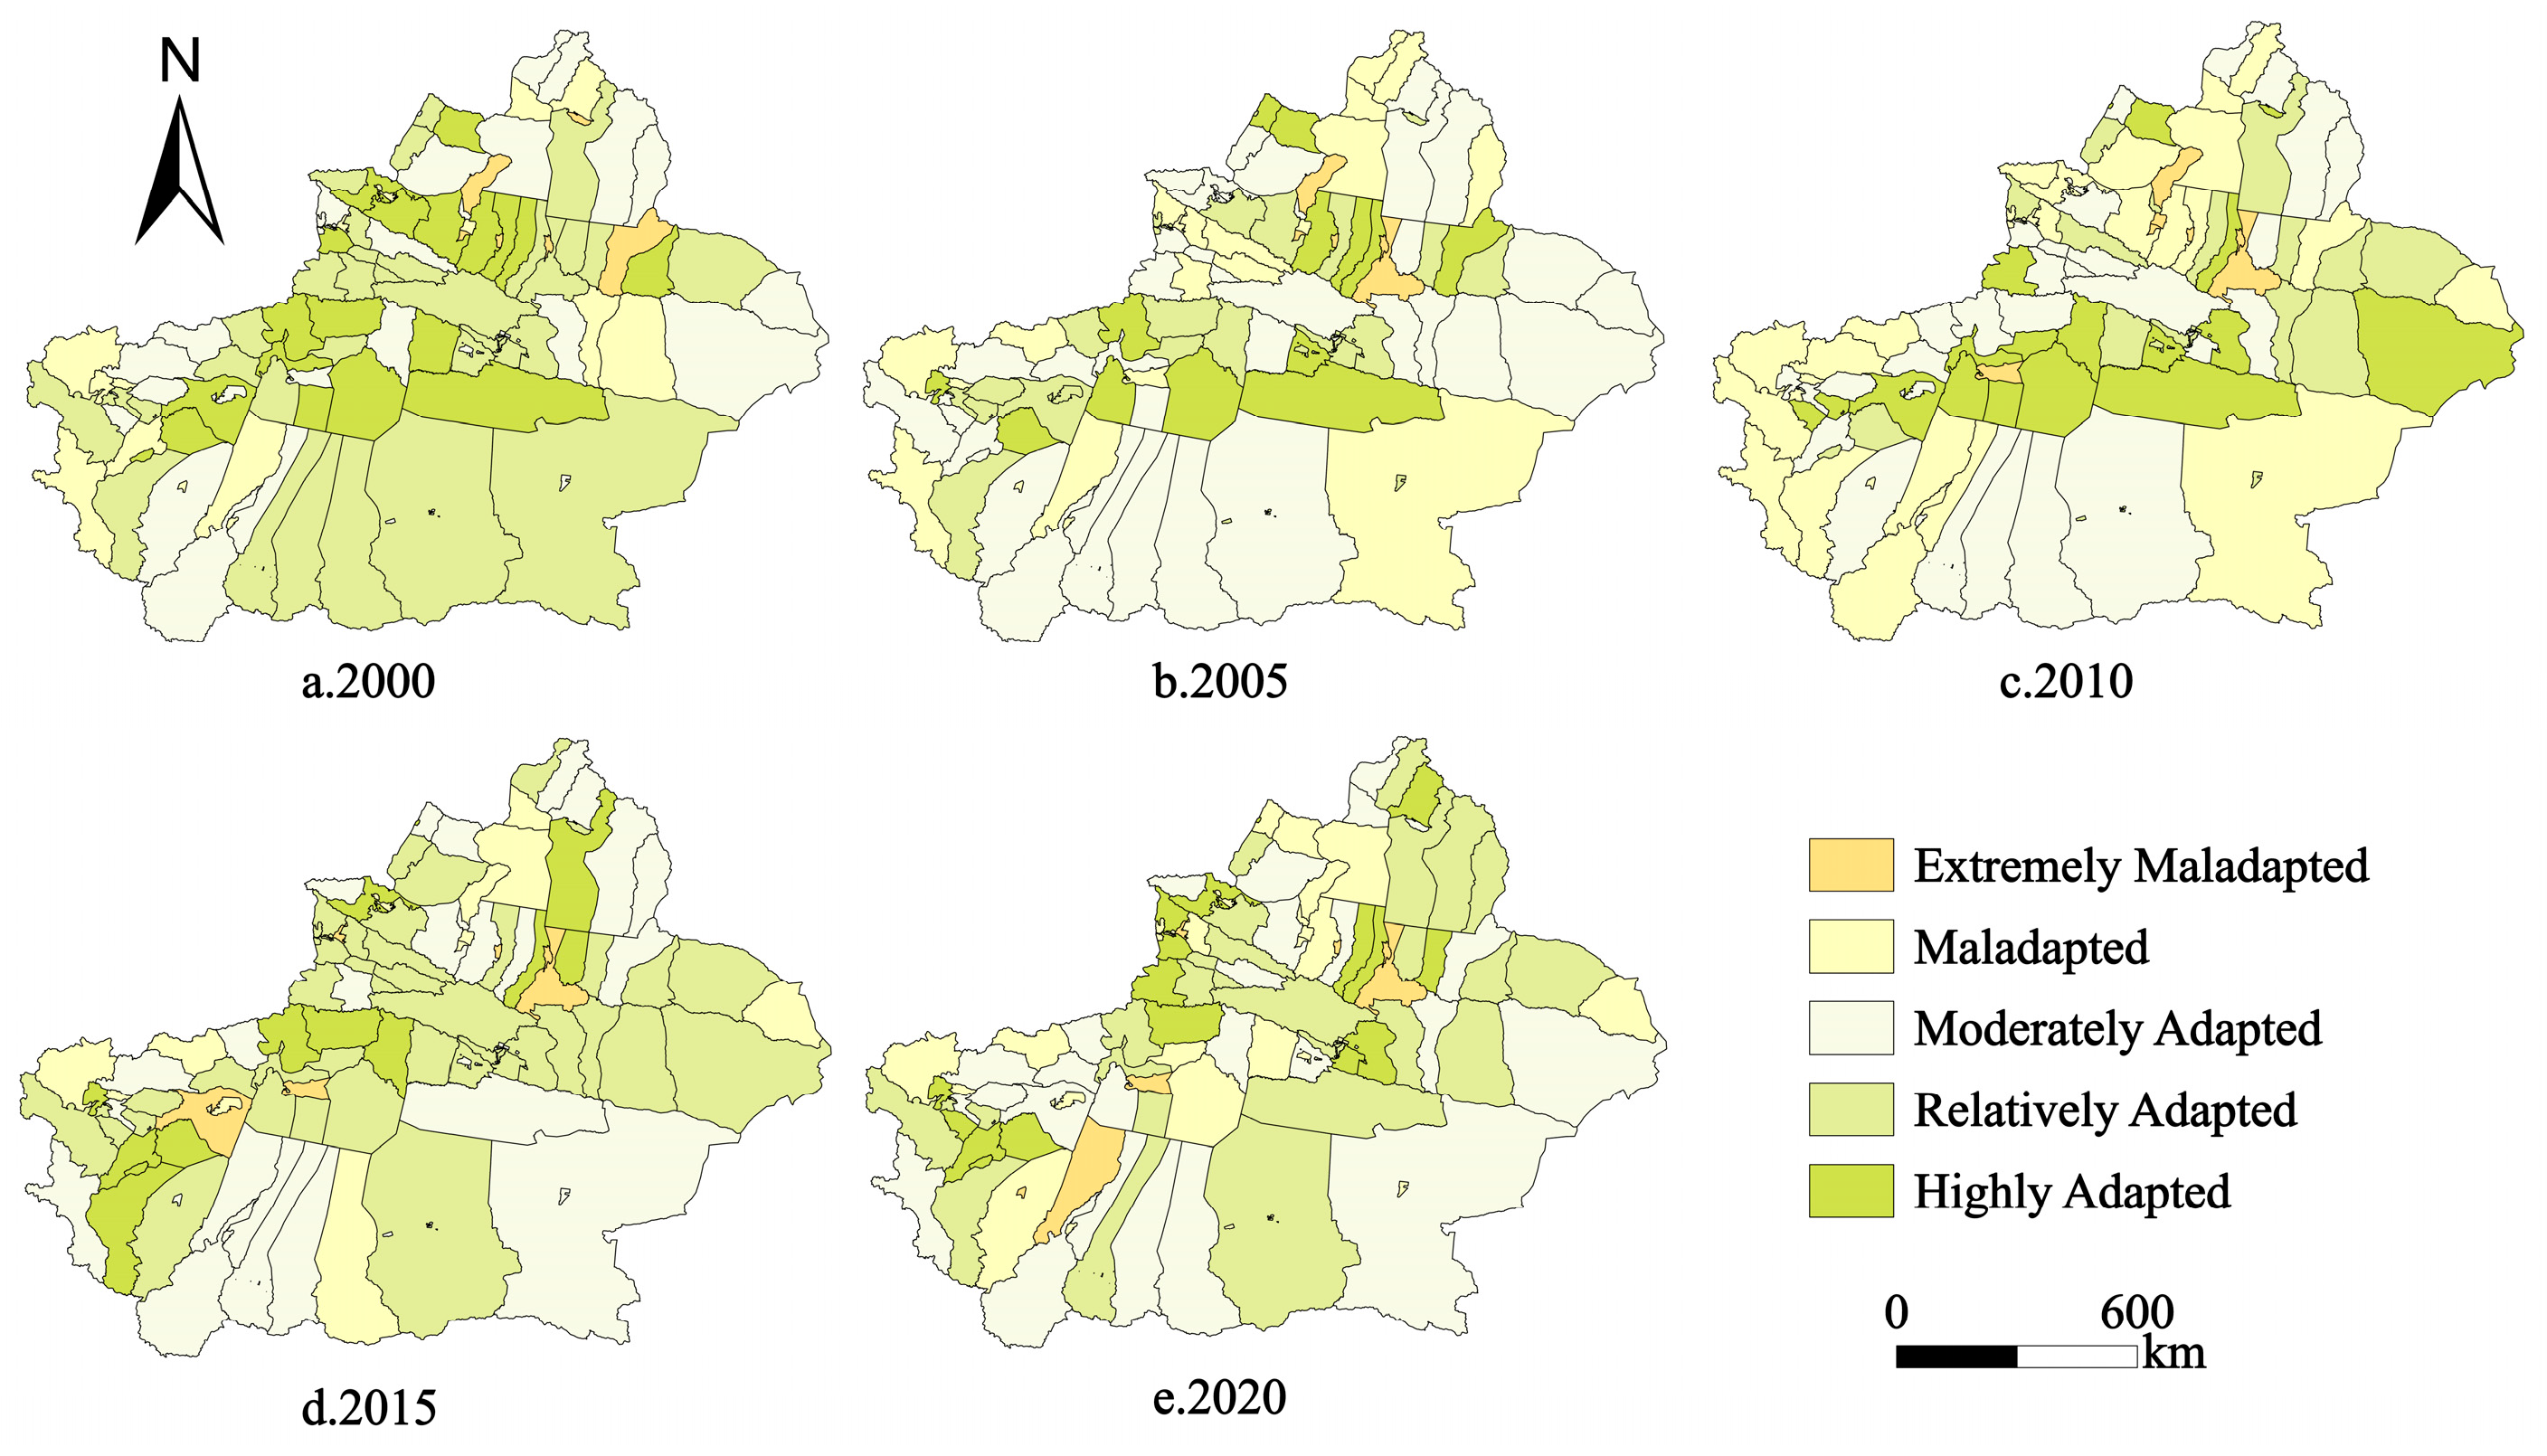
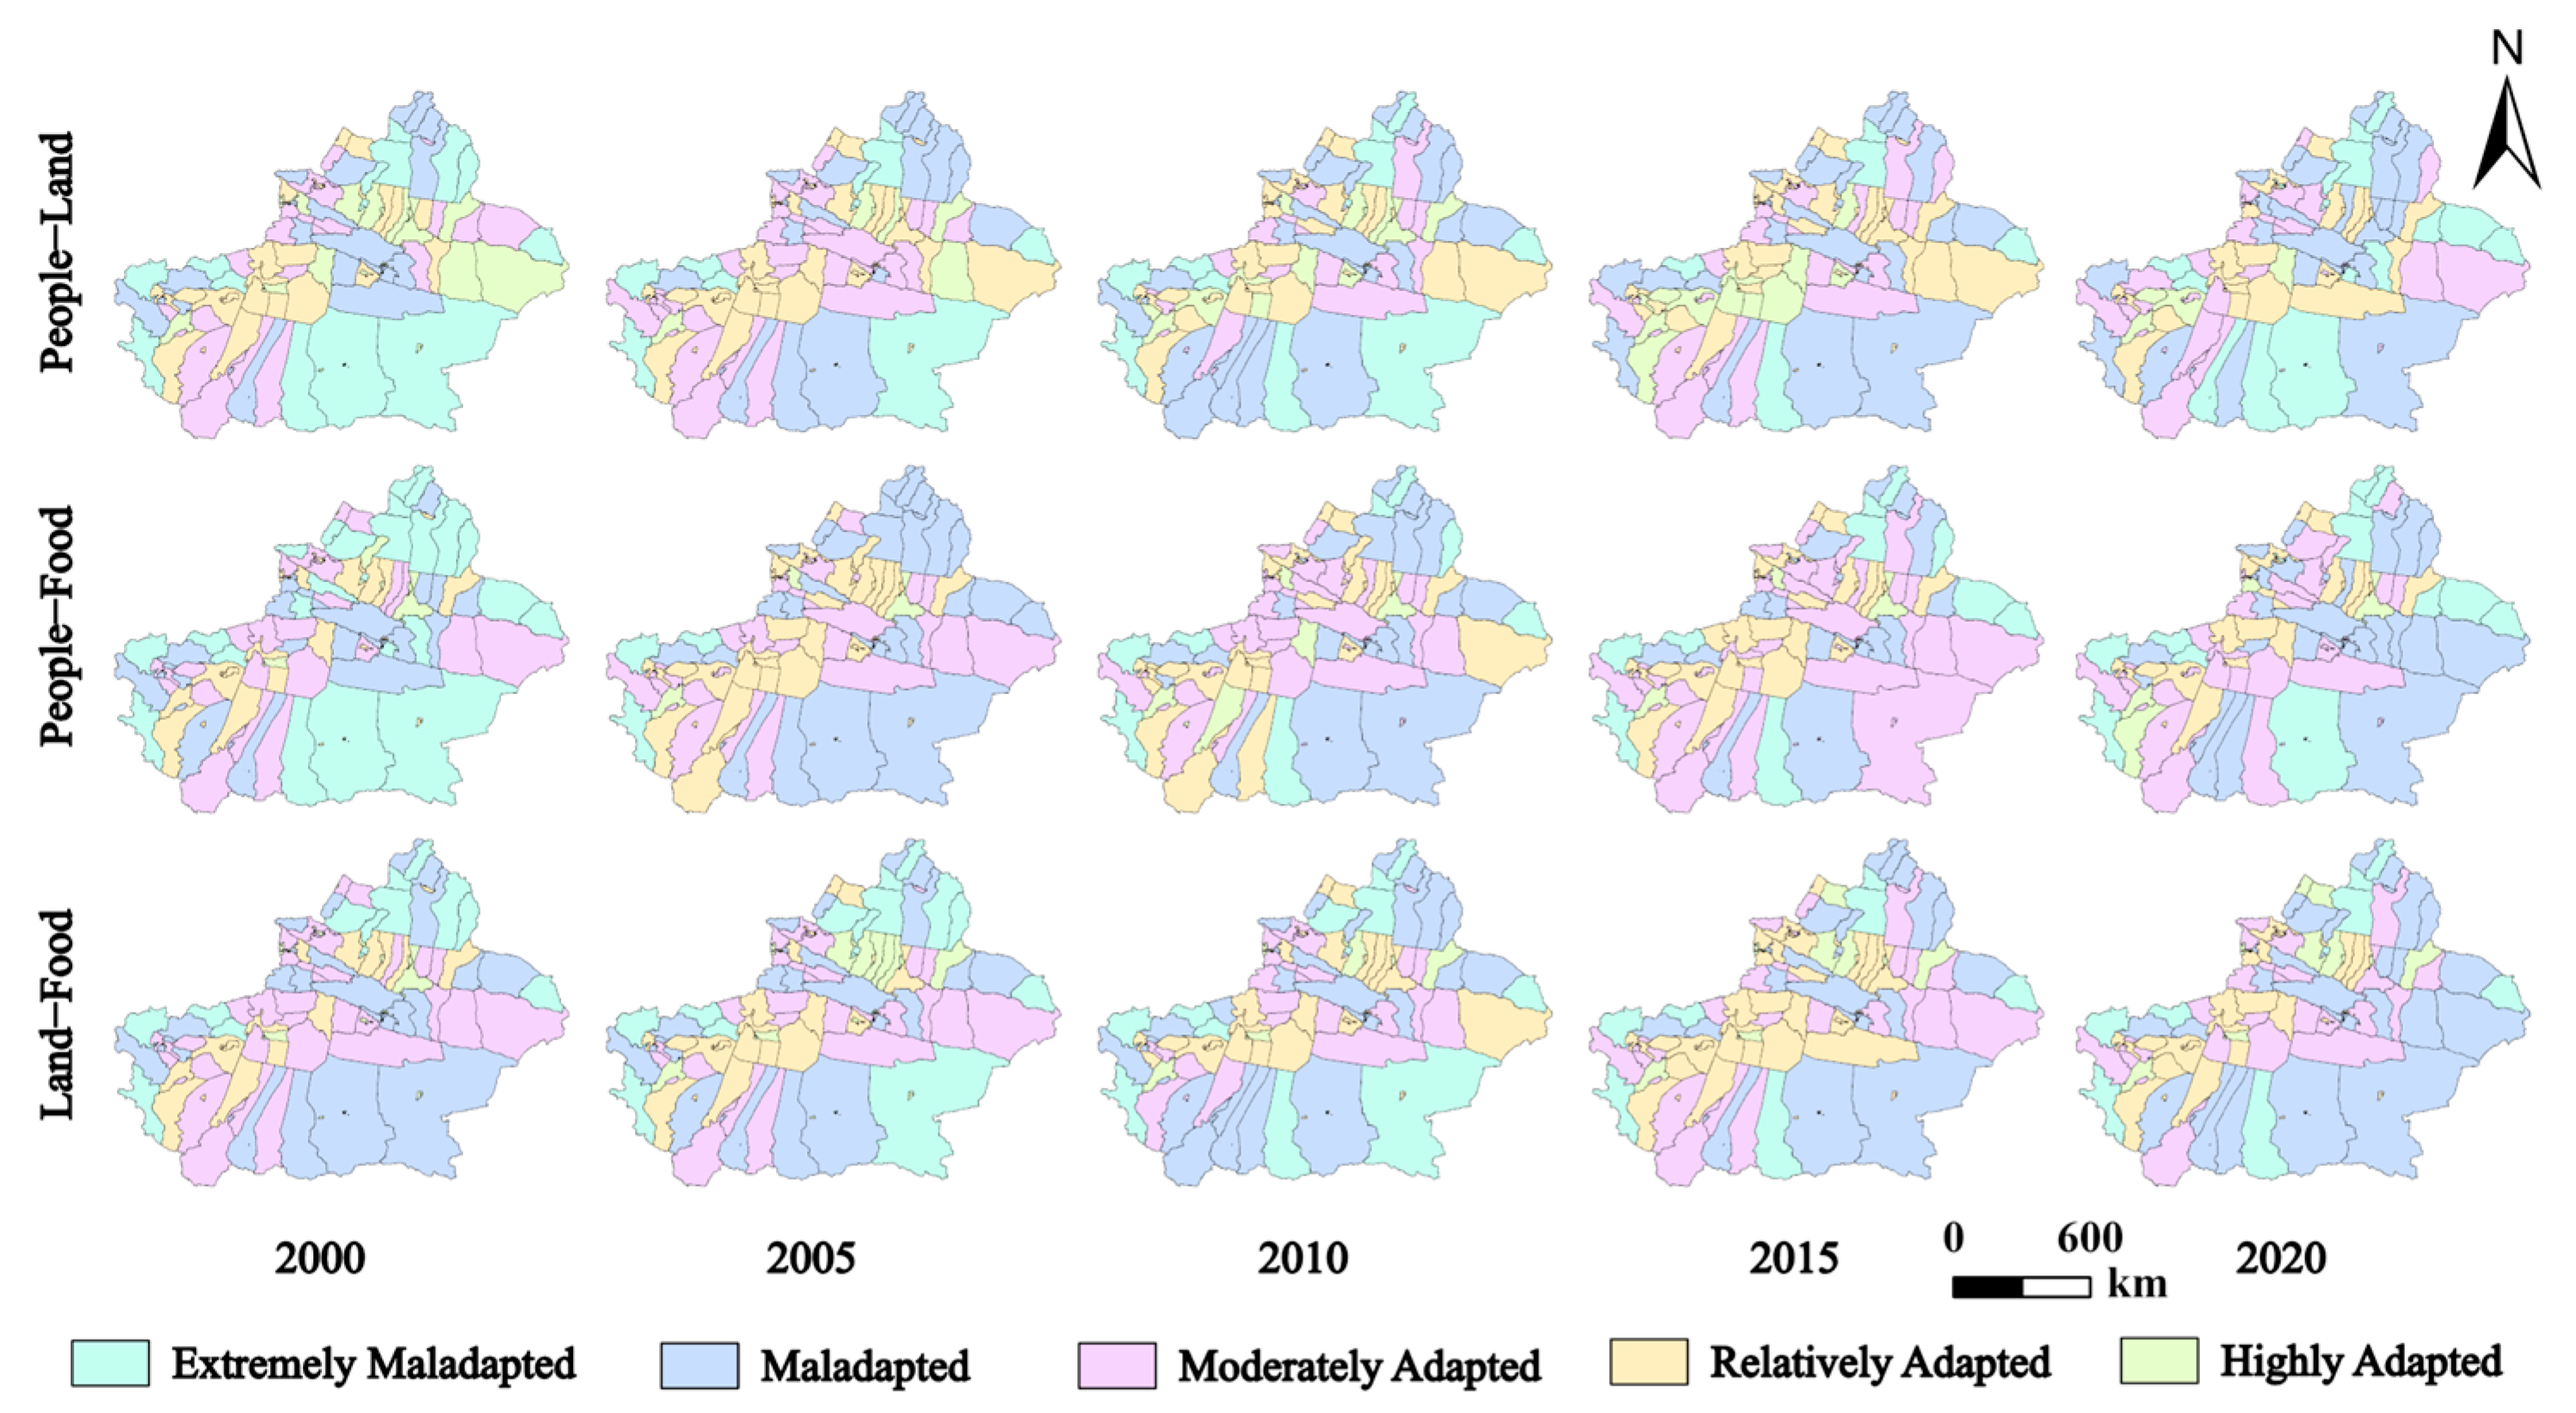
Based on the temporal changes in the comprehensive evaluation index of the Xinjiang P-L-F composite system, five time points—2000 (a), 2005 (b), 2010 (c), 2015 (d), and 2020 (e)—were selected for the study of Xinjiang. The evaluation indices for each region’s P-L-F composite system were classified using the natural breaks method in ArcGIS, and the spatial evolution characteristics of each region were analyzed. Overall, there are significant regional differences in adaptability across Xinjiang. As illustrated in Figure 6, northern Xinjiang shows higher adaptability than southern Xinjiang, which has relatively low adaptability, though this has improved in later years. In 2000, adaptability was relatively high, and it continued to improve in the following years. Compared to 2000, the adaptability of the entire region declined in 2005, with Qitai County shifting from “highly incompatible” to “highly adaptable,” while Tiemenguan, Ruoqiang, Hebu, Habahe, and Burqin became “incompatible,” and Urumqi shifted from “relatively adaptable” to “highly incompatible.” In 2010, compared to 2005, Bachu, Aksu, Zhaosu, and Yizhou became “highly adaptable,” while Alar became “highly incompatible,” and cities like Atushi, Aketao, Yecheng, Yuwu, Qitai, Wenquan, Wusu, Shawan, and Manas shifted to “incompatible.” In 2015, compared to 2010, Yecheng, Zepu, Shache, Maigaiti, Baicheng, Wensu, and Fuhai became “highly adaptable,” while Bachu became “highly incompatible,” and Minfeng became “incompatible.” Cities like Burqin, Tiemenguan, Ruoqiang, Moyu, Hetian, Luopu, Atushi, and Tashkurgan Tajik Autonomous County shifted to “relatively adaptable.” In 2020, compared to 2015, regions such as Heshuo, Bohu, Hutubi, Huocheng, Chaxian, Zhaosu, Heshuo, Bohu, and Jimusaer became “highly adaptable,” while Moyu became “highly incompatible,” and Minfeng became “relatively adaptable.”Although some regions have improved their system adaptability due to continued economic development and the strengthening of overall economic power, promoting rational resource allocation and regional coordinated development, some areas continue to remain in an “incompatible” state.

4.3. Adaptability of the Xinjiang P-L-F Dual System

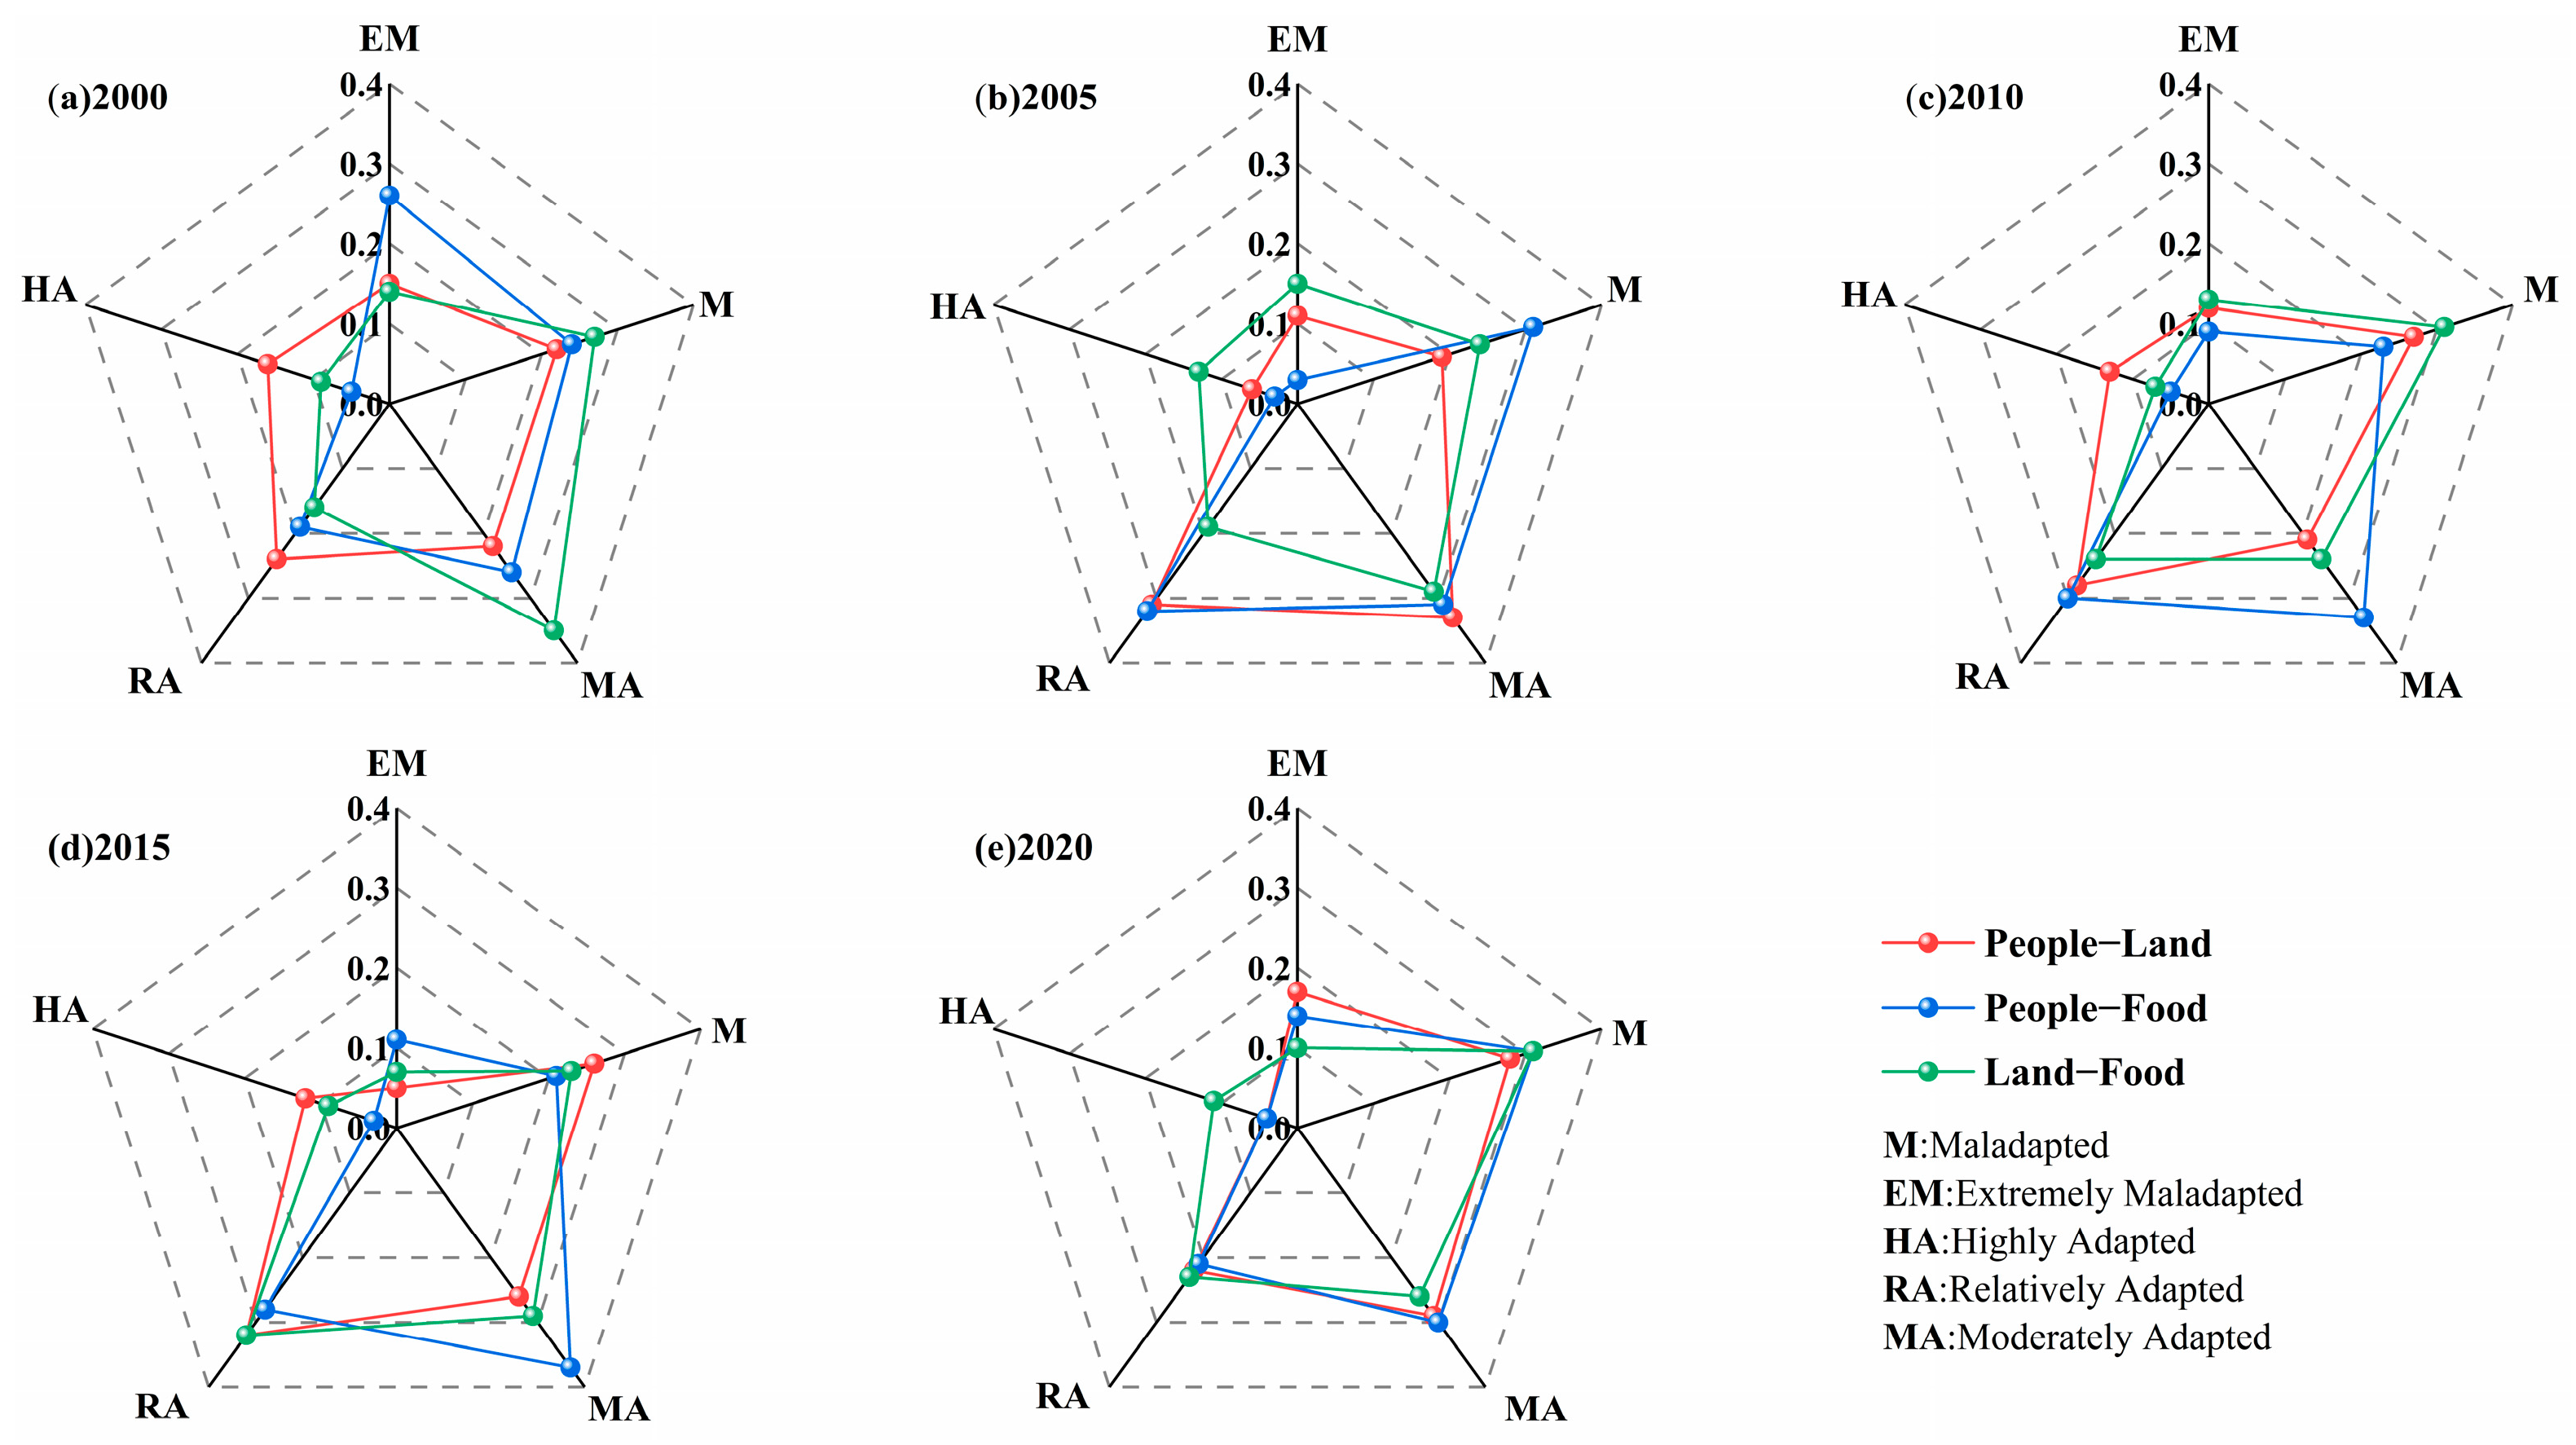
By calculating the adaptability of the Xinjiang P-L-F dual system from 2000 to 2020 and analyzing the results using the natural breaks method, the adaptability trends can be observed. As illustrated in Figure 7, throughout the study period, the adaptability effect of the Xinjiang P-L-F dual system remained at a mid-to-high level. Specifically:
① People–Land System: High adaptability regions initially declined, rose, and fell again, with proportions at 16% in 2000 and just 4% in 2020. Regions like Bachu, Kuqa, and Shache showed strong adaptability in 2020, reflecting improvements in population and land use strategies. Relatively adaptable areas, such as Shawan and Changji, fluctuated between 22 and 32%. Conversely, extremely low adaptability areas increased to 17% in 2020, including Karamay and Minfeng, indicating regional disparities and tensions between resource development and population growth.
② People–Food System: This system also saw fluctuating changes. Highly adaptable areas remained limited, ranging between 3 and 5% over the years, with Urumqi and Yecheng being key regions in 2020. Relatively high adaptability regions generally rose, reaching 21% in 2020, reflecting agricultural modernization and economic restructuring in areas like Shawan and Hutubi. Extremely low adaptability areas showed a downward trend, though they increased to 14% by 2020, with regions such as Qemai and Wuqia facing constraints in both food production and population resilience.
③ Land–Food System: This system displayed the most complex pattern. Highly adaptable regions showed an overall increase from 9% to 11% by 2020, including Qitai and Tacheng. Relatively adaptable regions steadily rose, reaching 23% in 2020, particularly in southern Xinjiang and the Tianshan belt, benefiting from ecological protection and modernization. Extremely low adaptability areas declined from 14% to 10%, with regions like Minfeng and Kuitun still facing ecological and resource allocation challenges.
④ As shown in Figure 8, the adaptability of the People–Land, People–Food, and Land–Food dual systems showed a gradual improvement from 2000 to 2020. Although the proportion of regions with extremely high adaptability remained relatively low in some systems, the reduction in extremely low adaptability and the increase in relatively adaptable regions indicate that the coordination and adaptability between the People–Land, People–Food, and Land–Food systems have been enhanced.

4.4. Diagnosis of Obstacle Factors

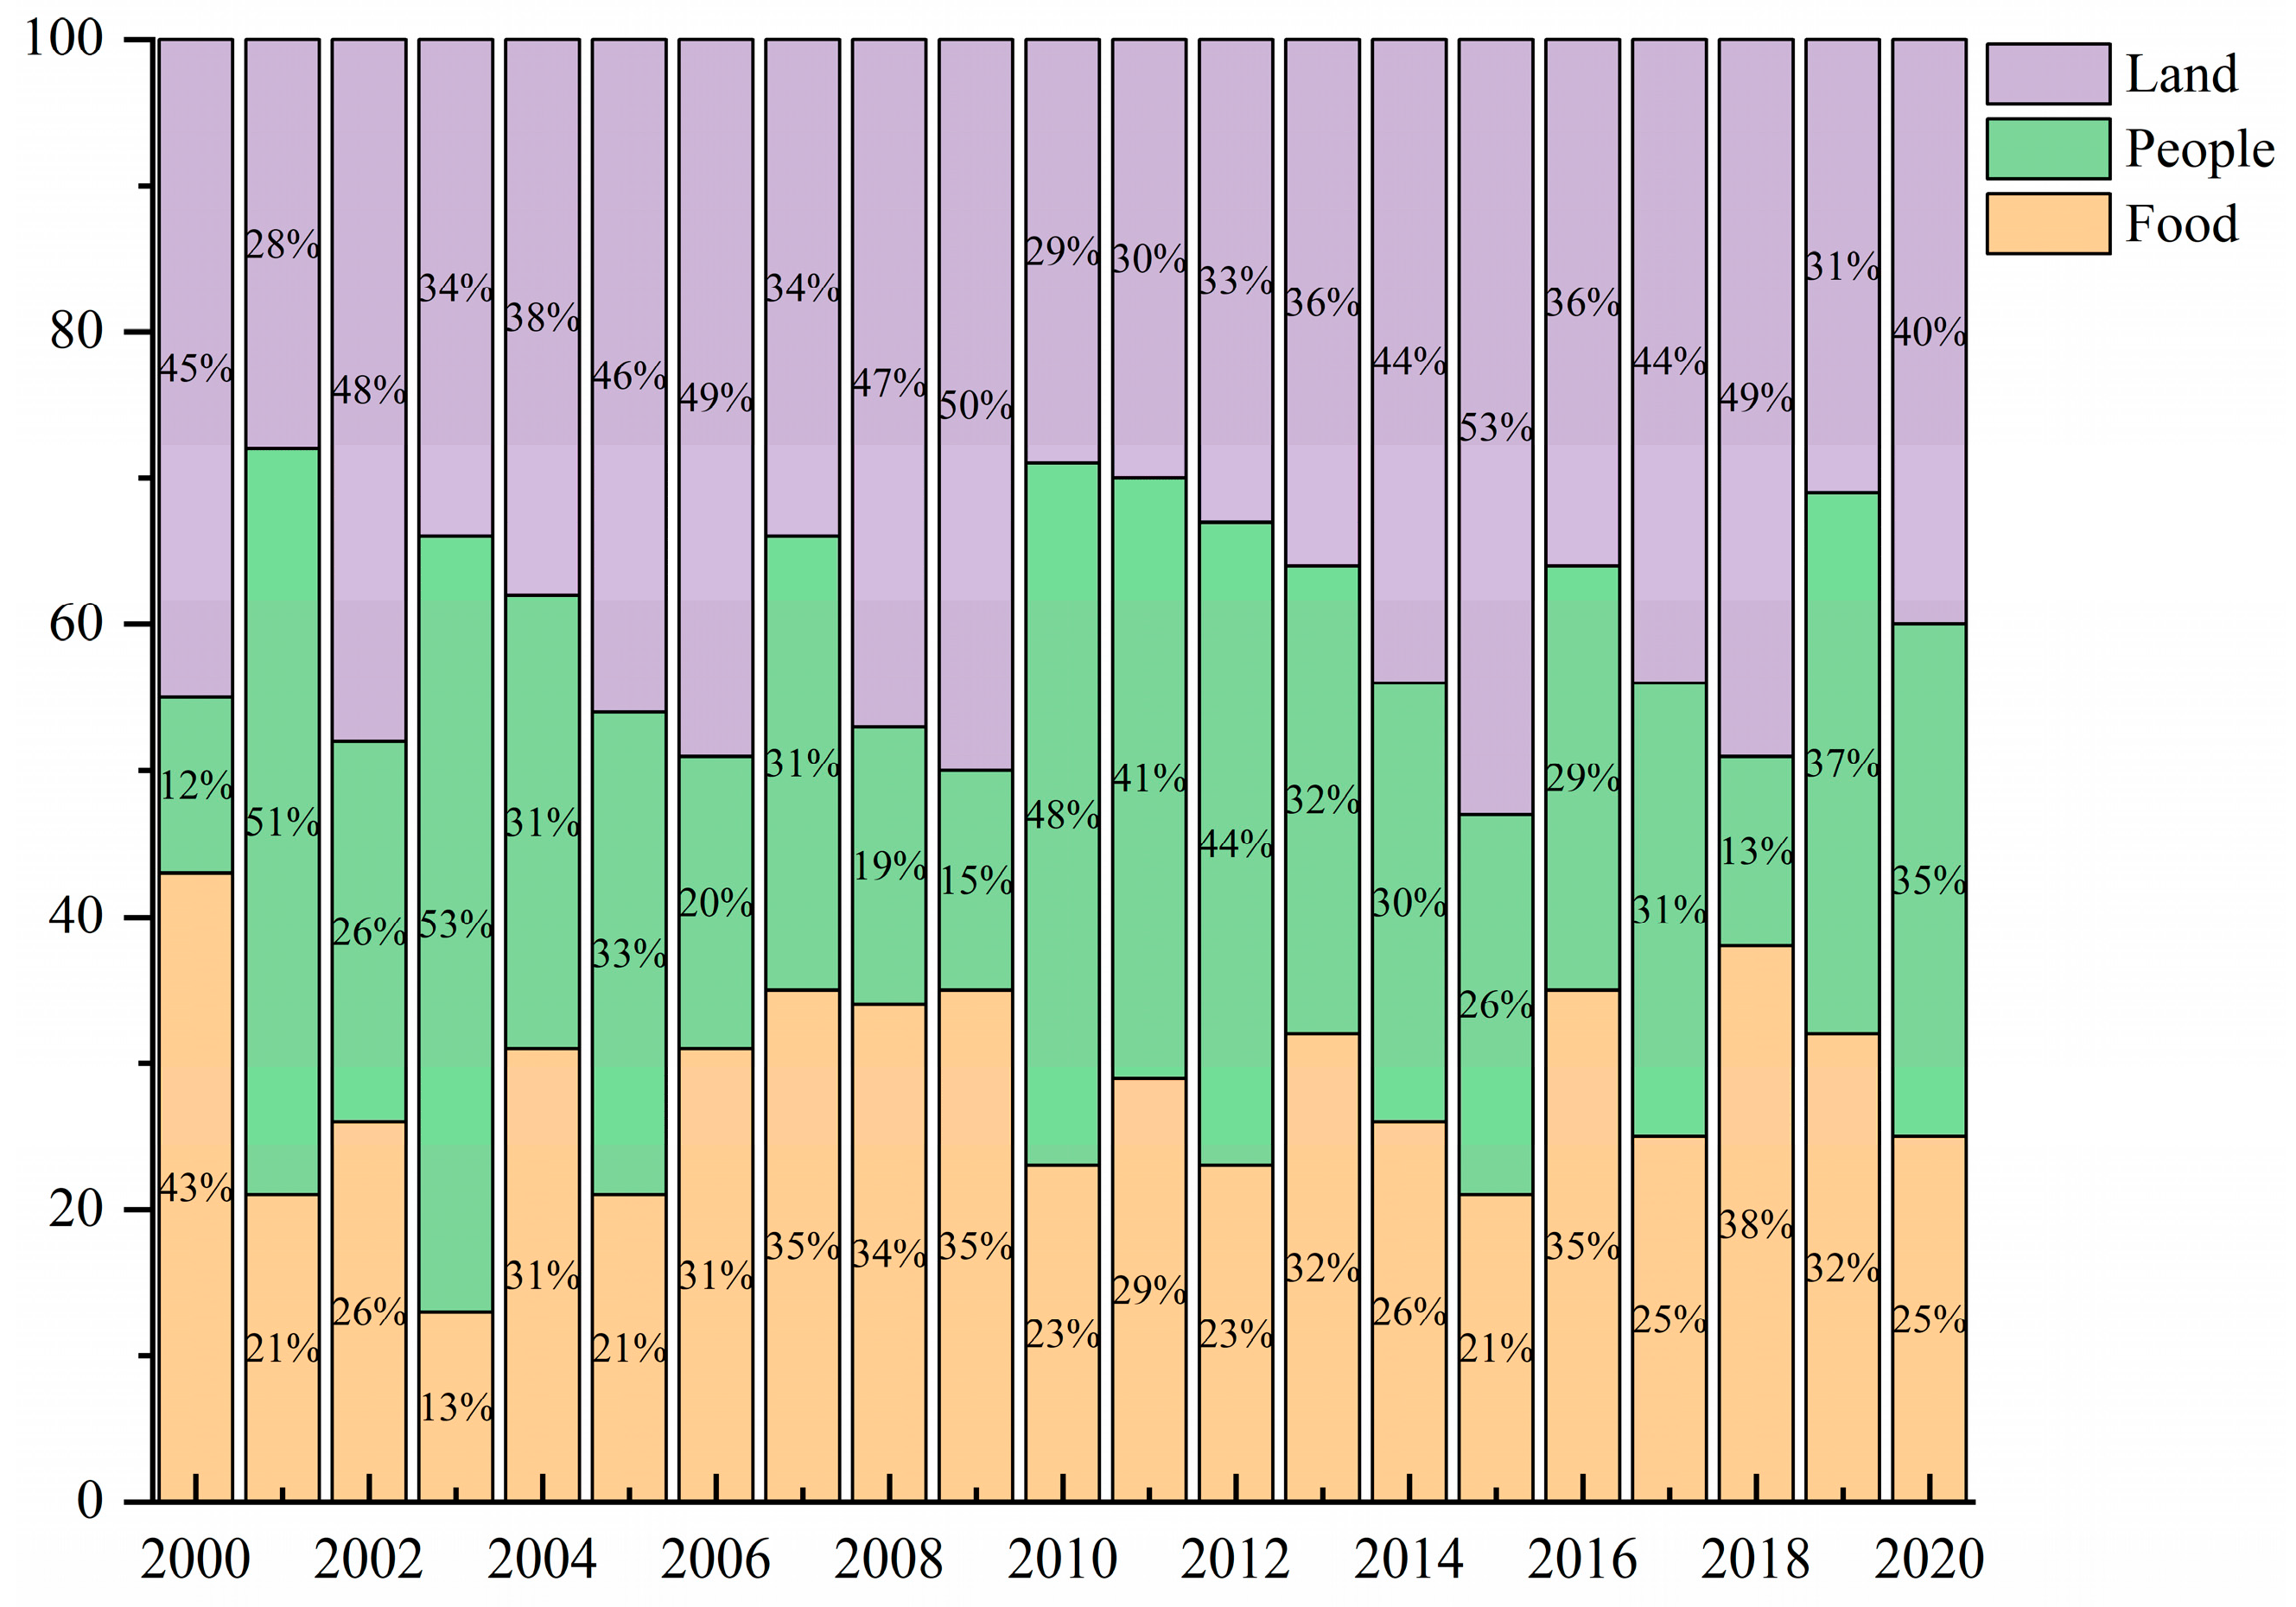
By calculating the degree of hindrance from the P-L-F subsystems to the coordinated development of the composite system from 2000 to 2020, it is evident from Figure 9 that the hindrance degree of the cultivated land and food subsystems decreased from 45% and 43% in 2000 to 40% and 25% in 2020, respectively. This is due to the advancement of high-standard farmland construction, increased mechanization in planting, cultivation, and harvesting, and improved irrigation water utilization efficiency. However, the hindrance degree of the people subsystem grew from 12% in 2000 to 35% in 2020; demographic imbalances and the outflow of rural labor have heightened demand for arable land resources and intensified pressure on food security. This implies that, although the influence of the cultivated land and food subsystems on the coordinated development of the P-L-F complex system has decreased, the people subsystem has become a more significant obstacle.
Similarly, based on the calculation of the obstacle degree at the indicator layer, Table 2 summarizes the top six obstacle factors affecting the coordinated development of the P-L-F composite system in Xinjiang. The table clearly shows that the primary barriers to the coordinated development of Xinjiang’s P-L-F composite system are the cultivated land and food subsystems. Before 2000, the top six obstacle factors mainly came from the food subsystem. The most significant hindrance indicator was C11 (grain yield per unit area), with two indicators related to food supply, one indicator related to cultivated land technology, one indicator related to population size, one related to population structure, and one related to food stability. This shows that the primary barriers to the coordinated development of Xinjiang’s P-L-F composite system in 2000 were limited food supply, poor land technology, and small population size. In 2005, three of the top six hindrance factors were from the cultivated land subsystem. The top three hindrance indicators were B22 (agricultural electricity consumption), A22 (rural labor force), and B12 (total sown area). The main challenges to coordinated development include an inefficient agricultural energy structure, insufficient rural labor, and growing pressure on cultivated land resources. In 2010, four of the top six obstacle factors were from the cultivated land subsystem, one from the population subsystem, and one from the food subsystem. The top three hindrance indicators were A11 (permanent resident population at the end of the year), C23 (primary industry output value), and B12 (total sown area), reflecting issues such as the increasing pressure on land resources, insufficient food production efficiency, and population demand for resources. The main cause of the hindrance in 2010 was the contradiction between population growth, increasing food demand, and the limited capacity of cultivated land, food production, and resource allocation. In 2015, three of the top six obstacle factors were from the cultivated land subsystem. The top three hindrance indicators were C12 (five-year average food production), B22 (agricultural electricity consumption), and A11 (permanent resident population at the end of the year). The outflow of labor and aging population structure have led to a decline in manual cultivation capacity, driving shifts in farmland utilization toward “abandoned/fragmented cultivation” or reduced investment in labor-intensive plots. This, in turn, has limited the adoption of large-scale mechanization and efficient water–fertilizer integration facilities, thereby affecting the effective cultivated area and grain output. In 2020, three of the top six obstacle factors were from the cultivated land subsystem, two from the food subsystem, and one from the population subsystem. The top three hindrance indicators were B31 (agricultural fertilizer application), C23 (primary industry output value), and B12 (total sown area), indicating that increasing agricultural ecological pressure, insufficient food production efficiency, and the continuing contradiction between resources and population were the primary barriers to the coordinated development of Xinjiang’s P-L-F composite system in 2020. In particular, the transmission pathways of B31 through ecosystems include soil compaction, groundwater and surface water pollution, and declining farmland biodiversity. While it may sustain yields in the short term, it reduces land’s sustainable productivity and grain quality over the long term, thereby imposing counterproductive constraints on the food subsystem.

5. Discussion

5.1. Focusing on the Dynamic Development of the P-L-F System in Xinjiang

Between 2000 and 2020, Xinjiang’s P-L-F complex system, along with its three subsystems, demonstrated a growth trend. This can be attributed to the sustained influx of capital, technology, and skilled labor driven by China’s Western Development Strategy and the Belt and Road Initiative. Accelerated outward-oriented opening-up, coupled with expedited infrastructure and logistics corridor development, has provided crucial support for farmland expansion, enhanced grain production capacity, and population mobility. Specifically, Xinjiang has been incorporated into the national “opening up to the west” framework, with plans to establish it as a bridgehead for China’s opening to the outside world. Xinjiang has established economic and trade cooperation with 179 countries and regions, secured approval for four comprehensive bonded zones and four cross-border e-commerce pilot zones, launched two market procurement trade pilot programs, and cultivated 29 overseas warehouses (port warehouses). It is accelerating comprehensive, multi-domain exchanges and cooperation with countries participating in the Belt and Road Initiative, thereby promoting high-quality trade development [53,54,55]. Based on this, Xinjiang leverages its advantages in integrating internal resources and utilizing oasis farmland to drive the coordinated development of its population, arable land, and food systems. The successful integration of internal resources and Xinjiang’s unique natural conditions has played a key role in supporting the sustainable development of its P-L-F complex system. However, the overall sustainability of Xinjiang’s P-L-F system remains relatively low compared to its three subsystems, a pattern that distinguishes it from other regions in China. This highlights the significant limitations on sustainable development in arid areas, where the scarcity of oasis land resources poses a major challenge to the region’s long-term sustainability [40]. Xinjiang’s population development level is relatively high, with a general upward trend in population development. This is evidenced by the overall continuous growth in the level of urbanization at the county level in Xinjiang from 2000 to 2020 [56]. Cultivated land utilization is currently the lowest, yet it experiences the highest annual growth rate. This indicates a significant expansion of cultivated land in Xinjiang from 2000 to 2020, albeit with spatial variations in its growth. It has been confirmed that as the area of cultivated land has increased, its overall productivity has consistently improved [57,58]. In various regions of Xinjiang, innovative practices in multiple-crop farming systems have transformed traditional two-crop practices into techniques such as arch greenhouse cover and vertical farming, shifting from two crops per year to three or more harvests [59]. As suitable large-scale production technologies and advanced farming machinery have been increasingly promoted, grain production capacity has grown at an average annual rate of 1.9%. Currently, research on the P-L-F complex system in Xinjiang is limited, but extensive studies have been conducted in areas such as cultivated land utilization and transformation [60]. Therefore, by comparing with these studies, this paper aims to explore relevant patterns.

5.2. Promoting the Adaptability Transition of the Complex and Dual Systems

The adaptability of Xinjiang’s P-L-F complex system is generally at a moderate-to-high level, closely related to its development characteristics. Xinjiang, situated in the less developed northwest of China, grapples with issues like water shortages and a vulnerable ecological system. Despite these challenges, its natural resources and growth potential offer distinct benefits for the adaptability of its P-L-F complex system. Since 2013, the region has seen steady growth in both population and cultivated land area [9,61], the comprehensive development index of the population and cultivated land subsystems has progressively exceeded that of the food subsystem. This suggests that, throughout Xinjiang’s development, strategic adjustments to the agricultural production structure—considering population growth and efficient land use—have facilitated better allocation of cultivated land resources. This, in turn, has supported the balanced growth of food production alongside other socio-economic activities [62]. From 2000 to 2020, Xinjiang’s P-L-F complex system adaptability improved due to coordinated development in population, land, and food subsystems. Rapid growth in population and land, along with steady food improvements, narrowed subsystem gaps and enhanced overall adaptability. Extremely mismatched regions declined, while relatively adaptable areas increased, reflecting better resource use, agricultural production, and population needs alignment. Though highly adaptable, People–Land areas dropped from 16% to 4%; extreme mismatches also lessened, showing overall system optimization and sustainable regional development, supporting high-quality growth and ecological progress in Xinjiang [63,64,65]. In recent years, driven by policy initiatives and technological advances, although achieving high adaptability remains difficult, visible progress has been made. The changes in the People–Food system are more notable, with the proportion of extremely mismatched regions sharply decreasing from 26% in 2000 to 14% in 2020. Although the proportion of highly adaptable regions remains low, the overall adaptability has improved, reflecting a gradual improvement in the alignment between population demands and food production [66]. The Land–Food system has seen a slight decrease in the proportion of extremely mismatched regions, while the proportion of relatively adaptable regions has increased from 16% in 2000 to 23% in 2020, suggesting some improvement in the land–food relationship. In contrast to the People–Food system, the proportion of moderately adaptable regions in the Land–Food system showed a significant decrease between 2000 and 2010. Although it has rebounded since then, it has not returned to its original level. This is closely linked to Xinjiang’s distinctive geographical conditions and economic development approach. As an arid and semi-arid area, the region’s agricultural output heavily relies on water resources [67]. The uneven distribution of water resources and the region’s fragile ecological environment continue to pose significant challenges to the adaptability of the Land–Food system. The underdeveloped high-altitude border areas and the region’s unbalanced development remain prominent issues. To implement differentiated governance based on P-L-F suitability, it is recommended to adopt a strategy of “zonal approaches, localized solutions, and quantified objectives.” Specifically, for highly unsuitable regions such as Habahe, Moyu, and Minfeng, prioritize food security and water resource efficiency by concentrating funds and technology to promote drip irrigation under plastic film and water–fertilizer integration, introduce drought-tolerant varieties, and establish ecological compensation mechanisms for cultivated land. For suitable regions like Qitai and Jimsar, efforts should focus on consolidating high-standard farmland, enhancing precision management and extending industrial chains. This includes promoting mechanization and digital agriculture technology demonstrations, as well as improving storage and processing systems.

5.3. Analyzing the Barrier Factors of the Complex System’s Adaptability

The constraint from cultivated land and food subsystems on Xinjiang’s P-L-F coordination has weakened, while population constraints have grown due to uneven subsystem development. Initially underdeveloped, the population subsystem became dominant as the food subsystem’s progress lagged. Key barriers include inefficient agricultural practices, low mechanization, excessive fertilizer use, and poor land resource utilization [68]. The high barrier degree of the population subsystem is primarily caused by a low number of permanent residents at the end of the year and a shortage of rural labor. Due to economic development and urbanization, some laborers have migrated from rural areas to cities or gone out to work, resulting in labor shortages in certain rural regions. This has an impact on agricultural output and the sustainable growth of the rural economy [69]. Through the diagnosis of barrier factors, we observe that in the evolution of Xinjiang’s P-L-F complex system, as food production increases and cultivated land resources are utilized more efficiently, the synergistic effect between the food and cultivated land subsystems and the population subsystem has strengthened. The population subsystem gradually surpasses the food subsystem, becoming the dominant driver of integrated development in Xinjiang’s P-L-F complex system. At the same time, the food subsystem has increasingly become the key limiting factor for the coordinated growth of the complex system. To address these obstacles, a differentiated and actionable regulatory framework should be established in conjunction with Xinjiang’s rural revitalization strategy and land use master plan to enhance internal coordination within the system. In agricultural production, a closed-loop mechanism encompassing “soil testing–formula fertilization–effectiveness evaluation” should be established. This involves improving the soil nutrient monitoring network and transitioning fertilizer subsidies from “quantity-based distribution” to “performance-based allocation.” Differentiated incentives should be provided to farmers who implement formula fertilization, reduce fertilizer usage while increasing efficiency, and maintain stable yields, thereby curbing excessive fertilizer use at its source. In the Tarim Basin and the irrigation areas at the northern foothills of the Tianshan Mountains, accelerate the adoption of drip irrigation and variable-rate fertilization technologies. Advance integrated water–fertilizer precision management to achieve efficient water resource utilization and coordinated nutrient uptake. To address rural labor shortages, establish regional agricultural machinery socialized service centers and cross-regional operation alliances in demonstration areas like Changji, Mulun, and Hami. Promote machinery sharing and contracted operations to increase agricultural mechanization coverage and alleviate seasonal labor pressures. Simultaneously, improve systems for attracting rural talent back to agriculture and professional agricultural training. Establish a three-tiered county–township–village platform for skill development and digital labor matching. Through a coordinated mechanism of “skills training–job placement–policy incentives,” strengthen rural residents’ willingness to remain in and revitalize agriculture.

5.4. Limitations and Outlook

This study provides a certain scientific basis for analyzing the relationship between P-L-F systems in Xinjiang and other arid regions, but there are still some limitations. On one hand, due to the lack of regional microdata, there are limitations in the evaluation indicators of the P-L-F system. For example, indicators such as the Engel’s coefficient, rural labor force education years, and plastic film usage were not included. As a result, factors such as residents’ economic capacity, poverty levels, production efficiency, and land sustainability were not considered, which may lead to potential biases in the evaluation of the adaptability of the P-L-F system. On the other hand, the study did not investigate the influencing factors or the operational mechanisms behind the adaptability of the P-L-F complex system. Future research will incorporate the Geodetector model to conduct spatial stratified analysis of natural, social, and economic variables (such as precipitation, temperature, and the number of food-processing enterprises). This approach will quantitatively assess the explanatory power of individual factors and their interactions on system adaptability, thereby contributing to the development of more precise adaptation enhancement strategies for different regions of Xinjiang.

6. Conclusions

Grasping the interactions between the P-L-F complex systems is essential for promoting the region’s sustainable development. This study focuses on the county and city levels in Xinjiang, assessing the individual People, Land, and Food systems, as well as their integration, while examining their spatiotemporal dynamics. To evaluate the adaptive development of Xinjiang’s P-L-F complex system, an indicator system was developed using the Entropy Weight method, a comprehensive adaptability evaluation model, and a barrier degree model. The study measures and tests the overall development level, adaptability status, and constraint forces of the P-L-F systems, providing detailed analysis from both temporal and spatial perspectives. The main conclusions are as follows:
The study first calculated the comprehensive evaluation index of Xinjiang’s P-L-F subsystems and the integrated system. The average annual growth rate of the P-L-F complex system’s comprehensive index was 1.39%, with the annual growth rates of the three subsystems—People, Land, and Food—being 0.32%, 1.99%, and 1.9%, respectively. Spatial visualization of the integrated system’s overall level revealed that the central region had a higher comprehensive level compared to the southern and northern regions.
From 2000 to 2020, the adaptability of Xinjiang’s P-L-F complex system showed a general upward trend with fluctuating changes. Adaptability levels across different regions of Xinjiang exhibited significant differences. Southern Xinjiang initially showed lower adaptability, but it gradually improved over time, whereas northern Xinjiang consistently maintained a higher level of adaptability. The adaptability of the People–Land, People–Food, and Land–Food dual systems showed a gradual improvement, with the proportion of highly adaptable levels still being low in some systems, but the proportion of extremely unsuitable levels decreased, and the relatively adaptable levels slightly increased.
In the early stages of the study, the main obstacles to the adaptive development of Xinjiang’s P-L-F complex system were the cultivated land and food subsystems, with the population subsystem having a relatively small barrier degree. During the intermediate stage, the barrier degree of the population subsystem increased notably, while those of the cultivated land and food subsystems decreased; this led to a reduction in the disparity between the barrier levels of the subsystems. By the end of the study period, the barrier levels of the population and cultivated land subsystems had risen, while the barrier degree of the food subsystem decreased. Building on the above findings, several policy recommendations are put forward. The rapid growth of the population and cultivated land subsystems has been key to improving the adaptability of Xinjiang’s P-L-F system. Optimizing the use of cultivated land has been key to further enhancing the region’s adaptability. Increasing the efficiency of land use is vital for improving the region’s overall adaptability. It has prioritized food security, promoting a new approach that focuses on “ensuring basic grain self-sufficiency and absolute security in staple foods”, and has also made significant efforts to enforce the strictest cultivated land protection policies, advance structural reforms in agricultural supply, and strengthen food security capabilities. Xinjiang, as an autonomous region in northwest China, has vast land resources, including a large amount of cultivated land. However, due to its remote location and challenging climate, the cultivated land utilization rate in Xinjiang remains relatively low. Therefore, the development of cultivated land in the region must align with the goals of agricultural modernization and sustainable growth. Furthermore, with the continued progress of the Belt and Road Initiative and the Western Development strategy, Xinjiang is rapidly constructing a comprehensive transportation network, positioning itself as a key hub linking the Eurasian continent. Its role as the “Golden Passage” for opening to the west is increasingly prominent. To fully leverage Xinjiang’s strategic position in the Belt and Road Initiative, the government should attract high-level scientific and technological talent and professionals to meet the regional economic development needs. Open population policies should be implemented to promote the employment and entrepreneurship of outstanding domestic and international talents, achieving population diversification and internationalization. At the same time, it is essential to maintain a moderate-to-high economic growth rate, focus on improving the quality and efficiency of economic development, deepen industrial cooperation, promote the rational layout of industries, and enhance Xinjiang’s overall economic strength. For regions with extremely low adaptability, such as Minfeng, Qiemo, and Burqin, which have relatively weak resource and environmental carrying capacities, it is necessary to strengthen infrastructure construction, especially by improving agricultural modernization levels, optimizing industrial structures, encouraging the growth of specialized agriculture and the agricultural processing sector, enhancing resource allocation efficiency, and rationally planning land use. For both northern and southern Xinjiang, natural resource development, utilization, protection, and restoration should be coordinated. Evaluations of resource and environmental carrying capacities, along with land suitability for development, should be conducted based on distinct functional zones. This involves scientifically defining spatial boundaries for ecology, agriculture, and urban areas, as well as establishing ecological protection zones, permanent basic farmland, and limits for urban development. A differentiated and coordinated long-term development mechanism should be established for the functional areas of southern Xinjiang, northern Xinjiang, and urban–rural areas.

Author Contributions

X.Z.: Conceptualization, Methodology, Writing—original draft. A.K.: Conceptualization, Methodology, Supervision, Funding acquisition, Writing—review and editing. Y.Z.: Methodology. X.A.: Software, Investigation. B.S.: Software. N.S.: Methodology. All authors have read and agreed to the published version of the manuscript.

Funding

This study was supported by the Autonomous Region Social Science Fund Project, grant number 2025BJL040; the National Natural Science Foundation of China, grant number NO. 42361030; and the University-level Postgraduate Research and Innovation Project of Xinjiang Uygur Autonomous Region, grant number XSY202501017.

Data Availability Statement

The original contributions presented in this study are included in the article. Further inquiries can be directed to the corresponding author.

Acknowledgments

We would like to thank all the students and technicians who assisted with the fieldwork and laboratory analyses. We also appreciate the farmers who provided access to their fields for our research. Additionally, we acknowledge the anonymous reviewers for their critical feedback, which greatly improved the manuscript.

Conflicts of Interest

The authors declare no conflicts of interest.

Abbreviations

The following abbreviations are used in this manuscript:
P-L-FPeople–Land–Food
P-LPeople–Land
P-FPeople–Food
L-FLand–Food
VIFVariance Inflation Factor

References

  1. Fei, L.; Shuang, M.; Xiaolin, L. Changing Multi-Scale Spatiotemporal Patterns in Food Security Risk in China. J. Clean. Prod. 2023, 384, 135618. [Google Scholar] [CrossRef]
  2. Godfray, H.C.J.; Beddington, J.R.; Crute, I.R.; Haddad, L.; Lawrence, D.; Muir, J.F.; Pretty, J.; Robinson, S.; Thomas, S.M.; Toulmin, C. Food Security: The Challenge of Feeding 9 Billion People. Science 2010, 327, 812–818. [Google Scholar] [CrossRef]
  3. Kong, X. China Must Protect High-Quality Arable Land. Nature 2014, 506, 7. [Google Scholar] [CrossRef]
  4. Liang, X.Y.; Jin, X.B.; Sun, R.; Han, B.; Ren, J.; Zhou, Y.K. China’s Resilience-Space for Cultivated Land Protection under the Restraint of Multi-Scenario Food Security Bottom Line. Acta Geogr. Sin. 2022, 77, 697–713. [Google Scholar]
  5. Chen, H.; Tan, Y.; Xiao, W.; He, T.; Xu, S.; Meng, F.; Li, X.; Xiong, W. Assessment of Continuity and Efficiency of Complemented Cropland Use in China for the Past 20 Years: A Perspective of Cropland Abandonment. J. Clean. Prod. 2023, 388, 135987. [Google Scholar] [CrossRef]
  6. Zhang, J. Regional Differences in China’s Man-Food Nexus and National Food Security. Econ. Geogr. 2009, 29, 1894–1897+1917. [Google Scholar]
  7. Verburg, P.H.; Mertz, O.; Erb, K.-H.; Haberl, H.; Wu, W. Land System Change and Food Security: Towards Multi-Scale Land System Solutions. Curr. Opin. Environ. Sustain. 2013, 5, 494–502. [Google Scholar] [CrossRef]
  8. Liu, Y.X.; Fu, B.J.; Wang, S.; Li, Y.; Zhao, W.; Li, C. A Review of Research on Water-Food-Ecology Linkages in Coupled Human-Land Systems in Dry Areas. J. Geogr. Sci. 2021, 40, 541–555. [Google Scholar]
  9. Yin, R.; Wang, Z.; Xu, F. Multi-Scenario Simulation of China’s Dynamic Relationship between Water–Land Resources Allocation and Cultivated Land Use Based on Shared Socioeconomic Pathways. J. Environ. Manag. 2023, 341, 118062. [Google Scholar] [CrossRef] [PubMed]
  10. Yang, W.Z.; Guo, S.; Yu, L.; Zhang, P. Spatiotemporal Variation of Coordinated Development Relationship between Population, Cultivated Land and Grain in Cangzhou City. Res. Soil Water Conserv. 2016, 23, 253–259. [Google Scholar]
  11. He, Y.Q.; Yi, X.; Pan, X.Y.; Qian, S. Spatial-Temporal Evolution of Coordination Degree of the Compound System among the Population, Cultivated Land and Grain in the Yangtze River Economic Zone. J. Nanchang Univ. Nat. Sci. 2016, 40, 381–388. [Google Scholar]
  12. Radwan, T.M.; Blackburn, G.A.; Whyatt, J.D.; Atkinson, P.M. Dramatic Loss of Agricultural Land Due to Urban Expansion Threatens Food Security in the Nile Delta, Egypt. Remote Sens. 2019, 11, 332. [Google Scholar] [CrossRef]
  13. Prăvălie, R.; Patriche, C.; Borrelli, P.; Panagos, P.; Roșca, B.; Dumitraşcu, M.; Nita, I.-A.; Săvulescu, I.; Birsan, M.-V.; Bandoc, G. Arable Lands under the Pressure of Multiple Land Degradation Processes. A Global Perspective. Environ. Res. 2021, 194, 110697. [Google Scholar] [CrossRef]
  14. Berchin, I.I.; Nunes, N.A.; de Amorim, W.S.; Zimmer, G.A.A.; da Silva, F.R.; Fornasari, V.H.; Sima, M.; de Andrade, J.B.S.O. The Contributions of Public Policies for Strengthening Family Farming and Increasing Food Security: The Case of Brazil. Land Use Policy 2019, 82, 573–584. [Google Scholar] [CrossRef]
  15. Mahmood, Z.; Iftikhar, S.; Saboor, A.; Khan, A.U.; Khan, M. Agriculture Land Resources and Food Security Nexus in Punjab, Pakistan: An Empirical Ascertainment. Food Agric. Immunol. 2016, 27, 52–71. [Google Scholar] [CrossRef]
  16. Ma, N.; Li, X. Study on Spatial and Temporal Changes of Cultivated Land Utilization and Food Security Guarantee in Ningbo City. Master’s Thesis, Zhejiang Gongshang University, Hangzhou, China, 2023. [Google Scholar]
  17. Nath, R.; Luan, Y.; Yang, W.; Yang, C.; Chen, W.; Li, Q.; Cui, X. Changes in Arable Land Demand for Food in India and China: A Potential Threat to Food Security. Sustainability 2015, 7, 5371–5397. [Google Scholar] [CrossRef]
  18. Molotoks, A.; Smith, P.; Dawson, T.P. Impacts of Land Use, Population, and Climate Change on Global Food Security. Food Energy Secur. 2021, 10, e261. [Google Scholar] [CrossRef]
  19. Feng, Z.; Li, X. Strategies for Arable Land and Food Security: Hiding Food in the Soil and Improving the Comprehensive Production Capacity of China’s Land Resources. Geogr. Territ. Res. 2000, 16, 1–5. [Google Scholar]
  20. Tan, S.; Hu, B.; Kuang, B.; Zhou, M. Regional Differences and Dynamic Evolution of Urban Land Green Use Efficiency within the Yangtze River Delta, China. Land Use Policy 2021, 106, 105449. [Google Scholar] [CrossRef]
  21. Horvat, A.; Behdani, B.; Fogliano, V.; Luning, P.A. A Systems Approach to Dynamic Performance Assessment in New Food Product Development. Trends Food Sci. Technol. 2019, 91, 330–338. [Google Scholar] [CrossRef]
  22. Akinbode, S.O.; Dipeolu, A.O.; Bolarinwa, T.M.; Olukowi, O.B. Effect of Health Outcome on Economic Growth in Sub-Saharan Africa: A System Generalized Method of Moment Approach. J. Econ. Dev. 2021, 23, 254–266. [Google Scholar] [CrossRef]
  23. Roer, A.-G.; Korsaeth, A.; Henriksen, T.M.; Michelsen, O.; Strømman, A.H. The Influence of System Boundaries on Life Cycle Assessment of Grain Production in Central Southeast Norway. Agric. Syst. 2012, 111, 75–84. [Google Scholar] [CrossRef]
  24. Wang, X.; Qiang, W.; Niu, S.; Growe, A.; Yan, S.; Tian, N. Multi-Scenario Simulation Analysis of Grain Production and Demand in China during the Peak Population Period. Foods 2022, 11, 1566. [Google Scholar] [CrossRef]
  25. Li, W.; Li, Y.; Zhao, Y.; Zhu, Y.; Li, Y.; Song, Q.; Jiang, S.; Xing, X.; Wang, H.; Liu, K. Multidimensional Evolution Analysis of Water-Energy-Food Nexus System—Taking Beijing-Tianjin-Hebei Region as an Example. China Water Resour. 2025, 2025, 1–13. [Google Scholar]
  26. Shi, M.; Wu, H.; Jiang, P.; Zheng, K.; Liu, Z.; Dong, T.; He, P.; Fan, X. Food-Water-Land-Ecosystem Nexus in Typical Chinese Dryland under Different Future Scenarios. Sci. Total Environ. 2023, 880, 163183. [Google Scholar] [CrossRef] [PubMed]
  27. Mao, D.; Wang, Z.; Wu, B.; Zeng, Y.; Luo, L.; Zhang, B. Land Degradation and Restoration in the Arid and Semiarid Zones of China: Quantified Evidence and Implications from Satellites. Land Degrad. Dev. 2018, 29, 3841–3851. [Google Scholar] [CrossRef]
  28. Wiemer, C. The Economy of Xinjiang. In Xinjiang; Routledge: Abingdon-on-Thames, UK, 2015; pp. 163–189. [Google Scholar]
  29. Gao, X.; Liu, J.; Wen, Y.; Lin, H.; Liang, Y.; Liu, M.; Zhou, Z.; Zhang, J.; Wang, Z. Estimating Future Climate Change Impacts on Wheat Yield and Water Demand in Xinjiang, Northwest China Using the DSSAT-CERES-Wheat Model. Comput. Electron. Agric. 2025, 237, 110604. [Google Scholar] [CrossRef]
  30. Chartres, C.J.; Noble, A. Sustainable Intensification: Overcoming Land and Water Constraints on Food Production. Food Secur. 2015, 7, 235–245. [Google Scholar] [CrossRef]
  31. Ma, W.; Jiang, G.; Li, W.; Zhou, T. How Do Population Decline, Urban Sprawl and Industrial Transformation Impact Land Use Change in Rural Residential Areas? A Comparative Regional Analysis at the Peri-Urban Interface. J. Clean. Prod. 2018, 205, 76–85. [Google Scholar] [CrossRef]
  32. Bao, C.; Fang, C. Dynamic Analysis on the Cultivated Area-Food-Population Complex System in the Yangtze River Basin and Its Control Approaches. Chin. J. Popul. Resour. Env. 2007, 17, 115–120. [Google Scholar]
  33. He, C.; Liu, Z.; Xu, M.; Ma, Q.; Dou, Y. Urban Expansion Brought Stress to Food Security in China: Evidence from Decreased Cropland Net Primary Productivity. Sci. Total Environ. 2016, 576, 660–670. [Google Scholar] [CrossRef]
  34. Wang, S.; Kong, W.; Ren, L.; Zhi, D. Research on Misuses and Modification of Coupling Coordination Degree Model in China. J. Nat. Resour. 2021, 36, 793–810. [Google Scholar] [CrossRef]
  35. Liu, Z.W.; Zheng, Y.; Li, Z.H.; Zhang, S.; Yang, H.; Sang, X. Evaluation on Water Resources- Economy-Population Matching Degree from Perspective of Spatial Equilibrium. Yangtze River 2023, 54, 31–39. [Google Scholar]
  36. Toops, S.W. The Ecology of Xinjiang: A Focus on Water. In Xinjiang; Routledge: Abingdon-on-Thames, UK, 2015; pp. 264–275. [Google Scholar]
  37. Ridwan, R.; Ismail, M. Population Growth Has an Impact on The Economy and Food Availability. J. Posthumanism 2025, 5, 2819–2827. [Google Scholar] [CrossRef]
  38. Alexandratos, N. Countries with Rapid Population Growth and Resource Constraints: Issues of Food, Agriculture, and Development. Popul. Dev. Rev. 2005, 31, 237–258. [Google Scholar] [CrossRef]
  39. Shah, F.; Wu, W. Soil and Crop Management Strategies to Ensure Higher Crop Productivity within Sustainable Environments. Sustainability 2019, 11, 1485. [Google Scholar] [CrossRef]
  40. Feng, Y.; Fanghui, Y.; Li, C. Improved Entropy Weighting Model in Water Quality Evaluation. Water Resour. Manag. 2019, 33, 2049–2056. [Google Scholar] [CrossRef]
  41. Raczka, W. Xinjiang and Its Central Asian Borderlands. Cent. Asian Surv. 1998, 17, 373–407. [Google Scholar] [CrossRef]
  42. Hu, J.; Song, M.; Zhang, L. Spatial and Temporal Evolution of Land Use Carbon Emission and Carbon Balance Zoning: Evidence from Xinjiang China. Sci. Rep. 2025, 15, 35705. [Google Scholar] [CrossRef]
  43. Qi, Y.K. Analysis of the Measurement and Evolutionary Characteristics of the Coordination Level Between Population, Economy, Resources, and Environment in Xinjiang. J. YiLi Prefect. Communist Party Inst. 2024, 4, 57–61. [Google Scholar]
  44. Vu, D.H.; Muttaqi, K.M.; Agalgaonkar, A.P. A Variance Inflation Factor and Backward Elimination Based Robust Regression Model for Forecasting Monthly Electricity Demand Using Climatic Variables. Appl. Energy 2015, 140, 385–394. [Google Scholar] [CrossRef]
  45. Liu, X.W. The Impact of Macroeconomic Indicators on Average Employee Wages. Master’s Thesis, Dongbei University of Finance and Economics, Dalian, China, 2016. [Google Scholar]
  46. Zhao, J.; Deng, C.J.; Li, W.L. Evaluation of Degradation Levels in the Bayinbuluke Grassland, Tianshan Mountains, Xinjiang, Over the Past 35 Years. Arid Zone Res. 2023, 40, 636–646. [Google Scholar]
  47. Ma, X.F.; Hu, S.L. Spatiotemporal Adaptation Characteristics and Influencing Factors of Tourism City Resilience and Residents’ Happiness Level: Taking Zhangjiajie City as an Example. Resour. Sci. 2022, 44, 2373–2385. [Google Scholar] [CrossRef]
  48. Tong, H.D.; Jun, F.C. Evaluation and Obstacle Factors of Coordination Development of Regional Water-Energy-Food-Ecology System under Green Development: A Case Study of Yangtze River Economic Belt, China. Stoch. Environ. Res. Risk Assess. 2022, 36, 2477–2493. [Google Scholar] [CrossRef]
  49. Yang, Y.; Fan, M. Analysis of the Spatial-Temporal Differences and Fairness of the Regional Energy Ecological Footprint of the Silk Road Economic Belt (China Section). J. Clean. Prod. 2019, 215, 1246–1261. [Google Scholar] [CrossRef]
  50. Xiang, L.G.; Cheng, P.L.; Qi, F.; Wei, L. Adaptability Investigation of Water Ecological Security and Socio-Ecological Resilience in Arid Inland River Basins, China. Environ. Sustain. Indic. 2025, 27, 100859. [Google Scholar] [CrossRef]
  51. Wang, Z.F.; Zhang, X.T. Evaluation of the Suitability and Impact of Human-Land-Food Composite Systems in China. Acta Geogr. Sin. 2024, 79, 779–799. [Google Scholar]
  52. Abulimiti, M.; Simayi, Z.; Yang, S.; Chai, Z.; Yan, Y. Study of Coordinated Development of County Urbanization in Arid Areas of China: The Case of Xinjiang. PLoS ONE 2022, 17, e0276235. [Google Scholar] [CrossRef] [PubMed]
  53. Li, X.; Chen, Y.; Xu, L.; Li, P.; Zhang, R. Transformation of Farmland Use and Driving Mechanism in Xinjiang since China’s Western Development Policy. Front. Ecol. Evol. 2022, 10, 942065. [Google Scholar] [CrossRef]
  54. Gu, H.X.; Gu, H.X.; Chen, H. Research on Over a Decade of Development and Future Prospects in the Core Area of the Belt and Road Initiative: With a Discussion on Coordinating the High-Quality Development of China (Xinjiang) Pilot Free Trade Zones. J. Jianghan Univ. Soc. Sci. Ed. 2024, 41, 89–103. [Google Scholar]
  55. Xu, X.; Wang, Y.Y. Measurement of Rural Revitalization Levels and Analysis of Influencing Factors in the New Era of Western Development. J. Southwest Univ. Natl. Humanit. Soc. Sci. Ed. 2021, 42, 129–137. [Google Scholar]
  56. Chen, H.M.; Yang, J.F.; Xue, Z.; Li, Q. Comprehensive Evaluation and Heterogeneity Analysis of High-Quality Agricultural Development in Xinjiang. J. Anhui Agric. Sci. 2024, 52, 261–264. [Google Scholar]
  57. Wei, B.; Kasimu, A.; Fang, C.; Reheman, R.; Zhang, X.; Han, F.; Zhao, Y.; Aizizi, Y. Establishing and Optimizing the Ecological Security Pattern of the Urban Agglomeration in Arid Regions of China. J. Clean. Prod. 2023, 427, 139301. [Google Scholar] [CrossRef]
  58. Zhang, Y.; Kasimu, A.; Zhang, X.; Song, N.; Shayiti, B.; An, X. Spatiotemporal Decoupling of Urban Expansion Intensity and Land Use Efficiency in Arid Oasis Agglomerations. Land 2025, 14, 2143. [Google Scholar] [CrossRef]
  59. Zhao, R.; Fang, C.; Liu, J.; Zhang, L. The Evaluation and Obstacle Analysis of Urban Resilience from the Multidimensional Perspective in Chinese Cities. Sustain. Cities Soc. 2022, 86, 104160. [Google Scholar] [CrossRef]
  60. Xiao, Q.S.; Wang, Y.Z. Characteristics of Spatial and Temporal Variability of NPP of Arable Land in the Main Grain-Producing Areas (Henan Province) and Analysis of Influencing Factors. Environ. Sci. 2024, 46, 3632–3644. [Google Scholar]
  61. Song, N.; Kasimu, A.; Tang, L.; Chen, J.; Zhang, Y.; An, X.; Zhang, X. A Network Perspective on Ecosystem Service Trade-Offs and Synergies Relationships and Their Spatial Pattern Optimization in Arid Regions. Environ. Technol. Innov. 2025, 40, 104584. [Google Scholar] [CrossRef]
  62. Qin, H.T. Study on the Carrying Capacity of Cultivated Land in Arid Areas Based on the Human-Food Relationship—Taking Gansu Province as an Example. J. Gansu Agric. 2023, 7, 25–30. [Google Scholar]
  63. Wang, T.; Yang, Z.; Han, F.; Yu, J.; Ma, X.; Han, J. Assessment of Tourism Socio-Ecological System Resilience in Arid Areas: A Case Study of Xinjiang, China. Ecol. Indic. 2024, 159, 111748. [Google Scholar] [CrossRef]
  64. Xia, N.; Hai, W.; Tang, M.; Song, J.; Quan, W.; Zhang, B.; Ma, Y. Spatiotemporal Evolution Law and Driving Mechanism of Production–Living–Ecological Space from 2000 to 2020 in Xinjiang, China. Ecol. Indic. 2023, 154, 110807. [Google Scholar] [CrossRef]
  65. Sun, Q.X.; Zhang, W.X. Impacts of Agricultural Land Use Changes on Ecosystem Service Values—A Case Study of Altay Region, Xinjiang. South-Cent. Agric. Sci. Technol. 2023, 44, 124–128. [Google Scholar]
  66. Jiang, S.G.; Hu, B.H. Measuring the Spatial Evolution of Cultivated Land Resources and Water Resources in Arid Zones—Taking Xinjiang as an Example. Water Resour. Dev. Res. 2023, 23, 26–32. [Google Scholar]
  67. He, J.; Ju, X.; Han, C.; Liu, L.; Zhang, H.; Adilai, S.; Li, C. Spatiotemporal Dynamics and Driving Mechanism of Eco-Environmental Quality in Piedmont-Oasis-Desert Ecotone Based on Long-Term Harmonized Remote Sensing Ecological Index-Take Korla-Tiemenguan Oasis in Xinjiang as an Example. Environ. Sustain. Indic. 2025, 26, 100611. [Google Scholar] [CrossRef]
  68. Hou, M.; Deng, Y.; Yao, S. Coordinated Relationship between Urbanization and Grain Production in China: Degree Measurement, Spatial Differentiation and Its Factors Detection. J. Clean. Prod. 2022, 331, 129957. [Google Scholar] [CrossRef]
  69. Ma, H.; Wang, Q.; Zhang, Y.; Hussain, M.B.; Xu, Y.; Tian, S.; Yuan, X.; Ma, Q.; Yuan, R.; Jia, Y. Research on Sustainable Development Evaluation and Improvement Path of Resource-Based Cities Based on Coupling of Emergy and System Dynamics. Environ. Dev. Sustain. 2024, 26, 5959–6006. [Google Scholar] [CrossRef] [PubMed]
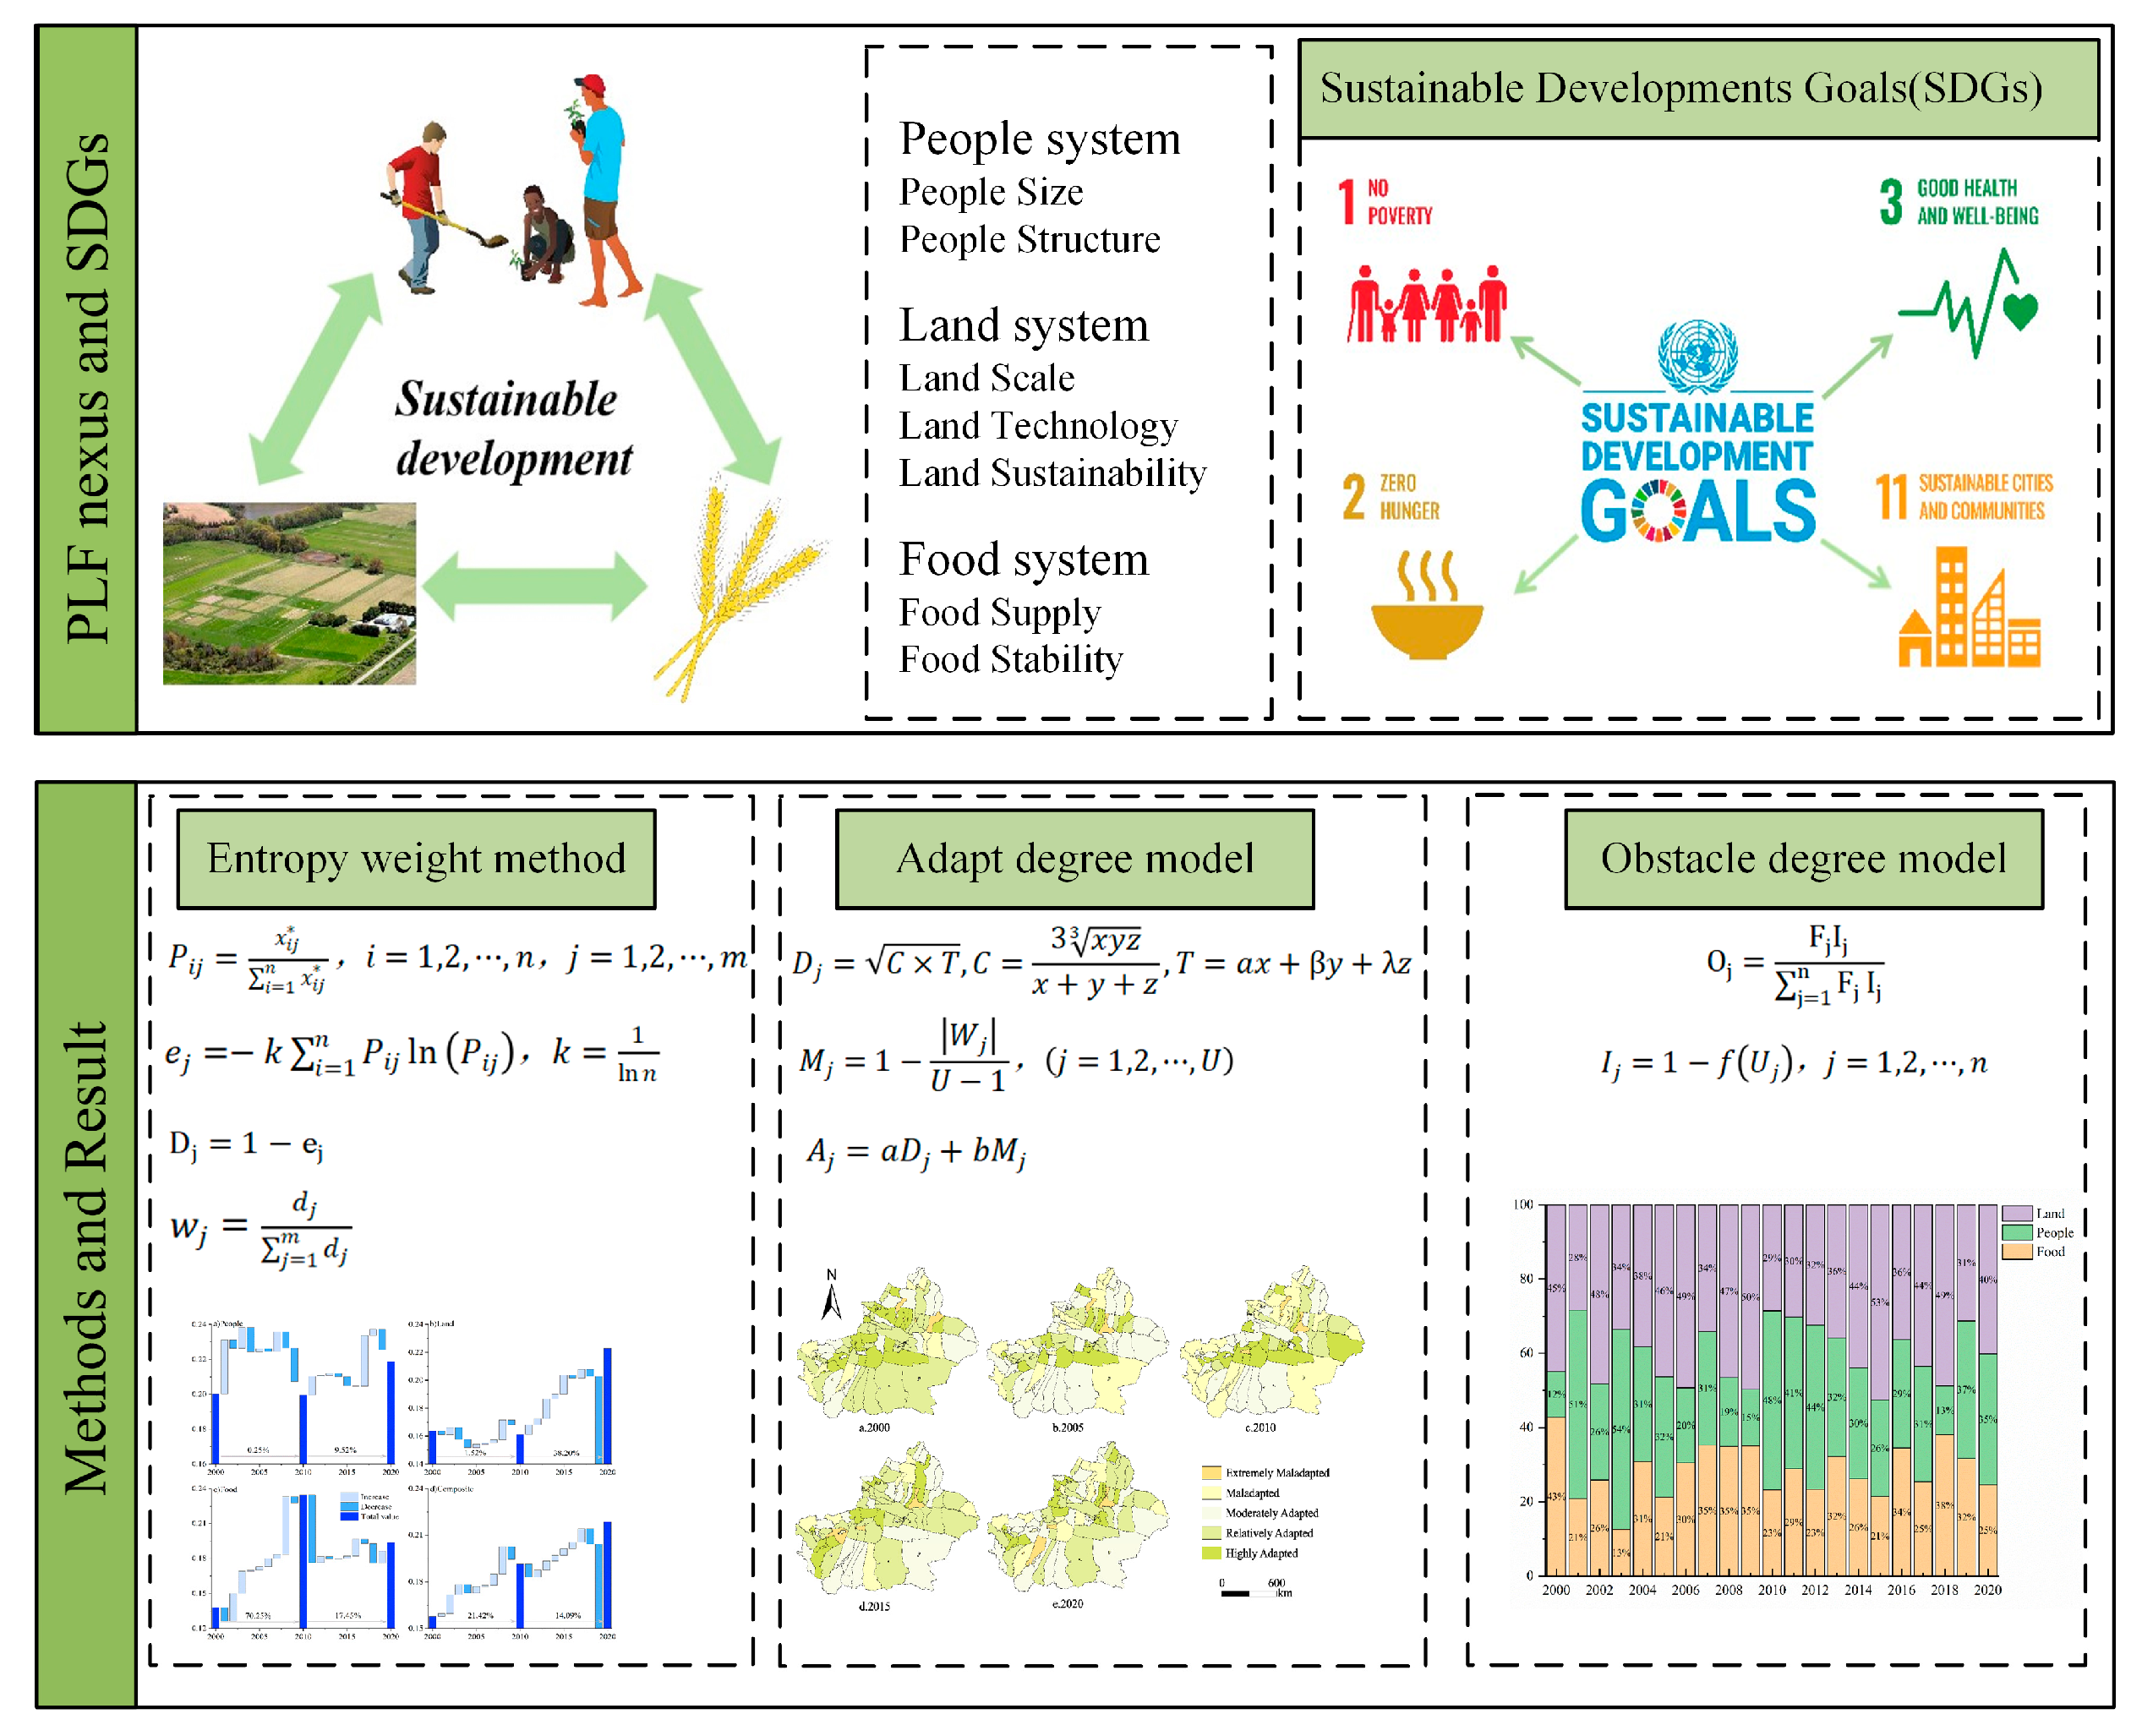
Figure 1. Research framework.
Land 14 02310 g001
Figure 2. Development mechanism of P-L-F adaptability.
Land 14 02310 g002
Figure 3. Locating the study area.
Land 14 02310 g003
Figure 4. The temporal evolution of P-L-F system in Xinjiang from 2000 to 2020.
Land 14 02310 g004
Figure 5. The spatial distribution pattern of P-L-F system in Xinjiang from 2000 to 2020.
Land 14 02310 g005
Figure 6. The spatial distribution pattern of P-L-F composite system adaptation in Xinjiang.
Land 14 02310 g006
Figure 7. The spatial evolution of P-L-F dual-system adaptation in Xinjiang.
Land 14 02310 g007
Figure 8. The temporal evolution of the adaptation of the P-L-F dual system in Xinjiang.
Land 14 02310 g008
Figure 9. Degrees of obstacles to adapted development of the P-L-F system in Xinjiang.
Land 14 02310 g009
Table 1. Evaluation index system of P-L-F composite system in Xinjiang.
SubsystemDimensionIndicator (Code)UnitWeights
People (A)Population Size (A1)Permanent Population at Year-End (A11)thousands of
people
0.080
Natural Population Growth Rate (A12)0.029
Population Structure (A2)Proportion of Non-Agricultural Population (A21)%0.034
Rural Workforce (A22)thousands of
people
0.059
Land (B)Land Scale (B1)Cultivated Land Area (B11)km20.066
Total Sown Area (B12)km20.061
Cropping Index (B13)%0.026
Land Technology (B2)Total Agricultural Machinery Power (B21)kW0.056
Agricultural Electricity Consumption (B22)kWh0.148
Land Sustainability (B3)Agricultural Fertilizer Application (B31)t0.094
Effective Irrigation Rate (B32)%0.021
Food (C)Food Supply (C1)Grain Yield per Unit Area (C11)kg/ha0.025
Five-Year Average Grain Yield (C12)t0.076
Food Stability (C2)Grain Production Fluctuation Rate (C21)%0.012
Proportion of Agricultural Output Value in Total Agricultural, Forestry, Animal Husbandry, and Fishery Output Value (C22)%0.019
Primary Industry Output Value (C23)CNY0.075
General Public Budget Expenditure (C24)CNY0.120
Note: km2 = square kilometer; ha = hectare; t = ton; kW = kilowatt; kWh = kilowatt hour; CNY = Chinese Yuan; ‰ denotes “per thousand” (one part in a thousand), while % denotes “per hundred” (one part in a hundred); ‰ and % both indicate proportion or rate.
Table 2. Obstacle degrees of the index layer of the P-L-F system in the Xinjiang (%).
YearOrder123456
2000Obstacle factors (OD%)C11 (23)B22 (18)A11 (12)C12 (9)C23 (6)A22 (5)
2001Obstacle factors (OD%)C24 (18)C23 (18)B31 (16)B12 (12)B21 (12)A22 (6)
2002Obstacle factors (OD%)C23 (20)C24 (16)B31 (12)B11 (9)A11 (8)B21 (7)
2003Obstacle factors (OD%)C24 (22)B31 (14)B22 (14)B12 (9)C12 (7)C23 (6)
2004Obstacle factors (OD%)B21 (15)C12 (13)C24 (13)B31 (12)B22 (7)A12 (7)
2005Obstacle factors (OD%)B22 (26)A22 (12)B12 (12)B11 (8)C24 (7)A11 (7)
2006Obstacle factors (OD%)B31 (16)C24 (13)B22 (12)B11 (9)C23 (9)A22 (7)
2007Obstacle factors (OD%)C24 (25)A11 (21)B21 (11)A22 (10)A12 (9)B31 (6)
2008Obstacle factors (OD%)B22 (17)B11 (17)B12 (16)C24 (10)B13 (10)C23 (9)
2009Obstacle factors (OD%)B12 (12)B31 (12)C24 (11)B21 (10)C12 (10)B11 (9)
2010Obstacle factors (OD%)A11 (15)C23 (13)B12 (11)B31 (10)B22 (8)B13 (7)
2011Obstacle factors (OD%)B22 (16)C23 (12)C12 (11)B11 (9)B21 (9)B31 (8)
2012Obstacle factors (OD%)A22 (13)B22 (12)B11 (11)A11 (10)B32 (8)C12 (7)
2013Obstacle factors (OD%)A11 (21)B11 (15)B12 (13)C24 (8)A21 (6)B31 (6)
2014Obstacle factors (OD%)B22 (23)C24 (22)B21 (11)A22 (7)B31 (5)C12 (5)
2015Obstacle factors (OD%)C12 (12)B22 (12)A11 (10)B31 (9)B11 (9)C23 (9)
2016Obstacle factors (OD%)C24 (17)A11 (13)C23 (12)B12 (11)B31 (10)B11 (8)
2017Obstacle factors (OD%)C24 (16)C12 (15)A11 (12)B22 (11)B12 (10)A22 (10)
2018Obstacle factors (OD%)C24 (20)A11 (10)B12 (10)C12 (10)B31 (8)B22 (7)
2019Obstacle factors (OD%)C24 (21)A11 (13)C23 (12)A22 (10)B22 (7)C12 (5)
2020Obstacle factors (OD%)B31 (16)C23 (14)B12 (13)B21 (10)C24 (9)A11 (6)
Disclaimer/Publisher’s Note: The statements, opinions and data contained in all publications are solely those of the individual author(s) and contributor(s) and not of MDPI and/or the editor(s). MDPI and/or the editor(s) disclaim responsibility for any injury to people or property resulting from any ideas, methods, instructions or products referred to in the content.