Abstract
With the intensification of climate change and the urban heat island effect, there is growing awareness of the role of urban greening in improving the urban climate. The aim of this study is to explore how various characteristics of green spaces—including type, configuration (size and shape), location, and distance from the urban centre—affect their cooling effect. Landsat remote sensing land surface temperature data were analysed through Geographic Information Systems, using Sheffield as a case study. The results show that the cooling effect of woodland was significantly stronger than that of grassland and urban parks, with a cooling intensity reaching up to 2.93 °C, and a cooling extent that can reach up to 500 m beyond its boundary. When closer to the city centre, both the shape and size of green spaces show a positive correlation with their cooling effect, but this relationship becomes less evident as the distance from the city centre increases. The size of a woodland had a greater effect in terms of a reduction in land surface temperature than the shape of the woodland. The findings of this study can provide a better framework for landscape architects and urban planners to plan for climate change and propose stronger green strategies to mitigate the urban heat island effect.
1. Introduction
In recent decades, largely due to global climate change and the urban heat island (UHI) effect, many cities have experienced urban warming [1]. This rise in urban heat has intensified the frequency and severity of heat events, heightening the risks for populations particularly vulnerable to extreme temperatures [2]. There is a growing awareness of the importance of leveraging natural systems for climate resilience, advocating for Nature-Based Solutions (NBSs) that utilise green spaces to lower local temperatures and lessen overall thermal stress in cities. Urban green infrastructure includes a variety of green spaces such as street trees, parks, rain gardens, private yards, and green roofs. As a strategically planned network of natural and semi-natural areas [3], green infrastructure has gained recognition as a crucial NBS for mitigating and adapting to urban heat [4,5]. A study in Glasgow (maritime temperate climate in Köppen–Geiger classification [6]) stated that raising greenspace coverage by 20% beyond current levels could reduce the city’s projected 2050 UHI effect by approximately one-third to one-half [7].
The cooling benefits of urban green spaces stem from mechanisms like plant evapotranspiration, shading, and increased albedo [8], which have been clarified by numerous reviews [8,9]. Urban green spaces typically exhibit lower air temperatures during summer compared to the surrounding built-up areas, with mean temperatures 1 to 2 °C lower [10], commonly called the “cool island effect”. Furthermore, due to the outward flow of cooler air during nighttime and early morning hours, which is known as “Park Breeze” [11], the cooling influence of green spaces often extends into surrounding urban areas. Park breeze is characterised by a divergent outflow from the green space, and its speed is less than 1 m/s [12]. It is believed that this breeze is driven by a thermally induced pressure gradient across the green space, functioning similarly to a gravity current [13,14]. The cooling effects within and beyond green space boundaries are especially evident under specific conditions: when the green space lies upwind, is positioned at a higher elevation relative to nearby urban areas, or is bordered by less-developed buffer zones. To improve the thermal conditions of the city and enhance residents’ thermal comfort, maximising the cooling effect of green spaces in surrounding urban areas has become an important research focus.
Currently, many quantitative studies have investigated the impact of green spaces on the surrounding urban thermal environment, and have summarised that the extent and intensity of this cooling effect are influenced by the local climate, the morphological characteristics of the green space, and the features of the surrounding urban environment [8,10]. In cities in temperate climate zones, regarding air temperature reduction, a study monitored the cooling effects of eight green spaces in London, found that, on average, small green spaces (ranging from 0.8 to 3.8 ha) cooled the surrounding area by 0.4 to 0.8 °C of nocturnal air temperature over a distance of approximately 30–120 m beyond their boundaries. Medium-sized green spaces (ranging from 10.1 to 12.1 ha) cooled the surrounding area by 0.6 to 1.0 °C over approximately 180–330 m [15]. According to another field measurement in London, the nocturnal cooling influence of green spaces could reach as far as 440 m beyond their boundaries, with an average extent of 125 m. The cooling effect was observed to decline with distance, decreasing at an average rate of 1.4% per metre [16]. Regarding land surface temperature (LST) reduction, a study in Copenhagen found that, during summer, 95% of blue-green spaces exhibit a cooling effect within a range of 60 to 210 m, with an average cooling extent of 150 m and an intensity of 2.47 °C. In spring, autumn, and winter, the mean cooling extent and intensity are 105 m and 1.53 °C; 120 m and 1.36 °C; and 90 m and 0.26 °C, respectively [17].
Although a large number of studies on the cooling effects beyond green spaces already exist, their research focus are often broadly referred to as “urban green spaces.” According to De Haas, Hassink and Stuiver (2021), urban green space is defined as urban land, partly or completely covered with grass, trees, shrubs, or other vegetation [18]. Due to differences in the types of vegetation cover (land cover), green spaces’ impact on the surrounding thermal environment may vary. There is currently no unified definition for the classification of green spaces. Parks are the predominant type of urban green space discussed in the literature relating to use and preference [19]. The cooling effect of parks has been confirmed by numerous studies [8]: for air temperature, a meta-analysis based on 89 studies showed that parks can reduce air temperature by 1.5–3.5 °C. As for LST, due to the better thermal conductivity of solid surfaces compared with air, parks have an even greater cooling potential [20]. Remote sensing studies have observed reductions in LST ranging from 1.9 to 6.7 °C over 60–120 m spatial footprints [8]. However, one problem with analysing parks as the units of analysis is that their land cover (and therefore heat reduction capacity) can be highly varied—including areas of trees, lawn, rocks, soil, water, build environments and so forth [21]. In contrast, many studies classify green spaces through their land cover as either tree-dominated, shrub-dominated, or grass-dominated identified using visual interpretation or machine learning methods [17,22]. For instance, Yang et al. defined tree-covered and grass-covered green spaces as areas covered by more than 80% trees/grassland [17]. By comparing LST across four seasons, they found that no matter which season, tree-covered green spaces are better than grass-covered green spaces in summer cooling or in winter warming. In summer, the cooling extent and intensity of tree-covered green spaces could meet 145 m, 3.58 °C, but grass covered were 105 m, 2.21 °C [17]. Jonsson [23] and Wong et al. [24] also found similar conclusions, namely that the cool island effect of different types of green space differs obviously, trees provide the highest, while the shrubs and the grass provide the lowest.
In addition, the characteristics of the green space also have a significant impact on its cooling effect. Regarding green space’s morphology characteristics, many researchers choose to use certain patch-level metrics to describe their configuration. For example, the size (area) of patches has been found to provide a significant positive correlation with green space cooling effect in all climate zones [10]. Based on a systematic review [25], the Shape index (SHAPE) is one of the most frequently used 2D metrics. It is often analysed with LST-related indicators, such as cooling intensity, cooling distance, and cooling gradient, typically through bivariate analysis methods such as correlation and OLS (ordinary least squares) regression. The relationship between patch complexity and its cooling effect, however, varies from scholar to scholar, and whilst some studies show positive effects [17,26,27] others are negative [28,29]. A meta-analysis from Li et al. identified consistent negative correlations between Shape index values and LST; however, the sample size of these meta-analyses is very small (only 4–9 studies) [25]. Therefore, the relationship between 2D metrics and the green space cooling effect still requires further research for confirmation. On the other hand, the location of green spaces and the distance from the urban centre also influence their cooling effect. A study in Beijing found that the cooling benefits provided by green spaces varied across urban zones, with the middle-distance zone demonstrating a markedly higher contribution compared to the inner and outer zones. They attributed these differences to variations in the underlying surface structure and land cover typical of urban versus rural areas [30].
Despite previous empirical research regarding the cooling effect outside green spaces, an issue of conceptual and practical significance has remained inadequately understood; although the relationship between the cooling effect of broadly green spaces on their surrounding urban thermal environments and their characteristics has been extensively explored through quantitative studies, further research is needed to understand how the subtypes of green space influence this relationship. It remains unclear which specific characteristics of different types of green spaces—such as parks, woodlands, or grasslands, respectively, in urban or suburban areas—have the greatest impact on their cooling effect, and to what extent. While the general correlations have been well established by previous research, more detailed and refined studies are essential to provide targeted guidance for urban and landscape design.
Given the knowledge gap mentioned above, this study aims to quantitatively investigate how various characteristics of green spaces, including type, configuration (size and shape), and location, (distance to urban centre—reflecting an urban–rural gradient), affect their cooling effect. This study used green spaces in Sheffield, UK, as a case study. Based on remote sensing data and Geographic Information System (GIS) analysis, this study employed multiple metrics, such as cooling intensity, cooling extent, and comparisons with baseline land surface temperatures, to examine the cooling impact of green spaces on the surrounding built environment. The findings could provide targeted recommendations for urban designers, landscape architects, and policymakers seeking to improve the urban thermal environment and enhance residents’ thermal comfort.
The structure of this manuscript is as follows. In Section 2 (Materials and Methods), we introduce the study area (i.e., Sheffield) and its climatic context, the methods for acquiring and processing remote sensing data, the approach to land cover identification, and the method for analysing LST data. In Section 3 (Results and Discussion), we primarily analyse and discuss the impact and extent of different green space types on their thermal effects, as well as the relationship between landscape metrics and the intensity of these thermal effects. Based on the findings of this study, practical suggestions for urban planners and landscape practitioners were proposed. The conclusion of this study is presented in Section 4.
2. Materials and Methods
2.1. Study Area
The study was conducted in Sheffield, a city in the UK at a longitude of 1.47° W and latitude of 53.38° N with a total area of 367.94 km2. Sheffield is known as one of the greenest cities in the UK as per the NatWest Green Cities report with around 22,600 acres of green space [31]. As a city in a warm temperate climate region (Cfb), according to Köppen-Geiger climate classification [6], Sheffield has an annual mean air temperature of 9.5 °C and precipitation of 800.8 mm [32]. During an extreme heatwave, the maximum air temperature reached 38.7 °C on 19 July 2022 [33].
2.2. Data Collection and Processing
2.2.1. Land Surface Temperature Retrieval
The research methodology utilised GIS (ArcMap 10.8) as a primary framework for data collection and analysis. Remote sensing satellite imagery was used to create heat maps, combining these with land cover datasets from Ordnance Survey maps (obtained through the Digimap service for UK higher education [34]).
When selecting remote sensing datasets, the four types of resolution that need to be considered are spatial, spectral, temporal and radiometric [35]. Spatial resolution is important as highly detailed map data are needed to understand the correlation between vegetation and heating. While various modes of satellite imagery are used for research, such as MODIS, ASTER, LANDSAT, etc., Landsat mission datasets were used for this study as they provide the highest resolution currently available and are the most used within research papers [36]. While MODIS and ASTER provide thermal datasets at 1 km and 90 m resolutions, respectively, Landsat 8 and 9 are collected at a 100 m resolution and frequently resampled to a 30 m resolution. Whilst we recognise that this may potentially introduce inaccuracies—it is a widely used practice which brings the significant benefit of increased spatial resolution. Within the Landsat missions, Landsat 8 and 9 were preferred as these datasets provide higher imaging capacity and are better geometrically and radiometrically compared to previous versions [37].
Landsat imagery was downloaded from Earth Explorer on USGS (United States Geological Survey) for peak summertime in 2023. Data were selected from mid-June to mid-September for land cloud cover lower than 10%. Land cloud cover refers to the percentage of cloud that is above land, excluding water bodies from the scene [38]. This search returned LANDSAT8 data for 6 September 2023 at 10:57:52–10:58:24 with a cloud cover of 2.08%, which were subsequently downloaded.
Heat maps are created using Band 10 of LANDSAT. To calculate heating maps, the following equations are used.
where
TOA (L) = ML × QCAL + AL,
- TOA—Top of Atmospheric spectral radiance;
- ML—band-specific multiplicative rescaling factor (value for RADIANCE_MULT_BAND_10 obtained from the metadata file provided in Supplementary Materials);
- QCAL—remote sensing raster image in tiff format for Band 10;
- AL—band-specific additive rescaling factor (value for RADIANCE_ADD_BAND_10 obtained from the metadata file).
BT = (K2/Ln((K1/L) +1)) − 273.15,
- BT—brightness;
- K1—(value for K1_CONSTANT_BAND_10 obtained from metadata file);
- K2—(value for K2_CONSTANT_BAND_10 obtained from metadata file);
- L—TOA. Precisely 273.15 is subtracted to convert data from Kelvin to Celsius.
Please refer to Supplementary Materials for comprehensive details regarding the metadata file used for the Landsat satellite imagery.
In terms of topography the landscape in Sheffield varies from the uplands and moorlands in the west to the lowlands in the south-east. Since this paper focuses on the urban heat island effect and its relationship to green spaces, all datasets were clipped to the urban boundary of Sheffield downloaded from The Open Geography portal of the Office for National Statistics (ONS) (https://geoportal.statistics.gov.uk (accessed on 9 September 2024)). This excludes rural areas that are a part of the Peak District National Park.
As urban morphology plays a vital role in the heating effect within cities, the research was undertaken using discrete buffer zones of Sheffield based on distance. The main dense urban settlements are concentrated within the city centre with urban density reducing as one moves away from the city centre. Sheffield as a city works as a single core centre that grows radially from the centre with the main urban density reducing as one travels further away towards the suburbs (see Appendix A for details). This buffer approach is commonly used in the wider literature in similar GIS-based analyses that operate at city-wide spatial scales. To create these various zones, a point was placed at the town hall in the city centre and was buffered to 2 km all the way to the suburban areas. Due to the variations in urban structure within the first zone, this zone was further split into two zones of 1 km. This first zone captures the corresponding area that is commonly perceived as the city centre of Sheffield [39]. Therefore, the study area was divided into a total of 6 zones, as shown in Figure 1. Further information (including topography, building height, and land use, for example) that sets the zones in context can be found in Appendix A. Zones 5 and 6 in particular contain large amounts of undeveloped rural land; however, it should be noted that our analysis excludes such areas, as only the urban land areas are included, as shown in Figure 1.
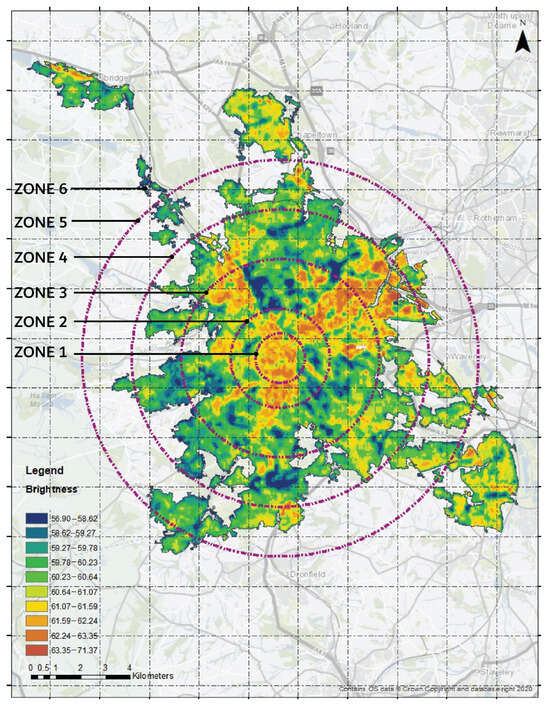
Figure 1.
Map showing temperature variation in Sheffield along with the different 2 km buffer zones. Temperature variation here is brightness calculated through remote sensing imagery and is used to understand areas that experience more heat.
2.2.2. Land Cover Identification
The dataset for parks was obtained from the council green space dataset with a total of 219 parks within the study area [40]. The woodland dataset was obtained from the aggregation of two sources—Land Cover Map (LCM) data for 2023 [41] and the council open green space data [40]. Of a total of 243 woodland areas—83 are under the council dataset, 189 are from the LCM, and a total of 29 woodland polygons are overlapping. LCM data for both coniferous and deciduous woodland were extracted (including trees > 5 m high when mature, which form a canopy cover of >20% [42]) and combined with the woodland data obtained from the council open green space data. Comparison of areas defined as woodland by LCM against the base map is shown on Figure 2. For grassland the dataset was extracted from LCM data, combining areas of arable grassland, improved grassland, neutral grassland, semi-natural grassland, and heather grassland, resulting in a total of 292 grassland polygons within the study area. The overall accuracy of LCM 2023 Is reported as 83% [42].
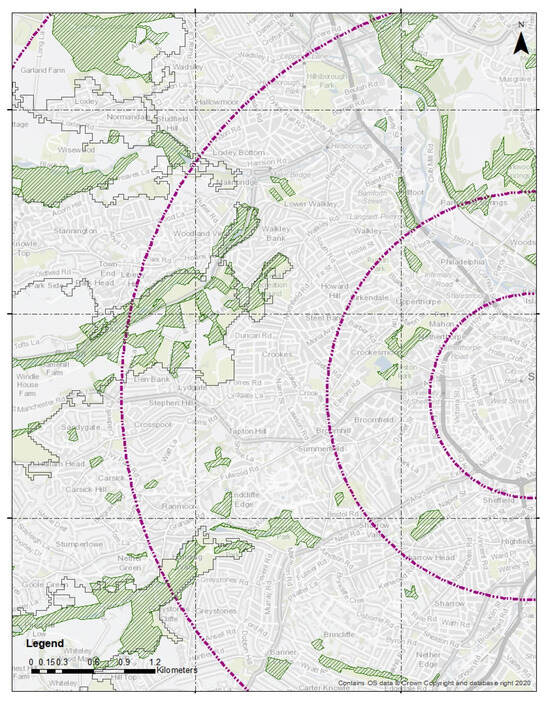
Figure 2.
Map showing overlap of woodland obtained from Land Cover Map (LCM) (shown in dark green hatch) overlaid on the base map indicating green spaces (shown in light green). The three purple circles show distances of 1 km (Zone 1), 2 km (Zone 2), and 4 km (Zone 3) from the city centre. This provides an idea of how many of the green spaces are classified as woodland as per LCM.
Figure 3 shows the green space-type data for woodland, grassland, and parks for the study area—the urban area of Sheffield. The boundaries of parks purposely overlap with those of woodland and grassland due to definitions, as we sought to investigate the differences between analysis that focused specifically on parks [8,20], compared to that which focused on vegetation [17,22].
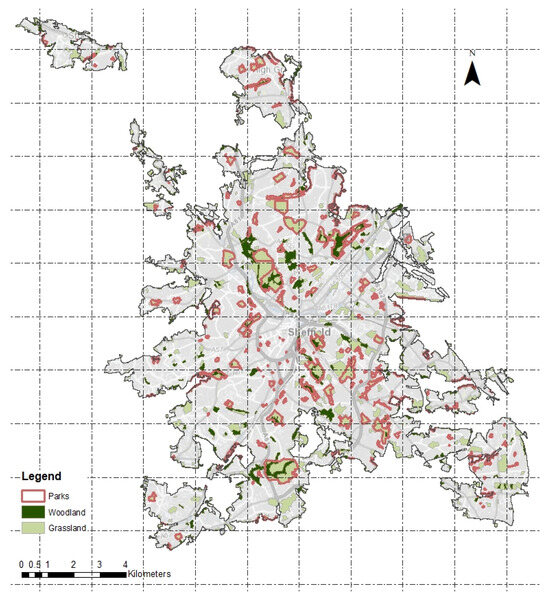
Figure 3.
Map showing heating areas of parks, woodland, and grassland within Sheffield.
The initial study is undertaken for the entire Sheffield urban area as a whole, after which a more focused study is carried out for each of the six urban zones—focusing on the relationship between size and shape with respect to heat.
2.3. Data Analysis
2.3.1. Computation of Landscape Metrics
To facilitate comparisons with relevant studies, this study utilised a frequently used patch-level landscape metric, the Shape index (SHAPE) [25], to describe the shape complexity of green spaces. It was calculated as
where p is the perimeter of the green space, and A is the area of the green space [43,44].
For the SHAPE, when the value increases, it indicates that shape complexity is increasing. When the SHAPE = 1, this means the shape of the green space is a circle.
2.3.2. Calculation of Cooling Effects
Three quantitative indicators, including cooling intensity, cooling extent, and comparison with baseline temperature, were employed in this study with the following two considerations: Firstly, these indicators can help quantitatively describe the cooling effect of a green space on the surrounding environment, aligning with our research aim. Secondly, these are commonly used in relevant studies [26,27,29,45] and can facilitate comparison and analysis with the results of similar research. The cooling intensity (some studies use the term UCI (Urban Cool Island) intensity [26]), is shown in Figure 4 and is defined as the temperature difference between the temperature of the edge of the green space and the temperature at the first temperature drop point [27]. Cooling distance (which some studies call UCI extent [26], is shown in Figure 4) is the distance between the edge of the green space and the first turning point of the temperature drop compared with the green space’s temperature, which represents how far the cooling effect of the green space can influence the surrounding urban environment [29,45]. To calculate the above-mentioned indicators, the LST within a 500 m radius around the green space was examined, with measurements taken at 50 m intervals.
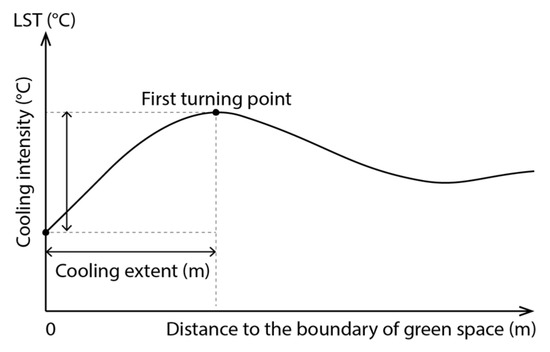
Figure 4.
The illustration of cooling intensity and cooling extent (adapted by [10,46]).
Thirdly, to calculate an expected comparator, estimating the temperature without the green space, the temperature for each 50 m interval was compared against the other areas within the zone that were outside the green space buffer. This is shown below in Figure 5, which shows the difference between the base temperature calculation for the interval 0–50 m ((average temp of park + average temp of 50 m) – average temp of remaining site) and 150 m ((average temp of park + average temp of 150 m) – average temp of remaining site).
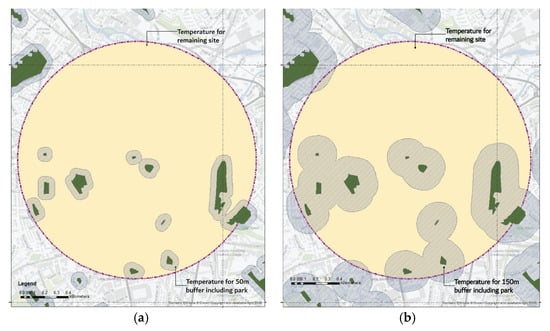
Figure 5.
Map showing how base temperature is calculated for Zone 1. (a) Temperature base study for 50 m; (b) temperature base study for 150 m. The dark green areas are parks, the varying buffer distances of these are shown in green hatch, whilst the comparison baseline temperature is calculated based on the remaining areas in the zone as shown within the yellow circle with a purple outline.
2.4. Limitations and Assumptions of the Study
One main limitation for heat maps is the availability of high spatial resolution datasets. Currently heat maps are only available at a 100 m resolution through LANDSAT, which are then resampled to 30 m [37]. This downscaling of resolution can potentially create gaps in data readings. The use of 30 m resolution images makes it difficult to reflect the complex internal structure of urban green spaces, lacks classification accuracy verification, and is prone to systematic errors. Whilst we appreciate that the resampling may potentially introduce inaccuracies, the practice is widely used and brings the significant benefit of increased spatial resolution.
We acknowledge that our research investigates a single city at one time point and therefore lacks multi-temporal and cross-regional exploration. We did, however, compare the spatial pattern of LST between our single day (6 September 2023) and that for the entire summer period (1 June 2023 to 31 August 2023) and found a strong association (R-squared of 90%)—justifying our data. This single day was specifically selected as the hottest day of the year, and is therefore in the light of climate change likely to reflect important human health implications.
3. Results and Discussion
3.1. The Impact of Green Space Type
3.1.1. Land Cover Patterns of Woodland, Grassland, and Parks
Table 1 compares the temperature gradients over distance from parks, woodland, and grassland. Overall it shows that woodlands appear to provide a larger impact in terms of distance and intensity followed by grassland and then parks. It also highlights that differences in temperature with distance are unsurprisingly greater at relatively short distances and by 200 m only relatively small distance effects are evident (of the order of under 0.2 °C). This is aligned with the findings of Doick et al., who observed that in London there was an exponential decrease in the extent of cooling as the distance from the greenspace increases [16]. Whilst parks and woodland appear to be having greater effects overall, woodland appears to have considerably longer distance decay effects in LST [16]. The full individual results of this research can be found in the Supplementary Materials.

Table 1.
Average land surface temperature effects by distance and type of green space.
From Figure 6, it can be seen that the LST of woodland and its surrounding environment is consistently the lowest among the three types of green spaces, particularly within a relatively close distance to green spaces. This is supported by the findings of Schwaab et al. by comparing LST and land cover data across 293 European cities, which found that tree-covered urban green spaces have a cooling effect that is 2–4 times higher than that of treeless urban green spaces [47]. Findings from many similar studies around the world also support this [17,29,48,49]. However, it is worth noting that when comparing the differences regarding the extent to which woodland and grassland reduce LST across different studies, attention should be paid to how woodland and grassland are defined in each study. For example, in the study by Yang et al. (2020), woodland/grassland is defined as having more than 80% tree or grassland cover [17]. In contrast, in this study, woodland is characterised as an area of land with over 20% tree cover consisting of trees higher than 5 m. Grassland is defined as an area dominated by grasses and other herbaceous plants [42]. For this study all woodlands have been combined under one category and a similar method has been undertaken for grassland.
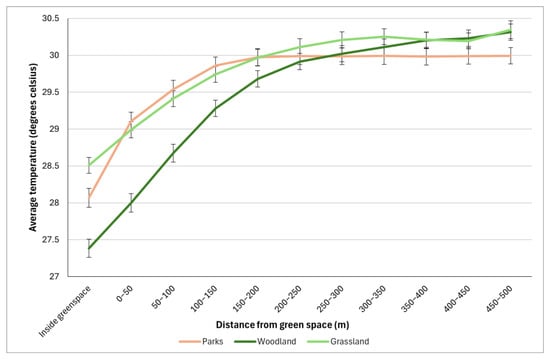
Figure 6.
Graph showing temperature difference for each green space type (including standard error bars).
The stronger cooling effect of woodlands compared to grasslands may be due to the following reasons: Firstly, trees have broad canopies that can cast large areas of shade. For example, in Sheffield, mature trees of common species such as Quercus robur (English oak) can have canopy widths reaching up to 8 m [50]. The canopy shading reduces direct solar radiation reaching the ground, thereby effectively lowering surface temperatures. Additionally, due to their greater height (mature height of between 20 and 40 m for Quercus robur [51]), trees can cast a larger area of shade, particularly when the sun is low in the sky in the late afternoon. In contrast, grasslands—where the height of the grass is approximately between a few dozen centimetres and about one metre [52]—offer minimal shading and therefore have a limited direct impact on surface temperature. Secondly, compared to grasslands, woodlands have a more complex, multi-layered ecological structure, including trees, shrubs, and herbaceous plants. This results in a greater overall leaf area. The leaf area index (calculated as the total area of green leaves divided by the total ground area they cover) of woodlands can reach approximately 5 in summer—in a broadleaf woodland at Risley Moss Nature Reserve, Lancashire, UK [53]—while for grasslands in the UK it is typically around 1 [54]. A larger leaf area enhances transpiration, which contributes significantly to cooling.
3.1.2. Distance from the Urban Centre
Figure 7 builds on the previous outputs by also including the distance from the urban centre that demonstrate changes within the urban–rural gradient. It shows temperature effects over both distance and within the three different types of urban green space within the six zones of increasing distance from the urban centre. Figure 7 shows strong trends of lower average temperatures further away from the city centre (through the zones). For woodland, it particularly highlights the contrast in temperatures between inside a woodland and within 0–50 m—perhaps indicating the large local effects in terms of cooling. The modest sample sizes within Zone 1 give rise to large standard errors—particularly for woodland.
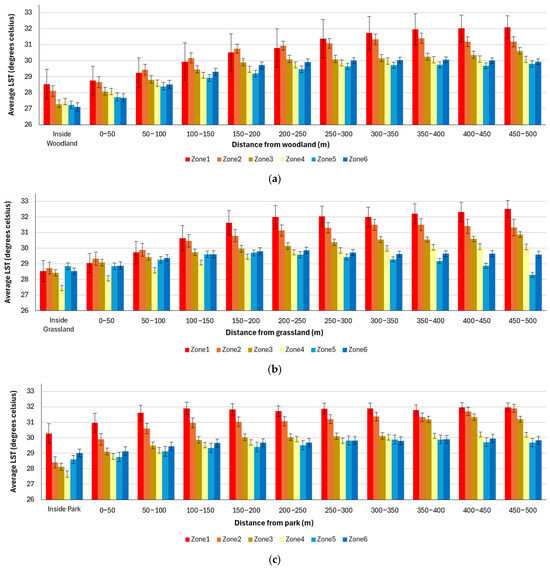
Figure 7.
Graphs showing land surface temperature differences for each zone for each green space type: (a) woodland; (b) grassland; (c) park.
Differences in temperature are particularly stark between Zone 1 and Zone 2 for parks. It should be stressed that park green space is a management concept. In Sheffield, parks are categorised by the Sheffield City Council into three types based on different catchment areas: city parks, district parks, and local parks [55]. When looking at distance, the cooling effect by parks can be experienced to approximately 150 m, with an intensity of around 1.9 °C, post which the difference is negligible. This, however, varies from zone to zone. Within Zone 1 there is a modest impact with a difference of 0.7 °C created by parks while a larger impact can be seen in Zone 2 with 1.7 °C. One of the main reasons for this is likely to be due to the composition of soft and hard surfaces of parks. Parks within Zone 1 are only 18.49% green while other zones have a green composition of higher than 30%—reducing cooling opportunities through NBS. The exact composition can be seen in Table 2. This demonstrates the importance of utilising the most appropriate units of analysis, whereby for land surface temperature analysis, vegetation coverage rather than park boundaries should be sought.

Table 2.
Detailed information about parks located in different urban zones.
Although Zone 4 has the highest area and percentage of green cover, Zone 2 seems to be exhibiting the largest impact in terms of decreases in LST. Other factors such as urban density along with the type of greenness could be potential factors that make a difference, whether these are woodlands or grasslands. This will be explored further in the following sections.
3.1.3. Cooling Effects—Cooling Intensity Approach
In this study, for woodland and grassland, the cooling intensity in Zone 1 is the strongest (see Figure 8). This may be because the level of building cover in the city centre is relatively high (in Zone 1, the building coverage is 29.94%, significantly higher than Zone 2′s 19.78%, and approximately 16%~17% in the other zones—as shown in Appendix A), resulting in higher LSTs [56]. Therefore, the temperature difference between the green space and its surroundings tends to be larger. However, unlike woodland and grassland, the cooling intensity of parks is strongest in Zone 3, followed by Zone 2 (see Figure 8). This may be due to two reasons. First, the size and dominant ground surface materials of parks in different zones may vary. Parks in Zone 1 are located in the city centre, where they are usually smaller in size and have more impervious surfaces, whereas parks in Zones 2 and 3 may be larger and have greater tree and grass coverage, resulting in stronger cooling intensity. Second, the high building density in the city centre (i.e., Zone 1) reduces wind speed, thereby limiting the extent and strength of the ‘park breeze’ effect spreading into the surrounding built environment. At the same time, we also found that, regardless of the type of green space, the cooling intensity in Zones 5 and 6 is relatively weak. This may in part be influenced by the surrounding rural areas affecting temperatures within the urban study area—which is predominately an effect only in Zones 5 and 6 (as evident in Figure 1). Although the green spaces in suburban areas tend to be larger in size, the surrounding built environment has a relatively low density, resulting in lower LSTs. As a result, the temperature difference between the green space and its surroundings there is not significant. However, this finding is contrary to that of An et al. [57], who, through their analysis of the LST of green spaces and their surroundings in Beijing, concluded that the green spaces within the Fifth Ring Road area exhibited a better cooling effect than those within the Second and Third Ring Road areas. They attributed this to the higher daytime LST in the central areas, suggesting that green spaces there have a stronger cooling impact on the surrounding areas compared to those in the central areas [57].

Figure 8.
The cooling intensity of three types of green space: (a) woodlands; (b) grasslands; (c) parks.
In relation to parks, Algretawee et al., based on field measurements of 27 parks in Melbourne and the surrounding urban environment’s LST, found that the closer a park is to the city centre, the stronger its cooling influence on the surrounding city compared to parks located farther from the city centre, which may reflect the fact that LSTs are inherently higher in those areas [58]. However, our findings differ somewhat from their conclusions, as we did not observe a clear correlation between cooling intensity and the distance between parks and the city centre. For example, we found that parks located in Zones 5 and 6 had the weakest cooling intensity, which aligns with the conclusion of Algretawee et al. [58]. However, we also observed that parks in Zone 1 had a lower cooling intensity than those in Zones 2, 3, and 4 (with a difference of 0.65–1.58 °C). This may be due to the significantly smaller size and lower green coverage of parks in Zone 1 (area from 210.85 to 26,834.70 m2; green coverage 18.49%), which could limit their ability to cool the surrounding urban environment.
Regarding park cooling intensity, Algretawee et al. measured that parks located within the 0–3 km ring from the city centre had a mean maximum PCI (Park Cool Island, defined as the difference between the LST at the measurement points outside the park and the LST at the park boundary) of up to 8.3 °C, whereas parks farther from the city centre (3–9 km) only reached around 6.2–6.3 °C [58]. The Park Cool Island values of parks measured in that study are much higher than in the present study (cooling intensity 0.82–3.21 °C in Zone 1–6), mainly due to differences in the research method and the accuracy of LST measurement [58]. Their study measured LSTs at a few specific points using a temp gun, so the thermal properties of the underlying surface materials at those points (asphalt road surfaces in the measuring photos) had a significant impact on the results. While in contrast, the present study uses remote sensing to obtain LST over a large area.
In relation to woodland and grassland, Schwaab et al. undertook a remote sensing study and found that the temperature differences between rural forests and continuous urban fabric (similar to our concept reflecting distances from the urban centre) closely resemble the temperature differences between urban trees and urban fabric [47]. They suggest that higher background air temperatures and LSTs may be the reason for higher rates of plant transpiration and cooling in urban woodlands. However, increasing water stress due to insufficient soil volumes may lead to reduced cooling in urban areas. Our findings in Sheffield are similar to those from Central Europe (especially Scandinavia), where the cooling effect of urban woodlands is stronger than that of more rural woodlands. Jonsson stated that the vegetation in the city acts to reduce the temperature through evapotranspiration [23]. While the rural flourishing vegetation and the increased soil moisture and heat capacity hinder the temperature from falling during summer. Whereas in Turkey, rural forests show a greater cooling effect on LST compared to urban trees. This difference may be due to variations in regional climates, differences in plant transpiration rates, and the differing albedo of urban surfaces. Additionally, unlike previous studies, we found that small-sized woodlands in Zones 4–6 exhibited a phenomenon where the LST within a certain distance was actually slightly higher than that of the surrounding urban environment. For example, for small woodlands located in Zone 4, the LST at 0–50 m from the woodland was 0.24 °C lower than inside the woodland itself. We believe this phenomenon may be related to the layout of the woodland. For instance, parking lots at the entrance of a woodland may be included within its boundaries, but the low-albedo surface materials there could raise the overall average LST of the woodland. This may also explain why some studies, after broadly classifying green spaces as woodland or park, further visually categorise and analyse the land cover within the green space.
Regarding grassland, our findings in Sheffield differ from those in Turkey [47]. In Turkey, treeless urban green spaces exhibit greater cooling effects compared to rural pastures, which may be due to irrigation. Although some studies have already shown that irrigation has a limited effect on urban trees in Europe, distinguishing temperature and transpiration differences between urban and rural vegetation remains challenging.
3.1.4. Cooling Effects—Cooling Comparison with Baseline Approach
Figure 9 uses a different approach to measure the cooling effect, comparing the temperature within the green space buffer compared against a comparator area without a green space (as a baseline). This was only undertaken for woodland in order to test the robustness of previous findings—as we found woodland was the green space type with the greatest potential to reduce LST (individual plots for each zone can be found in Appendix B). The distance decay effects across all zones are clear—with larger temperature differences close to woodland and with less effect further away—with only modest gains by a distance of 200–250 m (although there is still an effect out to 400 m across most zones). Whilst the greatest cooling effects were evident in Zone 1 (the city centre), caution should be applied due to the very modest sample sizes within Zone 1. Across the zones, the cooling effect within 50 m (where there is the largest effect) was a reduction in temperature of between 1.30 and 4.40 °C. This is in line with the previous findings of this research (cooling intensity of 0.82–3.21 °C).
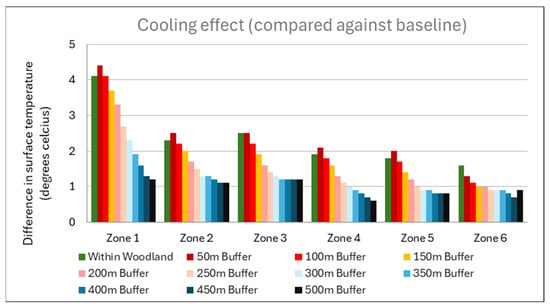
Figure 9.
Graph showing comparison of cooling effect against baseline for the six zones of distance from the urban centre.
3.2. Landscape Metrics
Many studies have found that AREA and SHAPE are both negatively correlated with the LST of the built-up areas [46,59], i.e., positively correlated with the cooling effect of green spaces. In the review article by Li et al., the meta-analysis shows that the SHAPE and LST statistics have consistent negative correlations with Pearson correlation coefficients ranging from about −0.5 to −0.1 [25]. However, Yang et al. stated that there is no significant correlation between the mean SHAPE value of blue-green spaces and their average cooling extent and intensity [17]. The reason for this discrepancy may be that Yang et al.’s study considered green spaces and water bodies together, even though the cooling mechanisms of the two are significantly different.
3.2.1. Landscape Metrics—Cooling Intensity Approach
Table 3 shows the sample size of woodland polygons when broken down by both size (area) and SHAPE. When looking into the impact both size and shape have in terms of cooling, size seems to create a much larger impact as opposed to the Shape index. Our findings are generally consistent with previous research, but there are some differences across the zones. As shown in Table 4, woodlands located in Zones 1 to 4 and Zone 6 exhibited a clear trend: the larger the Shape index, the stronger the cooling intensity. However, in Zone 5, the trend was somewhat different—woodlands with a small shape index showed a higher cooling intensity than those with a medium shape index. Therefore, we believe that when examining the relationship between landscape metrics and the cooling effect of green spaces, it is important to conduct a breakdown analysis based on the location of the green spaces within the city (i.e., whether they are in urban or suburban areas). The correlation between the SHAPE and cooling effect is more pronounced for woodlands located in urban areas. Regarding woodland size, woodlands in almost all zones (except Zones 2 and 3) show a clear trend: the larger the area, the stronger the cooling intensity (Table 5). This is consistent with previous research [17].

Table 3.
The number of woodlands in different categories.

Table 4.
The cooling intensity of woodlands across different zones and shape index categories (°C).

Table 5.
The cooling intensity of woodlands across different zones and size categories (°C).
When comparing the metrics AREA and SHAPE, many scholars believe that the area of green space has a greater impact on LST. Chen et al. suggested that the area of green space is the most important landscape metric for predicting LST, second only to the vegetation index (richness of vegetation), while the role of the SHAPE is minimal [60]. Huang et al. stated that, compared to the quantity and shape of green spaces, changes in the largest area are the key factor influencing regional LST [61]. Also, some scholars also believe that the area of green spaces is significantly positively correlated with their cooling extent within a certain range. However, once the area exceeds a certain threshold, size is no longer the primary factor influencing the cooling extent. For example, Yan et al., through a study on the cooling extent of urban parks, identified 30 hectares as a critical threshold. Parks smaller than 10 hectares had a cooling extent of only about 120 m, whereas parks larger than 30 hectares could provide a cooling extent of approximately 480 m between June and August [62].
3.2.2. Landscape Metrics—Cooling Distance Approach
Analysis is needed that compares the effects of both size and shape together—to determine which factor exerts the greatest effect. Table 6 uses woodlands as an example to show the LST inside and outside the green spaces, as well as their difference. For woodlands of the same shape index category (i.e., small, medium, or large), the general trend is that the larger the area, the stronger the cooling effect. This point is also mentioned in the meta-analysis on urban parks—the larger the park area, the better its cooling effect [9]. Gunawardena et al. stated that the significance of scale could be attributed to increased potential of the park breeze system [63], either due to an increased temperature gradient or else increased fetch (length of area over which a given flow has contact) for smaller scale parks. In addition, compared to the differences between shape-based groups, the differences in cooling effect between size groups were greater [63]. This indicates that the influence of woodland area on the cooling effect is more significant than that of shape.

Table 6.
Land surface temperatures inside and outside of the woodlands (up to 2500 m) and their differences.
Among woodlands of medium and large sizes (i.e., areas over 6566.45 m2 or 6.6 ha), there is a clear negative correlation between shape index and area—meaning that the more regular (less complex) the woodland shape, the stronger its cooling effect within the surrounding 50 m buffer. Generally, there was an iterative increase in the cooling effect of woodland with increasing size—irrespective of the shape of the woodland. The only exception was for large woodlands with small shapes, but here the sample size was only three instances and so should be treated with caution. There was no clear pattern for shape when size was considered and accounted for. Zhou et al. found, based on green space analysis in Nanjing, that the cooling effect can be enhanced by increasing area and reducing shape complexity, but only within certain thresholds—area increases improve cooling when below 10 ha, while shape simplification is effective for green spaces larger than 5 ha [64].
3.3. Practical Suggestions for Urban Planners and Landscape Designers
This study provides practical suggestions for urban planners, landscape designers, and policymakers. Firstly, whilst not the focus of our work, findings highlight potential social justice issues in relation to green space cooling effects. Previous work has identified that more deprived areas in Sheffield tend to lack larger high-quality green spaces [65] and more widely within England—deprived areas have lower tree canopy cover [66]. Given that findings of this work place a particular importance on the size of green space and on wooded areas for surface temperature reductions, it is likely that deprived areas will be disproportionately disadvantaged. Future work should seek to explicitly investigate these important relationships.
In urban planning, where possible, our work recommends placing large green spaces closer to the city centre should be prioritised to maximise the cooling effect. The planning of Central Park in New York, Hyde Park in London, and Olympic Forest Park in Beijing are examples worth referencing. Of course, from a practical perspective, it may not be feasible to create large green spaces in already built-up city centres. However, even small-scale green spaces—such as pocket parks or sitting-out areas with vegetation cover—can still help improve the urban outdoor thermal environment to some extent and are therefore worth promoting.
Furthermore, in green space landscape design, tree canopy cover should be regarded as an important metric to enhance the cooling effect of green spaces. At present, many urban green space policies primarily emphasise the concept of “green cover”; that is, vegetation coverage area [67]. For example, the City of Sydney aims to achieve 40% green cover across the local area, including proposed targets of 86% for parks [68]. However, our research indicates that green spaces with substantial tree canopy cover differ significantly from grasslands in terms of cooling intensity and extent. Previous work has identified large disparities in tree coverage within urban centres within Great Britain [69], with a lack of trees, and greenery more generally in deprived northern city centres. With our work highlighting the importance of urban tree coverage for urban heat island effects, such spatial inequalities raise important issues around social justice. Therefore, it is imperative to further quantify tree canopy cover in green space policies and design guidelines.
3.4. Future Work and Limitations
The core limitation of the research rests with the resolution of the data (100m resampled to 30m), which have been discussed in Section 2.4. Higher resolution datasets will be made available in the future as the new satellites HotSat-2 and -3 are launched later in 2025 (building on HotSat-1 that was only operational from June to December 2023 and no UK data was available). HotSat will provide data at a 3.5 m resolution facilitating more accurate analysis [70]. Whilst we acknowledge that our paper focuses on a single city and one time point and therefore lacks multi-temporal and cross-regional exploration, future research should seek to explore temporal patterns.
Regarding theoretical simplification in this study, it is assumed that urban morphology changes uniformly with increasing distance from the city centre. While urban density generally decreases as one moves away from the city centre, this decline does not occur in a uniform pattern. In future research, we will explore the non-uniform variations in urban and rural density more thoroughly. It should be noted that in particular Zones 5 and 6 contain large amounts of surrounding rural areas which are likely to influence the temperatures of nearby adjacent urban areas in the study area within our findings. Future work should explore and incorporate the temperature effects of these surrounding areas. In terms of land use, this research has only taken into consideration three types—woodland, parks. and grassland. Future research could potentially investigate other land uses and combinations of them. In particular, future work should seek to explore how the combination of green space and land use affects the regulatory effect of surface temperature; especially how the spatial distribution and interactions affect surface temperature regulation. We acknowledge that in future work, the inclusion of more comprehensive grey space related variables combined with green space modelling could help to improve the overall understanding of the urban thermal environment.
4. Conclusions
This study aimed to quantitatively investigate the impact of green space characteristics—including type, area, shape, and location—on their cooling effect in Sheffield, UK, using ground surface temperature data obtained through remote sensing. Three types of green space were included: urban parks, woodlands, and grasslands. Various cooling indicators were used, including cooling intensity, cooling extent, and the temperature difference relative to the urban baseline, to explore the cooling characteristics of temperate green spaces.
Regarding green space type, the study found that woodlands had a significantly stronger cooling effect compared to urban parks and grasslands, with higher cooling intensity (up to 2.93 °C) and a broader cooling extent (up to 500 m from the woodland boundary). Compared to urban parks (1.92 °C, 200–250 m), grasslands had slightly lower cooling intensity (1.74 °C) but a longer cooling extent (300–350 m). Regarding the location of green spaces within the city, the study found that for all green space types, those located near the city centre exhibited the strongest cooling intensity. In contrast, green spaces located further away (approximately 4–8 km from the city centre) showed a significantly weaker cooling intensity. For shape characteristics such as area and form, the study used the SHAPE to quantify the complexity of green space patches. Combining this with spatial location analysis, it was found that green spaces closer to the city centre showed a clear positive correlation between their area/shape complexity and their cooling effect. However, this relationship was much weaker for green spaces located in suburban areas.
The findings of this study represent an important step toward understanding the cooling effects of urban green spaces in temperate oceanic climate cities, offering planning and design guidance for practitioners in the UK and similar climate zones. The innovation of this manuscript lies in its inclusion of the specific urban location of green spaces in the analysis, further clarifying the relationship between green space cooling performance and urban context. Policymakers should note particularly the significance of green space provision at the edge of city centre locations (1–2 km from the centre) as a means to influence wider city cooling. In future research, a more comprehensive spatiotemporal analysis should be conducted, covering a longer time span, incorporating green space development over time, and including comparative studies with surrounding cities.
Supplementary Materials
The following supporting information can be downloaded at: https://www.mdpi.com/article/10.3390/land14112284/s1.
Author Contributions
Conceptualization, R.V., Z.L., and P.B.; Methodology, R.V., Z.L., and P.B.; Software, R.V.; Validation, R.V., Z.L. and P.B.; Formal Analysis, R.V., Z.L., and P.B.; Investigation, R.V. and Z.L.; Data Curation, R.V.; Writing—Original Draft Preparation, R.V., Z.L., and P.B.; Writing—Review and Editing, R.V., Z.L., and P.B.; Visualisation, R.V. and Z.L. All authors have read and agreed to the published version of the manuscript.
Funding
This research received no external funding.
Data Availability Statement
The core (surface temperature) data presented in the study are openly available through the U.S. Geological Survey—https://earthexplorer.usgs.gov/ (accessed on 6 July 2025). Land cover data were collected from two sources: Land Cover Map (LCM) data for 2023 and Sheffield City Council Parks and countryside open green space data as detailed within the manuscript Section 2.2.1.
Conflicts of Interest
The authors declare no conflicts of interest.
Appendix A
Appendix A contains material to help the reader understand the context of the six Zones used within this analysis and the city of Sheffield, UK more generally. It contains a number of maps (showing topography, land use, and levels of vegetation) and tables (building heights and land use).
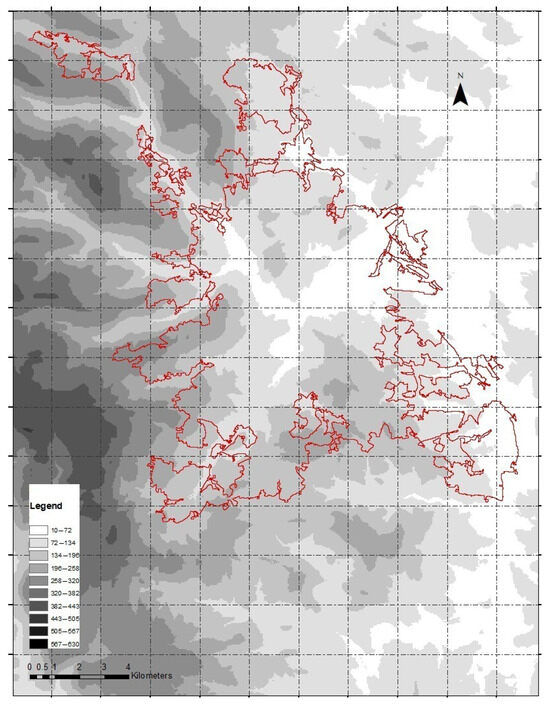
Figure A1.
Map of the topography of the site, the city of Sheffield (height above sea level in metres) (© OS Terrain® 50, 2025). The red outline depicts the urban area of Sheffield as used in the research.
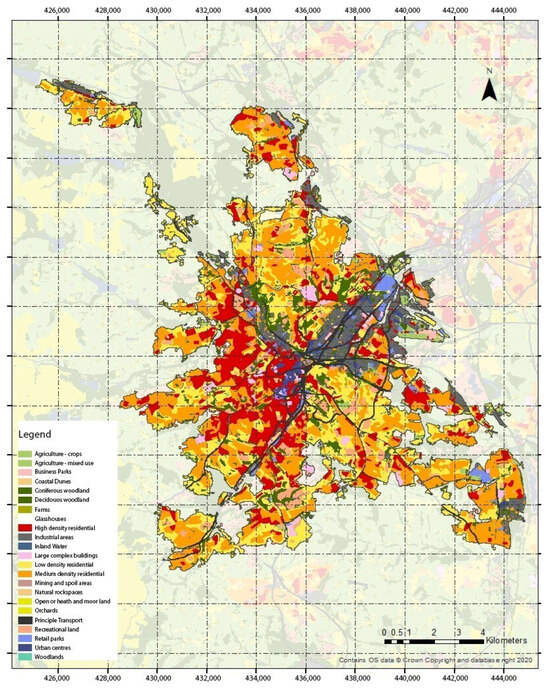
Figure A2.
Map of the land use of the site, the city of Sheffield (© GeoInformation Group Limited, 2025).
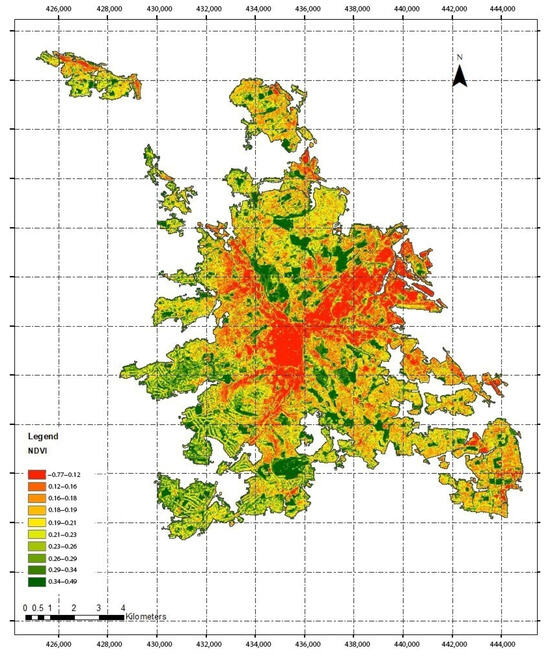
Figure A3.
Map of the vegetation of the site, the city of Sheffield, using the Normalised Difference Vegetation Index—showing the health of vegetation (scaled from +1 very healthy vegetation to −1 non-vegetated).

Table A1.
Building height and size by zone.
Table A1.
Building height and size by zone.
| Zone | Number of Buildings | Area Covered by Buildings (%) | Average Building Size (sq m) | Buildings per Hectare | Mean Building Height (m) | Median Building Height (m) |
|---|---|---|---|---|---|---|
| 1 | 2717 | 29.9 | 346.2 | 8.6 | 11.3 | 9.6 |
| 2 | 16,153 | 19.8 | 115.4 | 17.1 | 8.6 | 9.1 |
| 3 | 73,015 | 17.1 | 82.9 | 20.6 | 7.9 | 8.7 |
| 4 | 86,029 | 16.7 | 81.3 | 20.5 | 7.0 | 8.0 |
| 5 | 32,946 | 16.5 | 81.7 | 17.0 | 6.9 | 7.9 |
| 6 | 38,383 | 17.0 | 85.0 | 20.0 | 6.8 | 7.5 |

Table A2.
Building land use in Sheffield by zone (© GeoInformation Group Limited, 2025).
Table A2.
Building land use in Sheffield by zone (© GeoInformation Group Limited, 2025).
| Buildings in Zone 1 | Buildings in Zone 2 | Buildings in Zone 3 | Buildings in Zone 4 | Buildings in Zone 5 | Buildings in Zone 6 | |||||||
|---|---|---|---|---|---|---|---|---|---|---|---|---|
| Building Land Use | Count | % Share | Count | % Share | Count | % Share | Count | % Share | Count | % Share | Count | % Share |
| Agricultural | 0 | 0.0 | 0 | 0.0 | 27 | 0.0 | 62 | 0.1 | 40 | 0.1 | 76 | 0.2 |
| Commercial—derelict | 44 | 1.6 | 70 | 0.4 | 61 | 0.1 | 21 | 0.0 | 7 | 0.0 | 6 | 0.0 |
| Commercial—mixed use | 404 | 14.5 | 677 | 4.2 | 1121 | 1.6 | 595 | 0.7 | 285 | 0.8 | 267 | 0.8 |
| Complex use | 125 | 4.5 | 82 | 0.5 | 114 | 0.2 | 28 | 0.0 | 19 | 0.1 | 10 | 0.0 |
| Defence | 0 | 0.0 | 0 | 0.0 | 13 | 0.0 | 0 | 0.0 | 4 | 0.0 | 0 | 0.0 |
| Educational | 90 | 3.2 | 179 | 1.1 | 393 | 0.5 | 241 | 0.3 | 111 | 0.3 | 97 | 0.3 |
| Emergency services | 4 | 0.1 | 2 | 0.0 | 16 | 0.0 | 6 | 0.0 | 13 | 0.0 | 14 | 0.0 |
| Governmental | 14 | 0.5 | 3 | 0.0 | 10 | 0.0 | 11 | 0.0 | 2 | 0.0 | 4 | 0.0 |
| Health | 8 | 0.3 | 77 | 0.5 | 154 | 0.2 | 43 | 0.1 | 22 | 0.1 | 19 | 0.1 |
| Industry | 0 | 0.0 | 20 | 0.1 | 62 | 0.1 | 131 | 0.2 | 32 | 0.1 | 112 | 0.3 |
| Institutional accommodation | 24 | 0.9 | 20 | 0.1 | 76 | 0.1 | 22 | 0.0 | 8 | 0.0 | 10 | 0.0 |
| Office | 187 | 6.7 | 79 | 0.5 | 166 | 0.2 | 94 | 0.1 | 29 | 0.1 | 30 | 0.1 |
| Petrol station | 6 | 0.2 | 7 | 0.0 | 23 | 0.0 | 20 | 0.0 | 3 | 0.0 | 11 | 0.0 |
| Recreation and leisure | 43 | 1.5 | 422 | 2.6 | 1129 | 1.6 | 961 | 1.2 | 394 | 1.1 | 249 | 0.7 |
| Religious | 34 | 1.2 | 46 | 0.3 | 175 | 0.2 | 97 | 0.1 | 63 | 0.2 | 48 | 0.1 |
| Residential | 1000 | 35.9 | 12,675 | 79.3 | 62,786 | 87.3 | 74,872 | 91.3 | 32,990 | 92.1 | 32,654 | 93.0 |
| Residential with retail below | 8 | 0.3 | 0 | 0.0 | 0 | 0.0 | 6 | 0.0 | 3 | 0.0 | 0 | 0.0 |
| Retail | 326 | 11.7 | 336 | 2.1 | 596 | 0.8 | 451 | 0.6 | 143 | 0.4 | 200 | 0.6 |
| Retail below office or residential | 251 | 9.0 | 503 | 3.1 | 1361 | 1.9 | 720 | 0.9 | 178 | 0.5 | 98 | 0.3 |
| Retail with extensions | 7 | 0.3 | 6 | 0.0 | 2 | 0.0 | 13 | 0.0 | 0 | 0.0 | 0 | 0.0 |
| Transport | 28 | 1.0 | 11 | 0.1 | 6 | 0.0 | 14 | 0.0 | 14 | 0.0 | 8 | 0.0 |
| Unknown | 174 | 6.3 | 740 | 4.6 | 3555 | 4.9 | 3543 | 4.3 | 1375 | 3.8 | 1198 | 3.4 |
| Utilities | 5 | 0.2 | 17 | 0.1 | 78 | 0.1 | 24 | 0.0 | 75 | 0.2 | 14 | 0.0 |
| Warehousing | 0 | 0.0 | 0 | 0.0 | 4 | 0.0 | 12 | 0.0 | 0 | 0.0 | 0 | 0.0 |
| Warehousing with office | 0 | 0.0 | 2 | 0.0 | 1 | 0.0 | 0 | 0.0 | 0 | 0.0 | 1 | 0.0 |
| TOTAL | 2782 | 100.0 | 15,974 | 100.0 | 71,929 | 100.0 | 81,987 | 100.0 | 35,810 | 100.0 | 35,126 | 100.0 |
Appendix B
Appendix B contains individual plots for woodland by each zone comparing LST between observed and expected baseline conditions.
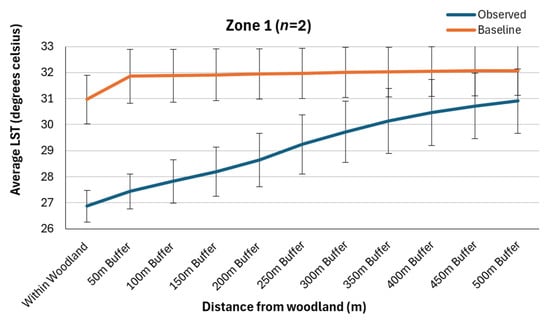
Figure A4.
Zone 1 cooling comparison with baseline.
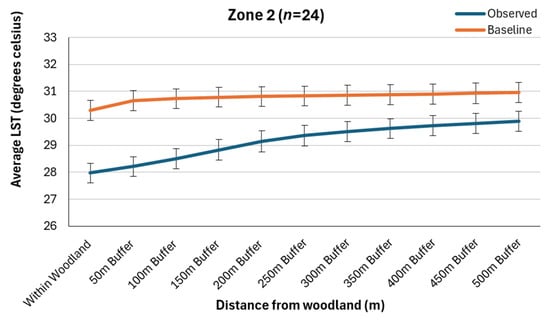
Figure A5.
Zone 2 cooling comparison with baseline.
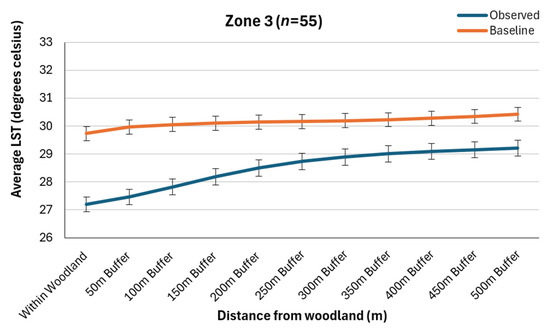
Figure A6.
Zone 3 cooling comparison with baseline.
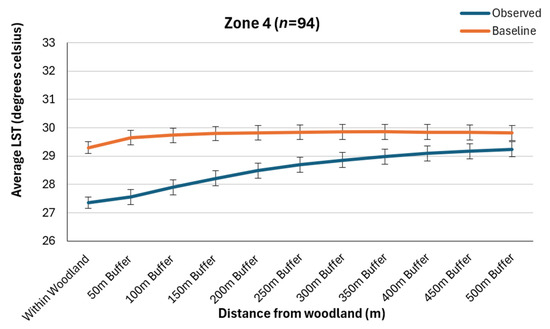
Figure A7.
Zone 4 cooling comparison with baseline.
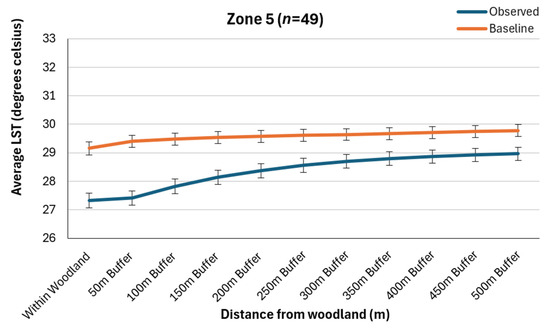
Figure A8.
Zone 5 cooling comparison with baseline.
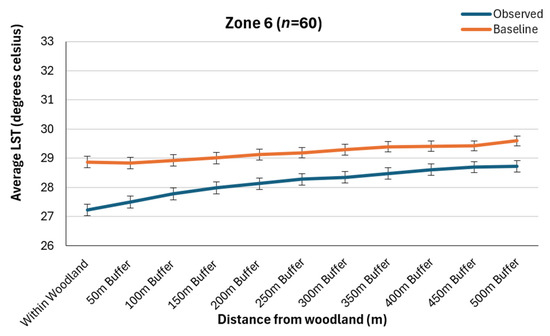
Figure A9.
Zone 6 cooling comparison with baseline.
References
- Santamouris, M. Regulating the damaged thermostat of the cities—Status, impacts and mitigation challenges. Energy Build. 2015, 91, 43–56. [Google Scholar] [CrossRef]
- He, B.J.; Wang, J.; Liu, H.; Ulpiani, G. Localized synergies between heat waves and urban heat islands: Implications on human thermal comfort and urban heat management. Environ. Res. 2021, 193, 110584. [Google Scholar] [CrossRef] [PubMed]
- European Commission. Green Infrastructure. 2025. Available online: https://environment.ec.europa.eu/topics/nature-and-biodiversity/green-infrastructure_en (accessed on 9 September 2024).
- Hayes, A.T.; Jandaghian, Z.; Lacasse, M.A.; Gaur, A.; Lu, H.; Laouadi, A.; Ge, H.; Wang, L. Nature-based solutions (nbss) to mitigate urban heat island (UHI) effects in Canadian cities. Buildings 2022, 12, 925. [Google Scholar] [CrossRef]
- Weidmüller, N.; Knopp, J.M.; Beber, J.; Krnjaja, G.M.; Banzhaf, E. Local planning scenario for shading from trees as an urban nature-based solution. City Environ. Interact. 2024, 23, 100154. [Google Scholar] [CrossRef]
- Kottek, M.; Grieser, J.; Beck, C.; Rudolf, B.; Rubel, F. World map of the Köppen-Geiger climate classification updated. Meteorol. Z. 2006, 15, 259–263. [Google Scholar] [CrossRef]
- Emmanuel, R.; Loconsole, A. Green infrastructure as an adaptation approach to tackling urban overheating in the Glasgow Clyde Valley Region, UK. Landsc. Urban Plan. 2015, 138, 71–86. [Google Scholar] [CrossRef]
- Wong, N.H.; Tan, C.L.; Kolokotsa, D.D.; Takebayashi, H. Greenery as a mitigation and adaptation strategy to urban heat. Nat. Rev. Earth Environ. 2021, 2, 166–181. [Google Scholar] [CrossRef]
- Bowler, D.E.; Buyung-Ali, L.; Knight, T.M.; Pullin, A.S. Urban greening to cool towns and cities: A systematic review of the empirical evidence. Landsc. Urban Plan. 2010, 97, 147–155. [Google Scholar] [CrossRef]
- Wang, C.; Ren, Z.; Dong, Y.; Zhang, P.; Guo, Y.; Wang, W.; Bao, G. Efficient cooling of cities at global scale using urban green space to mitigate urban heat island effects in different climatic regions. Urban For. Urban Green. 2022, 74, 127635. [Google Scholar] [CrossRef]
- Mikami, T. The Climate of Japan: Present and Past; Springer: Singapore, 2023; Volume 77. [Google Scholar]
- Eliasson, I.; Upmanis, H. Nocturnal airflow from urban parks-implications for city ventilation. Theor. Appl. Climatol. 2000, 66, 95–107. [Google Scholar] [CrossRef]
- Oke, T.R. The micrometeorology of the urban forest. Philos. Trans. R. Soc. Lond. B Biol. Sci. 1989, 324, 335–349. [Google Scholar] [CrossRef]
- Nicol, D.J.; Macfarlane, D. Formative assessment and self-regulated learning: A model and seven principles of good feedback practice. Stud. High. Educ. 2006, 31, 199–218. [Google Scholar] [CrossRef]
- Monteiro, M.V.; Doick, K.J.; Handley, P.; Peace, A. The impact of greenspace size on the extent of local nocturnal air temperature cooling in London. Urban For. Urban Green. 2016, 16, 160–169. [Google Scholar] [CrossRef]
- Doick, K.J.; Peace, A.; Hutchings, T.R. The role of one large greenspace in mitigating London’s nocturnal urban heat island. Sci. Total Environ. 2014, 493, 662–671. [Google Scholar] [CrossRef] [PubMed]
- Yang, G.; Yu, Z.; Jørgensen, G.; Vejre, H. How can urban blue-green space be planned for climate adaption in high-latitude cities? A seasonal perspective. Sustain. Cities Soc. 2020, 53, 101932. [Google Scholar] [CrossRef]
- De Haas, W.; Hassink, J.; Stuiver, M. The role of urban green space in promoting inclusion: Experiences from the Netherlands. Front. Environ. Sci. 2021, 9, 618198. [Google Scholar] [CrossRef]
- Fischer, L.K.; Honold, J.; Botzat, A.; Brinkmeyer, D.; Cvejić, R.; Delshammar, T.; Elands, B.; Haase, D.; Kabisch, N.; Karle, S.J.; et al. Recreational ecosystem services in European cities: Sociocultural and geographical contexts matter for park use. Ecosyst. Serv. 2018, 31, 455–467. [Google Scholar] [CrossRef]
- Saaroni, H.; Amorim, J.H.; Hiemstra, J.A.; Pearlmutter, D. Urban Green Infrastructure as a tool for urban heat mitigation: Survey of research methodologies and findings across different climatic regions. Urban Clim. 2018, 24, 94–110. [Google Scholar] [CrossRef]
- Sadeghian, M.M.; Vardanyan, Z. A brief review on urban park history, classification and function. Int. J. Sci. Technol. Res. 2015, 4, 120–124. [Google Scholar]
- Du, H.; Cai, W.; Xu, Y.; Wang, Z.; Wang, Y.; Cai, Y. Quantifying the cool island effects of urban green spaces using remote sensing Data. Urban For. Urban Green. 2017, 27, 24–31. [Google Scholar] [CrossRef]
- Jonsson, P. Vegetation as an urban climate control in the subtropical city of Gaborone, Botswana. Int. J. Climatol. A J. R. Meteorol. Soc. 2004, 24, 1307–1322. [Google Scholar] [CrossRef]
- Wong, N.H.; Jusuf, S.K.; La Win, A.A.; Thu, H.K.; Negara, T.S.; Wu, X. Environmental study of the impact of greenery in an institutional campus in the tropics. Build. Environ. 2007, 42, 2949–2970. [Google Scholar] [CrossRef]
- Li, Y.; Ren, C.; Ho, J.Y.E.; Shi, Y. Landscape metrics in assessing how the configuration of urban green spaces affects their cooling effect: A systematic review of empirical studies. Landsc. Urban Plan. 2023, 239, 104842. [Google Scholar] [CrossRef]
- Fan, H.; Yu, Z.; Yang, G.; Liu, T.Y.; Liu, T.Y.; Hung, C.H.; Vejre, H. How to cool hot-humid (Asian) cities with urban trees? An optimal landscape size perspective. Agric. For. Meteorol. 2019, 265, 338–348. [Google Scholar] [CrossRef]
- Yu, Z.; Xu, S.; Zhang, Y.; Jørgensen, G.; Vejre, H. Strong contributions of local background climate to the cooling effect of urban green vegetation. Sci. Rep. 2018, 8, 6798. [Google Scholar] [CrossRef]
- Chibuike, E.M.; Ibukun, A.O.; Abbas, A.; Kunda, J.J. Assessment of green parks cooling effect on Abuja urban microclimate using geospatial techniques. Remote Sens. Appl. Soc. Environ. 2018, 11, 11–21. [Google Scholar] [CrossRef]
- Yu, Z.; Guo, X.; Jørgensen, G.; Vejre, H. How can urban green spaces be planned for climate adaptation in subtropical cities? Ecol. Indic. 2017, 82, 152–162. [Google Scholar] [CrossRef]
- Liu, W.; Zhao, H.; Sun, S.; Xu, X.; Huang, T.; Zhu, J. Green space cooling effect and contribution to mitigate heat island effect of surrounding communities in Beijing metropolitan area. Front. Public Health 2022, 10, 870403. [Google Scholar] [CrossRef]
- NatWest Group. Sheffield Named UK’s Greenest City. 2021. Available online: https://www.natwestgroup.com/news-and-insights/news-room/press-releases/climate/2021/nov/sheffield-named-uks-greenest-city.html (accessed on 14 May 2025).
- Cropper, T.E.; Cropper, P.E. A 133-year record of climate change and variability from Sheffield, England. Climate 2016, 4, 46. [Google Scholar] [CrossRef]
- Sheffield Weather. Monthly Records for June. 2025. Available online: https://www.sheffieldweather.net/monthlyrecord.htm (accessed on 6 July 2025).
- Digimap. 2025. Available online: https://digimap.edina.ac.uk (accessed on 6 July 2025).
- NASA Remote Sensing. 2020. Available online: https://www.earthdata.nasa.gov/learn/backgrounders/remote-sensing#:~:text=Resolution%20can%20vary%20depending%20on,bits%20representing%20the%20energy%20recorded (accessed on 6 July 2025).
- Almeida, C.R.d.; Teodoro, A.C.; Gonçalves, A. Study of the urban heat island (UHI) using remote sensing data/techniques: A systematic review. Environments 2021, 8, 105. [Google Scholar] [CrossRef]
- Anon. Landsat 9. 2022. Available online: https://landsat.gsfc.nasa.gov/satellites/landsat-9 (accessed on 6 July 2025).
- Missions, L. Landsat Collections Land Cloud Cover. 2020. Available online: https://www.usgs.gov/landsat-missions/landsat-collections-land-cloud-cover (accessed on 6 July 2025).
- Twaroch, F.A.; Brindley, P.; Clough, P.D.; Jones, C.B.; Pasley, R.C.; Mansbridge, S. Investigating behavioural and computational approaches for defining imprecise regions. Spat. Cogn. Comput. 2019, 19, 146–171. [Google Scholar] [CrossRef]
- Sheffield City Council Open Data. Parks & Countryside Service Sites. 2025. Available online: https://sheffield-city-council-open-data-sheffieldcc.hub.arcgis.com/datasets/162d40a383fa48cbadc101ef18829bec_12/explore?location=53.395195%2C-1.488850%2C10.67 (accessed on 6 July 2025).
- Morton, R.D.; Marston, C.G.; O’Neil, A.W.; Rowland, C.S. Land Cover Map 2023 (Land Parcels, GB); NERC EDS Environmental Information Data Centre: Lancaster, UK, 2024. [Google Scholar]
- CEH. The UKCEH Land Cover Map for 2023. 2024. Available online: https://www.ceh.ac.uk/data/ukceh-land-cover-maps (accessed on 6 July 2025).
- Hesselbarth, M.H.; Sciaini, M.; With, K.A.; Wiegand, K.; Nowosad, J. Landscapemetrics: An open-source R tool to calculate landscape metrics. Ecography 2019, 42, 1648–1657. [Google Scholar] [CrossRef]
- Maximilian, H.K.; Hesselbarth, M.S.; Nowosad, J.; Hanss, S. Landscapemetrics. 2025. Available online: https://r-spatialecology.github.io/landscapemetrics/index.html (accessed on 6 July 2025).
- Bao, T.; Li, X.; Zhang, J.; Zhang, Y.; Tian, S. Assessing the distribution of urban green spaces and its anisotropic cooling distance on urban heat island pattern in Baotou, China. ISPRS Int. J. Geo-Inf. 2016, 5, 12. [Google Scholar] [CrossRef]
- Tan, X.; Sun, X.; Huang, C.; Yuan, Y.; Hou, D. Comparison of cooling effect between green space and water body. Sustain. Cities Soc. 2021, 67, 102711. [Google Scholar] [CrossRef]
- Schwaab, J.; Meier, R.; Mussetti, G.; Seneviratne, S.; Bürgi, C.; Davin, E.L. The role of urban trees in reducing land surface temperatures in European cities. Nat. Commun. 2021, 12, 6763. [Google Scholar] [CrossRef]
- Jaganmohan, M.; Knapp, S.; Buchmann, C.M.; Schwarz, N. The bigger, the better? The influence of urban green space design on cooling effects for residential areas. J. Environ. Qual. 2016, 45, 134–145. [Google Scholar] [CrossRef] [PubMed]
- Yu, Z.; Yao, Y.; Yang, G.; Wang, X.; Vejre, H. Strong contribution of rapid urbanization and urban agglomeration development to regional thermal environment dynamics and evolution. For. Ecol. Manag. 2019, 446, 214–225. [Google Scholar] [CrossRef]
- Friends of Ecclesall Woods. A Working Woodland. 2025. Available online: https://friendsofecclesallwoods.org.uk/woodland-management (accessed on 6 July 2025).
- The Royal Horticultural Society. Quercus Robur. 2025. Available online: https://www.rhs.org.uk/plants/14294/quercus-robur/details (accessed on 6 July 2025).
- Boalch, J.G.M. How to Identify Common UK Grasses. 2021. Available online: https://naturescalendar.woodlandtrust.org.uk/blog/2021/how-to-identify-common-uk-grasses (accessed on 6 July 2025).
- Ogunbadewa, E.Y.; Armitage, R.P.; Danson, F.M. Optical medium spatial resolution satellite constellation data for monitoring woodland in the UK. Forests 2014, 5, 1798–1814. [Google Scholar] [CrossRef]
- Boegh, E.; Houborg, R.; Bienkowski, J.; Braban, C.F.; Dalgaard, T.; Van Dijk, N.; Dragosits, U.; Holmes, E.; Magliulo, V.; Schelde, K.; et al. Remote sensing of LAI, chlorophyll and leaf nitrogen pools of crop-and grasslands in five European landscapes. Biogeosciences 2013, 10, 6279–6307. [Google Scholar] [CrossRef]
- Sheffield City Council. Parks and Green Spaces. 2025. Available online: https://www.sheffield.gov.uk/parks-sport-recreation/parks-green-spaces (accessed on 6 July 2025).
- Alexander, C. Normalised difference spectral indices and urban land cover as indicators of land surface temperature (LST). Int. J. Appl. Earth Obs. Geoinf. 2020, 86, 102013. [Google Scholar] [CrossRef]
- An, H.; Cai, H.; Xu, X.; Qiao, Z.; Han, D. Impacts of urban green space on land surface temperature from urban block perspectives. Remote Sens. 2022, 14, 4580. [Google Scholar] [CrossRef]
- Algretawee, H.; Rayburg, S.; Neave, M. Estimating the effect of park proximity to the central of Melbourne city on Urban Heat Island (UHI) relative to Land Surface Temperature (LST). Ecol. Eng. 2019, 138, 374–390. [Google Scholar] [CrossRef]
- Asgarian, A.; Amiri, B.J.; Sakieh, Y. Assessing the effect of green cover spatial patterns on urban land surface temperature using landscape metrics approach. Urban Ecosyst. 2015, 18, 209–222. [Google Scholar] [CrossRef]
- Chen, D.; Zhang, F.; Zhang, M.; Meng, Q.; Jim, C.Y.; Shi, J.; Tan, M.L.; Ma, X. Landscape and vegetation traits of urban green space can predict local surface temperature. Sci. Total Environ. 2022, 825, 154006. [Google Scholar] [CrossRef] [PubMed]
- Huang, J.; Lu, X.; Wang, Y. Spatio-Temporal Changes and Key Driving Factors of Urban Green Space Configuration on Land Surface Temperature. Forests 2024, 15, 812. [Google Scholar] [CrossRef]
- Yan, L.; Jia, W.; Zhao, S. The cooling effect of urban green spaces in metacities: A case study of Beijing, China’s capital. Remote Sens. 2021, 13, 4601. [Google Scholar] [CrossRef]
- Gunawardena, K.R.; Wells, M.J.; Kershaw, T. Utilising green and bluespace to mitigate urban heat island intensity. Sci. Total Environ. 2017, 584, 1040–1055. [Google Scholar] [CrossRef] [PubMed]
- Zhou, W.; Shen, X.; Cao, F.; Sun, Y. Effects of area and shape of greenspace on urban cooling in Nanjing, China. J. Urban Plan. Dev. 2019, 145, 04019016. [Google Scholar] [CrossRef]
- Mears, M.; Brindley, P.; Maheswaran, R.; Jorgensen, A. Understanding the socioeconomic equity of publicly accessible greenspace distribution: The example of Sheffield, UK. Geoforum 2019, 103, 126–137. [Google Scholar] [CrossRef]
- Sales, K.; Walker, H.; Sparrow, K.; Handley, P.; Vaz Monteiro, M.; Hand, K.L.; Buckland, A.; Chambers-Ostler, A.; Doick, K.J. The canopy cover Webmap of the United Kingdom’s towns and cities. Arboric. J. 2023, 45, 258–289. [Google Scholar] [CrossRef]
- Liu, Z.; Cheng, K.Y.; Amati, M.; Jim, C.Y.; Hua, C.; Yokohari, M.; Cameron, R.; Ng, E. Creating a thermally comfortable city through urban green infrastructure: An international review of greening policies. Urban For. Urban Green. 2025, 105, 128713. [Google Scholar] [CrossRef]
- City of Sydney, Greening Sydney Strategy. 2021. Available online: https://www.cityofsydney.nsw.gov.au/strategies-action-plans/greening-sydney-strategy (accessed on 6 July 2025).
- Robinson, J.M.; Mavoa, S.; Robinson, K.; Brindley, P. Urban centre green metrics in Great Britain: A geospatial and socioecological study. PLoS ONE 2022, 17, e0276962. [Google Scholar] [CrossRef] [PubMed]
- SatVu. High Resolution Thermal Data from Space for a Safer and More Sustainable Earth. 2025. Available online: https://www.satellitevu.com/ (accessed on 6 July 2025).
Disclaimer/Publisher’s Note: The statements, opinions and data contained in all publications are solely those of the individual author(s) and contributor(s) and not of MDPI and/or the editor(s). MDPI and/or the editor(s) disclaim responsibility for any injury to people or property resulting from any ideas, methods, instructions or products referred to in the content. |
© 2025 by the authors. Licensee MDPI, Basel, Switzerland. This article is an open access article distributed under the terms and conditions of the Creative Commons Attribution (CC BY) license (https://creativecommons.org/licenses/by/4.0/).