Article

Delineation and Intensity Classification of Freeze–Thaw Erosion in the Western Section of Northern China’s Agro-Pastoral Transition Zone Under Controlling Factors

1
School of Geography, Qinghai Normal University, Xining 810008, China
2
Academy of Plateau Science and Sustainability, Xining 810008, China
3
School of National Safety and Emergency Management, Qinghai Normal University, Xining 810008, China
*
Author to whom correspondence should be addressed.
Land 2025, 14(11), 2278; https://doi.org/10.3390/land14112278
Submission received: 14 October 2025 / Revised: 12 November 2025 / Accepted: 13 November 2025 / Published: 18 November 2025

Abstract

Global warming has intensified freeze–thaw activity in high-latitude and high-altitude regions; along the western sector of the farming–pastoral ecotone in northern China, pronounced seasonal freeze–thaw cycles now pose a severe threat to land resources. This study aims to quantitatively reveal the spatial differentiation patterns of freeze–thaw erosion in the western segment and its influencing factors. This study begins with the fundamental concepts of freeze–thaw erosion, grounded in soil mechanical fragmentation and gravitational migration. Critical slope is used as the identification criterion to delineate freeze–thaw erosion zones. Building upon this foundation, a Random Forest model is employed to calculate the weighting factors influencing freeze–thaw erosion in the western segment of the northern agro-pastoral transition zone, thereby constructing a graded evaluation model for freeze–thaw erosion intensity. Results indicate the following: (1) Freeze–thaw erosion exhibits no discernible distribution pattern in the western segment, appearing scattered, while non-freeze–thaw erosion is primarily concentrated in the northern region. (2) Freeze–thaw erosion intensity ranges from 1.48 to 4.58 in the western segment. The total area of the study region is 151,000 km2, the affected area spans 122,400 km2, accounting for 81.11% of the total regional area. (3) Regionally, the Hehuang Valley exhibits predominantly strong and severe erosion, while the northern Loess Plateau shows mostly slight erosion. The southern Loess Plateau features light and moderate erosion with scattered instances of severe erosion. (4) Vegetation coverage and soil moisture are the primary contributing factors to freeze–thaw erosion. This study proposes, for the first time, a method that couples annual freeze–thaw day cycles with a critical slope threshold to delineate freeze–thaw erosion zones, demonstrating broad applicability. It systematically uncovers the spatial heterogeneity of freeze–thaw erosion in the western sector, substantially advancing scientific understanding of the process and providing a theoretical basis for its targeted management.

1. Introduction

Freeze–thaw erosion is one of China’s three major soil erosion types, primarily occurring in high-latitude, high-altitude, and cold regions [1]. According to data from the Second National Soil Erosion Monitoring Survey, areas susceptible to freeze–thaw erosion in China cover 1,268,900 km2, accounting for 13.36% of the country’s total land area [2]. Freeze–thaw erosion alters soil’s physicochemical properties and destabilizes slope soils, supplying material for other erosive forces [3]. Furthermore, water and soil loss, geological hazards, and other issues caused by freeze–thaw processes pose severe threats to the ecological environment and human activities on plateaus [4].
The agro-pastoral transition zone in northern China lies at the boundary between arid and semi-humid regions, serving as a crucial ecological barrier for the country [5]. The western segment of this zone, situated at the transition between the Qinghai–Tibet Plateau and the Loess Plateau, possesses an extremely fragile ecosystem. Freeze–thaw erosion alters soil physicochemical properties and reduces productivity, while also constituting a primary source of sediment transport in rivers [6,7]. This region exhibits combined wind and water erosion constrained by freeze–thaw processes, with freeze–thaw erosion serving as the prerequisite and foundation for studying soil composite erosion [8]. In recent years, freeze–thaw effects have intensified in high-latitude, high-altitude areas [1], particularly in the western segment of the northern China agro-pastoral transition zone where seasonal freeze–thaw cycles are pronounced. Land resources face severe threats, yet scientific understanding of the spatial differentiation patterns of freeze–thaw erosion in this western segment remains limited.
Current research on freeze–thaw erosion primarily focuses on delineating the extent of freeze–thaw erosion zones. Zhang Jianguo et al. proposed defining the lower boundary of the periglacial zone as the lower boundary of the freeze–thaw erosion zone, determining its extent by noting that the lower boundary of the periglacial zone is approximately 200 m lower than that of the permafrost zone [9]. Against the backdrop of global climate warming, the permafrost and periglacial zones are shifting, so the static boundary increasingly deviates from reality. For intensity assessment, two approaches dominate: weight-of-evidence (scoring) methods and visual interpretation. LU et al. [2] combined multi-source data with a weighted-index scheme to map freeze–thaw erosion intensity under extreme weather. Cui Juanjuan [10] and Li Dong [11] applied the same technique on the Qinghai–Tibet Plateau and in Gansu Province, integrating meteorological, topographic, and vegetation indicators. Visual interpretation relies on distinguishing erosion signatures in satellite imagery [12] but lacks standardized criteria and is strongly subjective. Consequently, the weighted-index method is currently preferred. In this study we first adopted the conventional 200 m offset rule to map the freeze–thaw erosion zone in the western part of the farming–pastoral ecotone of northern China. The resultant zone lay mainly in the far west of the region, conspicuously mismatched with field observations. Given this, the extent of freeze–thaw erosion zones is defined using a dual-indicator approach that combines the annual number of freeze–thaw cycles with slope gradient critical thresholds. This approach originates from the fundamental concept of freeze–thaw erosion, defining its spatial extent by calculating the intersection between freeze–thaw activity zones and erosion zones. It provides a universal framework for understanding the basic processes of freeze–thaw erosion. Building upon this foundation, analyzing the influencing factors of freeze–thaw erosion intensity and classifying its severity levels enhances scientific understanding of the spatial distribution of freeze–thaw erosion in the western section. This offers crucial scientific basis for the prevention and control of freeze–thaw erosion in high-altitude cold regions and the protection of their ecological environments.

2. Materials and Methods

2.1. Overview of the Study Area

The northern agro-pastoral transition zone of China lies in the transitional area between arid and semi-humid regions, featuring an extremely fragile ecological environment. Given the differing criteria used by various scholars to delineate the boundaries of this northern agro-pastoral transition zone, this study adopts the boundaries defined by Wang Jing’ai et al. as the standard [5]. The research area selected is the western segment of the northern agro-pastoral transition zone, situated in the ecologically most vulnerable region where the Qinghai–Tibet Plateau transitions to the Loess Plateau (Figure 1). Geographically, this western segment spans between 34°50′–38°10′ N, and 100°50′–108°40′ E, covering a total area of 151,000 km2. Elevations range from 800 m to 4800 m, with a vertical gradient of 4000 m. The terrain slopes from west to east, primarily composed of mountains and hills. The western segment of the northern agro-pastoral transition zone predominantly experiences a temperate continental climate, with plateau mountain climates also present in the west. Annual average temperatures range from −9 °C to 12 °C, exhibiting significant seasonal variation. Annual precipitation averages between 143 mm and 708 mm, and seasonal permafrost is widely distributed. Land use is dominated by cultivated fields and grasslands. Predominant soil types include loam and calcareous gray soils. The administrative region encompasses three provinces/autonomous regions—Qinghai, Gansu, and Ningxia Hui Autonomous Region—involving 13 prefecture-level cities and 57 counties/districts under their jurisdiction. The Seventh National Census recorded a total population of approximately 19.85 million.

2.2. Data Sources

The original data used in this article includes the following: Digital Elevation Model (DEM) data primarily sourced from the National Aeronautics and Space Administration (NASA) and the National Imagery and Mapping Agency (NIMA) data platforms, with a resolution of 30 m. Slope and aspect were derived from the DEM data using ArcGIS 10.8.1 terrain analysis tools. Soil moisture data were sourced from the China-wide 1 km-resolution soil moisture dataset SMCI1.0 provided by the National Science Data Center for the Tibetan Plateau. This dataset features daily temporal resolution for the year 2022, with spatial resolution of 1 km, representing water content in the 0–10 cm soil profile unitized in m3/m3. NDVI data were sourced from the China Regional 250 m Normalized Difference Vegetation Index dataset of the National Qinghai–Tibet Plateau Science Data Center, with a temporal resolution of monthly for the year 2022 and a spatial resolution of 1 km. Daily maximum and minimum temperatures were obtained from the Zenodo platform database, featuring a temporal resolution of daily for the year 2022 and a spatial resolution of 1 km.

2.3. Delineation of the Freeze–Thaw Erosion Zone

Freeze–thaw erosion refers to the entire process in high-altitude cold regions where water within soil or rock undergoes phase transitions due to temperature fluctuations, resulting in volume changes. This leads to mechanical destruction of soil or rock caused by differential expansion and contraction of different minerals within them. Subsequently, under the influence of gravity and other forces, the eroded material is transported, migrated, and deposited [13]. The occurrence of soil freeze–thaw erosion requires two core conditions: freeze–thaw action and erosion. Freeze–thaw action refers to the alternating freezing and thawing of soil layers under environmental conditions where temperatures fluctuate between below and above zero degrees Celsius. A freeze–thaw day cycle is typically defined as a 24 h period with a maximum temperature above 0 °C and a minimum temperature below 0 °C [14]. The annual freeze–thaw day cycle count refers to the number of days in a year where such cycles occur [15], reflecting the extent and intensity of freeze–thaw action. Here, areas with an annual freeze–thaw day cycle count greater than zero are defined as freeze–thaw zones. However, freeze–thaw action alone does not directly cause the transport or displacement of soil particles. Soil movement occurs only when driven by gravitational erosion or other erosive forces, thereby forming freeze–thaw erosion [16]. Topography directly influences soil erosion by affecting the potential energy and stability of surface soil, with slope providing the dynamic conditions for gravitational erosion. When slope steepens, downslope forces increase, causing slope instability—the mechanical prerequisite for gravitational erosion and the direct determinant of its occurrence [17]. Extensive laboratory simulations by domestic and international researchers demonstrate that slopes increase downslope forces, reduce shear resistance, and weaken slope stability, thereby triggering gravitational erosion [18]. In the Loess Plateau region, slope gradient is recognized as the primary factor influencing gravitational erosion occurrence [19]. Laboratory simulations and field observations consistently indicate that the critical gradient for the transition from sheet erosion to gravity-driven erosion on the Loess Plateau (yuan, liang, and mao relief) is 22° [20,21]. Once the slope exceeds 20°, processes such as gully wall collapse and soil falls intensify sharply, and roughly 80% of all gravity erosion is concentrated within this steeper range [22]. UAV photogrammetry and statistical analyses further confirm that slopes >20–22° act as the “geomorphic threshold” at which large-scale gravitational erosion is triggered in Loess hill-and-gully terrain [23,24]. On the Qinghai–Tibet Plateau, gravity erosion occurs mainly between 15° and 30° [25], a range that overlaps and connects seamlessly with the 20–22° critical interval documented for the Loess Plateau. The western segment of the northern agro-pastoral transition zone lies in the transitional region between the Qinghai–Tibet Plateau and the Loess Plateau. Characterized by complex topography, crisscrossed gully networks, fragmented surfaces, and loose soil, this area possesses an extremely fragile ecological environment where freeze–thaw erosion induced by gravitational forces occurs. Based on this, this study integrates relevant research from domestic and international scholars and comprehensively considers landform characteristics. Areas with slopes greater than or equal to 22° are defined as zones subject to gravitational erosion. Building upon this, the intersection between zones of freeze–thaw action and gravitational erosion is calculated to delineate zones of freeze–thaw erosion (Figure 2). The expression is as follows:
A ( f r e e z e t h a w   e r o s i o n   z o n e ) = B ( f r e e z e t h a w   a c t i o n   z o n e ) C ( g r a v i t a t i o n a l   e r o s i o n   z o n e )
In the formula: The number of annual freeze–thaw cycles serves as the quantitative indicator for B. If the annual freeze–thaw cycle count > 0, freeze–thaw action is present; conversely, if the annual freeze–thaw cycle count ≤ 0, freeze–thaw action is absent. Areas with slopes ≥ 22° are defined as gravitational erosion zone. Finally, the intersection of B and C defines the freeze–thaw erosion zone A, where B ∩ C = {x|x ∈ freeze–thaw zone and x ∈ gravity erosion zone}.

2.4. Freeze-Thaw Erosion Intensity Evaluation System

2.4.1. Method for Calculating the Comprehensive Evaluation Index

The article employs a comprehensive evaluation index to assess the intensity of freeze–thaw erosion in the western section. The comprehensive evaluation index refers to an evaluation method that synthesizes multiple influencing factors into a single index, as expressed in Equation (2). In regional calculations, a higher evaluation index indicates more severe soil erosion in that area [26].
I = i = 1 n W i I i / i = 1 n W i
In the formula: Wi represents the weight corresponding to each single factor evaluation index, Ii denotes the assigned value for each single factor, and I is the comprehensive evaluation index.

2.4.2. Graded Evaluation Indicators and Standards

Freeze–thaw erosion is influenced by multiple interacting factors. In the evaluation of freeze–thaw erosion in the Ili River Valley region, factors such as annual precipitation, annual temperature range, vegetation, slope gradient, and aspect have been identified as core driving factors [27]. Relevant studies on the Qinghai–Tibet Plateau further indicate that, in addition to slope gradient, aspect, and vegetation, the number of freeze–thaw cycles per day, precipitation during the freeze–thaw period, wind field intensity, and rainfall erosion potential are also key variables determining erosion intensity [28]. Related studies have also indicated that soil texture, temperature conditions, topographic undulations, and slope aspect exert significant regulatory effects on the freeze–thaw process [29]. In the northern water diversion project area, climatic characteristics, soil properties, topographic conditions, and hydrogeological factors collectively determine the intensity of freeze–thaw erosion [30]. Selecting data points that are both significantly influential and readily collectable from numerous relevant factors is crucial for establishing the basis for assessing and classifying freeze–thaw erosion. In conducting the grading evaluation, this study primarily selected five key factors: the number of freeze–thaw cycles per day, soil moisture, slope gradient, slope aspect, and vegetation coverage.
The annual number of freeze–thaw cycles is a key factor in evaluating freeze–thaw erosion, studies indicate that significant diurnal temperature fluctuations lead to pronounced freeze–thaw erosion in soils [31]. This paper calculates daily freeze–thaw erosion based on the daily maximum and minimum temperatures. When the maximum temperature exceeds 0 °C and the minimum temperature is ≤0 °C, it indicates the presence of a freeze–thaw cycle. The annual number of freeze–thaw cycles is then accumulated based on this criterion. The western section exhibits annual freeze–thaw cycles ranging from 0 to 185 days, categorized into five tiers. Higher annual freeze–thaw cycle counts correlate with greater diurnal temperature fluctuations in soil, increased frequency of phase transitions, and more pronounced freeze heave–thaw shrinkage effects.
Soil moisture, or soil water content, is one of the key factors influencing the soil freeze–thaw process. Studies on the microstructure of soil aggregates under freeze–thaw cycles revealed that increased soil moisture accelerates aggregate disintegration during the freeze–thaw processes [32]. When soil moisture is high, liquid water undergoes phase transition to form ice crystals. These ice crystals enlarge the voids between soil particles, ultimately loosening the soil structure. As the soil thaws, melting ice crystals cause soil particles to detach and be transported, thereby accelerating the occurrence of freeze–thaw erosion. Soil moisture data were obtained from the 0–10 cm soil profile, with moisture content ranging from 0.15 to 0.39 m3/m3 in the western section.
The influence of topography on freeze–thaw erosion primarily manifests through two dimensions: slope gradient and aspect. By analyzing the effects of freeze–thaw cycles on soil separation and erosion, studies indicate that both processes intensify with increasing slope gradient [1]. The western section predominantly features mountainous and hilly terrain, where steep mountain slopes and gently sloping, elongated hills create topographic conditions conducive to the movement and transport of freeze–thaw erosion products. Regarding aspect, sun-facing slopes receive stronger and longer sunlight exposure, with greater diurnal temperature variations. The intense freeze–thaw cycles on these slopes lead to freeze–thaw erosion, whereas the opposite occurs on shaded slopes [33]. This study extracted slope gradient and aspect from a Digital Elevation Model and classified them into five levels. Specifically, slopes range from 0 to 82°. Aspects are determined based on solar radiation intensity: 0–22.5° and 337.2–360° are classified as north; 22.5–67.5° and 292.5–337.5° as northeast and northwest; 67.5–112.5° and 247.5–292.5° as east and west; 112.5–157.5° and 202.5–247.5° for southeast and southwest; and 157.5–202.5° for south.
Vegetation influences freeze–thaw erosion by stabilizing soil through its root systems and reducing surface water runoff. Studies investigating the effects of freeze–thaw cycles on soil erosion resistance and physical properties indicate that plant roots play a role in reducing soil loss [34,35]. In the western section, vegetation cover ranges from 0% to 100% and is categorized into five levels. Higher vegetation cover correlates with reduced freeze–thaw erosion intensity.
Based on the specific distribution characteristics and value ranges of the aforementioned indicators within the study area, drawing on the theoretical contributions of scholars such as Shi Zhan et al. [13,36], this paper further clarifies the assignment standards for each indicator. For detailed content, please refer to Table 1.

2.4.3. Weighting of Comprehensive Evaluation Index and Classification of Erosion Intensity

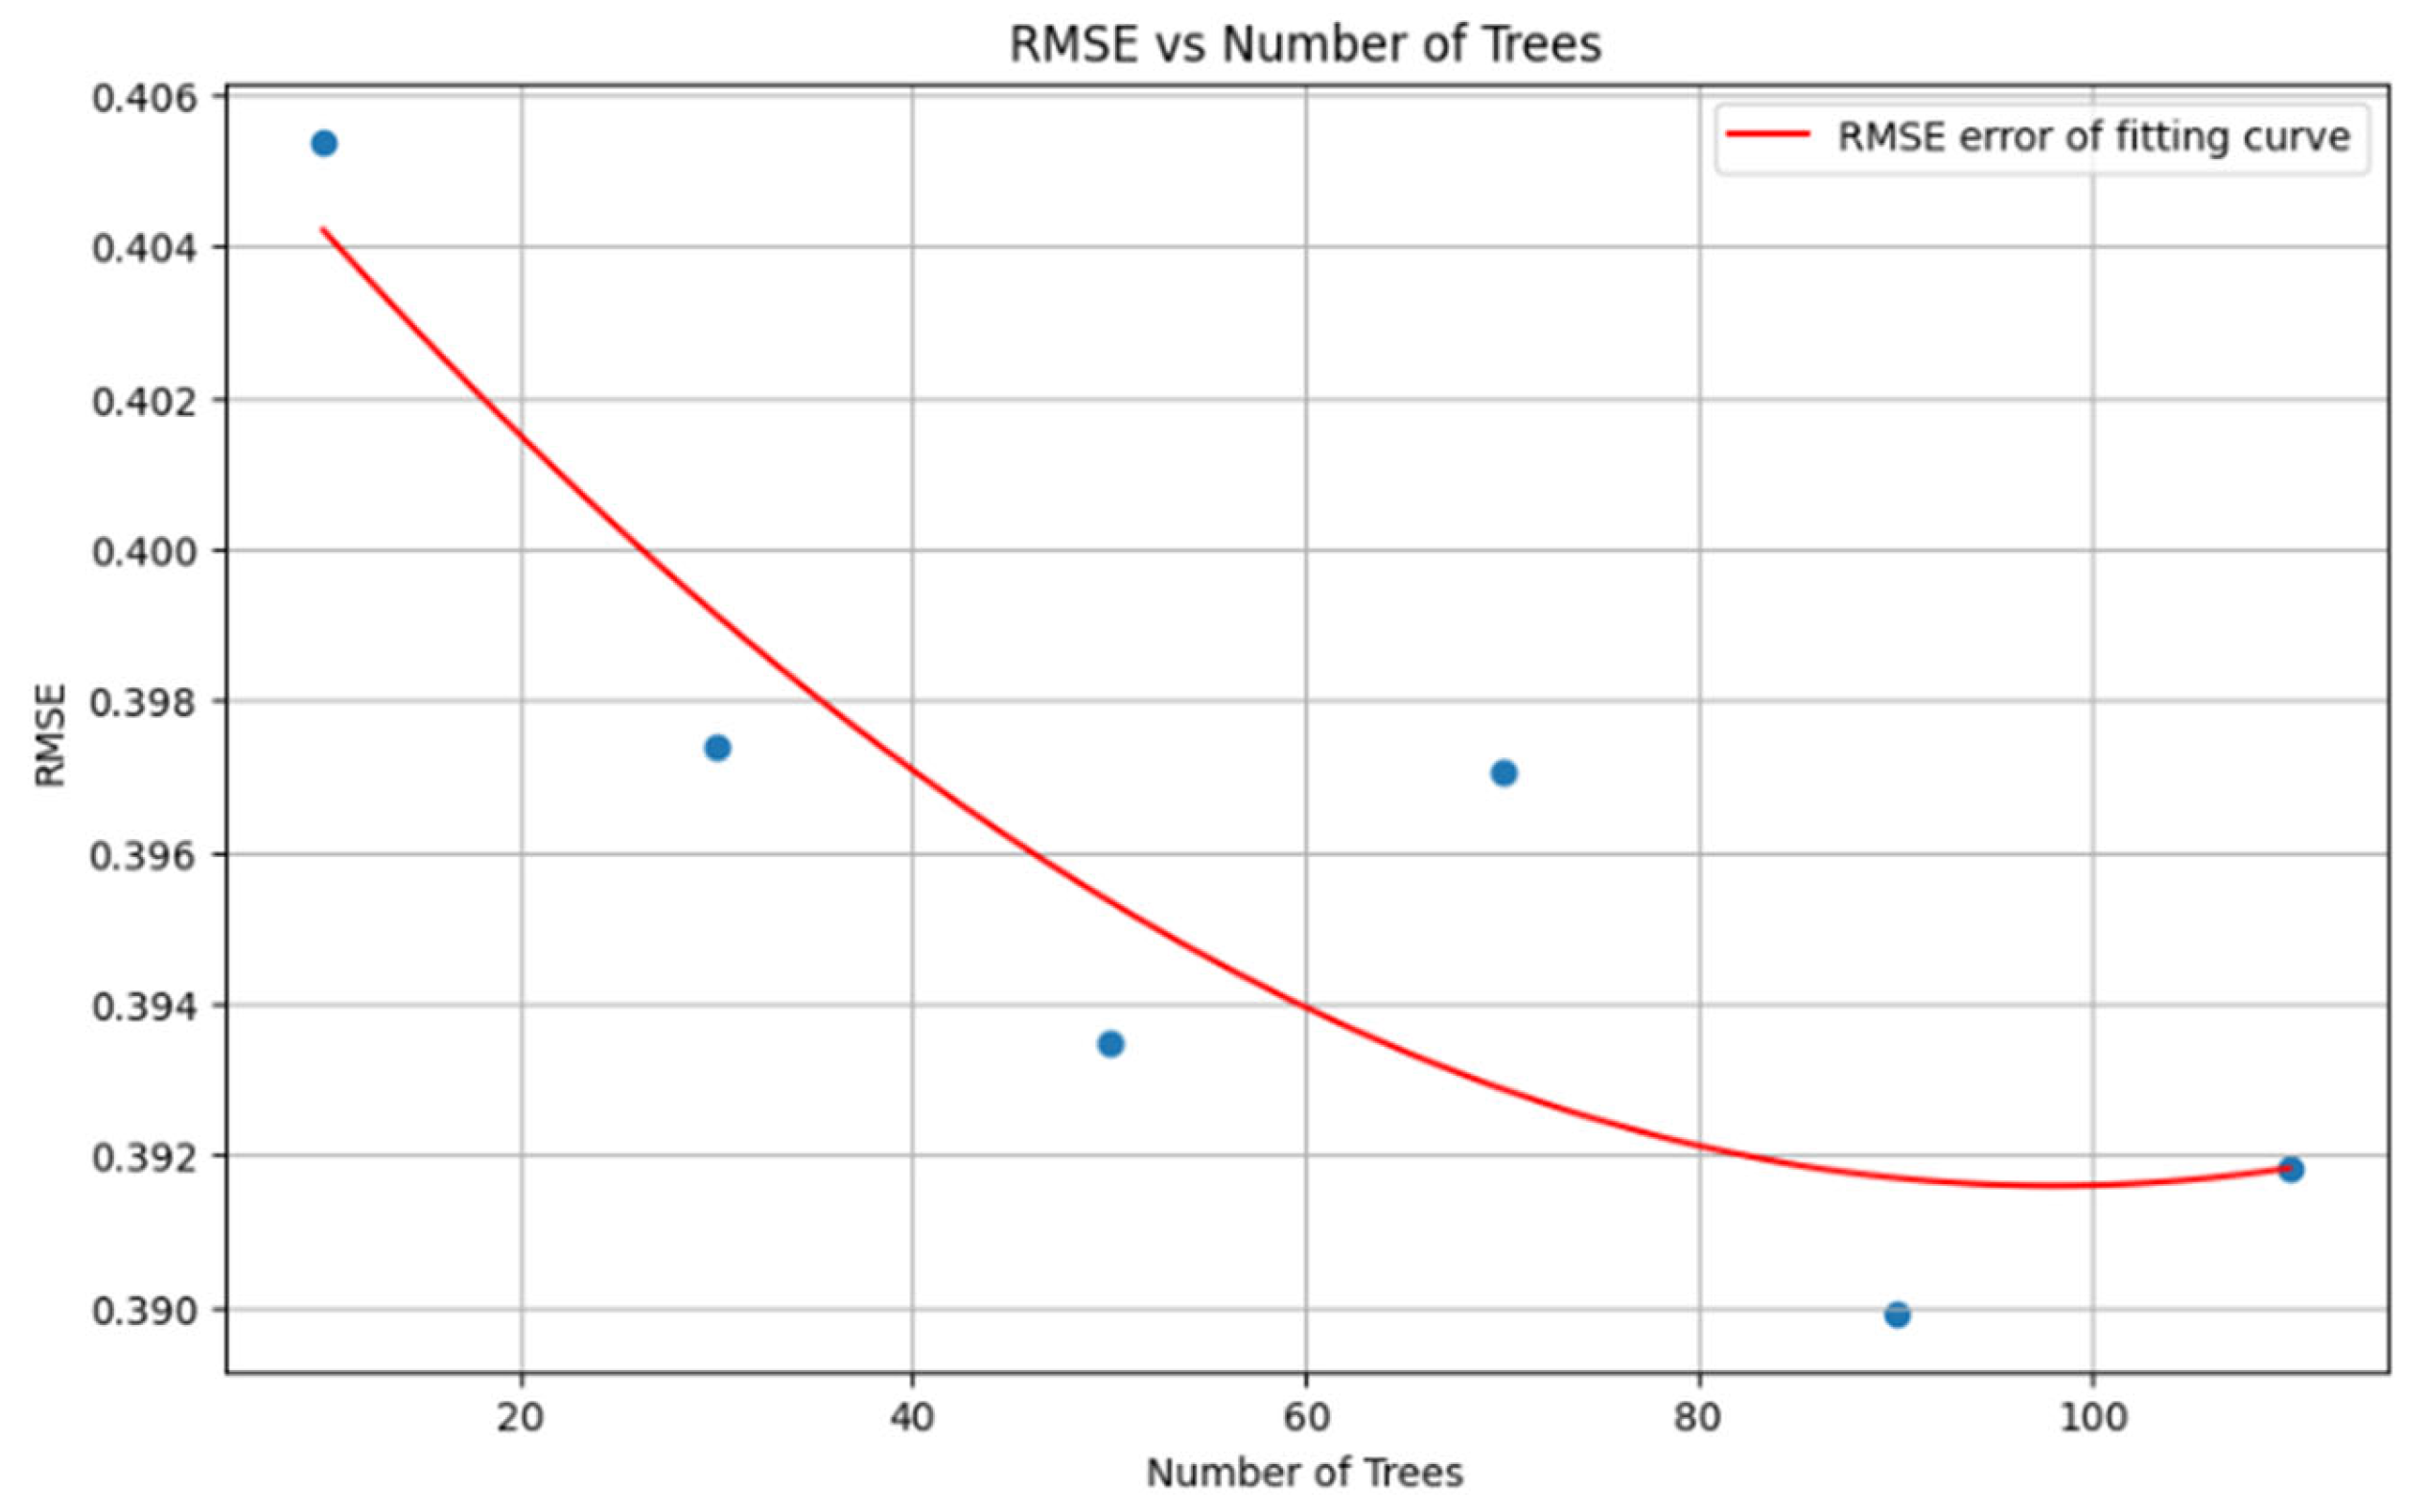
This study comprehensively considers multiple factors influencing freeze–thaw erosion intensity, such as temperature, precipitation, topography, and vegetation. In this study, the Random Forest classifier from the Python 3.6-based ensemble-learning library (Scikit-learn) was employed as the core algorithm to simulate the response relationship between freeze–thaw erosion intensity and its driving factors and to quantify the contribution of each predictor. As shown in Table 2, 75% of the samples were randomly selected for model training and the remaining 25% for independent validation; the simulation was performed under the hypothesis that erosion intensity is conditionally dependent on the five influencing factors. Freeze–thaw erosion intensity served as the dependent variable, while the five indicator variables were treated as independent predictors. To ensure the accuracy and reliability of the Random Forest model, the root mean square error (RMSE) was introduced as the evaluation metric. RMSE effectively measures the deviation between predicted and observed values, allowing us to precisely assess the predictive accuracy of each factor with respect to freeze–thaw erosion intensity [37]. The minimum RMSE of 0.390 was achieved when the number of trees was set to 90 (Figure 3), indicating that the model attained a high predictive accuracy under this parameterization and that the derived factor contributions are therefore reasonable and robust [38]. Integrating field observation data, the natural break method in ArcGIS was applied to classify the freeze–thaw erosion intensity in the western section (Table 3).

3. Results

3.1. Spatial Distribution Characteristics of Freeze–Thaw Erosion Zones

By overlaying spatial distribution maps of annual freeze–thaw cycles and slope gradients in the western segment of the northern agro-pastoral transition zone, and excluding areas such as glaciers, deserts, and lakes, we ultimately derived a spatial distribution map of freeze–thaw erosion zones in this region, as shown in Figure 4.
Overall, freeze–thaw erosion is widespread but scattered across the western sector of the farming–pastoral ecotone in northern China, being primarily controlled by vegetation cover and soil moisture. In high-altitude zones, abundant glaciers and snowpacks maintain high soil moisture levels while large proportions of bare or sparsely vegetated ground enhance freeze–thaw cycling, so erosion is readily triggered. By contrast, the northern part of the region is dominated by non-freeze–thaw erosion types. There, low erosion intensity can be attributed to the following: (i) dense vegetation (mainly cropland and meadow) whose root systems bind the soil; (ii) low soil moisture, which lessens the destructive phase change in water during freezing and thawing; and (iii) gentle, flat topography that restricts soil displacement during freeze–thaw cycles. Together these factors increase soil resistance and render freeze–thaw erosion features scarce.

3.2. Spatial Distribution of Freeze-Thaw Erosion Intensity

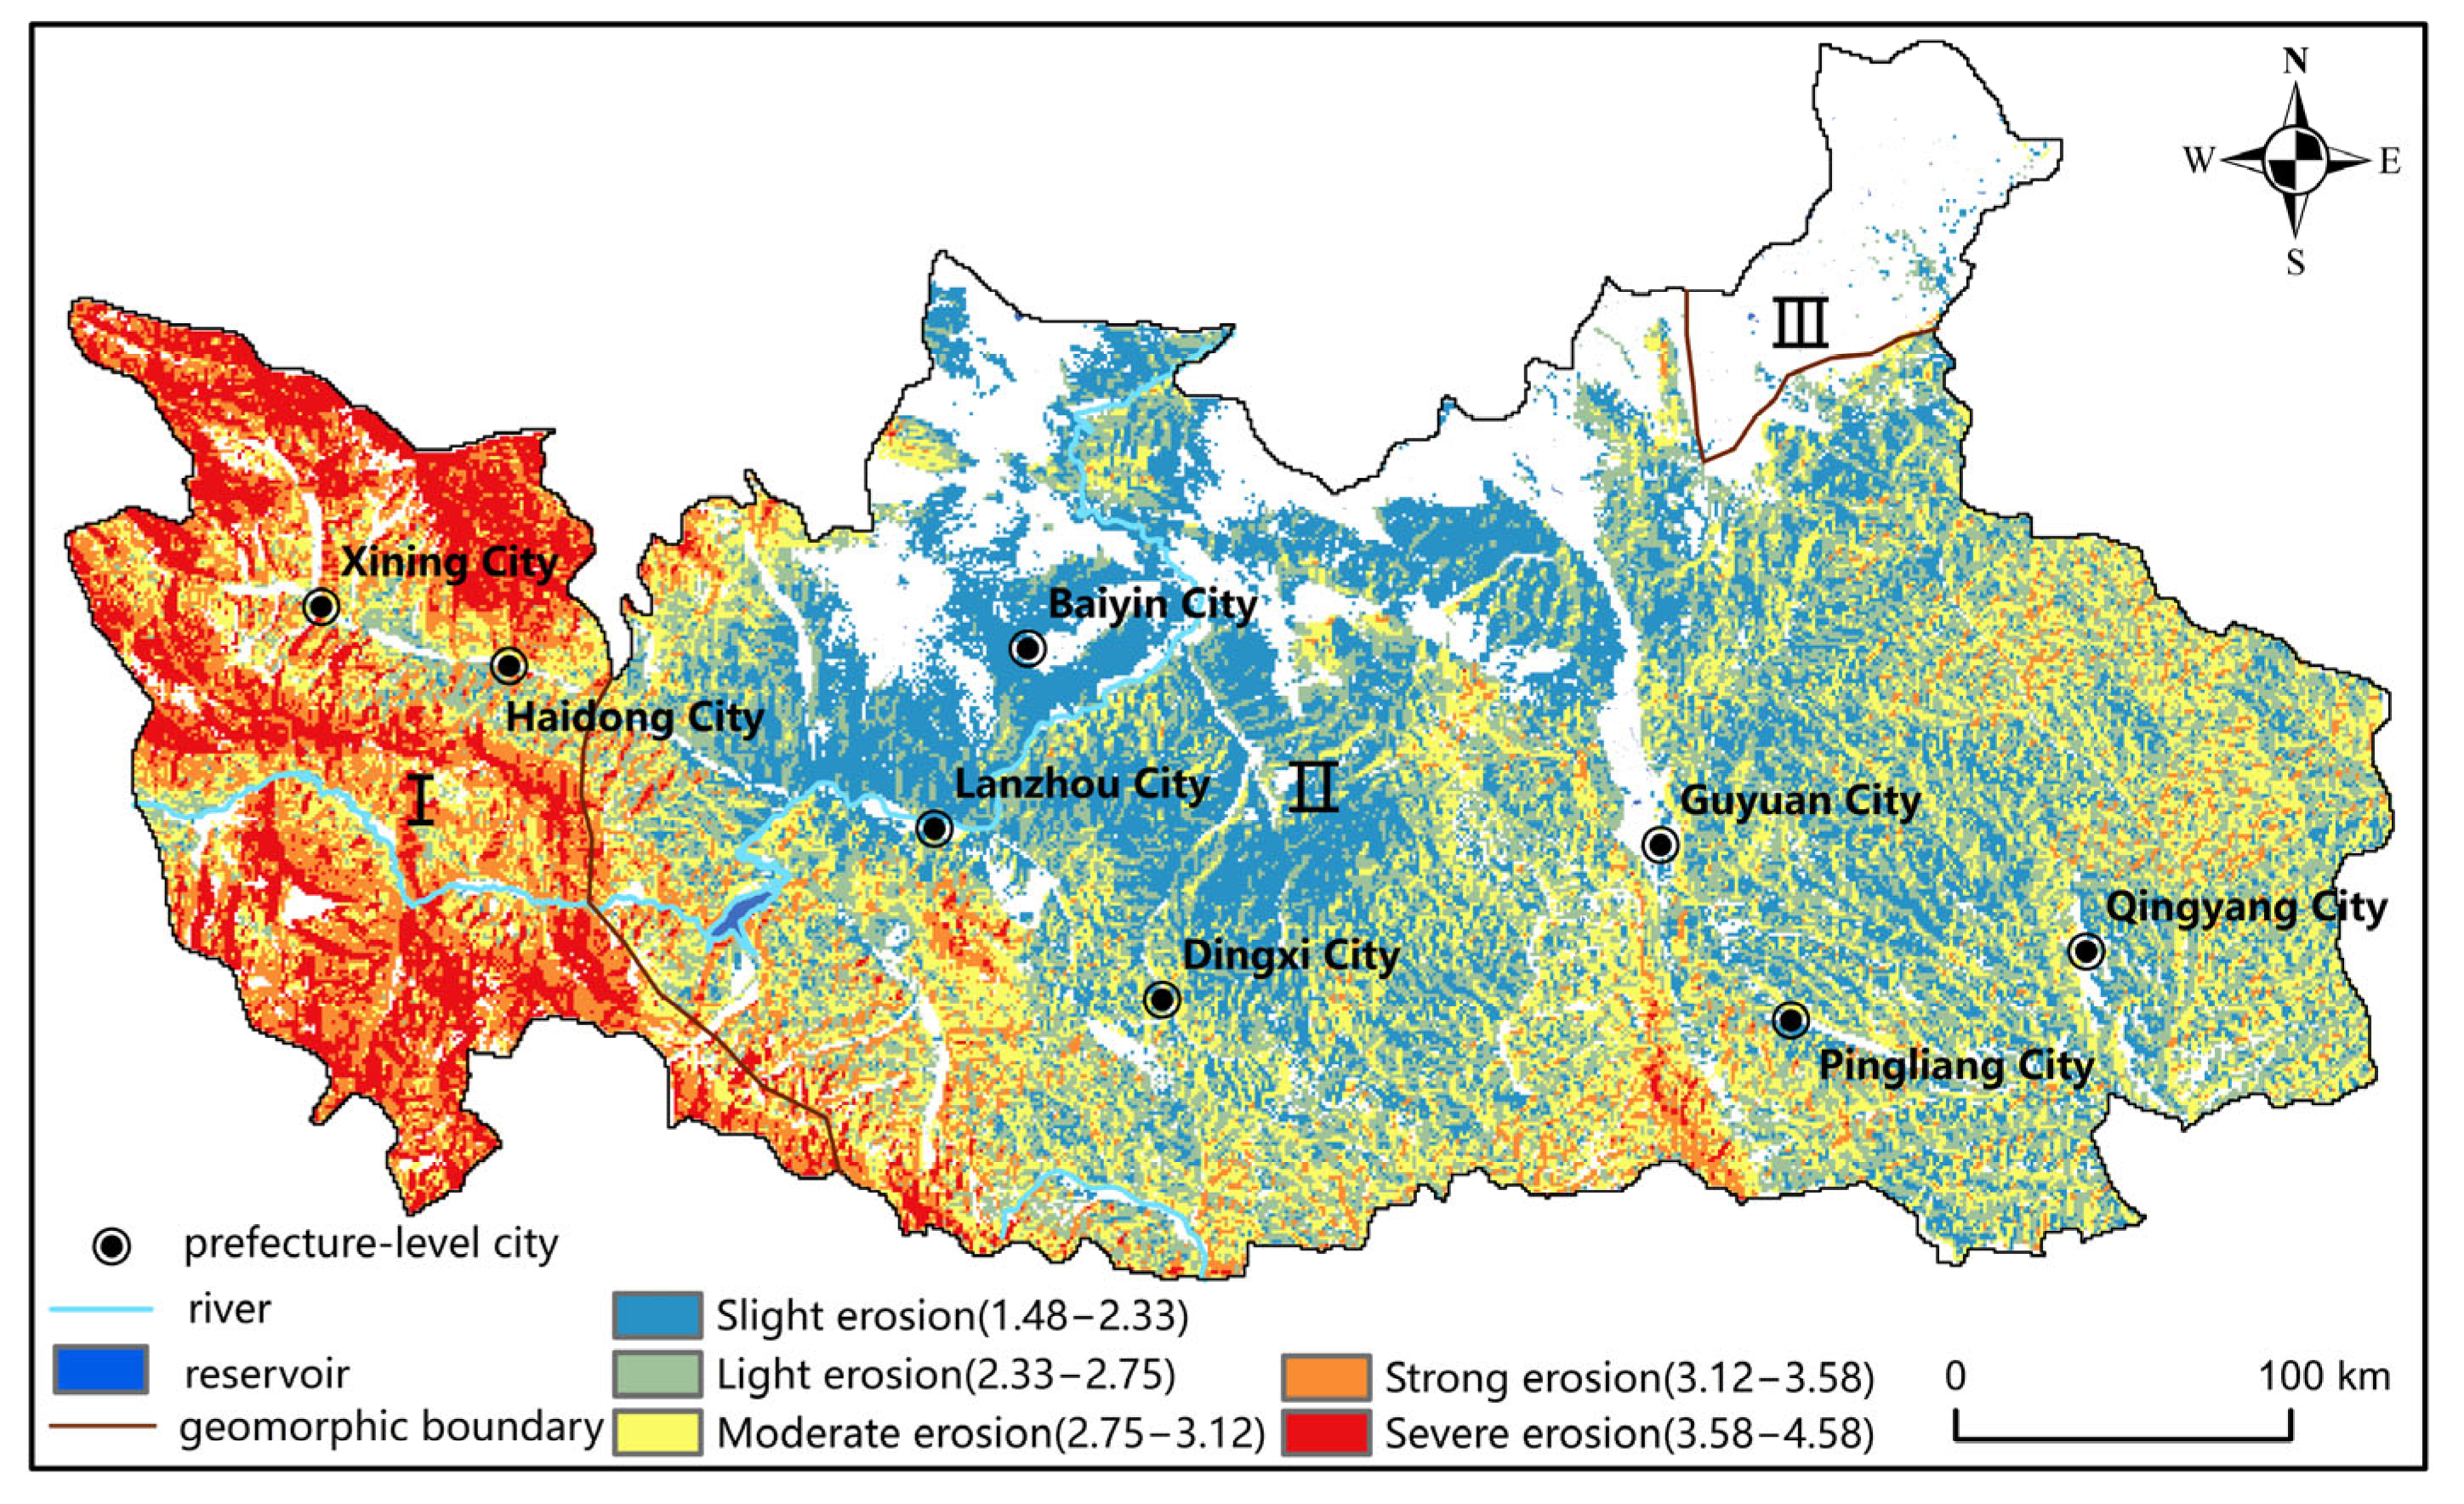
Based on the freeze–thaw erosion intensity classification criteria in Table 1, each influencing factor was graded and assigned a value. Combining the weight coefficients for each factor in Table 2, the freeze–thaw erosion intensity index for the western segment was calculated to be between 1.48 and 4.58 using the comprehensive evaluation index model. Finally, using the natural breakpoint method and the classification criteria in Table 3, the freeze–thaw erosion intensity in the western segment of the northern agro-pastoral transition zone was categorized. This process yielded the freeze–thaw erosion intensity classification map for the western segment of the northern agro-pastoral transition zone (Figure 5).
The western section of the northern agro-pastoral transition zone exhibits extensive distribution of freeze–thaw erosion, covering an area of 122,400 km2, accounting for 81.11% of the total study area. Moderate erosion areas constitute the largest portion of the freeze–thaw erosion zone, covering 48,300 km2(Table 4). These areas are primarily distributed in the southern Loess Plateau (I) and the Huangshui River Valley Basin Region (II). This distribution pattern is closely related to factors such as soil moisture, topography, and vegetation coverage in these regions. Light erosion areas follow with 32,700 km2, predominantly located in the Loess Plateau region (I), with minor distributions in the Huangshui River Valley Basin Region (II). These areas feature relatively high vegetation cover, low soil moisture content, gentle topography, and low slopes, collectively resulting in weaker freeze–thaw erosion. Severe erosion zones cover 15,800 km2, predominantly distributed in the Huangshui River Valley Basin Region (II). Their spatial distribution is significantly influenced by topography and vegetation cover conditions. The area of slight erosion areas covers 14,800 km2, primarily distributed in the northern Loess Plateau (I). The Ordos Plateau region has some areas distributed in a punctate pattern (III). The area of strong erosion zones spans 10,900 km2, mainly concentrated in the Huangshui River Valley Basin Region (II) with scattered occurrences in the southern Loess Plateau (I) (Spatial distribution data for freeze-thaw erosion intensity are provided in Supplementary File S1).

4. Discussion

4.1. Controlling Factors of Freeze–Thaw Erosion

This study delineates the extent of freeze–thaw erosion zones by overlaying areas of freeze–thaw action and gravitational erosion in the western segment of the northern agro-pastoral transition zone. The findings indicate that freeze–thaw erosion zones are primarily distributed in the Hehuang Valley and the undulating terrain of the southern Loess Plateau. In these areas, steeper slopes combined with the combined effects of gravity and other external forces cause soil displacement or creep, leading to the formation of typical freeze–thaw erosion processes. In relatively flat areas with gentle slopes, although freeze–thaw processes also occur, the absence of effective erosion and transport forces prevents large-scale soil movement, thus failing to generate freeze–thaw erosion phenomena. This indicates that the presence of freeze–thaw processes and terrain slope are crucial factors controlling the occurrence and distribution of freeze–thaw erosion, constituting its fundamental conditions—a conclusion consistent with the findings of Wu Wanzhen et al. [39]. Studies on freeze–thaw erosion in slope soils of eastern Tibet indicate that gravity and runoff hydraulic pressure are the primary driving forces behind this process. Under the influence of gravity and other factors, fractured soil tends to slide along the ground surface, gradually migrating downslope over time until the freeze–thaw erosion cycle is completed [40]. Further research highlights that topography plays a decisive role in determining the potential energy and stability of surface soils [41]. Crucially, freeze–thaw action alone cannot induce freeze–thaw erosion; displacement and erosion only occur when external forces such as gravity act in concert with the soil mass [16].
In summary, this paper scientifically delineates the extent of freeze–thaw erosion zones based on fundamental concepts, integrating annual freeze–thaw cycles and slope characteristics. It further identifies the spatial distribution patterns of soil freeze–thaw erosion intensity in the western segment of the northern agro-pastoral transition zone. This methodology comprehensively considers controlling factors of freeze–thaw erosion, demonstrating strong scientific validity and practical applicability.

4.2. Factors Affecting Freeze–Thaw Erosion Resistance

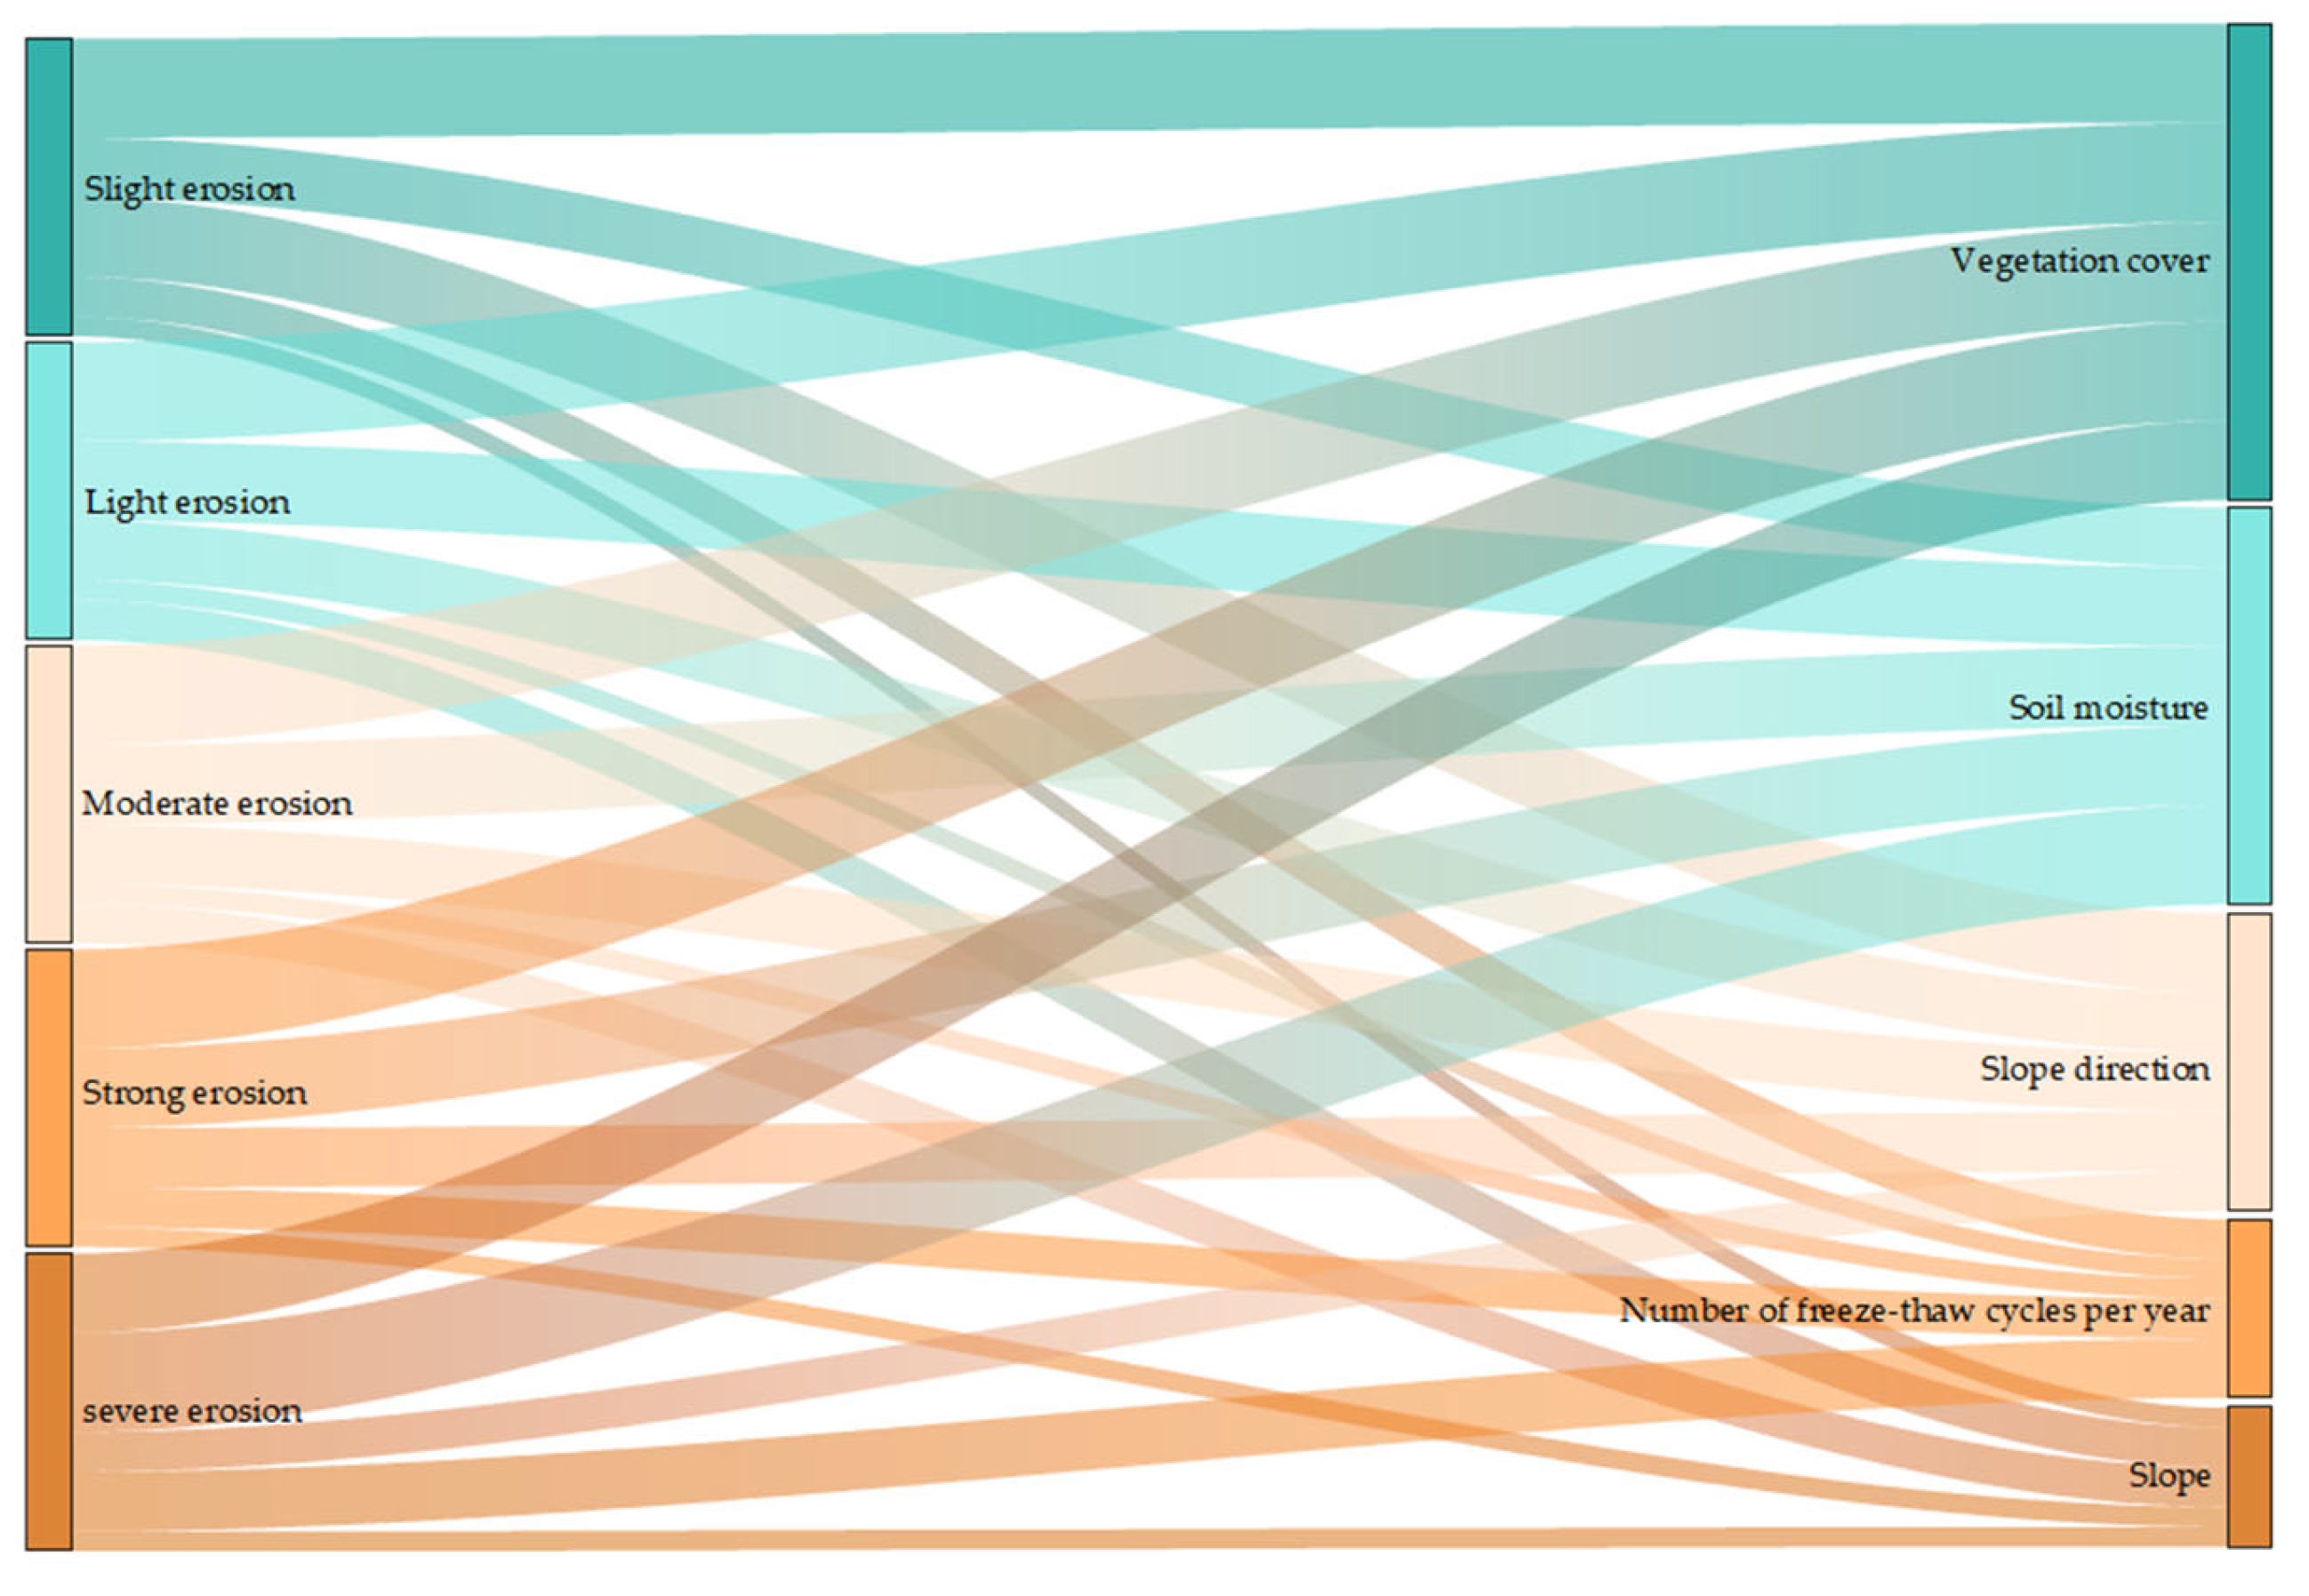
To thoroughly analyze the relationship between freeze–thaw erosion intensity and individual indicators in the western segment of the northern agro-pastoral transition zone, this study employed spatial overlay analysis by reclassifying five key indicators. This approach generated an area distribution map of freeze–thaw erosion intensity and relationship diagrams between this intensity and each indicator. As shown in Figure 6, when analyzing the spatial distribution relationship between freeze–thaw erosion intensity and multiple indicators, soil moisture content and vegetation coverage were found to have the most significant influence among all indicators. This aligns with the findings of Li Dong et al. [11] and Guo Bing et al. [28] regarding the relative weights influencing freeze–thaw erosion intensity in Gansu Province and the Qinghai–Tibet Plateau, where vegetation and soil moisture exert greater influence. A notable difference lies in the weighting of factors: in Gansu Province, temperature is the most significant factor affecting freeze–thaw erosion intensity, followed by soil moisture and vegetation, whereas slope gradient holds the highest weighting on the Qinghai–Tibet Plateau, followed by vegetation and soil moisture. This discrepancy primarily stems from Gansu’s geographical position at the northeastern edge of the Qinghai–Tibet Plateau—within the high-mountain belt of the Qilian Mountains—where low annual temperatures and significant seasonal variations mean that frost penetration depth and frequency are almost entirely determined by thermal balance. The Qinghai–Tibet Plateau, however, is largely characterized by steep terrain with slopes exceeding 15°, where gravitational forces significantly outweigh bedrock weathering. Consequently, slope becomes the primary factor. Nevertheless, overall, vegetation coverage and soil moisture remain relatively important influencing factors. Based on this, this study selected these two key indicators for further analysis.
As shown in Figure 7, when soil moisture is below 0.21 m3/m3, the proportion of freeze–thaw erosion area is relatively small. However, when soil moisture ranges between 0.26 and 0.34 m3/m3, freeze–thaw erosion is most pronounced, accounting for 53% of the total freeze–thaw erosion zone area, with light and moderate erosion accounting for 32.05% and 28.23% of the freeze–thaw erosion area in this range, respectively. Furthermore, the proportions of light and moderate erosion areas showed an upward trend with increasing soil moisture content. This indicates that soil moisture significantly influences freeze–thaw erosion [42]. When vegetation coverage was below 14%, the proportion of freeze–thaw erosion area was 29.41%; when vegetation coverage ranged between 14% and 78%, it accounted for 59.34% of the total freeze–thaw erosion area; when vegetation coverage exceeded 78%, it constituted 11.25% of the total freeze–thaw erosion area. As vegetation cover increases, the area affected by freeze–thaw erosion gradually decreases. This clearly demonstrates that enhancing vegetation cover can effectively mitigate the severity of freeze–thaw erosion [43].

4.3. Strategies for the Prevention and Control of Soil Freeze–Thaw Erosion

Given the analysis of the intensity and influencing factors of freeze–thaw erosion in the western segment of China’s northern agro-pastoral transition zone, developing relevant mitigation strategies is crucial for enhancing the prevention and control capabilities of freeze–thaw erosion in this region. The results indicate that soil moisture and vegetation cover are the primary factors influencing the intensity of freeze–thaw erosion. Higher soil moisture correlates with greater erosion intensity, while greater vegetation cover weakens it. Therefore, vegetation restoration should be prioritized in areas with high soil moisture. On one hand, plant roots provide a certain degree of soil consolidation. On the other hand, regions with higher soil moisture possess greater potential for vegetation restoration, as their moisture conditions are more conducive to plant survival and growth [36]. Secondly, implementing engineering measures on steep, sun-exposed slopes is particularly crucial. Steepness and sun exposure lead to large diurnal temperature fluctuations and frequent freeze–thaw cycles, intensifying freeze–thaw erosion and gravitational forces, making these areas prone to freeze–thaw landslides. Implementing engineering measures such as terraces, retaining walls, or permeable cover layers beforehand can effectively reduce shear displacement and improve moisture and site conditions, thereby enhancing slope stability and increasing subsequent vegetation survival rates. Research has explicitly shown that increased freeze–thaw cycle frequency significantly reduces the resistance to sliding on steep slopes. It is recommended to use engineering measures like “retaining walls + bench terraces” on high-risk slopes to maintain stability [44].

5. Conclusions

This study employs annual freeze–thaw cycle days and critical slope gradient as dual indicators to delineate, for the first time, the extent of freeze–thaw erosion zones in the western segment of northern China’s agro-pastoral transition zone. It further assesses erosion intensity levels, yielding the following conclusions: (1) Freeze–thaw erosion in the western segment of northern China’s agro-pastoral transition zone primarily occurs in the western, southern, and eastern regions, while the northern region is dominated by non-freeze–thaw erosion. (2) Freeze–thaw erosion intensity across the study area ranged from 1.48 to 4.58. The affected area reached 122,400 km2, accounting for 81.11% of the total regional area. (3) Regionally, the Huangshui River Valley Basin exhibits predominantly intense and severe erosion. The northern Loess Plateau shows mostly slight erosion, while the southern Loess Plateau features mild to moderate erosion with scattered instances of intense erosion. The Ordos Plateau has localized slight erosion distributed in isolated patches. (4) Soil moisture and vegetation coverage are the primary contributing factors to freeze–thaw erosion.
Defining the scope of freeze–thaw erosion zones based on fundamental concepts is scientifically sound. However, this approach has limitations as it overlooks interannual variations in erosion intensity. Freeze–thaw erosion detaches and transports soil through external forces, significantly increasing soil erodibility and ultimately exerting substantial influence on the occurrence and development of wind and water erosion processes. Future research will build upon this foundation by conducting multi-year analyses, employing high-resolution digital elevation models, establishing field verification, and investigating composite erosion driven by the combined forces of freeze–thaw, wind, and water. This work aims to provide scientific basis for soil erosion prevention and control decisions in the western segment of the agro-pastoral transition zone in northern China.

Supplementary Materials

The following supporting information can be downloaded at: https://www.mdpi.com/article/10.3390/land14112278/s1, The intensity of freeze–thaw erosion is detailed in Table 4 of the main text, and the spatial distribution data of freeze–thaw erosion intensity are provided in Supplementary File S1.

Author Contributions

Conceptualization, X.M. and Q.Z.; methodology, X.M.; software, X.M.; validation, W.M., F.L. and Q.Z.; formal analysis, X.M.; investigation, F.L. and Q.C.; resources, Q.C. and B.N.; data curation, X.M.; writing—original draft preparation, X.M.; writing—review and editing, W.M. and B.N.; visualization, X.M.; supervision, Q.Z.; project administration, Q.Z.; funding acquisition, Q.Z. All authors have read and agreed to the published version of the manuscript.

Funding

This research was funded by the National Natural Science Foundation of China (Grant No. 42330502 and Grant No. 42271127).

Data Availability Statement

The datasets generated and/or analyzed during the current study are not publicly available due to project requirements but are available from the corresponding author on reasonable request.

Acknowledgments

The authors are grateful to the editor and reviewers for their valuable comments and suggestions.

Conflicts of Interest

The authors declare no conflicts of interest.

References

  1. Sun, B.; Wu, Z.; Li, Z.; Liu, J.; Xiao, J.; Cheng, D.; Ren, F.; Ma, J.; Liu, C.; Ma, B. Effects of freeze-thaw on soil detachment capacity and erosion resistance. Trans. Chin. Soc. Agric. Eng. 2020, 36, 57–65. [Google Scholar] [CrossRef]
  2. Lu, Y.; Liu, C.; Ge, Y.; Hu, Y.; Wen, Q.; Fu, Z.; Wang, S.; Liu, Y. Spatiotemporal characteristics of freeze-thaw erosion in the source regions of the Chin-Sha, Ya-Lung and Lantsang Rivers on the basis of GIS. Remote Sens. 2021, 13, 309. [Google Scholar] [CrossRef]
  3. Yan, S.; Li, X.; Liu, Z. Research progress and prospects of compound soil erosion in the black soil region of Northeast China. Chin. Agric. Sci. Bull. 2024, 40, 96–101. [Google Scholar] [CrossRef]
  4. Pei, X. Disturbance mechanism of major engineering geological environment and ecological restoration technology system in the Qinghai-Tibet Plateau. J. Eng. Geol. 2024, 32, 1737–1758. [Google Scholar] [CrossRef]
  5. Wang, J.; Xu, X.; Liu, P. Land use and land carrying capacity in ecotone between agriculture and animal husbandry in Northern China. Resour. Sci. 1999, 21, 21–26. [Google Scholar] [CrossRef]
  6. Dong, R.K.; Xu, Z.Y.; Yang, C.Y. Dynamic and characteristic of freezing-thawing erosion on Qinghai-Tibet Plateau. J. Soil Water Conserv. 2000, 14, 12–16. [Google Scholar] [CrossRef]
  7. Li, J.; Wang, G.; Song, C.; Sun, S.; Ma, J.; Wang, Y.; Guo, L.; Li, D. Recent intensified erosion and massive sediment deposition in Tibetan Plateau rivers. Nat. Commun. 2024, 15, 722. [Google Scholar] [CrossRef]
  8. Yang, W.; Zhang, G.; Yang, H.; Lin, D.; Shi, P. Review and prospect of soil compound erosion. J. Arid Land 2023, 15, 1007–1022. [Google Scholar] [CrossRef]
  9. Zhang, J.; Liu, S. Methodologies and technologies of the implementation of Erhai Lake valley management system. Geogr. Geo-Inf. Sci. 2005, 21, 32–34+47. [Google Scholar] [CrossRef]
  10. Cui, J.; Xin, Z.; Huang, Y. The spatiotemporal variations in freeze-thaw erosion in 2003-2020 on the Qinghai-Tibet Plateau. Acta Ecol. Sin. 2023, 43, 4515–4526. [Google Scholar] [CrossRef]
  11. Li, D.; Wei, X.; Li, X.G.; Li, Y.J. Sensitivity evaluation of freeze-thaw erosion in gansu province based on RS and GIS. Res. Soil Water Conserv. 2015, 22, 1–6. [Google Scholar] [CrossRef]
  12. Li, Z.; Liu, S.; Zhang, J.; Zhang, L. Investigation methods of freeze-thaw erosion in China. Sci. Soil Water Conserv. 2012, 10, 1–5. [Google Scholar] [CrossRef]
  13. Shi, Z.; Tao, H.; Liu, S.; Liu, B.; Guo, B. Research of freeze-thaw erosion in the Three-River-Source area based on GIS. Trans. Chin. Soc. Agric. Eng. 2012, 28, 214–221. [Google Scholar] [CrossRef]
  14. Shen, Q.; Liu, X.; Zhou, X.; Zhang, Z.; Chen, Q. Spatiotemporal patterns of daily freeze-thaw cycles in near-surface soil on the Qinghai-Tibet Plateau from 2002 to 2020. Acta Geogr. Sin. 2023, 78, 587–603. [Google Scholar] [CrossRef]
  15. Luo, L.; Pei, X.; Huang, R.; Pei, Z. Spatial-temporal differentiation characteristics and rate of freeze-thaw erosion of rock slopes in periglacial area. J. Eng. Geol. 2020, 28, 1319–1328. [Google Scholar] [CrossRef]
  16. Zhang, K.; Liu, H. Research progresses and prospects on freeze-thaw erosion in the black soil region of Northeast China. Sci. Soil Water Conserv. 2018, 16, 17–24. [Google Scholar] [CrossRef]
  17. Gao, C.; Yao, J.; Li, P.; Mu, X. Research progress on gravitational erosion in the Loess Plateau. Yellow River 2020, 42, 99–105. [Google Scholar] [CrossRef]
  18. Jin, C. The role of slope gradient in slope erosion. Geogr. Res. 1996, 15, 57–63. [Google Scholar]
  19. Yu, L.; Xu, X.; Zhang, M.; Liu, G. Sensitivity analysis of gravitational erosion to geomorphic factors on the Loess Plateau. J. Soil Water Conserv. 2019, 33, 119–125. [Google Scholar] [CrossRef]
  20. Hu, S.; Jin, C. Theoretical and experimental study on the critical slope gradient of hillslope soil erosion. Acta Geogr. Sin. 1999, 54, 61–70. [Google Scholar] [CrossRef]
  21. Yang, J.; Zheng, M.; Yao, W.; Wang, L. Analysis of topographic factors for gravitational erosion in loess gullies. Soil Water Conserv. China 2014, 8, 42–45, 69. [Google Scholar] [CrossRef]
  22. Gao, J.; Ai, Q.; Han, L.; Gao, L.; Yang, L.; Ma, S.; Zhang, Y. An observation-based dataset of gravity erosion of Xindiangou watershed in the first sub-region of Loess Hilly-Gully Region during 2017–2018. China Sci. Data 2021, 6, 113–120. [Google Scholar] [CrossRef]
  23. Xing, S.; Zhang, G.; Wang, Z.; Wang, L. Morphological characteristics and critical topographic thresholds of shallow landslides and collapses in the loess hilly-gully region. J. Soil Water Conserv. 2022, 36, 106–113. [Google Scholar] [CrossRef]
  24. Qin, S.; Duan, B.; Wang, H.; Li, M.; Wei, C. Characteristics and distribution patterns of geo-hazards in the Jinchuan reach of the Dadu River. J. Yangtze River Sci. Res. Inst. 2023, 40, 179–186. [Google Scholar] [CrossRef]
  25. Li, E.D.; Yang, Q.K.; Pang, G.W.; Wang, C.M.; Yang, L.J.; Qiao, B.J. Spatial pattern and influencing factors of slope length and steepness factors (LS) in Qinghai-Tibet Plateau. J. Soil Water Conserv. 2023, 37, 133–139. [Google Scholar] [CrossRef]
  26. Yang, Z.; Ni, W.; Li, L.; Niu, F. Multi-factor classification and evaluation of soil freeze-thaw erosion intensity based on GIS: A case study in the upper reaches of the Yangtze River. J. Water Resour. Archit. Eng. 2022, 20, 89–95. [Google Scholar] [CrossRef]
  27. Li, H.; Xu, E.; Zhang, H. Soil erosion regionalization in Ili River Valley. Chin. J. Agric. Resour. Reg. Plan. 2018, 39, 116–124. (In Chinese) [Google Scholar]
  28. Guo, B.; Jiang, L. Evaluation of freeze-thaw erosion in Qinghai-Tibet Plateau based on multi-source data. Bull. Soil Water Conserv. 2017, 37, 12–19. [Google Scholar] [CrossRef]
  29. Sun, Z.F.; Song, C.F.; Li, W.S.; Chen, D. On erosion mechanism and control measures of freezing and thawing. J. Heilongjiang Hydraul. Eng. Coll. 1999, 26, 34–35. [Google Scholar] [CrossRef]
  30. Gu, Y.Q.; Huang, Y.J.; Wei, X.W. Analysis of freeze-thaw erosion factors in the north diversion channel. Heilongjiang Sci. Technol. Water Conserv. 2004, 31, 37. [Google Scholar] [CrossRef]
  31. Cai, L.; Fang, X.; Lv, S.; Zhang, Y.; Li, Z.; Zhang, S.; Lai, X. Variations in freeze-thaw intensity and its relationship with air temperature in the central Qinghai-Tibet Plateau. Plateau Meteorol. 2021, 40, 244–256. [Google Scholar] [CrossRef]
  32. Wang, W.; Wang, B.; Gu, W.; Chen, Z.; Jiang, Y. Effect of freeze-thaw cycles on soil aggregate stability and microstructure of black soil. J. Soil Water Conserv. 2022, 36, 66–73. [Google Scholar] [CrossRef]
  33. Lan, A.; Lin, Z.; Fan, X.; Yao, M. Differences of surface energy and shallow soil temperature and humidity at sunny and shady slopes in permafrost region, Beiluhe Basin, Qinghai-Tibet Plateau. Adv. Earth Sci. 2021, 36, 962–979. [Google Scholar] [CrossRef]
  34. Li, Q.; Yang, J.; Zhang, J.; Kang, F.; Gao, Y.; Zhang, Z. Progress of research on soil erosion resistance of plant roots and future prospects. J. Agric. Resour. Environ. 2020, 37, 17–23. [Google Scholar] [CrossRef]
  35. Wang, X.; Huang, S.; Li, T.; Qi, Z.; Hu, Y.; Li, K.; Yan, X. Research on the soil reinforcement effects of vegetation buffer zone—A case study of the Tongnan section of the Fujiang River Basin. Sci. Soil Water Conserv. 2025, 23, 199–209. [Google Scholar] [CrossRef]
  36. Wang, J.; Zhang, X.; Gulimire, P.; Wang, Z. Classification evaluation and spatial distribution characteristics of freeze-thaw erosion intensity in Heilongjiang Province of China. Trans. Chin. Soc. Agric. Eng. 2024, 40, 168–176. [Google Scholar] [CrossRef]
  37. Gao, G.; Liang, Y.; Liu, J.; Dunkerley, D.; Fu, B. A modified RUSLE model to simulate soil erosion under different ecological restoration types in the loess hilly area. Int. Soil Water Conserv. Res. 2024, 12, 258–266. [Google Scholar] [CrossRef]
  38. Hu, C.Q.; Ma, Y.; Huang, X.D.; Zhao, L. Downscaling algorithm for AMSR2 land surface temperature over the Tibetan Plateau using random forest. Pratacultural Sci. 2025, 42, 11–22. [Google Scholar] [CrossRef]
  39. Wu, W.; Liu, F. Dynamic analysis and distribution characteristics of freeze-thaw erosion in the Three-Rivers’ Headstream Region. J. Qinghai Norm. Univ. (Nat. Sci.) 2010, 26, 57–61. [Google Scholar] [CrossRef]
  40. Huang, H.; Tian, Y.; Liu, J.; Zhang, J.; Yang, D.; Yang, S. The mechanism and sensitivity analysis of soil freeze-thaw erosion on slope in eastern Tibet. Acta Geogr. Sin. 2021, 76, 87–100. [Google Scholar] [CrossRef]
  41. Fan, H.; Cai, Q. Review of research progress in freeze-thaw erosion. Sci. Soil Water Conserv. 2003, 1, 50–55. [Google Scholar] [CrossRef]
  42. Jing, G.; Ren, X.; Liu, X.; Liu, B.; Zhang, L.; Yang, Y.; Wang, Y. Relationship between freeze-thaw action and soil moisture for Northeast Black soil region of China. Sci. Soil Water Conserv. 2008, 6, 32–36. [Google Scholar] [CrossRef]
  43. Wang, L.; Xiao, Y.; Jiang, L.; Ouyang, Z. Assessment and analysis of the freeze-thaw erosion sensitivity on the Tibetan Plateau. J. Glaciol. Geocryol. 2017, 39, 61–69. (In Chinese) [Google Scholar]
  44. Patton, A.I.; Rathburn, S.L.; Capps, D.M. Landslide response to climate change in permafrost regions. Geomorphology 2019, 340, 116–128. [Google Scholar] [CrossRef]
Figure 1. Overview map of the study area.
Land 14 02278 g001
Figure 2. Framework flowchart for delineating the extent of the freeze–thaw erosion zone.
Land 14 02278 g002
Figure 3. Model accuracy evaluation based on RMSE, with the red curve indicating the fitting curve that stabilizes as feature numbers increase.
Land 14 02278 g003
Figure 4. Spatial distribution map of the freeze–thaw erosion zone in the western segment of the northern agro-pastoral transition zone.
Land 14 02278 g004
Figure 5. Map of freeze–thaw erosion intensity classes for the western sector of the farming–pastoral ecotone in northern China.
Land 14 02278 g005
Figure 6. Distribution of different freeze–thaw erosion intensities in the index.
Land 14 02278 g006
Figure 7. Distribution of freeze–thaw erosion intensity at different soil moisture contents (a) and vegetation coverages (b).
Land 14 02278 g007
Table 1. Evaluation criteria for freeze–thaw erosion intensity classification.
IndexTiered Assignment
12345
Annual freeze–thaw cycle days/day<9494–109109–130130–149149–185
Soil moisture/(m3/m3)0.15–0.210.21–0.260.26–0.300.30–0.340.34–0.39
Slope/(°)0–88–1616–2424–3333–82
Vegetation cover/%>7858–7837–5814–370–14
Slope direction/(°)0–22.522.5–67.567.5–112.5112.5–157.5157.5–202.5
337.5–360292.5–337.5247.5–292.5202.5–247.5
Table 2. Single-factor weights for classification indicators.
ProjectNumber of Freeze–Thaw
Cycles Per Year
Soil
Moisture
SlopeVegetation CoverSlope
Direction
Weight0.15900.24720.16760.20900.2171
Table 3. Freeze–thaw erosion intensity classification standards.
Freeze–Thaw Erosion IntensityMinor DegreeMildModerateIntensityViolent
Comprehensive Evaluation Index1.48–2.332.33–2.752.75–3.123.12–3.583.58–4.58
Table 4. Proportion of freeze–thaw erosion intensity classifications.
Freeze–Thaw Erosion IntensityTotal Area
(104 km2)
Percentage of Freeze–Thaw Erosion Area (%)
Slight erosion1.4812.13
Light erosion3.2726.68
Moderate erosion4.8339.42
Strong erosion1.098.87
Severe erosion1.5812.90
Disclaimer/Publisher’s Note: The statements, opinions and data contained in all publications are solely those of the individual author(s) and contributor(s) and not of MDPI and/or the editor(s). MDPI and/or the editor(s) disclaim responsibility for any injury to people or property resulting from any ideas, methods, instructions or products referred to in the content.