Article

Analysis of the Evolution of Land Use Carbon Metabolism Patterns and the Response to Urban Form Changes in Haikou, China

School of Tropical Agriculture and Forestry, Hainan University, Haikou 570228, China
*
Author to whom correspondence should be addressed.
Land 2025, 14(11), 2265; https://doi.org/10.3390/land14112265
Submission received: 9 October 2025 / Revised: 8 November 2025 / Accepted: 14 November 2025 / Published: 16 November 2025

Abstract

It is increasingly recognized that urban planning is essential in promoting low-carbon urban development, and the research on urban carbon metabolism patterns informs the theoretical support for carbon neutrality through urban structural optimization. To investigate the correlation between carbon metabolism patterns and urban form, this study analyzes their spatiotemporal evolution, thereby informing low-carbon urban planning from a novel perspective. Using multi-temporal land use data from 2000 to 2025 in Haikou City, China, we calculated carbon emissions and sinks based on land use types, and applied GIS spatial analysis, landscape metrics and autocorrelation methods to reveal the dynamic relationship between urban form and carbon metabolism. The results indicate that, over the past 20 years, carbon emission areas in Haikou have continuously expanded, with high-emission zones clustering in the city center, while carbon sink areas have gradually contracted and become increasingly fragmented. In terms of response, there is a notable correlation between the evolution of carbon metabolism patterns and the changes in urban form. In High–High (HH) carbon emission clusters, the degree of aggregation is positively correlated with urban morphological complexity, which indicates that greater complexity leads to stronger clustering of carbon emissions. In contrast, for carbon sink areas, higher morphological complexity corresponds to lower aggregation and more pronounced fragmentation. This implies that urban morphological complexity and the aggregation of carbon metabolism clusters are particularly critical indicators in low-carbon urban planning. Balancing these indicators to optimize the urban layout serves as a strategy to enhance urban low-carbon resilience.

1. Introduction

Global climate change has become one of the most pressing challenges faced by human society today. As the primary source of carbon emissions, urban areas exert a profound influence on the global carbon cycle [1]. Statistics show that as of 2020, urban regions occupied only about 3% of the global land area, yet they accounted for 67–72% of total greenhouse gas emissions, a proportion projected to increase further by 2050 [2]. Therefore, understanding the spatiotemporal evolution of urban carbon metabolism patterns and their driving mechanisms is of great significance for achieving global climate targets.
The term metabolism originates from the Greek word meaning “conversion” or “transformation” [3]. Wolman first proposed the concept of “urban metabolism,” viewing the city as an organism with vital characteristics to describe the processes of material and energy input, transformation, and output within urban systems [4]. Later, Baccini incorporated carbon emissions and carbon storage into this framework and introduced the concept of “urban carbon metabolism,” providing a new perspective for exploring the relationship between urban systems and climate change [5].
Carbon metabolism generally refers to the processes of carbon flow among different components within an ecosystem, including carbon emissions, carbon sinks, and carbon fluxes. Quantifying urban carbon emissions and carbon sinks forms the basis for studying urban carbon metabolism [6,7]. In recent years, scholars have found that urbanization can directly affect urban carbon metabolism by altering land use structures, functions, and landscape patterns. For example, when green spaces are converted into industrial or other built-up land, industrial production, residential consumption, and transportation activities significantly increase carbon emissions [8,9,10].
Existing studies have demonstrated that land-use change, energy consumption, economic development level, and population size are all key drivers of carbon emissions [11,12]. Among these, land-use change is one of the core factors: through rational spatial planning and management of land, approximately 60–70% of carbon emissions can be reduced [13], while expanding forested areas can significantly enhance urban carbon sinks. Therefore, estimating carbon emissions and sequestration based on land-use data has become a widely adopted approach for quantifying urban carbon metabolism [14,15]. In line with the progress in landscape ecology, an increasing number of quantitative research has leverage landscape pattern indices and spatial analysis models to examine the relationship between urban form and carbon emissions [16,17,18]. However, most existing research focuses on the direct impact of urban form on carbon emissions or carbon sinks, respectively, for instance, how changes in urban form affect emission efficiency, while few studies have explored how urban form influences the spatial response of carbon metabolism patterns.
As global climate change intensifies, China has established its “dual-carbon” goals as a key national strategy. Hainan Province, with its superior ecological environment, is actively pursuing high-quality development under strict spatial controls defined by the “three zones and three lines” policy. As the provincial capital, Haikou has experienced rapid urban expansion over the past two decades, leading to profound transformations in land-use structure and corresponding changes in its carbon metabolism. Based on this context, this study takes Haikou City as a case study and selects five time points (2000, 2005, 2010, 2015, and 2020) to estimate carbon emissions and carbon sequestration using multi-temporal land-use data. By integrating landscape pattern indices and spatial autocorrelation analysis, the study aims to reveal the spatiotemporal evolution of land-use-based carbon metabolism patterns and their response to urban form dynamics, thereby providing theoretical support for low-carbon land-use planning in Haikou.

2. Literature Review

2.1. Urban Carbon Metabolism

The concept of carbon metabolism originates from metabolic ecology theory, referring to the dynamic circulation of carbon elements within a system through processes of input, transformation, storage, and output [4,5]. At the urban scale, carbon metabolism reflects the balance between carbon sources (emissions) and carbon sinks (sequestration) generated by urban systems through energy consumption, material flows, and ecological processes. In recent years, the notion of urban carbon metabolism has been widely adopted as a conceptual framework for studying urban material and energy flows, providing a quantitative basis for understanding how carbon is exchanged through economic and ecological processes in city [19]. Urban carbon metabolism comprises two fundamental processes: (1) carbon emissions, primarily arising from human activities such as energy consumption, transportation, and industrial production; and (2) carbon sequestration, mainly resulting from the carbon-fixing function of natural ecosystems such as forests, grasslands, and water bodies. Together, these processes constitute the urban carbon flux, determining both the intensity and the direction of the city’s metabolic performance within the carbon cycle [7].
Traditionally, carbon emission studies have relied on energy-consumption-based accounting, with the IPCC Emission Factor Method serving as the standard approach. This method estimates CO2 emissions by multiplying energy consumption by corresponding emission factors across different sectors [20]. Its advantages include high generalizability and data accessibility, yet it suffers from low spatial resolution and limited capacity to reveal intra-urban structural variations. To address this, researchers have developed GIS-based spatial carbon emission estimation methods, which integrate night-time light data with variables such as population density and GDP to model the spatial distribution of urban emissions [21].
Urban carbon sequestration primarily stems from the photosynthetic fixation of carbon by vegetation ecosystems, and the key challenge remains the estimation of unit-area carbon sequestration capacities across various vegetation types. The Carbon Coefficient Method, a widely used simplified model, calculates total carbon sequestration by multiplying land area by corresponding sequestration coefficients. This method is particularly applicable to multi-temporal comparative studies, yet its reliability depends critically on the selection of coefficients; ecological heterogeneity among regions can lead to high uncertainty. Estimation methods leveraging remote sensing have also been proposed, using vegetation indices, such as the Normalized Difference Vegetation Index (NDVI) or Net Primary Productivity (NPP), to assess vegetation carbon-absorption capacity [22]. For higher precision, the Carbon Stock Change Method is also applied, which directly assesses variations in ecosystem carbon reserves.
In recent years, with the advancement of land-use/cover change (LUCC) research, scholars have increasingly integrated carbon metabolism with land-use dynamics to uncover how different land types contribute to carbon flows. For example, Hu et al. [7] constructed a carbon metabolism accounting framework for Beijing based on land-use data from 2000 to 2020, revealing that urban expansion transformed the city’s carbon metabolism system from “sink-dominated” to “source-dominated.” Overall, research on urban carbon metabolism has evolved from macro-scale accounting to perspectives that are spatially explicit, process-based, and network-oriented, thus providing a robust theoretical foundation for exploring its coupling with urban form.

2.2. Urban Form

Urban Form refers to the spatial structure of a city and its evolution over time, encompassing characteristics such as land-use distribution, density, shape complexity, connectivity, and aggregation. The study of urban form originated from the exploration of fractals in geometry. In 1987, Batty et al. [23] analyzed the fractal dimensions of different land-use types through perimeter–area ratios to describe the irregularity of urban form. With the advancement of landscape ecology, landscape pattern indices have been used to quantify urban form, thereby offering measurable indicators for the analysis of urban spatial structures. For example, Deng et al. [24] constructed an evaluation framework incorporating density, aggregation, connectivity, and shape complexity to quantitatively describe the evolution of urban from. In addition, indicators such as site coverage ratio and street height-to-width ratio are often applied to measure the three-dimensional form of cities, particularly in small- to medium-scale studies (e.g., urban blocks) [25,26].
Building on methodological progress, research has expanded its focus to examine the interrelationships between urban form and other environmental processes, notably water, heat, and carbon cycles. Among these, the interaction between urban form and the carbon cycle has become a central topic in urban ecology and low-carbon planning. Urban form regulates the urban carbon metabolism process either directly or indirectly by influencing land-use patterns, transportation modes, energy-consumption structures, and the spatial distribution of ecological land [14,25,27]. Different morphological structures exhibit distinct carbon metabolic characteristics: compact urban forms are generally associated with lower per capita carbon emissions, whereas sprawling forms tend to exacerbate emissions [28,29]. Applying an Integrated Spatio-Temporal Nonlinear Regression (ISTNR) model, Li et al. further revealed a significant positive correlation between morphological characteristics (e.g., patch area and connectivity) and carbon emission efficiency [18].
However, most existing studies predominantly concentrate on macro-level carbon emissions and sequestration efficiency, seldom addressing the metabolic pattern perspective, specifically, how morphological changes reshape the spatial organization of carbon metabolism. Since the carbon metabolic process is directly affected by urban expansion and ecological land transformation, understanding the spatial evolution of carbon metabolic patterns offers a novel analytical framework and theoretical foundation for advancing low-carbon land-use planning in the future.

3. Materials and Methods

3.1. Study Areas and Data Sources

Haikou City (19°31′32″–20°04′52″ N, 110°07′22″–110°42′32″ E) is in the northern coastal region of Hainan Province, at the northern margin of the low-latitude tropics. The area experiences a tropical monsoon climate characterized by abundant year-round sunshine and a mean annual precipitation of 1696.6 mm. Before 2002, the city covered only 236.44 km2; in October of that year it merged with Qiongshan City, forming its present administrative area (Figure 1). Since 2012, Haikou has launched land reclamation projects in its northern coastal area, constructing artificial islands with a total reclaimed land area of approximately 256 hectares. However, these islands remained largely undeveloped throughout the study period. As of 2023, Haikou governs four districts—Longhua, Xiuying, Meilan, and Qiongshan—with a total land area of 2296.82 km2. Between 2000 and 2020, Haikou’s permanent resident population increased dramatically from 0.83 million to 2.87 million, with the most rapid growth occurring in the latter decade, at an average annual rate of 3.54%. Following Hainan’s designation as an International Tourism Island in 2008, Haikou experienced rapid urban growth. Between 2008 and 2018, industrial and mining land and urban residential land, both major carbon sources, increased by 45.5% and 14.1%, respectively, while GDP per unit of land tripled [30]. In 2025, Hainan Province announced a comprehensive plan to build a low-carbon island, positioning Haikou, the provincial capital, as a key pilot city. Evidently, the city’s accelerated development in the 21st century has led to significant transformations in land-use structure, which may have altered the spatial pattern of Haikou’s carbon metabolism.
The data used in this study primarily include land use data, administrative boundary data, carbon emission data, carbon absorption data, and socioeconomic data. Being referenced against the China Land Cover Dataset (CLCD) [31] and the land use data are reclassified using a Support Vector Machine (SVM) approach in ENVI 5.6 software based on Landsat remote-sensing imagery, with a spatial resolution of 30 m (Figure 1). Administrative boundary data was provided by the national platform for common geospatial information services, Tianditu (www.tianditu.gov.cn, accessed on 7 November 2025). Carbon emissions and carbon sequestration data were calculated according to the IPCC guidelines [32]. Socioeconomic data were sourced from the Haikou Statistical Yearbook, Hainan Provincial Statistical Yearbook, and China Energy Statistical Yearbook (https://tjj.haikou.gov.cn/, accessed on 7 November 2025), primarily encompassing energy consumption by sector, GDP data, population statistics, and transportation volumes.

3.2. Methods

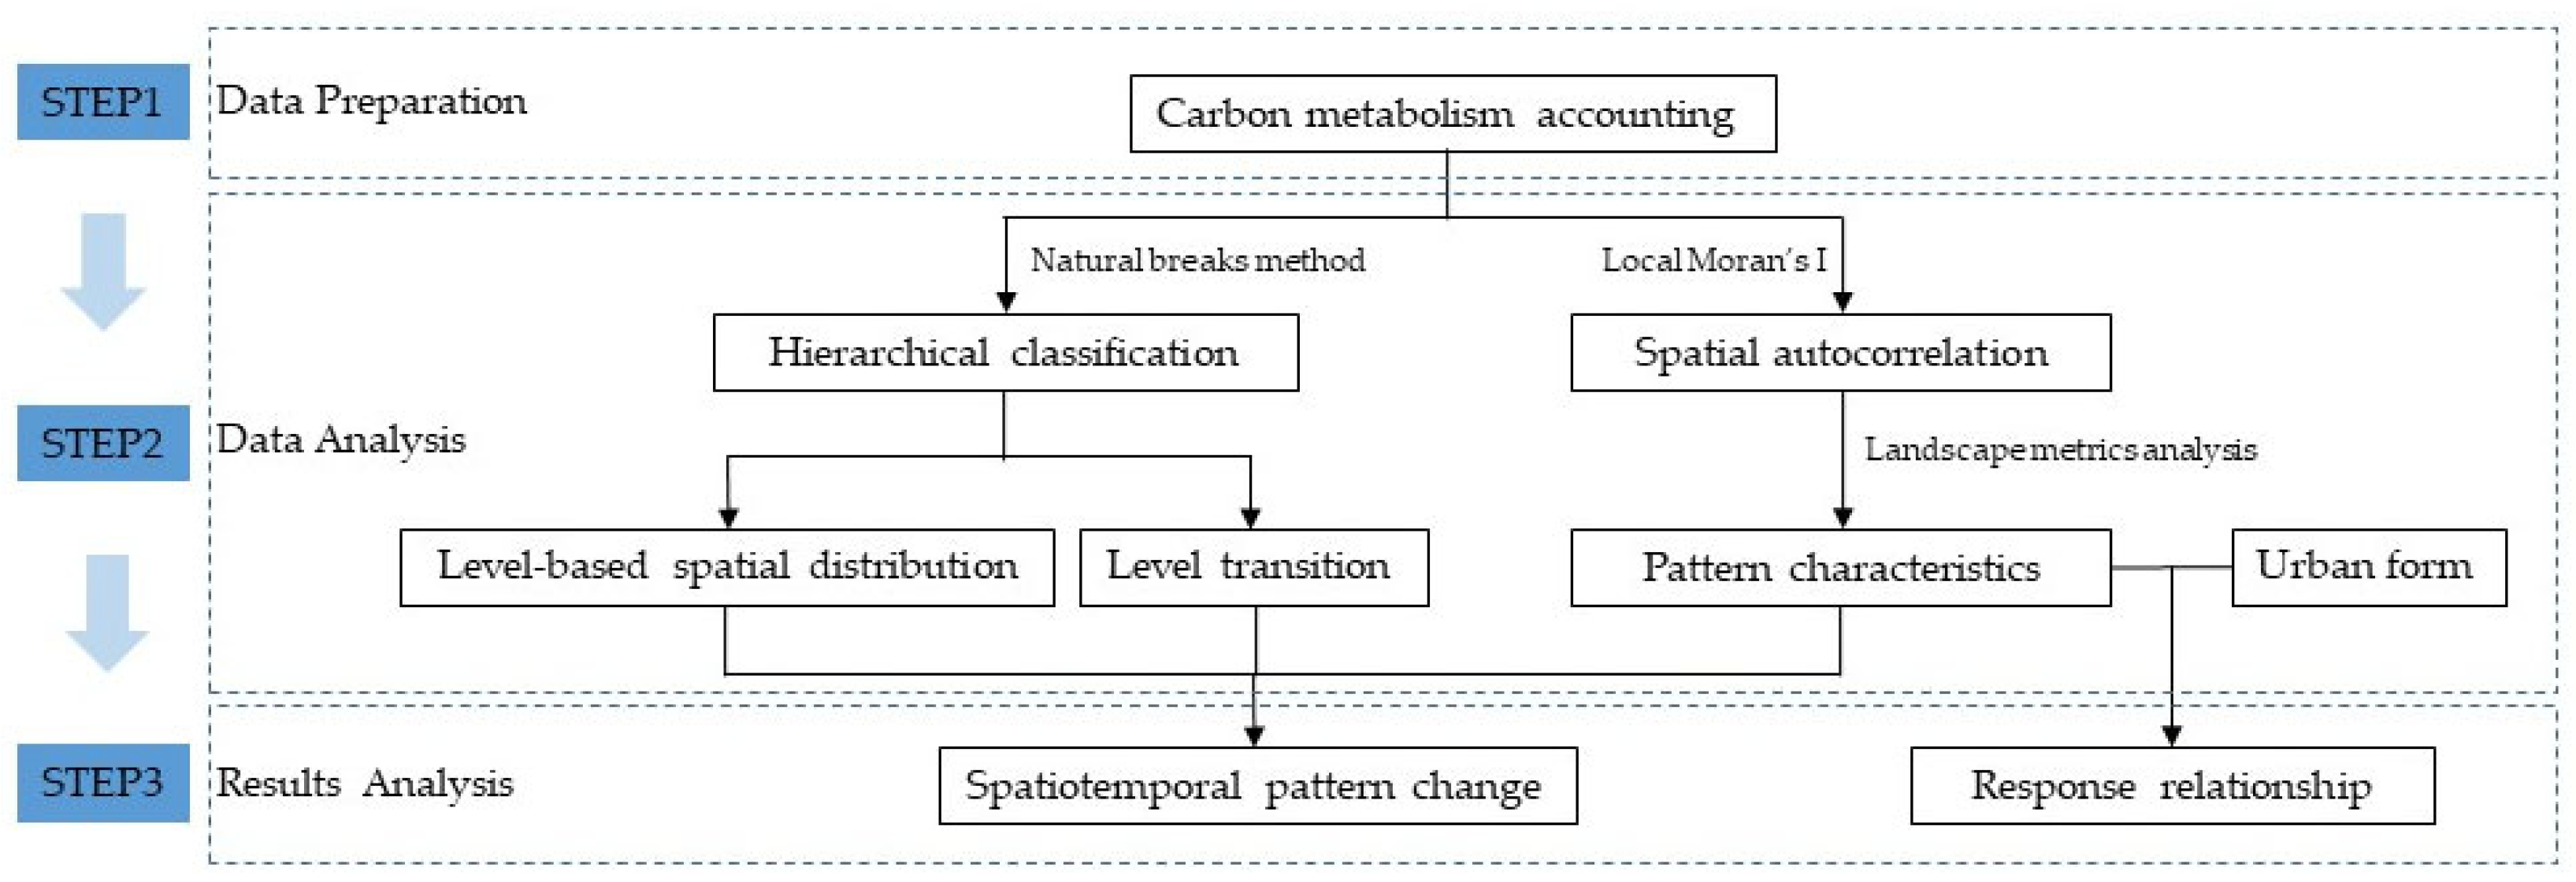
The research process contains three main steps (Figure 2). First, during the data preparation phase, the carbon emissions and carbon sequestration of each land-use type in Haikou were calculated. Second, the evolution of urban carbon metabolism and form was analyzed using GIS spatial analysis, spatial autocorrelation analysis, and landscape metrics. Finally, the results were interpreted in light of Haikou’s relevant urban planning and studies, providing insights for low-carbon urban planning.

3.2.1. Carbon Emission Accounting

At the regional (macro) scale, this study estimates land-based carbon emissions by referring to previous studies conducted at comparable scales [9,15,16,33]. Land types associated with carbon emission activities were categorized into industrial land, residential land, transportation land, other built-up land, and cropland. According to the International Energy Agency (IEA), approximately 90% of China’s CO2 emissions originate from the energy sector [34]. Therefore, we adopted the widely used Emission Factor Method recommended by the IPCC Guidelines [32] to estimate carbon emissions from built-up land, with emission factors adjusted according to the methodologies outlined in the provincial greenhouse gas inventory of China [35]. The general formula is:
For industrial land, emissions were computed as:
C E 1 = i = 1 n E i f i ,
C E 1 represents carbon emissions (kg) from industrial land use, E i denotes industrial energy consumption (kg & m3), and f i indicates the carbon emission factor for each energy source. These factors are calculated based on the IPCC inventory, as detailed in Table 1.
Residential emissions were similarly estimated as:
C E 2 = i = 1 n E i f i ,
C E 2 represents carbon emissions (kg) from residential land use, E i denotes energy consumption (kg & m3) required for residential living, and f i indicates the carbon emission factor for each energy source (Table 1).
Transportation emissions included private vehicle use ( C E P ) and passenger–freight transport ( C E t ):
C E 3 = C E P + C E t = M E K p + N K b + H K r ,
C E 3 represents carbon emissions (kg) from road transportation land use, where C E P denotes carbon emissions (kg) from private vehicles, C E t represents carbon emissions (kg) from passenger and freight transport, M denotes total mileage (km) of private vehicles, E is the average energy consumption (L/km) of private vehicles, N represents highway transport turnover (kg/t·km), H denotes railway transport turnover (kg/t·km), while K p , K b , and K r are the carbon emission coefficients for private vehicles, highway transport, and railway transport, respectively, as detailed in Table 1.
For other construction land, mainly supporting tertiary-sector activities where detailed energy data are unavailable, emissions were estimated using unit GDP energy consumption:
C E 4 = G i = 1 n E i f i ,
where G denotes the proportion of tertiary sector output in total output, E i is the total energy consumption (kg & m3) of the i-th energy type, and f i is the carbon emission factor for the i-th energy type (Table 1).
Cropland emissions were the sum of emissions from agricultural machinery, irrigation, and fertilizer application:
C E 5 = C E R + C E S + C E F = R K 1 + S K 2 + F K 3 ,
C E 4 represents carbon emissions (kg) from cultivated land, where C E R , C E S , and C E F denote carbon emissions from agricultural machinery, agricultural irrigation, and fertilizer application, respectively. K 1 , K 2 , and K 3 denote the respective carbon emission factors, while R, S, and F represent the total power (KW) of agricultural machinery, the area (ha) of agricultural irrigation, and the total amount (kg) of fertilizer applied [36].

3.2.2. Carbon Sink Accounting

At the macro scale, urban carbon sequestration primarily stems from vegetation, which is closely related to Net Primary Productivity (NPP). Based on SHI et al. [39], who analyzed NPP variations in China between 2001 and 2020, most regions of Hainan Province showed no significant change in NPP, indicating relatively stable carbon sequestration capacity during the study period. Therefore, we employed the Carbon Coefficient Method with fixed coefficients to estimate the carbon sequestration of different vegetation cover types. The selection of coefficients followed studies consistent with China’s ecological and climatic conditions. Carbon sink was estimated for forest, grassland, water bodies, and cropland using a coefficient method:
C S = K i S i ,
C S represents carbon sink (t), where Si is the area (km2) of land use type i and Ki its carbon sink coefficient. For example, K equals 13.8 t C km−2 yr−1 for grassland [40] and 56.7 t C km−2 yr−1 for water bodies [41]; other coefficients are listed in Table 2. Due to the lack of detailed local data for Haikou, a nationally averaged coefficient was used.

3.2.3. Spatial Patterns of Carbon Metabolism

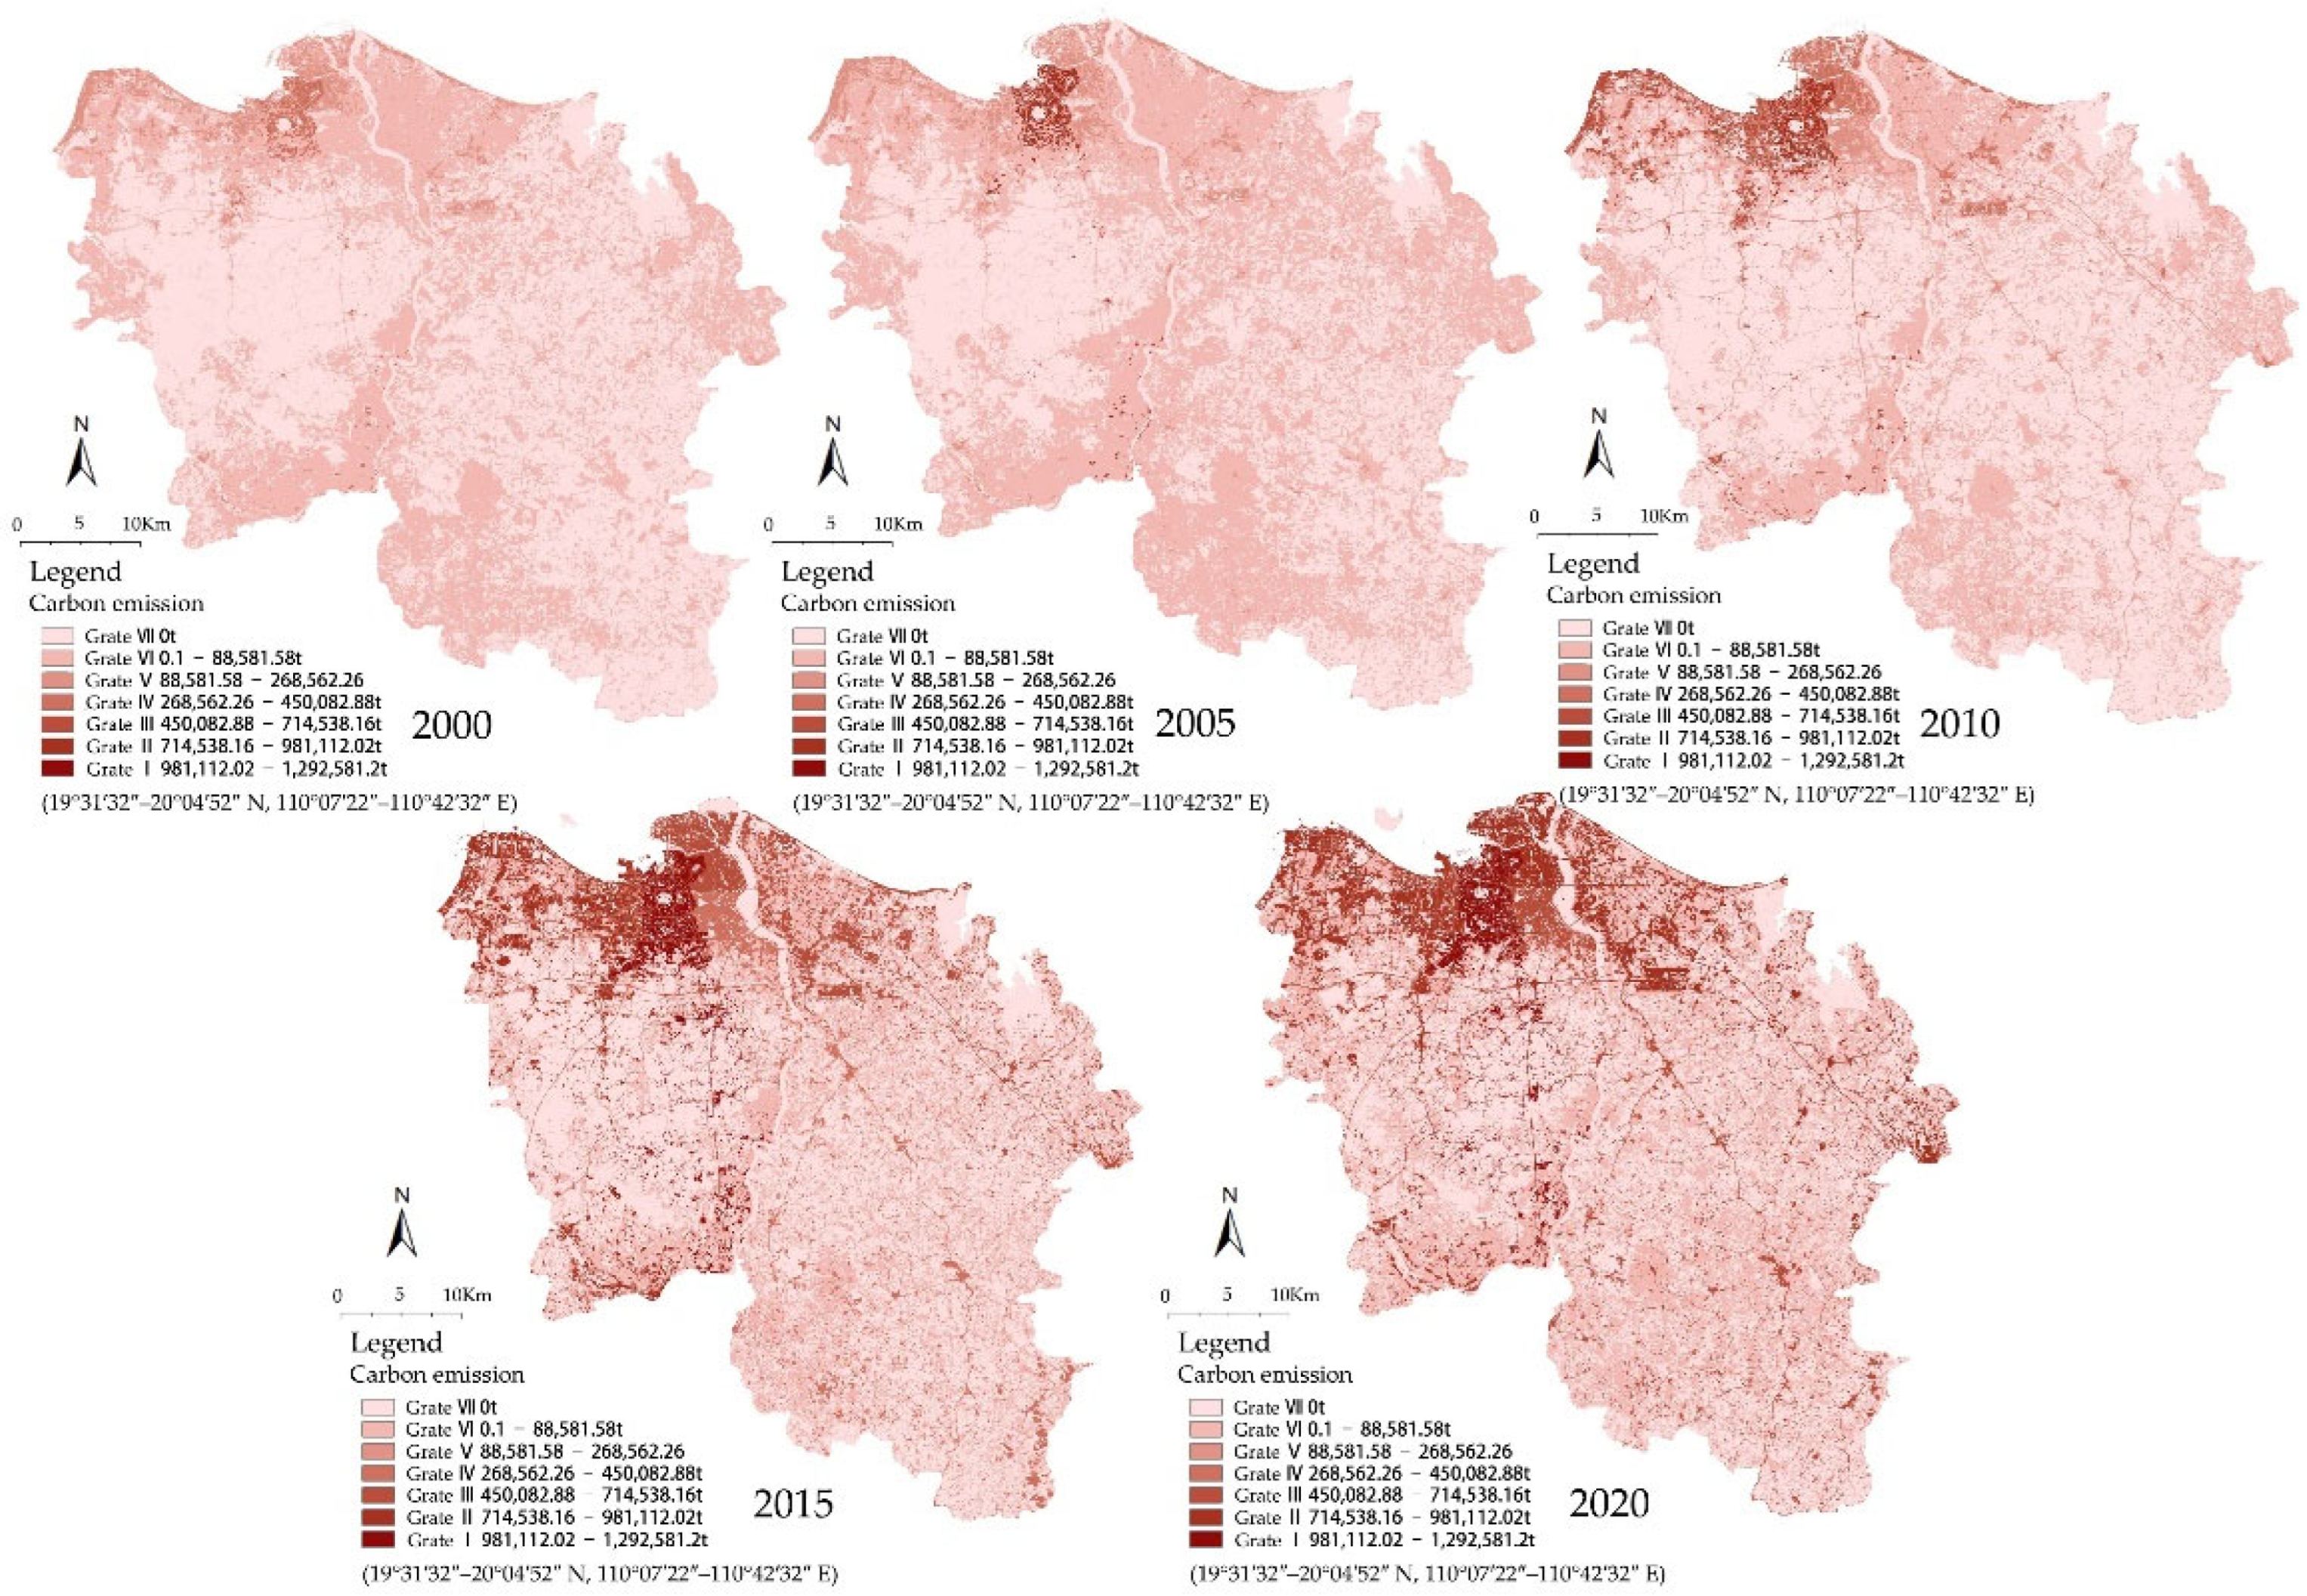
This study examines the spatial characteristics of carbon metabolism from three dimensions: spatial distribution, spatial clustering, and heterogeneity. First, carbon emission and carbon sequestration values for each land-use type were calculated and mapped in ArcMap 10.8.1 to visualize the spatial distribution of urban carbon metabolism. Pixels with zero values were classified as Grade VII, whereas nonzero values were divided into six levels from highest to lowest (I-VI) using the natural breaks method, producing a series of spatial maps of carbon emission and carbon sink patches. Transfer matrices of these graded patches were then constructed for 2000, 2005, 2010, 2015, and 2020 to track dynamic changes, i.e., expansion or contraction in the spatial pattern of urban carbon metabolism.
To explore clustering and heterogeneity, spatial autocorrelation was assessed using Local Moran’s I. Evolution maps of carbon metabolism clustering and heterogeneity were generated in ArcMap. Spatial autocorrelation measures the correlation between a spatial unit and its neighbors for a given attribute, revealing clustering and heterogeneity patterns [44]. The general formula is:
I i = X i X ¯ S 2 j = 1 n W i j X j X ¯
where Ι i is the local Moran’s I value of unit i, reflecting the similarity or dissimilarity between unit i and its neighboring areas. X i is the observed value of unit i (carbon emission or carbon sink), W i j is the spatial weight matrix representing the neighborhood relationship between units i and j, and S is the standard deviation of all units. A positive Ι i (>0) indicates that unit i is similar to its neighboring units (e.g., high–high or low–low clustering), while a negative Ι i (<0) suggests dissimilarity between unit i and its surroundings (e.g., high–low or low–high relationships). When Ι i approaches zero, it implies no significant spatial correlation.
The results were categorized into four types: High–High clusters (HH region), Low–Low clusters (LL region), High–Low outliers (HL region), and Low–High outliers (LH region). HH (LL) region indicates contiguous areas of high (low) values, representing zones of concentrated carbon emissions (sinks). HL and LH region identifies locations where high values are surrounded by low values or vice versa, indicating negative spatial correlation and highlighting heterogeneous carbon metabolism zones.
Based on the spatial autocorrelation results, five landscape metrics were used to characterize the spatial properties of these four cluster types: patch area (CA), patch density (PD), aggregation index (AI), largest patch index (LPI), and patch cohesion index (COHESION) (Table 3). CA reflects the degree of regional expansion, while PD measures fragmentation, with higher PD indicating more numerous and dispersed patches. AI quantifies the degree of spatial aggregation, LPI indicates whether a single core patch dominates the landscape, and COHESION measures the connectivity among patches, where higher values signify stronger spatial linkages that facilitate the diffusion or transfer of carbon emissions and sinks.

3.2.4. Response of Carbon Metabolism Patterns to Urban Morphological Change

Following previous studies [15,45], we selected the CA, PLADJ, and PRFRAC indices to characterize and analyze the features and evolution of urban for from three dimensions: area change, aggregation level, and morphological complexity.
Specifically, the PLADJ index represents the proportion of shared borders between patches of the same land-use type relative to the total length of all adjacent patch borders; a higher PLADJ value indicates a higher degree of landscape aggregation. The PRFRAC index measures the complexity of patch boundaries, reflecting the deviation of a patch’s shape from an ideal geometric form. Its value ranges from 1 to 2, where values closer to 1 indicate more regular shapes, while those closer to 2 suggest more complex or irregular boundaries [16]. Based on carbon metabolism characteristics, the urban area was divided into two primary functional zones: the carbon emission core zone (urban and built-up land) and the carbon sink core zone (green space and water bodies). The morphological patterns of these two zones were then analyzed separately to examine their respective spatial dynamics.
The spatial autocorrelation of carbon metabolism reveals clustering and heterogeneity, hence it provides a direct indication of how urban form influences carbon-metabolism patterns. By comparing trends in spatial autocorrelation with urban form dynamics, this study explains the response of carbon-metabolism patterns, thereby offering a scientific foundation for low-carbon urban development strategies.

3.3. Limitations

Since our study focuses on land use carbon metabolism from a macro-regional perspective, we did not perform finer-scale classification during remote sensing interpretation. Geographic spatial data inevitably contain uncertainties arising from acquisition errors, visualization biases, and classification accuracy [46]. Moreover, heterogeneity in carbon metabolism within the same land use type can also lead to discrepancies between the estimated and actual values of carbon emissions and sinks. To minimize these differences, we integrated high-resolution imagery and field surveys during the remote sensing interpretation process to iteratively refine classification results.
In addition, the coefficients used for estimating carbon emissions and sequestration vary significantly across regions. Even within the same land use category, carbon metabolic capacity can be influenced by multiple factors. Therefore, this study focuses on revealing spatial trends and relative changes rather than absolute numerical comparisons. To minimize potential errors, we drew on relevant macro-scale studies [9,15,16,33] and adopted coefficients that are not only well-established but also of particular relevance to China’s national conditions.

4. Results

4.1. Carbon Metabolism Accounting Results

Among the major land use types, industrial land was the largest source of carbon emissions in Haikou before 2010, accounting for 34% and 35% of total emissions in 2000 and 2005, respectively. Thereafter, its share was gradually overtaken by residential, transportation, and other construction land, declining to only 8% by 2020, when transportation land became the dominant emitter, releasing 3.11 × 10⁶ t and contributing 46.10% of total emissions (Table 4). Emissions from industrial land peaked in 2015 and subsequently declined, reflecting the effectiveness of Hainan Province’s annual policies aimed at phasing out outdated industrial capacity. Carbon sequestration in Haikou is primarily derived from forested land and water bodies. Forest sequestration reached a maximum of 1.10 × 10⁵ t in 2010 but has since decreased due to forest area loss, whereas sequestration from water bodies has shown a generally steady upward trend. Cropland and grassland provide the lowest carbon sinks, together contributing less than 1.3% of the total sequestration (Table 5).

4.2. Spatial Distribution Patterns of Carbon Metabolism

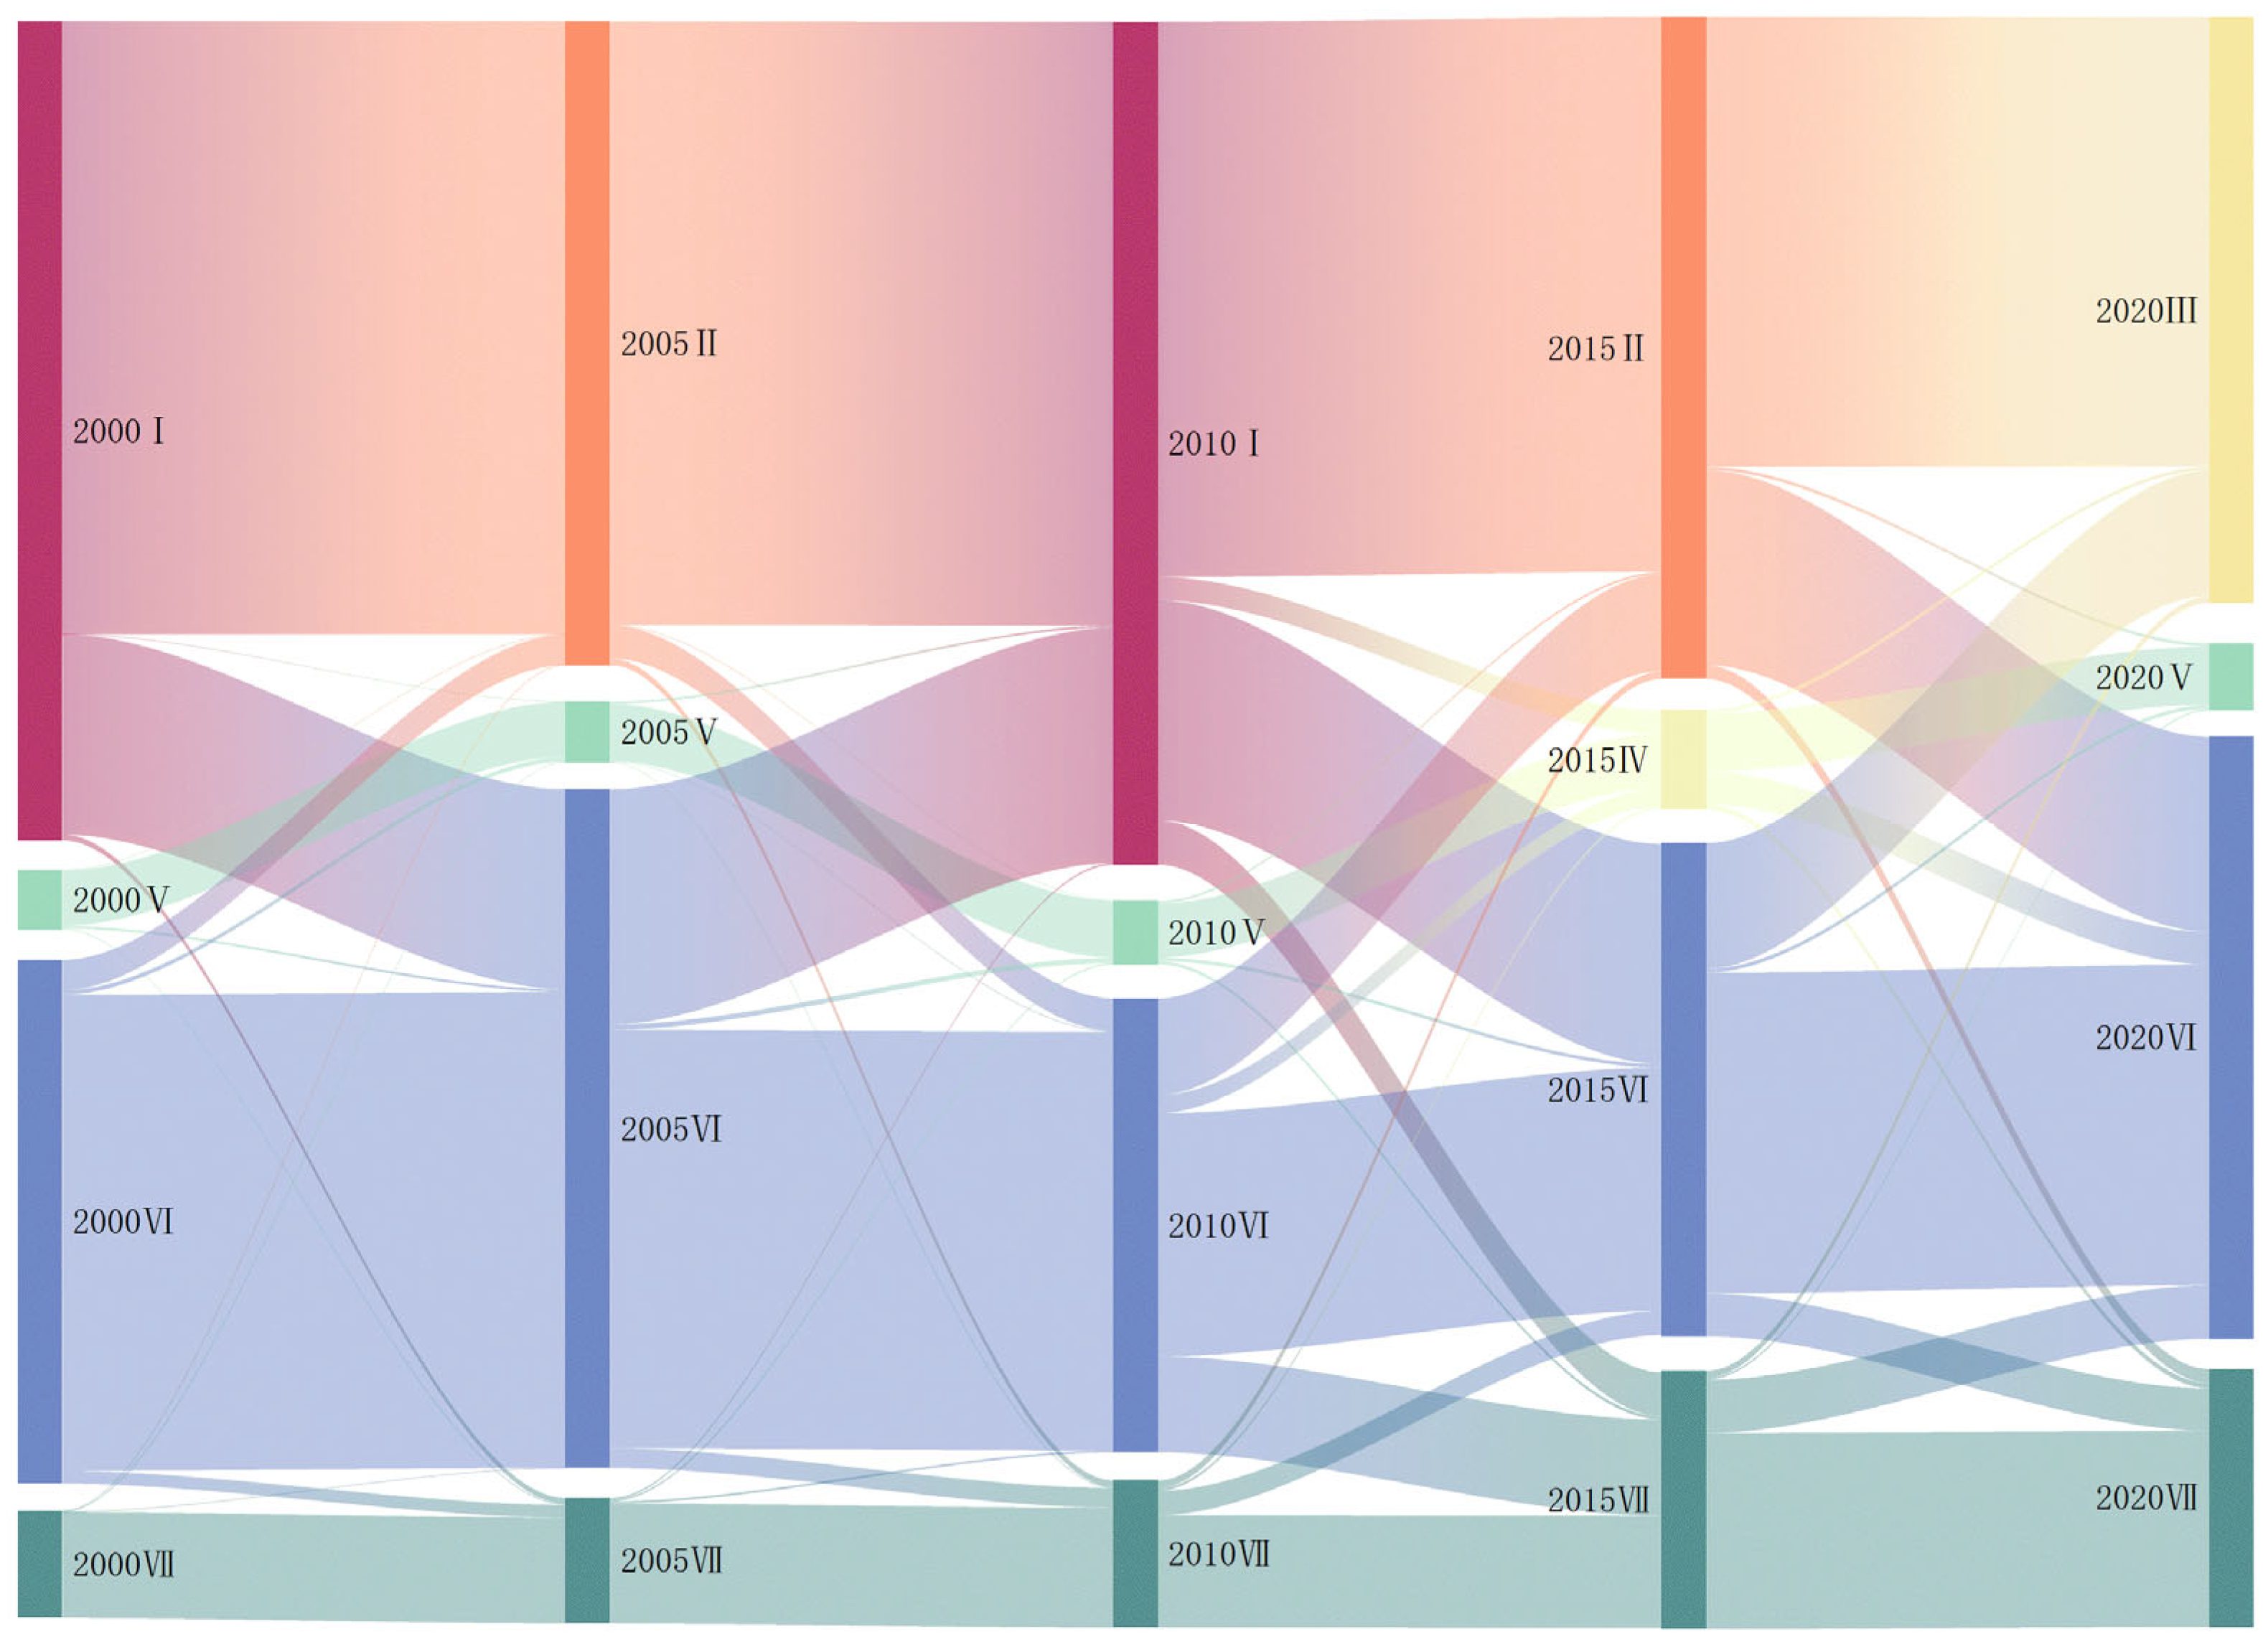
Mapping carbon emission and sink data on land use maps reveals the spatial distribution patterns of carbon metabolism across different periods. Spatially, high carbon emissions are concentrated in northern Haikou and continue to expand eastward and westward (Figure 3). In 2005, a Level II emission patch emerged in the central northern region, largely replacing the Level IV patch observed in 2000, resulting in a spatial discontinuity with surrounding areas. By 2010, carbon emissions increased in the northwestern region, leading to the formation of Level III emission patches, while Level I patches did not appear until 2015. As illustrated in Figure 4, the Grade I region predominantly comprises patches originally classified as Grade II (38.85%), Grade VI (31.34%), and Grade VII (23.81%). Compared to other regions, the expansion of Level I areas was relatively slow, with minimal change in area between 2015 and 2020. Expansion mainly occurred through road transportation land extending eastward and southward, while Level II emission patches covered most of the northern region (Figure 3).
Figure 4 also indicates that Zones III, IV, and V represent transitional areas shifting from lower to higher emission levels, exhibiting spatial instability. Patches within these zones consistently transition to higher emission levels in subsequent periods, highlighting the need for careful management during urban expansion. Additionally, Grade VI patches exhibit significant fluctuations, frequently converting with Grade VII patches. This suggests that both areas are highly sensitive to land use changes, thereby influencing carbon emissions.
Overall, Grade I areas demonstrate stable morphology, high and concentrated carbon emissions, and well-defined boundaries, making them a priority for urban carbon emission management. Grade II and III areas exhibit notable fluctuations in patch patterns, identifying them as carbon-emission-sensitive zones that require attention during urban development. Grade VI areas, characterized by fragmentation, largely correspond spatially to farmland and exhibit relatively low carbon emissions.
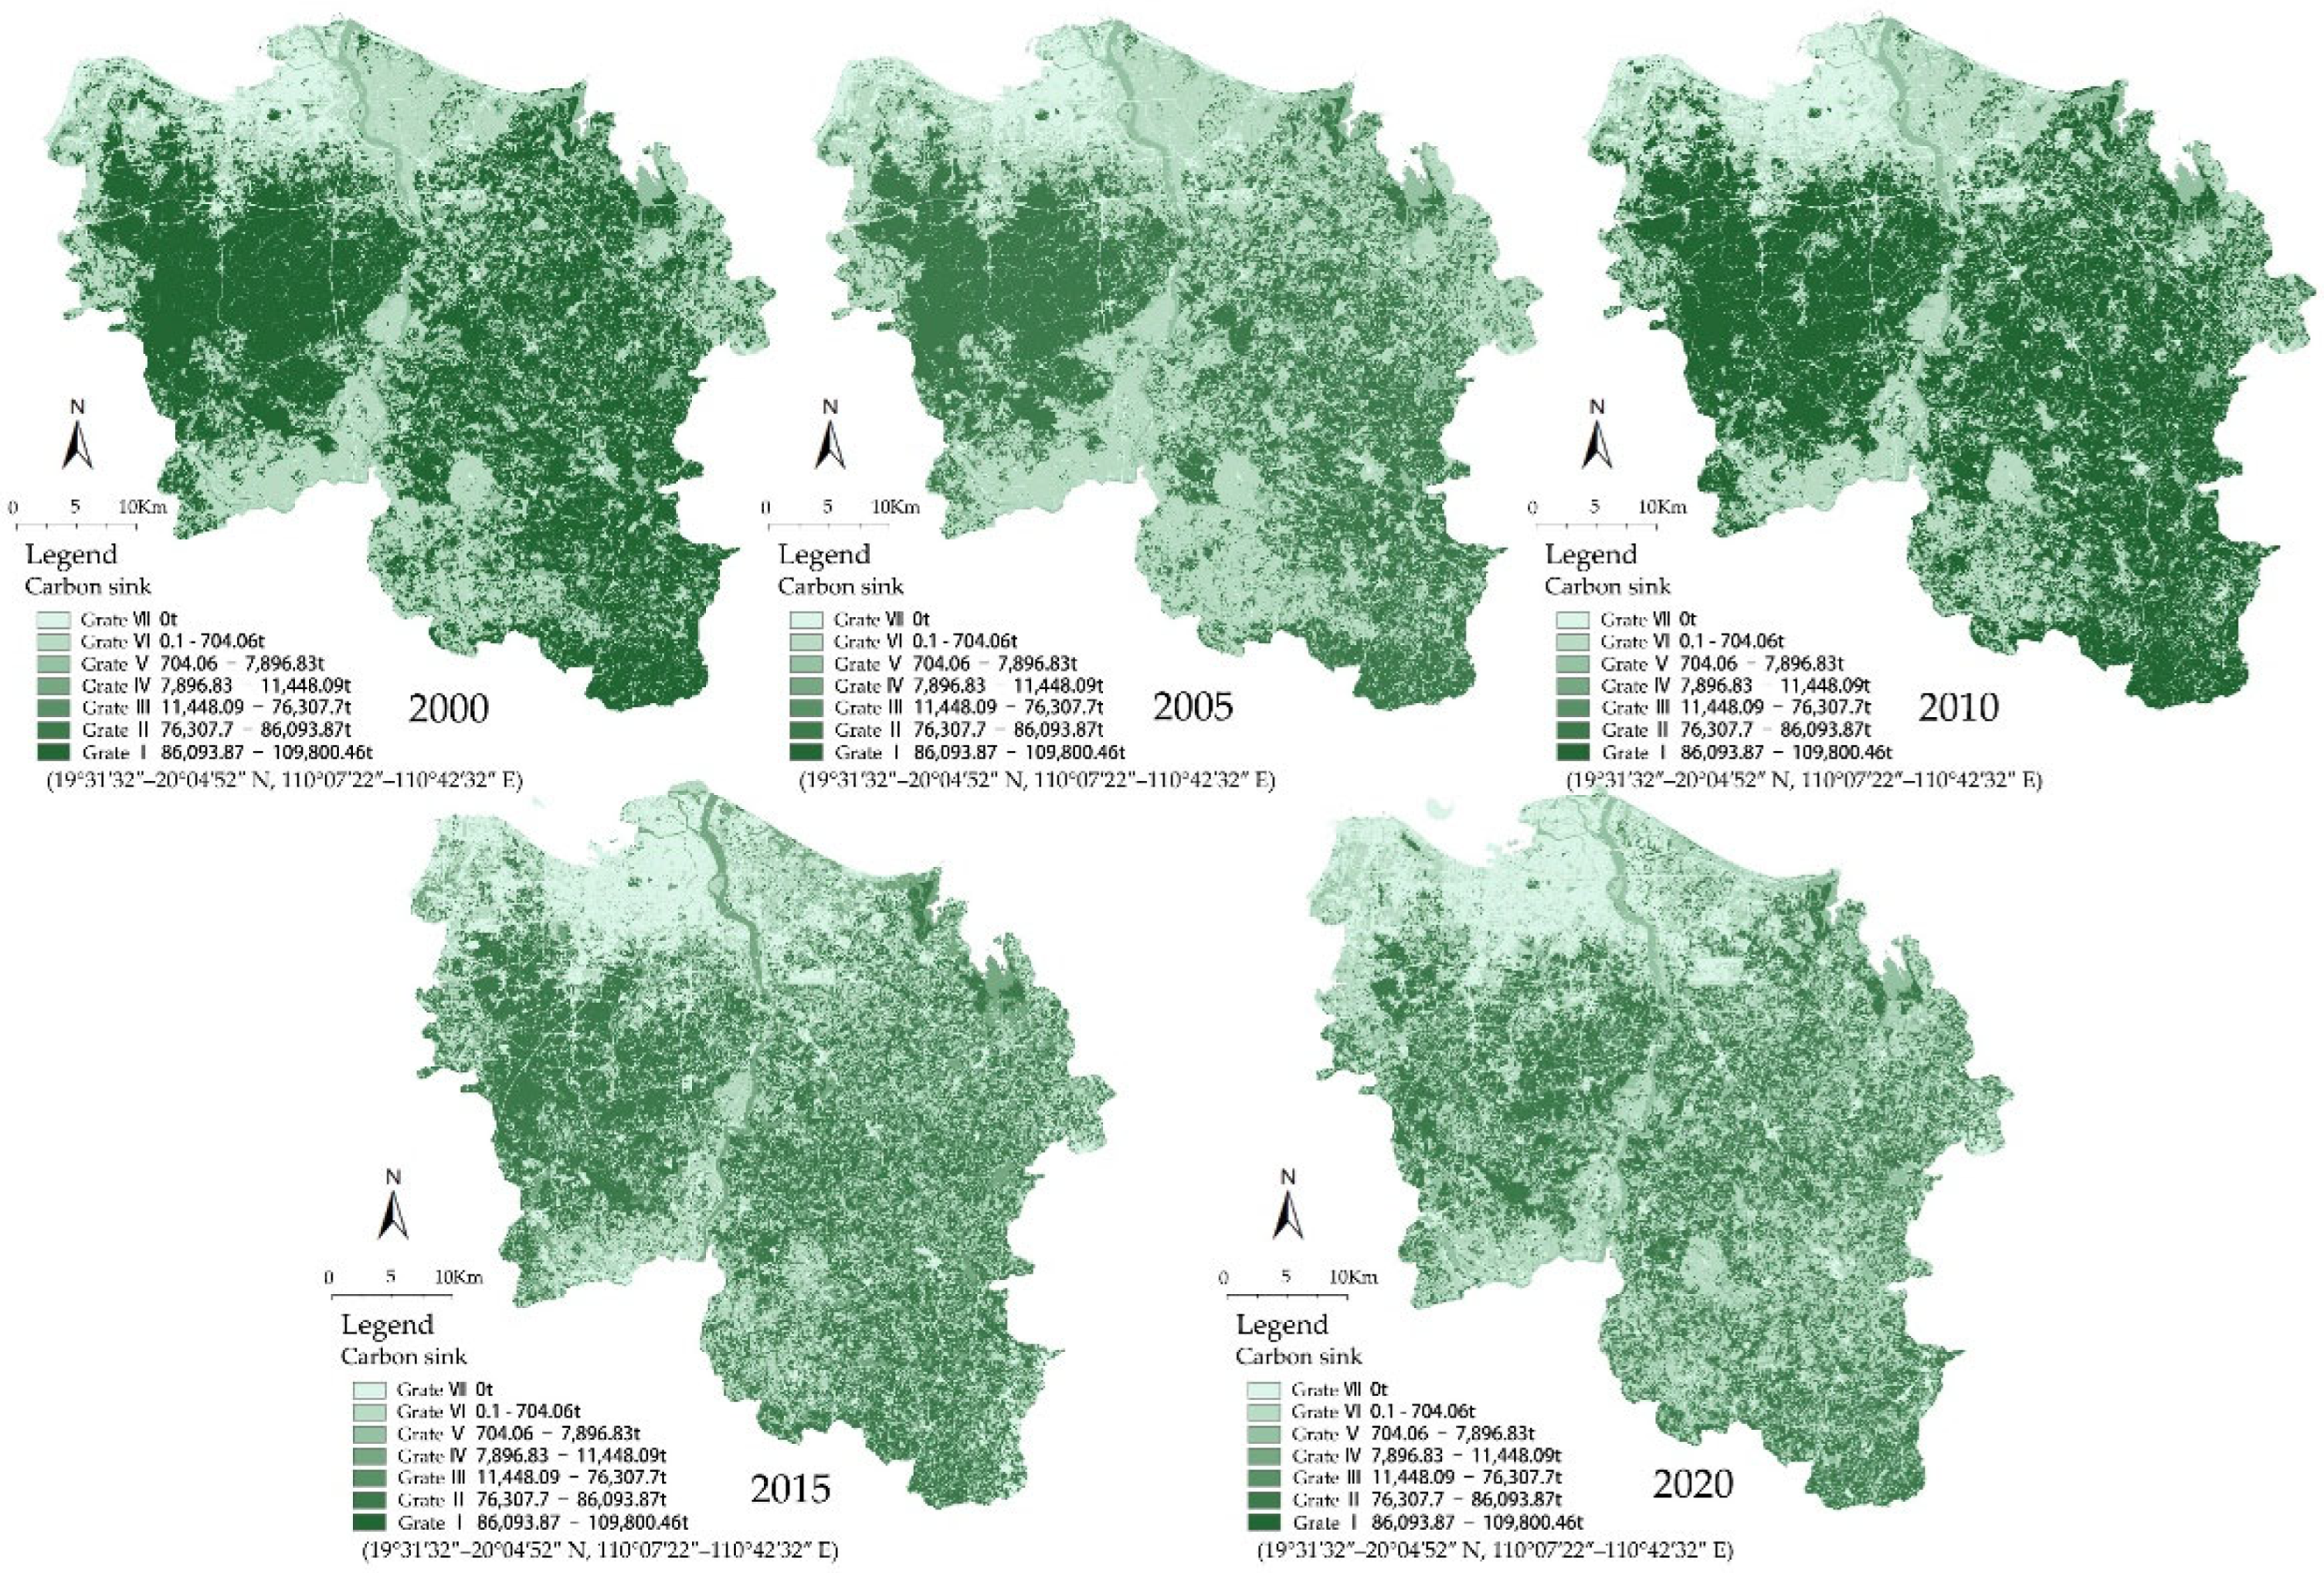
Figure 5 shows that carbon sink areas are primarily located in the southern region and have been gradually retreating southward over time. Combined with Figure 6, it is evident that Haikou City has experienced degradation of high-level carbon sink patches to lower levels. The area of high-level carbon sinks has been progressively decreasing, particularly for Grade I and Grade II patches, which disappeared after 2015, with most transitioning into Grade III patches. Moreover, carbon sink areas face significant fragmentation issues. From 2005 to 2020, large, contiguous high-level carbon sink patches were gradually fragmented into smaller, dispersed patches, with numerous linear and punctate Grade VII patches emerging within these areas. Meanwhile, the northern Grade VII regions, corresponding to carbon emission zones, have continuously expanded. These changes reflect the accelerating loss of ecological land due to urban expansion. Although limited in number, Grade V patches exhibit expansive, contiguous forms with good connectivity (Figure 5), which aligns closely with the spatial distribution of water bodies.
Figure 6 further indicates a reciprocal transition between Level I carbon sink patches and Level VI patches. Between 2005 and 2010, approximately 34.64% of Level VI patches transitioned into Level I, a shift that resembles the mutual transitions observed between Level VI and Level VII areas in carbon emission zones. Analysis of land use maps indicates that these two patch types correspond predominantly to woodland and farmland, suggesting that these transitions may be associated with agricultural activities and initiatives such as the Grain for Green Program. For instance, the release of the Implementation Opinions on Improving the Grain for Green Policy by the Hainan Provincial Government in 2009 facilitated the conversion of some farmland to woodland.
In summary, Grade I and Grade II areas exhibit characteristics of “high carbon sink–high aggregation” and form the core framework of the urban carbon sink network. However, their increasing fragmentation necessitates prioritized protection and optimization. Although Grade VI areas are widely distributed, their fragmentation is intensifying, and their carbon sink potential is limited. Implementing Strategies such as promoting ecological agriculture and enacting land use policies that prioritize ecological restoration represents a key strategy for boosting carbon sequestration capacity. Grade V areas exhibit high internal connectivity, endowing them with significant carbon storage potential and considerable capacity for regulating local microclimates. Therefore, it is imperative to enhance and maintain their connectivity through targeted conservation and planning efforts.

4.3. Evolution of Urban Morphology

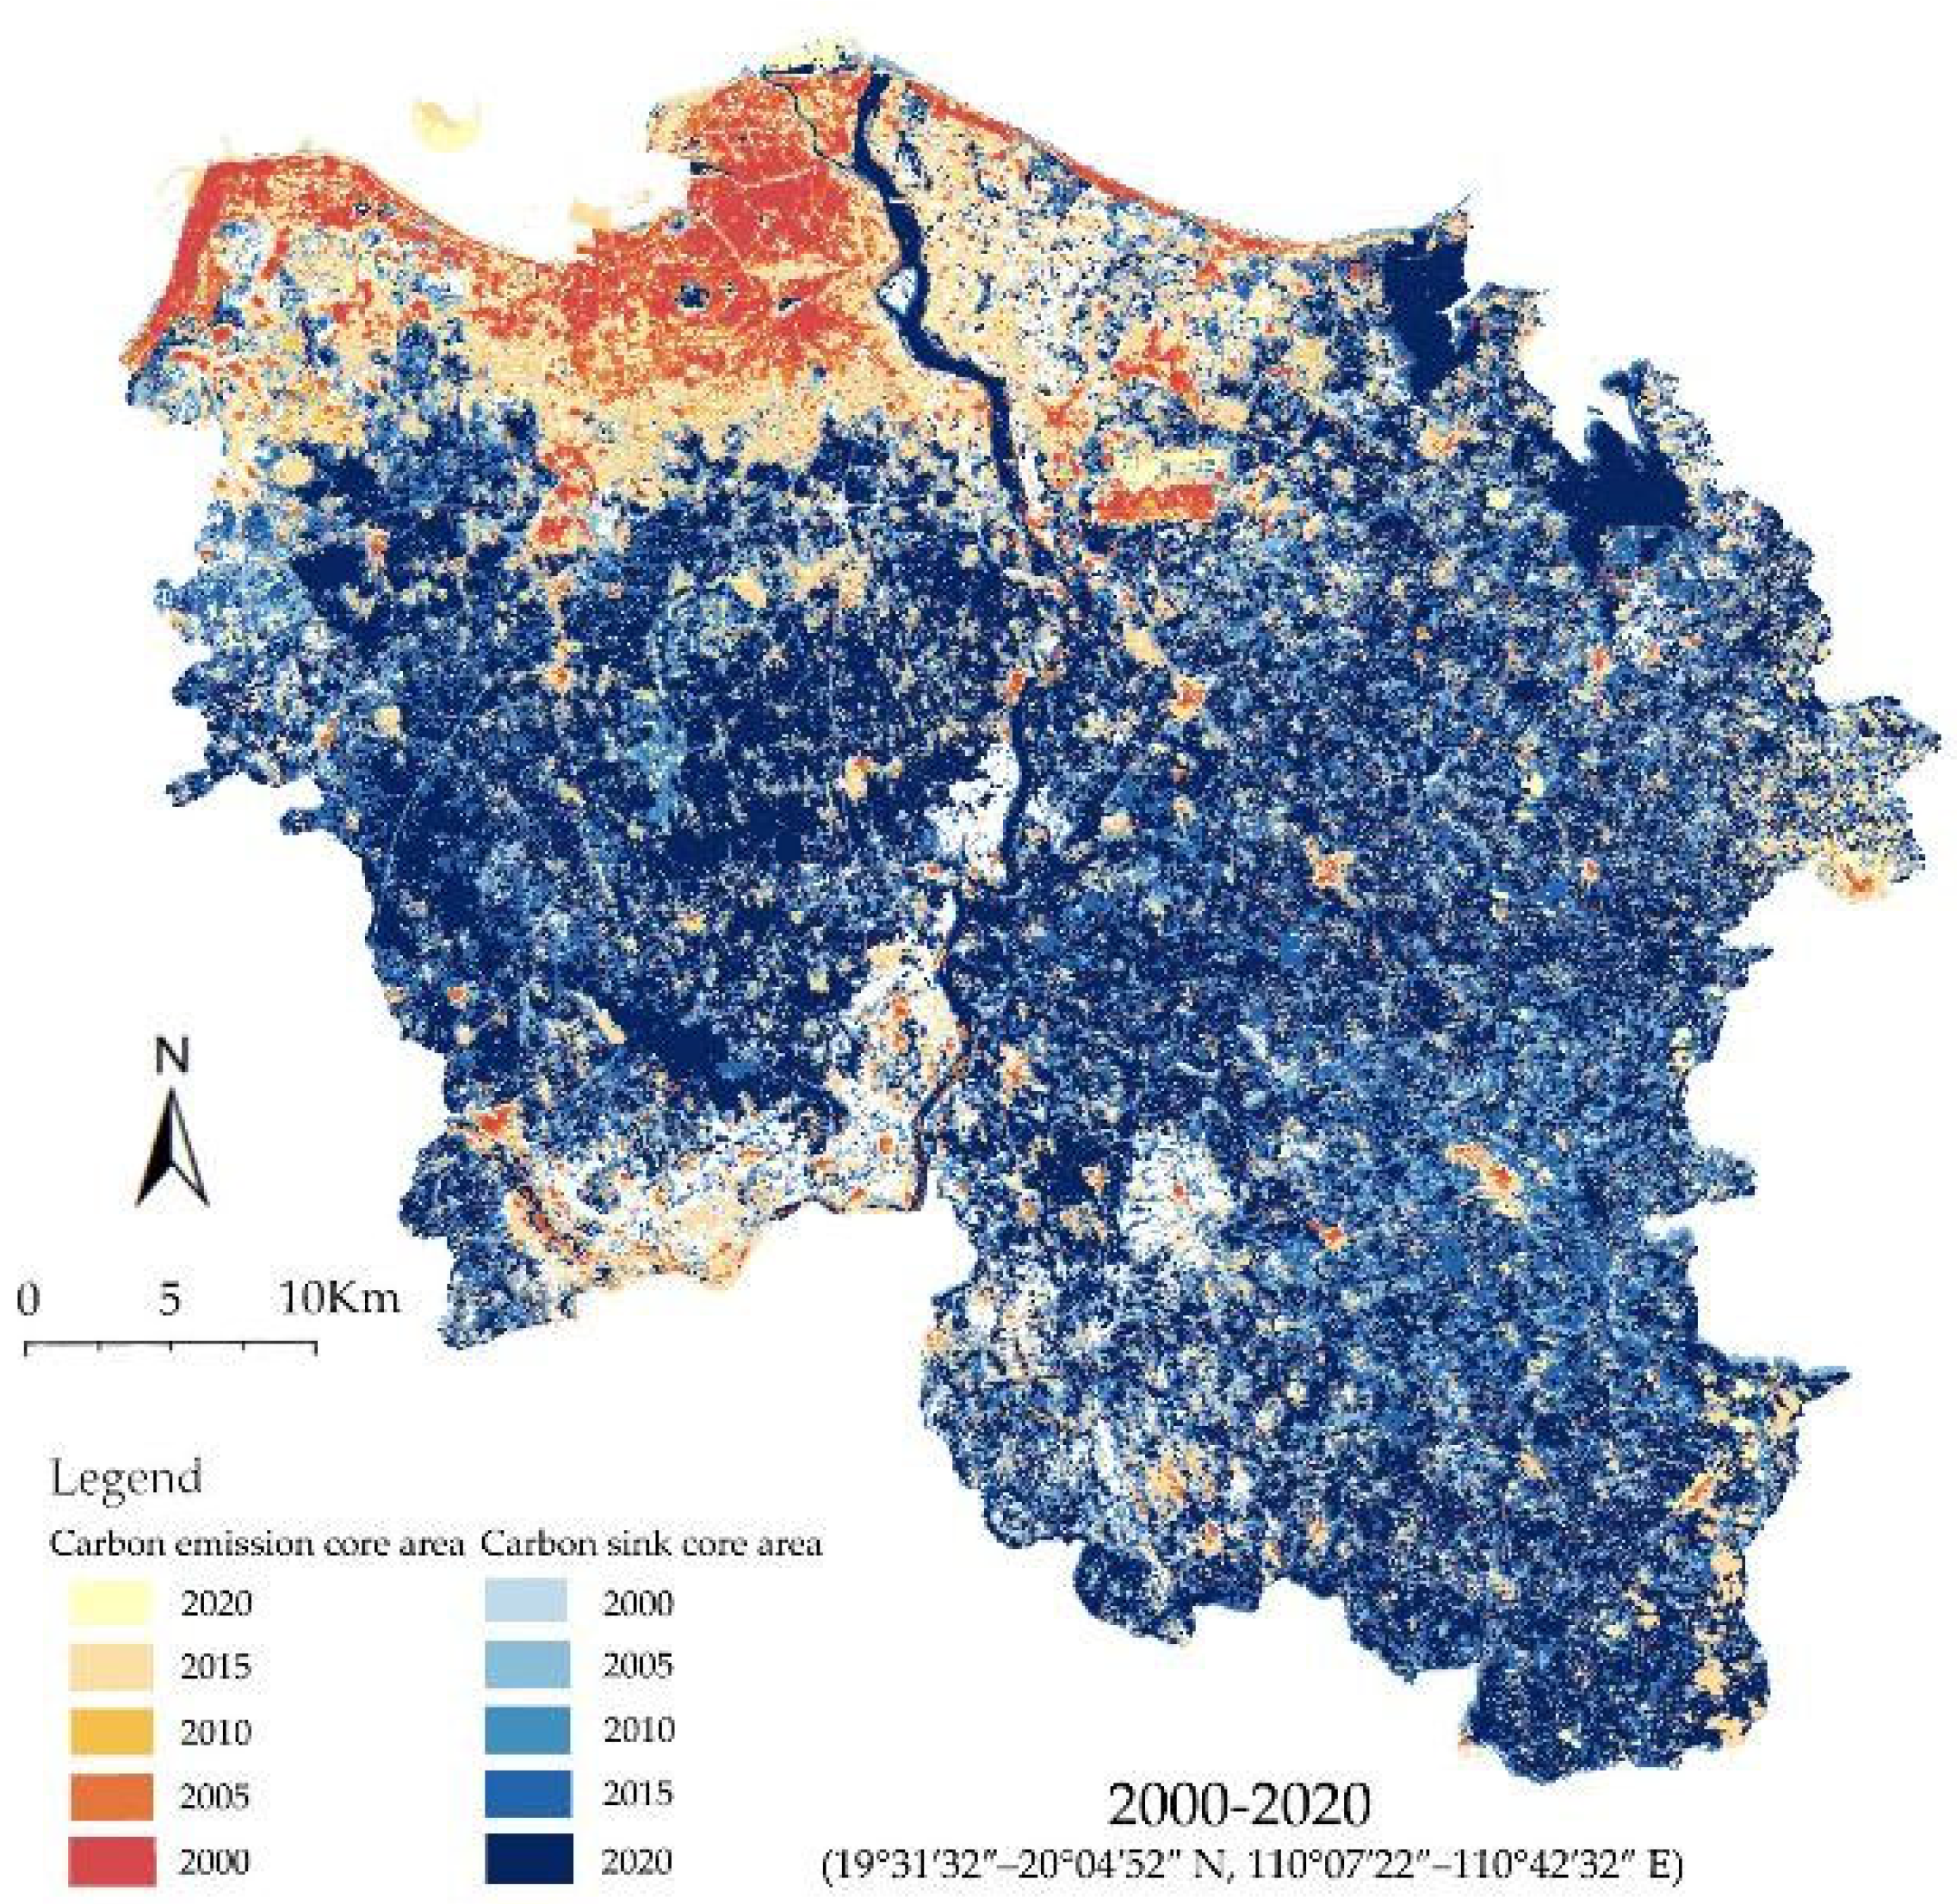
Figure 7 illustrates the spatial evolution of the carbon emission core zone (urban and built-up land) and the carbon sink core zone (green space and water bodies). The carbon emission core zone is primarily distributed in the northern coastal area and along the southwestern river corridor, gradually expanding southward over time. Its spatial form evolved from an elongated belt-like structure to a more contiguous, patch-like pattern. In contrast, the carbon sink core zone in the southern part of the city has continuously contracted, transforming from a concentrated and contiguous distribution into a fragmented pattern with increasing morphological complexity.
According to the Class Area (CA) index shown in Figure 8, the area of the carbon emission core zone has maintained a steady growth trend, with the most rapid increase occurring between 2010 and 2015, followed by relative stabilization after 2015. The carbon sink core zone, however, experienced a process of decrease–increase–decrease, largely influenced by fluctuations in forestland coverage.
As shown in Figure 8, the morphological complexity (measured by PAFRAC) of the carbon emission core zone reached its peak in 2010 (1.475), then declined to its lowest value of 1.437 in 2015. During this period, the rapid increase in area coupled with decreasing complexity indicates that urban expansion was compact rather than disorderly, reflecting a controlled development pattern. This interpretation is further supported by the nearly unchanged PLADJ (aggregation) index during the same period.
In contrast, the carbon sink core zone exhibited a negative correlation between morphological complexity and area expansion—when the area increased, the PAFRAC index decreased, and vice versa. The PLADJ index showed a similar inverse relationship, likely due to the fragmentation process of ecological land in this zone.
Overall, both the carbon emission and carbon sink core zones show a declining trend in landscape aggregation. Figure 7 illustrates different causes for these changes: the carbon emission core zone experienced reduced aggregation from its diffuse southward expansion and weak integration with the main urban core, while the carbon sink core zone suffered aggregation loss primarily from ecological fragmentation driven by urban expansion.

4.4. Spatial Autocorrelation Analysis of Carbon Metabolism

4.4.1. Spatially Aggregated and Heterogeneous Regions of Carbon Metabolism

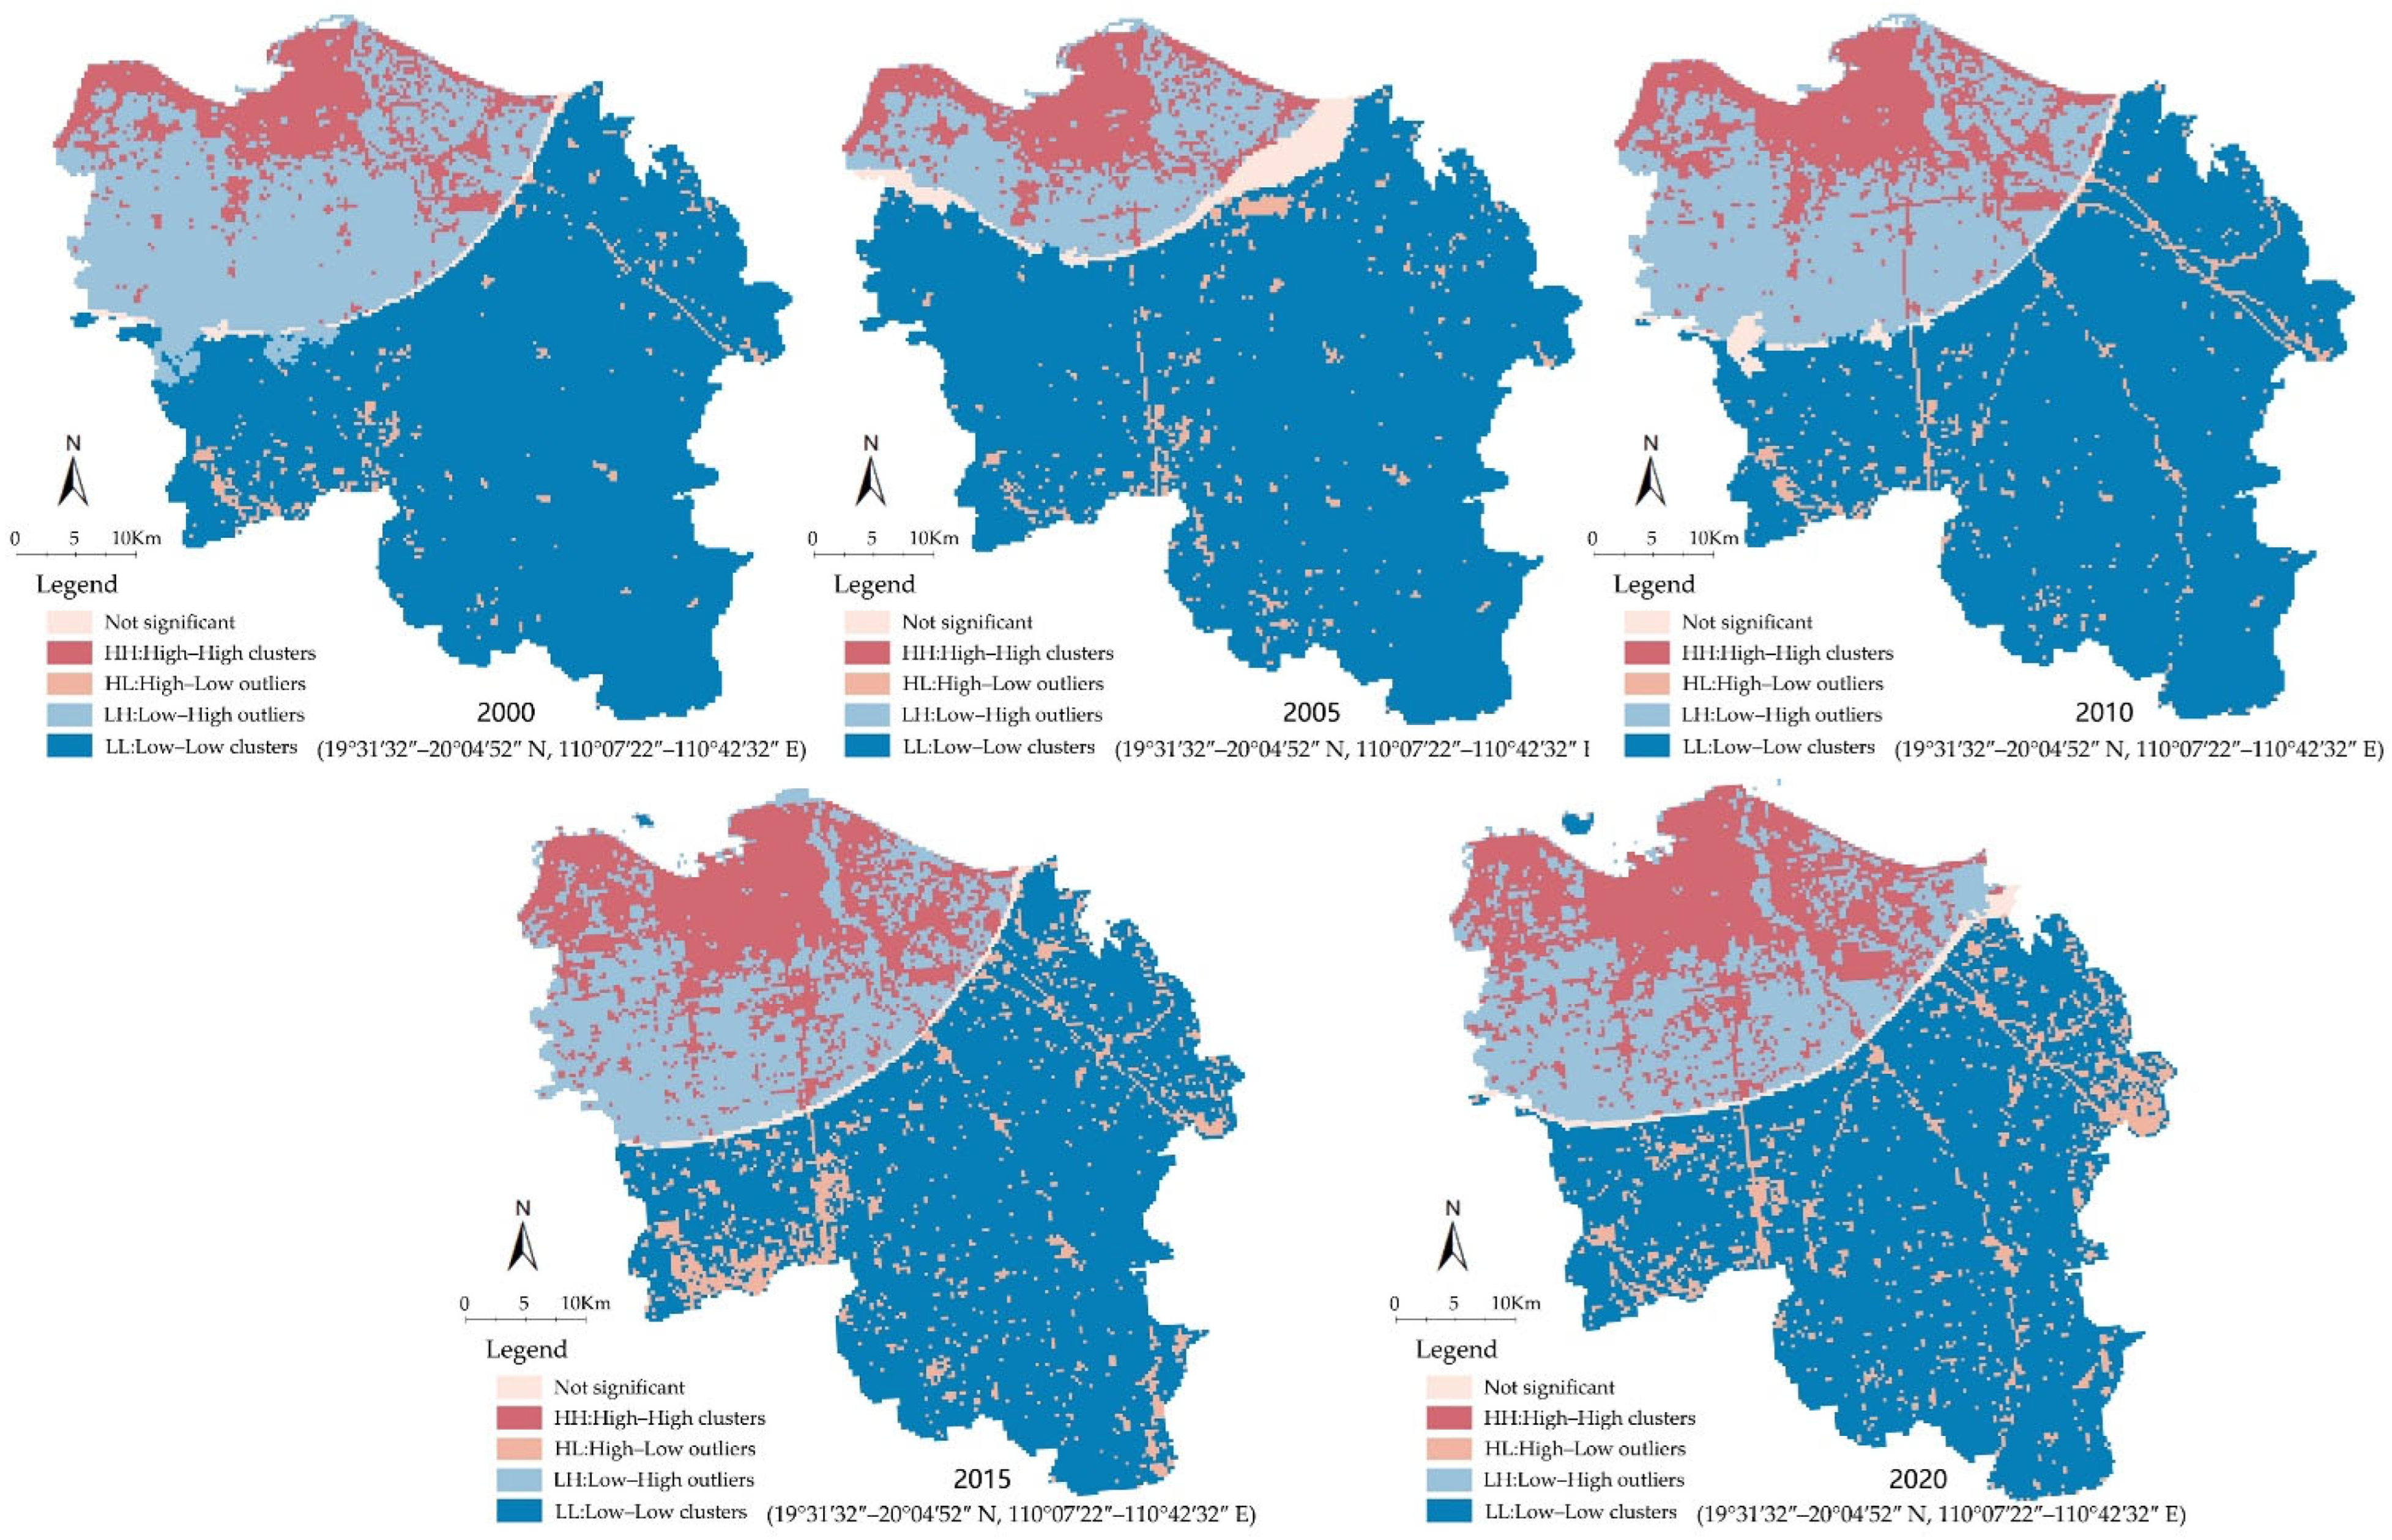
Based on the spatial autocorrelation analysis of carbon emissions across five time periods from 2000 to 2020 (Figure 9), a clear and significant spatial clustering pattern can be observed, with the extent of clustered areas continuously expanding. At the overall spatial level, High–High clusters were predominantly located in the northern, coastal, and central urban areas, which are characterized by intensive construction land use. This clustering pattern began to emerge in 2000 and expanded progressively with urban development, peaking in 2015, followed by minimal change by 2020. This stabilization may be associated with land regulation policies implemented during this period.
Meanwhile, Low–Low clusters were consistently found in the southern and peripheral regions of the city, with their spatial extent gradually decreasing over time. These areas are primarily composed of ecological or agricultural lands with low population density and limited industrial activities, resulting in consistently low carbon emissions. After 2010, spatial heterogeneity in carbon emissions intensified, and by 2020, the ratio of High–High to Low–Low clusters reached its peak.
Furthermore, the number of Low–High outliers (low-emission areas surrounded by high-emission zones) generally declined, as they were increasingly replaced by High–High clusters, a trend that accelerated after 2010. In contrast, the number of High–Low outliers increased significantly, typically appearing in linear or punctate patterns along urban fringe areas or at the boundaries of functional zones. This indicates that these regions are undergoing a transitional phase from low- to high-density emission patterns, with High–High clusters expanding along the spatial direction of these HL outliers.
Overall, the spatial autocorrelation pattern of carbon emissions demonstrates a clear structure: higher in the north and lower in the south, stronger in the center and weaker at the periphery. Its evolution is closely linked to urbanization, land use transformation, and transportation infrastructure expansion. In the context of dual carbon goals, i.e., carbon peaking and carbon neutrality, future efforts should focus on managing emissions in high-value agglomeration zones, optimizing urban functions, and implementing land remediation strategies to promote low-carbon and intensive land use practices.
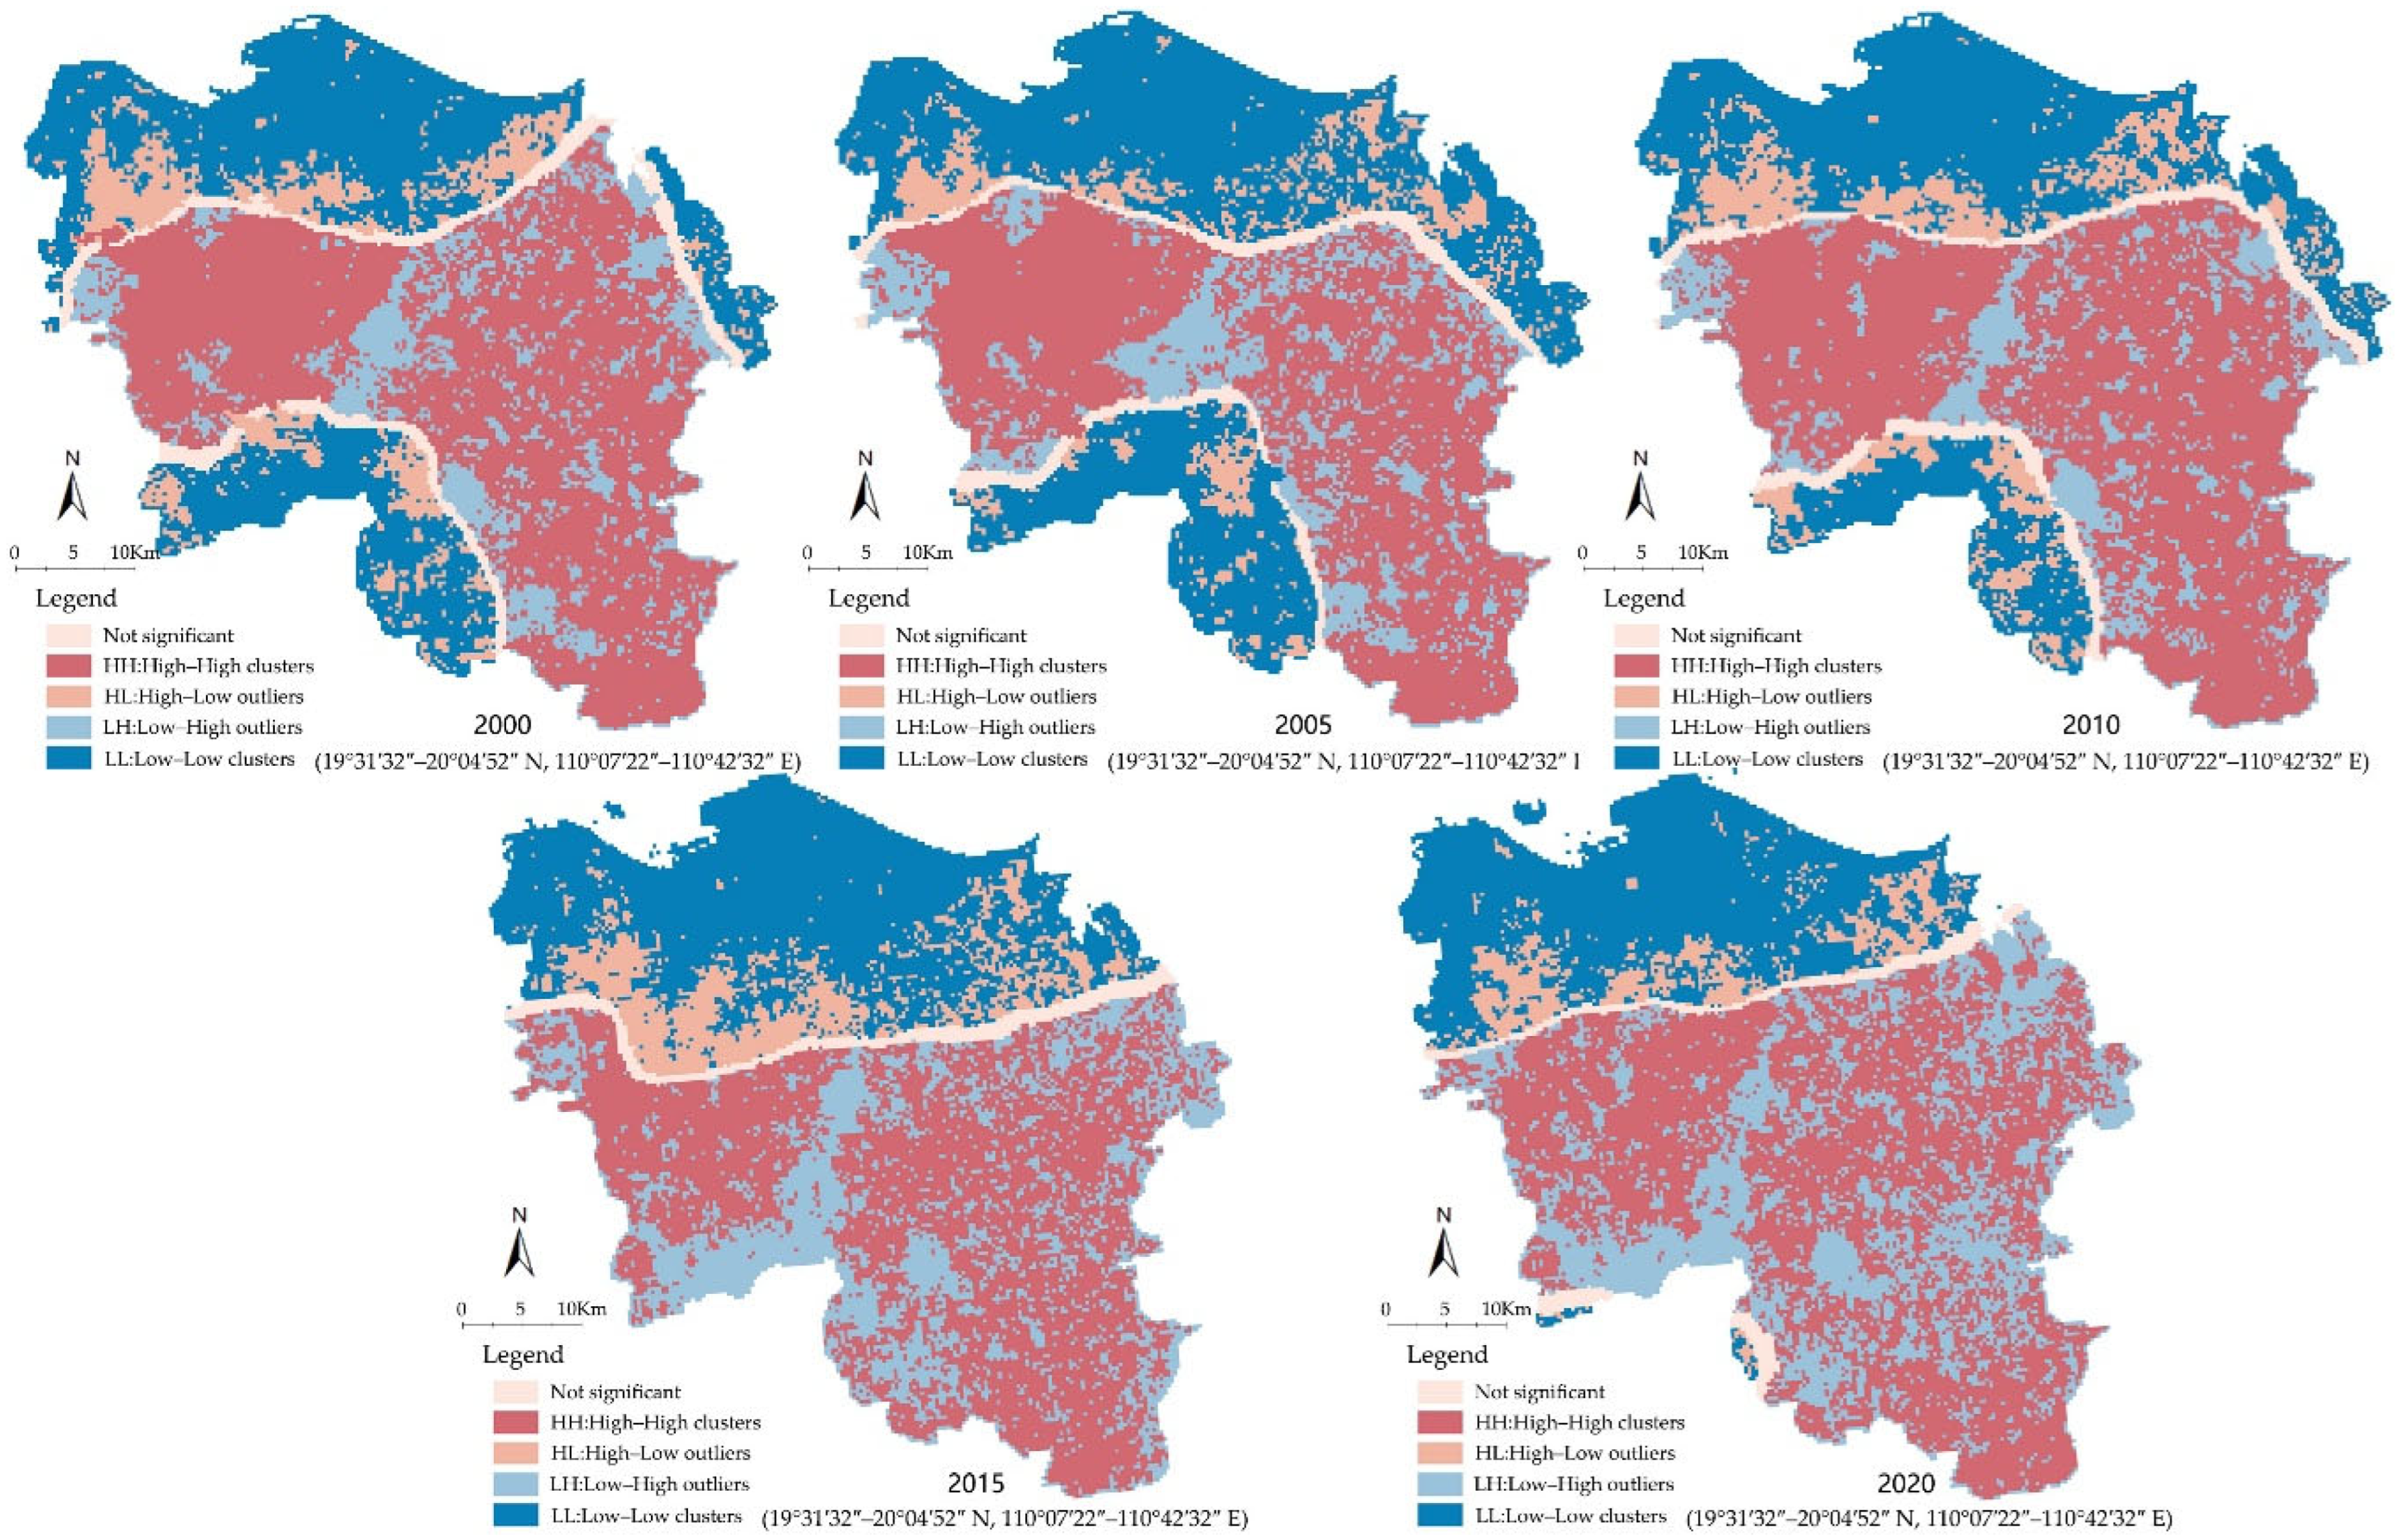
Figure 10 presents the spatial autocorrelation of carbon sinks, revealing a pattern marked by the coexistence of significant High–High and Low–Low clusters alongside growing local heterogeneity.
In terms of overall spatial distribution, High–High clusters of carbon sinks have remained consistently located in the southern part of the city over time. These areas are dominated by forestland and certain wetland ecosystems, featuring high vegetation coverage and ecosystem productivity, thus serving as core zones for carbon sequestration. After 2015, the extent of high-value agglomerations expanded further into the southwestern region, although increasing fragmentation was observed. In contrast, Low–Low clusters are mainly concentrated in the northern region, where carbon sink levels are relatively low and spatially stable. These areas largely correspond to cropland, construction land, and artificial green spaces. With ongoing urban expansion, some Low–Low clusters began to show improved carbon sink performance along their edges after 2010, transitioning into Low–High outlier zones. This shift likely reflects improvements in carbon sink functionality due to land use restructuring or afforestation initiatives.
From the perspective of spatial heterogeneity, a growing number of High–Low outliers and Low–High outliers have appeared since 2005, indicating increasing complexity in transitional zones and patch boundaries within the carbon sink spatial pattern. This reflects enhanced local heterogeneity in land use. These phenomena predominantly occur at the interface between urban ecological spaces and construction land, suggesting that urban expansion has led to effects such as “ecological encroachment” or “ecological nesting.”
In summary, the spatial distribution of carbon sinks generally follows a pattern: higher in the south and lower in the north, stronger at the edges and weaker in the center. With ongoing urban ecological development and land use changes, high-value areas are becoming increasingly fragmented, while low-value areas exhibit greater volatility. Future low-carbon planning should prioritize the protection of ecological integrity in high-value carbon sink agglomerations and focus on optimizing green space structure and ecosystem restoration in low-value clusters so as to enhance the city’s overall carbon sink capacity.

4.4.2. Changes in the Autocorrelation Patterns of Carbon Metabolism

Figure 11 illustrates the variations in relevant indices across four categories of carbon emissions: HH, HL, LH, and LL regions. The area of the HH region surged after 2005, expanding by 232 km2 over the following 15-year period. Throughout this time, the patch density (PD) index remained consistently low, while the aggregation index (AI) remained relatively high. This pattern suggests that areas with high carbon emissions are not only expanding but also consolidating into more contiguous units. The spatial autocorrelation analysis further supports this observation, as reflected in the rising largest patch index (LPI) and connectivity metrics.
Conversely, the LL region experienced areal contraction after 2005, shrinking by 484 km2 over the same period, accompanied by a decline in LPI. This reduction indicates ongoing fragmentation into smaller, isolated patches. The concurrent increase in AI reinforces that fragmentation is intensifying, likely due to urban encroachment into forested and agricultural lands.
Although the HL region covers the smallest area, it recorded the highest PD index, which rose rapidly after 2010 and approached 0.2 by 2020. Both LPI and AI remained low in this region, with LPI peaking at only 1.69, indicating a highly fragmented and dispersed spatial pattern. Nevertheless, the increasing COHESHION index suggests improving linkages among these patches. Spatial autocorrelation results reveal that this connectivity is often facilitated by linear features such as roads, typical of urban expansion patterns. These characteristics mark the HL region as a potential hotspot for future carbon emissions, warranting particular attention.
As a transitional zone, the LH region is influenced by both carbon emission and sequestration processes, leading to fluctuating indices without a consistent directional trend. However, the rising PD index and declining LPI and AI indices since 2010 indicate that the region is undergoing fragmentation.
Figure 12 shows that the extent of high carbon-sink aggregation zones remained consistently high over time, except for two notable declines in 2005 and 2015, with reductions of 122 km2 and 117 km2, respectively. Spatial autocorrelation patterns indicate that these decreases coincided with an expansion of LL zones in the southwestern and northeastern sectors in 2005. Land use change analysis reveals that the conversion of forest to cropland in these regions contributed to the contraction of high carbon-sink clusters.
The reduction in HH area in 2015 was driven by the southward expansion of the northern LL carbon-sink zone and the encroachment of LH areas into several high-carbon-sink regions, resulting in increased fragmentation. This interpretation is further supported by the concurrent rise in the LH area index.
In terms of the Largest Patch Index (LPI), the HH region exhibited considerable fluctuation, declining from 36.75 in 2005 to 27 in 2015, reflecting enhanced fragmentation. This trend is consistent with the increase in Patch Density (PD) and decrease in Aggregation Index (AI). However, post-2015, the LPI rebounded sharply, reaching a peak of 38.74 in 2020—a pattern that appears contradictory to general fragmentation trends.
Spatial autocorrelation analysis (Figure 12) clarifies this apparent discrepancy: prior to 2010, high-carbon-sink areas were characterized by multiple large, uniformly distributed patches. After 2015, fragmentation became more pronounced. By 2020, however, large patches reemerged in the western and southeastern parts of the city, signaling renewed aggregation. Meanwhile, fragmentation persisted in other regions, suggesting a shift toward mononuclear spatial development—a trajectory consistent with the recovered LPI values.
The COHESHION index remains high in both HH and LH regions, highlighting strong internal connectivity and underscoring the need for focused monitoring of carbon emission and sequestration dynamics. Other regions, particularly those at the interface between emission and sink cores, show greater variability. Since 2010, the improved connectivity of both LH and HH regions signals the gradual encroachment of high-emission zones into high-sequestration areas, shifting the balance toward carbon emissions.

4.5. Response of Carbon Metabolism Patterns to Urban Morphological Changes

Table 6 illustrates the variation trends of indices representing urban morphological complexity and the spatial aggregation patterns of urban carbon metabolism. As shown in the table, an increase in the morphological complexity of the carbon emission core zone corresponds to higher LPI (Largest Patch Index) and AI (Aggregation Index) values in the HH (high–high) carbon emission clusters, indicating that high-emission areas tend to become more spatially aggregated. In contrast, the HL (high–low) zones exhibit the opposite trend—greater morphological complexity leads to increased fragmentation and expansion in the HL areas.
From the perspective of carbon sinks, higher morphological complexity in the carbon sink core zone results in lower aggregation levels of high-carbon-sink areas (HH zones), a reduction in their total area, and more pronounced fragmentation. Conversely, the LH (low–high) zones show a positive correlation with morphological complexity—more complex urban forms correspond to larger LH areas with enhanced connectivity and aggregation.
These spatial response patterns suggest that as the city expands outward, urban edge areas tend to exhibit greater complexity and fragmentation compared to the urban core. These edge zones are typically surrounded by green and agricultural land, facilitating the outward diffusion of carbon emissions and consequently altering the spatial configuration of carbon sinks. This process fragments high-carbon-sink areas and consolidates high-carbon-emission zones, thereby reinforcing a monocentric urban structure.
Therefore, managing the morphological complexity of built-up areas is critical for low-carbon urban planning. Containing urban sprawl and regulating urban form complexity are essential to achieving a balanced spatial structure that underpins compact, resilient, and low-carbon urban development.

5. Discussion

5.1. Analysis and Comparison of Results

Extensive research indicates that changes in land use patterns and urban form can significantly alter urban carbon metabolism. In this study, the expansion of construction land is accompanied by the conversion of carbon sink patches into carbon emission patches. Moreover, functional and structural changes within construction land have led to an increase in high-carbon-emission patches, which also show greater spatial concentration (Figure 3). These shifts occur because the composition of construction land influences living, production, and transportation modes, thereby affecting carbon emissions, which is also emphasized by Wei et al. [9].
While industrial and transportation land are typically considered major contributors to carbon emissions, this study finds that after 2015, carbon emissions from residential land in Haikou surpassed those from industrial land. Together with transportation land, residential land became one of the primary sources of emissions (Table 5), a pattern similar to that observed in Tianjin, China [47]. This shift is primarily driven by Haikou’s low secondary industry proportion, combined with rapid population and motor vehicle growth over the past two decades. This combination has substantially increased emissions from residential and transportation sectors while reducing the share from industrial land use, a trend also observed in other Chinese cities during the same period [48]. In addition, technological innovation and economic restructuring have further contributed to the decline in industrial energy consumption.
Analyzing carbon metabolism patterns helps not only to assess the current state of regional carbon flows but also supports policymakers and planners in guiding the spatial direction of urban development and carbon metabolism expansion [49]. In Haikou, high-carbon-emission areas are concentrated in the north and extend along the coastline to the east and west of the main urban area. The expansion peaked between 2010 and 2015, and subsequently decelerated. Meanwhile, high-carbon-sink areas have generally contracted. These findings align with Fu et al. [50], who reported that construction land in Haikou grew most rapidly before 2015, with expansion slowing thereafter. Urban expansion hotspots have emerged on the eastern and western flanks of the central urban area, leading to a substantial decline in ecological land because of construction land encroachment. Wang et al. [51] further identified high-value areas of ecosystem services in western and southern Haikou, and low-value areas in the northern urban center, southwest, and parts of the east—a spatial correspondence with the HH and LL clusters of carbon sinks identified in this study.
In this study, we employed the fractal dimension and landscape aggregation indices to describe the spatial characteristics of urban morphology. The results reveal a certain correlation between these indices and urban area: as the city expands, its fractal dimension increases, indicating higher morphological complexity, while aggregation decreases, reflecting a more dispersed spatial pattern. However, during certain periods, urban area continued to grow while morphological complexity decreased—a phenomenon also observed in studies of Beijing–Tianjin–Hebei Urban Agglomeration by Zhang et al. [52] and Xia et al. [16]. This suggests that, during development, some cities have exercised control over expansion scale, thereby curbing unchecked sprawl. Additionally, Xing et al. [53] noted that built-up area expansion in Haikou City primarily occurred through infill development.
The response of carbon metabolism patterns to changes in urban form is also evident. The spatial characteristics of carbon metabolism, such as its degree of clustering and spatial heterogeneity, are significantly influenced by urban morphological dynamics. For instance, high–high (HH) carbon emission clusters tend to become more aggregated as urban form complexity increases, showing a trend toward monocentric development. In contrast, the aggregation of high–low (HL) heterogeneous areas decreases with greater morphological complexity. Regarding carbon sinks, the distribution of high–high (HH) carbon sink clusters exhibits a negative correlation with urban form complexity: the more complex the urban morphology, the more dispersed the spatial pattern of these HH zones (Table 6). There is considerable scholarly debate on the specific urban forms that best support the development of low-carbon cities: compact urban forms are demonstrated to reduce carbon emissions in Japanese cities [28], and polycentric development are found to lower emissions in Chinese urban agglomerations, though excessive polycentricity can reduce energy efficiency [54]. These findings indicate that a polycentric yet compact urban structure is most conducive to low-carbon development.

5.2. Policy Implications

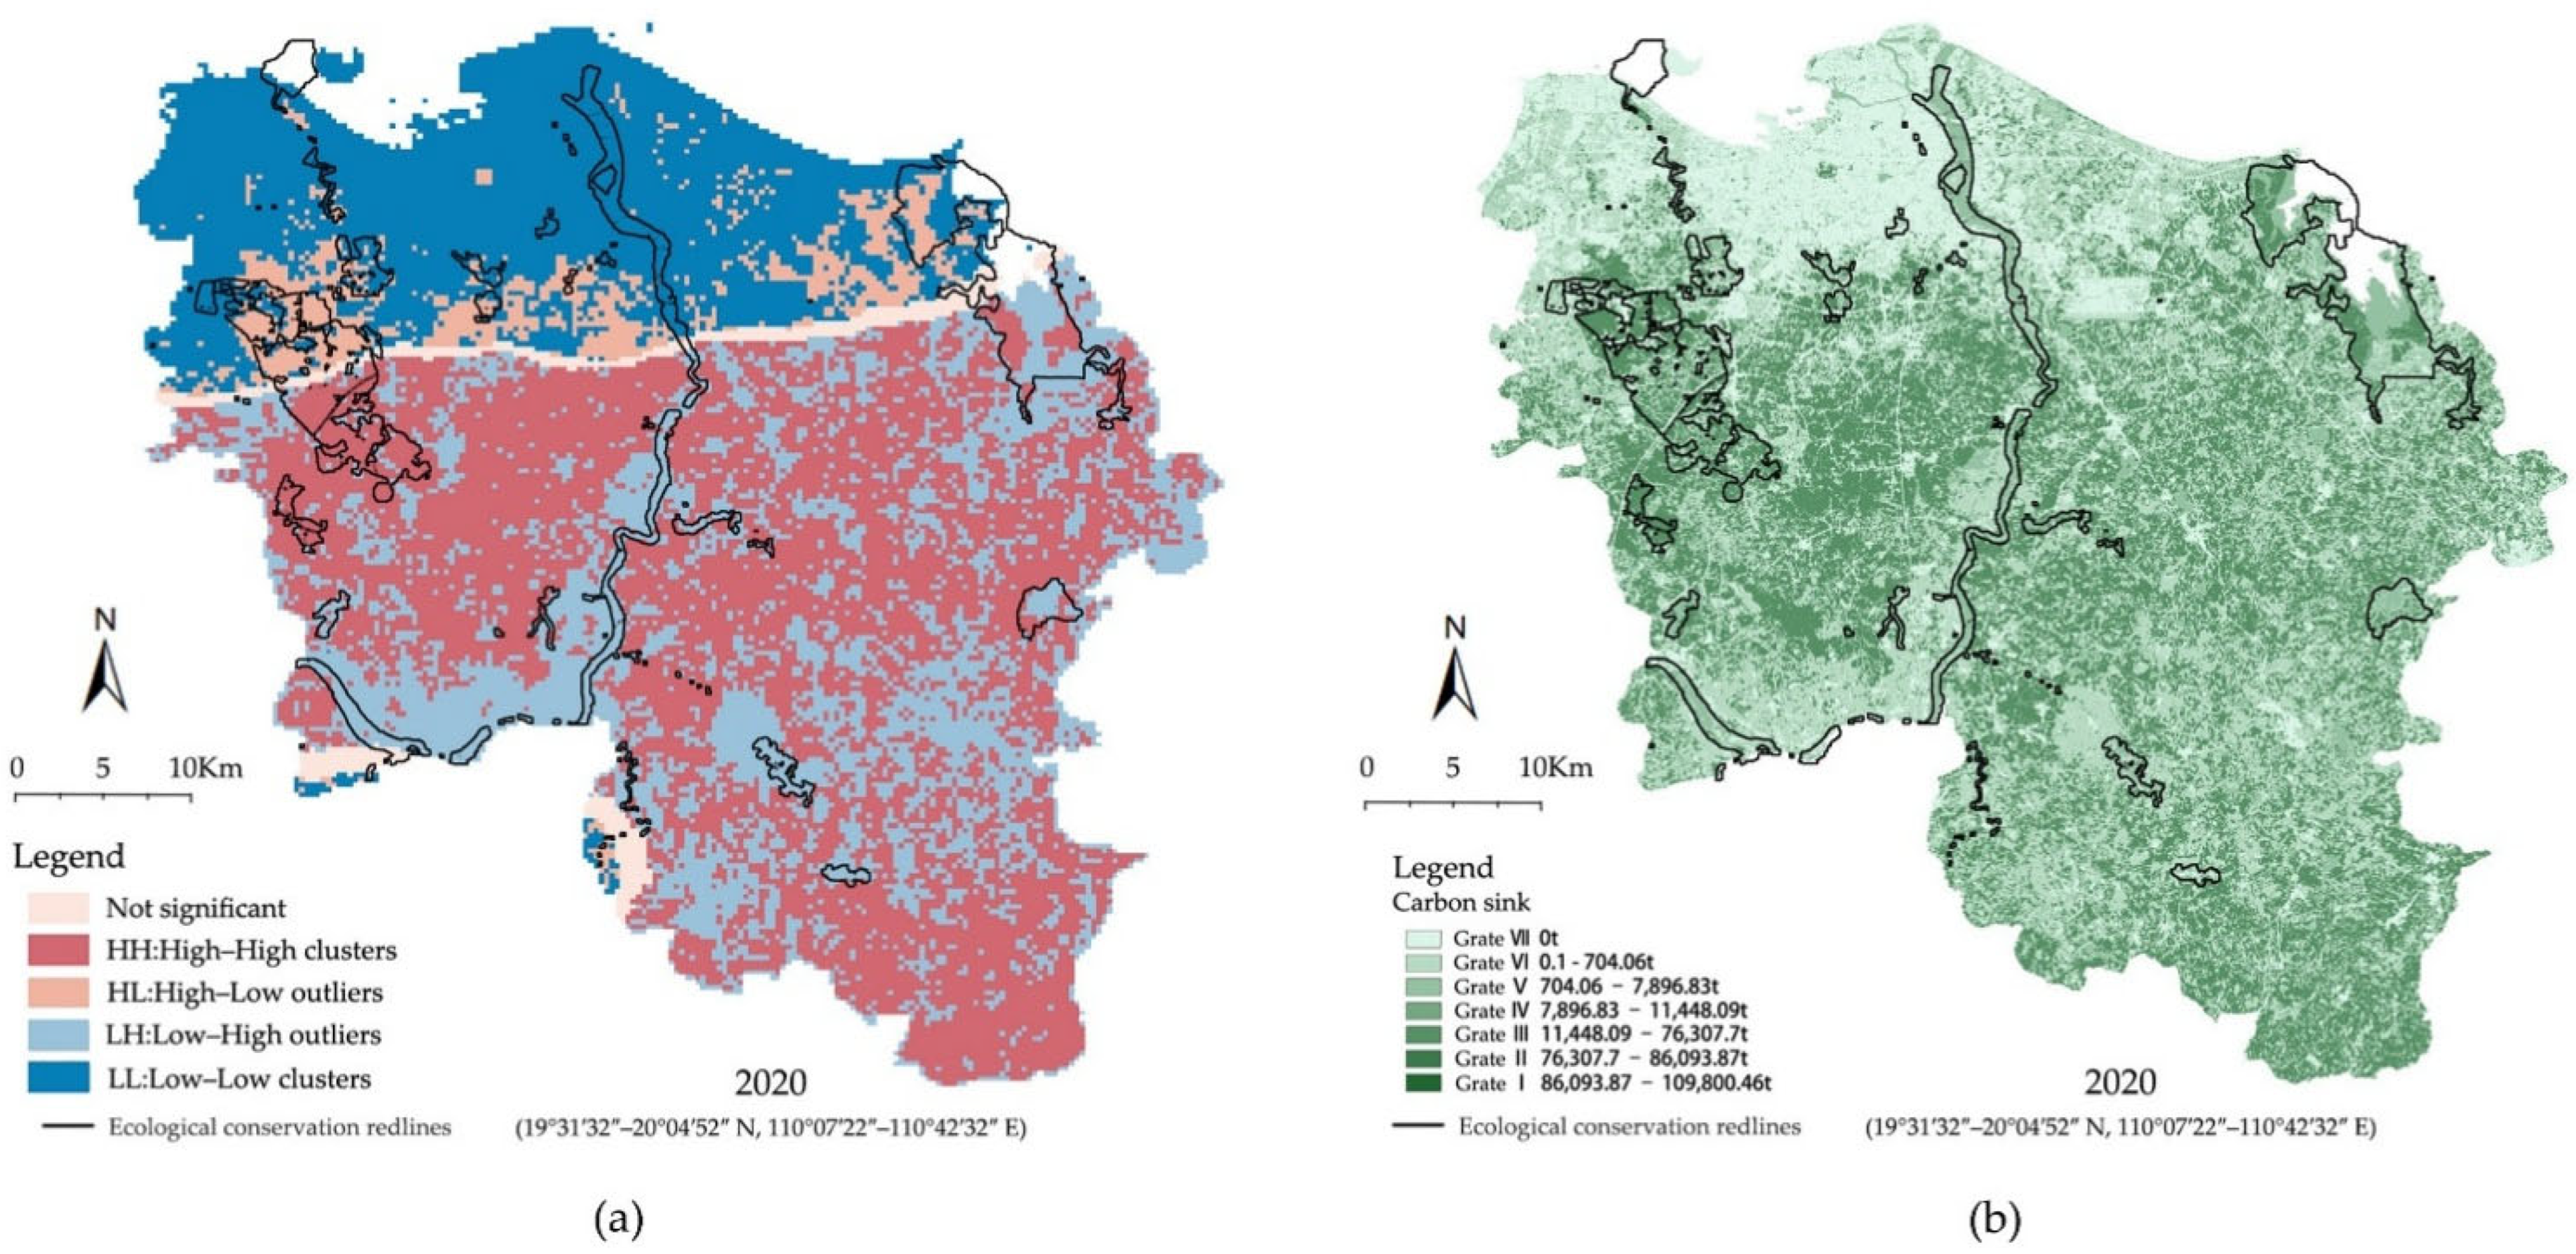
A comparison between Haikou’s 2020 carbon-metabolism pattern and the Haikou City Territorial Space Master Plan (2020–2035) shows that the planned urban development boundary largely overlaps existing HH and HL emission zones. To meet development needs, limited encroachment into high-sink zones occurs in the central and southern areas (Figure 13). Meanwhile, ecological protection redlines are primarily distributed in high-sink areas such as riparian corridors, western forest lands, and northeastern tidal flats, overlapping with several HL sink zones (Figure 14) and effectively curbing the southward expansion of high-emission areas.
Policy recommendations derived from these findings emphasize differentiated strategies for carbon emission and carbon sink zones. In high-emission areas, it is essential to optimize industrial and energy structures, increase road network density, and enhance the integration of urban spatial layout with transportation systems to mitigate emissions from industrial, residential, and mobility activities. In medium- and low-emission zones, the expansion of construction land should be strictly controlled, with greater emphasis on infill development and the revitalization of existing built-up areas to prevent the encroachment of high-emission activities into low-emission or sink zones. For high-sink areas, strict ecological redlines and buffer zones must be enforced, while ecological agriculture, composite green spaces, forest conservation, and ecological corridors should be promoted to strengthen the stability and integrity of carbon sinks.
From a regional planning perspective and in line with Haikou’s territorial spatial planning objectives, the HH emission region calls for intensive and efficient land use as a means to spatially contain and limit its carbon emissions. HL outlier zones may serve as potential sub-centers or regional hubs to alleviate carbon pressures in the urban core, but their spatial distribution should avoid excessive fragmentation. The extent of the HH carbon-sink region provides an important reference for delineating ecological protection boundaries and refining redline policies. Overall, in line with the Master Plan’s development principle, i.e., “eastward expansion, western enhancement, southern conservation, northern integration, and central optimization,” Haikou should gradually shift from a monocentric structure to a polycentric, grid-like spatial form that better supports long-term low-carbon development.

6. Conclusions

Global climate change has become a central topic in human–environment research. The process of urbanization has significantly reshaped carbon metabolism patterns, and urban planning now plays a crucial role in achieving low-carbon development. Increasingly, scholars and planners are seeking to promote carbon neutrality by optimizing urban structure. This study examined the relationship between carbon metabolism and urban form in Haikou, offering insights for low-carbon urban planning.
This research quantified carbon emissions and carbon sinks in Haikou from 2000 to 2020 and used GIS spatial analysis, spatial autocorrelation, and landscape index methods to reveal the spatiotemporal evolution of both carbon metabolism and urban morphology. The results indicate that high-carbon-emission zones expanded eastward and westward with urban growth. Among them, primary emission zones (Level I) clustered in the central-northern urban area, while secondary zones (Level II) exhibited the fastest expansion rate.
High–high carbon emission clusters (HH) showed a positive correlation with urban morphological complexity—the more complex the urban form, the stronger the aggregation of emissions, reflecting a monocentric development trend. In contrast, high-carbon-sink clusters were mainly distributed in the southern part of the city but were gradually eroded by low–high heterogeneous zones (LH), leading to increasing fragmentation and a decline in carbon sink capacity. The more complex the urban morphology, the lower the degree of aggregation in carbon sink areas.
However, this study has several limitations. First, the classification of land use based on remote sensing may introduce errors in land parcel positioning and shape recognition due to uncertainties in image resolution and classification algorithms [46]. These errors can be amplified when calculating landscape indices, potentially affecting the analysis of spatial patterns. Future research should employ higher-resolution imagery and refine land classification to achieve more precise boundaries, or conduct robustness analyses of the selected indices to enhance the accuracy of land use data interpretation [55].
Second, the estimation of carbon emissions and sinks relies on energy consumption and ecosystem carbon flux coefficients, which can vary significantly across regions. Even for the same land type, carbon metabolism capacity may be influenced by multiple factors. Therefore, the results of this study focus more on spatial trends and relative changes rather than absolute values. Future studies could incorporate locally calibrated emission factors and the carbon sequestration capacity of native vegetation to improve accuracy. Additionally, research could explore carbon density gradients to analyze the flow of carbon elements in response to urban morphological changes, providing a more comprehensive understanding of urban carbon metabolism.

Author Contributions

Conceptualization, S.L. and Z.Z.; Methodology, Z.Z. and S.L.; Investigation, Z.Z.; Software, Formal Analysis, Data Curation and Visualization, Z.Z. and X.F.; Validation, H.F.; Resources, S.L.; Writing—Original Draft Preparation, Z.Z. and X.F.; Writing—Review and Editing, H.F. and S.L.; Supervision and Project Administration, H.F. and S.L.; Funding Acquisition, S.L. All authors have read and agreed to the published version of the manuscript.

Funding

The research was funded by the Hainan Provincial Natural Science Foundation of China (722QN288).

Data Availability Statement

The majority of the data supporting the conclusions of this paper will be provided by the authors upon request. Some of the original data is sourced from Chinese government statistics.

Acknowledgments

We would like to thank Yunshan Chen, the chief planner of Haikou Urban Planning and Design Institute Co., LTD., for his valuable contribution to this article. His professional guidance and support further refined this work.

Conflicts of Interest

The authors declare no conflicts of interest.

References

  1. Chen, W.; Gu, T.; Fang, C.; Zeng, J. Global urban low-carbon transitions: Multiscale relationship between urban land and carbon emissions. Environ. Impact Assess. Rev. 2023, 100, 107076. [Google Scholar] [CrossRef]
  2. Bai, X.; Blanco, H.; Gurney, K.R.; Kılkış, Ş.; Lucon, O.; Murakami, J.; Pan, J.; Sharifi, A.; Yamagata, Y.; White, L. Urban systems and other settlements. In Climate Change 2022-Mitigation of Climate Change; Cambridge University Press: Cambridge, UK, 2022; pp. 861–952. [Google Scholar]
  3. Geremicca, F.; Bilec, M.M. Searching for new Urban Metabolism techniques: A review towards future development for a city-scale Urban Metabolism Digital Twin. Sustain. Cities Soc. 2024, 107, 105445. [Google Scholar] [CrossRef]
  4. Wolman, A. The metabolism of cities. Sci. Am. 1965, 213, 178–193. [Google Scholar] [CrossRef]
  5. Baccini, P. Understanding regional metabolism for a sustainable development of urban systems. Environ. Sci. Pollut. Res. 1996, 3, 108–111. [Google Scholar] [CrossRef]
  6. Chen, S.Q.; Long, H.H.; Chen, B. Assessing urban low-carbon performance from a metabolic perspective. Sci. China Earth Sci. 2021, 64, 1721–1734. [Google Scholar] [CrossRef]
  7. Hu, Y.J.; Sun, J.; Zheng, J. Spatiotemporal Analysis of Urban Carbon Metabolism and Its Response to Land Use Change: A Case Study of Beijing, China. Atmosphere 2023, 14, 1305. [Google Scholar] [CrossRef]
  8. Hong, C.; Burney, J.A.; Pongratz, J.; Nabel, J.E.; Mueller, N.D.; Jackson, R.B.; Davis, S.J. Global and regional drivers of land-use emissions in 1961–2017. Nature 2021, 589, 554–561. [Google Scholar] [CrossRef]
  9. Wei, J.; Xia, L.; Chen, L.; Zhang, Y.; Yang, Z. A network-based framework for characterizing urban carbon metabolism associated with land use changes: A case of Beijing city, China. J. Clean. Prod. 2022, 371, 133695. [Google Scholar] [CrossRef]
  10. Tang, X.; Xiao, J.; Ma, M.; Yang, H.; Li, X.; Ding, Z.; Yu, P.; Zhang, Y.; Wu, C.; Huang, J.; et al. Satellite evidence for China’s leading role in restoring vegetation productivity over global karst ecosystems. For. Ecol. Manag. 2022, 507, 120000. [Google Scholar] [CrossRef]
  11. Xu, Q.; Yang, R.; Dong, Y.-X.; Liu, Y.-X.; Qiu, L.-R. The influence of rapid urbanization and land use changes on terrestrial carbon sources/sinks in Guangzhou, China. Ecol. Indic. 2016, 70, 304–316. [Google Scholar] [CrossRef]
  12. Yang, X.; Liu, X. Path analysis and mediating effects of influencing factors of land use carbon emissions in Chang-Zhu-Tan urban agglomeration. Technol. Forecast. Soc. Change 2023, 188, 122268. [Google Scholar] [CrossRef]
  13. Liu, J.; Peng, K.; Zuo, C.; Li, Q. Spatiotemporal variation of land-use carbon emissions and its implications for low carbon and ecological civilization strategies: Evidence from Xiamen-Zhangzhou-Quanzhou metropolitan circle, China. Sustain. Cities Soc. 2022, 86, 104083. [Google Scholar] [CrossRef]
  14. Zeng, X.Y.; Fan, D.L.; Zheng, Y.F.; Li, S.J. Exploring the Differentiated Impact of Urban Spatial Form on Carbon Emissions: Evidence from Chinese Cities. Land 2024, 13, 874. [Google Scholar] [CrossRef]
  15. Han, X.; Fu, M.; Huang, X. Spatiotemporal Heterogeneity of Land-Use Landscape Pattern Effects on CO2 Emissions at the City-Level Scale in China. Land 2025, 14, 1715. [Google Scholar] [CrossRef]
  16. Xia, L.; Zhang, Y.; Sun, X.; Li, J. Analyzing the spatial pattern of carbon metabolism and its response to change of urban form. Ecol. Model. 2017, 355, 105–115. [Google Scholar] [CrossRef]
  17. Wang, C.; Liu, Z.; Du, H.; Zhan, W. Regulation of urban morphology on thermal environment across global cities. Sustain. Cities Soc. 2023, 97, 104749. [Google Scholar] [CrossRef]
  18. Li, L.; Sun, S.J.; Zhong, L.Y.; Han, J.; Qian, X.P. Novel spatiotemporal nonlinear regression approach for unveiling the impact of urban spatial morphology on carbon emissions. Sustain. Cities Soc. 2025, 125, 106381. [Google Scholar] [CrossRef]
  19. Fath, B.D.; Strelkovskii, N.; Wang, S.; Chen, B. Assessing urban carbon metabolism using network analysis across Chinese and European cities. Clean. Prod. Lett. 2023, 4, 100042. [Google Scholar] [CrossRef]
  20. Shan, Y.; Guan, D.; Liu, J.; Mi, Z.; Liu, Z.; Liu, J.; Schroeder, H.; Cai, B.; Chen, Y.; Shao, S.; et al. Methodology and applications of city level CO2 emission accounts in China. J. Clean. Prod. 2017, 161, 1215–1225. [Google Scholar] [CrossRef]
  21. Li, Y.; Guo, W.; Li, P.; Zhao, X.; Liu, J. Exploring the spatiotemporal dynamics of CO2 emissions through a combination of nighttime light and MODIS NDVI data. Sustainability 2023, 15, 13143. [Google Scholar] [CrossRef]
  22. Xu, F.; Wang, X.; Li, L. NPP and vegetation carbon sink capacity estimation of urban green space using the optimized CASA model: A case study of five Chinese cities. Atmosphere 2023, 14, 1161. [Google Scholar] [CrossRef]
  23. Batty, M.; Longley, P.A. Urban shapes as fractals. Area 1987, 19, 215–221. [Google Scholar]
  24. Deng, X.; Cao, Q.; Wang, L.; Wang, W.; Wang, S.; Wang, S.; Wang, L. Characterizing urban densification and quantifying its effects on urban thermal environments and human thermal comfort. Landsc. Urban Plan. 2023, 237, 104803. [Google Scholar] [CrossRef]
  25. Li, L.; Deng, Z.; Huang, X. Nonlinear relationship between urban form and transport CO2 emissions: Evidence from Chinese cities based on machine learning. J. Geogr. Sci. 2024, 34, 1558–1588. [Google Scholar] [CrossRef]
  26. Elzeni, M.; Elmokadem, A.; Badawy, N. Classification of Urban Morphology Indicators towards Urban Generation. Port Said Eng. Res. J. 2021, 26, 43–56. [Google Scholar] [CrossRef]
  27. Tang, Z.; Wang, Y.; Fu, M.; Xue, J. The role of land use landscape patterns in the carbon emission reduction: Empirical evidence from China. Ecol. Indic. 2023, 156, 111176. [Google Scholar] [CrossRef]
  28. Lv, K.; Sun, F.; Wang, L. Spatial compactness and carbon emission: Nighttime light satellite-based exposure assessment. Reg. Sci. Policy Pract. 2023, 15, 2089–2106. [Google Scholar] [CrossRef]
  29. Guo, R.; Leng, H.; Yuan, Q.; Song, S. Impact of Urban Form on CO2 Emissions under Different Socioeconomic Factors: Evidence from 132 Small and Medium-Sized Cities in China. Land 2022, 11, 713. [Google Scholar] [CrossRef]
  30. Wang, T.; Wei, S. Characteristics and influencing factors of land use transition in Haikou City during 2009–2018. Bull. Soil Water Conserv. 2022, 42, 344–352. [Google Scholar]
  31. Yang, J.; Huang, X. 30 m annual land cover and its dynamics in China from 1990 to 2019. Earth Syst. Sci. Data 2021, 13, 3907–3925. [Google Scholar] [CrossRef]
  32. IPCC. 2019 Refinement to the 2006 IPCC Guidelines for National Greenhouse Gas Inventories; Buendia, E., Tanabe, K., Kranjc, A., Baasansuren, J., Fukuda, M., Ngarize, S., Osako, A., Pyrozhenko, Y., Shermanau, P., Federici, S., Eds.; IPCC: Geneva, Switzerland, 2019. [Google Scholar]
  33. Zheng, Y.; Cheng, L.L.; Wang, Y.F.; Wang, J.Q. Exploring the impact of explicit and implicit urban form on carbon emissions: Evidence from Beijing, China. Ecol. Indic. 2023, 154, 110558. [Google Scholar] [CrossRef]
  34. International Energy Agency (IEA). An Energy Sector Roadmap to Carbon Neutrality in China; CC BY-NC 3.0 IGO.2021; International Energy Agency: Paris, France, 2021. [Google Scholar]
  35. Ministry of Ecology and Environment of the People’s Republic of China. Guidelines for Provincial Greenhouse Gas Inventories; Revised Edition; Ministry of Ecology and Environment of the People’s Republic of China: Beijing, China, 2025. (In Chinese) [Google Scholar]
  36. West, T.O.; Marland, G. A synthesis of carbon sequestration, carbon emissions, and net carbon flux in agriculture: Comparing tillage practices in the United States. Agric. Ecosyst. Environ. 2002, 91, 217–232. [Google Scholar] [CrossRef]
  37. Zhang, Q.; Tao, X.; Yang, P. Research on carbon emissions from metropolis urban passenger transport and countermeasures. China Popul. Resour. Environ. 2012, 22, 35–42. [Google Scholar]
  38. Xie, T.; Wang, J. Comparative Study on Carbon Emissions in the Transportation Industry. China Transp. Rev. 2011, 8, 20–24. [Google Scholar]
  39. Shi, Z.; Wang, Y.; Zhao, Q.; Zhang, L.; Zhu, C. The Spatiotemporal Changes of NPP and Its Driving Mechanisms in China from 2001 to 2020. Ecol. Environ. 2022, 31, 2111. [Google Scholar]
  40. Piao, S.; Fang, J.; Zhou, L.; Zhu, B.; Tan, K.; Tao, S. Changes in vegetation net primary productivity from 1982 to 1999 in China. Glob. Biogeochem. Cycles 2005, 19, GB2027. [Google Scholar] [CrossRef]
  41. Duan, X.; Wang, X.; Lu, F.; Ouyang, Z. Carbon sequestration and its potential by wetland ecosystems in China. Acta Ecol. Sin. 2008, 28, 463–469. [Google Scholar]
  42. Fang, J.; Yu, G.; Liu, L.; Hu, S.; Chapin, F.S., III. Climate change, human impacts, and carbon sequestration in China. Proc. Natl. Acad. Sci. USA 2018, 115, 4015–4020. [Google Scholar] [CrossRef]
  43. He, Y.; Jiang, Y.; Dan, L.; Ji, J.; Zhang, Y. Climate and Terrestrial Ecosystem Carbon Cycle Study of China; China Meteorological Press: Beijing, China, 2006. (In Chinese) [Google Scholar]
  44. Wei, J.; Mei, Z.; Ma, J.; Wang, X. Spatiotemporal Evolution and Influencing Factors of Land-Use Carbon Emissions in Guangzhou. Res. Soil Water Conserv 2024, 31, 298–307. [Google Scholar]
  45. Shou, T.; Yao, S.D.; Hong, Q.Y.; Mao, J.W.; Yuan, Y.Y. Impacts of Blue-Green Space Patterns on Carbon Sequestration Benefits in High-Density Cities of the Middle and Lower Yangtze River Basin: A Comparative Analysis Based on the XGBoost-SHAP Model. Land 2025, 14, 2094. [Google Scholar] [CrossRef]
  46. Goodchild, M.F. How well do we really know the world? Uncertainty in GIScience. J. Spat. Inf. Sci. 2020, 20, 97–102. [Google Scholar] [CrossRef]
  47. Yin, Z.; Zhang, X.; Chen, P.; Liao, Q. Spatial characteristics and optimization of urban living space carbon suitability index (ULS-CSI) in Tianjin, China. Front. Environ. Sci. 2024, 12, 1409624. [Google Scholar] [CrossRef]
  48. Liu, S.; Tian, X.; Xiong, Y.; Zhang, Y.; Tanikawa, H. Challenges towards carbon dioxide emissions peak under in-depth socioeconomic transition in China: Insights from Shanghai. J. Clean. Prod. 2020, 247, 119083. [Google Scholar] [CrossRef]
  49. Rahman, M.N.; Akter, K.S.; Faridatul, M.I. Assessing the impact of urban expansion on carbon emission. Environ. Sustain. Indic. 2024, 23, 100416. [Google Scholar] [CrossRef]
  50. Fu, H.; Chen, J.; Li, S. Spatial-temporal Analysis and Muti-scenario Simulation of Ecosystem Service Value in Haikou Based on PLUS Model. Guangdong Landsc. Archit. 2024, 46, 65–72. [Google Scholar]
  51. Wang, F.; She, R.; Zhang, L.; Zhou, P. Spatial Assessment of Ecosystem Services in Haikou City Based on InVEST Model. Chin. J. Trop. Agric. 2023, 43, 100–106. [Google Scholar]
  52. Zhang, H.; Liang, C.; Pan, Y. Spatial expansion of built-up areas in the beijing–tianjin–hebei urban agglomeration based on nighttime light data: 1992–2020. Int. J. Environ. Res. Public Health 2022, 19, 3760. [Google Scholar] [CrossRef]
  53. Xing, Z.; Wen, W.; Bao, Z.; Chen, X. Research on Urban Spatial Development Pattern Based on Luminous Remote Sensing:Take Haikou City as an Example. Geomat. Spat. Inf. Technol. 2021, 44, 46–49+54. [Google Scholar]
  54. Zhang, B.; Yin, J. Exploring the impact of spatial structure on carbon emissions in Chinese urban agglomerations: Insights into polycentric and compact development patterns. Urban Clim. 2025, 62, 102557. [Google Scholar] [CrossRef]
  55. Zhong, C.; Chen, J.; Yi, B.; Li, H. Examining the reliable trend of global urban land use efficiency from 1985 to 2020 using robust indicators and analysis tools. Habitat Int. 2025, 163, 103477. [Google Scholar] [CrossRef]
Figure 1. Land Use of Haikou from 2000 to 2020. This figure was created based on the standard map of Haikou City obtained from the National Platform for Common Geospatial Information Services. The boundary shown in the figure encloses the land area of each district in the city.
Land 14 02265 g001
Figure 2. Research Structure.
Land 14 02265 g002
Figure 3. Spatial patterns of carbon emission’s grade. This figure was created based on the standard map of Haikou City obtained from the National Platform for Common Geospatial Information Services.
Land 14 02265 g003
Figure 4. Sankey plot of carbon emission patch transfer.
Land 14 02265 g004
Figure 5. Spatial patterns of carbon sink grade. This figure was created based on the standard map of Haikou City obtained from the National Platform for Common Geospatial Information Services.
Land 14 02265 g005
Figure 6. Sankey plot of carbon sink patch transfer.
Land 14 02265 g006
Figure 7. Spatial Evolution of Urban Form. This figure was created based on the standard map of Haikou City obtained from the National Platform for Common Geospatial Information Services.
Land 14 02265 g007
Figure 8. Changes in Urban Form Characteristics.
Land 14 02265 g008
Figure 9. The spatial aggregation and heterogeneous pattern of carbon emission. HH: High–High clusters; HL: High–Low outliers; LH: Low–High outliers; LL: Low–Low clusters. This figure was created based on the standard map of Haikou City obtained from the National Platform for Common Geospatial Information Services.
Land 14 02265 g009
Figure 10. Spatial aggregation and heterogeneous pattern of carbon sink. HH: High–High clusters; HL: High–Low outliers; LH: Low–High outliers; LL: Low–Low clusters. This figure was created based on the standard map of Haikou City obtained from the National Platform for Common Geospatial Information Services.
Land 14 02265 g010
Figure 11. Changes in the landscape index of carbon emission pattern.
Land 14 02265 g011
Figure 12. Changes in the landscape index of carbon sink pattern.
Land 14 02265 g012
Figure 13. (a) Urban development boundaries and spatial autocorrelation patterns of carbon emissions; (b) Urban development boundary and carbon sink distribution map. HH: High–High clusters; HL: High–Low outliers; LH: Low–High outliers; LL: Low–Low clusters. This figure was created based on the standard map of Haikou City obtained from the National Platform for Common Geospatial Information Services.
Land 14 02265 g013
Figure 14. (a) Ecological conservation redlines and spatial autocorrelation patterns of carbon sink; (b) Ecological conservation redlines and carbon sink distribution map. HH: High–High clusters; HL: High–Low outliers; LH: Low–High outliers; LL: Low–Low clusters. This figure was created based on the standard map of Haikou City obtained from the National Platform for Common Geospatial Information Services.
Land 14 02265 g014
Table 1. Carbon emission coefficient and its sources.
ActivitiesCarbon Emission CoefficientUnitsSource
Energy f i = A i B i E i × 44 / 12
f i is the carbon emission factor of the i-th energy source, and Ai, Bi, Ei represent its average low calorific value, carbon content per unit calorific value, and carbon oxidation rate, respectively.
Kg/TJ[32,35]
Irrigation266.48kg/ha[36]
Agricultural machinery0.18kg/kW
Fertilization0.858kg/kg
Private car0.223kg/km[37]
Road transportation0.056kg/t·km[38]
Railway transportation0.017kg/t·km[38]
Table 2. Carbon sink coefficient and its sources.
CategoryCarbon Sink CoefficientUnitsSource
Forest87t/km2·yr[42]
Water56.7t/km2·yr[41]
Grassland13.8t/km2·yr[40]
Cultivated land0.7t/km2·yr[43]
Table 3. Formula of the landscape indices.
IndicesFormula
CA, class area C A = i = 1 n a i
PD, patch density P D = N P A
AI, aggregation index A I = 100 × g i i m a x g i i
LP, largest patch index L P I = m a x a j A R E A
COHESHION, Patch Cohesion Index C O H E S I O N = 1 j = 1 n P i j j = 1 n P i j a i j 1 1 A 1 × 100
PLADJ, Percentage of Like Adjacencies P L A D J = g i i k = 1 m z = 1 m g k z × 100
PAFRAC, fractal dimension index P A F R A C = 2 · i = 1 n j = 1 n i ( ln P ij · ln A i j ) i = 1 n j = 1 n i ln P i j · i = 1 n j = 1 n i ln A i j i = 1 n j = 1 n i ( ln A i j ) 2 ( i = 1 n j = 1 n i ln A i j ) 2 N i = 1 n j = 1 n i ( ln A i j ) 2 ( i = 1 n j = 1 n i ln A i j ) 2 N
Table 4. Carbon emissions of land use types.
Carbon Emission20002005201020152020
Industrial land352,747.46 t497,374.44 t733,542.97 t853,539.94 t545,004.12 t
Residential land186,106.30 t243,713.65 t570,625.16 t1,172,909.89 t1,424,156.77 t
Transportation land117,370.06 t145,918.47 t881,137.49 t1,916,912.63 t3,113,727.81 t
Other construction land248,143.23 t495,788.88 t785,790.96 t1,167,276.67 t1,572,315.82 t
Cultivated land129,641.54 t51,313.43 t88,861.74 t96,008.60 t98,888.10 t
Table 5. Carbon sinking of land use types.
Carbon Emission20002005201020152020
Forest106,622.24 t83,797.12 t109,738.30 t86,094.09 t76,282.50 t
Water6730.89 t6950.04 t7264.15 t11,447.54 t7715.81 t
Grassland96.13 t159.37 t314.88 t414.60 t462.75 t
Cultivated land544.51 t704.06 t460.99 t496.79 t608.33 t
Table 6. Response of Carbon Metabolism Patterns to Urban Morphological Changes.
Indices2005201020152020
Carbon emission core areaPAFRAC
HH areaLPI
AI
HL areaCA
AI
Carbon sink core areaPAFRAC
HH areaCA
PD
AI
LH areaCA
COHESHION
AI
Disclaimer/Publisher’s Note: The statements, opinions and data contained in all publications are solely those of the individual author(s) and contributor(s) and not of MDPI and/or the editor(s). MDPI and/or the editor(s) disclaim responsibility for any injury to people or property resulting from any ideas, methods, instructions or products referred to in the content.