Article

Assessing the Cost-Effectiveness of Ecological Restoration Programs Across China’s Desert and Desertification-Prone Regions by Integrating Vegetation Dynamics and Investment Data

1
Institute of Geographic Sciences and Natural Resources Research, Chinese Academy of Sciences, Beijing 100101, China
2
College of Resources and Environment, University of Chinese Academy of Sciences, Beijing 100049, China
*
Author to whom correspondence should be addressed.
Land 2025, 14(11), 2220; https://doi.org/10.3390/land14112220
Submission received: 22 September 2025 / Revised: 30 October 2025 / Accepted: 6 November 2025 / Published: 10 November 2025

Abstract

The fragile ecosystem of desert and desertification-prone regions (D & DPRs) in China is highly sensitive to climate change, landuse intensification, and human interventions such as deforestation and overgrazing. In response, large-scale ecological restoration programs have been implemented over the past decades, yet their effect and cost-effectiveness remain insufficiently understood. Here, by applying multi-source remote sensing data, employing the Geodetector model, and developing a Return on Investment (RI) index, we established a framework to quantify the ecological restoration effect and assess the cost-effectiveness of the ecological restoration programs launched in China’s D & DPRs. The results indicated that a marked shift in ecosystem dynamics occurred in 1999. A comparison of the pre-restoration (1982–1998) and post-restoration (1999–2020) periods revealed that the restoration and degradation occur simultaneously, with the proportions increasing by 15.5% and 21%, respectively. Spatially, the identified ecological restoration effect was concentrated in the northern Loess Plateau, the northeastern Inner Mongolia Plateau, and the Hexi Corridor, which were strongly linked to population, land management strategies and infrastructural accessibility. However, the cost-effectiveness analysis revealed that higher levels of ecological investment did not necessarily lead to greater ecological restoration effect. Instead, restoration efficiency varied substantially across different ecological and socio-economic contexts. These findings suggest that ecological restoration in China’s D & DPRs is not a uniform process but is contingent on social-ecological characteristics and investment strategies. Our results emphasize the need for adaptive, region-specific approaches to optimize restoration efforts and ensure the sustainable management of China’s D & DPRs.

1. Introduction

The ecosystem of China’s desert and desertification-prone regions (D & DPRs) provides numerous essential ecosystem services for humans, including water conservation, carbon storage, and biodiversity maintenance [1,2]. As long-standing traditional pastoral and agricultural regions of China, the unreasonable land use in China’s D & DPRs has triggered numerous ecological issues, such as forest deterioration, land degradation, and intensified desertification [3,4,5]. To combat desertification by increasing vegetation coverage and to reconcile the conflicts between socioeconomic development and environmental protection, the Chinese government has launched multiple ecological restoration programs since the 1970s, particularly the “Great Green Wall Program”, the “Natural Forest Protection Program”, the “Grain for Green Program”, the “Beijing-Tianjin Sandstorm Source Control Program”, and the “Grassland Ecological Protection and Construction Program”. These programs have cumulatively covered an area exceeding 15.55 million square kilometers, with total investments surpassing 1.57 trillion yuan (based on comparable prices in 2022). They have implemented vegetation restoration through measures such as afforestation, mountain closure, returning croplands to forests or grasslands, grazing prohibition, fencing, and ecological subsidies [6]. Therefore, a comprehensive cost-effectiveness assessment is critical to optimizing the allocation of resources in ecological restoration programs.
Previous ecological restoration assessments have mainly focused on a specific program. For example, Li et al. [7] evaluated the impact of the Grain for Green Program on vegetation based on the normalized difference vegetation index (NDVI) dataset, while Liu et al. [8] focused on the benefits of the Grain for Green Program in the restoration of soil organic carbon; Hu et al. [9] assessed the ecological benefits of the Great Green Wall Program through the leaf area index (LAI) dataset; Yuan et al. [10] quantified the ecological risk of the Beijing-Tianjin Sandstorm Source Control Program area; Cao et al. [11] evaluated the Natural Forest Protection Program’ impact on forestry family livelihood from the perspective of social welfare. However, the overlapping geographical extents of multiple programs may lead to inaccurate quantification of their ecological restoration effect. Moreover, existing assessments have primarily concentrated in specific geomorphic regions, such as the Tibetan Plateau [2,12,13], the Loess Plateaus [14,15,16], and the karst regions [17,18], with limited assessment of ecological restoration in large-scale arid vulnerable zones.
The key aims of ecological restoration programs are to enhance vegetation coverage through afforestation and other measures, making vegetation dynamics a reliable indicator of restoration effect. However, since vegetation dynamics are simultaneously driven by climate change and human management [19,20,21], separating climate and human contributions to vegetation is a precondition for quantifying the ecological restoration effect. Residual trend analysis based on multiple regression models is a widely adopted approach for separating contributions [22,23,24]. Nevertheless, conventional residual methods employing the entire time series to establish vegetation-climate regression models become inappropriate in the context of intensive ecological program implementation [25]. To address this limitation, we introduce a turning point identified through turning-point detection algorithms in conjunction with the program timeline. The model is then established during the period with minimal anthropogenic disturbance to assess the human management and the ecological restoration effects during the period with intensive anthropogenic disturbance.
Studies have shown that ecological restoration programs have achieved progress in increasing vegetation cover [26], mitigating land degradation [27], and improving ecosystem services [26,28,29] after years of effort and substantial financial investment. However, the ecological restoration effect shows marked regional variations due to divergent natural and socio-economic conditions [30,31,32], necessitating a comprehensive analysis of the contributing factors. Furthermore, with the advancement of ecological restoration programs, some unforeseen consequences have arisen, including declining groundwater levels, reduced biodiversity, increased tree mortality, and declines in the direct incomes of farmers and herders [5,33,34,35]. High levels of investment have not always led to corresponding ecological effect. The cost-effectiveness of ecological restoration programs varies by region and needs further exploration.
Therefore, this study aims to quantify the ecological restoration effect, analyze its factors, and assess the cost-effectiveness of ecological restoration programs. We assume that there is a linear relationship through the origin between ecological restoration effect and investment, but there is spatial heterogeneity in cost-effectiveness among different regions. Here “cost” refers to the investment in these programs, and “effectiveness” refers to the ecological restoration effect quantified by the positive human-driven vegetation trends. They are achieved by (1) analyzing vegetation dynamics in China’s D & DPRs from 1982 to 2020; (2) separating human-driven, climate-driven, and CO2-driven vegetation changes by the residual trend method; (3) exploring the multiple factors influencing the ecological restoration effect through the GeoDetector model; and (4) assessing the cost-effectiveness of ecological restoration by integrating investment data. The findings will help clarify the investment efficiency of ecological restoration programs, providing a reference for the investment layout of ecological restoration in China’s D & DPRs.

2. Study Area and Data

2.1. Study Area

The study area encompasses China’s desert ecosystems as well as non-desert regions that are prone to transitioning into desert ecosystems due to the combined impacts of climate change and human management practices. Specifically, they consist of regions with an aridity index (AI) below 0.5, collectively referred to as China’s D & DPRs [36] (Figure 1a). The regions span diverse geomorphic units, including the Inner Mongolia Plateau, the Loess Plateau, the Tibetan Plateau, the Qaidam Basin, the Tarim Basin, and the Junggar Basin (Figure 1b). Climatically, temperate continental and highland climates are the dominant climate types, with large spatial variations in temperature and annual precipitation below 400 mm in most areas (Figure 1d,e). Soils are predominantly alpine soil, desert soil, and xerosol, supporting desert vegetation and grassland [36]. Since the 1950s, socioeconomic reforms, population growth, and industrial development have significantly impacted the regional ecological environment, resulting in land degradation and intensified desertification [37]. To restore the ecological environment, multiple ecological restoration programs have been implemented in China’s D & DPRs (Figure 1c). These programs aim to alleviate environmental pressure and promote regional sustainability through measures such as afforestation, grassland restoration, cropland conversion, prohibiting grazing, and ecological subsidies (Figure 1f,g, Table 1).

2.2. Data

2.2.1. NDVI Data

This study utilized the Global Inventory Modeling and Mapping Studies (GIMMS) NDVI 3g+ dataset (shown in Equation (1)) characterized by a spatial resolution of 0.0833° and a temporal resolution of 8 days [48]. Growing season NDVI (GSN) dataset (shown in Equation (2)) was processed by applying the maximum value composite (MVC) method at monthly and annual scales to reduce atmospheric and aerosol effects [49]. We then adopted the Savitzky–Golay method to reconstruct the NDVI data [50]. Additionally, pixels with maximum NDVI values < 0.1 were excluded to identify vegetated areas [51].
N D V I = ( N I R R e d ) ( N I R + R e d )
G S N = 1 7 N D V I m   ( m = 4 , , 10 )
where NDVI is the Normalized Difference Vegetation Index, calculated by the surface reflectance value in the near-infrared part of the electromagnetic spectrum (NIR) and the surface reflectance value in the red part of the electromagnetic spectrum (Red). GSN is the growing season NDVI, and NDVIm represents the monthly NDVI for month m.

2.2.2. Climate Datasets

The monthly mean temperature and total precipitation datasets at a 1 km resolution were obtained from the National Tibetan Plateau Data Center (http://data.tpdc.ac.cn). The climate datasets were downscaled for China utilizing the Delta method based on datasets from CMIP6 and WorldClim. Moreover, climate data were resampled to match the NDVI dataset’s spatial resolution and coordinate system.

2.2.3. Atmospheric CO2 Concentration Dataset

The monthly mean atmospheric CO2 concentration dataset was obtained from NOAA Global Monitoring Laboratory (https://gml.noaa.gov/ccgg/trends/global.html?doi=10.15138/9n0h-zh07, accessed on 14 October 2025). The dataset provides atmospheric CO2 concentration recorded at the Mauna Loa Observatory in Hawaii, beginning in 1958.

2.2.4. Ecological Restoration Program Datasets

Program boundary data were acquired from the National Ecological Science Data Center (https://www.nesdc.org.cn/), whereas investment and implementation area data were derived from official yearbooks and government reports [44,45,46,47]. The subsidy standards for fencing, grazing prohibition, and grass-livestock balance programs were compiled from government publications [52].

2.2.5. Auxiliary Datasets

The utilized auxiliary data encompasses a range of aspects, including topography, climate, social conditions, and soil properties. Detailed data sources are listed in Table 2.

3. Methods

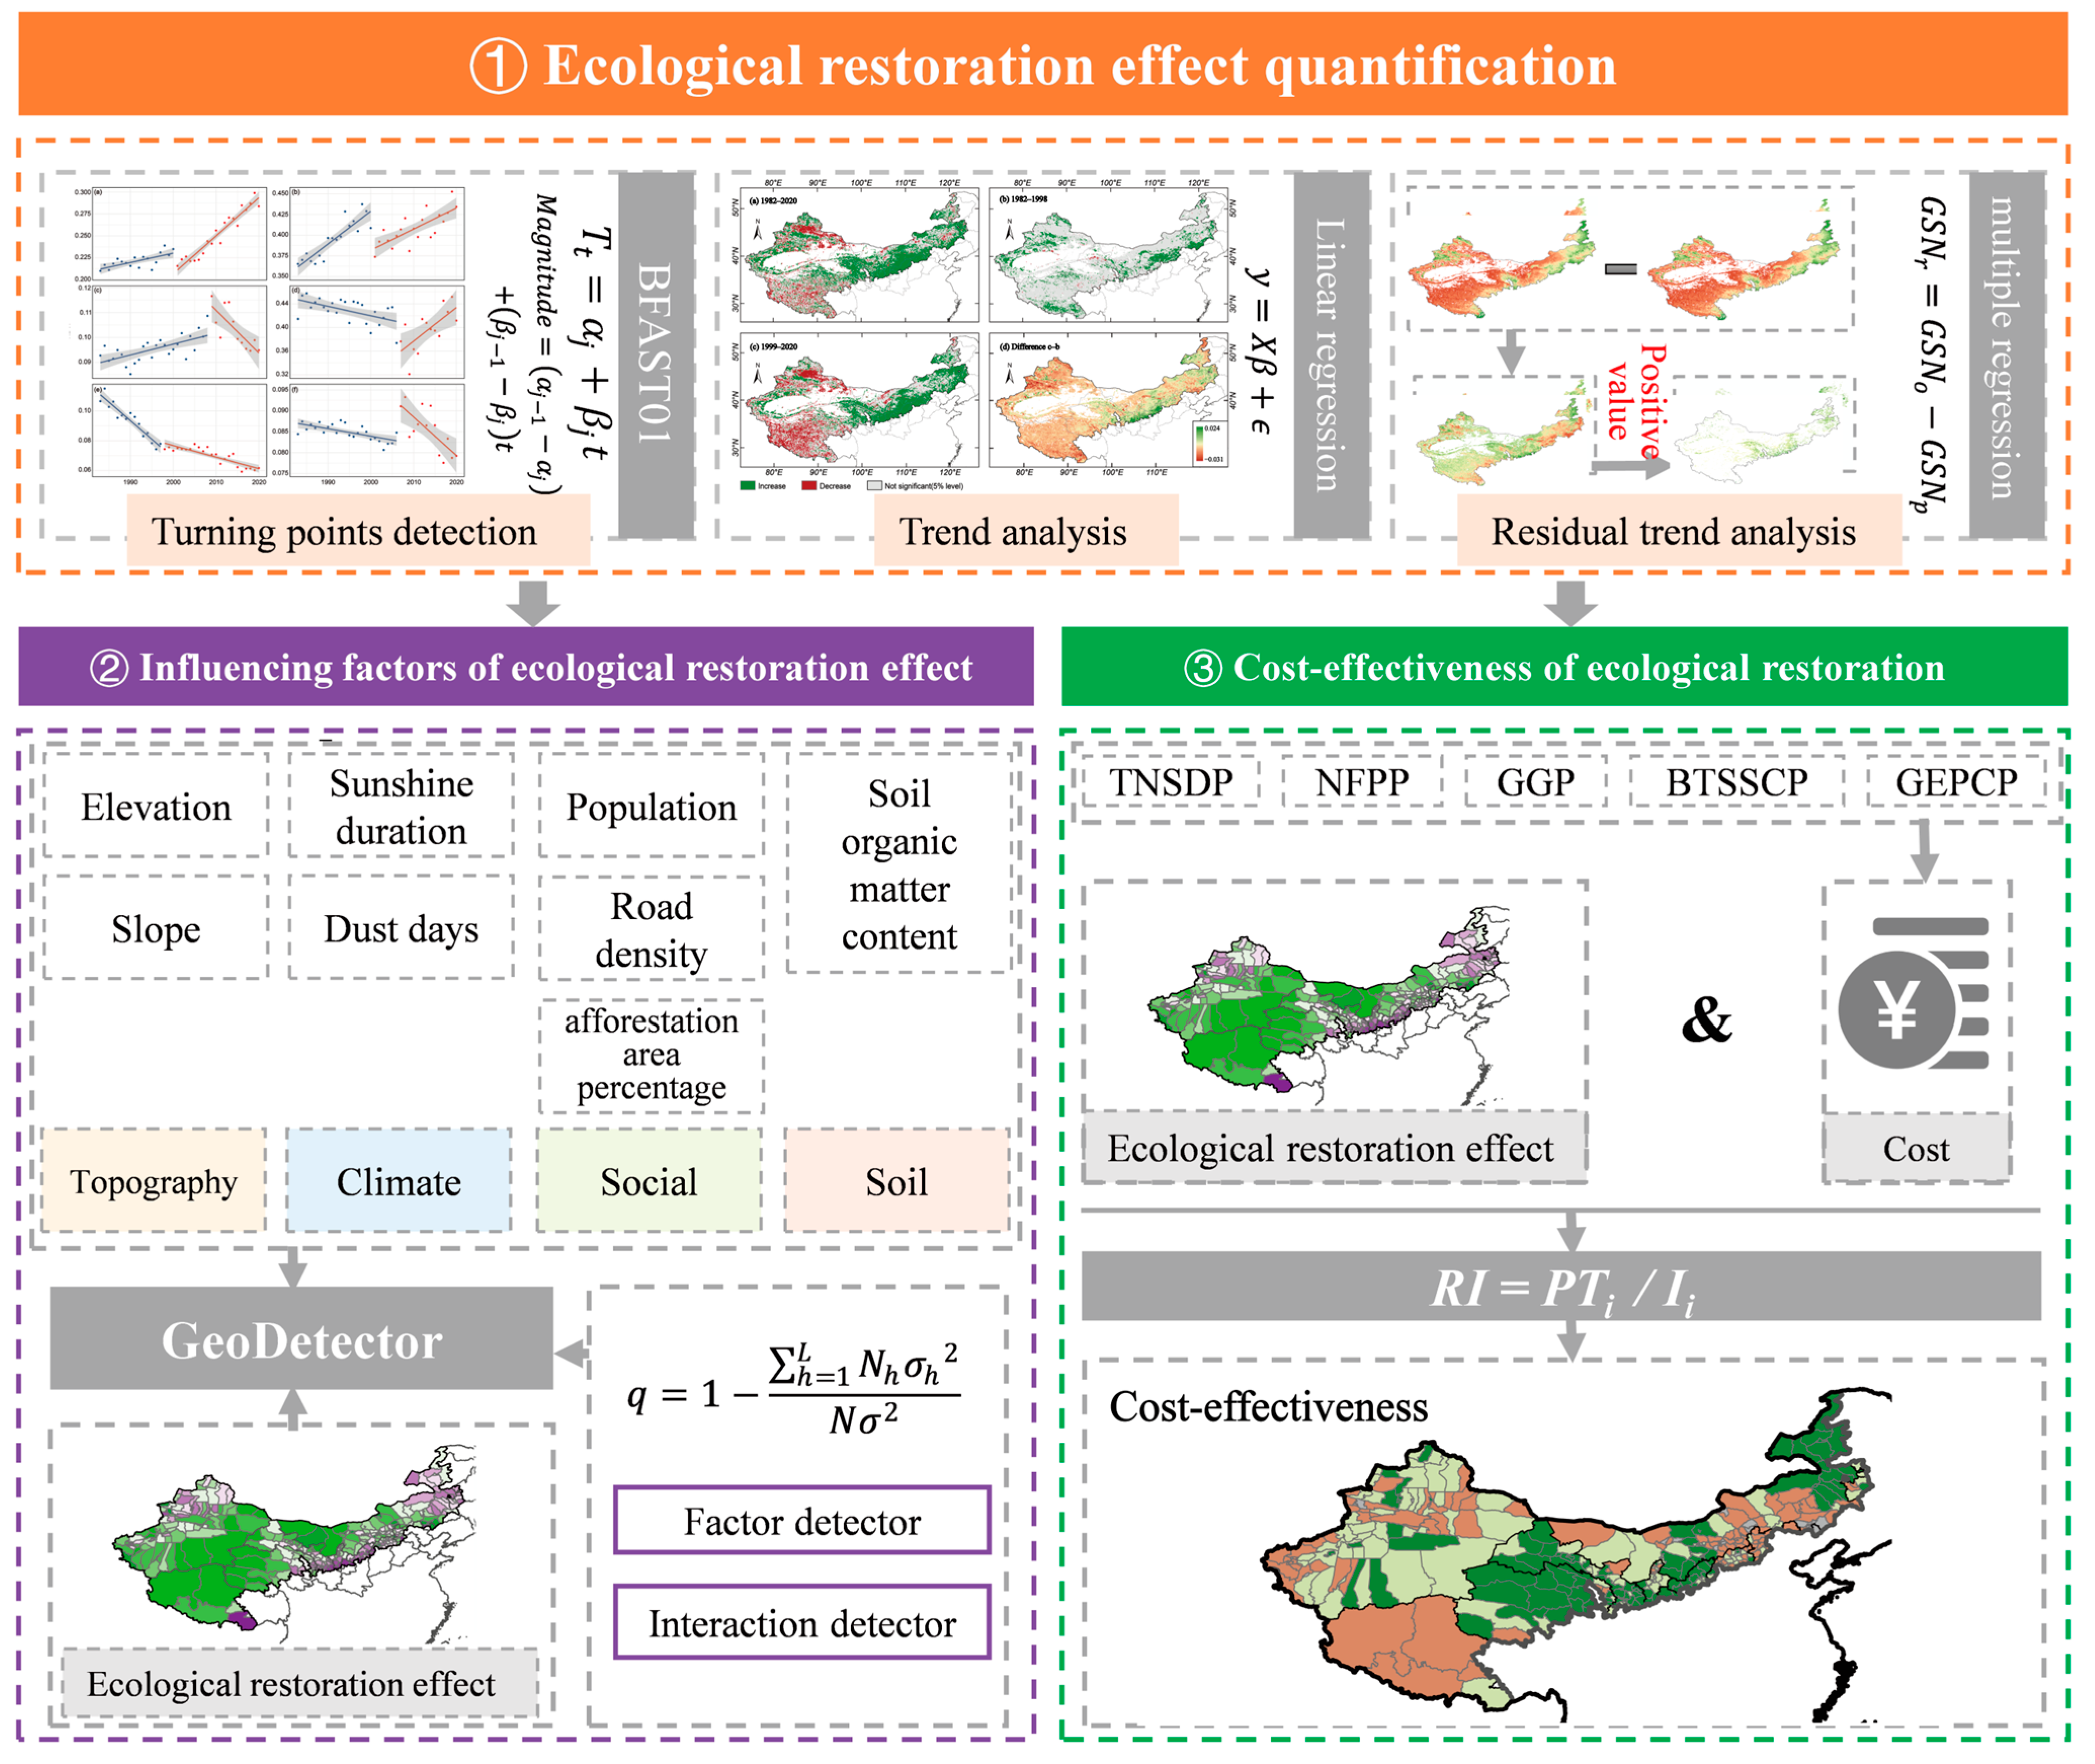
This study developed a novel three-step analytical framework: (1) quantification of the ecological restoration effect, (2) factor analysis of the ecological restoration effect, and (3) cost-effectiveness assessment of ecological restoration. The detailed framework is as follows (Figure 2).

3.1. Ecological Restoration Effect Quantification

3.1.1. Turning Points Detection

In this study, we applied the Breaks for Additive Season and Trend (BFAST) algorithm to detect turning points in the GSN trends. The BFAST algorithm characterizes trends through time points, magnitude, and direction, demonstrating robust performance in detecting transitions within GSN time series [60]. The equation is as follows [60]:
Y t = T t + S t + e t t = 1 , , n
where Yt represents the observed value at time t, Tt, St, and et represent the trend, the seasonal, and the remainder components, respectively. Among them, Tt is assumed to be piecewise linear with m breakpoints τ1, …, τm and can be estimated as below [60]:
T t = α i + β i t τ i 1 * < t τ i * ,
where i = 1, …, m. αi and βi represent the intercept and the slope, respectively. The magnitude is obtained by calculating the difference between Tt at τi−1 and τi [60]:
M a g n i t u d e = α i 1 α i + β i 1 β i t
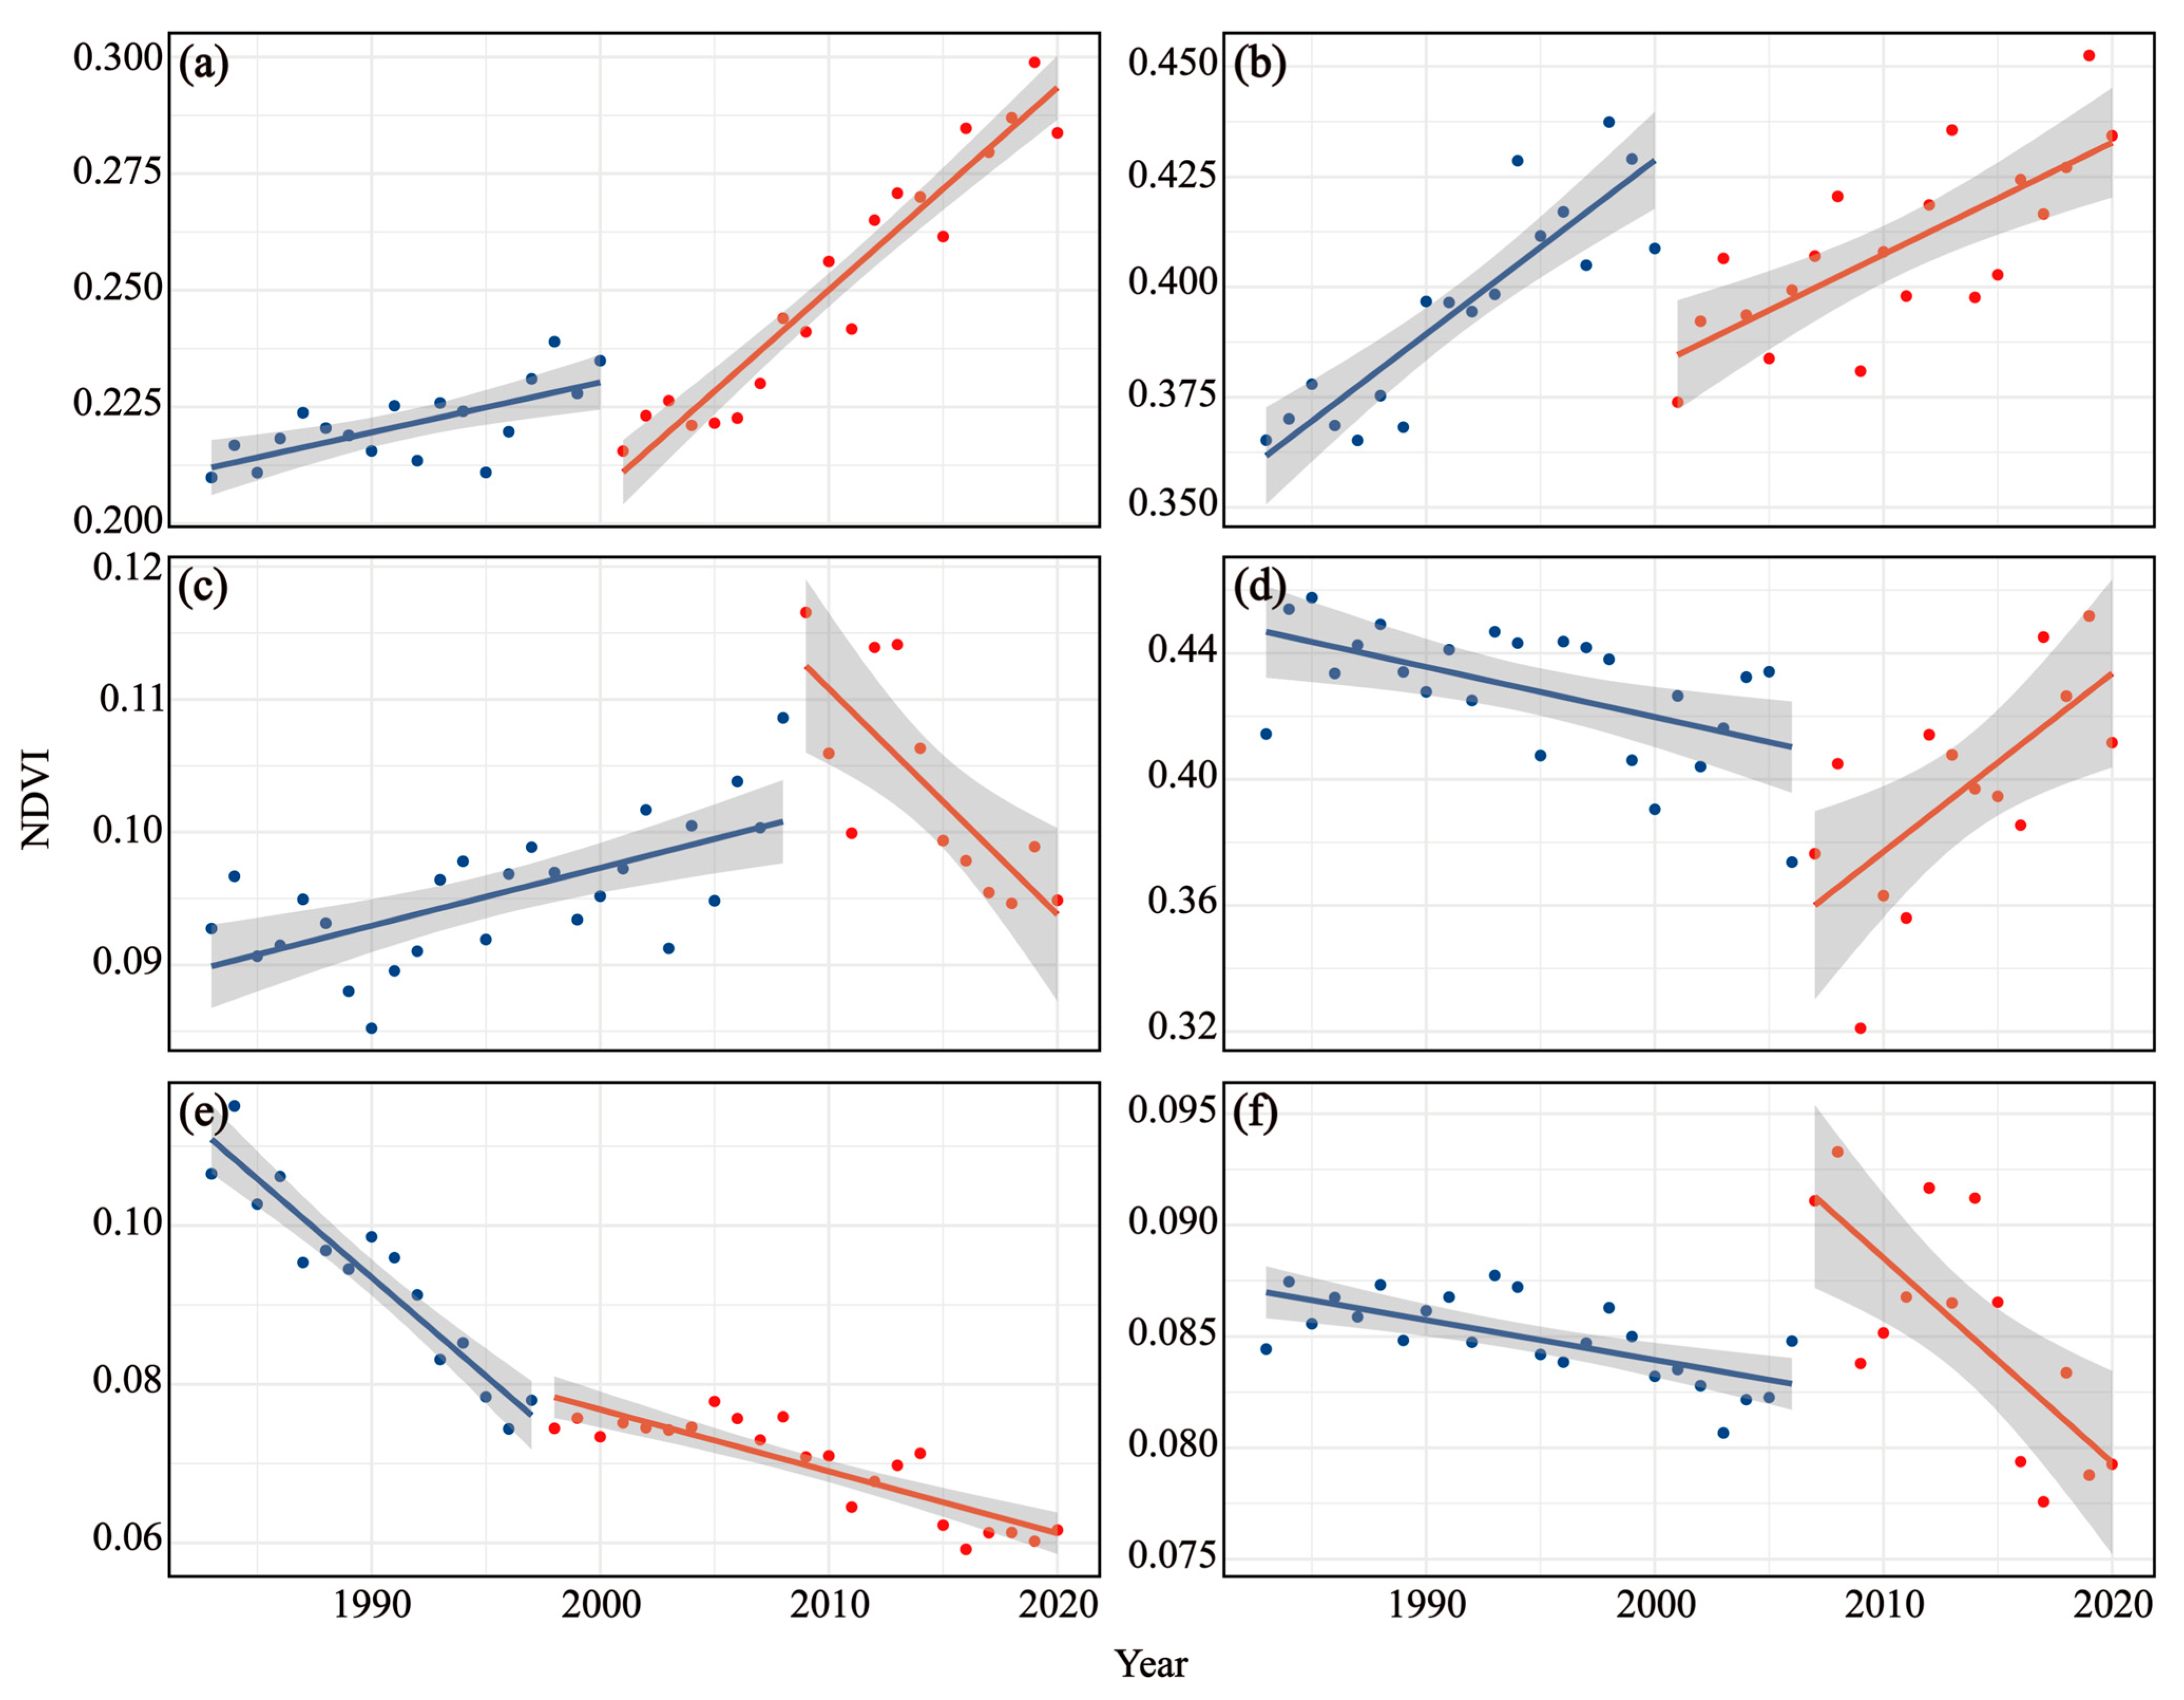
We applied the trend component of the BFAST algorithm to detect turning points in the GSN trend from 1982 to 2020 with a minimum fitting period of 5 years, testing significance at the 95% level. The turning point detection results in this study were summarized into six categories: (1) accelerated greening; (2) decelerated greening; (3) greening to degradation; (4) degradation to greening; (5) decelerated degradation; (6) accelerated degradation (Figure 3).

3.1.2. Linear Regression Analysis

The year 1999 is a pivotal year for ecological restoration programs in China’s D & DPR, as several major ecological programs were initiated around this time. For example, the “Grain for Green Program” was launched in 1999 [40]. The “Natural Forest Protection Program” and the “Beijing-Tianjin Sandstorm Source Control Program” were piloted in 1998 and 2000, respectively [39,61]. Consequently, many studies have used 1999 (or proximate years) as the baseline or turning point for assessing ecological restoration [2,41,62,63,64]. Furthermore, natural factors such as NDVI, precipitation, and soil moisture also exhibited changes around 1999 [65,66]. Combined with the BFAST breakpoint detection results, which showed that pixels with a turning point in or after 1999 accounted for 82.4% of the total turning pixels, we selected 1999 as the turning point to divide the GSN time series into two distinct periods: the reference period (1982–1998) and the restoration period (1999–2020). We employed ordinary least squares (OLS) linear regression to fit the GSN trends across different periods, given the method’s proven maturity and broad applicability [51,62,67]. The slope can be calculated as follows [68]:
S l o p e = n × i = 1 n i × G S N i i = 1 n i × i = 1 n G S N i n × i = 1 n i 2 i = 1 n i 2
where Slope represents the fitted slope coefficient, n denotes the number of years, GSNi is the GSN values of year i.

3.1.3. Residual Trend Analysis

Residual analysis is widely used in attribution studies because it enables the establishment of a global model at the pixel scale, applicable across diverse regions [24]. We utilized the residual trend method to isolate vegetation trends driven by human management from those driven by climate change (temperature and precipitation) and atmospheric CO2 concentration. This method characterized the human-driven GSN trends by determining the difference between the observed and predicted values of the GSN. We developed a multiple regression model using GSN data and climatic data at a monthly scale from 1982 to 1998, as follows [17]:
G S N ( i .   m ) = a × T e m p e r a t u r e ( i ,   m ) + b × P r e c i p i t a t i o n ( i ,   m ) + c   × C O 2 ( i , m ) + d
G S N r e s = G S N o b s G S N p r e d
where i represents the pixel’s location, m is the month of the growing season, a, b and c are the regression coefficients for temperature, precipitation and atmospheric CO2 concentration, respectively, and d is a constant. GSNobs, GSNpred, and GSNres denote the observed, the predicted, and the residual GSN values from 1999 to 2020. This procedure was performed only for pixels where the GSN was significantly (p < 0.05) correlated with climate. Urban and cropland pixels were masked to reduce the disturbance of urbanization and agricultural practices. The residual trends represent the effects of human management on vegetation conditions. Decreasing trends indicate human-driven degradation, such as improper land use or overgrazing, whereas increasing trends can be attributed to restoration efforts [12,17].

3.2. Geodetector Model

The positive human-driven GSN trends can serve as an indicator of the ecological restoration effect [12,17]. Previous studies have revealed that the ecological restoration effect is driven by multiple factors, and this study selected nine potential factors from four dimensions: topography, climate, social conditions, and soil properties [29,69,70,71,72,73] (Table 3).
The GeoDetector is a statistical tool used to detect spatial heterogeneity, reveal its underlying drivers, and quantify the interactions among these factors. It has been extensively applied in many fields of the natural and social sciences [74]. We applied the Geodetector model to detect the factors influencing the ecological restoration effect in China’s D & DPRs. The GeoDetector model presupposes that input samples are relatively independent [74]. To meet this assumption and minimize potential spatial autocorrelation of samples, we adopted a spatial random sampling strategy [74,75]. Specifically, we generated a set of random points within the DPR, imposing a minimum allowed distance of more than 16 km. This threshold was set as double the 8 km spatial resolution of our data layers. Subsequently, the values of the dependent variable and the respective independent variables were extracted at these point locations for input into the GeoDetector model. The parameter optimization within the geographic detector employs the “gdm” function from the R package “GD” of version 10.8 to identify optimal discretization methods and class numbers. The q-statistic was employed to characterize the explanatory power of different factors [74]:
q = 1 h = 1 L N h σ h 2 N σ 2
where q represents the explanatory power of the factors, h is the stratification classes (h = 1, …, L) of either ecological restoration effect or factors, N and Nh refer to the total sample size and the size of subregion h, respectively; σ2 and σh2 represent the total variance and the variance within subregion h, respectively [74].

3.3. Assessment of the Cost-Effectiveness

This study employed the “marginal effect per unit of investment” as the metric for cost-effectiveness. However, the true marginal effect is difficult to estimate due to the absence of ecological investment and program area data for each county across different time periods. Therefore, we used a Return on Investment (RI) index (the ratio of the total restoration effect to the total ecological investment for each county, see Equation (10)) as a measure of the “average effect per unit of investment” and an approximate proxy for the marginal effect. This approach implicitly assumes a linear relationship passing through the origin between investment and effect within each county, under which condition the average effect is equivalent to the marginal effect. The method of using a ratio to represent efficiency has been adopted in evaluation studies lacking detailed panel data [17,76,77].
R I = P T i I i
where PTi refers to the positive human-driven GSN trends within county i, and Ii represents the investment in ecological restoration programs in county i. To obtain county-level investment data, we downscaled the provincial investment data based on county-level program area data (In Tibet, we used city-level area data due to the lack of county-level data) for the four forestry ecological programs (the “Great Green Wall Program”, the “Natural Forest Protection Program”, the “Grain for Green Program” and the “Beijing-Tianjin Sandstorm Source Control Program”), as follows:
I i = A i A I × I I
where Ai refers to the program area of county i, AI and II refer to the program area and the investment of province I where county i is located, respectively. The county-level investment data of the “Grassland Ecological Protection and Construction Program” were calculated through the downscaling method shown in the Supplementary Text [78].

3.4. Uncertainty and Sensitivity Analysis

We categorized the cost-effectiveness of each county into low, medium, and high classes using the equal-interval method. To assess the robustness of the subsequent classification of our cost-effectiveness estimates, we developed an integrated uncertainty simulation framework that combined Monte Carlo simulation and the Bootstrap method, with 10,000 iterations. This framework aimed to simultaneously quantify uncertainties from both the ecological effect and the investment and ultimately evaluate their potential impact on the cost-effectiveness classification of each county. Specifically, we simulated the uncertainty in ecological effect by performing Bootstrap resampling on the valid pixels within each county. Concurrently, we simulated the investment uncertainty by applying a ±20% random perturbation to the investment data using a Monte Carlo approach. By integrating these two methods, we ran 10,000 simulations for each county to derive the 95% confidence interval for its cost-effectiveness. Finally, the classification’s robustness was assessed by examining whether the 95% confidence interval of a county’s cost-effectiveness crossed the classification thresholds.

4. Results

4.1. The Shift Pattern of Vegetation Trends in China’s D & DPRs

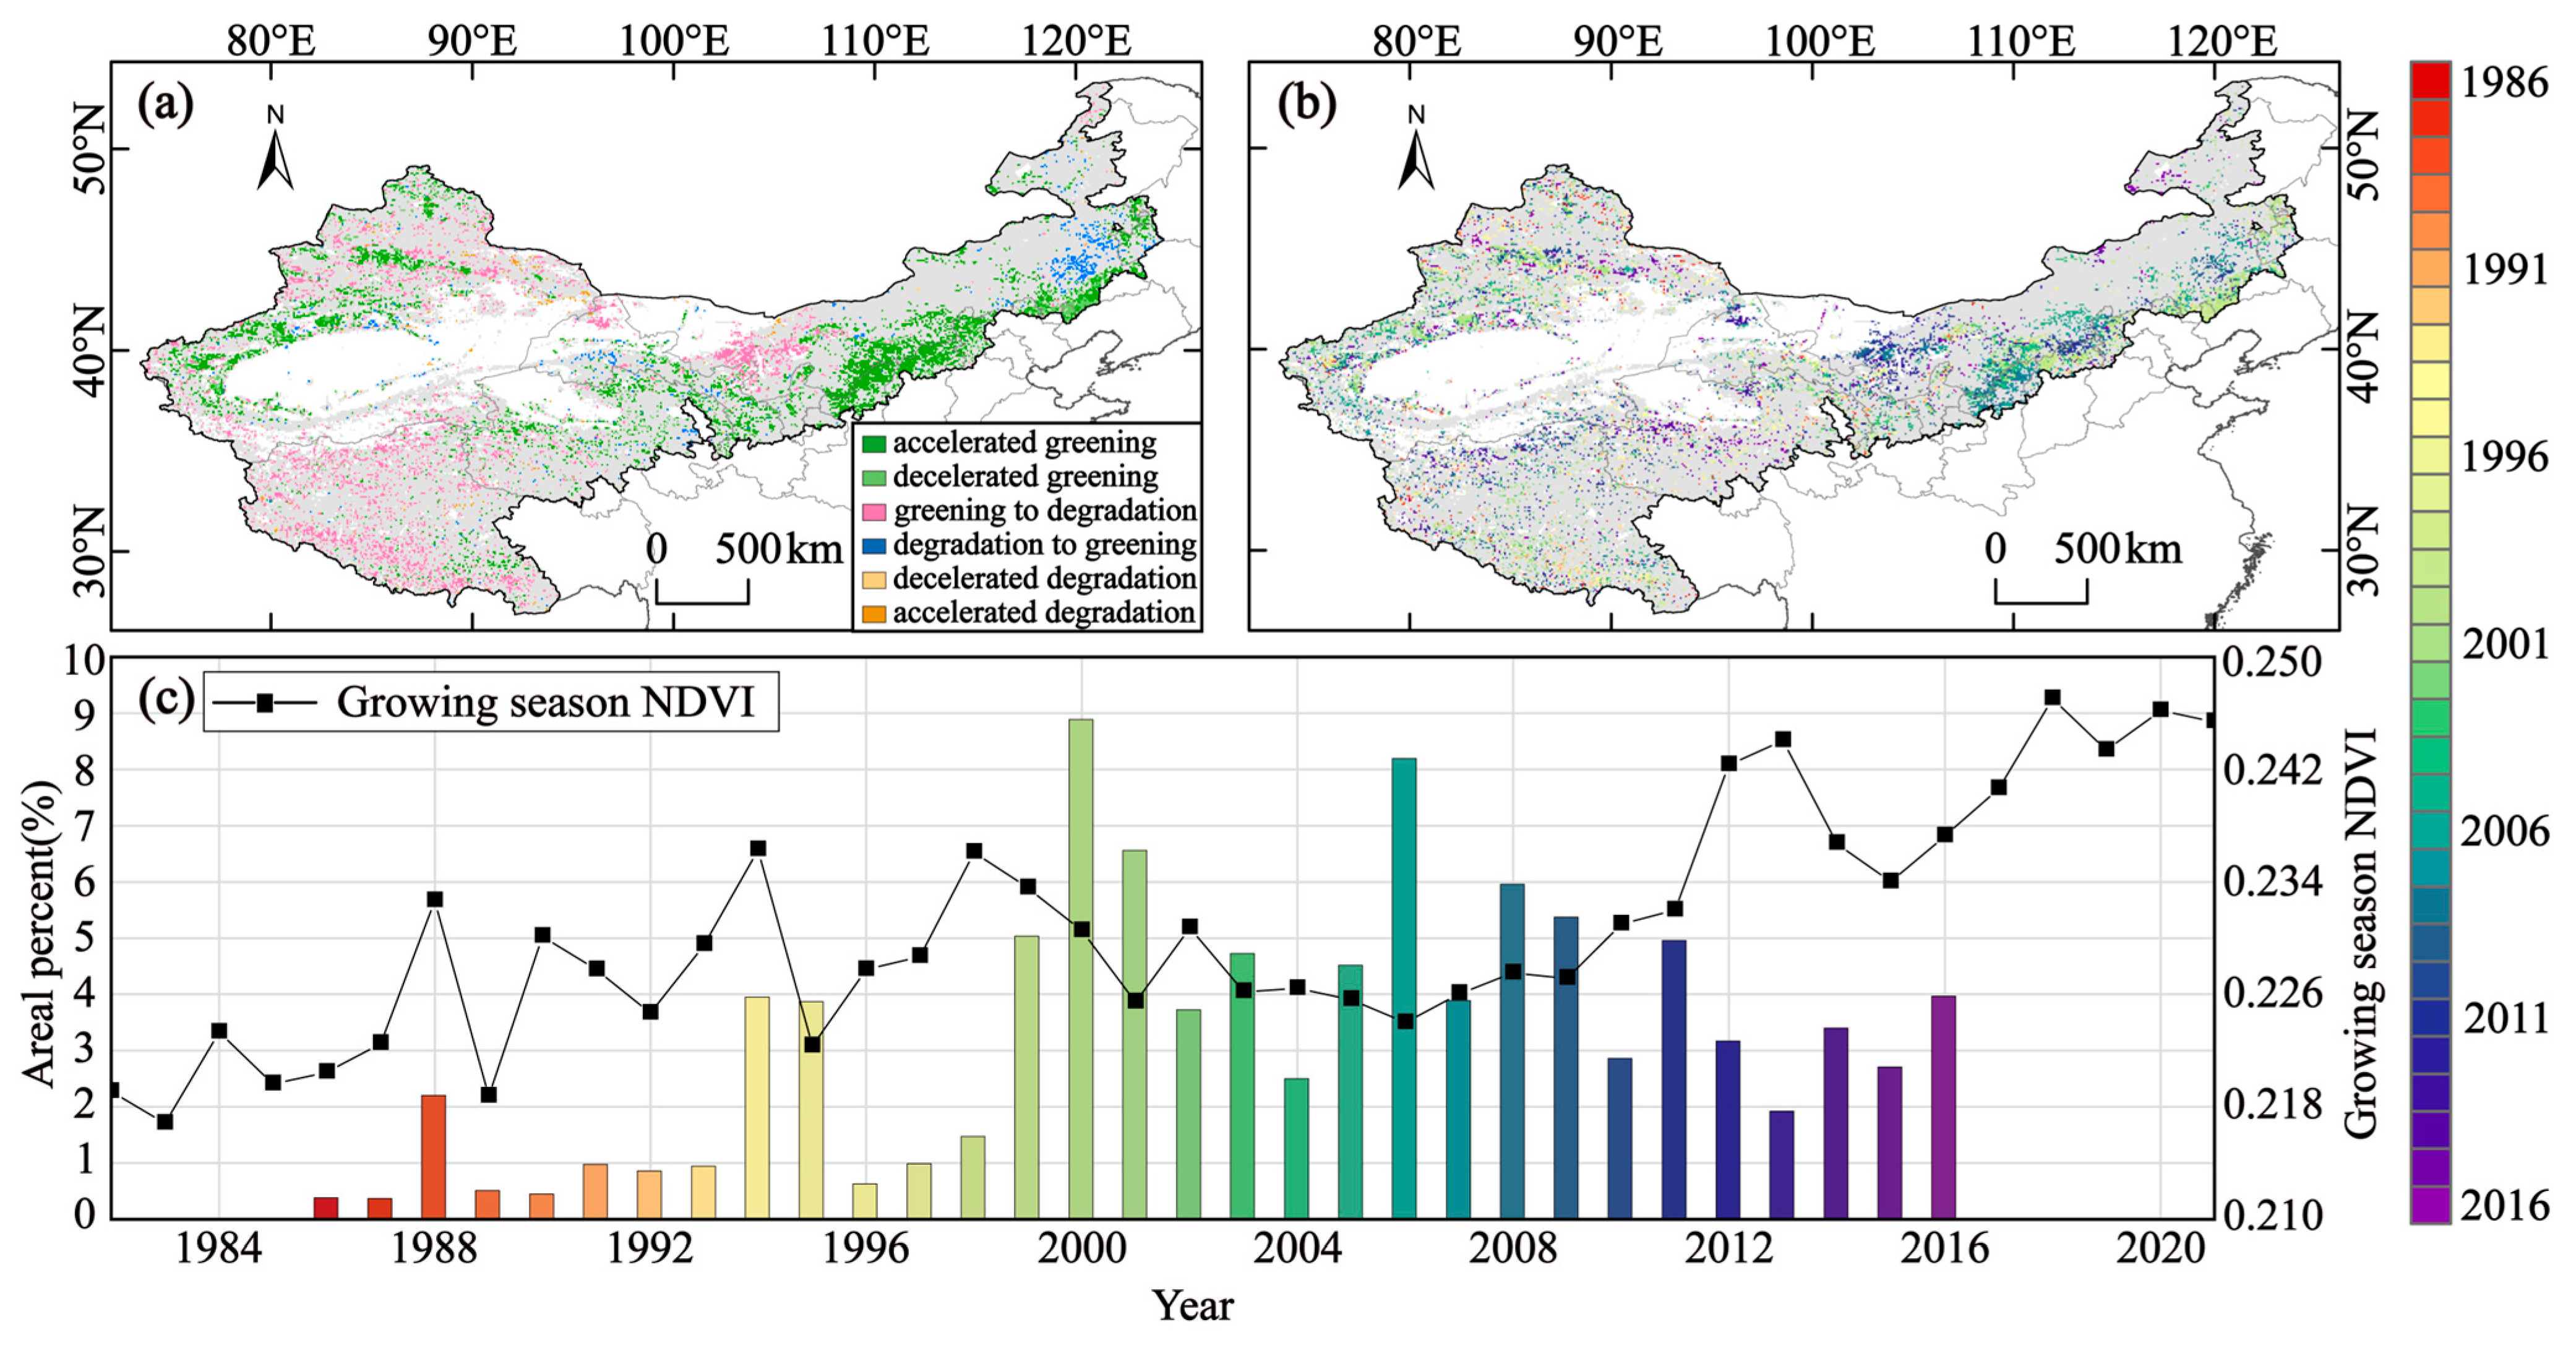
According to the results of turning point detection, 21.8% of the vegetation trends in China’s D & DPRs exhibited a marked shift (Figure 4). Among the shift types, accelerated greening dominated (43.7%), with the pixels concentrated in the northern Loess Plateau, eastern Inner Mongolia Plateau, Hexi Corridor, and Tarim River Basin (Figure 4a). In addition, 33.1% of the vegetation shifted from greening to degradation, mainly distributed in the western Inner Mongolia Plateau and the southern Tibetan Plateau (Figure 4a). The turning points of vegetation trends detected in China’s D & DPRs showed a strong temporal distribution pattern, with the proportion of vegetation trends shifting in and after 1999 (82.4%) significantly increasing compared to previous years (17.6%) (Figure 4c).
The vegetation trends in some regions exhibited specific shift patterns. Between 1999 and 2009, the vegetation trends on the northern Loess Plateau showed significant accelerated greening, primarily due to its location in the agro-pastoral zone (Figure 4a,b), where human management strongly impacted the vegetation dynamics. This greening trend was further enhanced by the implementation of multiple programs. The vegetation trends in the Alxa League, located in the western Inner Mongolia Plateau, concentratedly shifted from greening to degradation between 2006 and 2013 (Figure 4a,b). Conversely, the vegetation trends in the southern section of the Greater Khingan Mountains concentratedly shifted from degradation to greening between 2006 and 2011 (Figure 4a,b).

4.2. Changes in Vegetation Trends

From 1982 to 2020, significant vegetation trends (p < 0.05) were observed across China’s D & DPRs, with 46.2% of vegetated areas showing greening and 15.4% exhibiting degradation (Figure 5a). There was a marked difference in vegetation trends between the reference and the restoration periods (Figure 5b,c). During the reference period (1982–1998), 77.5% of the vegetation showed no significant trend, with only a small proportion undergoing significant greening (21.9%) and degradation (0.6%), respectively (Figure 5b). However, during the restoration period (1999–2020), 36.4% of the vegetation showed significant greening trends, primarily in the eastern and southern Inner Mongolia Plateau and north of the Loess Plateau. Meanwhile, 21.6% of the vegetation underwent significant degradation, particularly across the Tibetan Plateau and northern Xinjiang (Figure 5c). Furthermore, vegetation dynamics varied across different stages of the recovery period (1999–2020). The vegetation pixels in the central and eastern Inner Mongolia Plateau, which exhibited a significant degradation trend during 1999–2010, substantially decreased or transitioned to a significant greening trend during 2011–2020. Similar trends were also observed in Xinjiang. However, in localized regions (e.g., the western Inner Mongolian Plateau), the vegetation degradation trend was exacerbated from 1999–2010 to 2011–2020 (Figure 5e,f). Compared to the reference period, 43.5% of the vegetation underwent restoration during the restoration period, which was primarily located near the agro-pastoral ecotone (Figure 5d).

4.3. Ecological Restoration Effect

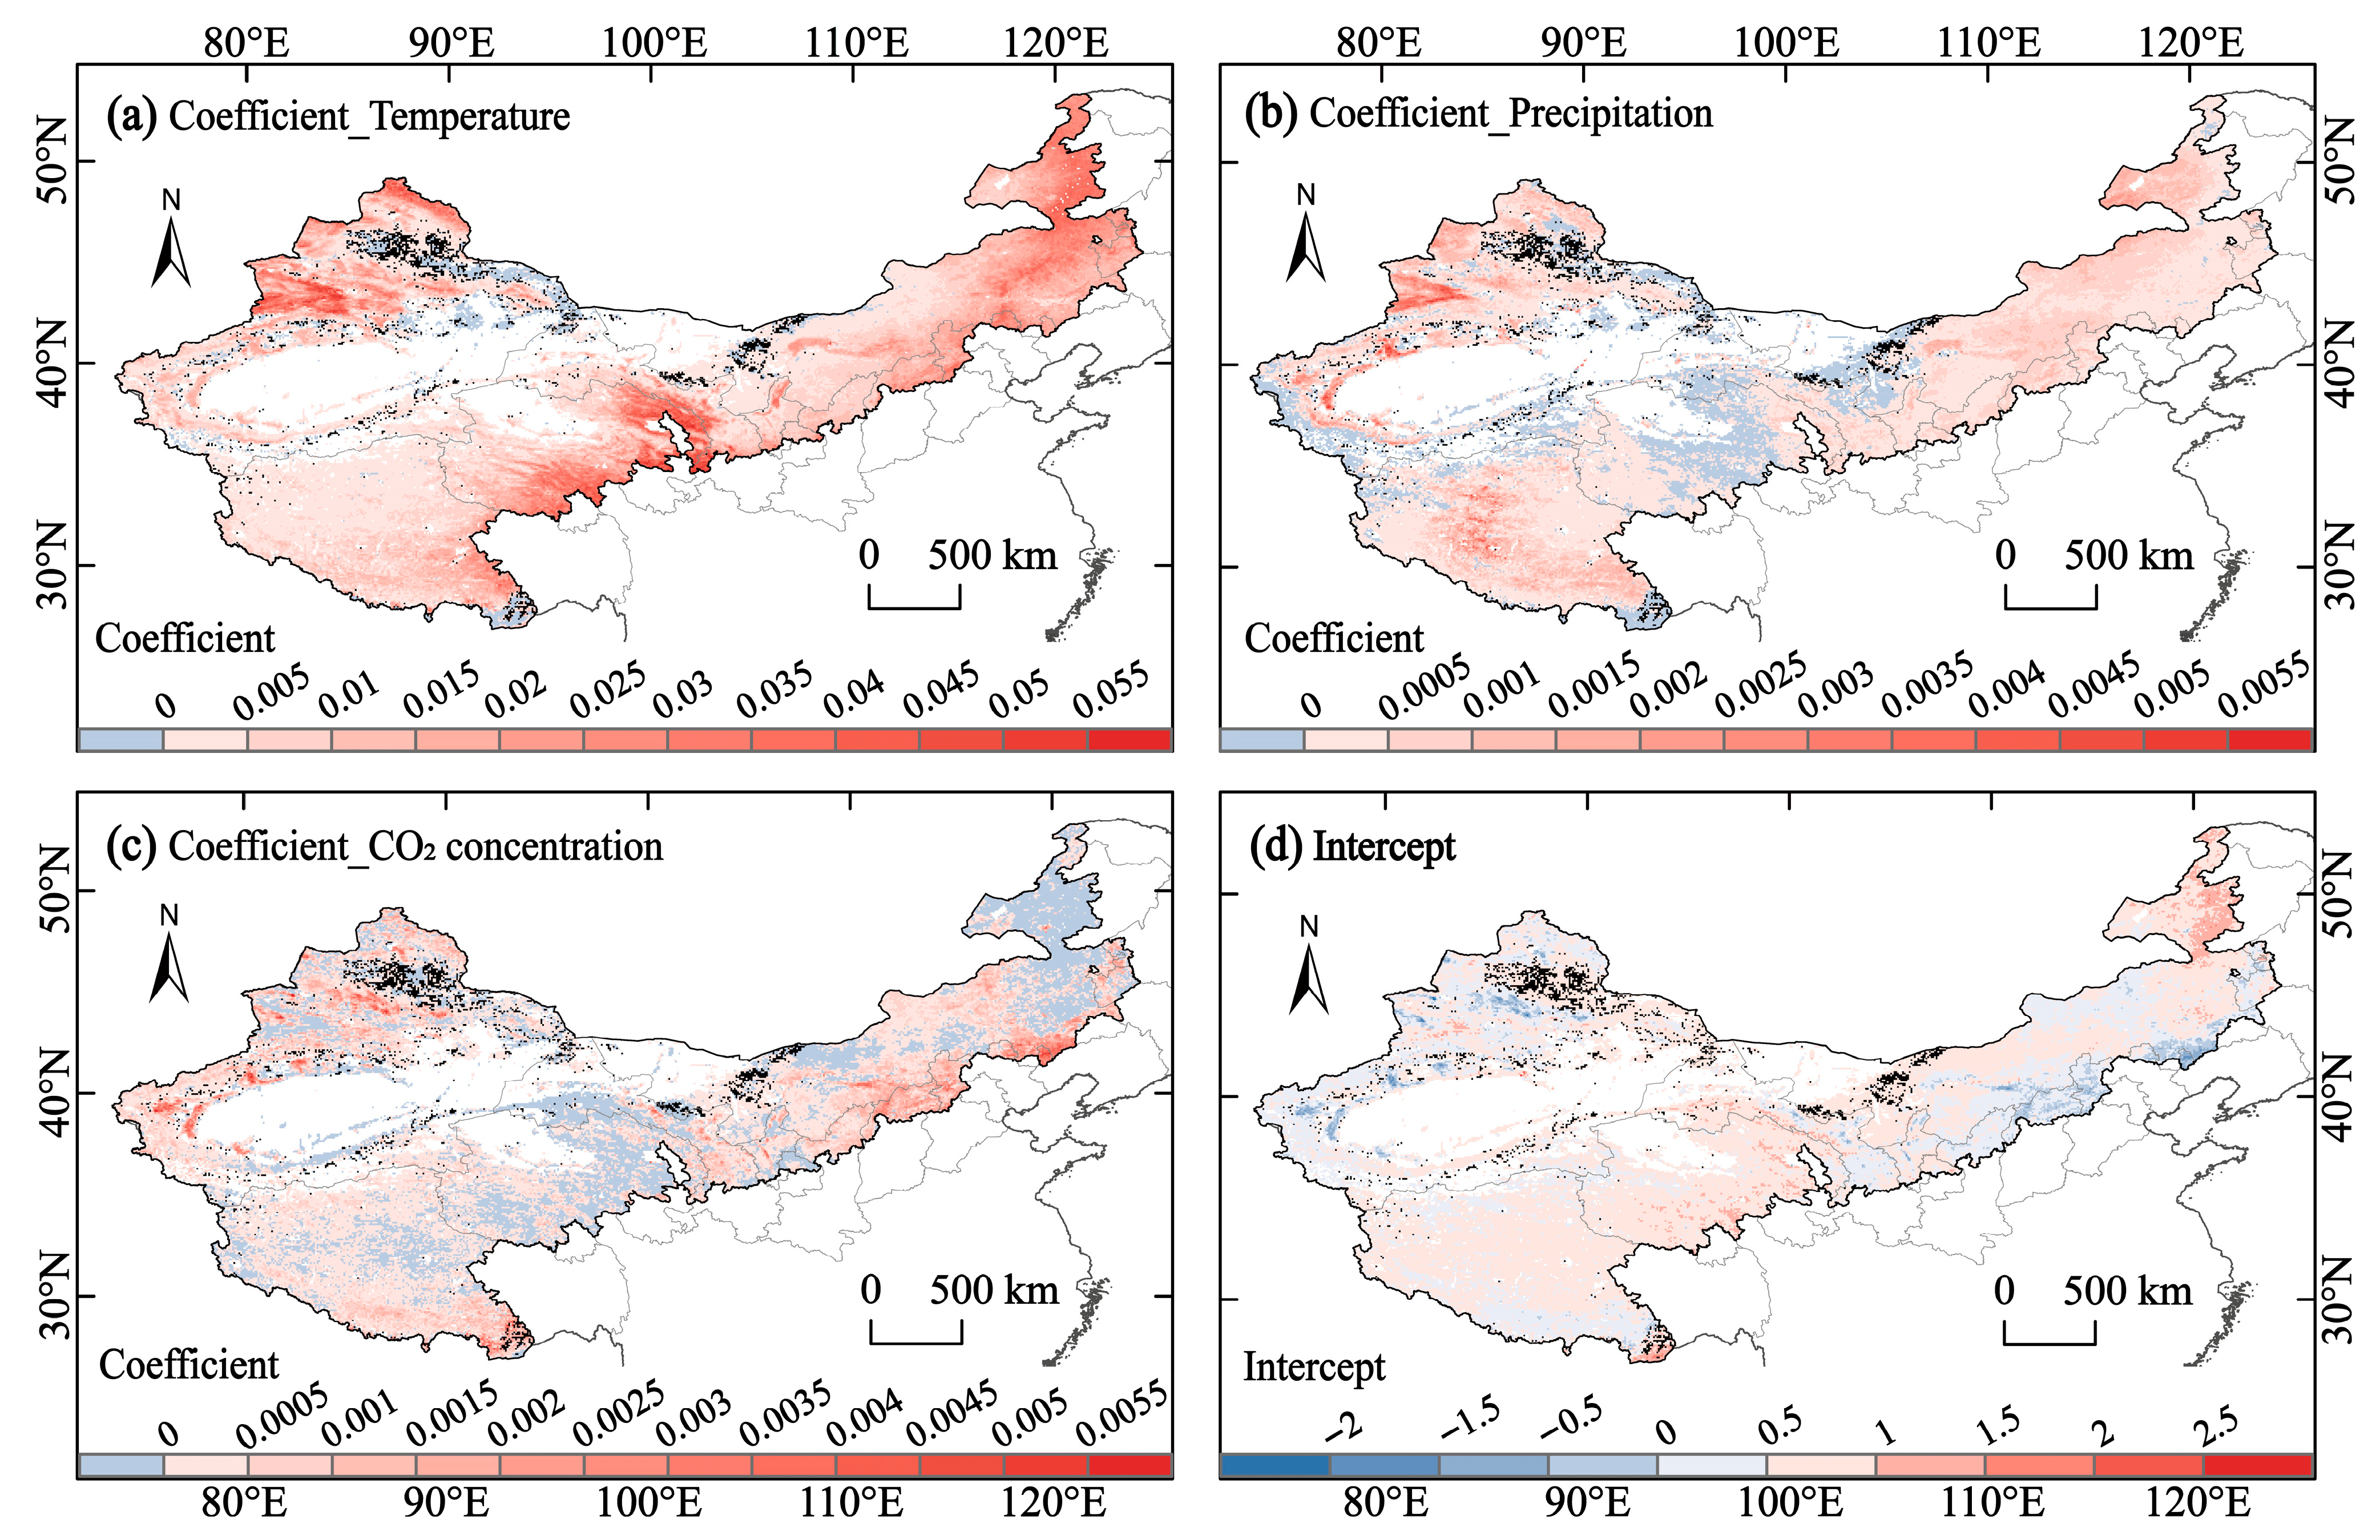
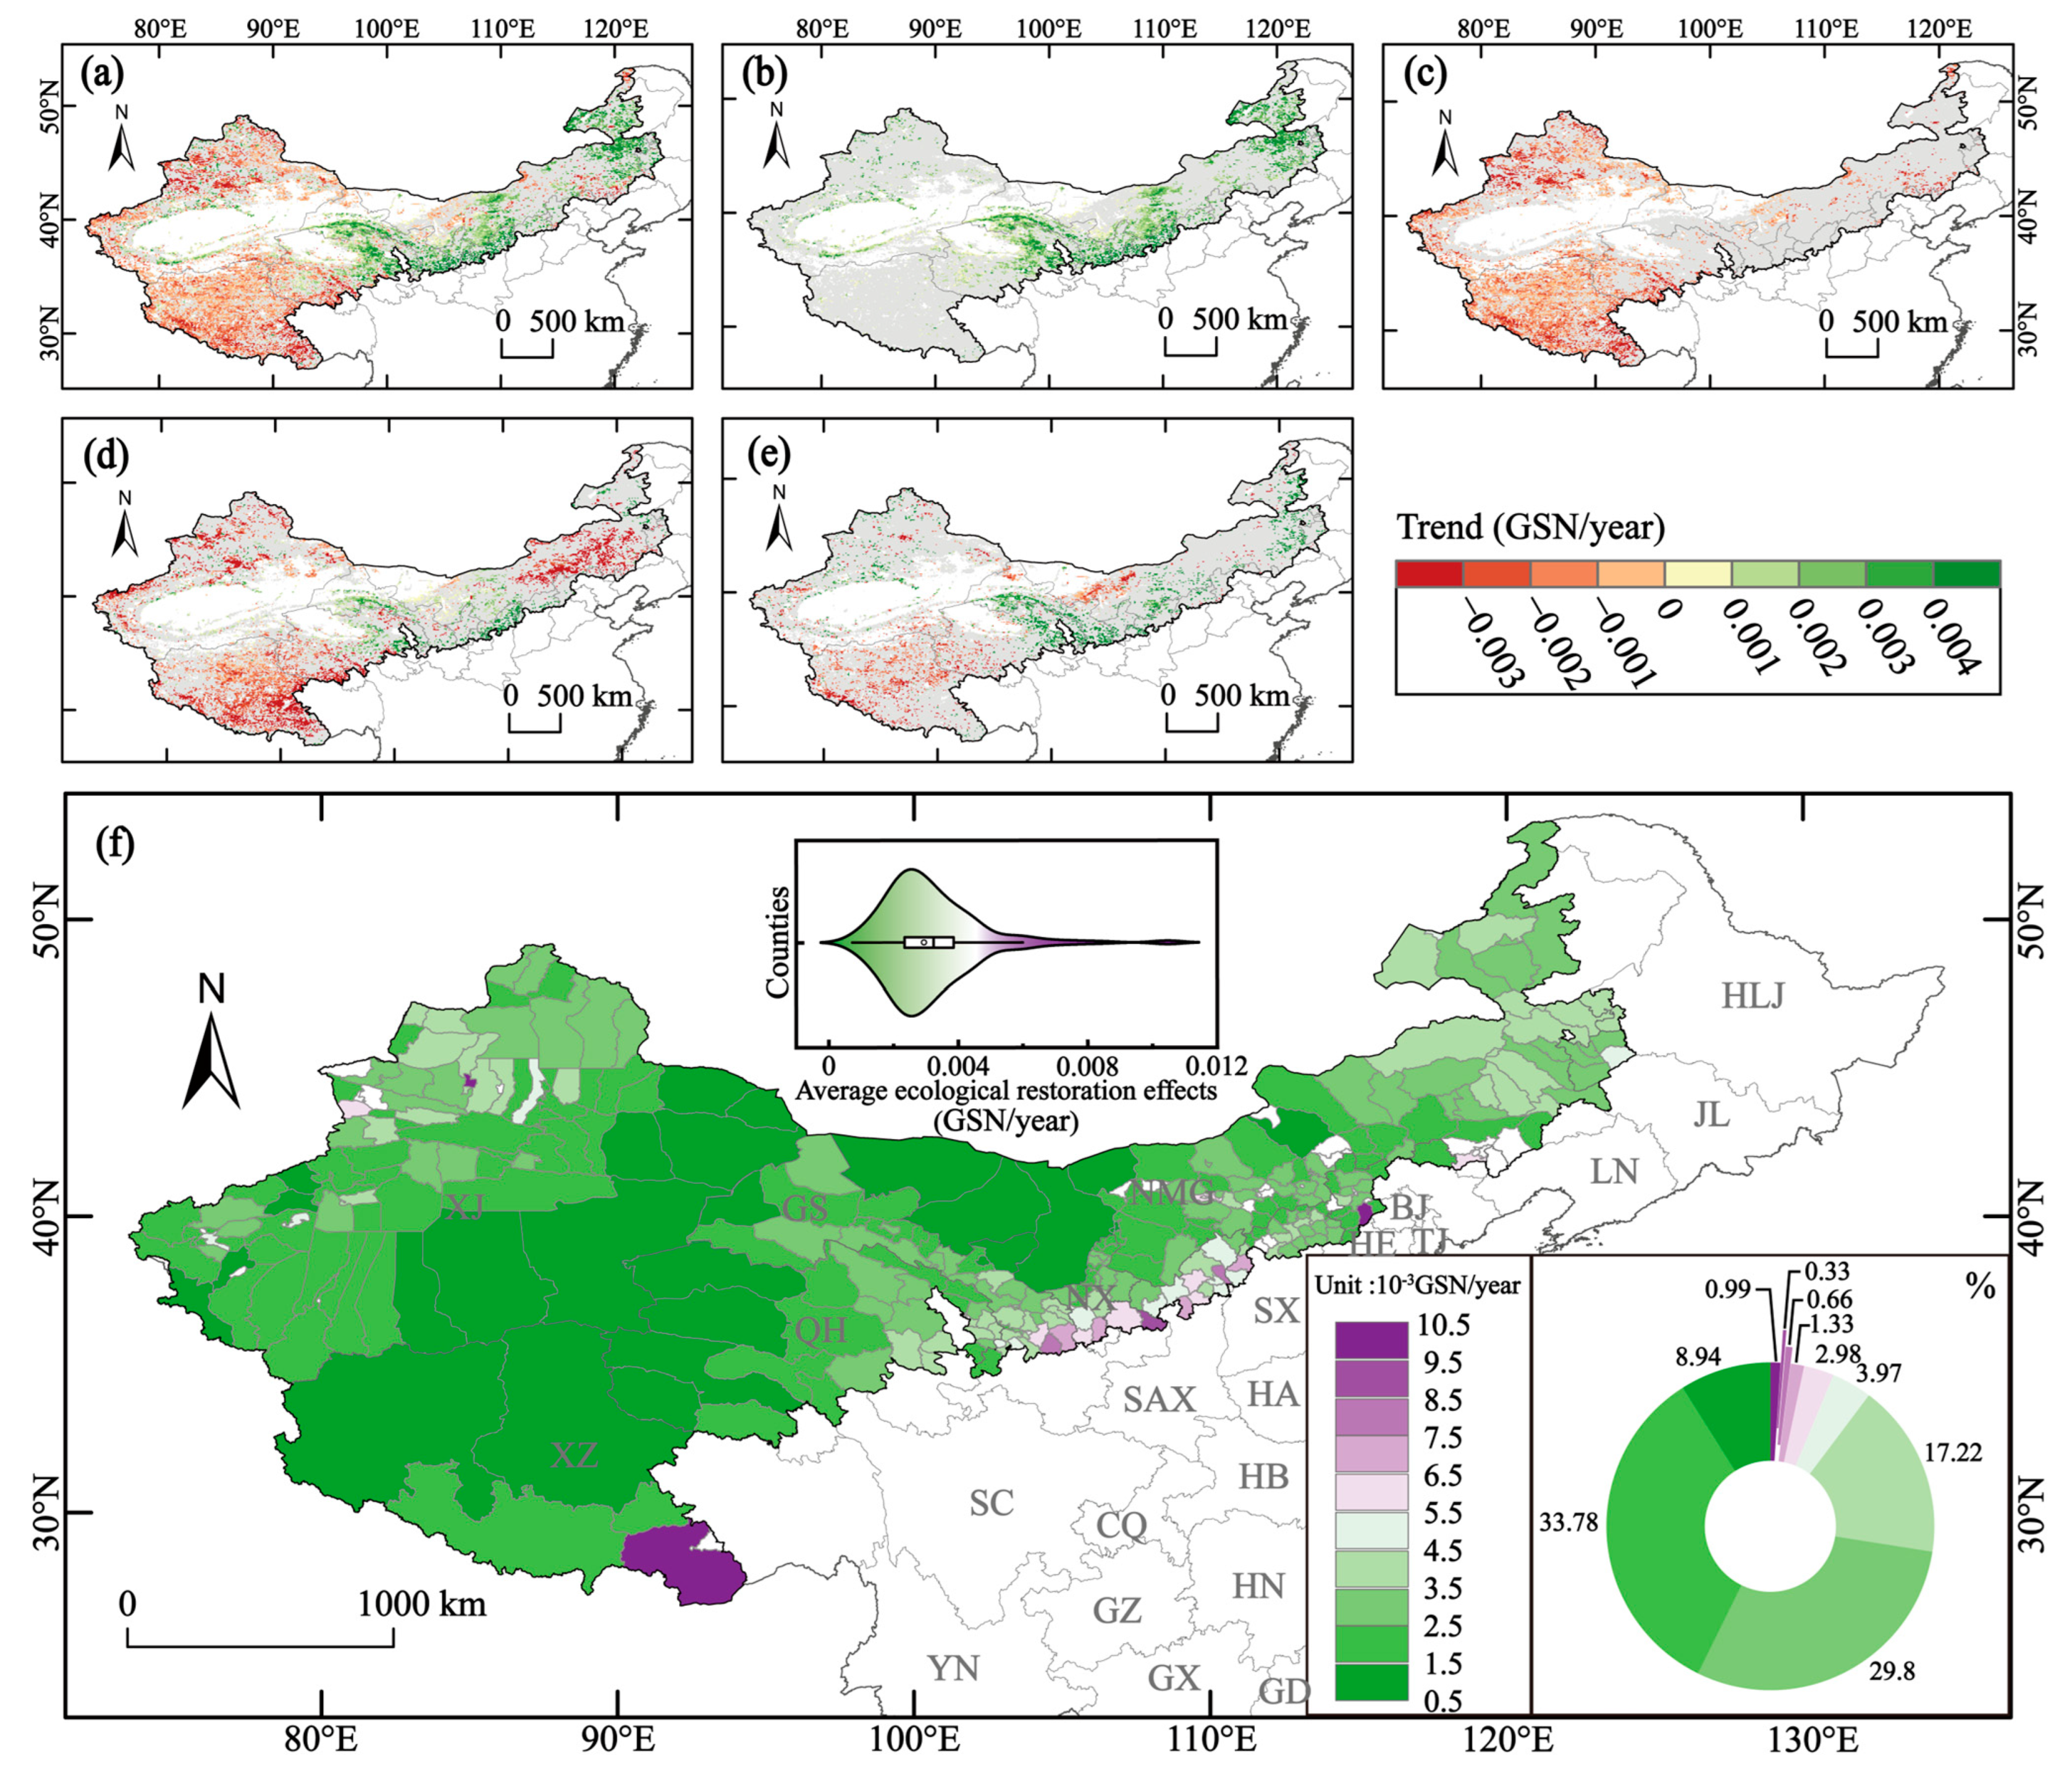
In the regression analysis of GSN on climatic variables and atmospheric CO2 concentration, 96.6% of pixels in the study area showed significant (p < 0.05) correlations (Figure 6). The result of residual trend analysis showed that human management in China’s D & DPRs positively affected 20.1% of the vegetation while negatively affecting 25.3% (Figure 7a–c). Spatially, the areas with a significant (p < 0.05) increase in human-driven GSN trends were concentrated in the northern Loess Plateau, southern and northeastern Inner Mongolia Plateau, and Hexi Corridor (Figure 7b). In contrast, the Tibetan Plateau and northern Xinjiang showed a significant (p < 0.05) decline in human-driven GSN trends (Figure 7c). The differences in human-driven GSN trends between the two stages of the restoration periods were mainly manifested as strengthened greening in the Hexi Corridor, along with alleviated degradation in the central and eastern Inner Mongolia Plateau, Xinjiang, and the southern Qinghai–Tibet Plateau (Figure 7d,e).
Based on the positive human-driven GSN trends, the spatial distribution of average ecological restoration effects of counties is shown in Figure 7f. The ecological restoration effects across China’s D & DPRs ranged from 0.5 × 10⁻³ to 10.5 × 10⁻³ GSN/year classified into 10 categories using the equal-interval method. Ecological restoration effects exceeded 5.5 × 10⁻³ GSN/year in 6.3% of the counties, with Zhuolu County, Shannan City, and Kuitun City showing exceptional performance (>10 × 10−3 GSN/year). Conversely, 42.6% of counties exhibited restoration effects below 2.5 × 10⁻³ GSN/year. Counties with better ecological restoration effects were primarily concentrated in the northern Loess Plateau, Hexi Corridor, northeastern Inner Mongolia Plateau, and northern Xinjiang.

4.4. The Influencing Factors of the Ecological Restoration Effect

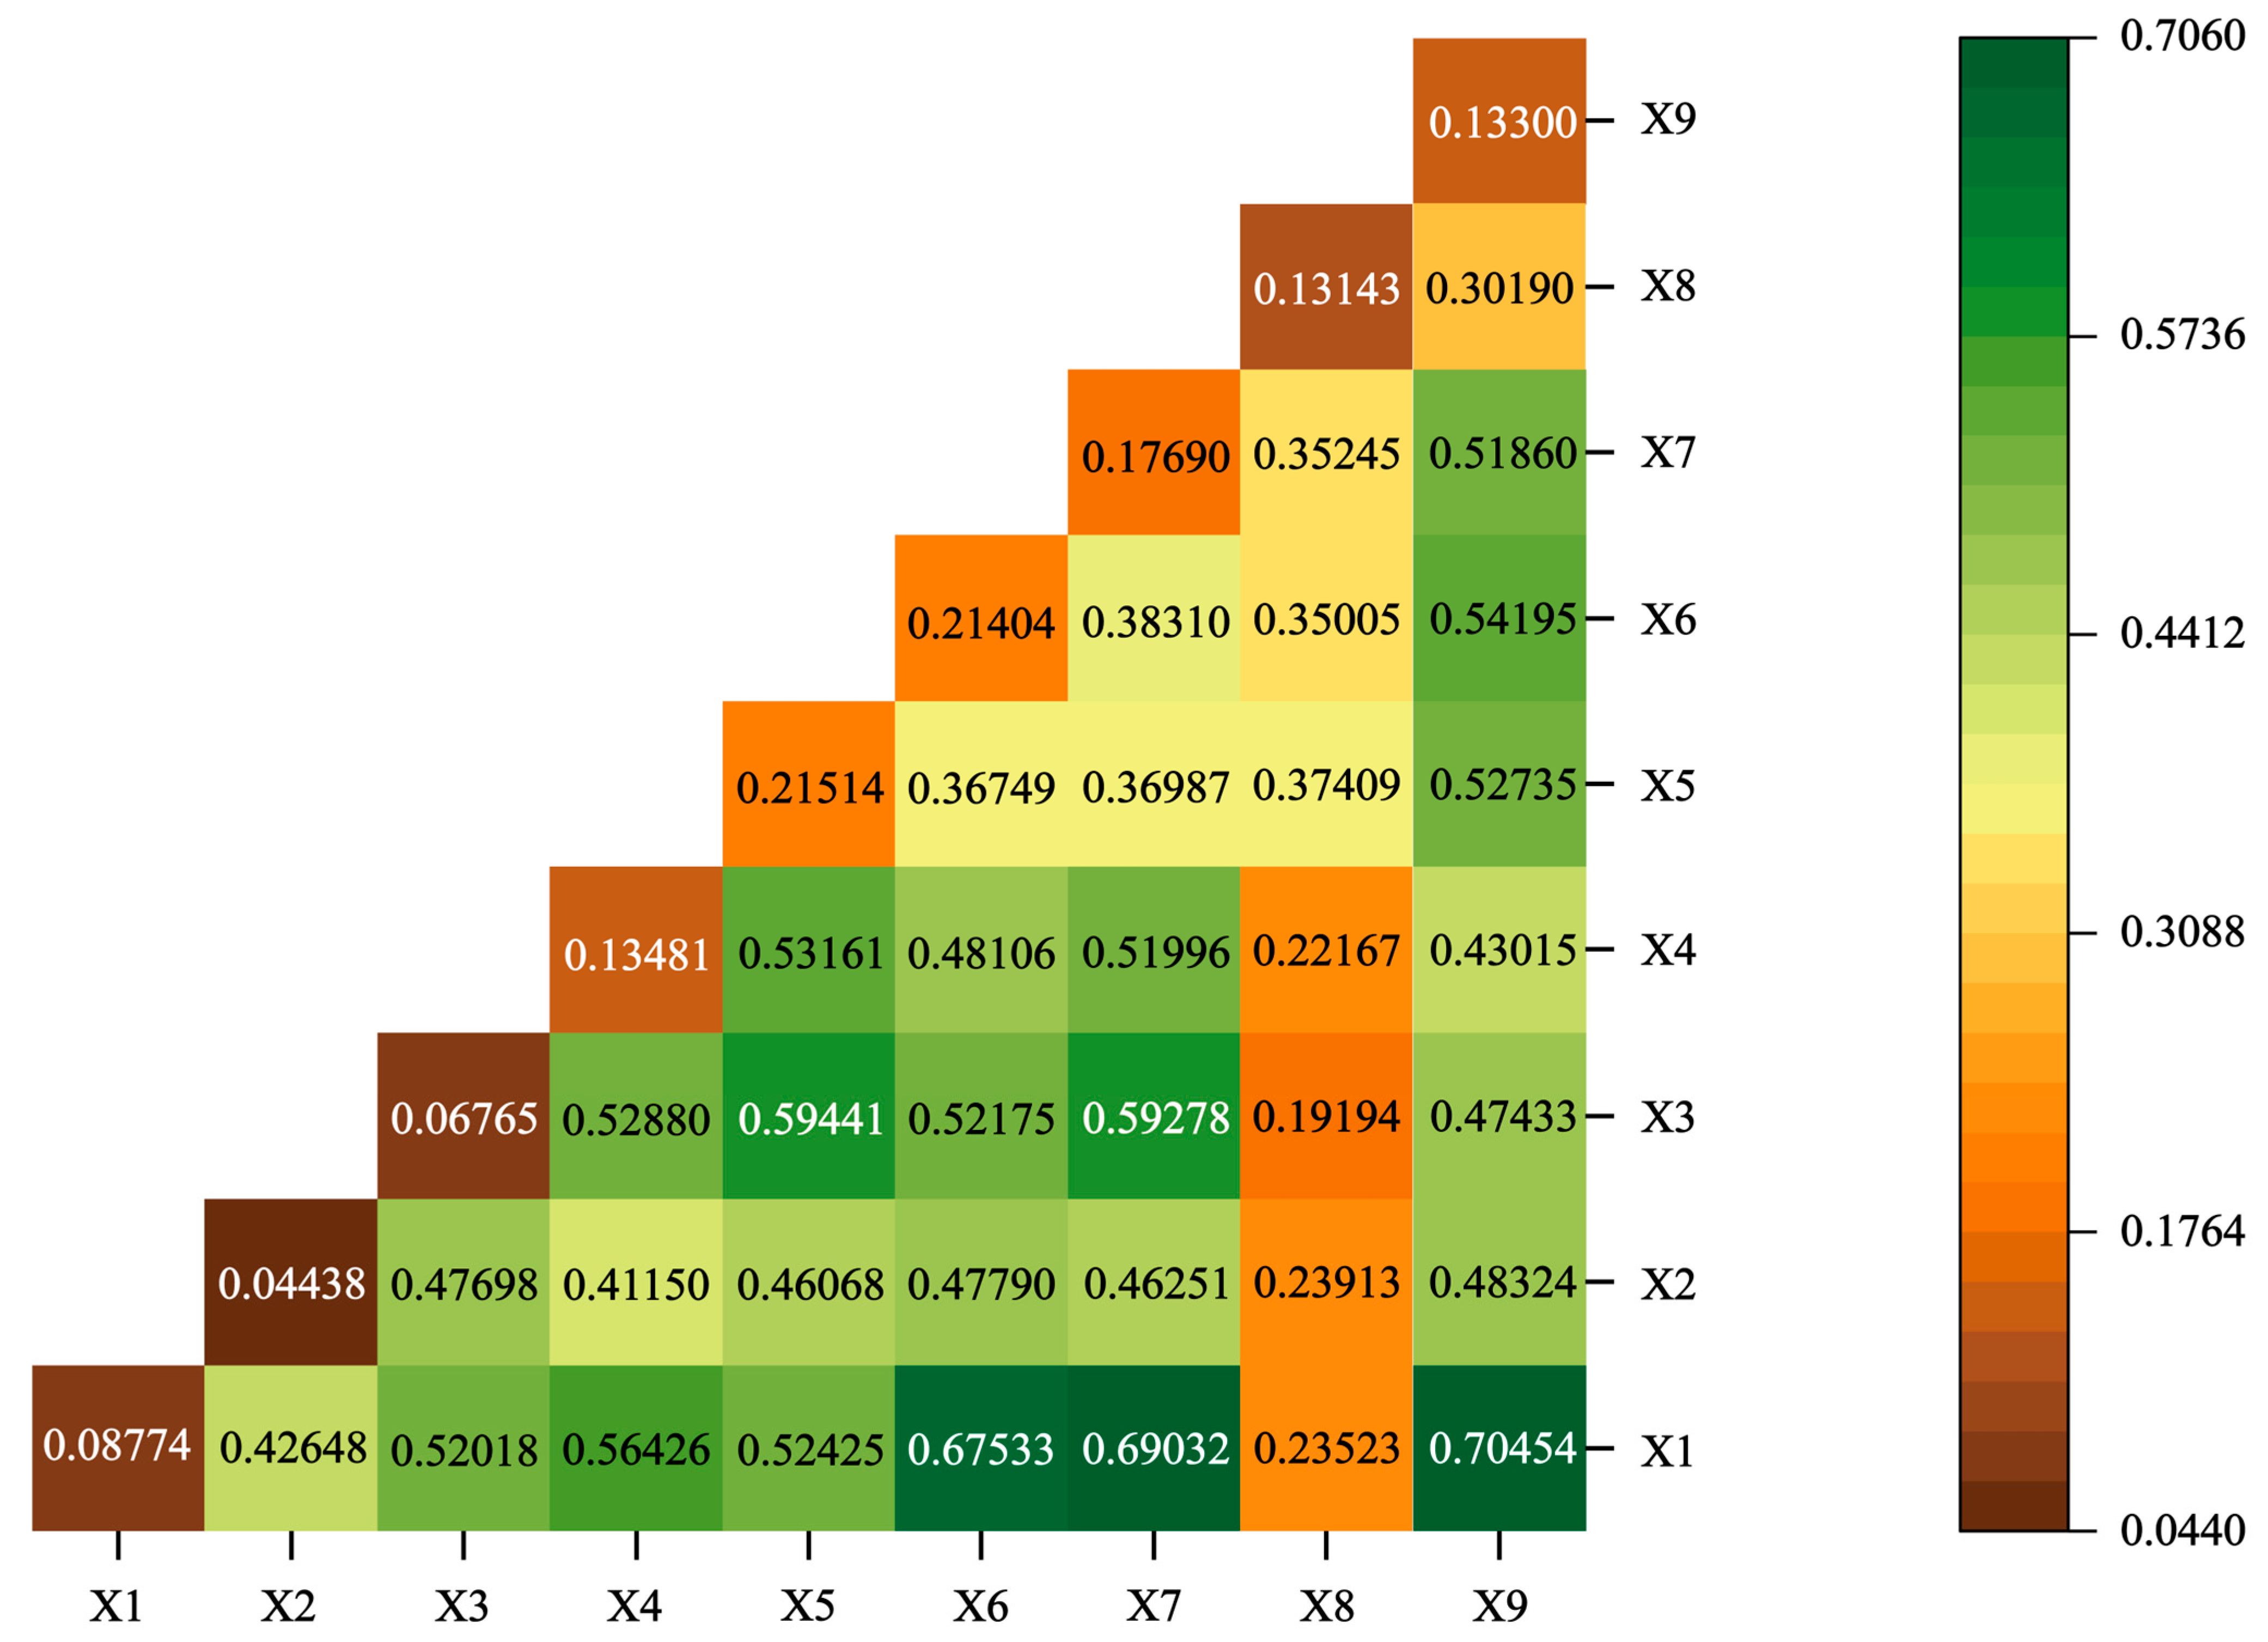
This study analyzed the factors employing the GeoDetector model. The detection results revealed that all eight factors exhibited significant (p < 0.001) explanatory power for the ecological restoration effect. The factors were ranked according to their explanatory power, as follows: Population (X5) > Road Density (X6) > Afforestation Area Percentage (X7) > Dust Days (X4) > Soil Organic Matter Content (X9) > Land Use Intensity (X8) > Elevation (X1) > Sunshine Duration (X3) > Slope (X2) (Table 4). Among these factors, Population showed the strongest explanatory power (q = 0.215), followed by Road Density (q = 0.214) and Afforestation Area Percentage (q = 0.177), making them the dominant factors. The result reflected the impact of population concentration, infrastructure accessibility and land management strategies on the ecological restoration effect.
In the interaction detection among factors (Figure 8), 30 pairs of factors exhibited non-linear enhancements, while 6 pairs showed bivariate enhancements, indicating that no single-factor effects were observed on the ecological restoration. The strongest interaction effect was observed between Elevation and Soil organic matter content (q = 0.705), followed by Elevation ∩ Afforestation Area Percentage (q = 0.690), Elevation ∩ Road Density (q = 0.675), and Sunshine duration ∩ Population (q = 0.594).
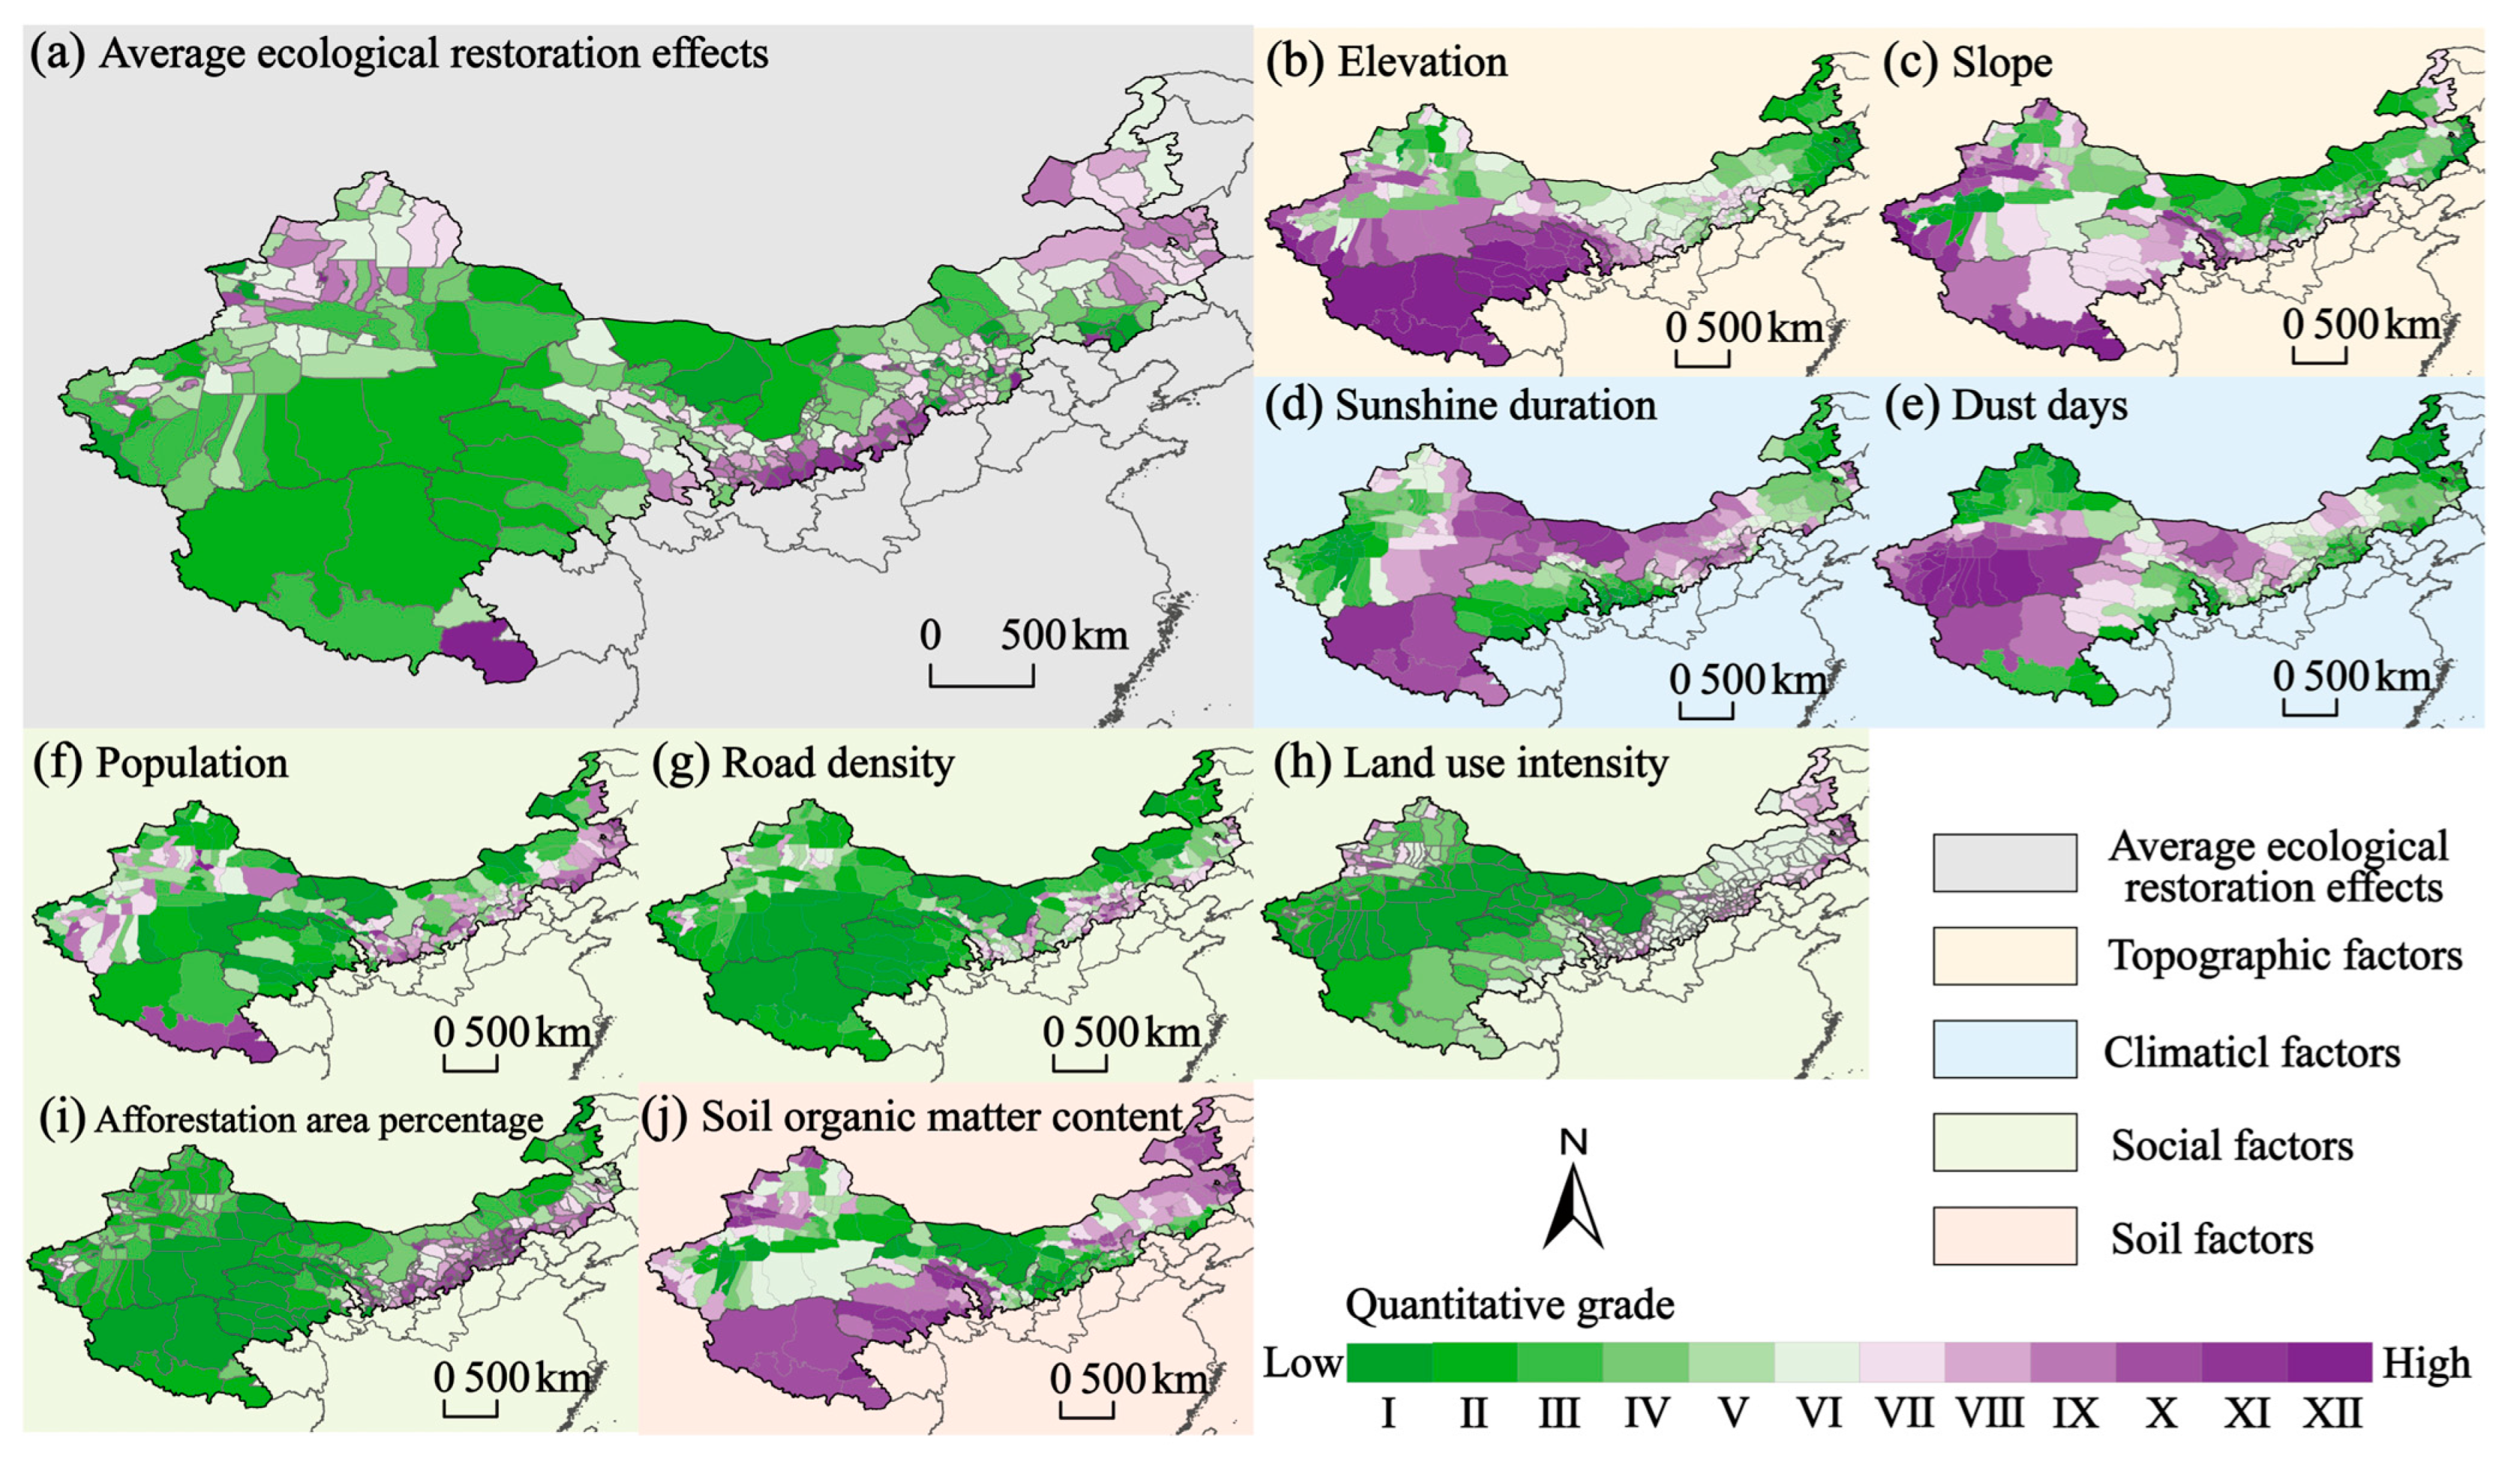
Spatially, the factors have different relationships with the ecological restoration effects (Figure 9). Marked positive correlations were observed between the ecological restoration effects and factors such as Population (Figure 9f), Road density (Figure 9g), Land use intensity (Figure 9h) and Afforestation area percentage (Figure 9i). In contrast, negative correlations were observed with Elevation (Figure 9b) and Dust Days (Figure 9e). The topographic influence was primarily manifested through altitudinal constraints on the Tibetan Plateau, where the ecological restoration effects mostly remained at a level below III and correlated negatively with elevation. Both climatic factors (Sunshine duration (X3) and Dust days (X4)) were negatively correlated with the ecological restoration effects. Moreover, socioeconomic factors exhibited particularly explanatory power. In the northern Loess Plateau, a densely populated region and the main execution zone of the GGP, the ecological restoration effects generally exceeded level IX.

4.5. Cost-Effectiveness of Ecological Restoration Programs

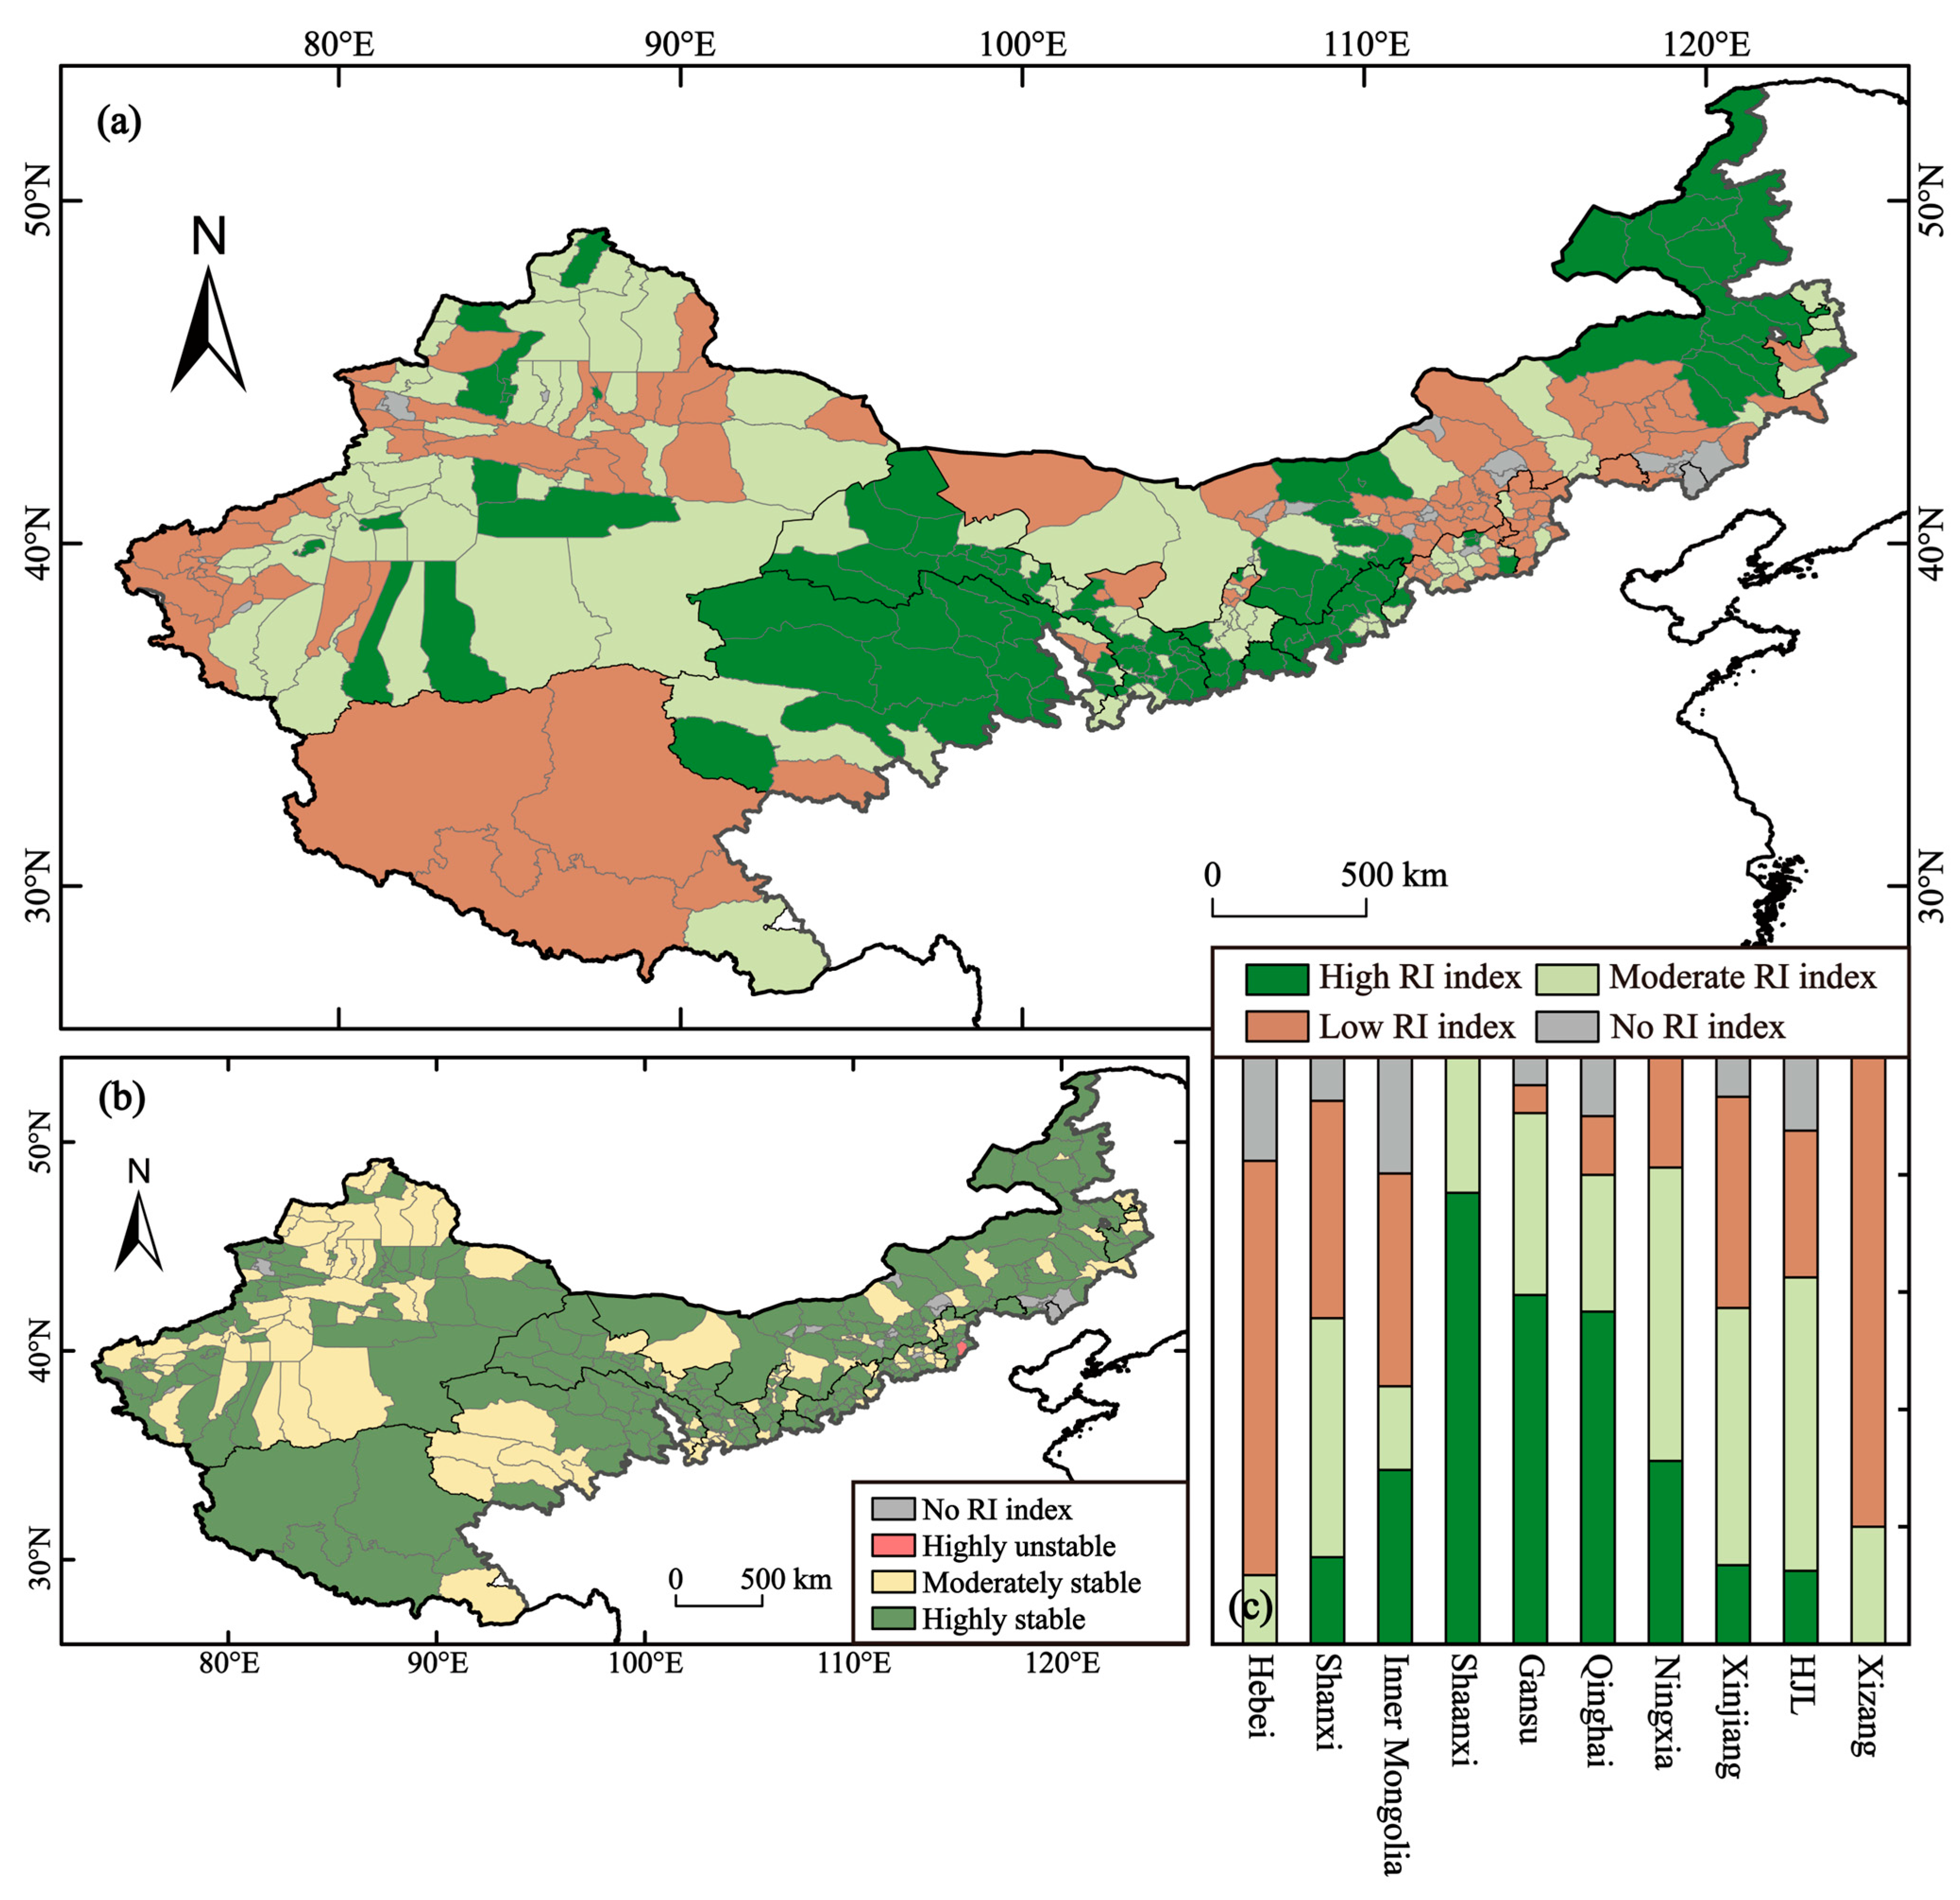
We calculated the Return on Investment (RI) index by combining the investment in ecological restoration programs with the positive human-driven GSN trends to serve as a proxy to assess the cost-effectiveness (Figure 10). A total of 303 counties within the study area were included in the analysis. The counties were categorized into low, medium, and high classes using the equal-interval method and a cost-effectiveness classification sensitivity analysis combining Monte Carlo simulation and Bootstrap method was conducted. We excluded the remaining 35 counties from the analysis due to the absence of pixels showing positive human-driven GSN trends. The results exhibited that the RI index exhibited notable spatial distribution patterns. Counties with a high RI index clustered in the northern Loess Plateau, the northeastern Inner Mongolia Plateau, and the Hexi Corridor, while counties with a low RI index predominated in the central and western parts of the Inner Mongolia Plateau, around the Tianshan Mountains, and across the Tibetan Plateau. This suggested that ecological restoration programs were more cost-effective in the former regions than in the latter. From the perspective of administrative divisions (Figure 10c), in China’s D & DPRs, Shaanxi Province had the highest portion (76.9%) of counties with high cost-effectiveness levels, followed by Gansu Province (59.5%) and Qinghai Province (56.7%). Counties in Northeast China, Ningxia, and Xinjiang were dominated by moderate cost-effectiveness levels, accounting for 50%, 50% and 43.8%, respectively. Low cost-effectiveness levels primarily occurred in Xizang (80%) and Hebei (70.6%). The sensitivity analysis (Figure 10b) results indicated that the cost-effectiveness classification was highly stable for 66.3% of the counties within China’s D & DPRs. An additional 33.3% were identified as moderately stable, primarily distributed in the northeastern Qinghai–Tibet Plateau and Xinjiang. Zhuolu County (Hebei Province) was the sole county classified as highly unstable, warranting a cautious approach when assessing the cost-effectiveness of its ecological programs.

5. Discussion

5.1. Vegetation Trend Changes and Shift Characteristics

The shifts in vegetation trends in China’s D & DPRs identified in this study mainly occurred in 1999 and later, with “accelerated greening” and “greening to degradation” as the primary shift types. For instance, vegetation greening has accelerated in the northern Loess Plateau, consistent with the previous findings [79]. On the one hand, a moistening trend has emerged in the Loess Plateau over past years, which has been conducive to vegetation growth [80,81]; on the other hand, the Loess Plateau serves as a critical implementation area for the Grain for Green Program and one of the regions with the highest density of ecological restoration [27], thereby driving vegetation greening. Moreover, we found that the vegetation trends on the Tibetan Plateau have shifted from greening to degradation, which aligned with previous studies documenting a vegetation productivity transition from increasing to decreasing around 1998 [82]. Vegetation degradation on the Tibetan Plateau was associated with reduced precipitation and intensified warming stress in the early 21st century [36] and was also affected by population growth and grazing activities [83].

5.2. Ecological Restoration Effect and Its Influencing Factors

It is widely recognized that both climate change, atmospheric CO2 concentration and human management impact vegetation dynamics [83,84]. Therefore, appropriate methods (such as the residual trend method [22,23] or the model parameter control method [85,86]) need to be adopted to separate their impacts. Nevertheless, the conventional residual trend method based on full-time series modeling is inadequate because it ignores the mutations in human management [87]. Therefore, this study introduced a turning point and established the vegetation-climate-CO2 relationships during periods with minimal human management to calculate the residuals. The ecological restoration effect identified by this method was mainly observed in the Loess Plateau, the Inner Mongolia Plateau, and western Xinjiang, consistent with the findings of Li et al. [88] and Shi et al. [89]. The ecological restoration effect is unevenly distributed and influenced by multiple factors. Our research found that population density, road density and policy intensity have a strong explanatory power for the ecological restoration effect, which is in line with the conclusion of Zhang et al. [90]. In addition, Tong et al. [17] believe that apart from human activities, climate and terrain are also important reasons for the differences in ecological restoration effect. Qu et al. [22] found that in the Yangtze River Basin, population mobility and migration have also contributed to ecological restoration.

5.3. Cost-Effectiveness of Ecological Restoration in Different Regions

5.3.1. Potential Factors of Cost-Effectiveness Disparities

This study combined investment and ecological restoration effect to assess the cost-effectiveness levels of ecological restoration and classified them into three categories. We utilized a comprehensive sensitivity analysis framework to provide more robust cost-effectiveness categories while simultaneously identifying the counties where these categories were less robust. Overall, the cost-effectiveness of ecological restoration programs in China’s D & DPRs is unevenly distributed. Beyond the influence of regional natural conditions, restoration approaches and supervision during implementation play critical roles.
Appropriate restoration methods are crucial for ensuring cost-effective ecological restoration. Some local governments implement tree planting without conducting suitability assessments, resulting in low tree survival rates and the “little old tree” phenomenon [91]. To mitigate these issues, some arid regions may adopt measures like increasing conservation expenses [92], which increases the operational costs of ecological restoration. In addition, since the initiation of ecological restoration on the Loess Plateau in 1999, the runoff has decreased from 8% during 1980–1999 to 5% during 2000–2010, with a concurrent decline in soil moisture. Vegetation restoration has led to water demands exceeding natural replenishment rates, indicating that vegetation recovery is approaching sustainable water limits [93]. Therefore, ecological restoration programs should implement measures such as selecting appropriate vegetation types [94] and arranging suitable planting densities [95] to alleviate conflicts between vegetation restoration and water resource utilization, thus promoting cost-effective ecological restoration.
Subsequent supervision and management affect the sustainability of the cost-effectiveness of ecological restoration. Grazing prohibition involves inherent trade-offs between ecological and economic benefits. Taking Inner Mongolia as an example, as the provincial administrative unit with the most investment in ecological restoration in China’s D & DPRs, grazing prohibition plays a crucial role in its grassland protection policy. Grazing prohibition has somewhat improved the ecological regimes of Inner Mongolia’s grasslands [96]. However, due to an inadequate compensation mechanism, the compensation amount fails to fully offset the financial losses due to reduced grazing intensity, thus undermining the livelihoods of some herders [97,98]. To reduce costs and increase efficiency, some herders may overstock during rotational grazing periods or graze nocturnally, exacerbating the conflict between grass and livestock and counteracting the effect of the grazing prohibition [99]. On the other hand, prolonged grazing prohibition may impair the natural recovery capacity and biodiversity due to the lack of moderate disturbance [100,101,102].

5.3.2. Cost-Effectiveness Metric Comparison in a Global Context

Ecological restoration has become a critical development intervention at the global scale. In addition to China’s major ecological restoration programs, restoration efforts in South America and Africa provide important reference cases (such as Africa’s Great Green Wall initiative (GGWI) (https://www.unccd.int/our-work/ggwi, accessed on 27 October 2025), Ethiopia’s Sustainable Land Management Project (SLMP) (https://projects.worldbank.org/en/projects-operations/project-detail/P133133, accessed on 27 October 2025), the Atlantic Forest Restoration Pact (https://pactomataatlantica.org.br/, accessed on 27 October 2025), and the Araguaia Biodiversity Corridor (https://black-jaguar.org/araguaia-biodiversity-corridor/, accessed on 27 October 2025)). The Cost-effectiveness research within this field has developed diverse assessment methods.
A comprehensive review of cost-effectiveness studies for ecological restoration in South America and Africa reveals that, despite their varying emphases, they widely corroborate the feasibility and necessity of such interventions [103]. The assessment metric is typically the ratio of cost to effectiveness of the restoration, but the methods for the individual estimation of cost and effectiveness vary among studies. On the cost side, estimates typically include implementation and maintenance costs (such as labor, materials, machinery, and equipment) [104,105,106]. Some studies also incorporate insurance and taxes into the cost estimation scope [105]. Where official government cost data are unavailable, researchers often resort to alternative estimates such as the opportunity cost of land [105,107]. Measures of effectiveness are even more heterogeneous. A common approach is the quantification or monetization of ecosystem services, including water provision, food supply, carbon storage, and tourism services [103,107,108]. In addition, estimating environmental losses avoided by ecological restoration (such as soil erosion and grain yield losses avoided by sustainable land management) as alternative indicators of effectiveness is also a common method [104,106].
By contrast, the cost-effectiveness metrics in our research are based on official government investment data and quantify effectiveness after rigorously removing non-human influences and ensuring spatial comparability. This approach enhances the credibility and rigor of our findings. Nevertheless, our study is limited by a relatively narrow focus on quantifying effectiveness. Future research should broaden the types of effectiveness to include water conservation, food supply, and biodiversity maintenance.

5.3.3. Policy Suggestions for Future Ecological Restoration

Our findings reveal significant spatial heterogeneity in the cost-effectiveness of ecological restoration across different regions within China’s D & DPR. A simplistic investment allocation strategy may lead to suboptimal resource use, resulting in diminished returns in low-cost-effectiveness regions and insufficient investment in high-cost-effectiveness regions. In addition, an arbitrary reduction in investment in low-cost-effectiveness regions is inadvisable. It is also crucial to consider the ecological vulnerability and strategic importance of these areas when allocating resources [109]. Consequently, future policies should adopt a nuanced approach, balancing cost-effectiveness assessments with the ecological significance of specific regions. For areas demonstrating high cost-effectiveness, successful experiences should be summarized and disseminated. In contrast, regions with lower cost-effectiveness necessitate diagnostic analysis and strategic optimization, potentially involving the selection of more suitable species, adoption of advanced techniques, and ensuring long-term maintenance [110,111,112]. Some studies propose that developing cost-effectiveness frameworks from the perspective of local ecological resource scarcity is highly constructive for policy-making [113]. Furthermore, governments can incorporate the cost-effectiveness of ecological restoration to guide the delineation of priority restoration areas, thereby optimizing resource allocation [114,115,116]. In addition, our analysis indicates a localized degradation trend in the later restoration period (2011–2020) compared to the earlier phase (1999–2010), particularly observed in areas such as the western Inner Mongolia Plateau. This suggests that ecosystems restored in the initial phase might remain in a fragile state and could revert without sustained management efforts. Therefore, strengthening post-restoration supervision and monitoring is imperative, including establishing robust ecosystem health monitoring networks to facilitate the timely identification of degradation risks [117].

5.4. Methodological Limitations and Uncertainties

The study employed GIMMS NDVI 3g+ data, which has been widely utilized for long-term vegetation monitoring due to its extensive temporal coverage (since 1982). However, its spatial resolution of 8 km poses challenges in identifying the vegetation dynamics in smaller areas. In recent years, MODIS data (available since 2000) has become the mainstream for vegetation detection but presents temporal scale limitations for long-term studies. Therefore, future research can explore the integration of datasets with different temporal and spatial resolutions. Regarding the regression methodology, the improved residual method we applied presupposes a relatively stationary climate-vegetation relationship during the reference period. Although the atmospheric CO2 concentration variable was incorporated to isolate the CO2 fertilization effect on vegetation dynamics, non-stationarity may persist. Future studies could employ explainable machine learning methods to cross-validate the findings, thereby enabling a more comprehensive understanding of the complex driving mechanisms of vegetation dynamics. Furthermore, we allocated the investment data of ecological restoration programs through downscaling methods due to data gaps, which may contain some limitations and require further refinement in future studies.
Our calculation of cost-effectiveness involves simplification. We proxied the “marginal effect per unit of investment” with a linear ratio indicator. This was a pragmatic choice decided by current data availability. However, we acknowledge that the true relationship between ecological investment and effect may be non-linear. Future research, with access to longer time-series or program-level panel data, could more precisely characterize this non-linear relationship, thereby permitting a dynamic assessment of the marginal effect.

6. Conclusions

This study employed methods including turning point detection, trend analysis, residual analysis, and the GeoDetector model to investigate vegetation dynamics, as well as to explore the distribution and drivers of ecological restoration effect in China’s D & DPRs. We collected the investment data from ecological restoration programs to assess the cost-effectiveness. Based on the preceding analysis, several conclusions could be summarized as follows:
(1)
From 1982 to 2020, vegetation trends in 21.8% of China’s D & DPRs experienced significant shifts, dominated by “accelerated greening”. Among these shifts, 82.4% occurred in or after 1999.
(2)
Compared with the reference period (1982–1998), vegetation restoration and degradation during the restoration period (1999–2020) increased by 15.5% and 21%, respectively, with accelerated greening primarily occurring around the agro-pastoral ecotone.
(3)
Positive impacts of human management were observed in 20.1% of the vegetated area in China’s D & DPRs, whereas negative impacts occurred in 25.3% of the vegetated area.
(4)
The ecological restoration effect was influenced by multiple factors, including topographic, climatic, socio-economic, and soil factors, among which population, road density and afforestation area percentage exhibited the strongest explanatory power.
(5)
The cost-effectiveness of ecological restoration in China’s D & DPRs was unevenly distributed. Ecological restoration exhibited higher cost-effectiveness in counties located in the northern Loess Plateau, Hexi Corridor, and northeastern Inner Mongolia Plateau. In contrast, counties situated in the central and western Inner Mongolia Plateau, the Tianshan Mountains, and the Tibetan Plateau exhibited relatively lower cost-effectiveness. Administratively, Shaanxi Province demonstrated the highest restoration cost-effectiveness among China’s D & DPRs, followed by Gansu and Qinghai Provinces.
(6)
Ecological restoration should formulate policies in combination with the cost-effectiveness level and ecological status of the region, select reasonable restoration measures and strengthen subsequent ecological monitoring.

Supplementary Materials

The following supporting information can be downloaded at: https://www.mdpi.com/article/10.3390/land14112220/s1.

Author Contributions

Conceptualization, J.L.; Data curation, J.L.; Formal analysis, J.L.; Methodology, J.L.; Resources, X.W.; Supervision, X.W.; Writing—original draft, J.L.; Writing—review & editing, X.W. and Y.P. All authors have read and agreed to the published version of the manuscript.

Funding

This research was funded by the National Key Research and Development Program of China (Grant number 2024YFF0809300) and the Open Solicitation Program with Appointed Leadership of China’s Inner Mongolia Autonomous Region (Grant number 2024JBGS0010).

Data Availability Statement

The data is contained within the article.

Acknowledgments

The authors are grateful to the anonymous reviewers and editors.

Conflicts of Interest

The authors declare no conflicts of interest.

References

  1. Li, C.; Fu, B.; Wang, S.; Stringer, L.C.; Wang, Y.; Li, Z.; Liu, Y.; Zhou, W. Drivers and impacts of changes in China’s drylands. Nat. Rev. Earth Environ. 2021, 2, 858–873. [Google Scholar] [CrossRef]
  2. Dai, E.; Zhao, Z.; Jia, L.; Jiang, X. Contribution of ecosystem services improvement on achieving Sustainable development Goals under ecological engineering projects on the Qinghai-Tibet Plateau. Ecol. Eng. 2024, 199, 107146. [Google Scholar] [CrossRef]
  3. Chen, Y.; Tang, H. Desertification in north China: Background, anthropogenic impacts and failures in combating it. Land Degrad. Dev. 2005, 16, 367–376. [Google Scholar] [CrossRef]
  4. Xu, J.; Yin, R.; Li, Z.; Liu, C. China’s ecological rehabilitation: Unprecedented efforts, dramatic impacts, and requisite policies. Ecol. Econ. 2006, 57, 595–607. [Google Scholar] [CrossRef]
  5. Wang, X.; Ge, Q.; Geng, X.; Wang, Z.; Gao, L.; Bryan, B.A.; Chen, S.; Su, Y.; Cai, D.; Ye, J.; et al. Unintended consequences of combating desertification in China. Nat. Commun. 2023, 14, 1139. [Google Scholar] [CrossRef]
  6. Ding, Z.; Yao, S. Ecological effectiveness of payment for ecosystem services to identify incentive priority areas: Sloping land conversion program in China. Land Use Policy 2021, 104, 105350. [Google Scholar] [CrossRef]
  7. Li, G.; Sun, S.; Han, J.; Yan, J.; Liu, W.; Wei, Y.; Lu, N.; Sun, Y. Impacts of Chinese Grain for Green program and climate change on vegetation in the Loess Plateau during 1982–2015. Sci. Total Environ. 2019, 660, 177–187. [Google Scholar] [CrossRef] [PubMed]
  8. Liu, T.; Yu, L.; Chen, J.; Qi, W.; Wu, H.; Peng, D.; Chen, X.; Zhou, Y. Afforestation surpasses abandonment in the recovery of post-agricultural soil organic carbon in China as estimated by machine learning models. Glob. Change Biol. 2025, 31, e70383. [Google Scholar] [CrossRef]
  9. Hu, Y.; Li, H.; Wu, D.; Chen, W.; Zhao, X.; Hou, M.; Li, A.; Zhu, Y. LAI-indicated vegetation dynamic in ecologically fragile region: A case study in the Three-North Shelter Forest program region of China. Ecol. Indic. 2021, 120, 106932. [Google Scholar] [CrossRef]
  10. Meng, R.; Meng, Z.; Li, H.; Cai, J.; Qin, L. Changes in landscape ecological risk in the Beijing-Tianjin Sandstorm Source Control Project area from a spatiotemporal perspective. Ecol. Indic. 2024, 167, 112569. [Google Scholar] [CrossRef]
  11. Cao, B.; Zhu, H.; Wang, Y. Has China’s “Only-out, no-in” staff-reduction policy alleviated the material deprivation of forestry worker families? Evidence from China’s Natural Forest Protection Program. For. Policy Econ. 2025, 170, 103391. [Google Scholar] [CrossRef]
  12. Zhao, Z.; Dai, E. Vegetation cover dynamics and its constraint effect on ecosystem services on the Qinghai-Tibet Plateau under ecological restoration projects. J. Environ. Manag. 2024, 356, 120535. [Google Scholar] [CrossRef] [PubMed]
  13. Yang, X.; Zhou, H.; Liu, F. Utilizing a vegetation restoration potential model to derive a reference for assessing ecological restoration of the Qinghai-Tibet Plateau. Ecol. Eng. 2025, 212, 107514. [Google Scholar] [CrossRef]
  14. Bai, R.; Wang, X.; Li, J.; Yang, F.; Shangguan, Z.; Deng, L. The impact of vegetation reconstruction on soil erosion in the Loess plateau. J. Environ. Manag. 2024, 363, 121382. [Google Scholar] [CrossRef] [PubMed]
  15. Wu, X.; Wang, S.; Fu, B.; Liu, J. Spatial variation and influencing factors of the effectiveness of afforestation in China’s Loess Plateau. Sci. Total Environ. 2021, 771, 144904. [Google Scholar] [CrossRef]
  16. Lyu, F.; Tang, J.; Olhnuud, A.; Hao, F.; Gong, C. The impact of large-scale ecological restoration projects on trade-offs/synergies and clusters of ecosystem services. J. Environ. Manag. 2024, 365, 121591. [Google Scholar] [CrossRef]
  17. Tong, X.; Wang, K.; Yue, Y.; Brandt, M.; Liu, B.; Zhang, C.; Liao, C.; Fensholt, R. Quantifying the effectiveness of ecological restoration projects on long-term vegetation dynamics in the karst regions of Southwest China. Int. J. Appl. Earth Obs. Geoinf. 2017, 54, 105–113. [Google Scholar] [CrossRef]
  18. Fan, J.; Liu, S.; Wang, W.; Li, Y.; Zhao, Y.; Wu, G. Quantifying the ecological network dynamics associated with ecological restoration projects: A case study in Southwest China. Global Ecol. Conserv. 2025, 62, e03744. [Google Scholar] [CrossRef]
  19. Piao, S.; Yin, G.; Tan, J.; Cheng, L.; Huang, M.; Li, Y.; Liu, R.; Mao, J.; Myneni, R.B.; Peng, S.; et al. Detection and attribution of vegetation greening trend in China over the last 30 years. Glob. Change Biol. 2015, 21, 1601–1609. [Google Scholar] [CrossRef]
  20. Guo, M.; Zhou, N.; Cai, Y.; Wang, X.; Zhang, X.; Lu, S.; Liu, K.; Zhao, W. Quantitative estimation of vegetation carbon source/sink and its response to climate variability and anthropogenic activities in Dongting Lake Wetland, China. Remote Sens. 2025, 17, 2475. [Google Scholar] [CrossRef]
  21. Chen, D.; Wu, L.; Wei, H.; Yang, D.; Xiong, L.; Chen, G.; Du, J.; Jia, J.; Xia, Y. Stronger climatic impact than anthropogenic control on vegetation carbon sink growth in China. Ecol. Front. 2025, 45, 1860–1873. [Google Scholar] [CrossRef]
  22. Qu, S.; Wang, L.; Lin, A.; Zhu, H.; Yuan, M. What drives the vegetation restoration in Yangtze River basin, China: Climate change or anthropogenic factors? Ecol. Indic. 2018, 90, 438–450. [Google Scholar] [CrossRef]
  23. Wang, Z.; Jia, Y.; Niu, C.; Liu, J.; Jin, J.; Liao, Z.; Wang, M.; Li, G.; Zhang, J. Spatiotemporal variation in fractional vegetation coverage and quantitative analysis of its driving forces: A case study in the Tabu River Basin, Northern China, 1986–2023. Remote Sens. 2025, 17, 2490. [Google Scholar] [CrossRef]
  24. Shi, S.; Zheng, W.; Han, J.; Zhan, X.; Wang, F. Dominance of human activities in reducing soil erosion on the Loess Plateau. J. Hydrol. 2025, 662, 133835. [Google Scholar] [CrossRef]
  25. Horion, S.; Prishchepov, A.V.; Verbesselt, J.; de Beurs, K.; Tagesson, T.; Fensholt, R. Revealing turning points in ecosystem functioning over the Northern Eurasian agricultural frontier. Glob. Change Biol. 2016, 22, 2801–2817. [Google Scholar] [CrossRef] [PubMed]
  26. Shao, Q.; Liu, S.; Ning, J.; Liu, G.; Yang, F.; Zhang, X.; Niu, L.; Huang, H.; Fan, J.; Liu, J. Assessment of ecological benefits of key national ecological projects in China in 2000–2019 using remote sensing. Acta Geogr. Sin. 2022, 77, 2133–2153. [Google Scholar] [CrossRef]
  27. Jiang, C.; Zhang, H.; Zhao, L.; Yang, Z.; Wang, X.; Yang, L.; Wen, M.; Geng, S.; Zeng, Q.; Wang, J. Unfolding the effectiveness of ecological restoration programs in combating land degradation: Achievements, causes, and implications. Sci. Total Environ. 2020, 748, 141552. [Google Scholar] [CrossRef]
  28. Huang, B.; Lu, F.; Wang, X.; Wu, X.; Zheng, H.; Su, Y.; Yuan, Y.; Ouyang, Z. The impact of ecological restoration on ecosystem services change modulated by drought and rising CO2. Glob. Change Biol. 2023, 29, 5304–5320. [Google Scholar] [CrossRef]
  29. Fu, S.; Zhang, J.; Li, Y.; Chen, W.; Zhang, Y.; Yi, K.; Dai, Y. Environmental variables affect the effectiveness of ecosystem services of ecological restoration project: Evidence from Xiangjiang River Basin-Dongting Lake. J. Clean. Prod. 2025, 527, 146739. [Google Scholar] [CrossRef]
  30. Wang, Y.; Liu, C.; Liu, B.; Lee, T.M. Integrated outcomes of large-scale ecological restoration projects on biodiversity–eco-environment–society in China. Geogr. Sustain. 2025, 6, 100243. [Google Scholar] [CrossRef]
  31. Hu, T.; Peng, J.; Qiu, S.; Dong, J.; Hu, Y.N.; Lin, Y.; Xia, P. Social-ecological heterogeneity drove contrasting tree cover restoration in south China karst. Commun. Earth Environ. 2024, 5, 484. [Google Scholar] [CrossRef]
  32. Li, J.; Dong, S.; Li, Y.; Li, Z.; Li, F.; Fan, F. Do ecosystem service gains promote human well-being? Unpacking the ecosystem–human well-being link in fragile landscapes. Ecol. Indic. 2025, 179, 114177. [Google Scholar] [CrossRef]
  33. Cao, S. Why large-scale afforestation efforts in China have failed to solve the desertification problem. Environ. Sci. Technol. 2008, 42, 1826–1831. [Google Scholar] [CrossRef]
  34. Hua, F.; Wang, X.; Zheng, X.; Fisher, B.; Wang, L.; Zhu, J.; Tang, Y.; Yu, D.W.; Wilcove, D.S. Opportunities for biodiversity gains under the world’s largest reforestation programme. Nat. Commun. 2016, 7, 12717. [Google Scholar] [CrossRef]
  35. Lu, C.; Zhao, T.; Shi, X.; Cao, S. Ecological restoration by afforestation may increase groundwater depth and create potentially large ecological and water opportunity costs in arid and semiarid China. J. Cleaner Prod. 2018, 176, 1213–1222. [Google Scholar] [CrossRef]
  36. Wang, X.; Geng, X.; Liu, B.; Cai, D.; Li, D.; Xiao, F.; Zhu, B.; Hua, T.; Lu, R.; Liu, F. Desert ecosystems in China: Past, present, and future. Earth Sci. Rev. 2022, 234, 104206. [Google Scholar] [CrossRef]
  37. Bryan, B.A.; Gao, L.; Ye, Y.; Sun, X.; Connor, J.D.; Crossman, N.D.; Stafford-Smith, M.; Wu, J.; He, C.; Yu, D.; et al. China’s response to a national land-system sustainability emergency. Nature 2018, 559, 193–204. [Google Scholar] [CrossRef] [PubMed]
  38. National Forestry and Grassland Administration. The Overall Planning of the Green Great Wall Program. 2022. Available online: https://www.forestry.gov.cn/c/sbj/gcgh/355834.jhtml (accessed on 28 October 2025).
  39. Zhejiang Forestry Bureau. World Famous Ecological Program—“Natural Forest Protection Program” in China. 2022. Available online: http://lyj.zj.gov.cn/art/2022/2/11/art_1277845_59025920.html (accessed on 28 October 2025).
  40. Quanzhou Forestry Bureau. The White Paper “China’s 20 Years of Returning Farmland to Forest and Grassland” Was Released. 2020. Available online: https://lyj.quanzhou.gov.cn/zwgk/lydt/lyyw/202007/t20200703_2380461.htm (accessed on 28 October 2025).
  41. National Development and Reform Commission. Planning of the Beijing-Tianjin Sandstorm Source Control Program (2001–2010). 2007. Available online: https://www.ndrc.gov.cn/fggz/fzzlgh/gjjzxgh/200709/t20070928_1196575.html (accessed on 28 October 2025).
  42. The Central People’s Government of the People’s Republic of China. Notice on the Assignment of the 2003 Task of Returning Grazing Land to Grassland. 2003. Available online: https://www.gov.cn/gongbao/content/2003/content_62103.htm (accessed on 28 October 2025).
  43. Shao, Q. The Dataset for Ecological Benefit Assessment of Major Ecological Projects in China. 2022. Available online: https://www.nesdc.org.cn/theme/index?projectId=636334037e28173e66a7243b (accessed on 28 October 2025).
  44. National Forestry and Grassland Administration. China Forestry and Grassland Statistical Yearbook; China Forestry Publishing House: Beijing, China, 2020. [Google Scholar]
  45. National Bureau of Statistics; Ministry of Ecology and Environment. China Statistical Yearbook on Environment; China Statistics Press: Beijing, China, 2020. [Google Scholar]
  46. Editorial Department of China Environmental Yearbook. China Environment Yearbook; China Environmental Yearbook Society: Beijing, China, 2010. [Google Scholar]
  47. China Afforestation (Greening) Committee. Bulletin on the Status of Land Greening in China; China Afforestation (Greening) Committee: Beijing, China, 2020. [Google Scholar]
  48. Pinzon, J.E.; Pak, E.W.; Tucker, C.J.; Bhatt, U.S.; Frost, G.V.; Macander, M.J. Global Vegetation Greenness (NDVI) from AVHRR GIMMS-3G+, 1981–2022. 2023. Available online: https://www.earthdata.nasa.gov/data/catalog/ornl-cloud-global-veg-greenness-gimms-3g-2187-1 (accessed on 18 November 2024).
  49. Holben, B.N. Characteristics of maximum-value composite images from temporal AVHRR data. Int. J. Remote Sens. 1986, 7, 1417–1434. [Google Scholar] [CrossRef]
  50. Chen, J.; Jönsson, P.; Tamura, M.; Gu, Z.; Matsushita, B.; Eklundh, L. A Simple Method for Reconstructing a High-Quality NDVI Time-Series Data Set Based on the Savitzky–Golay Filter. Remote Sens. Environ. 2004, 91, 332–344. [Google Scholar] [CrossRef]
  51. Piao, S.; Wang, X.; Ciais, P.; Zhu, B.; Wang, T.; Liu, J. Changes in satellite-derived vegetation growth trend in temperate and boreal Eurasia from 1982 to 2006. Glob. Change Biol. 2011, 17, 3228–3239. [Google Scholar] [CrossRef]
  52. Ministry of Finance of the People’s Republic of China; Ministry of Agriculture and Rural Affairs of the People’s Republic of China. Guiding Opinions on the Implementation of the 2011 Grassland Ecological Protection Subsidy and Reward Mechanism Policy. 2011. Available online: https://www.mof.gov.cn/gp/xxgkml/nys/201201/t20120116_2500355.htm (accessed on 13 June 2025).
  53. GEBCO Organization. Available online: https://www.gebco.net/data-products/gridded-bathymetry-data (accessed on 29 October 2024).
  54. Resource and Environmental Science and Data Center. A Dataset of Annual Average Conditions of Meteorological Elements in China. Available online: https://www.resdc.cn/data.aspx?DATAID=378 (accessed on 29 October 2024).
  55. Chinese Academy of Meteorological Sciences. Available online: https://www.camscma.cn/ (accessed on 15 July 2024).
  56. Rose, A.; McKee, J.; Sims, K.; Bright, E.; Reith, A.; Urban, M. LandScan Global 2000–2020. Oak Ridge National Laboratory. 2021. Available online: https://landscan.ornl.gov/ (accessed on 30 October 2024).
  57. Li, Y.; Zhang, D.; Zhang, X.; Peng, J.; Shang, M. A Dataset of 1 km Grid Road Network Density in China (2019). 2019. Available online: https://www.scidb.cn/en/detail?dataSetId=de7e723223f846c3a116c64af291f4a6 (accessed on 17 November 2024).
  58. Nachtergaele, F.; Velthuizen, H.; Verelst, L. Harmonized World Soil Database. 2009. Available online: https://gaez.fao.org/pages/hwsd (accessed on 17 November 2024).
  59. Friedl, M.; Sulla-Menashe, D. MODIS/Terra+Aqua Land Cover Type Yearly L3 Global 500 m SIN grid V061. 2022. Available online: https://ui.adsabs.harvard.edu/abs/2022lp...data..424F/abstract (accessed on 16 October 2025).
  60. Verbesselt, J.; Hyndman, R.; Newnham, G.; Culvenor, D. Detecting trend and seasonal changes in satellite image time series. Remote Sens. Environ. 2010, 114, 106–115. [Google Scholar] [CrossRef]
  61. National Forestry and Grassland Administration. Beijing-Tianjin Sandstorm Source Control Program. 2022. Available online: https://www.forestry.gov.cn/c/www/zxdt/18716.jhtml (accessed on 28 October 2025).
  62. Cai, D.; Ge, Q.; Wang, X.; Liu, B.; Goudie, A.S.; Hu, S. Contributions of ecological programs to vegetation restoration in arid and semiarid China. Environ. Res. Lett. 2020, 15, 114046. [Google Scholar] [CrossRef]
  63. Zhang, Y.; Peng, C.; Li, W.; Tian, L.; Zhu, Q.; Chen, H.; Xiao, X. Multiple afforestation programs accelerate the greenness in the ‘Three North’ region of China from 1982 to 2013. Ecol. Indic. 2016, 61, 404–412. [Google Scholar] [CrossRef]
  64. Li, J.; Liu, H.; Cheng, D.; Zhang, H.; Qi, G.; Wang, W. Vegetation response to climate and human interventions on the Loess Plateau: Trends, variability, and the influence of the Grain for Green Program. Sustainability 2025, 17, 8233. [Google Scholar] [CrossRef]
  65. Wang, J.; Sun, M.; Gao, X.; Zhao, X.; Zhao, Y. Spatial and temporal characteristics of precipitation and potential Influencing factors in the Loess Plateau before and after the implementation of the Grain for Green Project. Water 2021, 13, 234. [Google Scholar] [CrossRef]
  66. Wang, Y.; Hu, W.; Sun, H.; Zhao, Y.; Zhang, P.; Li, Z.; Zhou, Z.; Tong, Y.; Liu, S.; Zhou, J.; et al. Soil Moisture decline in China’s Monsoon Loess critical zone: More a result of land-use conversion than climate change. Proc. Natl. Acad. Sci. USA 2024, 121, e2322127121. [Google Scholar] [CrossRef]
  67. Wang, D.; Ziegler, A.D.; Holden, J.; Spracklen, D.V.; Ciais, P.; Peng, L.; Zeng, Z. Vegetation cover change as a growing driver of global leaf area index dynamics. Nat. Commun. 2025, 16, 9259. [Google Scholar] [CrossRef] [PubMed]
  68. Fan, X.; Gao, P.; Tian, B.; Wu, C.; Mu, X. Spatio temporal patterns of NDVI and its influencing factors based on the ESTARFM in the Loess Plateau of China. Remote Sens. 2023, 15, 2553. [Google Scholar] [CrossRef]
  69. He, J.; Shi, X. Detection of social ecological drivers and impact thresholds of ecological degradation and ecological restoration in the last three decades. J. Environ. Manag. 2022, 318, 115513. [Google Scholar] [CrossRef]
  70. Wang, W.; Chen, Y.; Du, Z.; Zhang, Q.; Ye, T. Ecological restoration zoning and its driving factors in Beijing-Tianjin-Hebei based on landscape ecological risk and ecosystem services. Ecol. Indic. 2025, 178, 114086. [Google Scholar] [CrossRef]
  71. Lai, S.; Li, X.; Jiang, W.; Li, F.Y.; Wu, H.; Zhang, Z.; Li, Z. Evaluating the sustainability of ecological quality in Inner Mongolia Autonomous Region: Bridging the millennium development goals and sustainable development goals. Land Degrad. Dev. 2025, in press. [CrossRef]
  72. Zhang, Y.; Zhang, L.; Wang, J.; Dong, G.; Wei, Y. Quantitative analysis of NDVI driving factors based on the geographical detector model in the Chengdu-Chongqing region, China. Ecol. Indic. 2023, 155, 110978. [Google Scholar] [CrossRef]
  73. Gu, Z.; Chen, X.; Ruan, W.; Zheng, M.; Gen, K.; Li, X.; Liu, M. Quantifying the direct and indirect effects of terrain, climate and human activity on the spatial pattern of kNDVI-based vegetation growth: A case study from the Minjiang River Basin, Southeast China. Ecol. Inform. 2024, 80, 102493. [Google Scholar] [CrossRef]
  74. Wang, J.; Xu, C. Geodetector: Principle and prospective. Acta Geogr. Sin. 2017, 72, 116–134. [Google Scholar] [CrossRef]
  75. Hei, Y.; Sui, Y.; Gao, W.; Zhao, M.; Hu, M.; Gao, M. Geodetector-based analysis of spatiotemporal distribution characteristics and influencing mechanisms for rural homestays in Beijing. Land 2025, 14, 997. [Google Scholar] [CrossRef]
  76. Zhang, J.; Lu, Z.; Zhou, J.; Qin, G.; Bai, Y.; Sanders, C.J.; Macreadie, P.I.; Yuan, J.; Huang, X.; Wang, F. Getting the best of carbon bang for mangrove restoration buck. Nat. Commun. 2025, 16, 1297. [Google Scholar] [CrossRef] [PubMed]
  77. Gao, F.; Zhou, J.; Jiang, H.; Yang, W.; Wang, G. Assessing the true value of ecological restoration in mining areas: An input output approach based on ecosystem service valuation. Ecol. Indic. 2024, 166, 112591. [Google Scholar] [CrossRef]
  78. Hu, Z.; Kong, D.; Jin, L. Grassland eco-compensation: Rate differentiations of “Reward for Balanced Grazing” and its reasons. Chin. J. Popul. Resour. 2015, 25, 152–159. Available online: https://cohd.cau.edu.cn/module/download/downfile.jsp?classid=0&filename=1604271154396271595.pdf (accessed on 5 November 2024).
  79. Dou, Y.; Tong, X.; Horion, S.; Feng, L.; Fensholt, R.; Shao, Q.; Tian, F. The success of ecological engineering projects on vegetation restoration in China strongly depends on climatic conditions. Sci. Total Environ. 2024, 915, 170041. [Google Scholar] [CrossRef] [PubMed]
  80. Wen, Q.; Chen, H. Changes in drought characteristics over China during 1961–2019. Front. Earth Sci. 2023, 11, 1138795. [Google Scholar] [CrossRef]
  81. Gou, Y.; Tao, Y.; Kou, P.; Alonso, A.; Luo, X.; Tian, H. Elucidate the complex drivers of significant greening on the Loess Plateau from 2000 to 2020. Environ. Dev. 2024, 50, 100991. [Google Scholar] [CrossRef]
  82. Ren, Y.; Wang, H.; Yang, K.; Li, W.; Hu, Z.; Ma, Y.; Qiao, S. Vegetation productivity slowdown on the Tibetan Plateau around the late 1990s. Geophys. Res. Lett. 2024, 51, e2023GL103865. [Google Scholar] [CrossRef]
  83. Wei, Y.; Lu, H.; Wang, J.; Wang, X.; Sun, J. Dual influence of climate change and anthropogenic activities on the spatiotemporal vegetation dynamics over the Qinghai-Tibetan Plateau from 1981 to 2015. Earth’s Future 2022, 10, e2021EF002566. [Google Scholar] [CrossRef]
  84. Yang, D.; Liu, Y. Heterogeneous impacts of human activities and climate change on transformed vegetation dynamics on the Qinghai-Tibet Plateau. J. Environ. Manag. 2025, 392, 126575. [Google Scholar] [CrossRef]
  85. Shao, Q.; Fan, J.W.; Liu, J.Y.; Huang, L.; Cao, W.; Xu, X.; Ge, J.; Wu, D.; Li, Z.; Gong, G.; et al. Assessment on the effects of the first stage ecological conservation and restoration project in Sanjiangyuan Region. Acta Geogr. Sin. 2016, 71, 3–20. [Google Scholar] [CrossRef]
  86. Yin, L.; Dai, E.; Zheng, D.; Wang, Y.; Ma, L.; Tong, M. What drives the vegetation dynamics in the Hengduan Mountain Region, southwest China: Climate change or human activity? Ecol. Indic. 2020, 112, 106013. [Google Scholar] [CrossRef]
  87. Zhang, Y.; Ye, A. Quantitatively distinguishing the impact of climate change and human activities on vegetation in mainland China with the improved residual method. GISci. Remote Sens. 2021, 58, 235–260. [Google Scholar] [CrossRef]
  88. Li, Z.; Wang, S.; Li, C.; Ye, C.; Gao, D.; Chen, P. The trend shift caused by ecological restoration accelerates the vegetation greening of China’s drylands since the 1980s. Environ. Res. Lett. 2022, 17, 044062. [Google Scholar] [CrossRef]
  89. Shi, S.; Yu, J.; Wang, F.; Wang, P.; Zhang, Y.; Jin, K. Quantitative contributions of climate change and human activities to vegetation changes over multiple time scales on the Loess Plateau. Sci. Total Environ. 2021, 755, 142419. [Google Scholar] [CrossRef]
  90. Zhang, Y.; Zhao, X.; Gong, J.; Luo, F.; Pan, Y. Effectiveness and driving mechanism of ecological restoration efforts in China from 2009 to 2019. Sci. Total Environ. 2024, 910, 168676. [Google Scholar] [CrossRef]
  91. McVicar, T.R.; Li, L.; Van Niel, T.G.; Zhang, L.; Li, R.; Yang, Q.; Zhang, X.; Mu, X.; Wen, Z.; Liu, W.; et al. Developing a decision support tool for China’s re-vegetation program: Simulating regional impacts of afforestation on average annual streamflow in the Loess Plateau. For. Ecol. Manag. 2007, 251, 65–81. [Google Scholar] [CrossRef]
  92. Cao, S.; Xia, C.; Suo, X.; Wei, Z. A framework for calculating the net benefits of ecological restoration programs in China. Ecosyst. Serv. 2021, 50, 101325. [Google Scholar] [CrossRef]
  93. Feng, X.; Fu, B.; Piao, S.; Wang, S.; Ciais, P.; Zeng, Z.; Lü, Y.; Zeng, Y.; Li, Y.; Jiang, X.; et al. Revegetation in China’s Loess Plateau is approaching sustainable water resource limits. Nat. Clim. Change 2016, 6, 1019–1022. [Google Scholar] [CrossRef]
  94. Wang, Y.; Shao, M.; Zhu, Y.; Liu, Z. Impacts of land use and plant characteristics on dried soil layers in different climatic regions on the Loess Plateau of China. Agric. For. Meteorol. 2011, 151, 437–448. [Google Scholar] [CrossRef]
  95. Zhang, S.; Yang, D.; Yang, Y.; Piao, S.; Yang, H.; Lei, H.; Fu, B. Excessive afforestation and soil drying on China’s Loess Plateau. J. Geophys. Res. Biogeosci. 2018, 123, 923–935. [Google Scholar] [CrossRef]
  96. Xue, Z.; Kappas, M.; Wyss, D. Spatio-Temporal Grassland Development in Inner Mongolia after Implementation of the First Comprehensive Nation-Wide Grassland Conservation Program. Land 2021, 10, 38. [Google Scholar] [CrossRef]
  97. Byrne, A.T.; Hadrich, J.C.; Robinson, B.E.; Han, G. A factor-income approach to estimating grassland protection subsidy payments to livestock herders in Inner Mongolia, China. Land Use Policy 2020, 91, 104352. [Google Scholar] [CrossRef]
  98. Zhu, J.; Xu, X.; Li, T.; Liu, Y.; Yang, Y.; Cui, X. Fundamental strategic shift required by the expensive ecological policy in Chinese grasslands. J. Resour. Ecol. 2022, 13, 955–963. [Google Scholar] [CrossRef]
  99. Zhou, L.; Hou, C. Key problems of grassland utilization and the graze ban policy in farming-pastoral ecotone of Northern China. Arid Land Geogr. 2019, 42, 354–362. Available online: http://alg.xjegi.com/EN/10.12118/j.issn.1000-6060.2019.02.15 (accessed on 5 November 2024).
  100. Song, M.; Tian, Y.; Li, Y.; Xu, X.; Zheng, L.; Zhou, H.; Kuzyakov, Y.; Wang, G.; Zhang, Y.; Cornelissen, J.H.C. Loss of taxonomic and functional diversity and decrease in primary productivity with nitrogen enrichment after a long-term release from grazing in an alpine grassland. Sci. Total Environ. 2024, 957, 177570. [Google Scholar] [CrossRef]
  101. Ren, J. Grazing, the basic form of grassland ecosystem and its transformation. J. Nat. Resour. 2012, 27, 1259–1275. [Google Scholar] [CrossRef]
  102. Ju, W.; Fang, L.; Shen, G.; Delgado-Baquerizo, M.; Chen, J.; Zhou, G.; Ma, D.; Bing, H.; Liu, L.; Liu, J. New perspectives on microbiome and nutrient sequestration in soil aggregates during long-term grazing exclusion. Glob. Change Biol. 2024, 30, e17027. [Google Scholar] [CrossRef] [PubMed]
  103. Peacock, R.; Bently, M.; Rees, P.; Blignaut, J.N. The benefits of ecological restoration exceed its cost in South Africa: An evidence-based approach. Ecosyst. Serv. 2023, 61, 101528. [Google Scholar] [CrossRef]
  104. Mirzabaev, A.; Sacande, M.; Motlagh, F.; Shyrokaya, A.; Martucci, A. Economic efficiency and targeting of the African Great Green Wall. Nat. Sustain. 2022, 5, 17–25. [Google Scholar] [CrossRef]
  105. Lucchesi, A.; Khanna, M.; Pereda, P.C.; Ussami, K.A.; Ruggiero, P.G.; Dornelas, V.S.; Lallement, T. Araguaia Biodiversity Corridor cost benefit analysis: Large scale restoration and sustainable agribusiness in Amazon and Cerrado. Land Use Policy 2024, 141, 107122. [Google Scholar] [CrossRef]
  106. Reij, C.; Pasiecznik, N.; Mahamoudou, S.; Kassa, H.; Winterbottom, R.; Livingstone, J. Dryland restoration successes in the Sahel and Greater Horn of Africa show how to increase scale and impact. ETFRN News 2020, 60, 1–24. Available online: https://hdl.handle.net/10568/111706 (accessed on 25 October 2025).
  107. Busch, J.; Bukoski, J.J.; Cook-Patton, S.C.; Griscom, B.; Kaczan, D.; Potts, M.D.; Yi, Y.; Vincent, J.R. Cost-effectiveness of natural forest regeneration and plantations for climate mitigation. Nat. Clim. Change 2024, 14, 996–1002. [Google Scholar] [CrossRef]
  108. Birch, J.C.; Newton, A.C.; Aquino, C.A.; Cantarello, E.; Echeverría, C.; Kitzberger, T.; Schiappacasse, I.; Garavito, N.T. Cost-effectiveness of dryland forest restoration evaluated by spatial analysis of ecosystem services. Proc. Natl. Acad. Sci. USA 2010, 107, 21925–21930. [Google Scholar] [CrossRef]
  109. Gao, J.; Wang, Y.; Zou, C.; Xu, D.; Lin, N.; Wang, L.; Zhang, K. China’s ecological conservation redline: A solution for future nature conservation. Ambio 2020, 49, 1519–1529. [Google Scholar] [CrossRef] [PubMed]
  110. Zhang, M.; Liu, S.; Luo, X.; Keenan, T.F.; Fu, L.; Xiao, C.; Zhang, Y.; Gong, P. Incorporating site suitability and carbon sequestration of tree species into China’s climate adaptive forestation. Sci. Bull. 2025, 70, 1834–1845. [Google Scholar] [CrossRef]
  111. Holl, K.D.; Brancalion, P.H. Tree planting is not a simple solution. Science 2020, 368, 580–581. [Google Scholar] [CrossRef] [PubMed]
  112. Liu, X.; Zhang, L.; Wu, P.; Deng, H. A new small-scale system of rainwater harvesting combined with irrigation for afforestation in mine area: Optimizing design and application. J. Environ. Manag. 2022, 322, 116129. [Google Scholar] [CrossRef]
  113. Fu, F.; Wang, X.; Chen, S.; Tan, Z.; Ye, C.; Grünzweig, J. Integrating hydrological impacts for cost-effective dryland ecological restoration. Commun Earth Environ 2025, 6, 667. [Google Scholar] [CrossRef]
  114. Li, T.; Li, S.; Zhao, Y.; Zheng, H.; Wang, K.; Yi, M. Multi-objective decision-making considering future demands helps to delineate key areas for ecological restoration in Changsha-Zhuzhou-Xiangtan urban agglomeration, China. J. Environ. Manag. 2025, 381, 125176. [Google Scholar] [CrossRef] [PubMed]
  115. Zhao, Y.; Liu, S.; Liu, H.; Wang, F.; Dong, Y.; Wu, G.; Li, Y.; Wang, W.; Tran, L.; Li, W. Multi-objective ecological restoration priority in China: Cost-benefit optimization in different ecological performance regimes based on planetary boundaries. J. Environ. Manag. 2024, 356, 120701. [Google Scholar] [CrossRef] [PubMed]
  116. Hou, S.; Yang, R.; Zhao, Z.; Cao, Y.; Tseng, T.; Wang, F.; Wang, H.; Wang, P.; Wang, X.; Yu, L. A cost-effective approach to identify conservation priority for 30 × 30 biodiversity target on the premise of food security. Sci. Total Environ. 2024, 941, 172870. [Google Scholar] [CrossRef] [PubMed]
  117. Wang, H.; He, M.; Ran, N.; Xie, D.; Wang, Q.; Teng, M.; Wang, P. China’s key forestry ecological development programs: Implementation, environmental impact and challenges. Forests 2021, 12, 101. [Google Scholar] [CrossRef]
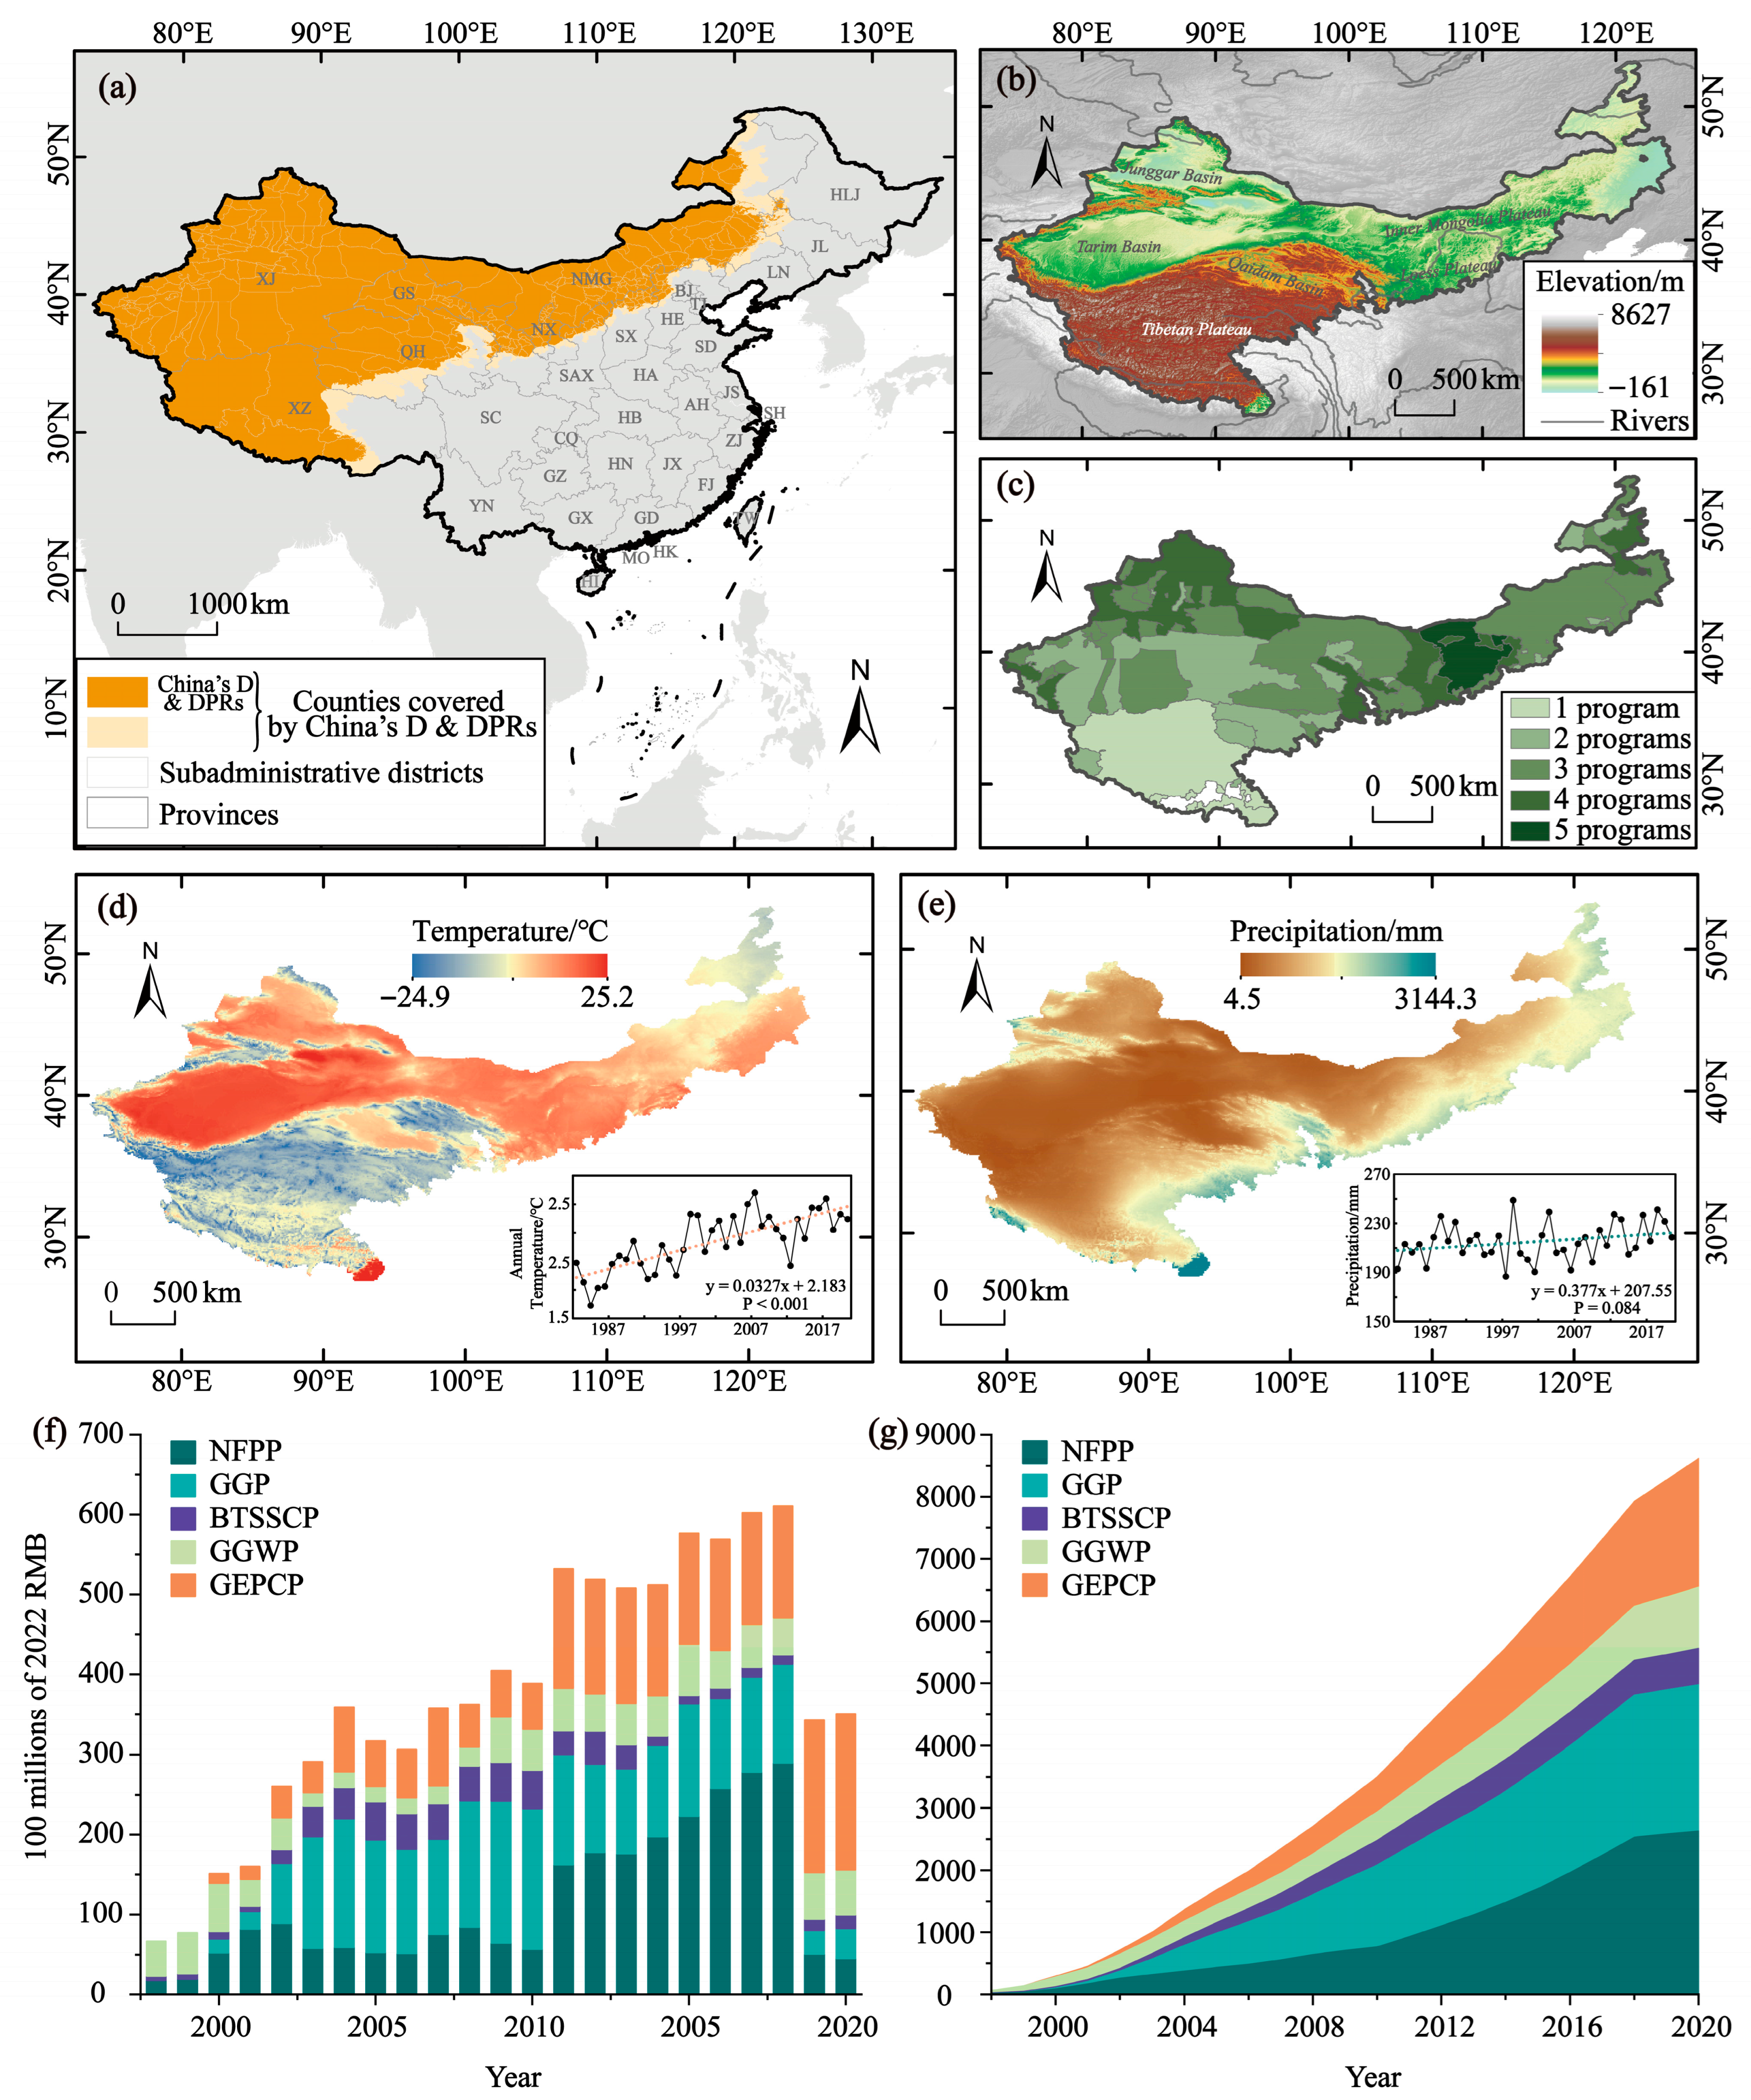
Figure 1. (a) Location and scope of China’s desert and desertification-prone regions (D & DPRs). (b) Elevation of China’s D & DPRs. (c) Coverage of ecological restoration programs in China’s D & DPRs. (d,e) Spatial distribution and time series of the annual temperature (d) and precipitation (e). (f,g) Investment in ecological restoration programs in 12 provinces of China’s D & DPRs ((f) annual investment; (g) accumulative investment). Note: Abbreviations of the provinces are established as follows: Beijing (BJ), Tianjin (TJ), Hebei (HE), Heilongjiang (HJL), Jilin (JL), Liaoning (LN), Inner Mongolia (NMG), Shanxi (SX), Shaanxi (SAX), Gansu (GS), Ningxia (NX), Qinghai (QH), Xinjiang (XJ), Shanghai (SH), Jiangsu (JS), Shandong (SD), Henan (HA), Anhui (AH), Zhejiang (ZJ), Fujian (FJ), Jiangxi (JX), Guangdong (GD), Hunan (HN), Hubei (HB), Chongqing (CQ), Guizhou (GZ), Guangxi (GX), Sichuan (SC), Yunnan (YN), Xizang (XZ), Hainan (HI), Hongkong (HK), Macao (MO), and Taiwan (TW). Abbreviations of the ecological restoration programs are established as follows: Great Green Wall Program (GGWP), Natural Forest Protection Program (NFPP), Grain for Green Program (GGP), Beijing-Tianjin Sandstorm Source Control Program (BTSSCP), and Grassland Ecological Protection and Construction Program (GEPCP).
Land 14 02220 g001
Figure 2. Research framework.
Land 14 02220 g002
Figure 3. Classification of BFAST detection results ((a) accelerated greening, (b) decelerated greening, (c) greening to degradation, (d) degradation to greening, (e) decelerated degradation, (f) accelerated degradation). Blue and red dots represent GSN values before and after the turning points, respectively. Blue and red lines represent the monotonic trend before and after the turning points, respectively. The shaded areas denote the 95% confidence intervals.
Land 14 02220 g003
Figure 4. Spatial and temporal distribution of turning points detected in China’s D & DPRs. (a) Spatial distribution of turning point types. (b) Spatial distribution of turning point years. (c) Temporal distribution of turning point years (the colored bars represent the area ratio for the corresponding turning point year) and change in Growing season NDVI (GSN).
Land 14 02220 g004
Figure 5. (ac) Spatial distribution of vegetation trends in different periods ((a) 1982–2020, (b) 1982–1998, (c) 1999–2020, (e) 1999–2010, (f) 2011–2020) in China’s D & DPRs. (d) The differences in the GSN trend slope between 1982–1998 and 1999–2020.
Land 14 02220 g005
Figure 6. The spatial distribution of the regression coefficients between GSN with temperature (a), precipitation (b) and atmospheric CO2 concentration (c). (d) The spatial distribution of the regression intercept. The black area indicates that there is no significant relationship between GSN and variables.
Land 14 02220 g006
Figure 7. (a) Spatial distribution of human-driven GSN trends including ecological restoration effect (b) and other anthropogenic effect (c) in China’s D & DPRs. (d,e) Spatial distribution of human-driven GSN trends from 1999 to 2010 (d) and from 2011 to 2020 (e). (f) Spatial distribution and composition of average ecological restoration effects in China’s D & DPRs. Note: See Figure 1 for the abbreviations and full names of the provinces.
Land 14 02220 g007
Figure 8. Interaction effects of influencing factors for the ecological restoration effect in China’s D & DPRs.
Land 14 02220 g008
Figure 9. (a) Spatial distribution of average ecological restoration effects in China’s D & DPRs. (bj) represent the spatial distribution of the influencing factors of the ecological restoration effects.
Land 14 02220 g009
Figure 10. (a) Spatial and statistical distribution of the cost-effectiveness levels at the county scale in China’s D & DPRs (municipal scale in Tibet due to data incompleteness). (b) Sensitivity map for cost-effectiveness classification in China’s D & DPRs. (c) The composition of cost-effectiveness levels in different provinces in China’s D & DPRs (HJL refers to Heilongjiang, Jilin, and Liaoning Provinces).
Land 14 02220 g010
Table 1. Introduction of ecological restoration programs in China.
Program NameProgram AimsProvinces IncludedPeriodCountermeasuresProgram
Investment/Billion Yuan
GGWPPlant 35.08 million ha of forest;
Raise 33.38 million ha of forest;
Transform 1.97 million ha of low-yield forest;
Regenerate 6.29 million ha of forest;
Increase forest coverage to 14.95% by 2050.
BJ, TJ, HE, SX, SAX, NMG, LN, JL, HLJ, GS, NX, QH, XJ 1978–2050(1) Afforestation, (2) Closing hillsides to facilitate afforestation and sandy land protection, (3) Artificial glass planting in grassland, (4) Transformation for low-yield forest, (5) Forest regeneration306.56
NFPPProtect and restore natural forest resources;
Meet domestic demand for wood through plantation.
NMG, HLJ, JL, HI, CQ, SC, GZ, YN, HB, XZ, SX, SAX, GS, NX, QH, XJ, HN1998–2035(1) Afforestation, (2) Forest management and conservation, (3) Ecological benefit compensation416.21
GGPBy 2020, transform qualified sloping farmland and severely desertified farmland into forest or grassland;
Gradually remove the steep slopes above 25 °C which are unsuitable for cultivation and harmful to ecology from basic cropland.
HJL, JL, LN, NMG, BJ, TJ, HE, HA, AH, HB, HN, JX, HI, CQ, SC, GZ, YN, GX, SX, SAX, GS, NX, QH, XJ, XZ1999–2020(1) Grain for green, (2) Afforestation, (3) Seeding, (4) Subsidy539.16
BTSSCPBy 2010, transform 2.63 million ha of farmland into forest, plant 4.94 million ha of forest, and manage more than 10.63 million ha of grassland;
By 2022, plant 3.58 million ha of forest and facilitate the relocation of 370,400 people; 20.17 million ha of grasslands implement grazing prohibition; 3.56 million ha of grasslands implement fencing and enclosing.
BJ, TJ, HE, SX, NMG, SAX1998–2022(1) Afforestation, (2) Sand control by science and technology, (3) Grassland management, (4) Ecological migration66.18
GEPCPAccelerate the restoration of grassland ecology;
Accelerate the transformation of grassland graziery production methods;
Promote the sustained increase in herdsmen’s income.
NMG, GS, NX, XJ, XZ, QH, SC, YN, HE, SX, LN, JL, HLJ2003–2020(1) Grazing prohibition, subsiding to farmers and herdsmen, (2) Forage-livestock balance, (3) Grassland fencing and enclosing240.55
Notes: 1. The aims, period, and countermeasures of each ecological program were sourced from official announcements and reports issued by government departments, such as the Forestry and Grassland Administration, the National Development and Reform Commission, and the Ministry of Finance [38,39,40,41,42]. 2. Information on the provincial coverage of each ecological program was obtained from the National Ecological Science Data Center [43]. 3. Investment data for each ecological program were derived from publications including the official yearbooks and government reports [44,45,46,47]. See Figure 1 for the abbreviations and full names of the provinces and the programs.
Table 2. Auxiliary data sources.
DataTypeTime RangeSource
DEMRaster
(500 m)
2020GEBCO organization [53]
SlopeRaster
(500 m)
2020Calculated according to elevation
Sunshine durationRaster
(1 km)
2000–2020Resource and Environmental Science and Data Center [54]
Dust days at stationsVector
(point)
2000–2020Chinese Academy of Meteorological Sciences [55]
Population densityRaster
(1 km)
2000–2020Oak Ridge National Laboratory [56]
Road densityRaster
(1 km)
2019Science Data Bank [57]
Soil organic matter contentRaster
(1 km)
2023Harmonized World Soil Database [58]
Land coverRaster
(500 m)
2001–2020NASA Land Processes Distributed Active Archive Center [59]
Land use intensityRaster
(500 m)
2001–2020Calculated according to Land cover
Table 3. Potential influencing factors of ecological restoration effect.
CategoryIndicatorUnitVariable
TopographyElevationmX1
Slope°X2
ClimateSunshine DurationhX3
Dust DaysdayX4
SocialPopulationpersonX5
Road Densitykm/km2X6
Afforestation Area Percentage%X7
Land Use IntensityN/AX8
SoilSoil Organic Matter Content%X9
Note: N/A represents no unit.
Table 4. Influencing factors of ecological restoration effect.
VariablesQ-statistic
Population (X5)0.215 ***
Road Density (X6)0.214 ***
Afforestation Area Percentage (X7)0.177 ***
Dust days (X4)0.135 ***
Soil organic matter content (X9)0.133 ***
Land Use Intensity (X8)0.131 ***
Elevation (X1)0.088 ***
Sunshine duration (X3)0.068 ***
Slope (X2)0.044 ***
Note: *** denote p < 0.001.
Disclaimer/Publisher’s Note: The statements, opinions and data contained in all publications are solely those of the individual author(s) and contributor(s) and not of MDPI and/or the editor(s). MDPI and/or the editor(s) disclaim responsibility for any injury to people or property resulting from any ideas, methods, instructions or products referred to in the content.