Article

Driving Forces of Ecosystem Transformation in Extremely Arid Areas: Insights from Hami City in Xinjiang, China

1
College of Ecology and Environment, Xinjiang University, Urumqi 830046, China
2
Key Laboratory of Oasis Ecology Ministry of Education, Xinjiang University, Urumqi 830046, China
3
Xinjiang Jinghe Observation and Research Station of Temperate Desert Ecosystem, Ministry of Education, Bole 833300, China
*
Author to whom correspondence should be addressed.
Land 2025, 14(11), 2212; https://doi.org/10.3390/land14112212 (registering DOI)
Submission received: 10 October 2025 / Revised: 5 November 2025 / Accepted: 6 November 2025 / Published: 8 November 2025

Abstract

Global ecosystems have undergone significant degradation and deterioration, making the identification of ecosystem changes essential for promoting sustainable development and enhancing quality of life. Hami City, a representative region characterized by the complex “desert–oasis–mountain” ecosystem in Xinjiang, China, provides a critical context for examining ecosystem changes in extremely arid environments. This study utilizes remote sensing data alongside the Revised Wind Erosion Equation and Revised Universal Soil Loss Equation models to analyze the transformations within the desert–oasis ecosystems of Hami City and their driving forces. The findings reveal that (1) over the past 24 years, there have been substantial alterations in the ecosystem patterns of Hami City, primarily marked by an expansion of cropland and grassland ecosystems and a reduction in desert ecosystems. (2) Between 2000 and 2023, there has been an upward trend in Fractional Vegetation Cover, Net Primary Productivity, and windbreak and sand fixation amount in Hami City, whereas soil retention has shown a declining trend. (3) The overall ecosystem change in Hami City is moderate, encompassing 61.85% of the area, with regions exhibiting positive change comprising 16.79% and those with negative change comprising 21.33%. (4) Temperature, precipitation, and evapotranspiration are the primary drivers of ecosystem change in Hami City. Although the overall changes in ecosystems in Hami City have shown an improving trend, significant spatial heterogeneity still exists. The natural climatic conditions of Hami City constrain the potential for further ecological improvement. This study enhances the understanding of ecosystem change processes in extremely arid regions and demonstrates that strategies for mitigating or adapting to climate change need to be implemented as soon as possible to ensure the sustainable development of ecosystems in arid areas.

1. Introduction

The continuous advancement of urbanization and the increasing intensity of human activities have exerted tremendous pressure on natural ecosystems, resulting in a series of ecological problems, including soil erosion [1], biodiversity loss [2], and habitat fragmentation [3]. Ecosystems around the world have undergone severe degradation and disruption. As a result of intense disturbances caused by rapid urbanization and industrialization, these ecosystems have been transformed into highly anthropogenic coupled natural–social–economic systems [4]. The ecological environment is gradually becoming a key factor limiting the sustainable development of China’s economy and society [5]. With the ongoing modernization of industrial and agricultural technologies, the degradation of ecosystems has been increasingly intensified, and the importance of ecosystems has gradually attracted more attention. Identifying changes in ecosystems is crucial for ensuring China’s sustainable development and improving the quality of life of its population.
Ecosystem change assessment evaluates the processes of structural, functional, and service changes that occur in ecosystems over specific spatial and temporal scales. Ecosystem change assessment primarily focuses on two aspects: ecosystem restoration assessment and ecosystem resilience assessment. The former evaluates ecosystem changes from the perspective of regional ecological restoration projects, based on multi-level indicators encompassing natural, economic, and social dimensions. The latter assesses ecosystem changes from the perspective of ecosystem status, focusing on ecosystem quality, services, and health.
Ecosystems in China are evaluated through health assessment and change analysis [6], the Hulunbuir Grassland ecosystem based on drought risk [7], and oasis ecosystems based on land-use change [8]. Other scholars have investigated the Loess Plateau using both ecosystem health evaluation [9] and ecosystem service assessment [10]. Additional work has addressed urban and industrial systems, such as green competitiveness in cities along the Yangtze River Economic Belt [11] and vulnerability in mining-area industrial ecosystems [12]. Ecological restoration has also been emphasized, with studies evaluating its comprehensive benefits on the Qinghai–Tibet Plateau [13] and its role in vulnerable mining areas of the Yellow River Basin [14]. Collectively, this body of work highlights the broad range of ecological settings and methodological frameworks through which scholars have sought to understand ecosystem changes.
Against the backdrop of active global ecological restoration, current research mainly focuses on the assessment of ecosystem restoration, with research objects primarily involving single ecosystems or simple composite ecosystems. These studies provide scientific evidence on the trajectories of ecosystem evolution in response to ecological restoration initiatives. However, relatively few studies have focused on arid ecosystem changes in regions where ecological restoration projects have not been implemented, or where such projects are small in scale and spatially fragmented. Against the backdrop of active global ecological restoration, current research is primarily focused on ecosystem restoration assessment, with research subjects mostly being single ecosystems or simple composite ecosystems. These studies provide a scientific basis for the evolutionary trajectory of ecosystems under ecological restoration measures. However, research on changes in arid zone ecosystems that have not implemented ecological restoration projects or have small-scale and spatially fragmented projects is relatively scarce. Research on ecosystem changes in extremely arid areas, especially regions without ecological restoration projects, remains very limited. It is necessary to integrate multiple research methods to identify trends and driving mechanisms of typical arid ecosystem changes across appropriate spatial scales for various ecosystem types in order to achieve scientific planning of ecological restoration measures and ultimately realize sustainable development goals.
Hami City is located in the extremely arid region of Xinjiang, China, and has vast desert ecosystems. The extremely arid climate makes it difficult to carry out ecological restoration projects here. How to carry out ecological restoration in such an extremely arid area is an urgent problem that needs to be solved. This study focuses on this typical area of Hami City. Based on the ecosystem service research framework, three categories of indicators were selected: macro-structure of the ecosystem, ecosystem quality, and ecosystem services. Quantitative assessment of ecosystem changes from 2000 to 2023 was conducted using the Sen trend analysis and time series trend analysis methods. The random forest method was used to comprehensively consider natural, economic, and social factors to analyze the driving factors of ecosystem changes. The specific objectives of this study are as follows: (1) to analyze the spatiotemporal dynamics of the macro-structure, quality, and ecosystem services of Hami City’s ecosystem; (2) to assess the degree of ecosystem change; (3) to explore the driving factors of ecosystem change in Hami City.

2. Materials and Methods

2.1. Study Area

Hami City is located in the eastern part of the Xinjiang Uygur Autonomous Region (Figure 1), spanning longitudes 91°06′33″–96°23′00″ E and latitudes 40°52′47″–45°05′33″ N. The region features diverse terrain, including plains, hills, and basins, with a pronounced topographic relief and elevations ranging from 53 m to 4780 m. The area experiences a temperate continental arid climate, with an annual mean temperature of 9.8 °C, average annual precipitation of only 33.8 mm, and annual potential evapotranspiration of 3300 mm. Natural vegetation is sparse, dominated by desert and sparse meadows. Hami City experiences up to 149 days per year with winds of Beaufort scale 8 or higher, and the maximum recorded wind speed reaches 42 m·s−1, corresponding to a force exceeding Beaufort scale 14.
Hami City exhibits a diverse range of ecosystem types, including grassland, forest, desert, farmland, and wetland ecosystems. Groundwater with depths exceeding 200 m, scarce precipitation, and high evapotranspiration make Hami City a typical arid region in China. Forest ecosystems account for only 0.26% of the total area, whereas desert ecosystems cover 77.56%. The extreme scarcity of water resources combined with strong wind conditions results in pronounced ecological challenges in the region.
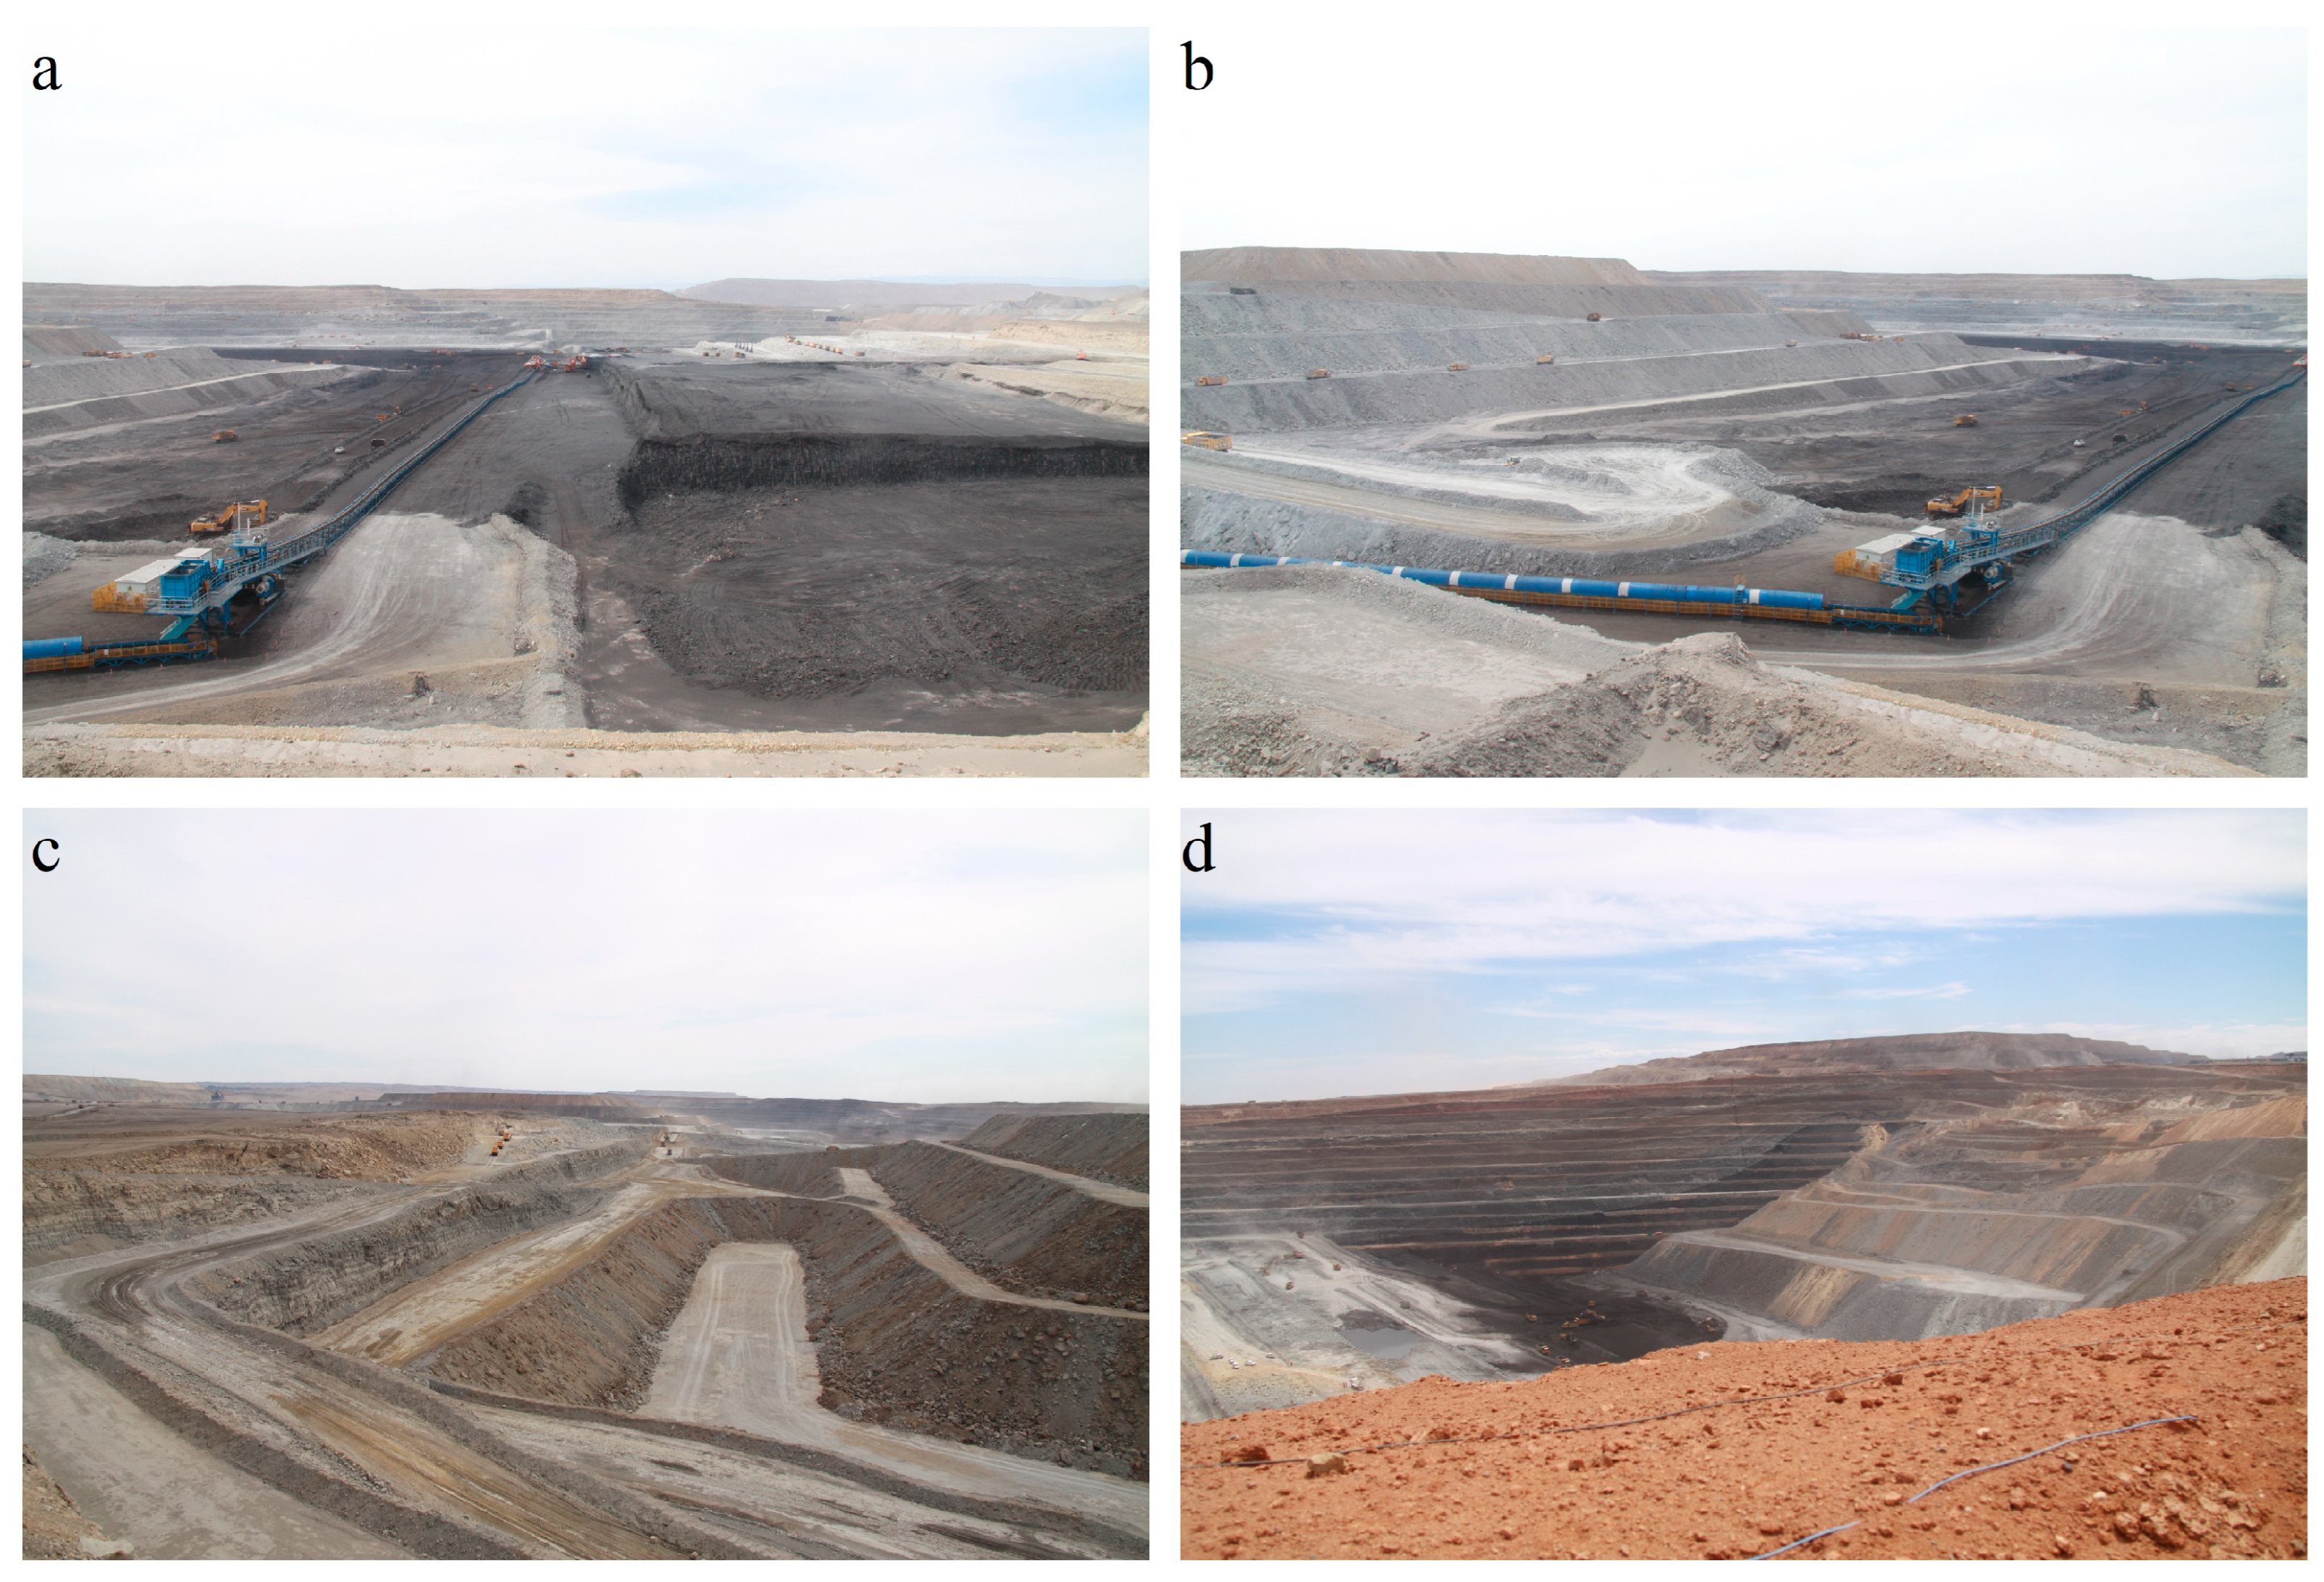
Hami City possesses abundant coal resources, with mining predominantly conducted through open-pit methods. The typical coal mining areas in the northern part of Hami include the Barkol Mine (1245 km2), Santang Lake Mine (6582 km2), and Naomao Lake Mine (2242 km2). In the southern region, major mines include Danan Lake Mine (5653 km2), Yemaquan Mine (800 km2), SandaoLing Mine (663.41 km2), and Shaer Lake Mine (1271 km2). By the end of 2023, the total area under active mining reached 200.46 km2, accounting for 0.15% of Hami City’s total area. The current mining areas are primarily located within desert ecosystems. The annual mean precipitation in these areas is less than 20 mm, vegetation cover is extremely sparse, and the surface is dominated by natural gravel mulch [15]. The coal resources in Hami are characterized by large reserves, concentrated distribution, high quality, and ease of extraction. In 2023, the total coal production in Hami City reached 150 million tons. However, the mining process has also caused certain damage to the local topography and environment. Figure 2 shows field photographs of selected open-pit coal mines in Hami City, illustrating the impacts of mining activities on the local topography and landforms.

2.2. Data Sources

The data used in this study are categorized into five types: vegetation, climate, topography, soil, and human activities. Vegetation data include Fractional Vegetation Cover (FVC) and Net Primary Productivity (NPP); climate data include temperature, precipitation, wind speed, snow cover, and evapotranspiration; topographic data include DEM; soil data include soil moisture, organic carbon content, calcium carbonate content, and the contents of sand, silt, and clay; human activity data include gross domestic product (GDP), population density, and mining area. Data sources and descriptions are provided in Table 1.

2.3. Research Methods and Technology Roadmap

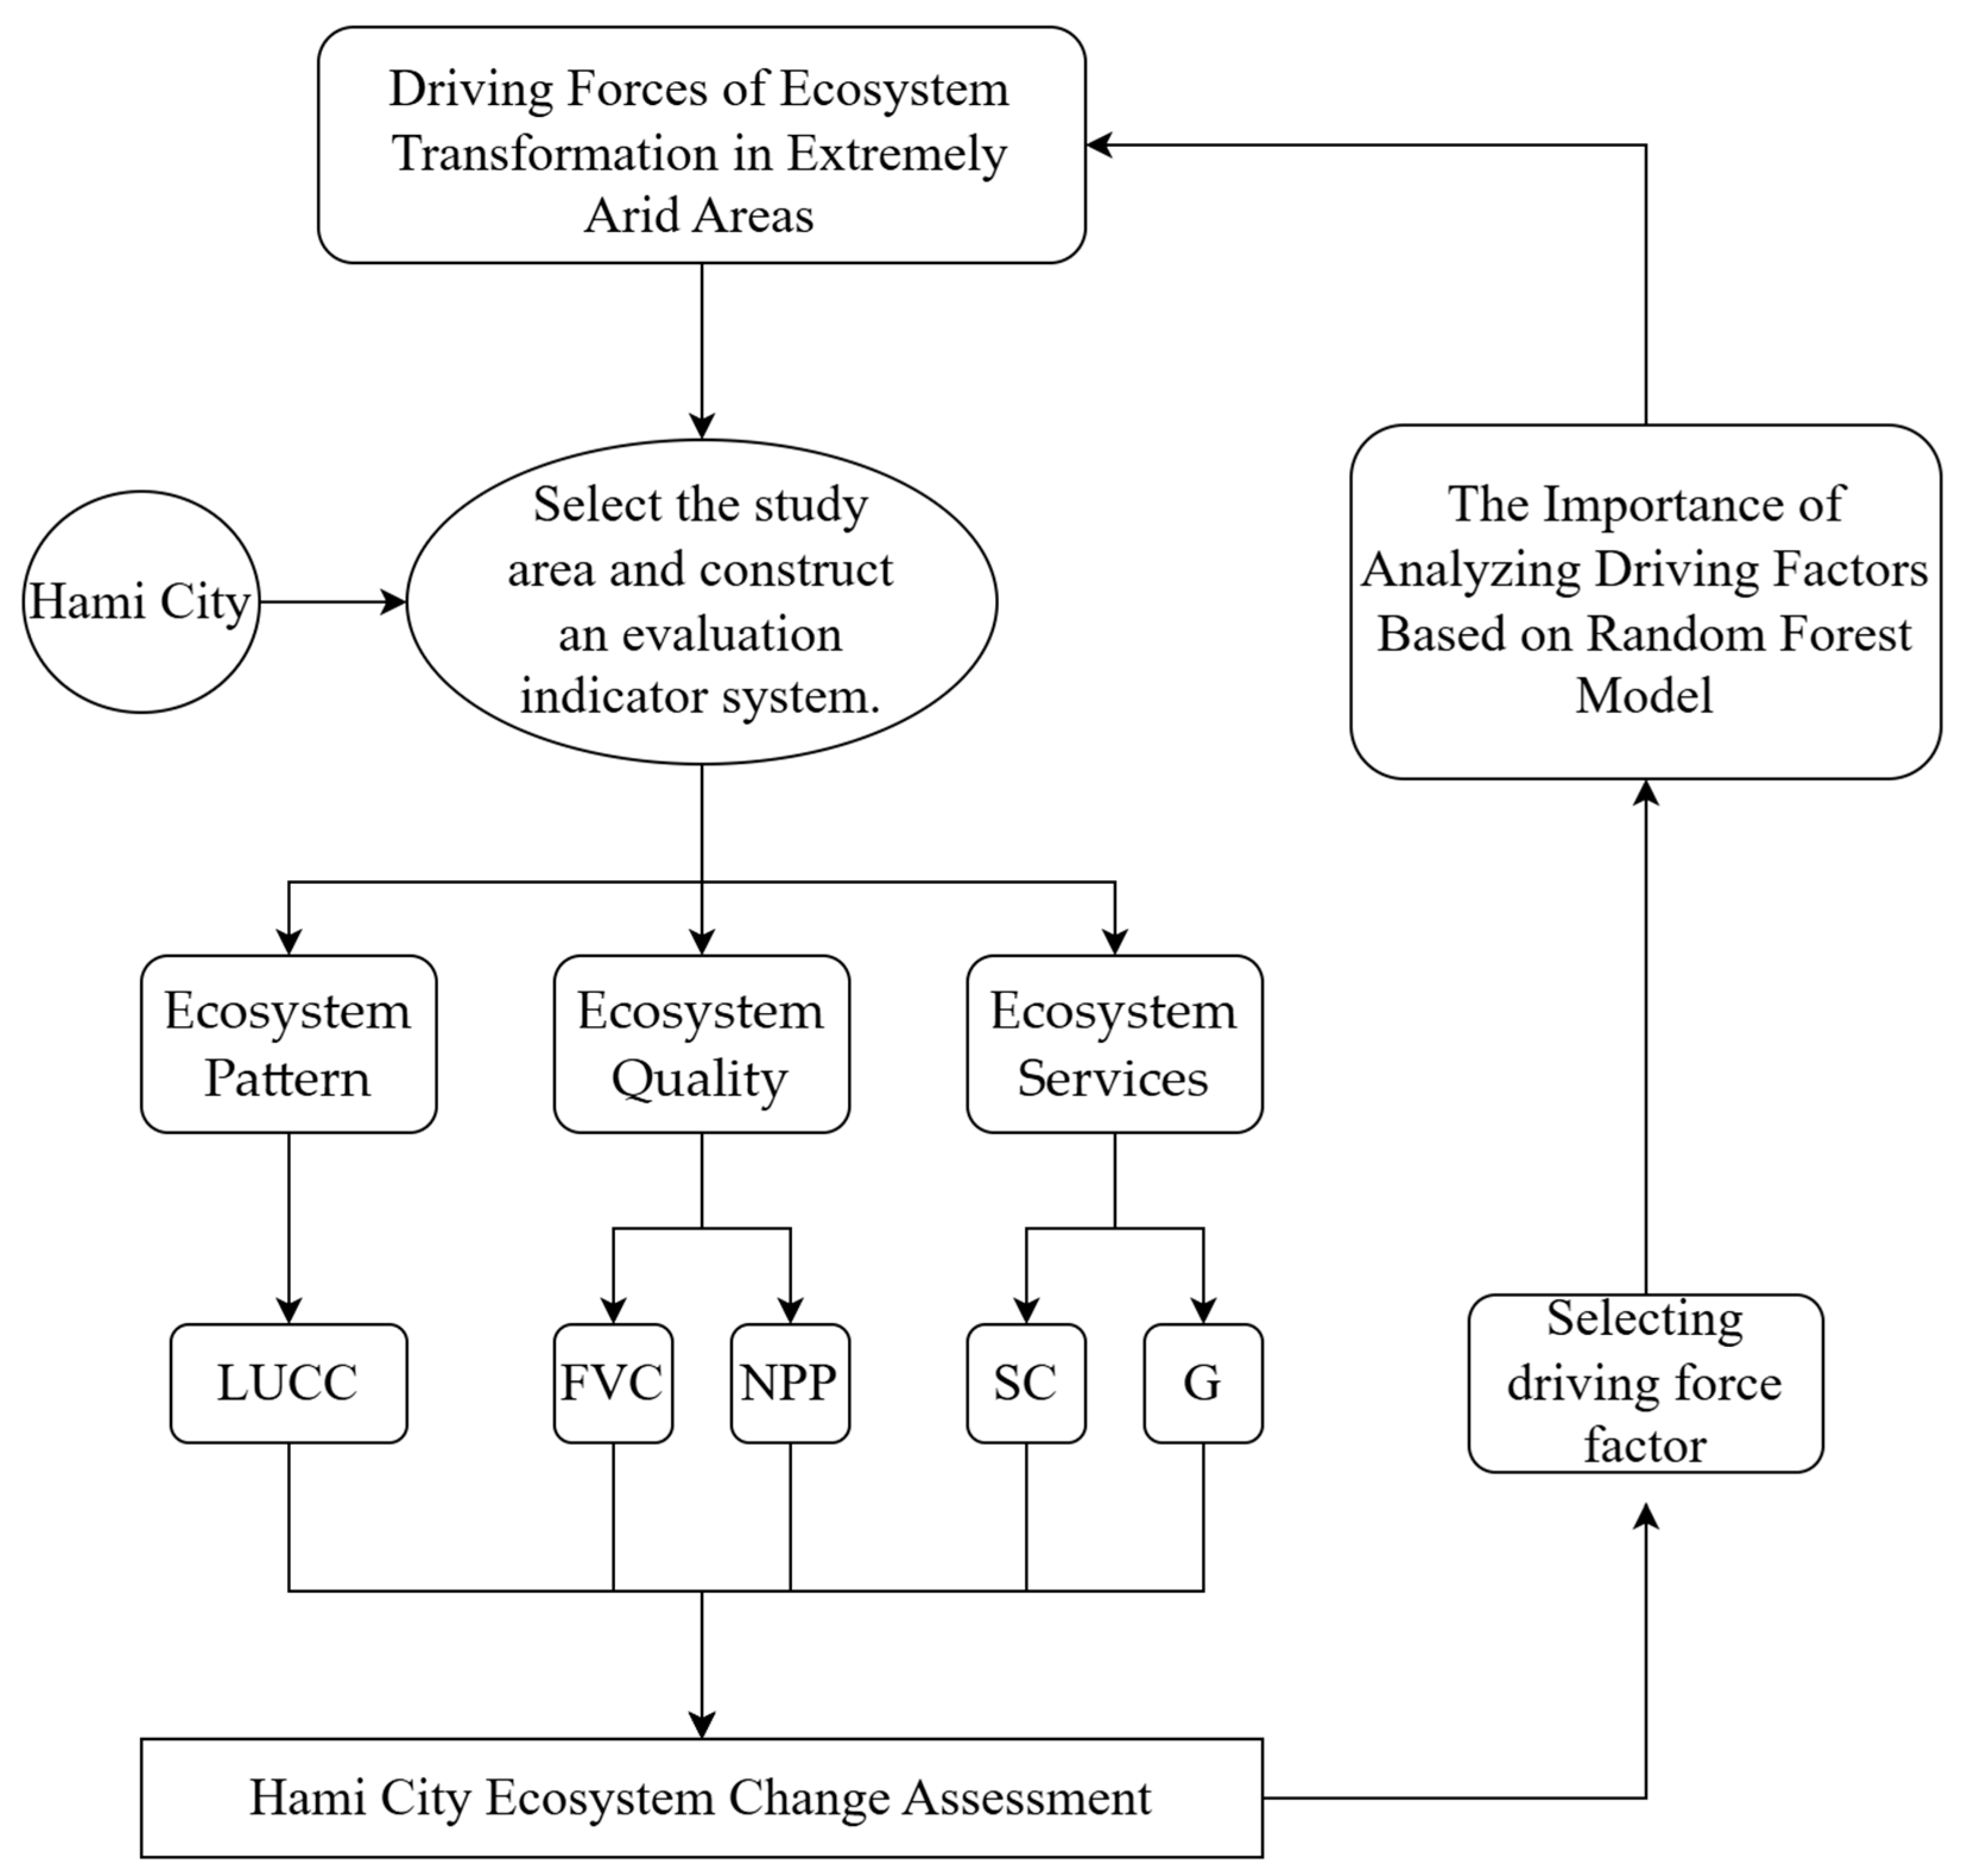
Through the analysis of the diverse and complex ecosystems in Hami City, an evaluation index system for this typical “desert–oasis” ecosystem was established to ensure a balanced and objective assessment of ecosystem change, with reference to the studies of Li [18], Guo [19], and Seth [20]. This indicator system selected 3 major categories—ecosystem pattern, ecosystem quality, and ecosystem services—comprising 5 primary indicators and 9 secondary indicators to construct an evaluation framework for ecosystem changes and conducted a remote-sensing-based assessment of ecosystem changes in Hami City from 2000 to 2023 (Table 2). Figure 3 is the technical roadmap of this study.

2.3.1. Ecosystem Pattern

Based on the LUCC data of Hami City in 2000 and 2023, based on the research conducted by Liu [21] and Song [22], and following the macro-structural classification system of terrestrial ecosystems, Hami City was reclassified into six types: cropland ecosystem (CE), forest ecosystem (FE), grassland ecosystem (GE), wetland ecosystem (WE), urban ecosystem (UE), and desert ecosystem (DE).

2.3.2. Ecosystem Quality

This study selected Fractional Vegetation Cover (FVC) and Net Primary Productivity (NPP) as indicators for assessing ecosystem quality. FVC and NPP are widely recognized as key indicators of vegetation growth and ecosystem functioning, particularly in arid and semi-arid regions. FVC directly reflects the spatial extent and density of vegetation cover, which strongly influences surface energy balance, soil erosion resistance, and microclimatic regulation. NPP represents the net carbon accumulation of vegetation and serves as a fundamental measure of ecosystem productivity and carbon cycling. Together, FVC and NPP capture the structural and functional aspects of ecosystems, providing a comprehensive and ecologically meaningful evaluation of regional ecosystem quality.
  • Fractional Vegetation Cover
Fractional Vegetation Cover (FVC) refers to the proportion of the ground surface covered by green vegetation per unit area, usually expressed as a percentage (%). It reflects the density of surface vegetation and serves as an important indicator for assessing ecosystem quality and vegetation condition.
2.
Net Primary Productivity
Net Primary Productivity (NPP) refers to the total amount of organic matter fixed by plants through photosynthesis per unit area, minus the organic matter consumed by plant respiration, representing the net accumulation of organic matter. It reflects the net growth rate of plant biomass within an ecosystem. In this study, the unit is kg·C·m−2·a−1.

2.3.3. Ecosystem Services

In extreme arid regions, soil erosion [23] and wind erosion [24] are the main driving forces of ecosystem change. This study selected soil retention and windbreak and sand fixation as ecosystem services. Hami is a complex “desert–oasis–mountain” ecosystem in an arid and windy region. Precipitation is extremely scarce and unevenly distributed, but annual floods can occur from ice and snow melting, causing soil erosion during specific periods. The region is also subject to strong winds and frequent dust storms, making wind erosion an important indicator for studying ecosystem changes. Soil retention [25] and windbreak and sand fixation [26] play a significant role in maintaining regional ecological security and preventing land desertification, accurately reflecting the response of ecosystem services to local environmental pressures and their spatial heterogeneity.
  • Soil Retention
In this study, the Revised Universal Soil Loss Equation (RUSLE) was used to estimate the annual soil retention service in Hami City from 2000 to 2023, as shown in Equation (1).
S C = R × K × L S × ( 1 C ) × P
where SC is the soil conservation capacity (t·hm−2·a−1); R is the rainfall erosivity factor (MJ·mm·hm−2·h−1·a−1); K is the soil erodibility factor (t·h·MJ−1·mm−1); LS is the slope length and steepness factor; C is the vegetation cover factor; P is the soil conservation practice factor, which is set to 1 [27] in this study; and LS, C, and P are dimensionless. R was calculated using the empirical formula proposed by Wischmeier and Smith [28].
R = i = 1 12 1.735 × 10 ( 1.5 l g p i 2 p )
where p is the annual precipitation (mm) and pi is the monthly precipitation (mm).
K was estimated using the EPIC model [29] to determine the soil erodibility factor, and the results are generally consistent with existing studies [30].
K = 0.2 + 0.3 × e 0.0256 S A N 1 S I L 100 × S I L C L A + S I L 0.3 × 1 0.25 T O C T O C + e 3.72 2.95 T O C × 1 0.7 1 S A N 100 1 S A N 100 + e 22.9 1 S A N 100 5.51
where SAN is the sand content (%), SIL is the silt content (%), CLA is the clay content (%), and TOC is the soil organic carbon content (%).
LS was calculated using the Invest model based on DEM data, while C was estimated using the empirical formula proposed by Cai [27] based on Fractional Vegetation Cover.
C = 1 C = 0.6508 0.3436 l o g 10 ( f ) C = 0         f = 0         0 < f < 78.3         78.3 f
where f is FVC (%).
2.
Windbreak and Sand Fixation
The windbreak and sand fixation service of an ecosystem refers to the difference between soil wind erosion under bare soil conditions and soil wind erosion under vegetated conditions [31]. In this study, the Revised Wind Erosion Equation ‌(RWEQ) model was used to estimate the annual soil wind erosion and windbreak and sand fixation amounts in Hami City from 2000 to 2023.
G = S L r S L
S L r = 2 z s r 2 × Q r m a x × e ( z s r ) 2
Q r m a x = 109.8 × ( W F × E F × S C F × K )
s r = 50.71 × ( W F × E F × S C F × K ) 0.3711
S L = 2 z s 2 × Q m a x × e ( z s ) 2
Q m a x = 109.8 × ( W F × E F × S C F × K × C )
s = 105.71   ×   ( WF   ×   EF   ×   SCF   ×   K   ×   C ) 0.3711
where G is the annual windbreak and sand fixation amount per unit area (kg·m−2·a−1); SLr is the annual potential wind erosion per unit area (kg·m−2); SL is the annual actual wind erosion per unit area (kg·m−2); Qrmax is the maximum sediment transport capacity of the potential wind (kg·m−1); z is the downwind distance (m), which is set to 50 m [32]; sr is the potential wind erosion (kg·m−2); Qmax is the maximum sand transport capacity of wind (kg·m); WF is the climatic factor (kg·m−1); EF is the soil erodibility factor; SCF is the soil crust factor; K′ is the soil roughness factor; s is the critical plot length (m); C is the vegetation factor.
The climatic factor (WF) is the wind force capacity for soil particle transport under the conditions of rainfall, temperature, sunshine, and snow cover, for which the formula is as follows:
W F = w f × ρ g × S W × S D
w f = U 2 × ( U 2 U 1 ) 2 × N d
U 2 = U z 4.87 l n ( 67.8 z 5.42 )
ρ = 348 1.013 0.1183 E L + 0.0048 E L 2 T
S D = 1 P
where wf is the wind force factor (m·s−1); ρ is the air density (kg·m−3); g is the gravitational acceleration, take 9.8 m·s−2; SW is the soil moisture factor; SD is the snow cover factor, which is the proportion of days in a year with snow depth less than 25.4 mm, with a dimensionless value of 1; U2 is the wind speed at 2 m height (m·s−1); U1 is the critical wind speed for sand movement at 2 m height, for which 5 m·s−1 is used in this study [33]; Nd is the number of observation days; Uz is the wind speed measured within 100 m above the ground (m·s−1); z is the measurement height above the ground, with a maximum value of 100 m; EL is the elevation (m); T is the absolute temperature (K); and P is the probability that the snow cover depth (Hsnow) exceeds 25.4 mm during the observation days.
The soil erodibility factor (EF) is the capacity of soil to resist erosion and transport under external forces such as wind, for which the formula is as follows:
E F = ( 29.09 + 0.31 S a + 0.17 S i + 0.33 S a C l 2.59 O M 0.95 C a C O 3 ) 100
where Sa is the sand content of soil (%), Si is the silt content of soil (%), Cl is the clay content of soil (%), OM is the soil organic matter content (%), and CaCO3 is the soil calcium carbonate content (%).
The soil crust factor (SCF) is the capacity of the soil surface crust to resist wind erosion, for which the formula is as follows:
S C F = 1 1 + 0.0066 C L 2 + 0.021 O M 2
where Cl is the clay content of soil (%) and OM is the soil organic matter content (%).
The soil roughness factor (K′) is the influence of variations in land surface roughness caused by topography on soil wind erosion, for which the formula is as follows:
K = e ( 1.86 K r 2.41 k r 0.94 0.127 C r r )
K r = 0.2 × ( Δ H ) 2 L
L = 5 L = 5 L = 10 L = 10 L = 50 Δ h < 30 30 h < 150 150 h < 300 300 Δ h < 600 600 Δ h
where Kr is the topographic roughness length (m) [34] and Crr is the random roughness, which is set to 0 [35]. ∆H is the elevation difference within the distance L (cm); L is the terrain undulation parameter, which is calculated from DEM data following the study of Li [36]; and ∆h is the terrain roughness within 16 km2.
The vegetation cover factor (C) is the magnitude of soil wind erosion suppression under a given vegetation cover. The formula is as follows [37]:
C   =   e 0.0438 ( FVC )
where e is a constant and FVC is the fractional vegetation cover (%).

2.3.4. Ecosystem Change Assessment

  • Spatiotemporal Variation Trend
Sen’s trend analysis method was used to calculate the pixel-wise variation slopes (P) of FVC, NPP, SC, and G during 2000–2023; they are denoted as FVCsen, NPPsen, SCsen, and Gsen, and the Mann–Kendall method was applied for significance testing. The spatial distribution characteristics of ecosystem changes in Hami City are expressed by the pixel-wise variation slope P (P < 0 is Worse, P = 0 is Stabilization, P > 0 is Better).
The mean and standard deviation (SD) of FVC, NPP, SC, and G were calculated for each period from 2000 to 2023. The mean was used to reflect the overall level of an indicator within the region during a specific period, while the standard deviation was used to evaluate the spatial dispersion of the indicator. The temporal variation in the ecosystem in Hami City was expressed by the mean and standard deviation.
2.
Degree of Change
To indicate the degree of change in each ecosystem indicator, this study introduced the ecological index (EI). EI comprehensively reflects the variation trends of multiple indicators. To achieve comparability among different indicators, their dimensions need to be unified. At the same time, to preserve the directionality of indicator changes, FVCsen, NPPsen, SCsen and Gsen were processed using the central symmetric normalization method, resulting in FVCi, NPPi, SCi, Gi. Finally, the degree of ecosystem change in Hami City was expressed by the EI score. The calculation formula of EI is as follows:
EI   =   FVC i   +   NPP i   +   S C i   +   G i
where FVCi is the centrally normalized value of FVCsen; NPPi is the normalized value of NPPsen; SCi is the normalized value of SCsen; Gi is the normalized value of Gsen

2.3.5. Analysis of Driving Forces of Ecosystem Change

Referring to the study of Manish [38], 17 factors were initially selected. Considering that this study focuses on ecosystem changes in Hami City from 2000 to 2023, factors that do not vary over time, such as DEM, soil particle composition, soil pH, and electrical conductivity, were excluded to ensure the accuracy of temporal contributions. Ultimately, seven factors capable of reflecting temporal changes were selected as the driving factors for exploring EI changes (Table 3). Using the EI as the classification outcome, the Random Forest model was applied to analyze the driving factors of ecosystem change. Random Forest was chosen because it is robust to noise and multicollinearity among predictors, provides reliable variable importance measures, and performs well for nonlinear relationships without requiring strict data distribution assumptions. In this study, the Random Forest regression model from the Python(3.12.7) scikit-learn library was employed to analyze factor importance. The model was configured with 100 decision trees, with all candidate variables considered at each split node. Node splitting was based on minimizing the mean squared error (MSE), and the tree depth was left unconstrained until no further splits were possible at the leaf nodes. Feature importance was derived by calculating the reduction in impurity caused by each variable across all trees and then normalizing the values. To ensure the model’s accuracy, we calculated R2 and Root Mean Squared Error (RMSE) to validate its performance.
I m p ( x ) = 1 T t = 1 T m M j , t i m , t ( x j )
where T is the number of decision trees in the forest; Mi,t is the set of all nodes in tree t where feature xj is used; Δim,t is the decrease in the impurity measure after the split at that node.

3. Results and Analysis

3.1. Spatiotemporal Variation in Ecosystems

3.1.1. Macroscopic Structural Changes in Ecosystems

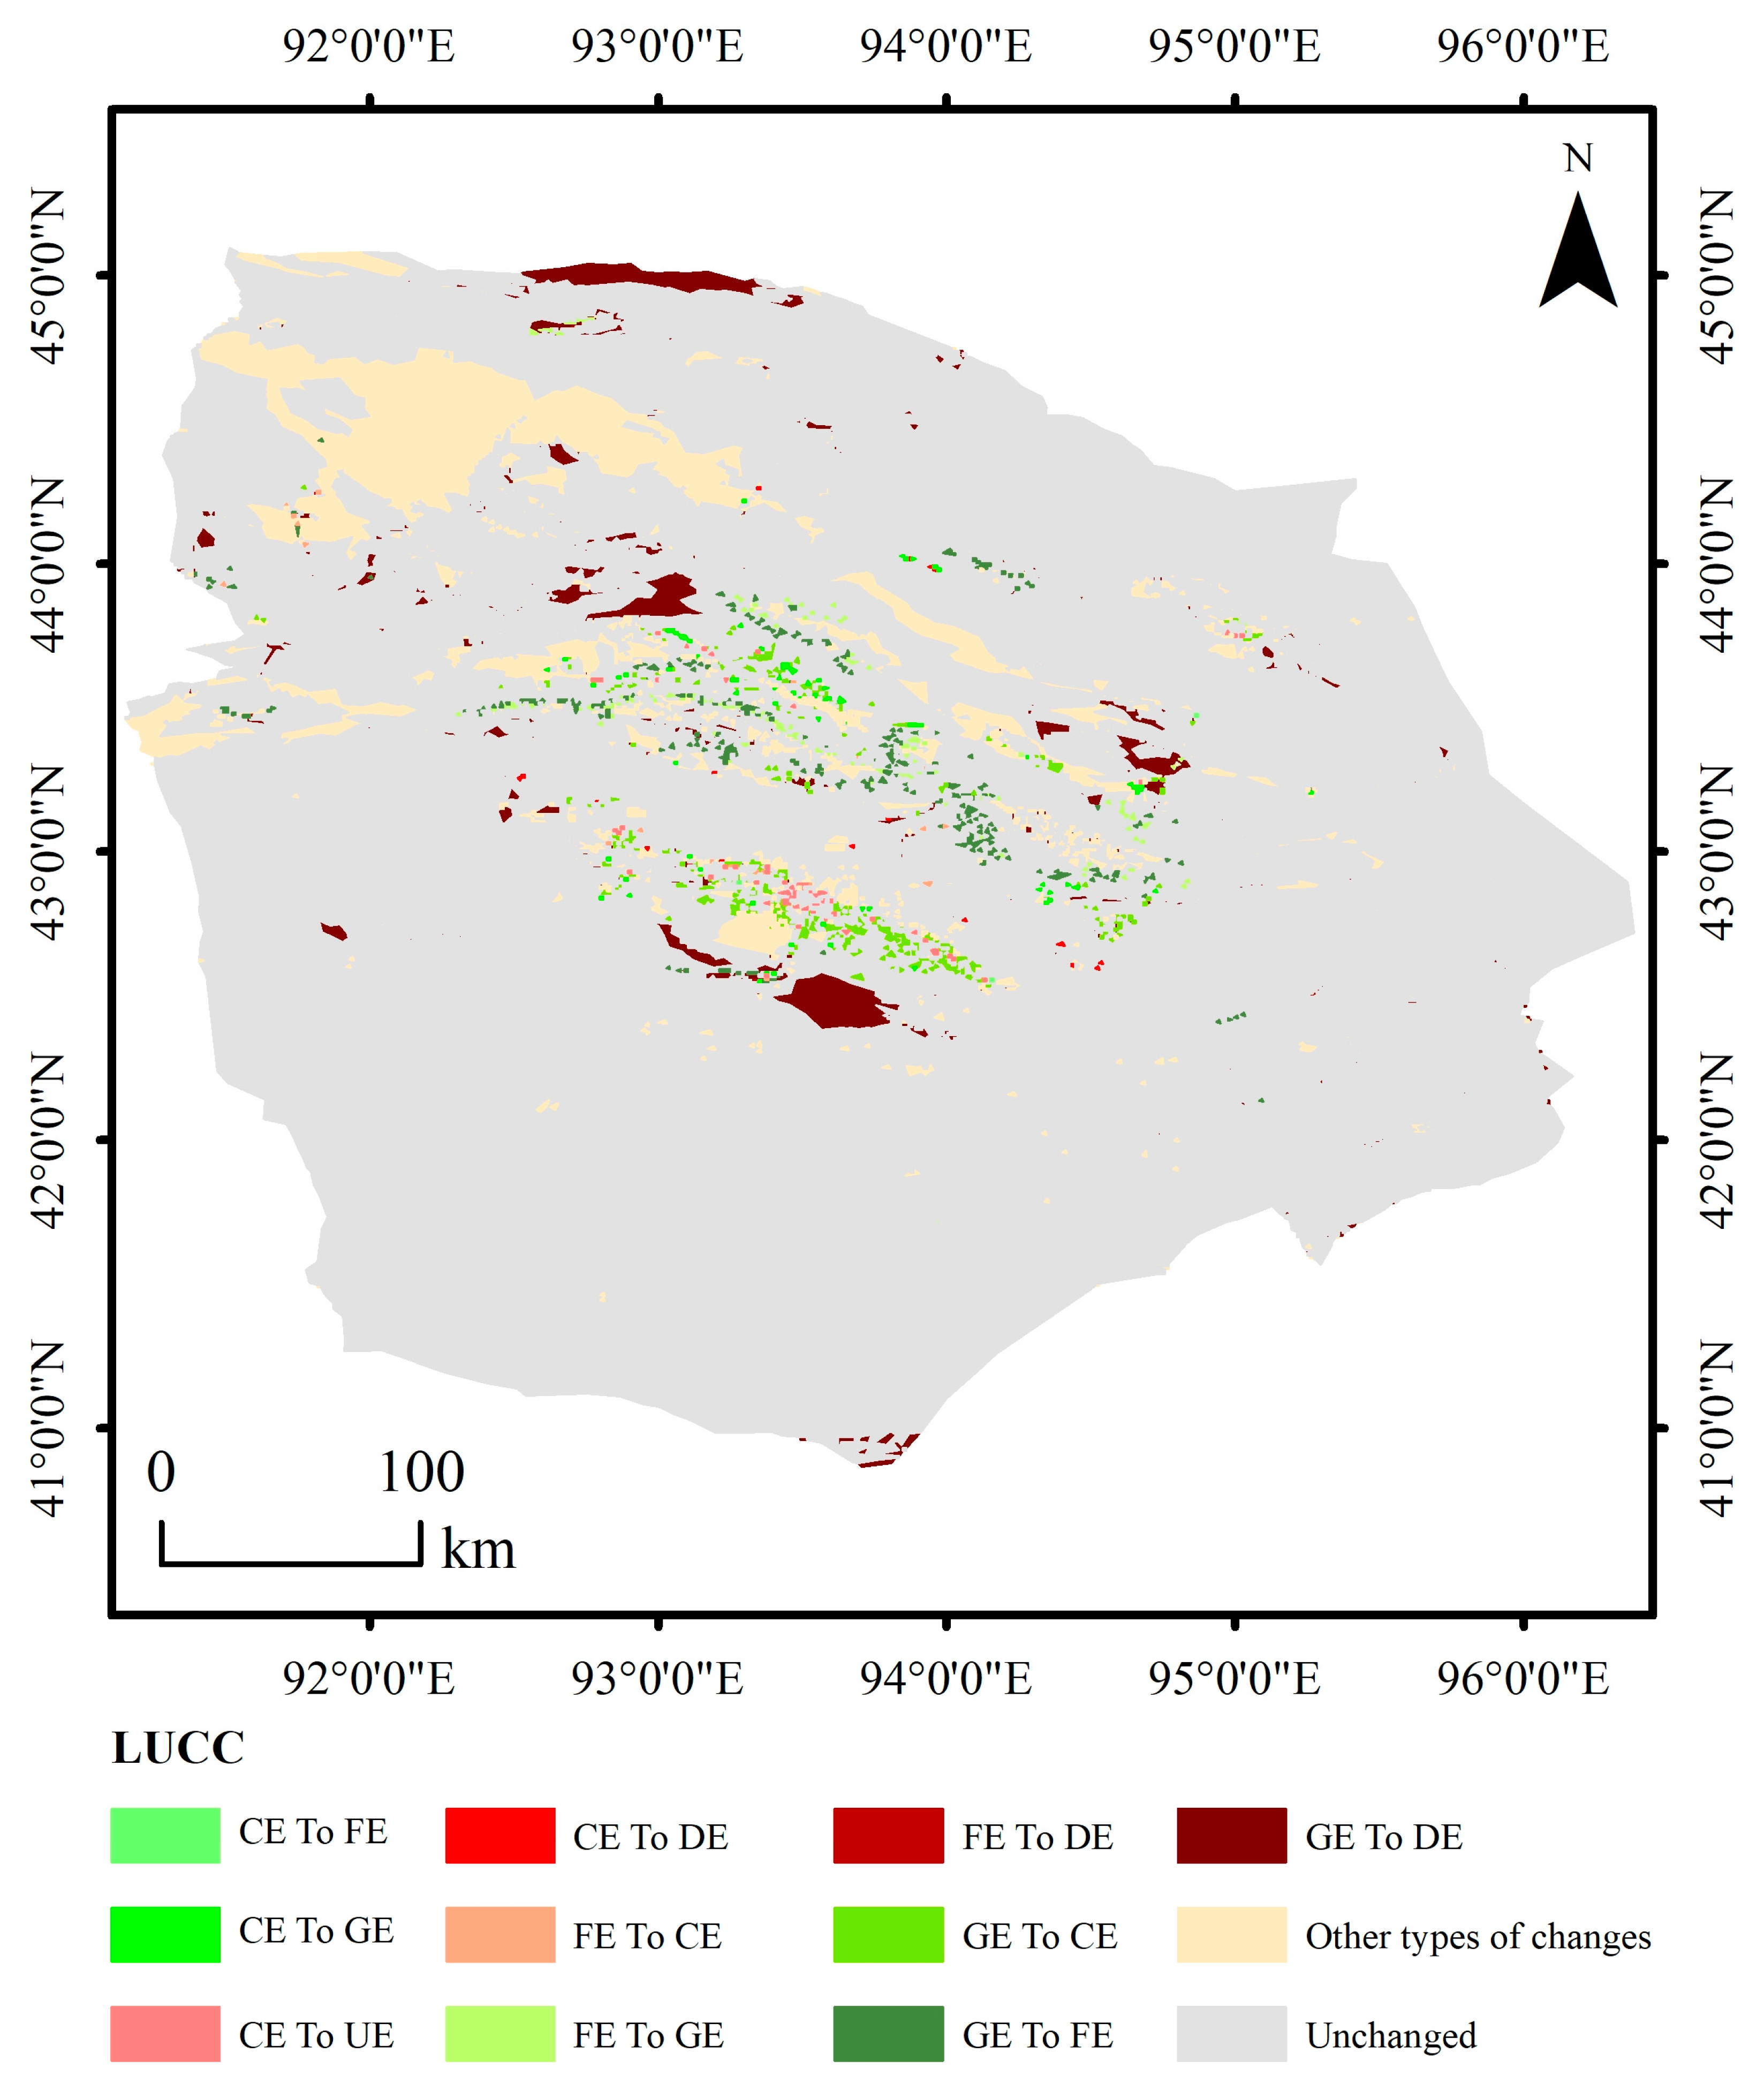
Hami City includes six types of ecosystems: cropland ecosystem (CE), forest ecosystem (FE), grassland ecosystem (GE), wetland ecosystem (WE), urban ecosystem (UE), and desert ecosystem (DE). The area and proportion of each ecosystem type are shown in Table 4 and Table 5 and Figure 4.
The grassland ecosystem and desert ecosystem are the dominant ecosystem types in Hami City, accounting for approximately 97.89% of the total area of the study region. Data from 2023 show that the desert ecosystem has the largest area, totaling 106 415.83 km2, which accounts for 77.56% of the total area. The wetland ecosystem has the smallest area, totaling 232.55 km2, accounting for only 0.17% of the total area. The grassland ecosystem is an important component, with an area of 27 894.34 km2, accounting for 20.33% of the total area. The cropland ecosystem (1745.16 km2), forest ecosystem (361.63 km2) and urban ecosystem (549.27 km2) account for 1.27%, 0.26%, and 0.4% of the total area, respectively. Between 2000 and 2023, the macroscopic structure of the ecosystems in Hami City changed significantly, mainly manifested as an increase in the grassland ecosystem and a decrease in the desert ecosystem. The desert ecosystem had the largest decrease in area, reducing by 6755.52 km2. The grassland ecosystem had the largest increase in area, growing by 6108.48 km2. The urban ecosystem had the highest dynamics, at 251.23%. The desert ecosystem had the lowest dynamics, at 5.97%. The urban ecosystem had the smallest area of outflow, 49.23 km2, accounting for 0.34%. The desert ecosystem had the largest area of outflow, 9868.8 km2, accounting for 68.51%. The grassland ecosystem had the largest area of inflow, 9852.77 km2, accounting for 68.51%. The wetland ecosystem had the smallest area of inflow, 74.22 km2, accounting for 0.52%. The grassland ecosystem increased by 612.41 km2, with a dynamic of 54.06%.

3.1.2. Spatiotemporal Variation in Ecosystem Quality

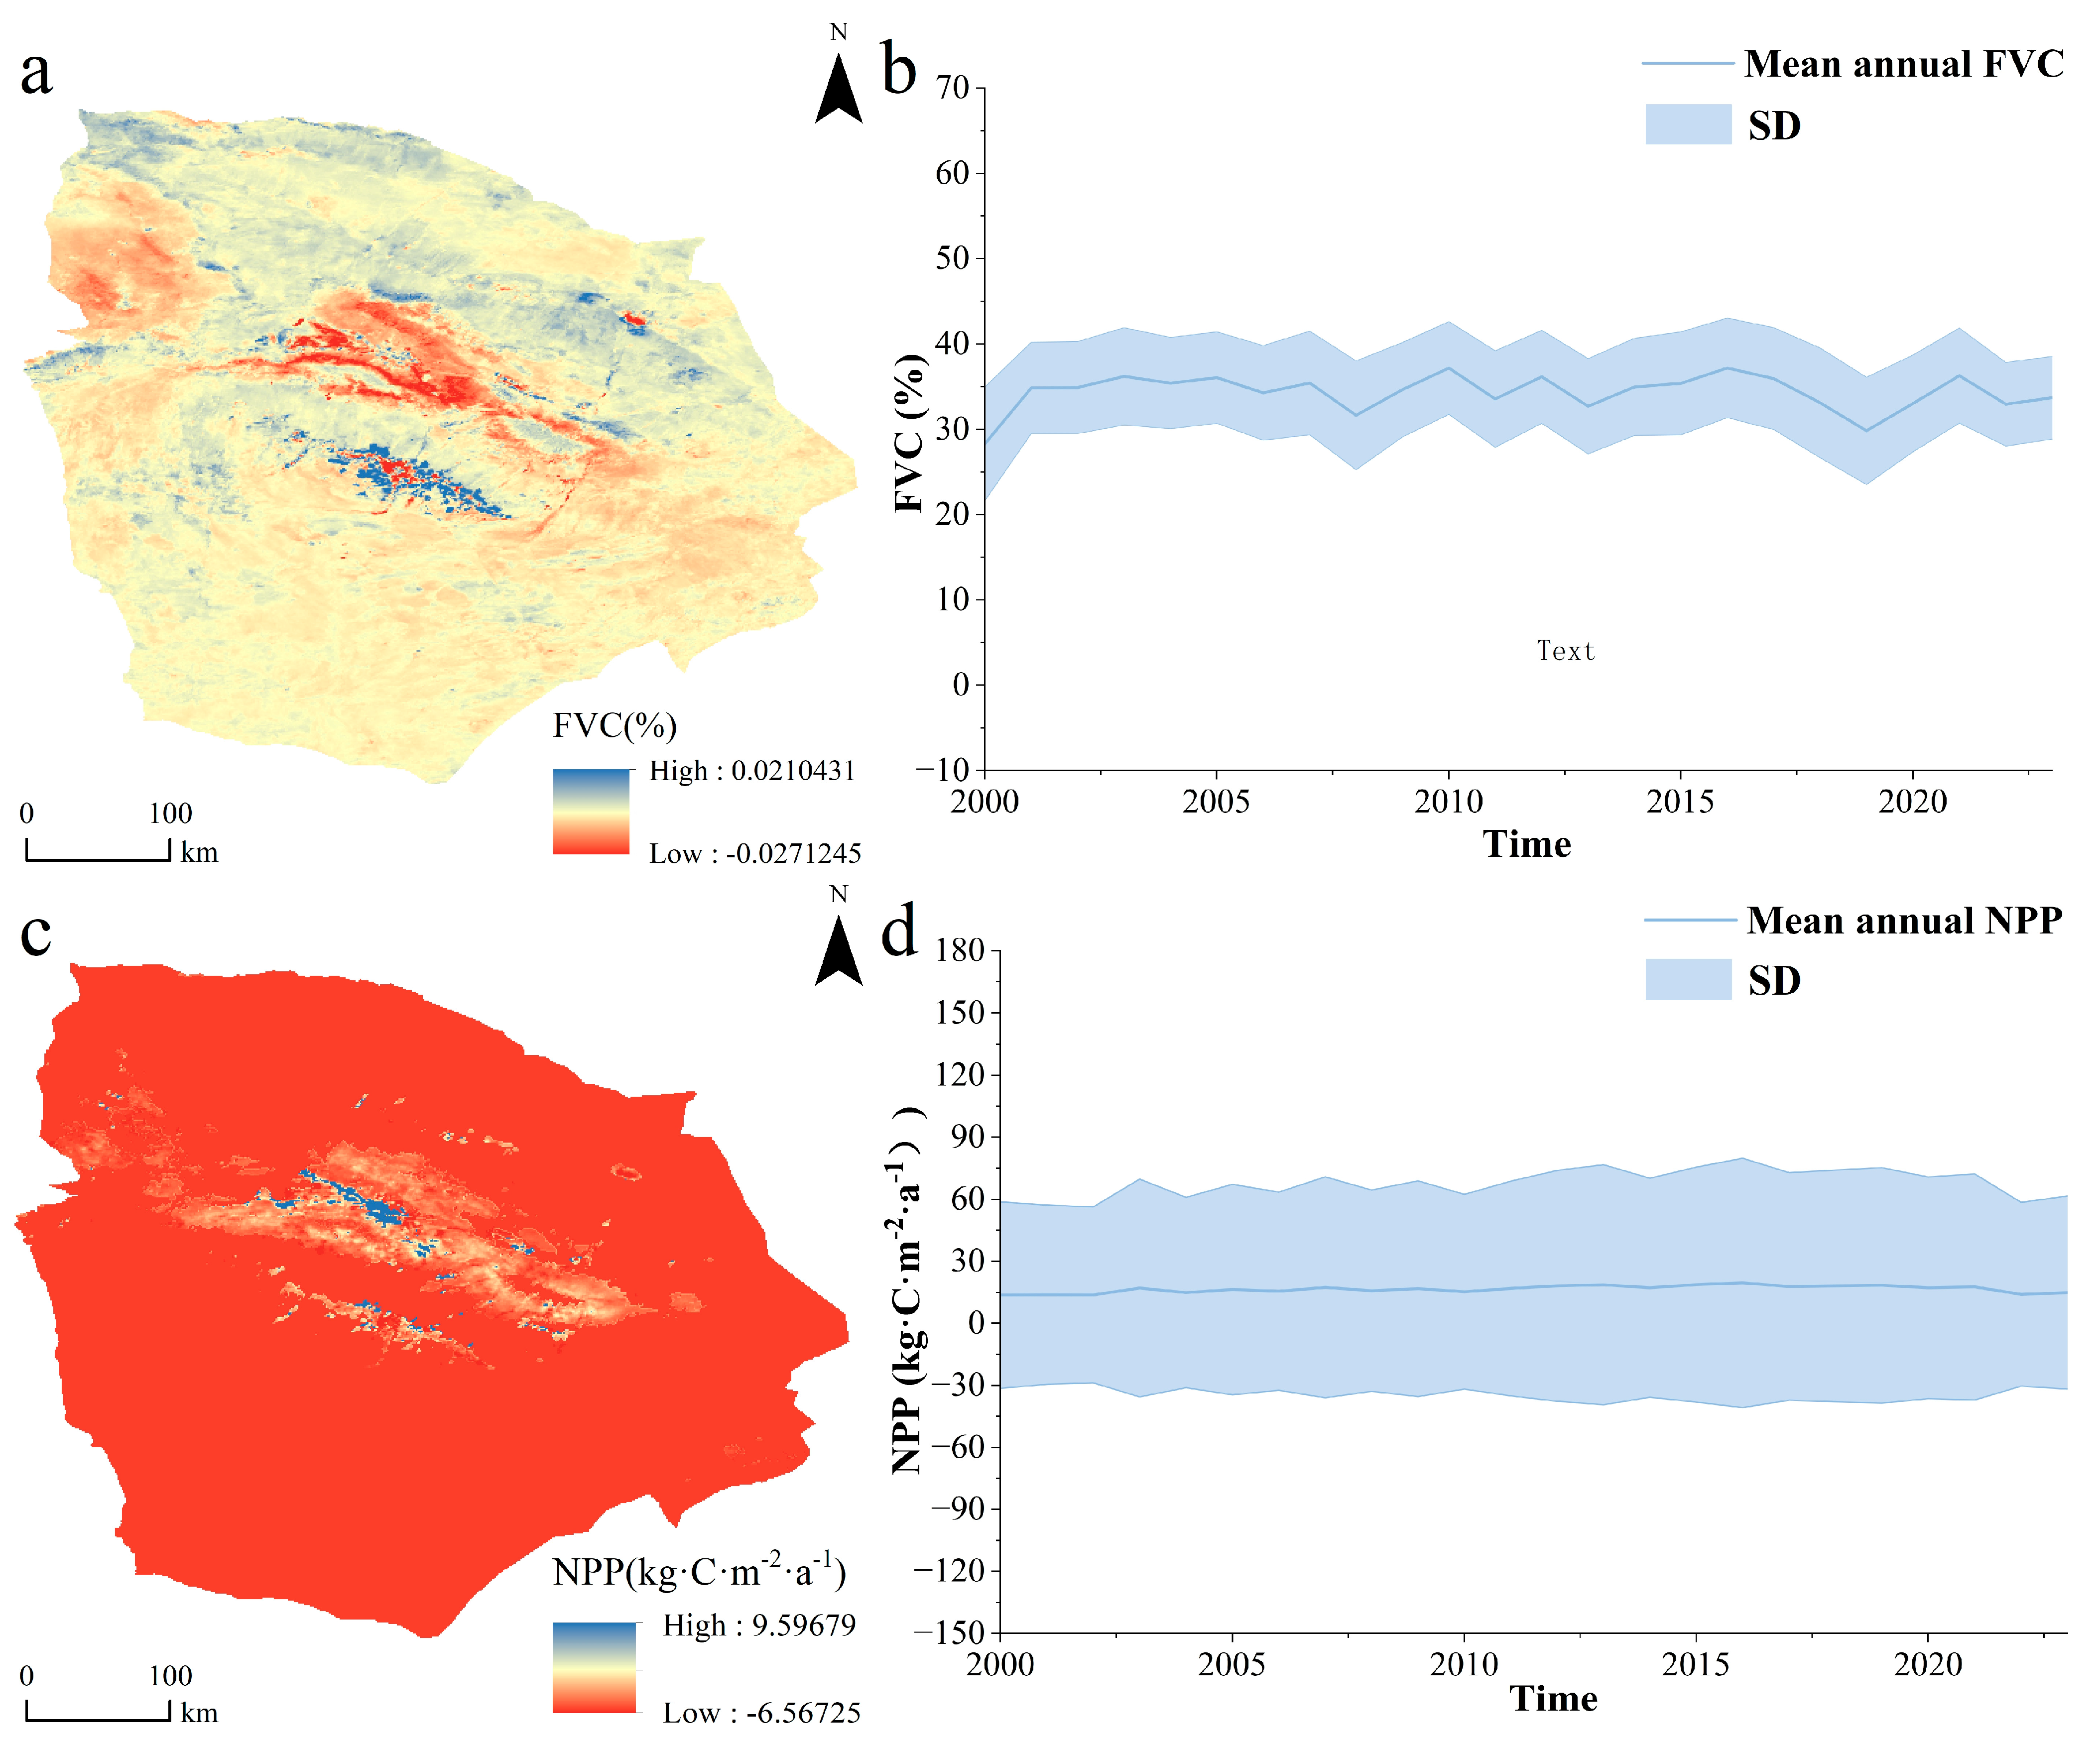
From 2000 to 2023, FVC in Hami City showed an overall increasing trend over time, with the mean increasing by 5.41% and the standard deviation decreasing by 1.81%. The annual mean reached its maximum in 2016, at 37.19%, with a standard deviation of 5.84%. The minimum mean occurred in 2000, at 28.29%, with a standard deviation of 6.67%. Spatially, the areas with increasing FVC were mainly concentrated in the central cropland ecosystem and the northern cropland ecosystem and forest ecosystem, with a maximum growth rate of 2.1%·a−1. The areas with decreasing FVC were concentrated in the central grassland ecosystem and the southwestern grassland ecosystem, with a maximum decline rate of 2.71%·a−1 (Figure 5).
From 2000 to 2023, NPP in Hami City showed an overall increasing trend over time, with the mean increasing by 1.25 kg·C·m−2·a−1 and the standard deviation increasing by 1.57 kg·C·m−2·a−1. The annual mean reached its maximum in 2016, at 19.57 kg·C·m−2·a−1, with a standard deviation of 60.27 kg·C·m−2·a−1. The minimum occurred in 2000, at 13.66 kg·C·m−2·a−1, with a standard deviation of 45.11 kg·C·m−2·a−1. Spatially, the areas with increasing NPP were mainly concentrated in the central cropland ecosystem, forest ecosystem, and grassland ecosystem, with a maximum increase of 9.6 kg·C·m−2·a−1. The areas with decreasing NPP were concentrated in the central urban ecosystem, with a maximum decrease of 6.57 kg·C·m−2·a−1 (Figure 5).

3.1.3. Spatiotemporal Variation in Ecosystem Services

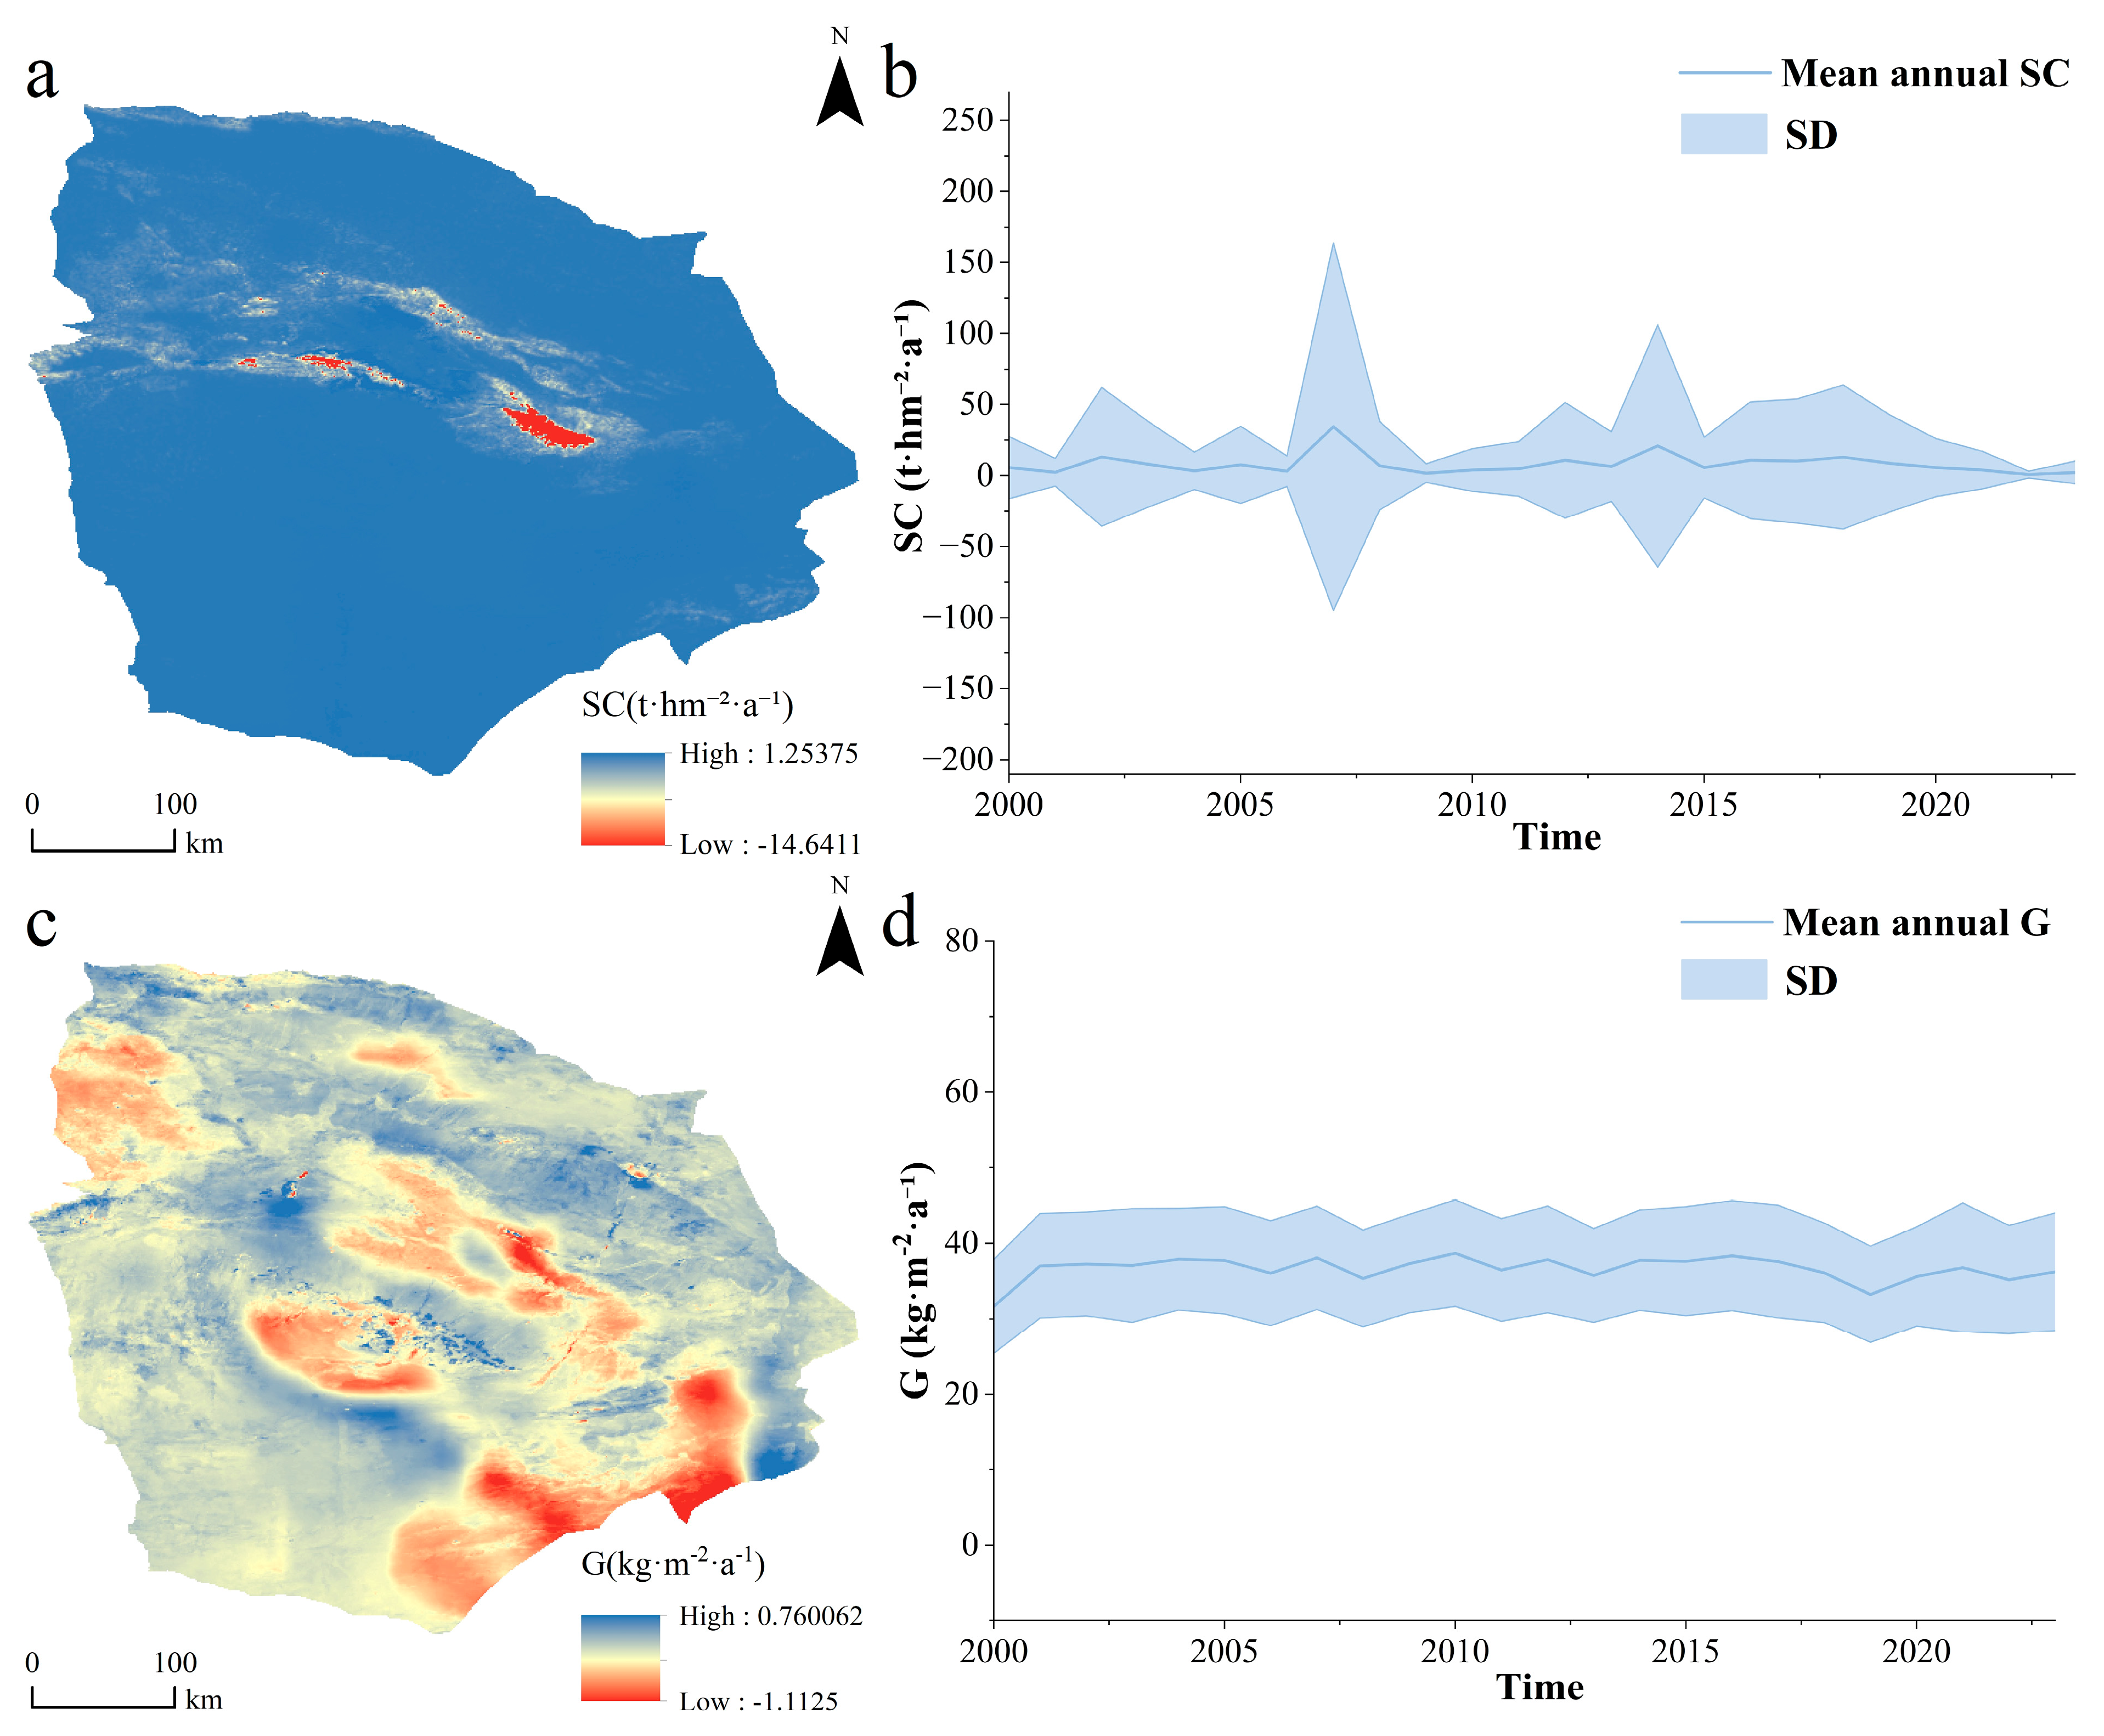
From 2000 to 2023, SC in Hami City showed an overall decreasing trend over time, with the mean decreasing by 3.4 t·hm−2·a−1 and the standard deviation decreasing by 14 t·hm−2·a−1. The annual mean reached its maximum in 2007, at 34.47 t·hm−2·a−1, with a standard deviation of 129.39 t·hm−2·a−1. The minimum occurred in 2022, at 0.81 t·hm−2·a−1, with a standard deviation of 2.36 t·hm−2·a−1. The standard deviation fluctuated sharply and was much higher than the mean, with the most pronounced changes occurring in 2003, 2007, 2014, and 2018. Spatially, the areas with increasing SC were mainly concentrated in the central forest ecosystem and grassland ecosystem. The areas with decreasing SC were mainly concentrated in the central grassland ecosystem and wetland ecosystem, with a maximum decline of 14.64 t·hm−2·a−1 (Figure 6).
From 2000 to 2023, G in Hami City showed an overall increasing trend over time, with the mean increasing by 4.57 kg·m−2·a−1 and the standard deviation increasing by 1.54 kg·m−2·a−1. The annual mean reached its maximum in 2010, at 38.71 kg·m−2·a−1, with a standard deviation of 7.03 kg·m−2·a−1. The minimum occurred in 2000, at 31.68 kg·m−2·a−1, with a standard deviation of 6.23 kg·m−2·a−1. Spatially, the areas with increasing G were concentrated in the northern desert ecosystem, central cropland ecosystem, grassland ecosystem, and desert ecosystem, and eastern desert ecosystem, with a maximum increase of 0.76 kg·m−2·a−1. The areas with decreasing G were concentrated in the northwestern grassland ecosystem and desert ecosystem, central cropland ecosystem, grassland ecosystem, and wetland ecosystem, and southeastern desert ecosystem, with a maximum decrease of 1.11 kg·m−2·a−1 (Figure 6).

3.2. Analysis of Ecosystem Change Trends and Degrees

Degree of Ecosystem Change and Spatial Differences

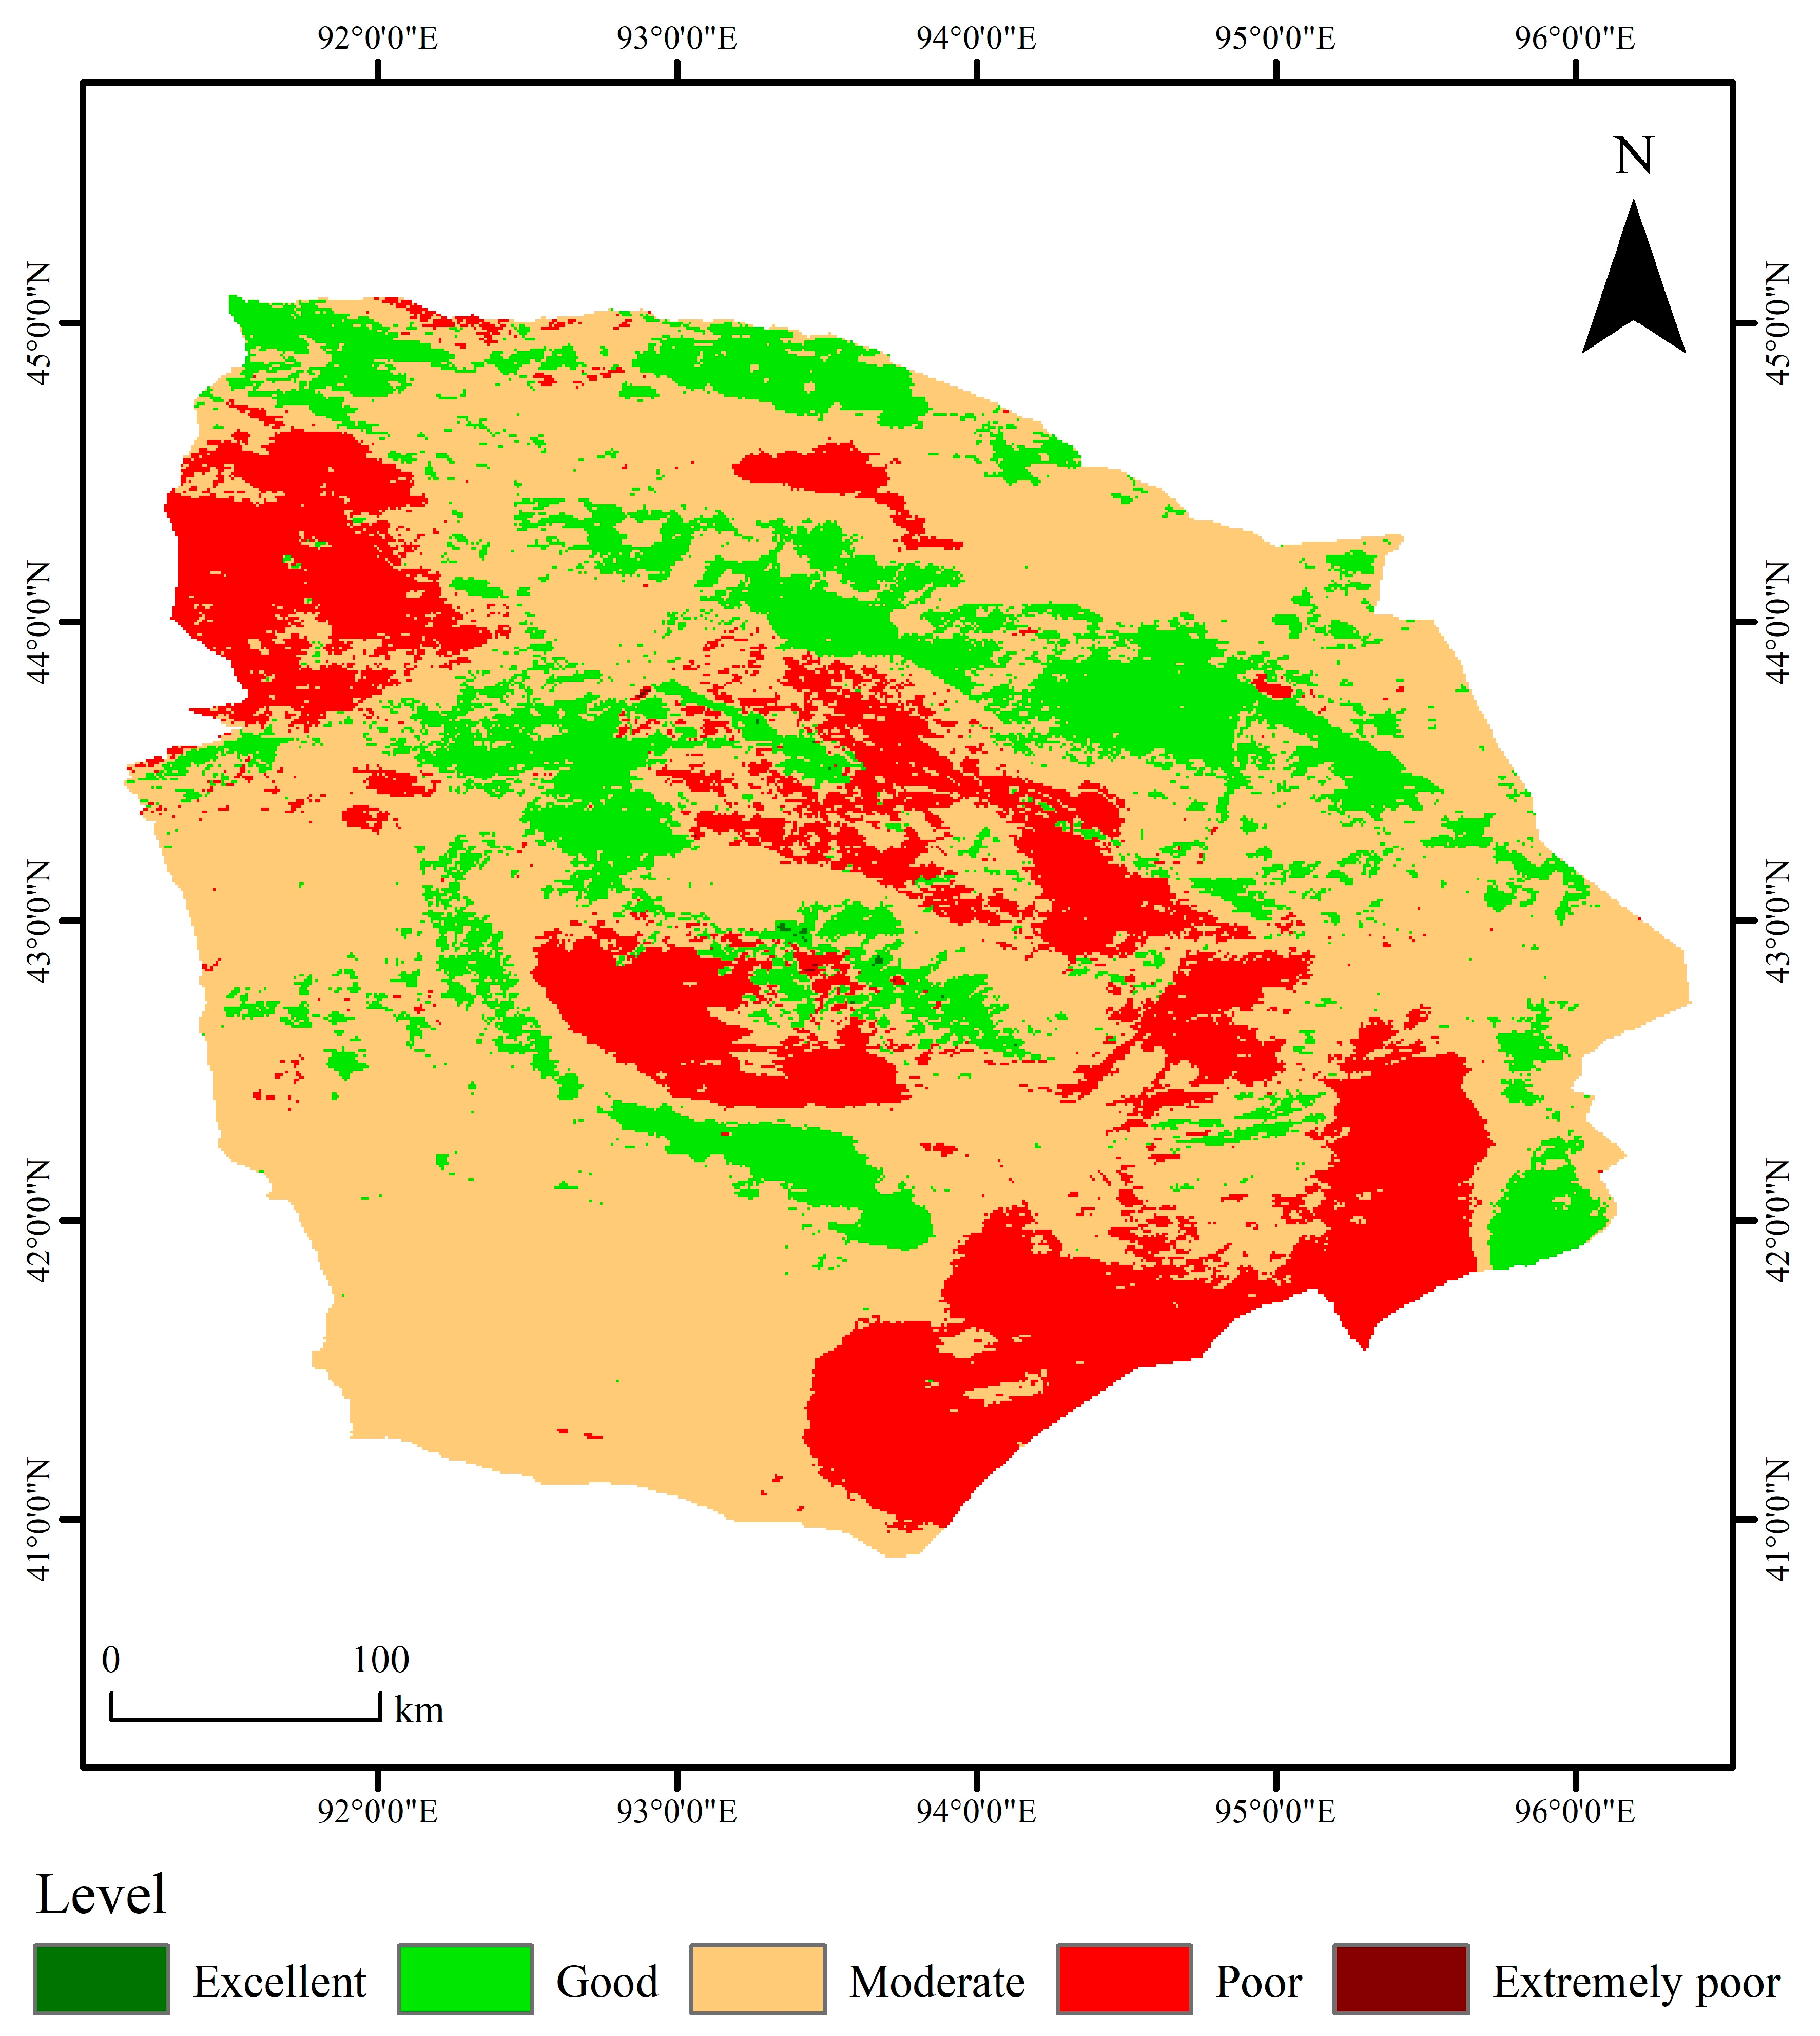
From 2000 to 2023, the overall EI level of ecosystems in Hami City was moderate (Figure 7).
The area with a moderate level was the largest, accounting for 61.85% of the total area, mainly distributed in the eastern desert ecosystem and southwestern desert ecosystem. The area with an extremely poor level was the smallest, accounting for 0.01% of the total area. The area with a poor level accounted for 21.33%, mainly distributed in the northern grassland ecosystem and desert ecosystem, central grassland ecosystem and urban ecosystem, and southeastern desert ecosystem of Hami City. The area with a good level accounted for 16.79%, mainly distributed in the northern grassland ecosystem and desert ecosystem, and central cropland ecosystem, grassland ecosystem, and desert ecosystem. The area with an excellent level accounted for 0.02%.

3.3. Factors Influencing the Degree of Ecosystem Change

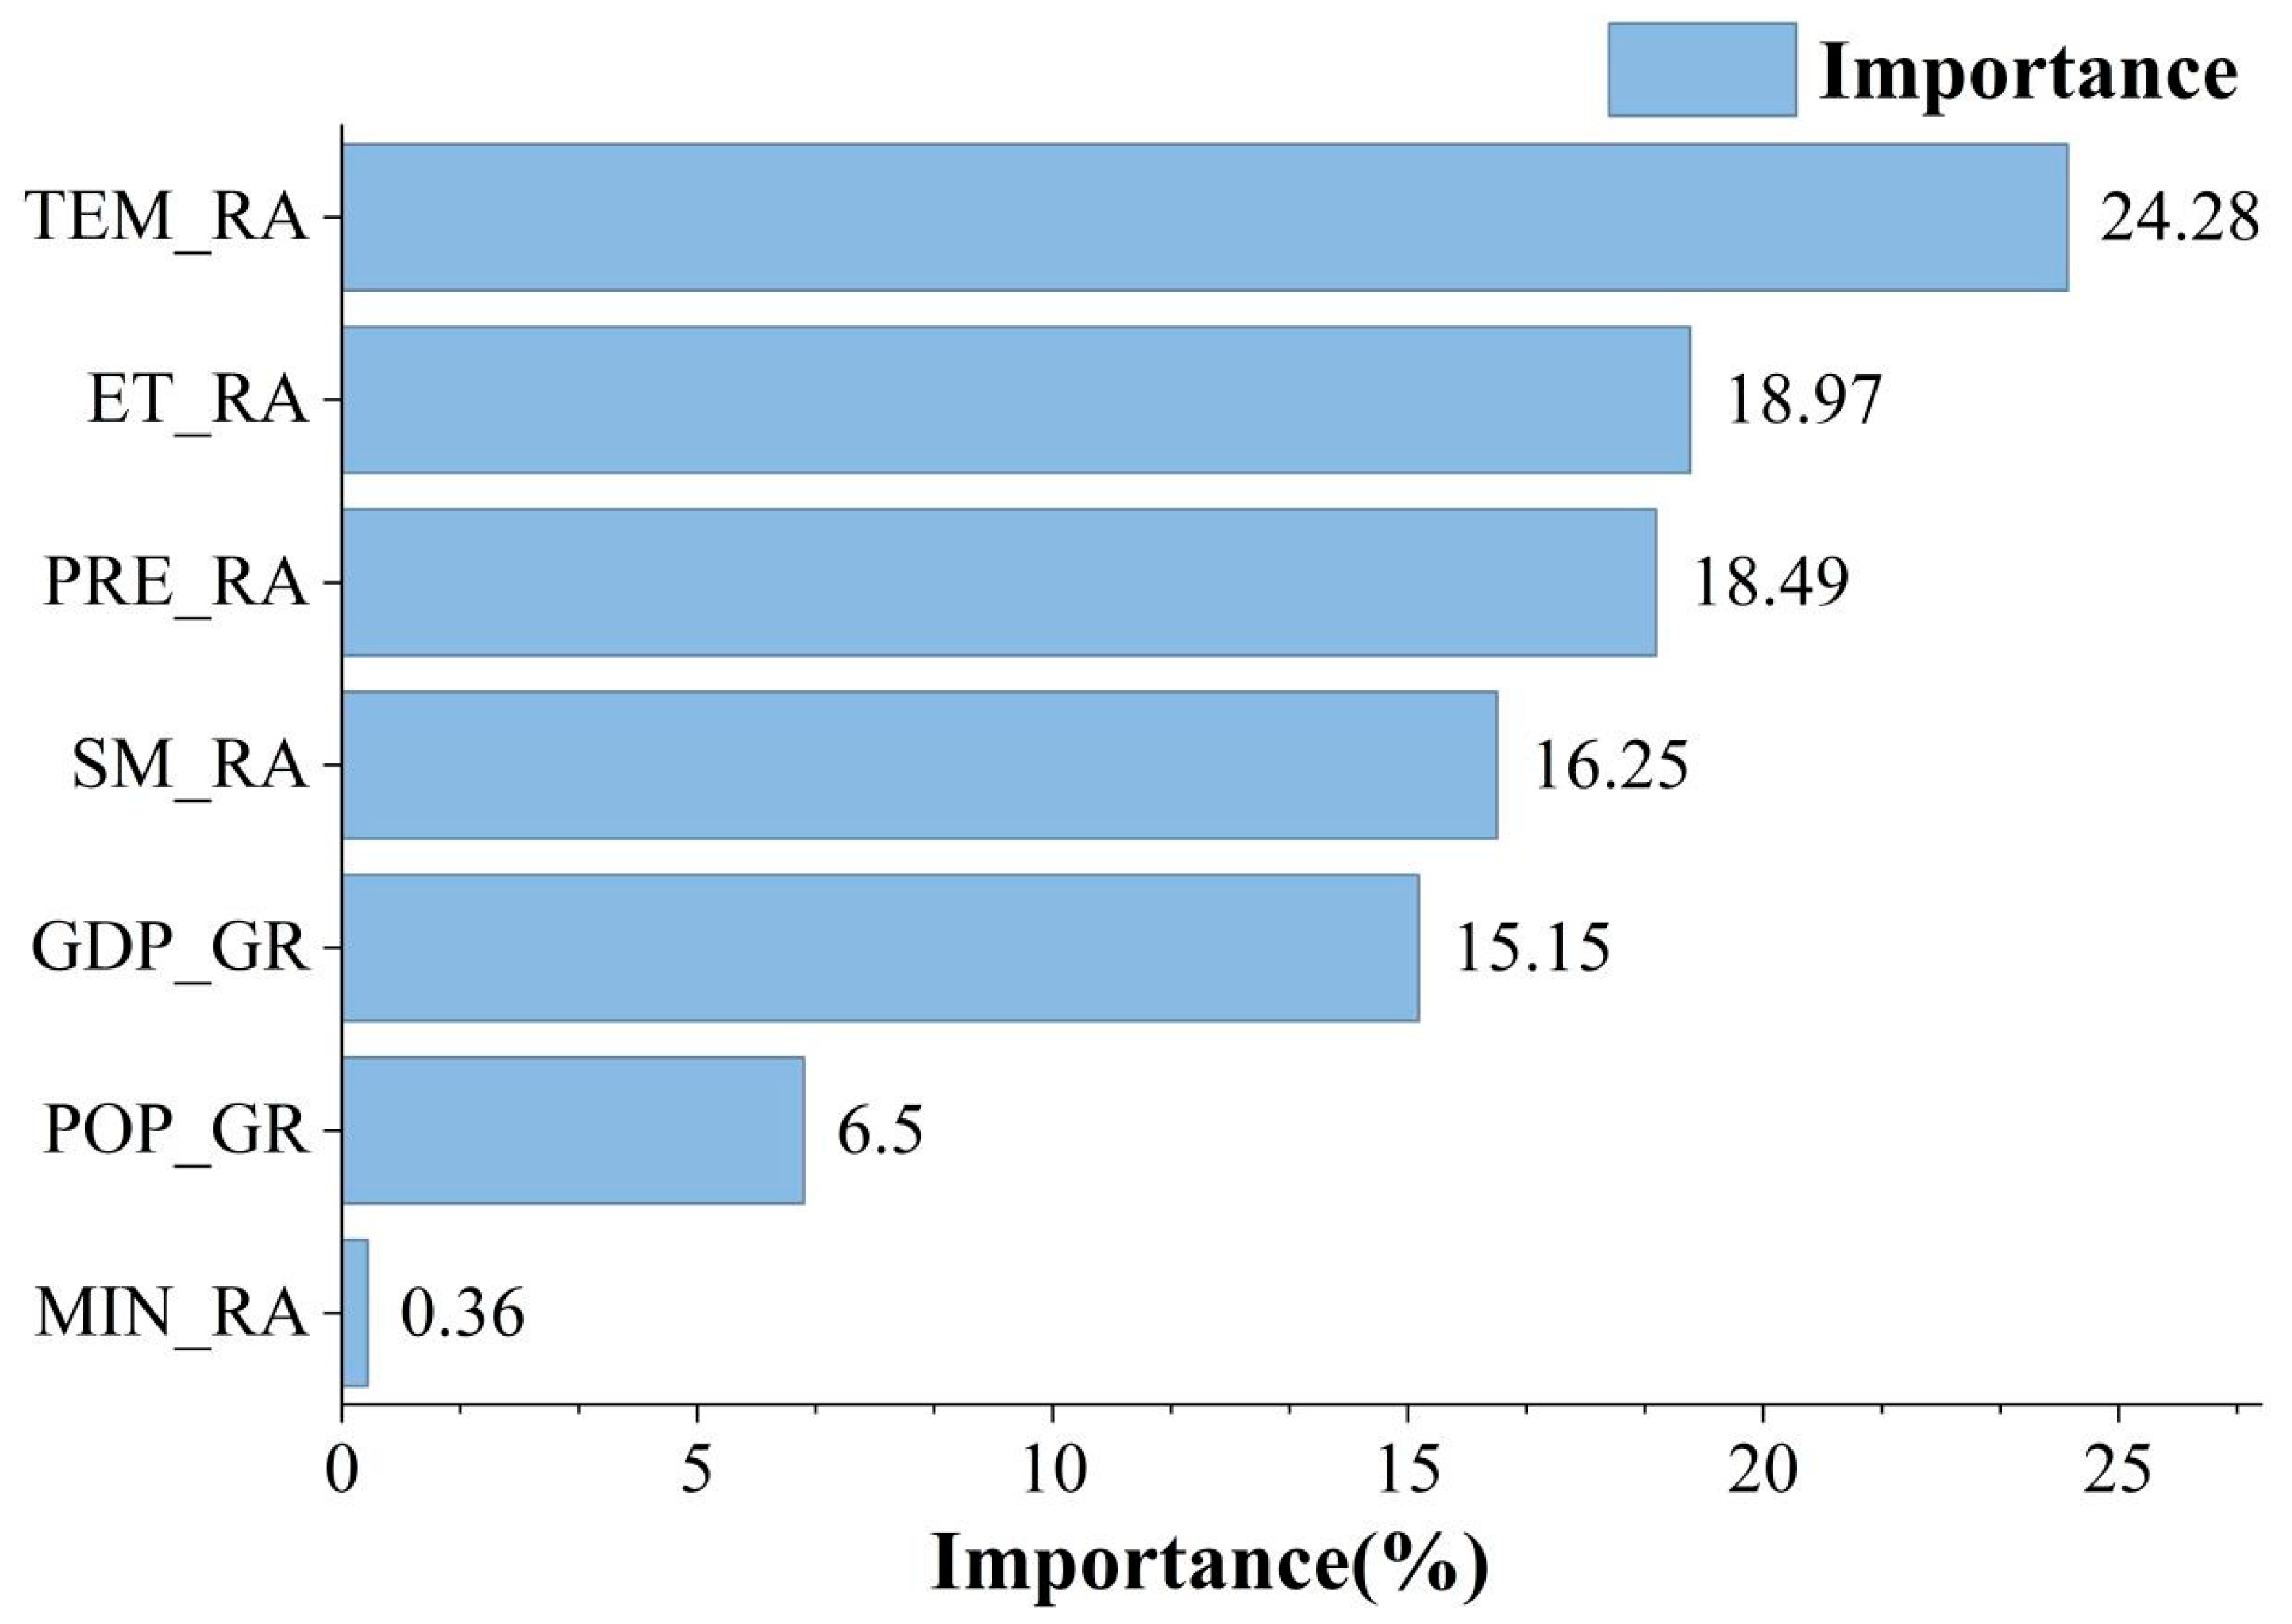
After screening, this study selected seven factors: TEM_RA, PRE_RA, SM_RA, ET_RA, MIN_RA, GDP_GR, and POP_GR. Based on the random forest model, the importance of these seven factors on EI scores was evaluated. The model performed well overall, with an R2 value of 0.95 for the training set, 0.77 for the validation set, and an RMSE of 0.03. This indicates strong fitting performance and reliability. According to the ranking of feature importance, TEM_RA was the most important driving factor, with an importance of 24.28%. It was followed by ET_RA (18.97%), PRE_RA (18.49%), SM_RA (16.25%), and GDP_GR (15.15%). POP_GR had relatively low importance, at 6.50%, and MIN_RA had the lowest importance, at only 0.26% (Figure 8).

4. Discussion

The study systematically assessed the spatiotemporal variation characteristics of ecosystem structure, quality, and services in Hami City from 2000 to 2023, revealing the trend and degree of EI change. In terms of ecosystem structure, the movement from desert ecosystem to grassland ecosystem indicates that the ecosystem structure in Hami City is changing in the direction of higher ecosystem quality. It is noteworthy that although the overall ecosystem structure shows an improving trend, there are also movements from grassland and wetland ecosystems to desert ecosystems in some areas, indicating that the structural changes in ecosystems in Hami City exhibit spatial heterogeneity. The dynamics of the urban ecosystem reached 251.23%, indicating that Hami City has experienced rapid development and a high level of urbanization in recent years. The grassland ecosystem is a key component of Hami City’s ecosystems and serves as the main carrier of ecosystem change. These structural changes provide the context for examining ecosystem quality, as alterations in ecosystem type and spatial heterogeneity can directly influence vegetation cover and productivity.
In terms of ecosystem quality, the FVC exhibited a relatively stable trend, with a gradual overall increase. The standard deviation reflects that FVC was spatially balanced, without drastic regional changes. The increase in the mean value accompanied by a decrease in the standard deviation indicates that the spatial heterogeneity of FVC in Hami decreased, suggesting an overall trend toward greater stability. Hami is located in an extremely arid region, where precipitation is the key limiting factor for vegetation growth, and the contribution of desert plants to vegetation cover change is very limited. NPP exhibited a relatively stable trend, with an overall slow increase. The standard deviation indicates that the spatial variation in NPP was highly uneven, with extreme areas dominating the changes in mean NPP. NPP variation occurred primarily in the central part of Hami, while values in other areas were very low. This is because vegetation NPP in desert ecosystems is often negligible [39]. Understanding these patterns of ecosystem quality is essential for interpreting the observed changes in ecosystem services, which are directly influenced by vegetation cover and productivity.
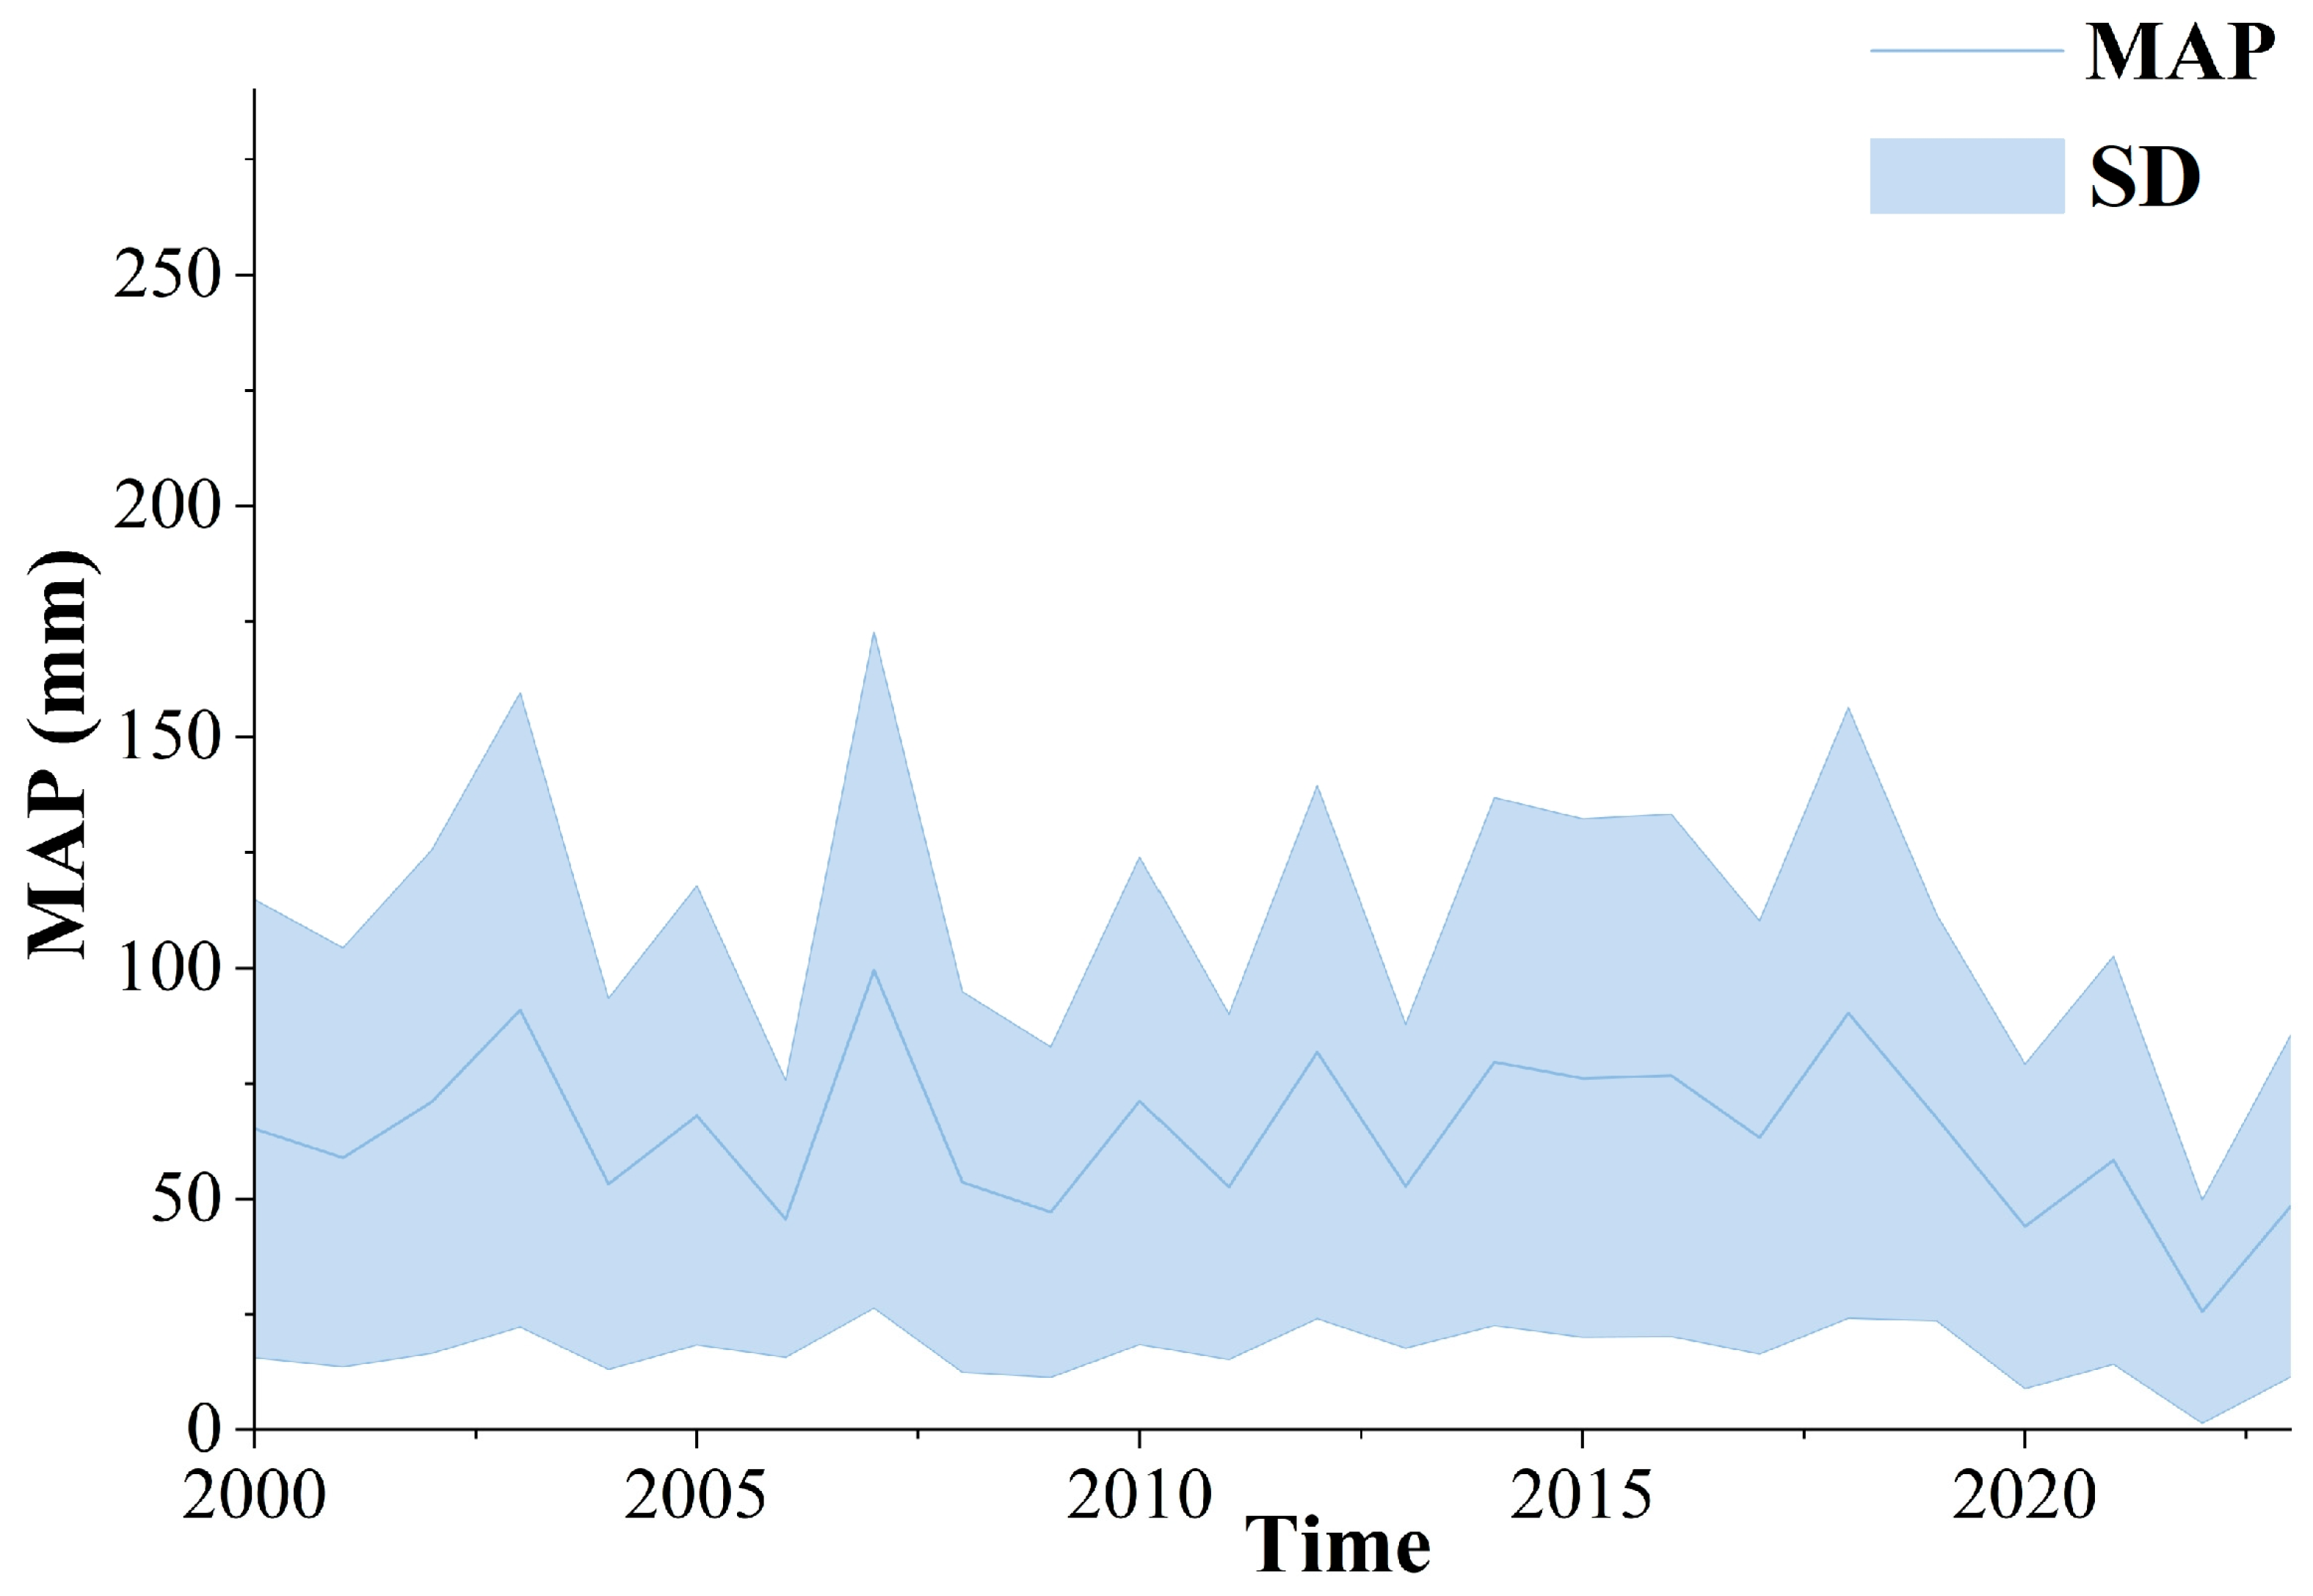
In ecosystem services, SC showed considerable fluctuations with a slight overall decline. Spatially, SC changes were highly variable, with localized dominant patterns. Areas of SC change were concentrated in the central Tianshan Mountains of Hami. This may be due to the extremely low and stable annual precipitation across most of Hami, resulting in very limited rainfall-induced erosion. Areas where SC deteriorated were located in mountainous regions, which may be due to accelerated snow and ice melt caused by global warming [40]. The annual mean standard deviation of SC showed significant changes in 2003, 2007, 2014, and 2018 (Figure 6); studies found that the Mean Annual Precipitation (MAP) in these four years was much higher than in other years (Figure 9). According to the RUSLE model, the rainfall erosivity factor has an exponential relationship with annual precipitation, and increases in annual precipitation significantly raise the R value, leading to pronounced interannual fluctuations in the calculated SC. Meanwhile, the standard deviation of Mean Annual Precipitation reflects significant spatial heterogeneity of rainfall in Hami, which may also explain the pronounced spatial heterogeneity of SC. The spatial heterogeneity and sharp variations in SC highlight the vulnerability of Hami’s ecosystems under extreme precipitation events. G changes were mainly observed in cropland, grassland, and desert ecosystems. Among them, the desert ecosystem has sparse herbaceous vegetation [41] and is highly susceptible to wind erosion [42], serving as the primary carrier of changes in windbreak and sand fixation functions. Hami City has a relatively developed livestock industry, with a total of 942,700 cattle and sheep at the end of 2023 (https://www.hami.gov.cn/ (accessed on 19 May 2025)). The G of cropland ecosystems and grassland ecosystems fluctuated, showing obvious regional changes, which may be affected by human activities such as high-intensity grazing [43] and farming intensity [44].
Most areas of Hami City exhibit moderate changes in EI, with desert ecosystems dominating. The desert ecosystem occupies the largest proportion, and vegetation is extremely sparse. The rates of change in FVC and NPP are close to zero, resulting in very limited EI scores in these areas. Interestingly, in some central areas of Hami City, EI levels are classified as poor. In these regions, the ecosystem type remains grassland, yet FVC shows a decreasing trend, while NPP shows an increasing trend. This phenomenon can be attributed to changes in vegetation types. Field surveys in 2023 found that the dominant and community-forming species in the area are shrub plants. Compared with the surrounding Agropyron cristatum and Stipa caucasica subsp. glareosa grasslands, the shrub vegetation has a sparse canopy and low FVC but contributes significantly to NPP. It can be inferred that the area was previously dominated by herbaceous plants, with relatively high coverage but low NPP contribution. In the calculation of EI scores, the influence of vegetation type cannot be ignored. Vegetation factors typically have a strong influence on soil retention [45] and are also a key factor in calculating windbreak and sand fixation capacity. The main reason for the poor EI levels in this area is the significant decline in SC, which has negatively contributed to the EI score. The decrease in SC is caused by reductions in FVC and precipitation. In addition, G also negatively contributes to EI in this area, and its decline is likewise driven by the decrease in FVC. In the central region, areas with good EI levels have consistently remained desert ecosystems.
Extensive and continuous gravel mulch layers are distributed across the deserts of Hami City. Gravel cover is a mechanical method of combating land desertification, as it directly protects soil from wind erosion [46]. Yang [47] experimentally confirmed that in desert–oasis regions, gravel cover helps retain soil moisture, reduce temperature, minimize evaporation, and prevent wind erosion. Chen’s study [48] also indicated that gravel layers in the desert–oasis transition zone form an ecological buffer against wind erosion and desertification. The presence of gravel mulch ensures the lower limit of EI levels in Hami City, as reflected in the small Extremely Poor EI class, accounting for only 0.01% of the total area. However, the vast extent of desert ecosystems, combined with precipitation constraints, also limits the upper threshold of EI levels, with the Excellent EI class accounting for only 0.02%.
Overall, ecosystem changes are determined by the fundamental ecological characteristics of each region and are further influenced by human activities and climate change. This study demonstrates that natural factors—particularly temperature, precipitation, and evapotranspiration—are the most important drivers of ecosystem changes in Hami City, which is consistent with previous research findings [49,50,51]. In future ecological restoration projects in extremely arid regions, local specific ecological characteristics should be taken into careful consideration. In desert areas with sparse shrub vegetation, planting native seedlings can effectively increase FVC and NPP, thereby further preventing soil wind erosion. If the surface is bare land without vegetation or gravel cover, laying a gravel layer can be considered to improve the ecological environment.
This study has some limitations. This study focuses on quantifying ecosystem changes and exploring their driving forces, but it lacks an analysis of the interactions among these driving forces. In addition, the indicator framework of this study is primarily designed for extremely arid regions and is not suitable for areas with abundant water resources or without strong winds.

5. Conclusions

This study systematically assessed the ecosystem changes in Hami City over the past 24 years from the perspectives of ecosystem pattern, ecosystem quality, and ecosystem services, as well as the natural and human-driven factors influencing these changes. The main conclusions are as follows:
  • From 2000 to 2023, the ecosystem pattern in Hami City changed significantly, mainly reflected by the expansion of the cropland ecosystem, grassland ecosystem, and urban ecosystem, along with a reduction in the desert ecosystem. Among these, the urban ecosystem increased the most.
  • From 2000 to 2023, FVC, NPP, and G in Hami City showed an increasing temporal trend, while SC showed a decreasing trend. Spatially, FVC exhibited a relatively slow overall change. NPP showed an increase in the central core area and a decrease in the surrounding central area. The central area of SC showed a decreasing trend. The southeastern region of G decreased significantly.
  • Overall, the ecosystem change in Hami City was at a moderate level. Areas with a moderate level of change were mainly distributed in the southwestern and southeastern parts of the city. Areas with a good level were primarily located in the northern and central regions, while areas with a poor level were mainly distributed in the northern, central, and southeastern parts of Hami City.
  • Ecological fundamental factors such as temperature, precipitation, and evapotranspiration were the most important driving forces of ecosystem change in Hami City. Among these, the rate of temperature change was the most critical driver. The rates of change in evapotranspiration, precipitation, soil moisture, and GDP also played key roles in determining the degree of ecosystem change in Hami City.
  • Future studies should explore the presence and ecological role of gravel layers, which may help reduce wind erosion and conserve soil moisture, and investigate the interactions among ecosystem driving forces. The indicator framework developed here should be tested in other arid regions to improve its applicability. Strategies for mitigating or adapting to climate change must be implemented promptly to ensure the sustainable development of ecosystems in arid regions.

Author Contributions

Conceptualization, Z.L. and C.L.; methodology, Z.L. and C.L.; software, Z.L. and C.L.; validation, Z.L. and C.L.; formal analysis, Z.L., Y.W. and S.W.; investigation, Z.L., C.L., Y.W. and S.W.; resources, Z.L., C.L., Y.W. and S.W.; data curation, Z.L. and C.L.; writing—original draft preparation, Z.L.; writing—review and editing, C.L.; visualization, Z.L. and C.L.; supervision Y.W. and S.W.; project administration, C.L.; funding acquisition, C.L. All authors have read and agreed to the published version of the manuscript.

Funding

This research was funded by the “Key Research and development projects of Xinjiang Uygur Autonomous Region”, with grant number 2022B03025-5, and The Third Xinjiang Scientific Expedition “Ecological Environment Assessment of Clean Energy Investigation and Energy Mineral Development in Turpan Hami Basin”, with grant number 2021xjkk1100.

Data Availability Statement

Data supporting the reported results can be provided upon request.

Conflicts of Interest

The authors declare no conflicts of interest. The funders had no role in the design of the study; in the collection, analyses, or interpretation of data; in the writing of the manuscript; or in the decision to publish the results.

Abbreviations

The following abbreviations are used in this manuscript:
CECropland Ecosystem
DEDesert Ecosystem
DEMDigital Elevation Model
EIecological index
ET_RAAnnual mean rate of total evapotranspiration change
FEForest Ecosystem
FVCFractional Vegetation Cover
GGross weight of annual windbreak and sand fixation per unit area
GEGrassland Ecosystem
GDPGross Domestic Product
GDP_GRAnnual mean GDP growth rate
LUCCLand Use and Cover Change
MAPMean Annual Precipitation
MIN_RAAnnual mean rate of mining area change
NPPNet Primary Productivity
POP_GRAnnual mean population growth rate
PRE_RAAnnual mean rate of precipitation change
RMSERoot Mean Squared Error
RUSLERevised Universal Soil Loss Equation
RWEQRevised Wind Erosion Equation
SCSoil retention capacity
SM_RAAnnual mean rate of soil moisture change
TEM_RAAnnual mean rate of temperature change
UEUrban Ecosystem
WEWetland Ecosystem

References

  1. DeFries, R.S.; Foley, J.A.; Asner, G.P. Land-use choices: Balancing human needs and ecosystem function. Front. Ecol. Environ. 2004, 2, 249–257. [Google Scholar] [CrossRef]
  2. Paruelo, J.; Burke, I.; Lauenroth, W. Land-use impact on ecosystem functioning in eastern Colorado, USA. Glob. Change Biol. 2001, 7, 631–639. [Google Scholar]
  3. Foley, J.A.; DeFries, R.; Asner, G.P.; Barford, C.; Bonan, G.; Carpenter, S.R.; Chapin, F.S.; Coe, M.T.; Daily, G.C.; Gibbs, H.K. Global consequences of land use. Science 2005, 309, 570–574. [Google Scholar] [CrossRef] [PubMed]
  4. MacDonald, A.J.; Larsen, A.E.; Plantinga, A.J. Missing the people for the trees: Identifying coupled natural–human system feedbacks driving the ecology of Lyme disease. J. Appl. Ecol. 2019, 56, 354–364. [Google Scholar]
  5. Runting, R.K.; Bryan, B.A.; Dee, L.E.; Maseyk, F.J.; Mandle, L.; Hamel, P.; Wilson, K.A.; Yetka, K.; Possingham, H.P.; Rhodes, J.R. Incorporating climate change into ecosystem service assessments and decisions: A review. Glob. Change Biol. 2017, 23, 28–41. [Google Scholar]
  6. Xiao, F.; Ouyang, H.; Cheng, S.; Zhang, Q. Forest health ecological risk assessment in China. Ying Yong Sheng Tai Xue Bao = J. Appl. Ecol. 2004, 15, 349–353. [Google Scholar]
  7. Han, J.; Sun, Y.; Yang, F. Assessing drought risk of grassland ecosystem in Hulunbuir, China. Ecol. Indic. 2025, 175, 113522. [Google Scholar] [CrossRef]
  8. Jia, B.; Zhang, Z.; Ci, L.; Ren, Y.; Pan, B.; Zhang, Z. Oasis land-use dynamics and its influence on the oasis environment in Xinjiang, China. J. Arid. Environ. 2004, 56, 11–26. [Google Scholar] [CrossRef]
  9. Zhang, X.; Wu, T.; Du, Q.; Ouyang, N.; Nie, W.; Liu, Y.; Gou, P.; Li, G. Spatiotemporal changes of ecosystem health and the impact of its driving factors on the Loess Plateau in China. Ecol. Indic. 2025, 170, 113020. [Google Scholar]
  10. Fu, B.; Liu, Y.; Lü, Y.; He, C.; Zeng, Y.; Wu, B. Assessing the soil erosion control service of ecosystems change in the Loess Plateau of China. Ecol. Complex. 2011, 8, 284–293. [Google Scholar] [CrossRef]
  11. Wang, C.; Qiu, X.; Shen, H.; Rao, C. Evaluation mechanism of urban green competitiveness via a gray fuzzy comprehensive evaluation model. Ecol. Indic. 2025, 175, 113510. [Google Scholar] [CrossRef]
  12. Wang, D.; Zheng, J.; Song, X.; Ma, G.; Liu, Y. Assessing industrial ecosystem vulnerability in the coal mining area under economic fluctuations. J. Clean. Prod. 2017, 142, 4019–4031. [Google Scholar] [CrossRef]
  13. Li, M.; Liu, S.; Wang, F.; Liu, H.; Liu, Y.; Wang, Q. Costbenefit analysis of ecological restoration based on land use scenario simulation and ecosystem service on the Qinghai-Tibet Plateau. Glob. Ecol. Conserv. 2006, 34, 2022. [Google Scholar]
  14. Sui, X.; Sun, Y.; Wang, X.; Yuan, J. Research on ecological quality and restoration of fragile mining areas in the Yellow River Basin—The case of Xiegou coal mine. Ecol. Indic. 2025, 174, 113426. [Google Scholar] [CrossRef]
  15. Pullen, A.; Kapp, P.; Chen, N. Development of stratigraphically controlled, eolian-modified unconsolidated gravel surfaces and yardang fields in the wind-eroded Hami Basin, northwestern China. Bulletin 2018, 130, 630–648. [Google Scholar] [CrossRef]
  16. Hansen, M.; Song, X.-P. Vegetation Continuous Fields (VCF) Yearly Global 0.05 deg. 2018. Available online: https://doi.org/10.5067/MEaSUREs/VCF/VCF5KYR.001 (accessed on 11 November 2024).
  17. Running, S.; Zhao, M. MYD17A3HGF MODIS/Aqua Net Primary Production Gap-Filled Yearly L4 Global 500 m SIN Grid V006. 2019. Available online: https://doi.org/10.5067/MODIS/MYD17A3HGF.006 (accessed on 12 November 2024).
  18. Li, X.; Mao, D.; Xue, J.; Wang, S.; Chang, J.; Liu, X. Integrative assessment and management implications on loss of ecosystem services value of desert-oasis ecotone due to artificial oasis expansion. Glob. Ecol. Conserv. 2025, 58, e03450. [Google Scholar] [CrossRef]
  19. Guo, X.; Shao, Q.; Yang, F.; Liu, G.; Liu, S.; Zhang, X. Assessing the restoration status and potential of ecosystem services on the Loess Plateau. Ecol. Indic. 2022, 141, 109103. [Google Scholar] [CrossRef]
  20. Munson, S.; Bradford, J.; Hultine, K.R. An integrative ecological drought framework to span plant stress to ecosystem transformation. Ecosystems 2021, 24, 739–754. [Google Scholar] [CrossRef]
  21. Liu, H.; Gong, P.; Wang, J.; Clinton, N.; Bai, Y.; Liang, S. Annual dynamics of global land cover and its long-term changes from 1982 to 2015. Earth Syst. Sci. Data 2020, 12, 1217–1243. [Google Scholar] [CrossRef]
  22. Song, X.-P.; Hansen, M.C.; Stehman, S.V.; Potapov, P.V.; Tyukavina, A.; Vermote, E.F.; Townshend, J.R. Global land change from 1982 to 2016. Nature 2018, 560, 639–643. [Google Scholar] [CrossRef] [PubMed]
  23. Bakker, M.M.; Govers, G.; Kosmas, C.; Vanacker, V.; Van Oost, K.; Rounsevell, M. Soil erosion as a driver of land-use change. Agric. Ecosyst. Environ. 2005, 105, 467–481. [Google Scholar] [CrossRef]
  24. Zhang, H.; Fan, J.; Cao, W.; Harris, W.; Li, Y.; Chi, W.; Wang, S. Response of wind erosion dynamics to climate change and human activity in Inner Mongolia, China during 1990 to 2015. Sci. Total Environ. 2018, 639, 1038–1050. [Google Scholar] [PubMed]
  25. Zhang, B.; Cao, J.; Chen, D.; Li, X.; Liu, Y.; Wang, J.; Liu, T. Construction of watershed ecological security patterns with integrated of spatial variability: A case study of the Yellow River Basin, China. Ecol. Indic. 2024, 159, 111663. [Google Scholar] [CrossRef]
  26. Zhang, K.; Zhang, H.; An, Z.; Xue, C. Evaluation of windproof and sand fixation effect of protective system in the Desert oasis ecotone of Mingsha Mountain Dunhuang. Sci. Rep. 2025, 15, 546. [Google Scholar] [CrossRef]
  27. Cai, C.; Ding, S. Study of applying USLE and geographical information system IDRISI to predict soil erosion in small watershed. J. Soil Water Conserv. 2000, 2, 19–24. [Google Scholar]
  28. Wischmeier, W.H.; Smith, D.D. Predicting Rainfall Erosion Losses: A Guide to Conservation Planning; Department of Agriculture, Science and Education Administration: Washington, DC, USA, 1978. [Google Scholar]
  29. Williams, J.; Renard, K.; Dyke, P. A new method for assessing erosion’s effects on soil productivity. J. Soil Water Conserv. 1983, 38, 381–383. [Google Scholar] [CrossRef]
  30. Sun, L.; Liu, F.; Zhu, X.; Zhang, G. High-resolution digital mapping of soil erodibility in China. Geoderma 2024, 444, 116853. [Google Scholar] [CrossRef]
  31. Mao, L.; Mo, D.; Guo, Y.; Fu, Q.; Yang, J.; Jia, Y. Multivariate analysis of heavy metals in surface sediments from lower reaches of the Xiangjiang River, southern China. Environ. Earth Sci. 2013, 69, 765–771. [Google Scholar]
  32. Arong, L.; Dongmei, Z.; Jing, M.; Xiaoyan, Z.; Jing, J.; Jun, Z. Evaluation of wind prevention and sand fixation function in Shule River Basin based on RWEQ model. Arid Land Geogr. 2024, 47, 58–67. [Google Scholar]
  33. Jiang, L.; Xiao, Y.; Rao, E.; Wang, L.; Ouyang, Z. Effects of land use and cover change (LUCC) on ecosystem sand fixing service in Inner Mongolia. Acta Ecol. Sin. 2016, 36, 3734–3747. [Google Scholar]
  34. Smith, F.B.; Carson, D.J. Some thoughts on the specification of the boundary-layer relevant to numerical modeling. Bound. LayerMeteorology 1977, 12, 307–330. [Google Scholar]
  35. Zhang, H.; Gao, Y.; Cui, Y. Evaluation the effects of wind erosion control projects in typical sandy area based on RWEQ Model. Acta Sci. Nat. Univ. Pekin. 2019, 55, 342–350. [Google Scholar]
  36. Li, J.; You, S.; Huang, J. Spatial distribution of ground roughness length based on GIS in China. J. Shanghai Jiaotong Univ. (Agric. Sci.) 2006, 24, 185–189. [Google Scholar]
  37. Yi, L.; Ren, Z.; Zhang, C.; Liu, W. Vegetation cover, climate and human activities on the Loess Plateau. Resour. Sci. 2014, 36, 166–174. [Google Scholar]
  38. Mathur, M.; Sundaramoorthy, S. Appraisal of arid land status: A holistic assessment pertains to bio-physical indicators and ecosystem values. Ecol. Process. 2018, 7, 41. [Google Scholar] [CrossRef]
  39. Yang, Y.; Shi, Y.; Sun, W.; Chang, J.; Zhu, J.; Chen, L.; Wang, X.; Guo, Y.; Zhang, H.; Yu, L. Terrestrial carbon sinks in China and around the world and their contribution to carbon neutrality. Sci. China Life Sci. 2022, 65, 861–895. [Google Scholar] [CrossRef]
  40. Oerlemans, J.; Fortuin, J. Sensitivity of glaciers and small ice caps to greenhouse warming. Science 1992, 258, 115–117. [Google Scholar] [CrossRef]
  41. Filonchyk, M.; Peterson, M.; Hurynovich, V. Air pollution in the Gobi Desert region: Analysis of dust-storm events. Q. J. R. Meteorol. Soc. 2021, 147, 1097–1111. [Google Scholar] [CrossRef]
  42. Goudie, A.S. The history and nature of wind erosion in deserts. Annu. Rev. Earth Planet. Sci. 2008, 36, 97–119. [Google Scholar] [CrossRef]
  43. Li, C.; Fu, B.; Wang, S.; Stringer, L.C.; Wang, Y.; Li, Z.; Liu, Y.; Zhou, W. Drivers and impacts of changes in China’s drylands. Nat. Rev. Earth Environ. 2021, 2, 858–873. [Google Scholar] [CrossRef]
  44. Chi, W.; Zhao, Y.; Kuang, W.; He, H. Impacts of anthropogenic land use/cover changes on soil wind erosion in China. Sci. Total Environ. 2019, 668, 204–215. [Google Scholar] [CrossRef]
  45. Wei, W.; Pan, D.; Feng, J. Tradeoffs between soil conservation and soil-water retention: The role of vegetation pattern and density. Land Degrad. Dev. 2022, 33, 18–27. [Google Scholar] [CrossRef]
  46. Kaseke, K.; Mills, A.; Henschel, J.; Seely, M.; Esler, K.; Brown, R. The effects of desert pavements (gravel mulch) on soil micro-hydrology. Pure Appl. Geophys. 2012, 169, 873–880. [Google Scholar] [CrossRef]
  47. Qiu, Y.; Chen, X.; Wang, Y.; Zhang, Y.; Xie, Z. What drives soil degradation after gravel mulching for 6 years in northwest China? Front. Microbiol. 2023, 14, 1224195. [Google Scholar] [CrossRef]
  48. Chen, Y.; Fang, G.; Li, Z.; Zhang, X.; Gao, L.; Elbeltagi, A.; Shaer, H.E.; Duan, W.; Wassif, O.M.A.; Li, Y. The crisis in oases: Research on ecological security and sustainable development in arid regions. Annu. Rev. Environ. Resour. 2024, 49, 1–20. [Google Scholar] [CrossRef]
  49. Grimm, N.B.; Groffman, P.; Staudinger, M.; Tallis, H. Climate change impacts on ecosystems and ecosystem services in the United States: Process and prospects for sustained assessment. In The US National Climate Assessment: Innovations in Science and Engagement; Springer: Berlin/Heidelberg, Germany, 2015; pp. 97–109. [Google Scholar]
  50. Ni, J. Impacts of climate change on Chinese ecosystems: Key vulnerable regions and potential thresholds. Reg. Environ. Change 2011, 11, 49–64. [Google Scholar] [CrossRef]
  51. Ren, Y.; Zhang, F.; Li, J.; Zhao, C.; Jiang, Q.; Cheng, Z. Ecosystem health assessment based on AHP-DPSR model and impacts of climate change and human disturbances: A case study of Liaohe River Basin in Jilin Province, China. Ecol. Indic. 2022, 142, 109171. [Google Scholar] [CrossRef]
Figure 1. Overview of the study area in Hami City. (a) Geographic location of the study area; (b) elevation map of the study area; (c) ecosystem types within the study area; (d) area percentage of different ecosystem types. Abbreviations: CE is cropland ecosystem; FE is forest ecosystem; GE is grassland ecosystem; WE is wetland ecosystem; UE is urban ecosystem; DE is desert ecosystem.
Land 14 02212 g001
Figure 2. Field photographs of open-pit coal mines in Hami City. (a,b) Naomao Lake Coal Mine; (c,d) Shitoumei Coal Mine.
Land 14 02212 g002
Figure 3. Technology roadmap.
Land 14 02212 g003
Figure 4. Hami City ecosystem type transformation (2000–2023). CE is cropland ecosystem; FE is forest ecosystem; GE is grassland ecosystem; UE is urban ecosystem; DE is desert ecosystem.
Land 14 02212 g004
Figure 5. Spatiotemporal variation in ecosystem quality (2000–2023). (a) FVC change slope; (b) annual mean time series of FVC; (c) NPP change slope; (d) annual mean time series of NPP. FVC is the Fractional Vegetation Cover, and NPP is the Net Primary Productivity. SD is the standard deviation.
Land 14 02212 g005
Figure 6. Spatiotemporal variation in ecosystem services (2000–2023). (a) SC change slope; (b) annual mean time series of SC; (c) G change slope; (d) annual mean time series of G. SC is the annual variation in soil and water conservation capacity. G is the annual variation rate of windbreak and sand fixation per unit area. SD is the standard deviation.
Land 14 02212 g006
Figure 7. Distribution of EI change levels in Hami City.
Land 14 02212 g007
Figure 8. Importance of driving factors for EI scores (based on random forest). TEM_RA is annual mean rate of temperature change; PRE_RA is annual mean rate of precipitation change; SM_RA is annual mean rate of soil moisture change; ET_RA is annual mean rate of total evapotranspiration change; MIN_RA is annual mean rate of mining area change; GDP_GR is annual mean GDP growth rate; POP_GR is annual mean population growth rate.
Land 14 02212 g008
Figure 9. Mean annual precipitation (MAP) and standard deviation in Hami City (2000–2023). MAP is Mean annual precipitation (mm).
Land 14 02212 g009
Table 1. Data sources and details.
NameSourceSource DescriptionNotes
FVC [16]https://lpdaac.usgs.gov/ (accessed on 11 November 2024)The website provides terrestrial remote sensing data, tools, and resources.The original spatial resolution was 250 m, and it was resampled to 1 km.
NPP [17]https://lpdaac.usgs.gov/ (accessed on 12 November 2024)The original spatial resolution was 500 m, and it was resampled to 1 km.
Temperaturehttp://data.tpdc.ac.cn/ (accessed on 14 November 2024)The website is China’s National Tibetan Plateau Data Center, offering meteorological, ecological, and hydrological datasets for the Tibetan Plateau and nearby regions.The original spatial resolution was 1 km.
Precipitationhttp://data.tpdc.ac.cn/ (accessed on 14 November 2024)The original spatial resolution was 1 km.
Soil moisturehttp://data.tpdc.ac.cn/ (accessed on 14 November 2024)The original spatial resolution was 0.5°, and it was resampled to 1 km.
Wind speedhttps://cds.climate.copernicus.eu/ (accessed on 15 November 2024)The website is the Copernicus Climate Data Store, providing climate data and tools.The original spatial resolution was 0.1°, and it was resampled to 1 km. Variables include east–west and north–south components at a 10 m height.
Snow coverhttps://cds.climate.copernicus.eu/cdsapp#!/dataset/reanalysis-era5-land (accessed on 16 November 2024)The website provides the ERA5-Land reanalysis dataset.The original spatial resolution was 0.1°, and it was resampled to 1 km.
Evapotranspirationhttps://disc.gsfc.nasa.gov/ (accessed on 17 November 2024)The website is responsible for archiving and distributing Earth science data.The original spatial resolution was 0.1°, and it was resampled to 1 km.
Calcium carbonate contenthttps://doi.org/10.4060/cc3823en (accessed on 19 November 2024)The link is a resource from the Food and Agriculture Organization (FAO) knowledge base.Data were resampled to a spatial resolution of 1 km.
Mining areahttps://earth.google.com/ (accessed on 19 November 2024)The website is Google Earth, offering global high-resolution satellite imagery and related features.Converted into raster data with a 1 km resolution.
Populationhttps://landscan.ornl.gov/ (accessed on 21 November 2024)The website provides global population distribution data.The original spatial resolution was 1 km.
DEMhttps://www.earthdata.nasa.gov/ (accessed on 23 November 2024)The website provides Earth science data.The original spatial resolution was 12.5 m, and it was resampled to 1 km.
GDPhttps://www.stats.gov.cn/ (accessed on 3 April 2025)The website is the official site of China’s National Bureau of Statistics, publishing statistical data and policies.Converted into raster data with a 1 km resolution.
Organic matter contentDetermined by the potassium dichromate external heating methodLab-determined.
Contents of sand, silt, and clay in the soilHydrometer methodParticle size classification was conducted according to the USDA soil texture classification system.
Table 2. Ecosystem change evaluation indicator system category.
CategoryPrimary IndicatorSecondary Indicator
Ecosystem PatternArea of each ecosystem typeProportion of ecosystem area
Area change rate of ecosystem types
Direction of ecosystem change
Area of each category
Ecosystem QualityFractional Vegetation CoverFractional Vegetation Cover
Net primary productivityVegetation net primary productivity
Ecosystem ServicesSoil RetentionSoil Retention
Windbreak and Sand FixationSoil Erosion Modulus
Windbreak and Sand Fixation Amount
Table 3. Driving factors of EI changes used in the random forest model.
FactorsName
TEM_RAAnnual mean rate of temperature change/%
PRE_RAAnnual mean rate of precipitation change/%
SM_RAAnnual mean rate of soil moisture change/%
ET_RAAnnual mean rate of total evapotranspiration change/%
MIN_RAAnnual mean rate of mining area change/%
GDP_GRAnnual mean GDP growth rate/%
POP_GRAnnual mean population growth rate/%
Table 4. Change matrix of ecosystem types in Hami City (2000–2023) (Unit: km2).
From/ToCEFEGEWEUEDE
CE945.423.0079.642.0070.2216.01
FE22.00131.44305.370.002.0016.07
GE541.20157.8718,038.200.0077.682946.02
WE10.370.0094.25146.315.00137.19
UE8.610.005.640.00102.2234.99
DE155.6832.819367.8772.22240.22103,386.38
CE is cropland ecosystem; FE is forest ecosystem; GE is grassland ecosystem; WE is wetland ecosystem; UE is urban ecosystem; DE is desert ecosystem.
Table 5. Area changes in ecosystems in Hami City (2000–2023).
CEFEGEWEUEDE
Area in 2000/km21132.75551.0921,785.87412.97156.38113,171.35
Proportion/%0.83%0.40%15.88%0.30%0.11%82.48%
Area in 2023/km21745.16361.6327,894.34232.55549.27106,415.83
Proportion/%1.27%0.26%20.33%0.17%0.40%77.56%
Change in area/km2612.41−189.466108.48−180.42392.88−6755.52
Proportion/%4.30%1.33%42.90%1.27%2.76%47.44%
Dynamics/%54.06%34.38%28.04%43.69%251.23%5.97%
Outflow area/km2170.87345.433722.76246.8149.239868.8
Proportion/%1.19%2.40%25.85%1.71%0.34%68.51%
Inflow area/km2737.85193.679852.7774.22395.123150.18
Proportion/%5.12%1.34%68.40%0.52%2.74%21.87%
CE is cropland ecosystem; FE is forest ecosystem; GE is grassland ecosystem; WE is wetland ecosystem; UE is urban ecosystem; DE is desert ecosystem.
Disclaimer/Publisher’s Note: The statements, opinions and data contained in all publications are solely those of the individual author(s) and contributor(s) and not of MDPI and/or the editor(s). MDPI and/or the editor(s) disclaim responsibility for any injury to people or property resulting from any ideas, methods, instructions or products referred to in the content.