Article

Evolution Characteristics and Driving Mechanisms of Innovation’s Spatial Pattern in Beijing–Tianjin–Hebei Urban Agglomeration Under Coordinated Development Policy: Evidence from Patent Data

1
School of Architecture and Art Design, Hebei University of Technology, Tianjin 300130, China
2
Key Laboratory of Healthy Human Settlements in Hebei Province, Tianjin 300130, China
3
School of Architecture, Tianjin University, Tianjin 300072, China
4
Sichuan Hongtai Tongji Architectural Design Co., Ltd., Meishan 620020, China
*
Author to whom correspondence should be addressed.
Land 2025, 14(11), 2206; https://doi.org/10.3390/land14112206
Submission received: 5 October 2025 / Revised: 4 November 2025 / Accepted: 4 November 2025 / Published: 6 November 2025
(This article belongs to the Special Issue Land Space Optimization and Governance)

Abstract

Against the backdrop of global economic digital transformation and the rapid flow of creative factors, innovation spaces, as the key carriers of inventive activities, drive high-quality development in urban agglomerations. This study develops a three-dimensional framework of “Spatial Structure–Factor Synergy–Institutional Drivers” to uncover the evolution of innovation spaces and industrial shifts in the Beijing–Tianjin–Hebei urban agglomeration, China. Methodologically, spatial econometric techniques were applied to capture both the overall concentration and spatial disparities of innovation. Spatial Gini and variation coefficients measured innovation clustering, while standard deviation ellipses and location entropy identified spatial linkages among high-tech innovation clusters. Geographically weighted regression models explored spatial heterogeneity in influencing factors, and a policy intensity index was constructed to assess the effectiveness of differentiated policy interventions in optimizing innovation resources. Key findings include the following: (1) Innovation spaces are spatially polarized in a “core–periphery” pattern, yet require cross-regional collaboration. Concurrently, high-tech industries demonstrate a gradient structure: central cities leading in R&D, sub-central cities driving industrial applications, and node cities achieving specialized development through industrial transfer. (2) The driving mechanisms exhibit significant spatial heterogeneity: economic density shows diminishing returns in core areas, whereas R&D investment and ecological quality demonstrate increasingly positive effects, with foreign investment’s role evolving positively post-institutional reforms. (3) Regional innovation synergy has formed a preliminary framework, but strengthening sustainable policy mechanisms remains pivotal to advancing market-driven coordination and dismantling administrative barriers. These findings underscore the importance of integrated policy reforms for achieving balanced and high-quality innovation development in administratively coordinated urban agglomerations like BTH.

1. Introduction

Amid intensifying global technological competition and accelerating industrial transformation, innovation drives high-quality development and cultivates new quality productive forces [1]. Innovation spaces, as the spatial manifestations of innovative activities, comprehensively reflect a region’s creative capacity and knowledge-based economic development, thereby determining national innovative competitiveness. Within this framework, urban agglomerations serve as key platforms for the flow and agglomeration of innovation factors [2,3], and are undergoing a critical transition from scale expansion to quality enhancement [4]. Understanding the evolutionary patterns and driving mechanisms of innovation spaces within urban agglomerations is essential to improving the efficiency of innovation resource allocation [5] and strengthening policy coordination [6]—issues that remain theoretically and practically significant.
However, a notable theoretical shortfall persists, particularly in the context of the Beijing–Tianjin–Hebei (BTH) urban agglomeration. As a key engine of China’s economic and innovative growth, it faces the dual challenge of reducing regional disparities and advancing coordinated governance. Elevated to a national priority in 2014, the BTH coordination strategy was first outlined in the 2015 Planning Framework [7]. It has since been advanced through the 2023 Three-Year Action Plan and the 14th Five-Year Plan, fostering cross-sectoral collaboration in transportation, ecology, and high-tech industries [8]. These initiatives facilitate Beijing’s relocation of non-capital functions and model institutional reforms. However, high-tech industries—the core drivers of regional innovation given their knowledge intensity and high value-added output [9]—continue to face persistent constraints. Current research on the BTH region’s innovation space covers three main domains: spatial structure evolution [10,11], collaborative development mechanisms [12,13,14], and macro-scale innovation assessments [15,16,17]. Yet a dedicated theoretical framework for administratively coordinated urban clusters remains underdeveloped, necessitating new research paradigms.
Despite these advancements, significant research problems persist, including technological constraints [18], uneven industrial distribution [19], and significant talent composition disparities [20,21]. These issues lead to the following research questions: (1) How has the innovation space structure evolved in the BTH region during the research period (2014–2023)? (2) What drives the geographic disparities and spatial heterogeneity in innovation output? (3) How do regional coordination policies influence the flow of innovation factors?
To address these questions, this study establishes a novel three-dimensional analytical framework of “Spatial Structure–Factor Synergy–Institutional Drivers” (Figure 1) to analyze differentiated development within the BTH urban agglomeration. It innovates by integrating heterogeneous spatial analysis with institutional mechanisms, offering differentiated insights beyond conventional market-oriented models, and aims to (1) uncover the evolution of innovation spaces and industrial shifts in the BTH urban agglomeration; (2) identify the spatial distribution patterns of innovation and examine the spatial heterogeneity of influencing factors; and (3) quantify the potential of tailored policies for optimizing innovation factor allocation. Through this approach, this study provides theoretical insights and practical guidance for enhancing innovation policy coordination in the region.
Based on this analytical foundation, the following testable hypotheses are proposed: (1) Innovation spaces in the BTH urban agglomeration exhibit a “core–periphery” structure, with innovation factors continuously diffusing over time. (2) The impact of key influencing factors on innovation output shows significant spatial heterogeneity across the region. (3) The strength of coordinated development policies fostering urban innovation synergy and balanced development is high.
This article is organized as follows: Section 2 reviews the literature on innovation spaces. Section 3 introduces the study area and methodology. Section 4 presents the results on spatiotemporal evolution and driving mechanisms. Section 5 discusses the findings, including comparative analyses and policy implications. Section 6 concludes with a synthesis of key insights, limitations, and future directions.

2. Literature Review

2.1. Research on Theoretical Foundations

Innovation space refers to the spatial embodiment of innovation activity. It functions as a concentrated hub of the knowledge economy and innovative industries, encompassing not only physical infrastructure and built environments but also the dynamic interactions among economic, social, and cultural forces.
Research on innovation spaces within urban agglomerations traces its roots to Schumpeter’s innovation theory (1912), which defines innovation as a recombination of production resources [22]. Since then, this field has evolved into a multidisciplinary framework spanning economics, geography, and urban planning. A foundational concept in this evolution is that of agglomeration economies, first introduced by Alfred Marshall (1890) [23] and later expanded by scholars like Jane Jacobs (1969) [24]. This framework emphasizes the advantages of spatial proximity—lower transaction costs, knowledge spillovers, and access to specialized labor and resources—all of which enhance innovation within urban clusters. Michael Porter’s (1990) cluster theory further enriches this perspective by illustrating how geographically concentrated networks of firms, suppliers, and institutions generate competitive advantages [25]. His work highlights innovation spaces as ecosystems where collaboration and competition coexist to drive technological advancement and economic growth. Urban planning scholarship has also advanced this discourse. The smart city concept redefines innovation spaces as technologically integrated environments that harness digital infrastructure and data-driven governance to improve urban efficiency and sustainability [26]. Similarly, Florida’s (2002) creative class theory underscores the importance of attracting and retaining talent by cultivating cultural vibrancy, openness, and a high quality of life [27].
Through these theoretical developments, innovation spaces have come to be recognized as vital engines of urban transformation. They leverage spatial, social, and institutional factors to promote innovation-led growth and regional competitiveness [28,29]. Integrating these diverse perspectives allows innovation spaces to be understood as complex, adaptive systems that both shape and are shaped by the processes of urban development. However, these theories face criticism for neglecting non-economic barriers, equity issues, overcrowding risks, digital divides, and structural inequalities like gentrification, highlighting the need for a more inclusive approach to ensure sustainable innovation-led growth.

2.2. Research on Evolution of Research Perspectives

Research on innovation spaces has evolved considerably, shifting from broad macro-level analyses to more focused, strategic micro-level investigations. This evolution reflects changing theoretical perspectives and the growing practical relevance of spatial innovation planning. Early studies emphasized macro-regional scales, exploring how innovation spaces clustered and diffused within the context of economic geography—particularly in high-tech industries and developed regions [30,31]. These works highlighted the role of spatial concentration in promoting knowledge spillovers, resource sharing, and innovation-driven growth within global technology hubs. Since the early 2000s, scholarly attention has increasingly turned to localized innovation networks, spatial coordination mechanisms, and quantitative spatial morphology [32,33,34]. This shift coincided with a growing recognition of the importance of governance structures and policy interventions in improving the efficiency and resilience of innovation ecosystems [35]. The integration of economics and urban planning further enriched the field, giving rise to new analytical approaches that link innovation spaces to urban cluster development and spatial planning design [36]. More recent research introduces micro-level concepts such as “innovation districts” and “makerspaces” [37,38], emphasizing urban regeneration, industrial chain integration, and multi-dimensional innovation mechanisms [39,40].
Furthermore, contemporary studies increasingly examine the global applicability of these frameworks, exploring how innovation spaces can be adapted to diverse economic, cultural, and institutional contexts—particularly in emerging economies [41,42]. By bridging macro-level insights with micro-level strategies, the study of innovation spaces continues to advance, offering new perspectives on fostering innovation-led urban development in an interconnected and rapidly evolving global landscape.

2.3. Research on the Influencing Factors

International studies categorize the drivers of innovation agglomeration into internal agglomeration factors and external spillover effects [43]. Internal factors primarily consist of innovation inputs and the innovation environment. The main contributors to innovation inputs are enterprises and universities, with human capital being the most critical factor [44]. Regions endowed with a highly skilled labor force are more conducive to innovation. The mobility of talent—whether through career transitions or entrepreneurial activities—facilitates the rapid diffusion of knowledge [45]. Additionally, the innovation environment, encompassing innovation services, industrial specialization and diversification, manufacturing foundations, and the scale structure of regional enterprises, significantly influences the development of innovation spaces.
External spillover effects primarily stem from knowledge spillovers among firms, spillovers from universities and research institutions, and the sharing of innovation environments. Due to the pronounced distance decay effect in knowledge dissemination, firms optimize their location strategy by clustering within the same knowledge spillover space as their competitors [46,47]. Universities and research institutions, as key hubs of knowledge production, provide firms with technological development and innovation resources, reducing innovation costs, enhancing efficiency, and strengthening regional comparative advantages. Furthermore, shared innovation environments foster a self-reinforcing cycle of innovation and growth, further promoting the agglomeration of innovation spaces.

2.4. Limitations of the Existing Research

Existing research on innovation spaces has evolved from descriptive observation to more systematic theorization. However, most studies focus on market-driven clusters such as the Yangtze River Delta [48,49] and Pearl River Delta [50,51], while administratively coordinated regions like the Beijing–Tianjin–Hebei urban agglomeration have received comparatively limited attention. In addition, the spatial heterogeneity of innovation within urban agglomerations remains insufficiently examined, which constrains the broader applicability of current theoretical frameworks.
Most existing studies rely on regional statistical data and emphasize macro-level quantitative analyses. They primarily investigate the organizational structures of innovation spaces, patterns of urban stock development, and the clustering of creative and high-tech industries, offering valuable insights into spatial and industrial dynamics. However, the relationships between innovation spaces and other forms of urban space remain poorly understood. Current research often emphasizes descriptive case studies while neglecting firm-level analyses that could reveal the internal mechanisms shaping innovation spaces within urban agglomerations. Furthermore, few studies integrate contemporary dynamics to examine how technology, industry, and institutions interact. Future research should focus on developing institutional frameworks tailored to China’s specific governance and spatial context.

3. Research Area and Methodology

3.1. Study Area

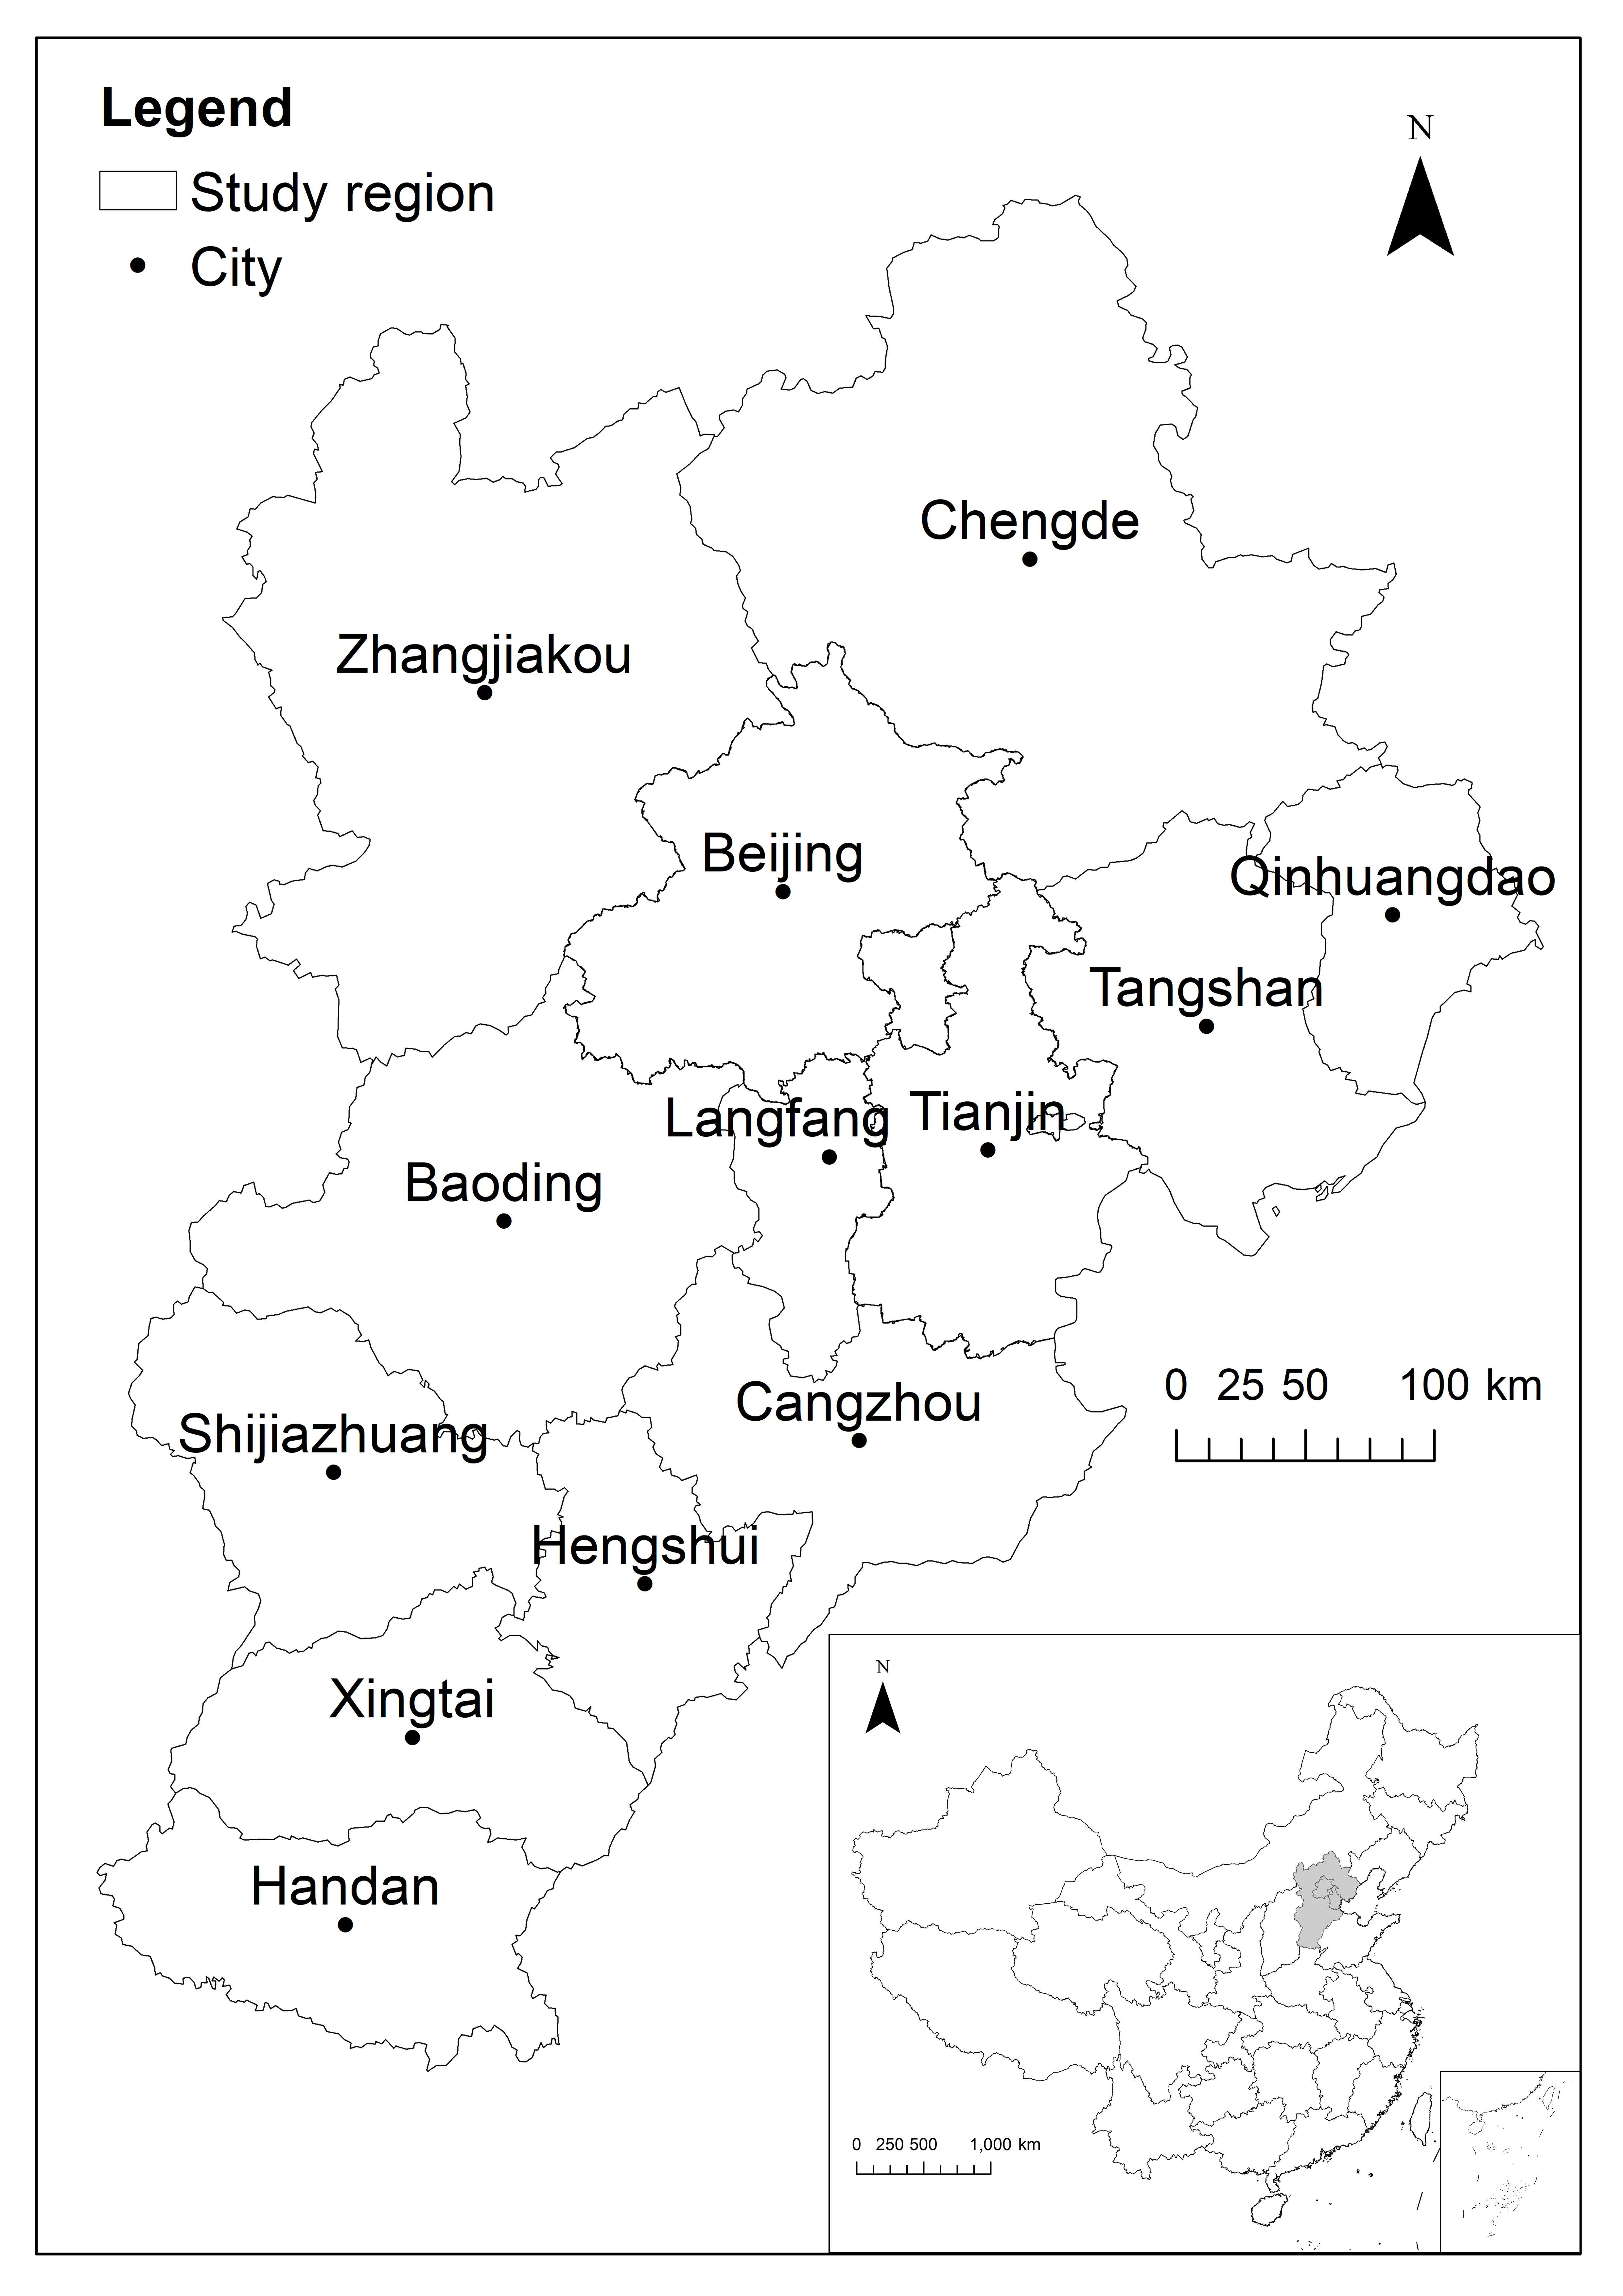
The Beijing–Tianjin–Hebei (BTH) urban agglomeration, situated in North China, is the region’s largest and most innovative cluster, playing a leading role in developing the Bohai Rim Economic Zone. BTH comprises 13 cities under the “2 + 11” system established in the BTH coordinated development plan: the municipalities of Beijing and Tianjin, along with 11 prefecture-level cities in Hebei Province—Shijiazhuang, Tangshan, Qinhuangdao, Handan, Baoding, Chengde, Zhangjiakou, Cangzhou, Langfang, Hengshui, and Xingtai, covering a total area of 216,000 square kilometers (Figure 2). Since the implementation of the coordinated development policy, the urban agglomeration has continuously generated innovative outputs and enhanced its overall innovation capabilities. Beijing serves as an innovation hub, driving progress with its cutting-edge research and resources; Tianjin complements this by translating advanced manufacturing technologies into practical applications; and Hebei Province provides essential support through industrial upgrading and supply chain collaboration. Despite these gains, disparities in innovation development persist across the region, posing challenges to balanced growth.

3.2. Data Sources

This study employs patent grants as the primary dataset to measure the spatial development of innovation [52]. The analysis encompasses Beijing, Tianjin, and 13 prefecture-level cities in Hebei Province, covering a total of 194 counties. The specific data types and sources are presented in Table 1. The patent data include invention, utility model, and design patents. To prevent double-counting, duplicate assignees and inventors were removed based on standardized names and addresses. For accurate geographical identification, the Applicant’s City and Country fields were directly selected using the advanced search options of the CNIPA database. Furthermore, subsector mapping from IPC codes to six high-tech industry categories was conducted using the official Classification of High-tech Industries (Manufacturing) (2017) concordance tables. Zero patent counts were retained without imputation to reflect true innovation gaps. To normalize variable distributions and reduce heteroscedasticity, log transformations were applied to key variables. All spatial analyses were performed and visualized using ArcMap 10.8.

3.3. Methodology

3.3.1. Spatial Gini Coefficient

The Spatial Gini Coefficient measured the overall concentration of patent grants across the BTH region, with values ranging from 0 to 1. Higher values indicate greater innovation agglomeration. This method offers an intuitive and effective means of assessing innovation concentration, supporting both cross-regional and temporal comparisons, though it remains sensitive to spatial scale and may obscure intra-unit variations. The results remain robust under alternative normalization schemes: although the coefficient value varies slightly when normalized by patents per GDP, the conclusion of pronounced spatial inequality among counties persists. The formula is
G = ( 1 / 2 N 2 X ¯ ) i = 1 N j = 1 N | X i   X j |
where G is the Spatial Gini Coefficient, N is the number of county-level units, X i and X j are the patent grants in counties i and j , and X ¯ is the mean patent grant count.

3.3.2. Spatial Variation Coefficient

The spatial variation coefficient was used to measure disparities in patent grants across the 194 districts and counties of the BTH urban agglomeration. Higher values indicate greater spatial disparities, while lower values denote a more equitable distribution. This method offers a straightforward indicator of relative dispersion, highlighting regional imbalances. The formula is
C V = i = 1 N X i X ¯ 2 / ( N / X ¯ )
where C V is the Spatial Coefficient of Variation, N is the number of county-level units, X i is the patent grants in county i , and X ¯ is the mean patent grant count.

3.3.3. Standard Deviation Ellipse and Spatial Centroid

The standard deviation ellipse model was applied to capture the directional characteristics and spatial dispersion of innovation activities. The major semi-axis indicates the principal orientation of data spread, and the minor semi-axis reflects its dispersion range. Greater differences between the axes indicate stronger directional tendencies. Key formulas are
X ¯ = i = 1 n w i x i / i = 1 n w i
Y ¯ = i = 1 n w i y i / i = 1 n w i
σ x = i = 1 n w i x i ~ c o s θ w i y i ~ s i n θ 2 / i = 1 n w i 2
σ y = i = 1 n w i x i ~ s i n θ w i y i ~ c o s θ 2 / i = 1 n w i 2
where X ¯ and Y ¯ are the weighted centroid coordinates; w i is the weight of observation i ; x i and y i are the geographic coordinates of point i ; x ~ i and y ~ i are the deviations of x i and y i from the centroid; θ is the ellipse rotation angle; σ x and σ y are the standard deviation along the rotated X-axis and Y-axis; and n is the number of spatial units.
Spatiotemporal shifts in innovation patterns were tracked by calculating the geographic centroids of patent grants [53]. Expressed in latitude and longitude, these centroids were derived as
X = i = 1 n G i x i / i = 0 n G i
Y = i = 1 n G i y i / i = 0 n G i
where X , Y is the centroid’s coordinates; ( x i , y i ) is the geographic coordinates of spatial unit i ; G i is the technological innovation capacity of the unit i ; and n is the number of spatial units.

3.3.4. Location Quotient

The Location Quotient was used to assess regional specialization in high-tech industries within the BTH region. While this measure may obscure firm-level variations and is sensitive to the choice of reference area, it effectively highlights comparative advantages and industry clustering patterns, supporting targeted policy formulation. The formula is
q i j = ( e i j e i ) / ( E j E )
where q i j is the Location Quotient of industry j in region i ; e i j is the number of patents in industry j in region i ; e i is the total patents in region i ; E j is the total patents in industry j; and E is the total patents across all industries.

3.3.5. Exploratory Regression and Geographically Weighted Regression

ArcMap 10.8’s Exploratory Regression tool was used to systematically identify the optimal Ordinary Least Squares (OLS) model that best explained patent grant variations against predefined criteria. Geographically Weighted Regression (GWR) then quantified spatial heterogeneity in innovation outputs [54], using geospatial weighting to generate localized estimates that account for spatial non-stationarity [55]. These methods offer key advantages in systematically selecting robust models and capturing spatial non-stationarity, while being limited respectively, by potentially excluded variables and sensitivity to bandwidth selection.
The core formula for GWR is
y i = β 0 ( u i , v i ) + k = 1 p β k u i , v i x i k + ε i
where y i is the dependent variable (patent grants) at location i ; x i k is the value of the k t h independent variable at location i ; β 0 ( u i , v i ) is the local intercept at coordinates ( u i , v i ) ; β k u i , v i is the local regression coefficient for the k t h variable at location i ; and ε i is the random error term at location i .
Building on prior research and observed innovation pattern evolution in the BTH region, patent grants were established as the dependent variable, and ten influencing factors across six dimensions (Table 2) were tested. Variable selection adhered to three key criteria: exclusion of those exhibiting statistical insignificance across all years; removal of variables incompatible with established theories in innovation economics; and elimination of any with a variance inflation factor (VIF) exceeding 10, signifying substantial multicollinearity. Ultimately, four core explanatory variables were selected: economic density (X1), R&D expenditure (X3), FDI (X6), and green space area (X9), for further GWR analysis to examine spatial heterogeneity. A fixed kernel GWR model was employed, with its bandwidth selected by the AICc to adapt to the spatial heterogeneity in data density. The analysis was conducted using the GCS_Beijing_1954 projected coordinate system.

3.3.6. Policy Strength Index (PSI)

To assess the policy impact of the BTH coordinated development policy [56], a composite Policy Strength Index (PSI) was constructed across six dimensions: economic foundation, innovation input, openness level, social welfare, transportation infrastructure, and ecological environment. Whereas the GWR selects significant, low-collinearity variables to identify key drivers of innovation output, the PSI aims to assess the overall policy impact across all six dimensions. It provides a comprehensive measure of policy effort, capturing synergistic effects across multiple dimensions. Therefore, it includes even variables with a weaker direct impact to better capture the policy’s synergistic effects.
P S I = i 1 N w i D i
where w i is the weight of the i t h dimension; D i is the standardized indicator value; and N is the number of distinct dimensions.

3.4. Technical Roadmap

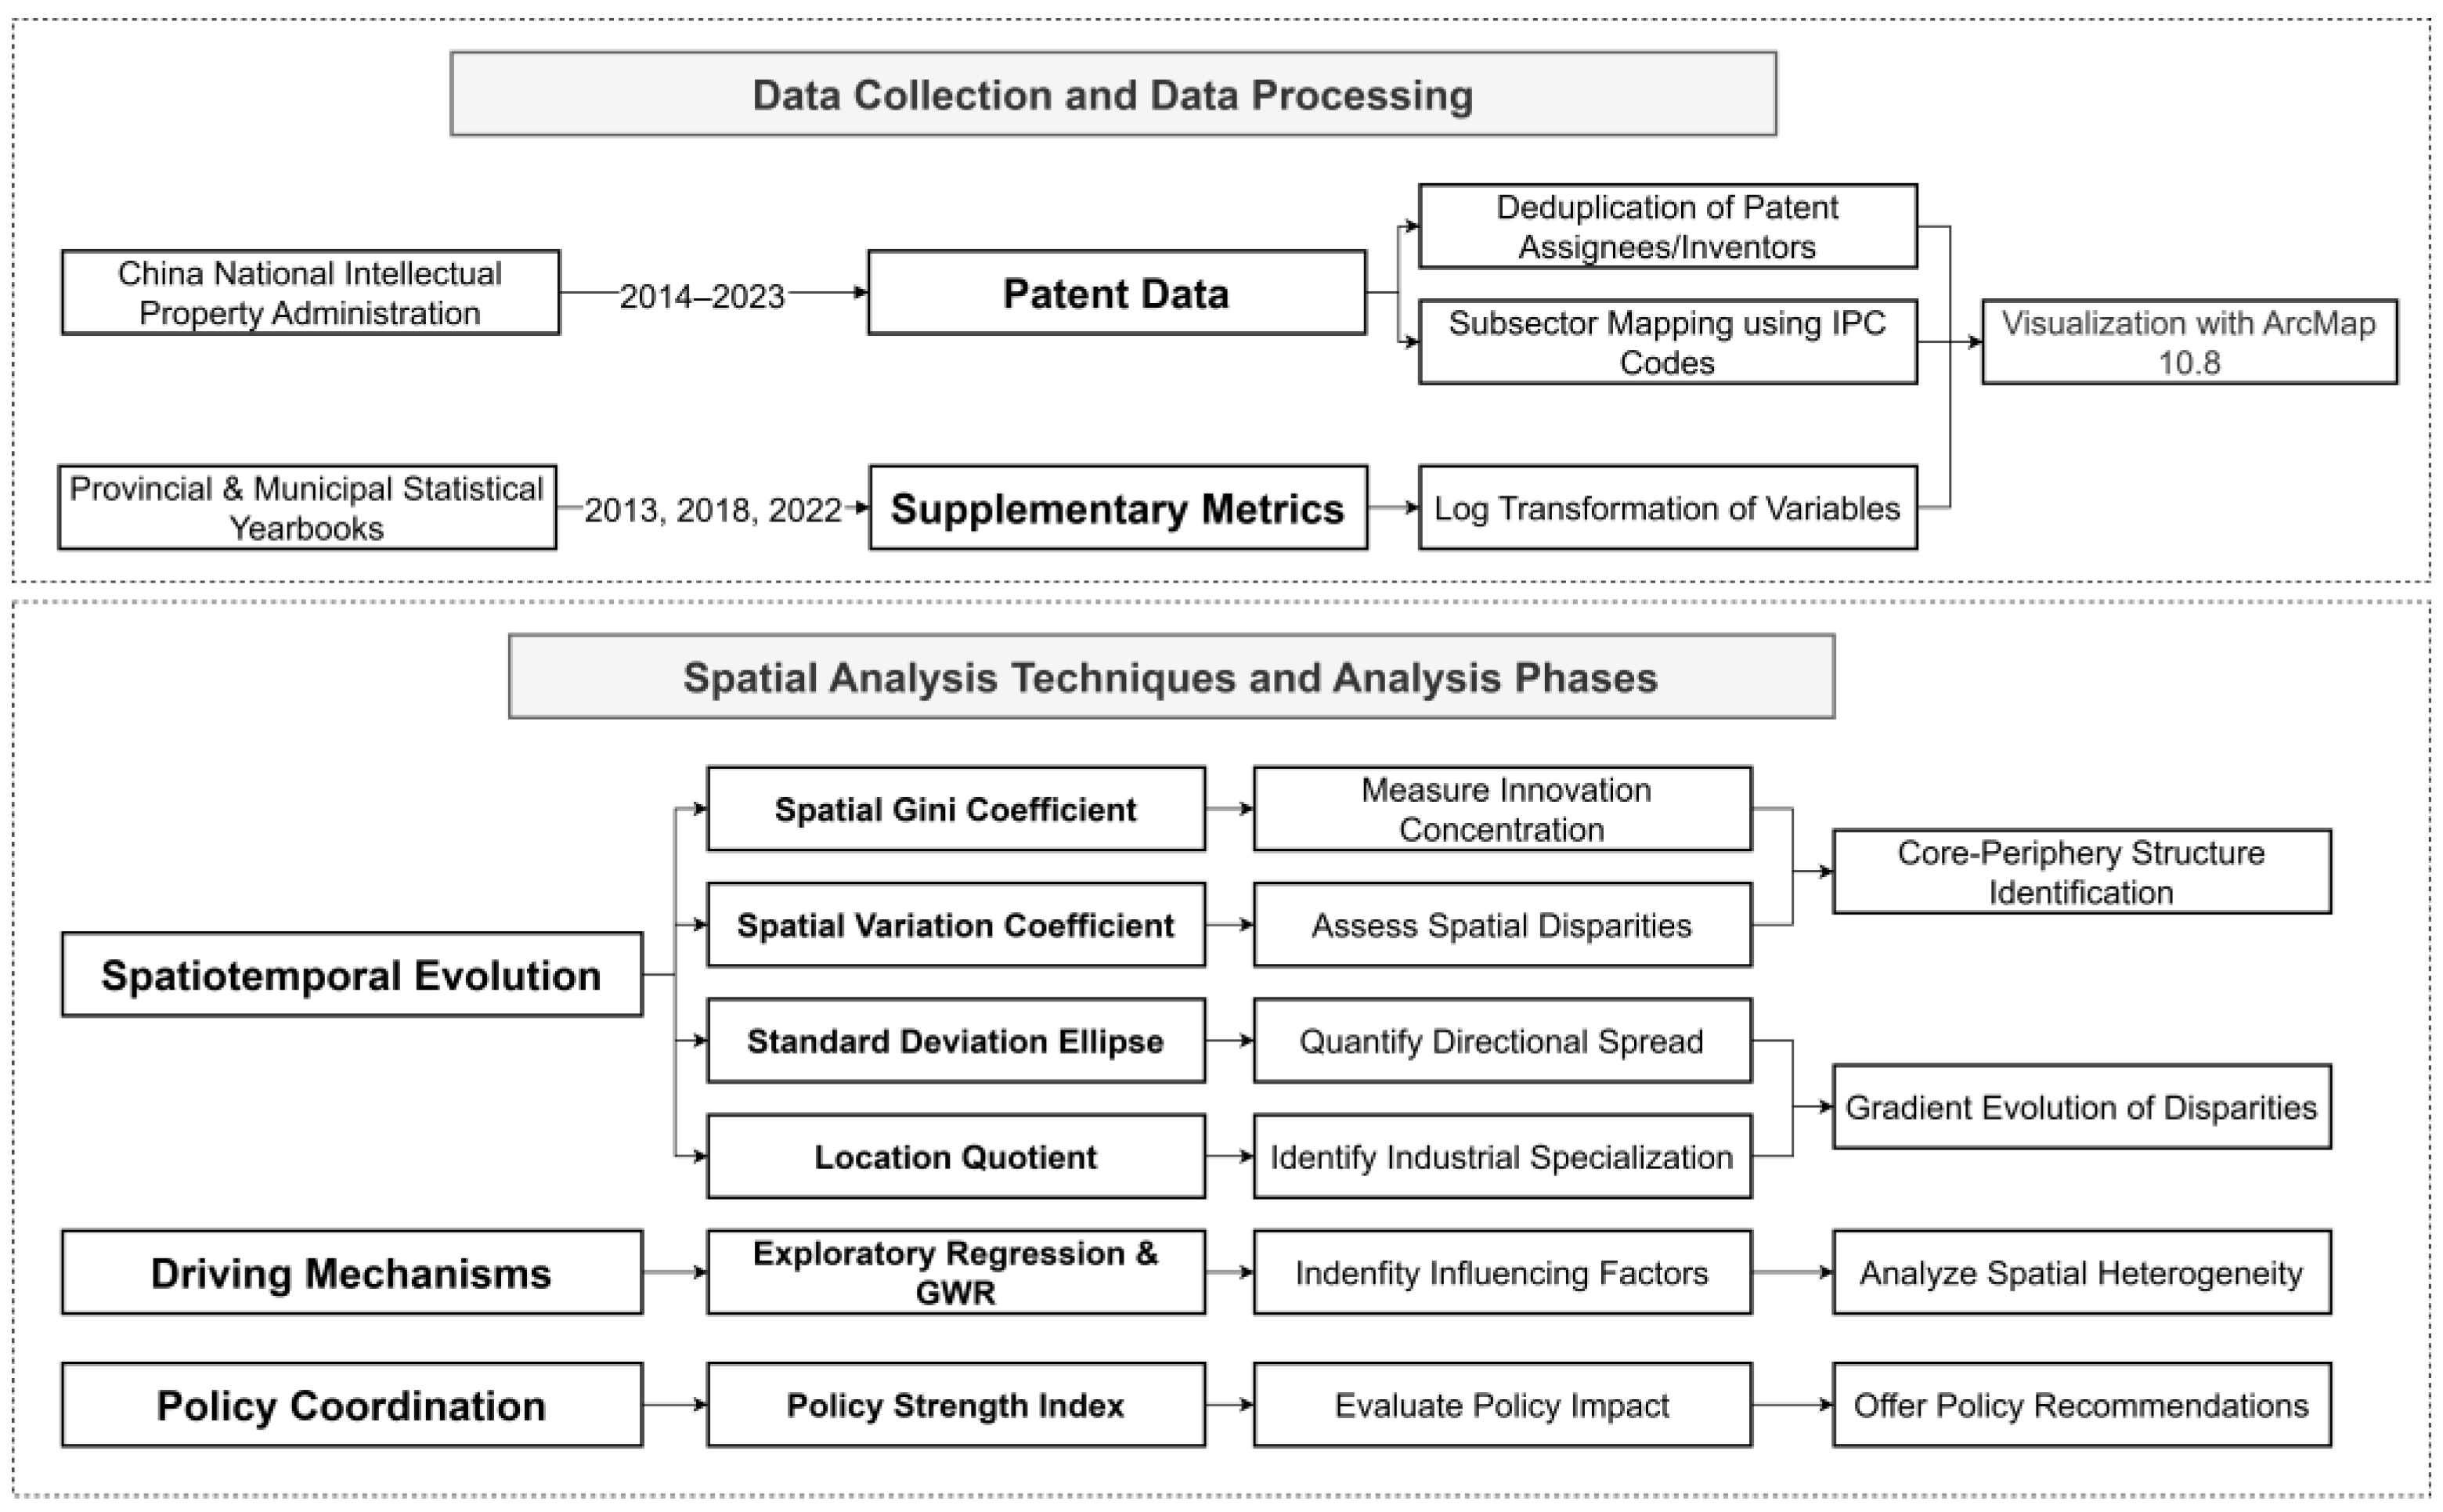
To achieve the research objectives, a detailed technical roadmap has been developed, as shown in Figure 3.

4. Results

4.1. Spatiotemporal Evolution of Innovation Patterns

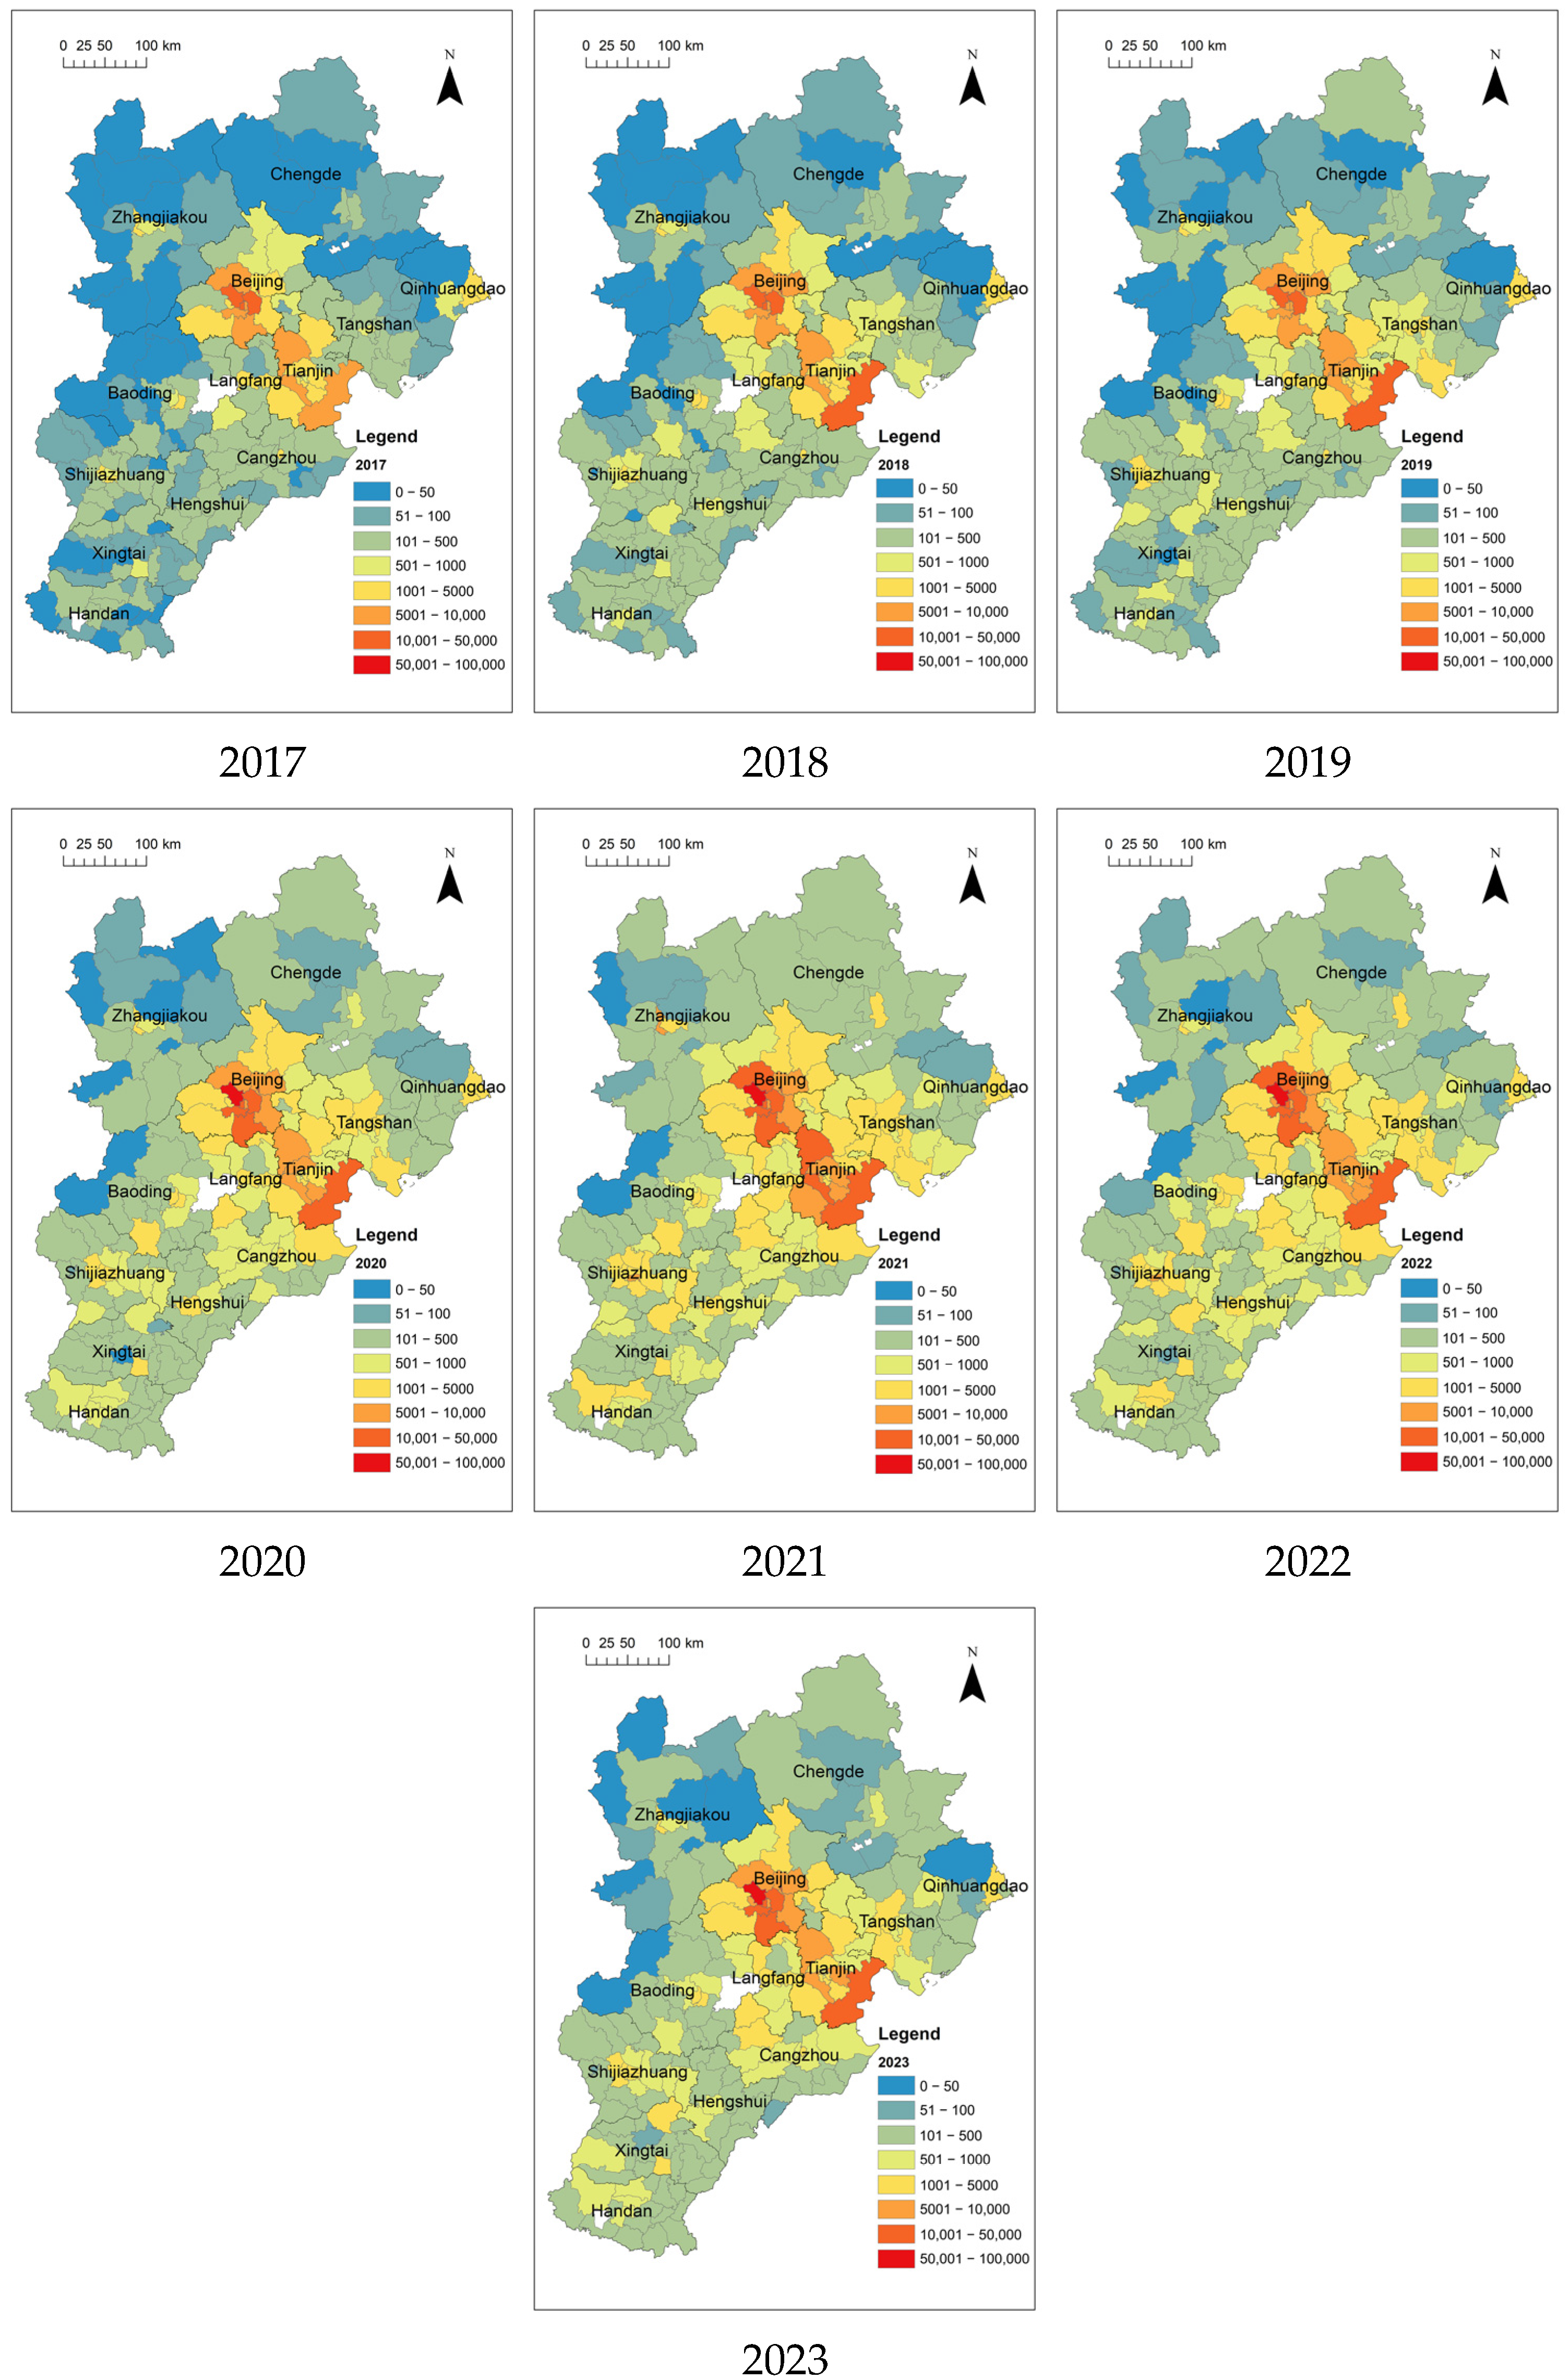
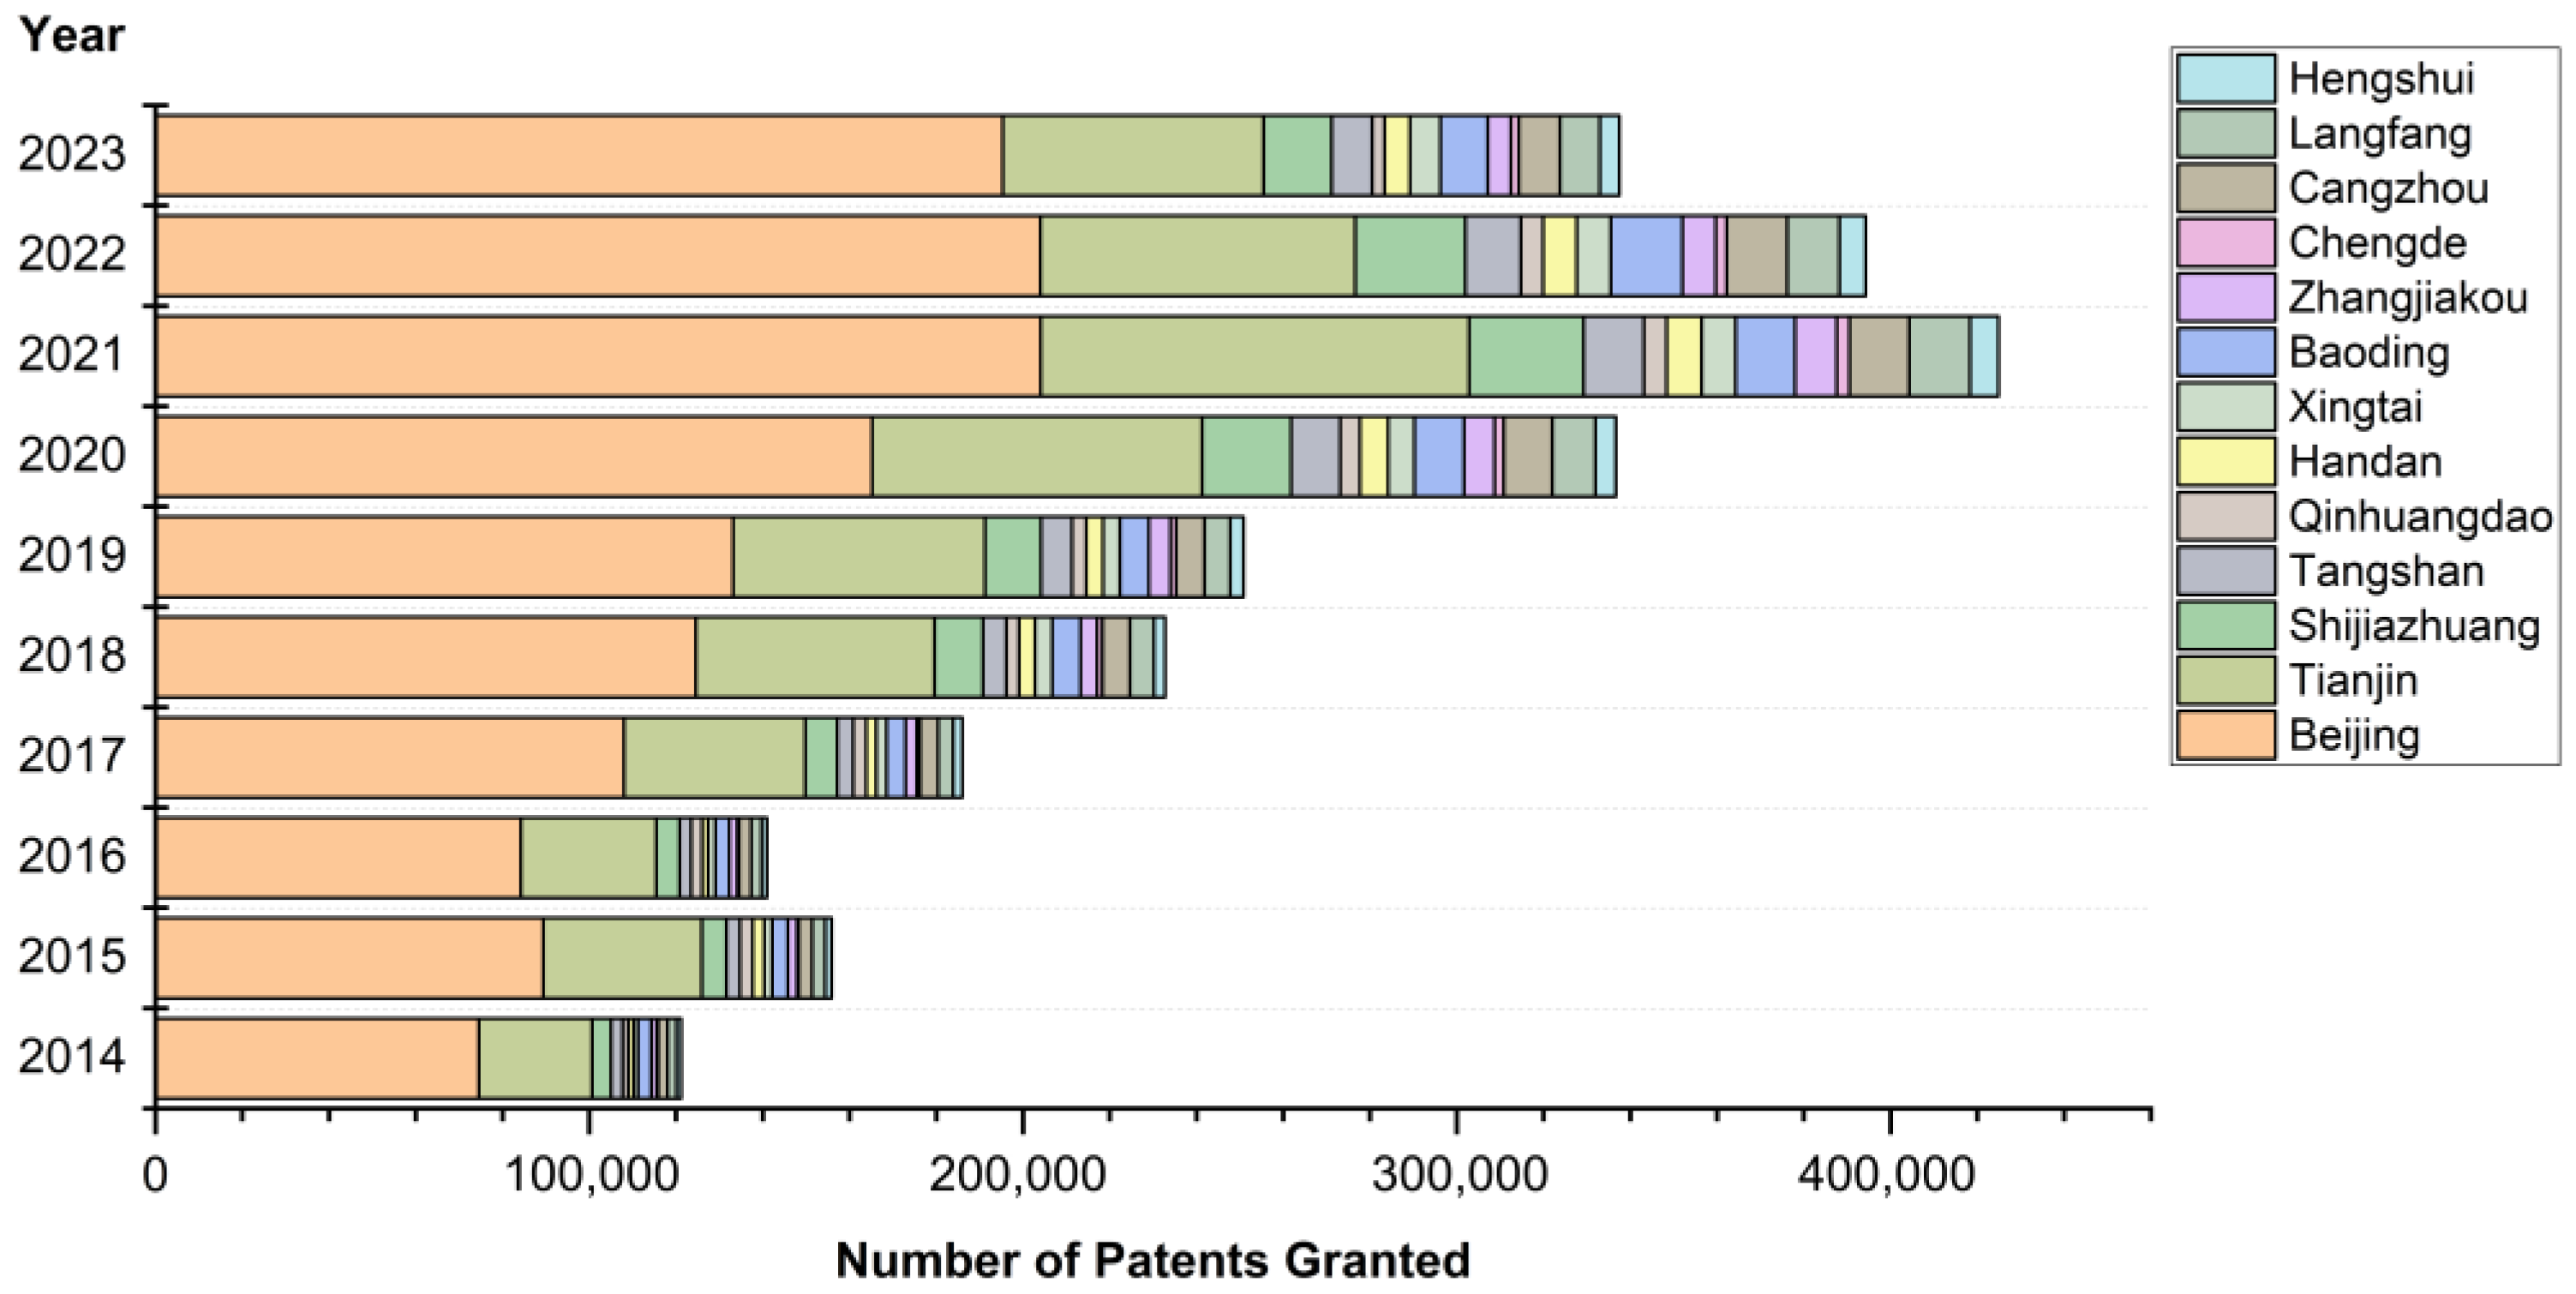
Figure 4 illustrates the temporal evolution of county-level innovation across the BTH region from 2014 to 2023, while Figure 5 maps the corresponding spatial distribution of patent grants (comprehensive annual results are provided in Appendix A Figure A1). The spatial pattern reveals a consistent core–periphery structure: Beijing serves as the primary innovation core, with Tianjin forming a secondary center. Together, they constitute a high-value innovation cluster, whereas Hebei generally demonstrates lower innovation intensity. Patent grants decline steeply from the Beijing–Tianjin core toward peripheral zones. This pattern reflects the effects of resource concentration in Beijing, which amplifies regional innovation disparities [57]. Surrounding areas like Shijiazhuang and Tangshan leveraged industrial restructuring for innovation growth, while Zhangjiakou and Chengde faced constraints from ecological conservation policies [58]. Overall, these results are consistent with core–periphery theory in innovation geography, highlighting the persistent spatial polarization of innovation within the BTH region.

4.1.1. Dynamic Agglomeration Characteristics

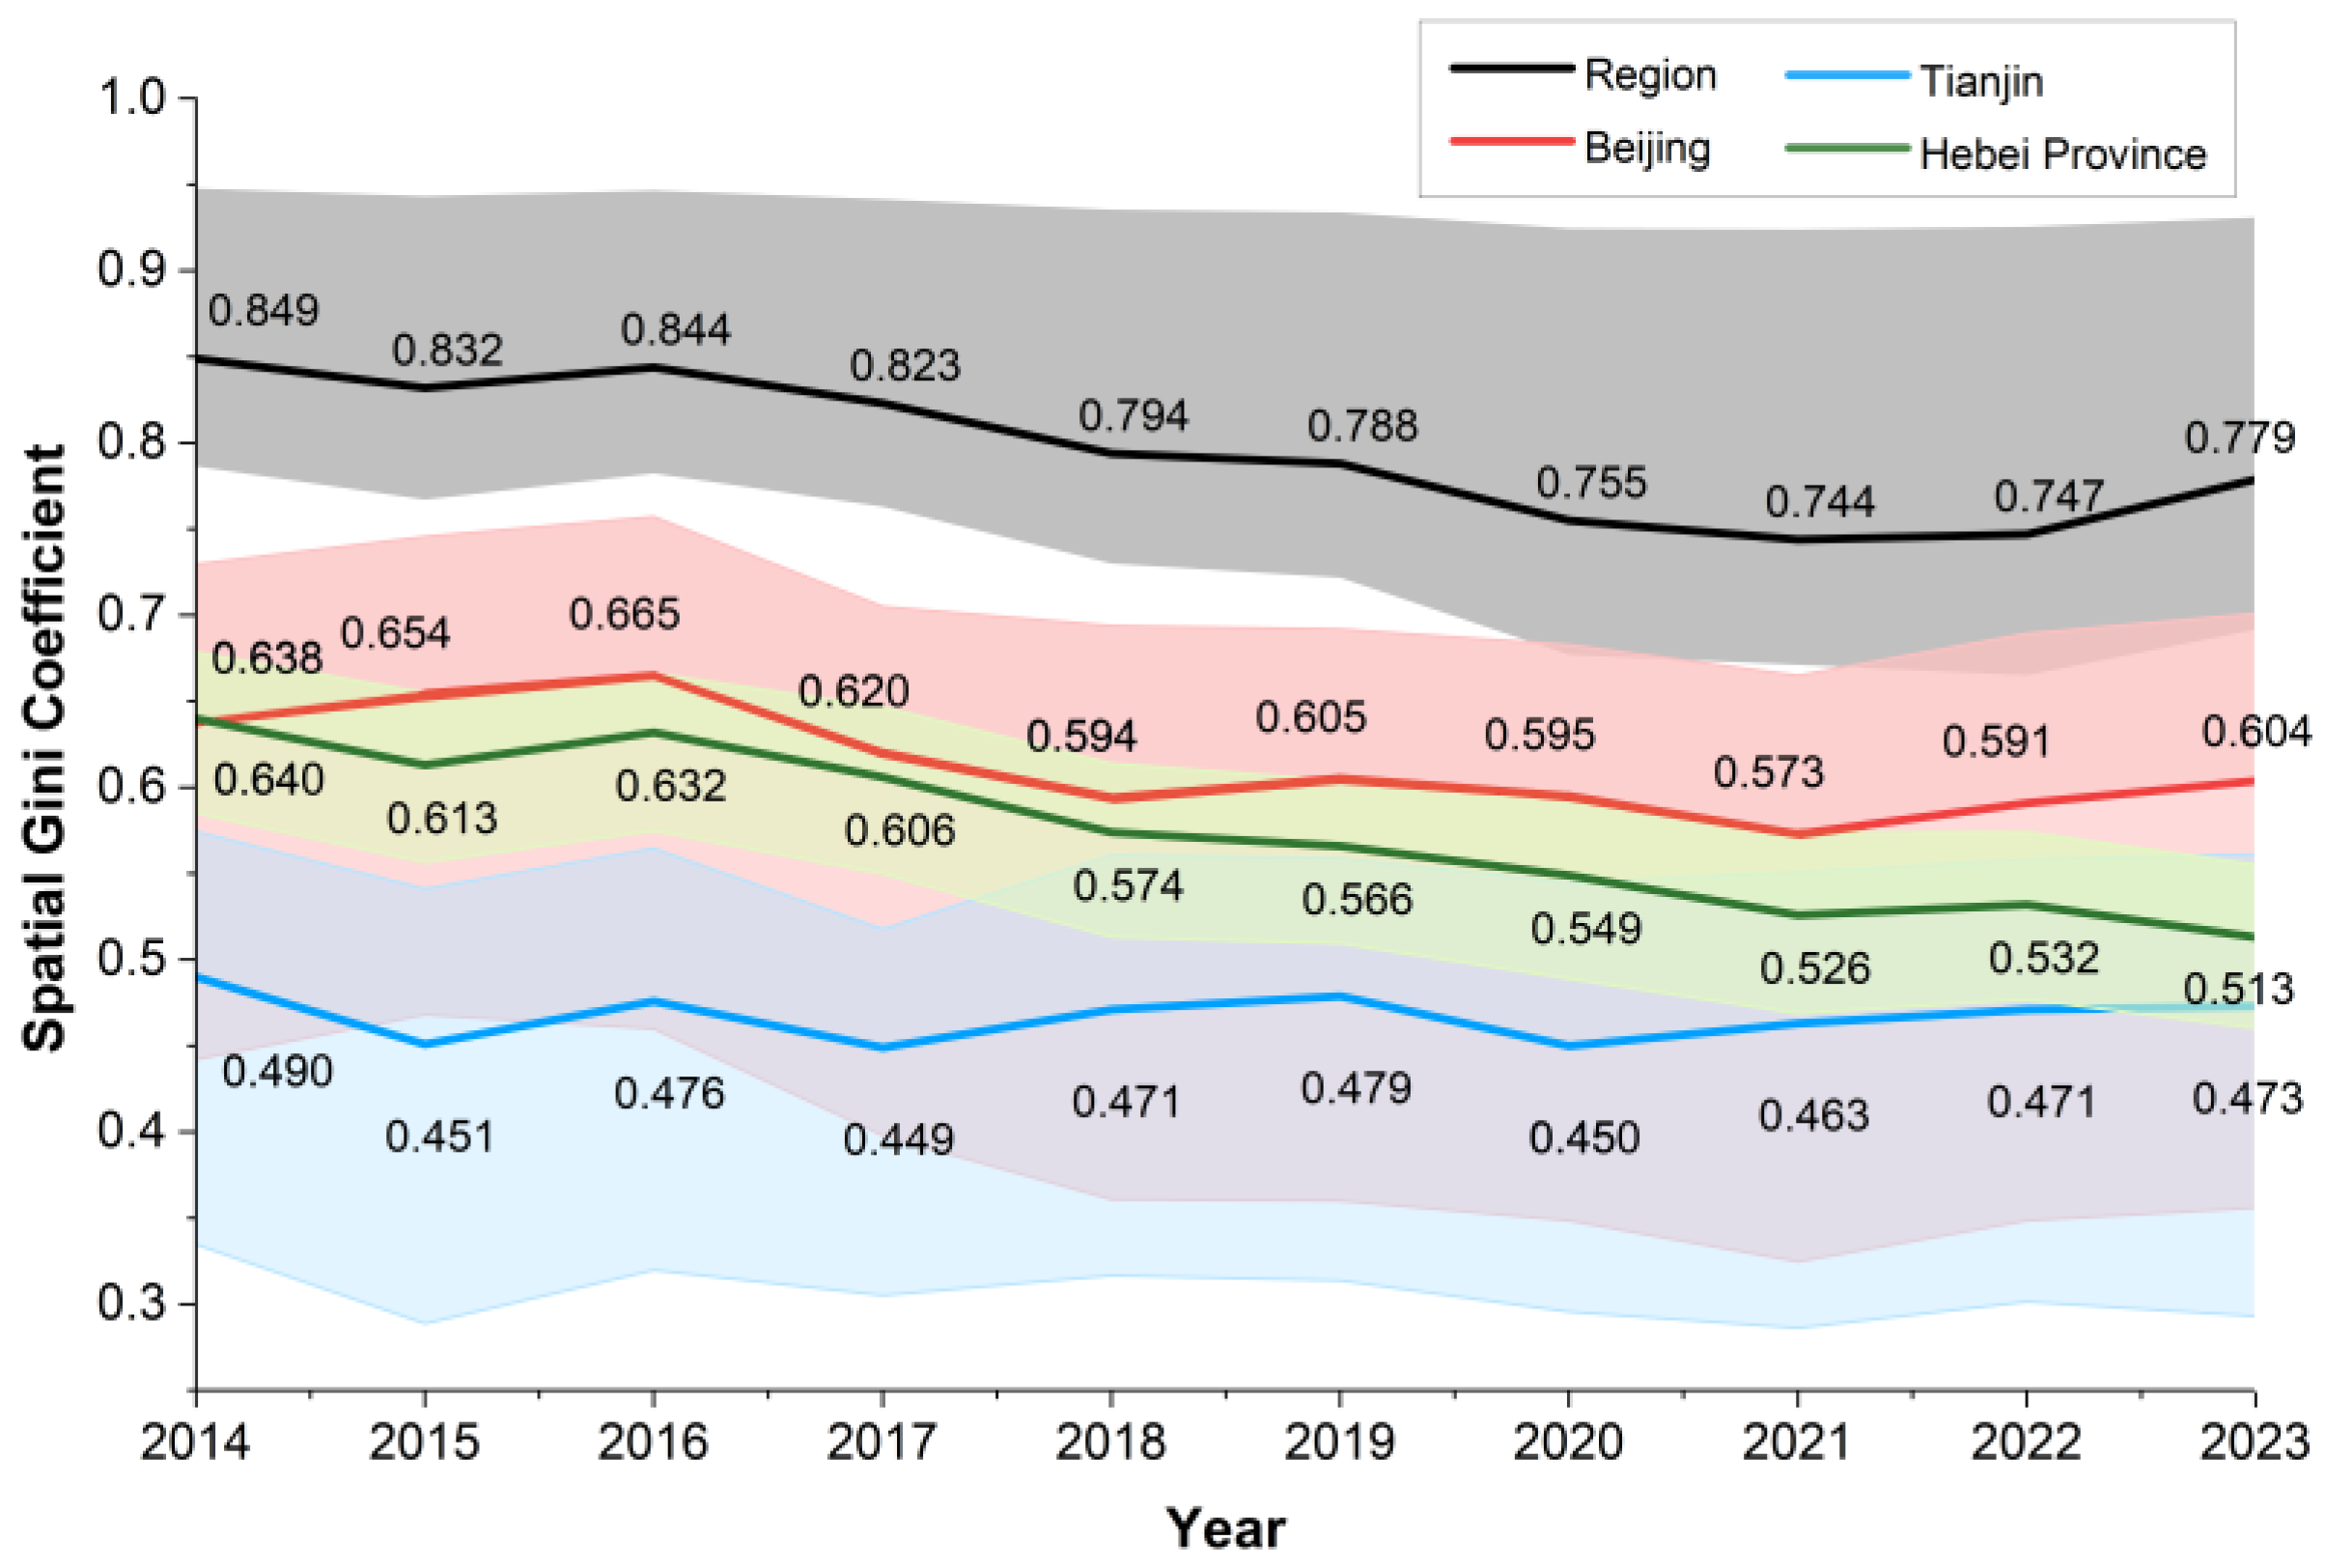
To assess innovation concentration across the BTH urban agglomeration, the spatial Gini coefficient with 95% confidence intervals for 2014–2023 was calculated (Figure 6). Although the regional Gini coefficient remained consistently high, it exhibited a modest decline from 2014 to 2021, suggesting that the regional coordination strategy enhanced innovation capacity in peripheral areas and alleviated excessive spatial concentration. Since 2021, however, the coefficient has risen slightly—likely reflecting the disruptive effects of COVID-19, which constrained cross-regional innovation flows, redirected resources toward core high-value industries, and temporarily widened interregional disparities. Persistent intra-regional differences were evident throughout the study period. Both Beijing and Hebei maintained high internal Gini coefficients, indicating pronounced developmental imbalances, while Tianjin consistently displayed a lower coefficient, reflecting a more balanced pattern of innovation. Regarding confidence intervals, the region’s high Gini coefficients are accompanied by wide ranges, indicating fluctuations in inequality levels. Hebei’s narrowing interval suggests a more stable improving trend, Tianjin’s narrow intervals reflect result stability, and Beijing’s recently widened interval points to increased estimation uncertainty in the latest period. Overall, the spatial structure remains characterized by a pronounced core–periphery configuration.

4.1.2. Gradient Evolution of Innovation Spatial Disparities

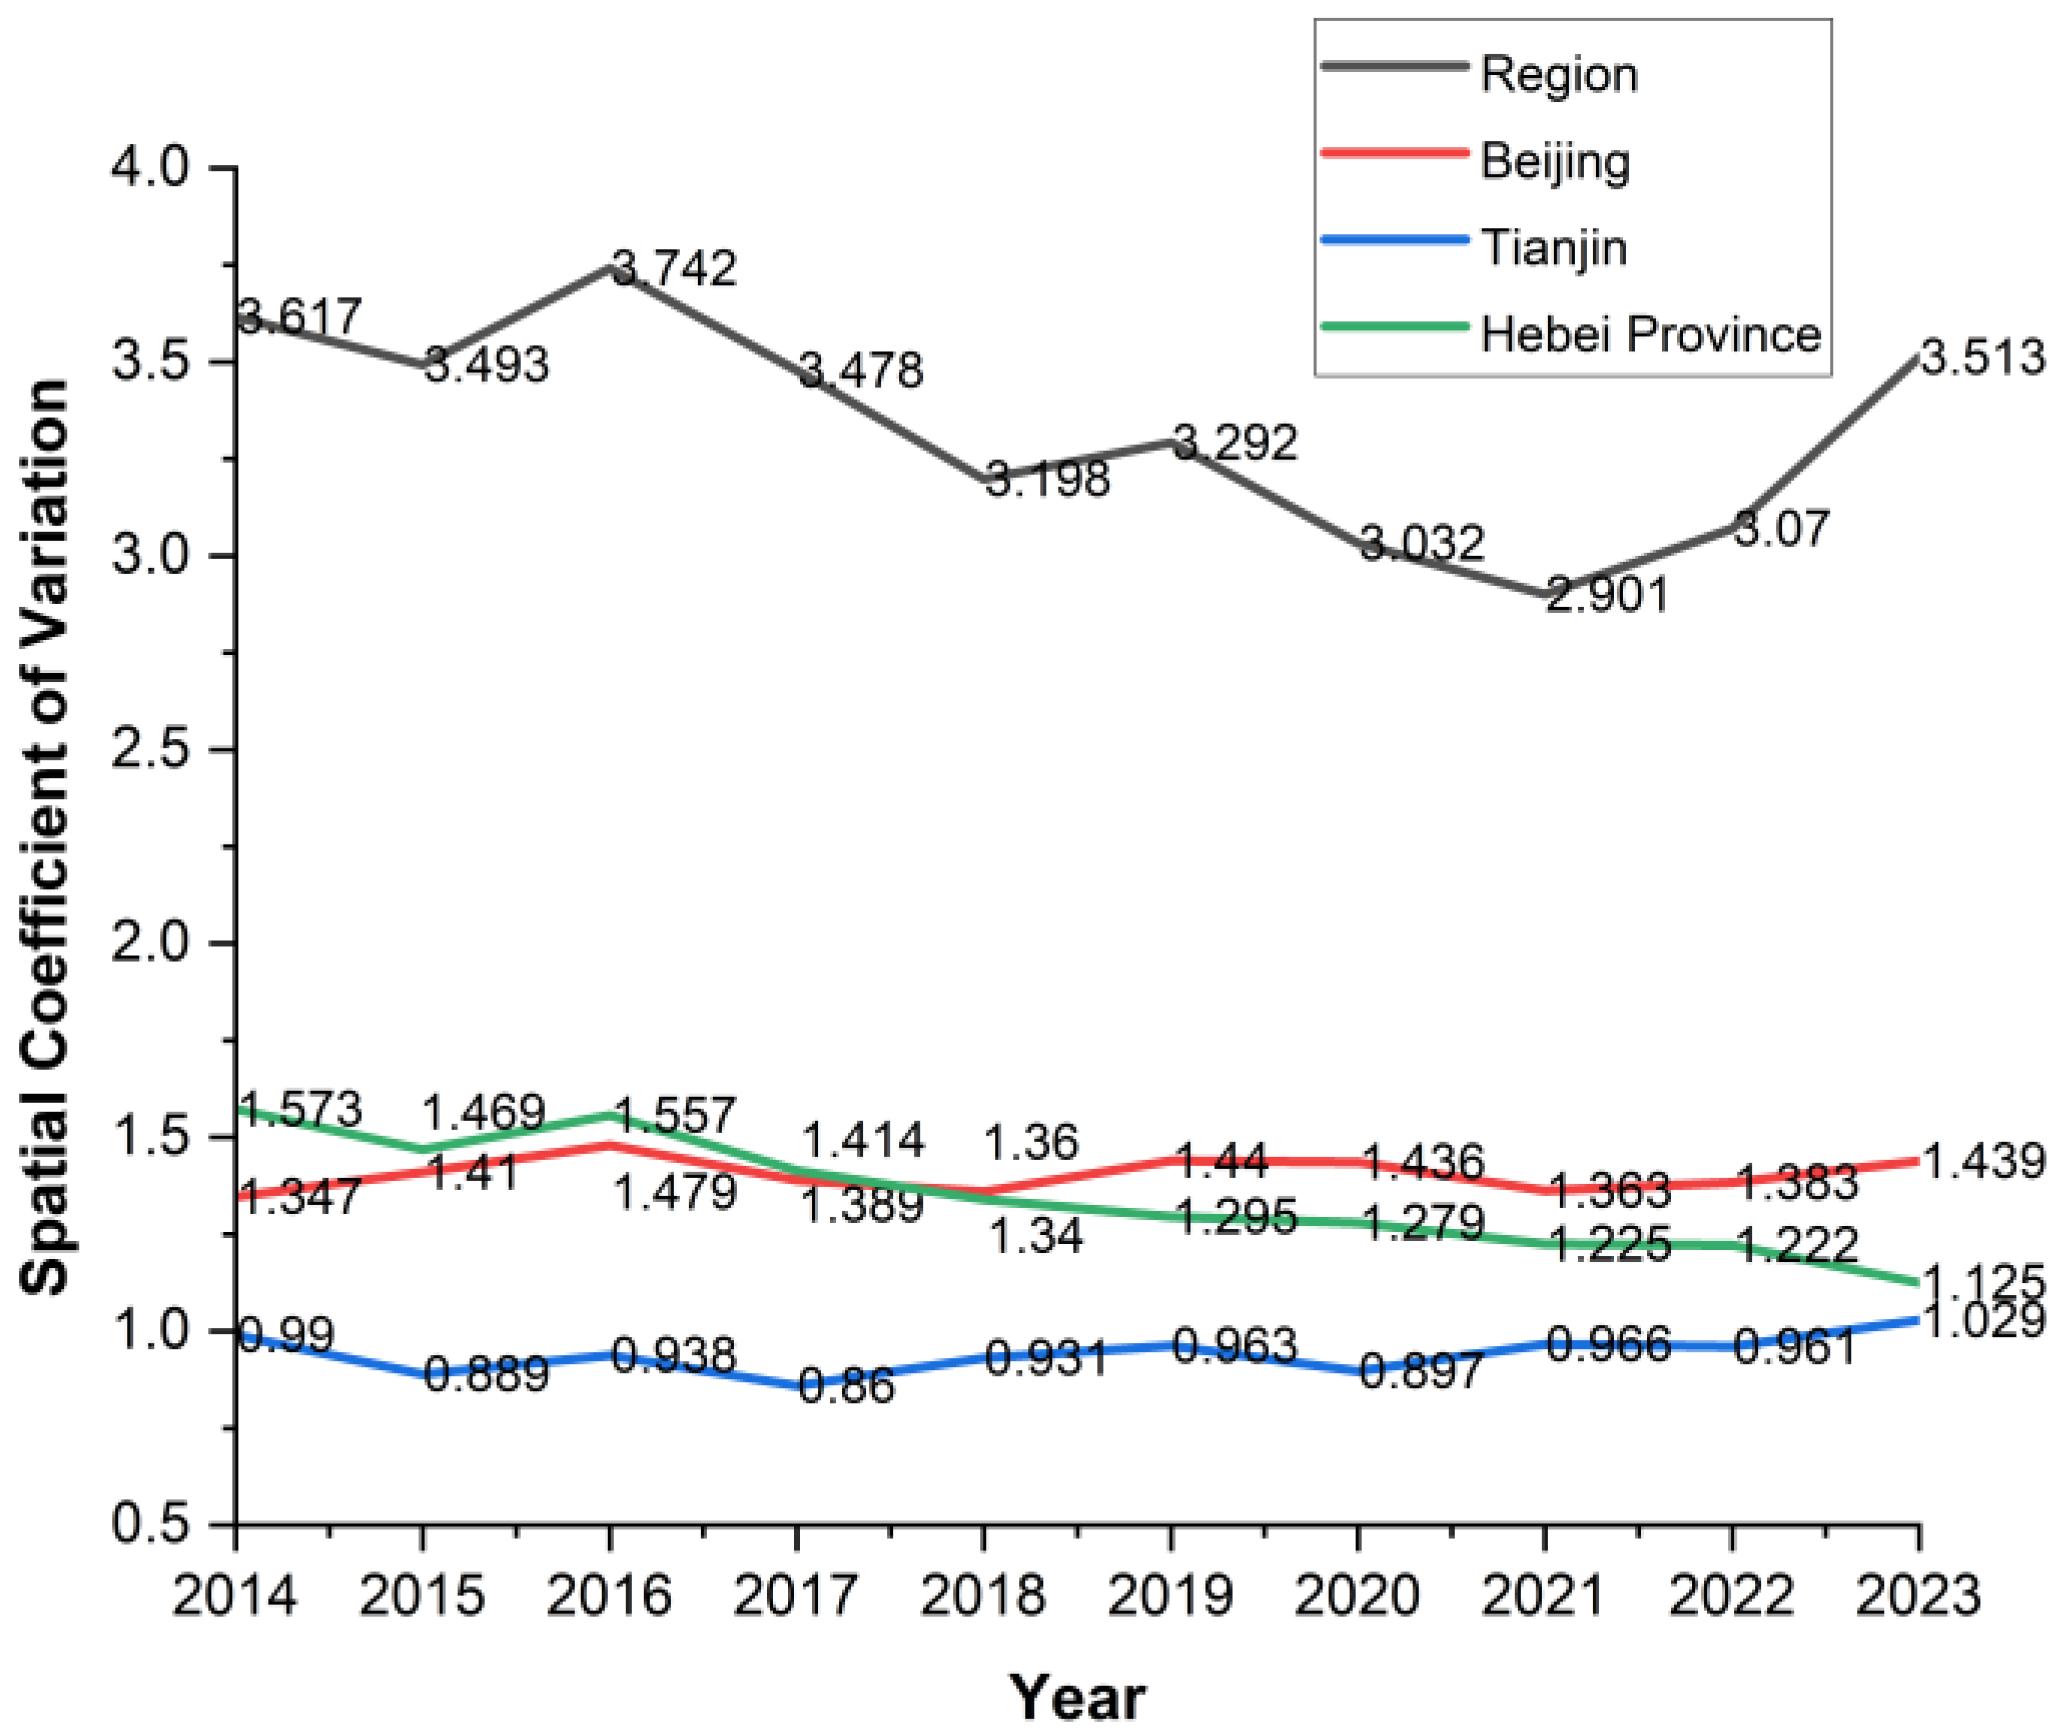
Coefficient of variation analysis for the BTH region during 2014–2023 (Figure 7) reveals a phased convergence in regional disparities. The coefficient declined steadily from 2014 to a trough in 2021, reflecting a period of balanced innovation growth during regional expansion. Post-2021, however, a sharp rebound occurred, suggesting pandemic disruptions to factor mobility intensified Matthew effects and reinforced core–periphery polarization. By administrative division, Beijing exhibits persistently high variation, revealing widening gaps between innovation hubs and peripheries; Tianjin maintains low but stable variation, with a 2023 peak indicating growing disparities between Binhai New Area and its hinterland; and Hebei manifests healthy improvement as emerging hubs like Xiong’an New Area optimized provincial imbalances. These findings underscore the importance of polycentric network development for advancing regional coordination. The evolving spatial disparities reflect a gradual transition in the BTH innovation system—from a unipolar to a polycentric spatial structure.

4.2. Exploration of the Driving Mechanisms and Influencing Factors of Innovation Space in High-Tech Industries

4.2.1. Characteristics of Innovation Spatial Patterns by High-Tech Industry Sub-Sector

High-tech industries constitute the core innovation engine of the BTH region, as evidenced by their share of patent grants rising from 80.68% in 2014 to 92.82% in 2023. This overwhelming dominance underscores the need for systematic evaluation of innovation capabilities and targeted identification of development gaps.
The Classification of High-tech Industries (Manufacturing) (2017) was used to categorize the sector into six subsectors: Pharmaceutical Manufacturing (PM); Aircraft and Spacecraft Manufacturing (ASM); Electronic and Communication Equipment Manufacturing (ECEM); Computer and Office Equipment Manufacturing (COEM); Medical Equipment and Instrument Manufacturing (MEIM); and Information Chemicals Products Manufacturing (ICPM). These abbreviations are used hereafter for brevity. Spatial analysis using ArcGIS 10.8 reveals the distribution patterns of innovation activities across these sub-sectors in the BTH region. Key findings include the following.
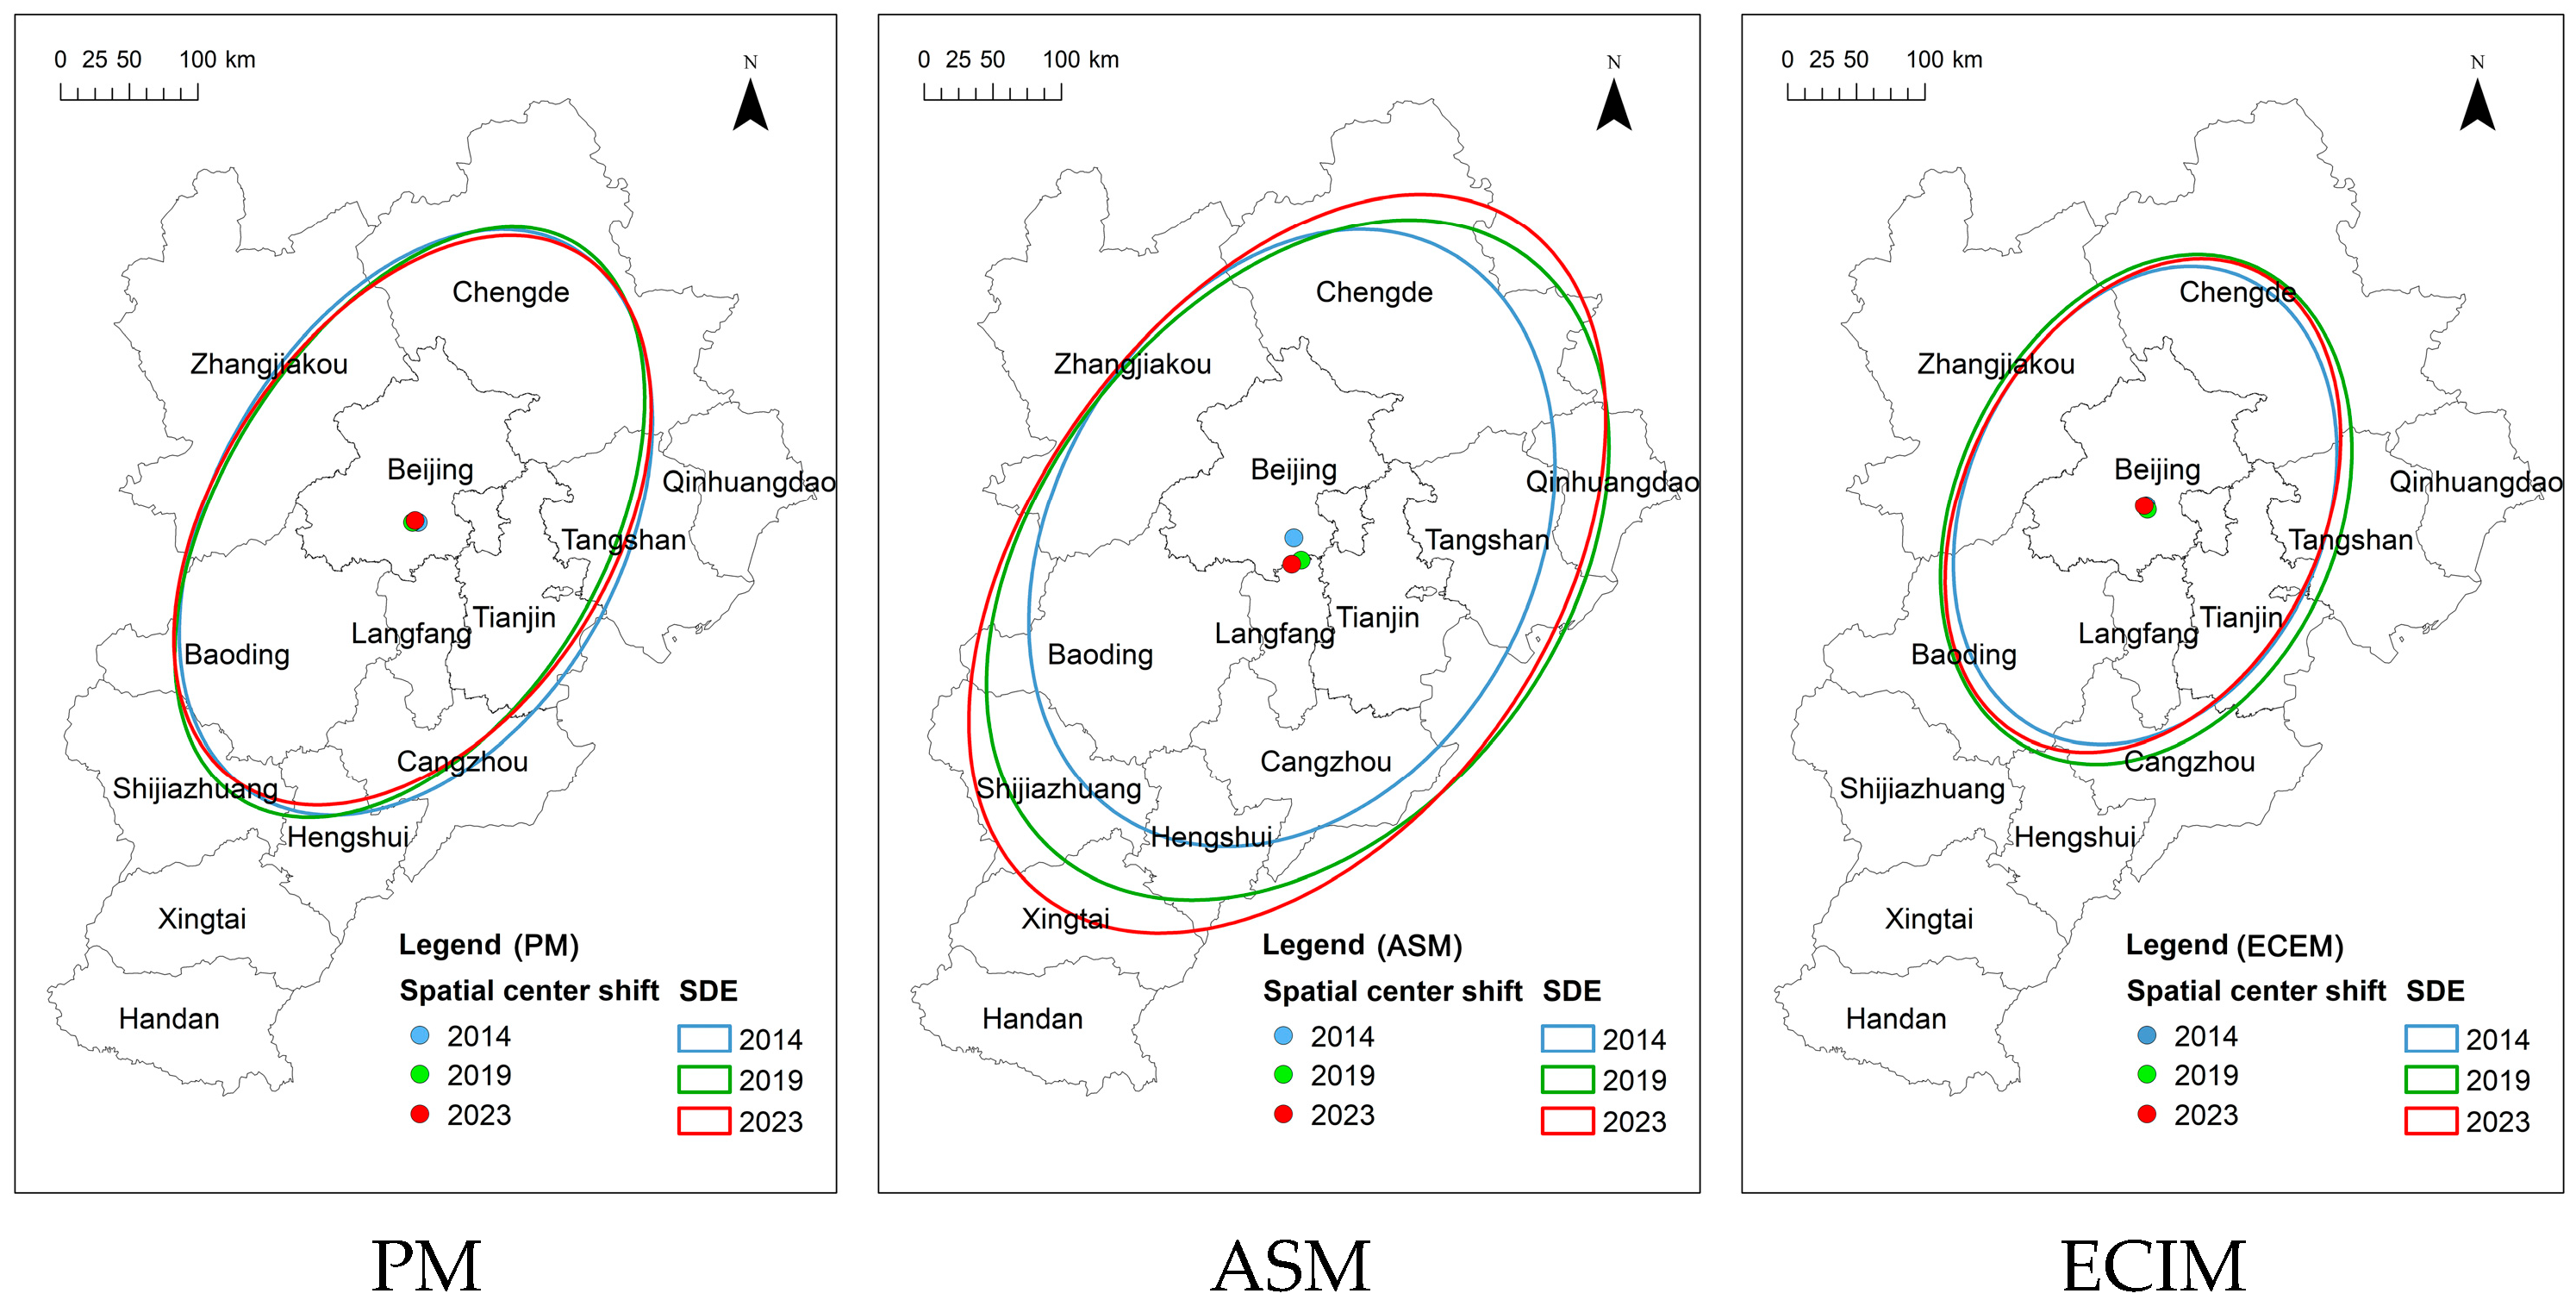
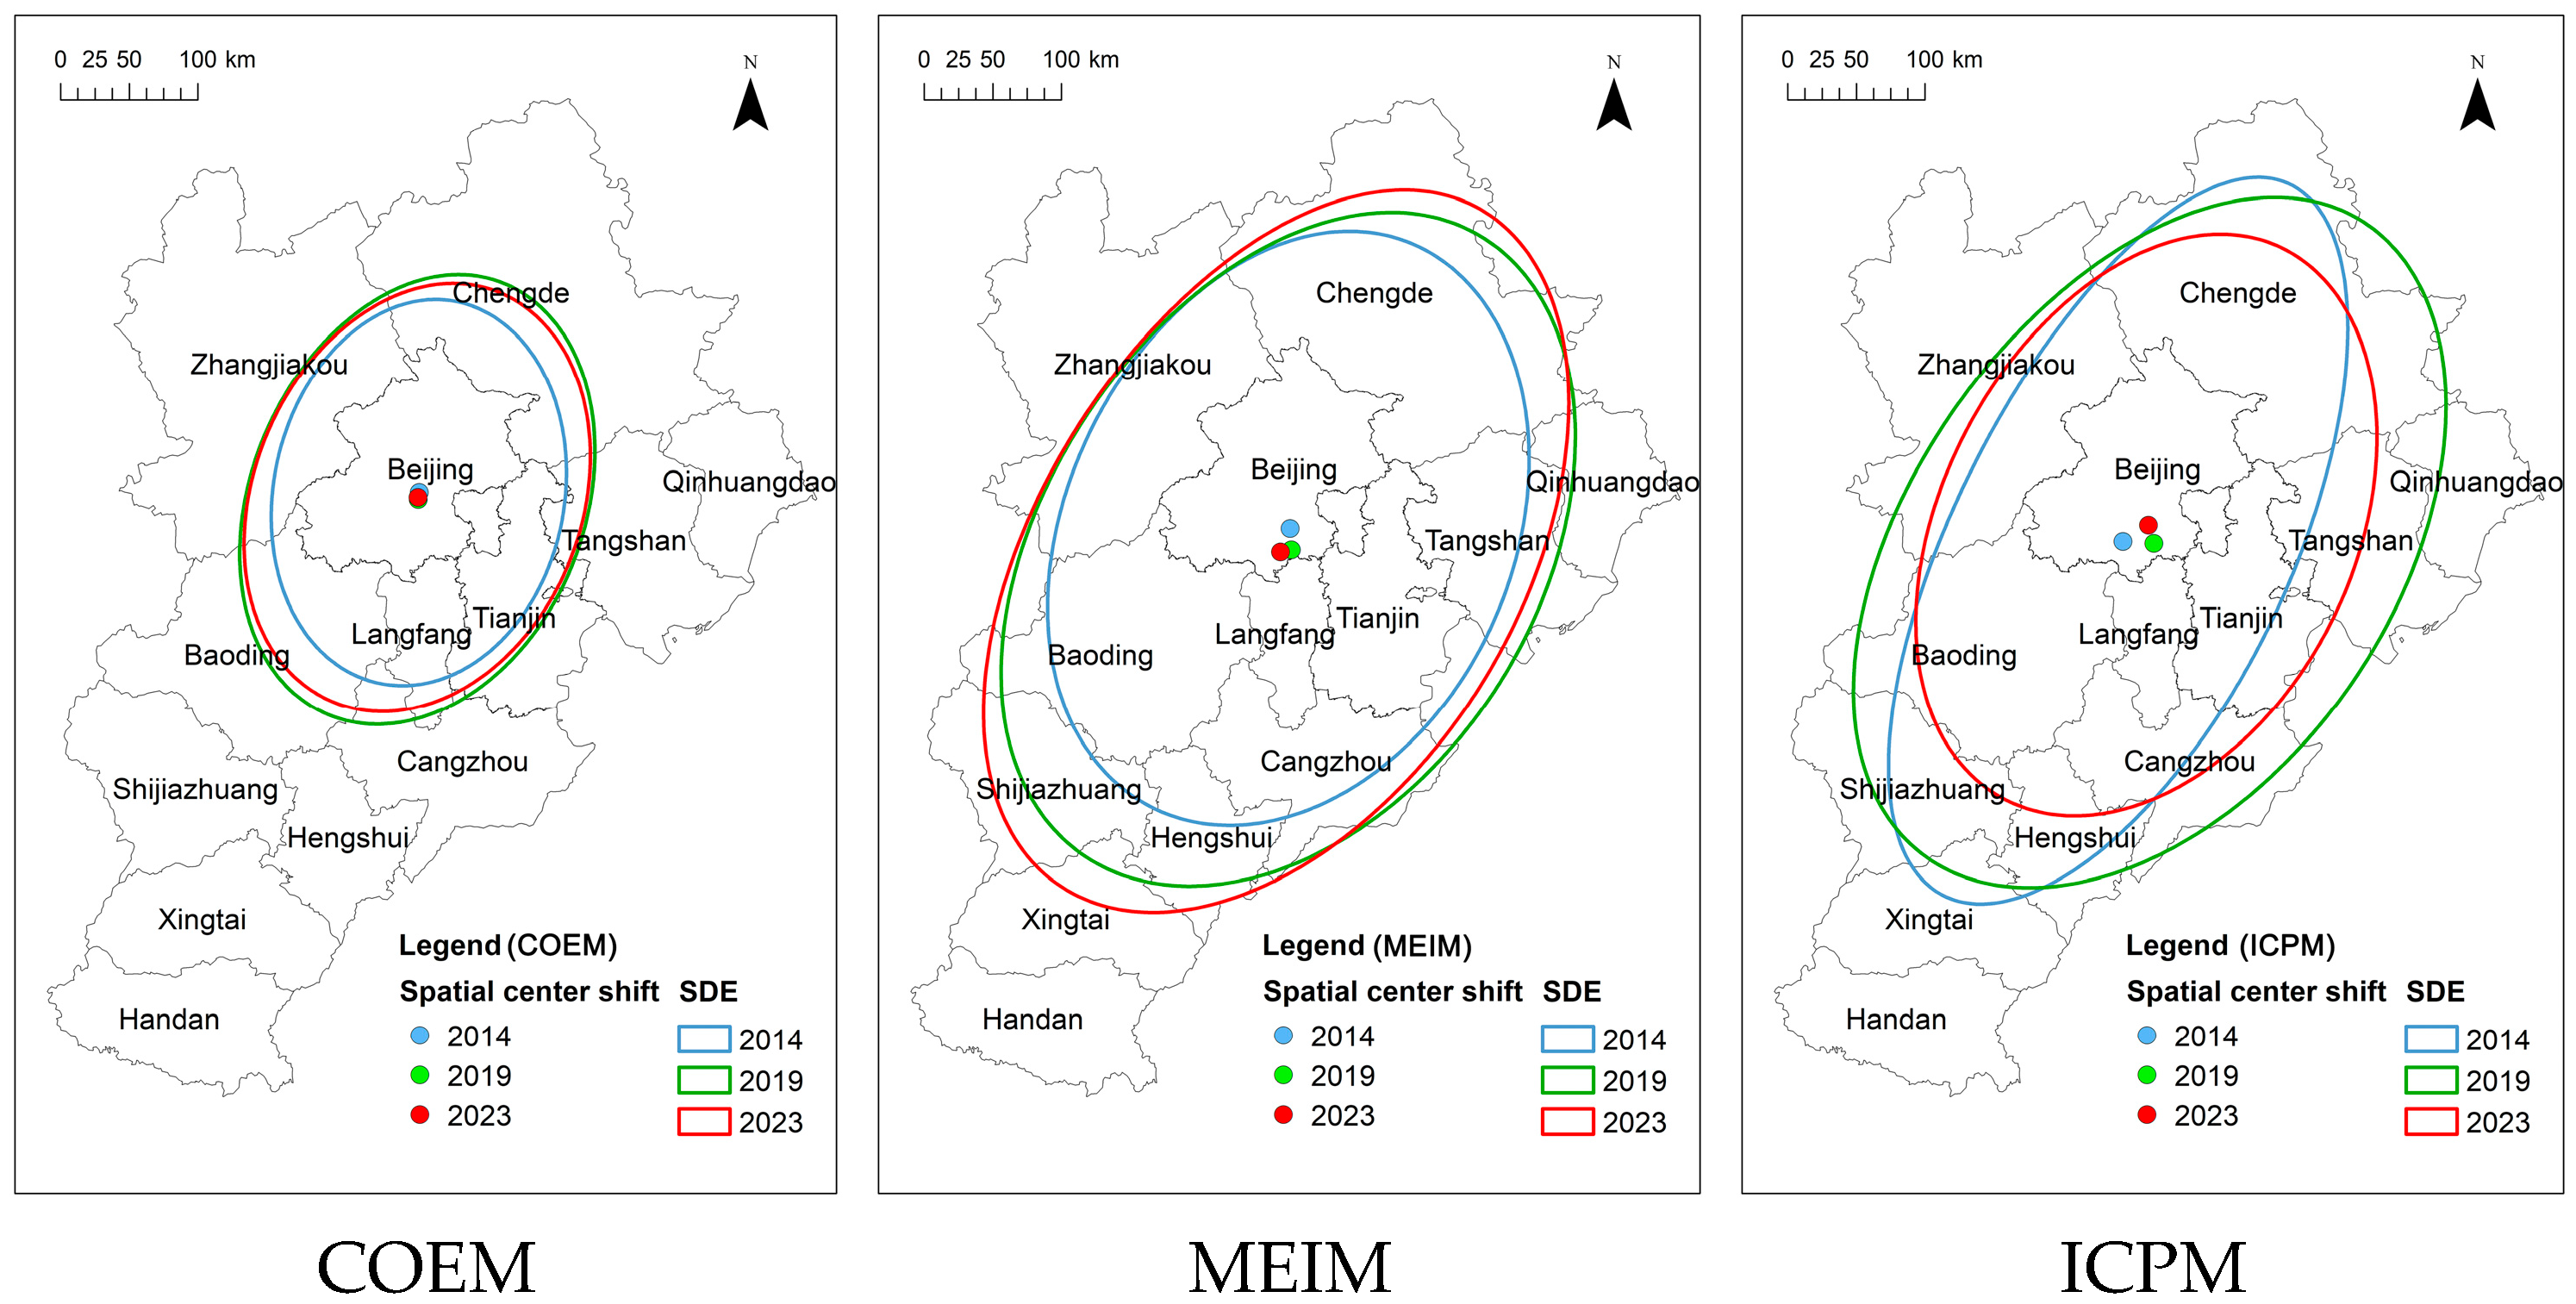
According to Figure 8 and Table 3, high-tech industries in the BTH region align along a northeast–southwest axis, displaying a general trend of diffusion. The innovation gravity center is situated in southeastern Beijing, indicating a stable yet expanding development pattern.
The PM sector’s gravity center has shifted eastward toward Tongzhou, Beijing’s sub-center, driven by the relocation of non-capital functions [59]. Mature biopharmaceutical clusters in the Zhongguancun Science Park (Z-Park, Beijing’s innovation and startup hub) and the Beijing Economic–Technological Development Area (E-Town, Beijing’s high-tech manufacturing base) have reduced the need for dispersed layouts, increasing spatial concentration and contracting the standard deviation ellipse. The ASM gravity center moves southward following Daxing Airport’s operation (Beijing’s new super-large international aviation hub). The Beijing–Tianjin–Xiong’an industrial corridor [60] drives significant industry transfers, significantly increasing the standard deviation along the Beijing–Tianjin axis and expanding the spatial scope of innovation. The ECEM sector maintains a stable ellipse distribution, centered on Z-Park, showing minimal directional change over the decade. In contrast, the COEM center has drifted slightly southwest within Haidian District, with an expanded ellipse suggesting outward diffusion. Despite Haidian’s role as Beijing’s sci-tech innovation core, rising operational costs and the emergence of new industrial bases have encouraged some firms to relocate northward. The MEIM center extends toward Langfang and Baoding in Hebei, showing clear spatial diffusion that aligns with Beijing’s healthcare resource relocation initiatives and the construction of the Baoding International Medical Base. A significant structural shift occurred during the 14th Five-Year Plan period (2021–2025): the innovation gravity center of ICPM has markedly shifted eastward, forming a dual-core structure between Beijing’s E-town and Tianjin’s Binhai New Area. This evolution from a Beijing-centric, single-pole configuration to a polycentric, networked innovation pattern signifies a major milestone in the spatial restructuring of the region’s high-tech industries.

4.2.2. Analysis of Specialization in High-Tech Industry Innovation

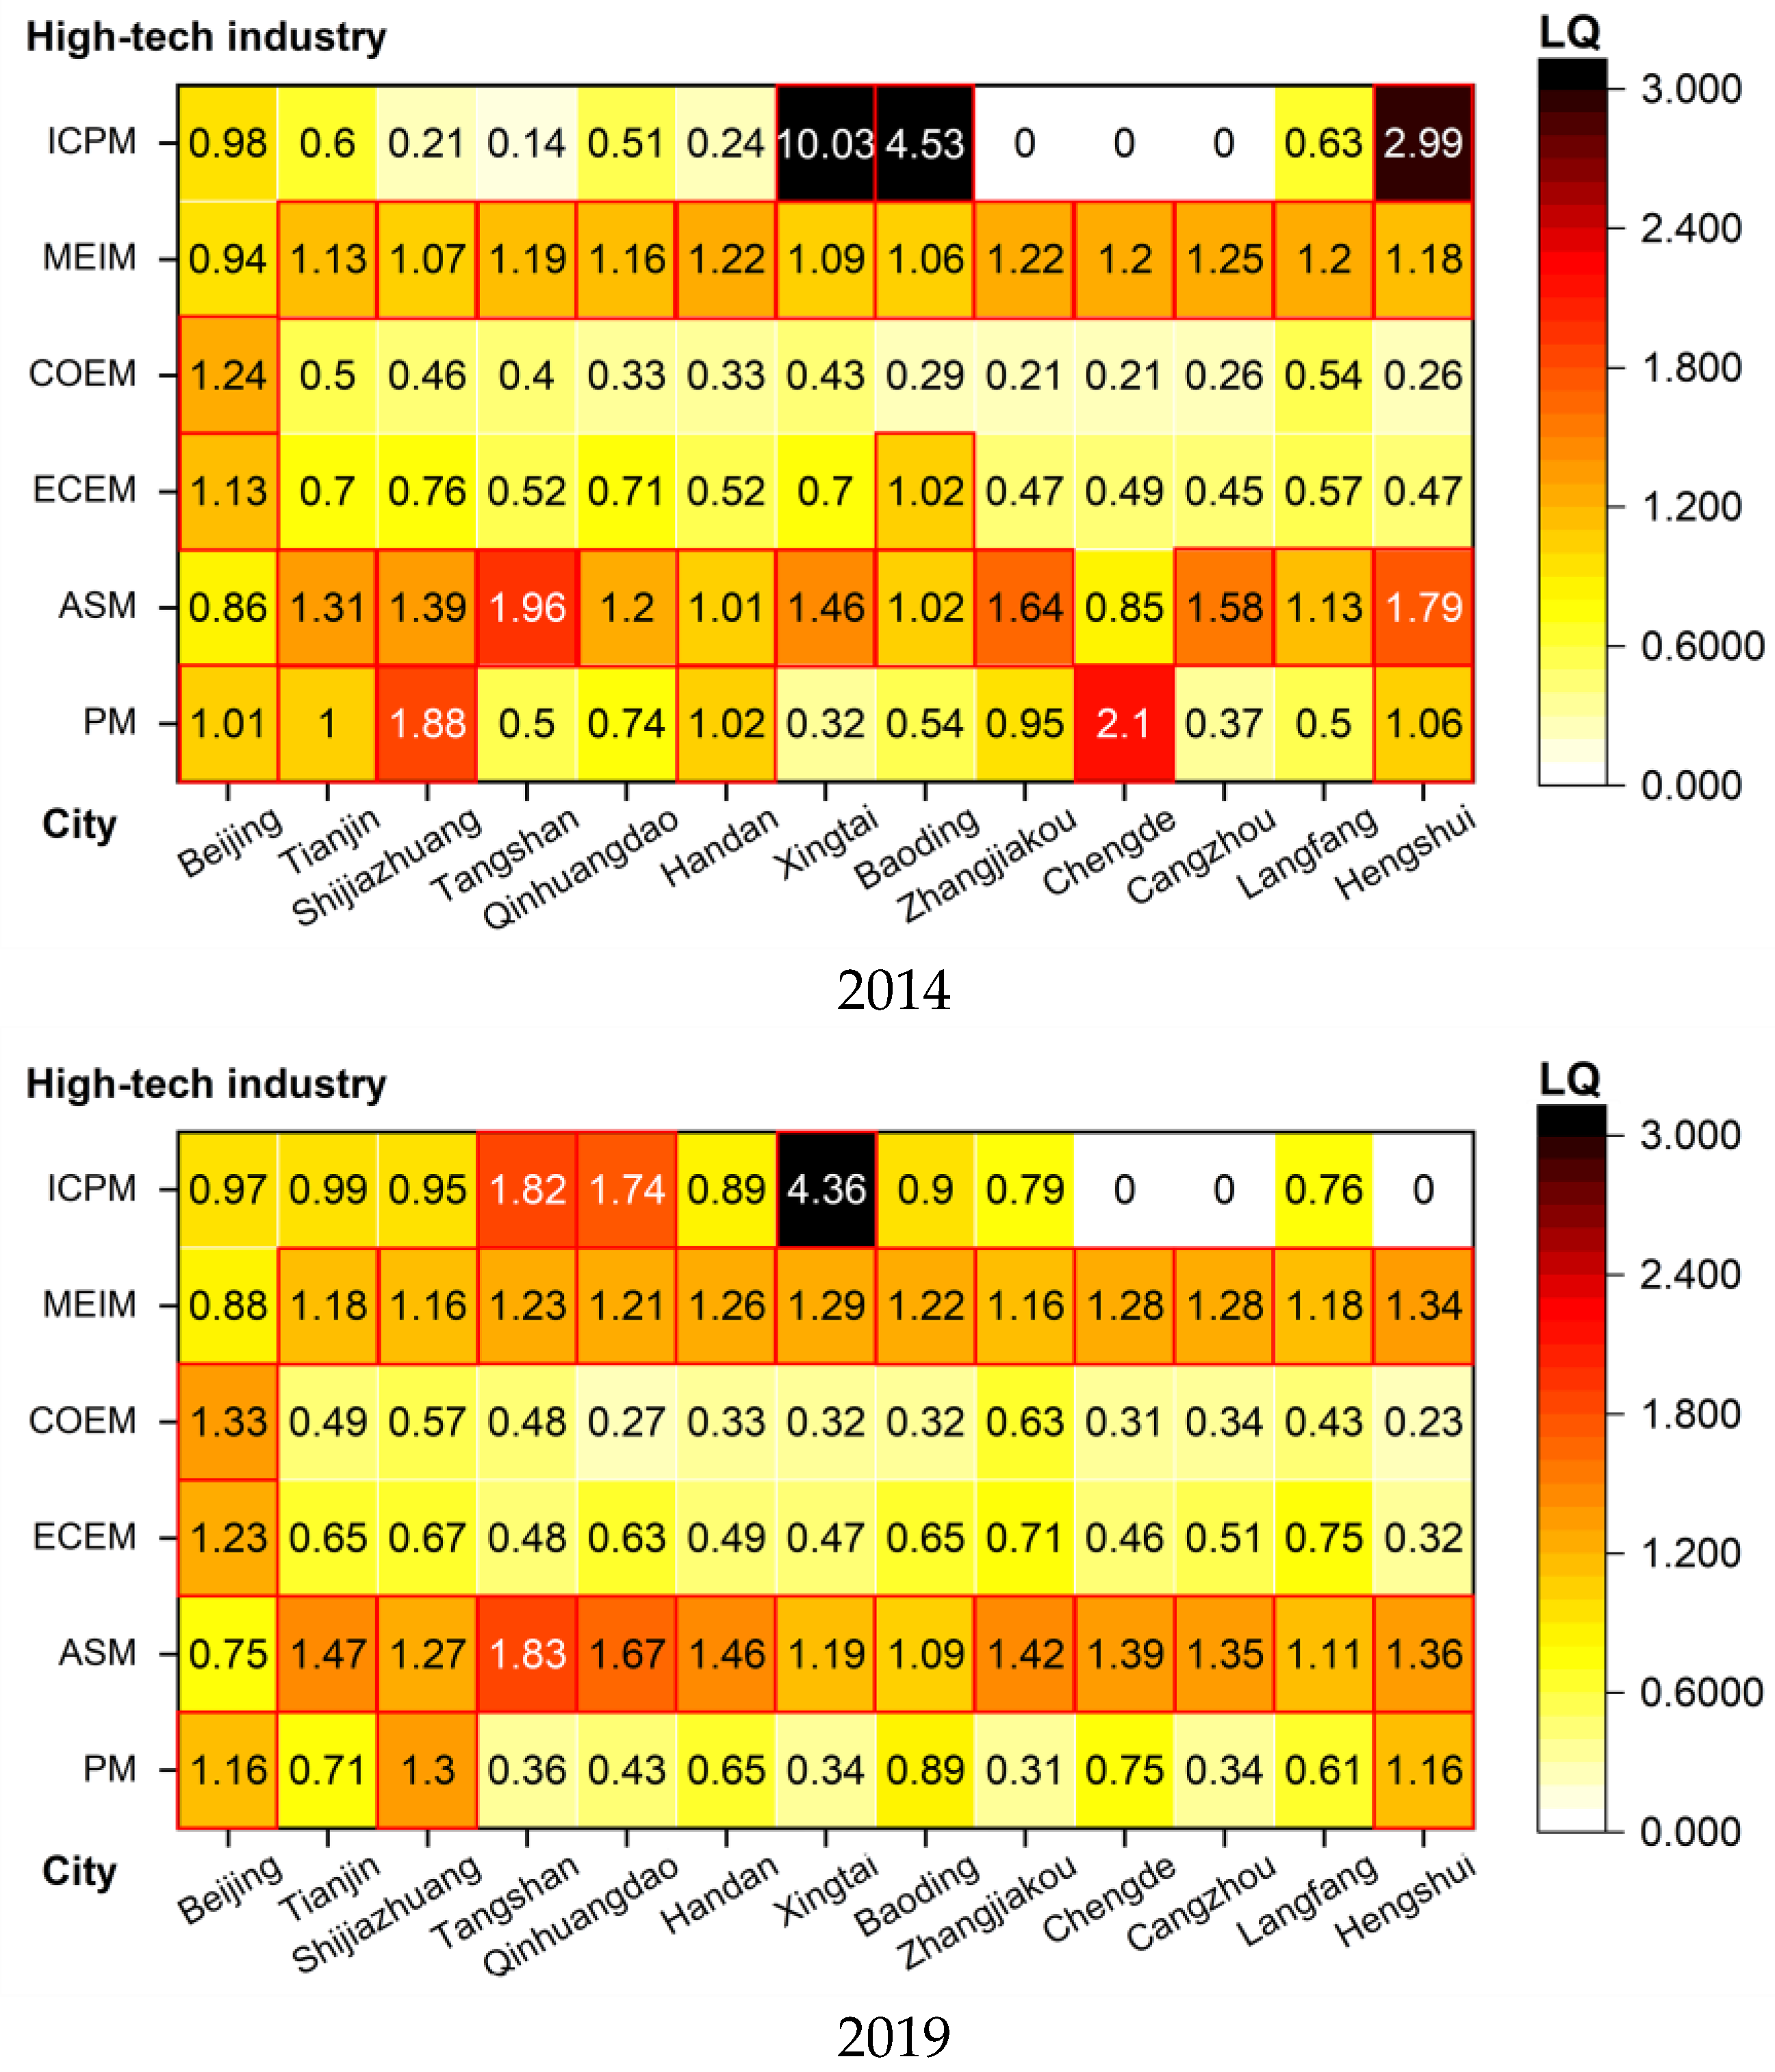
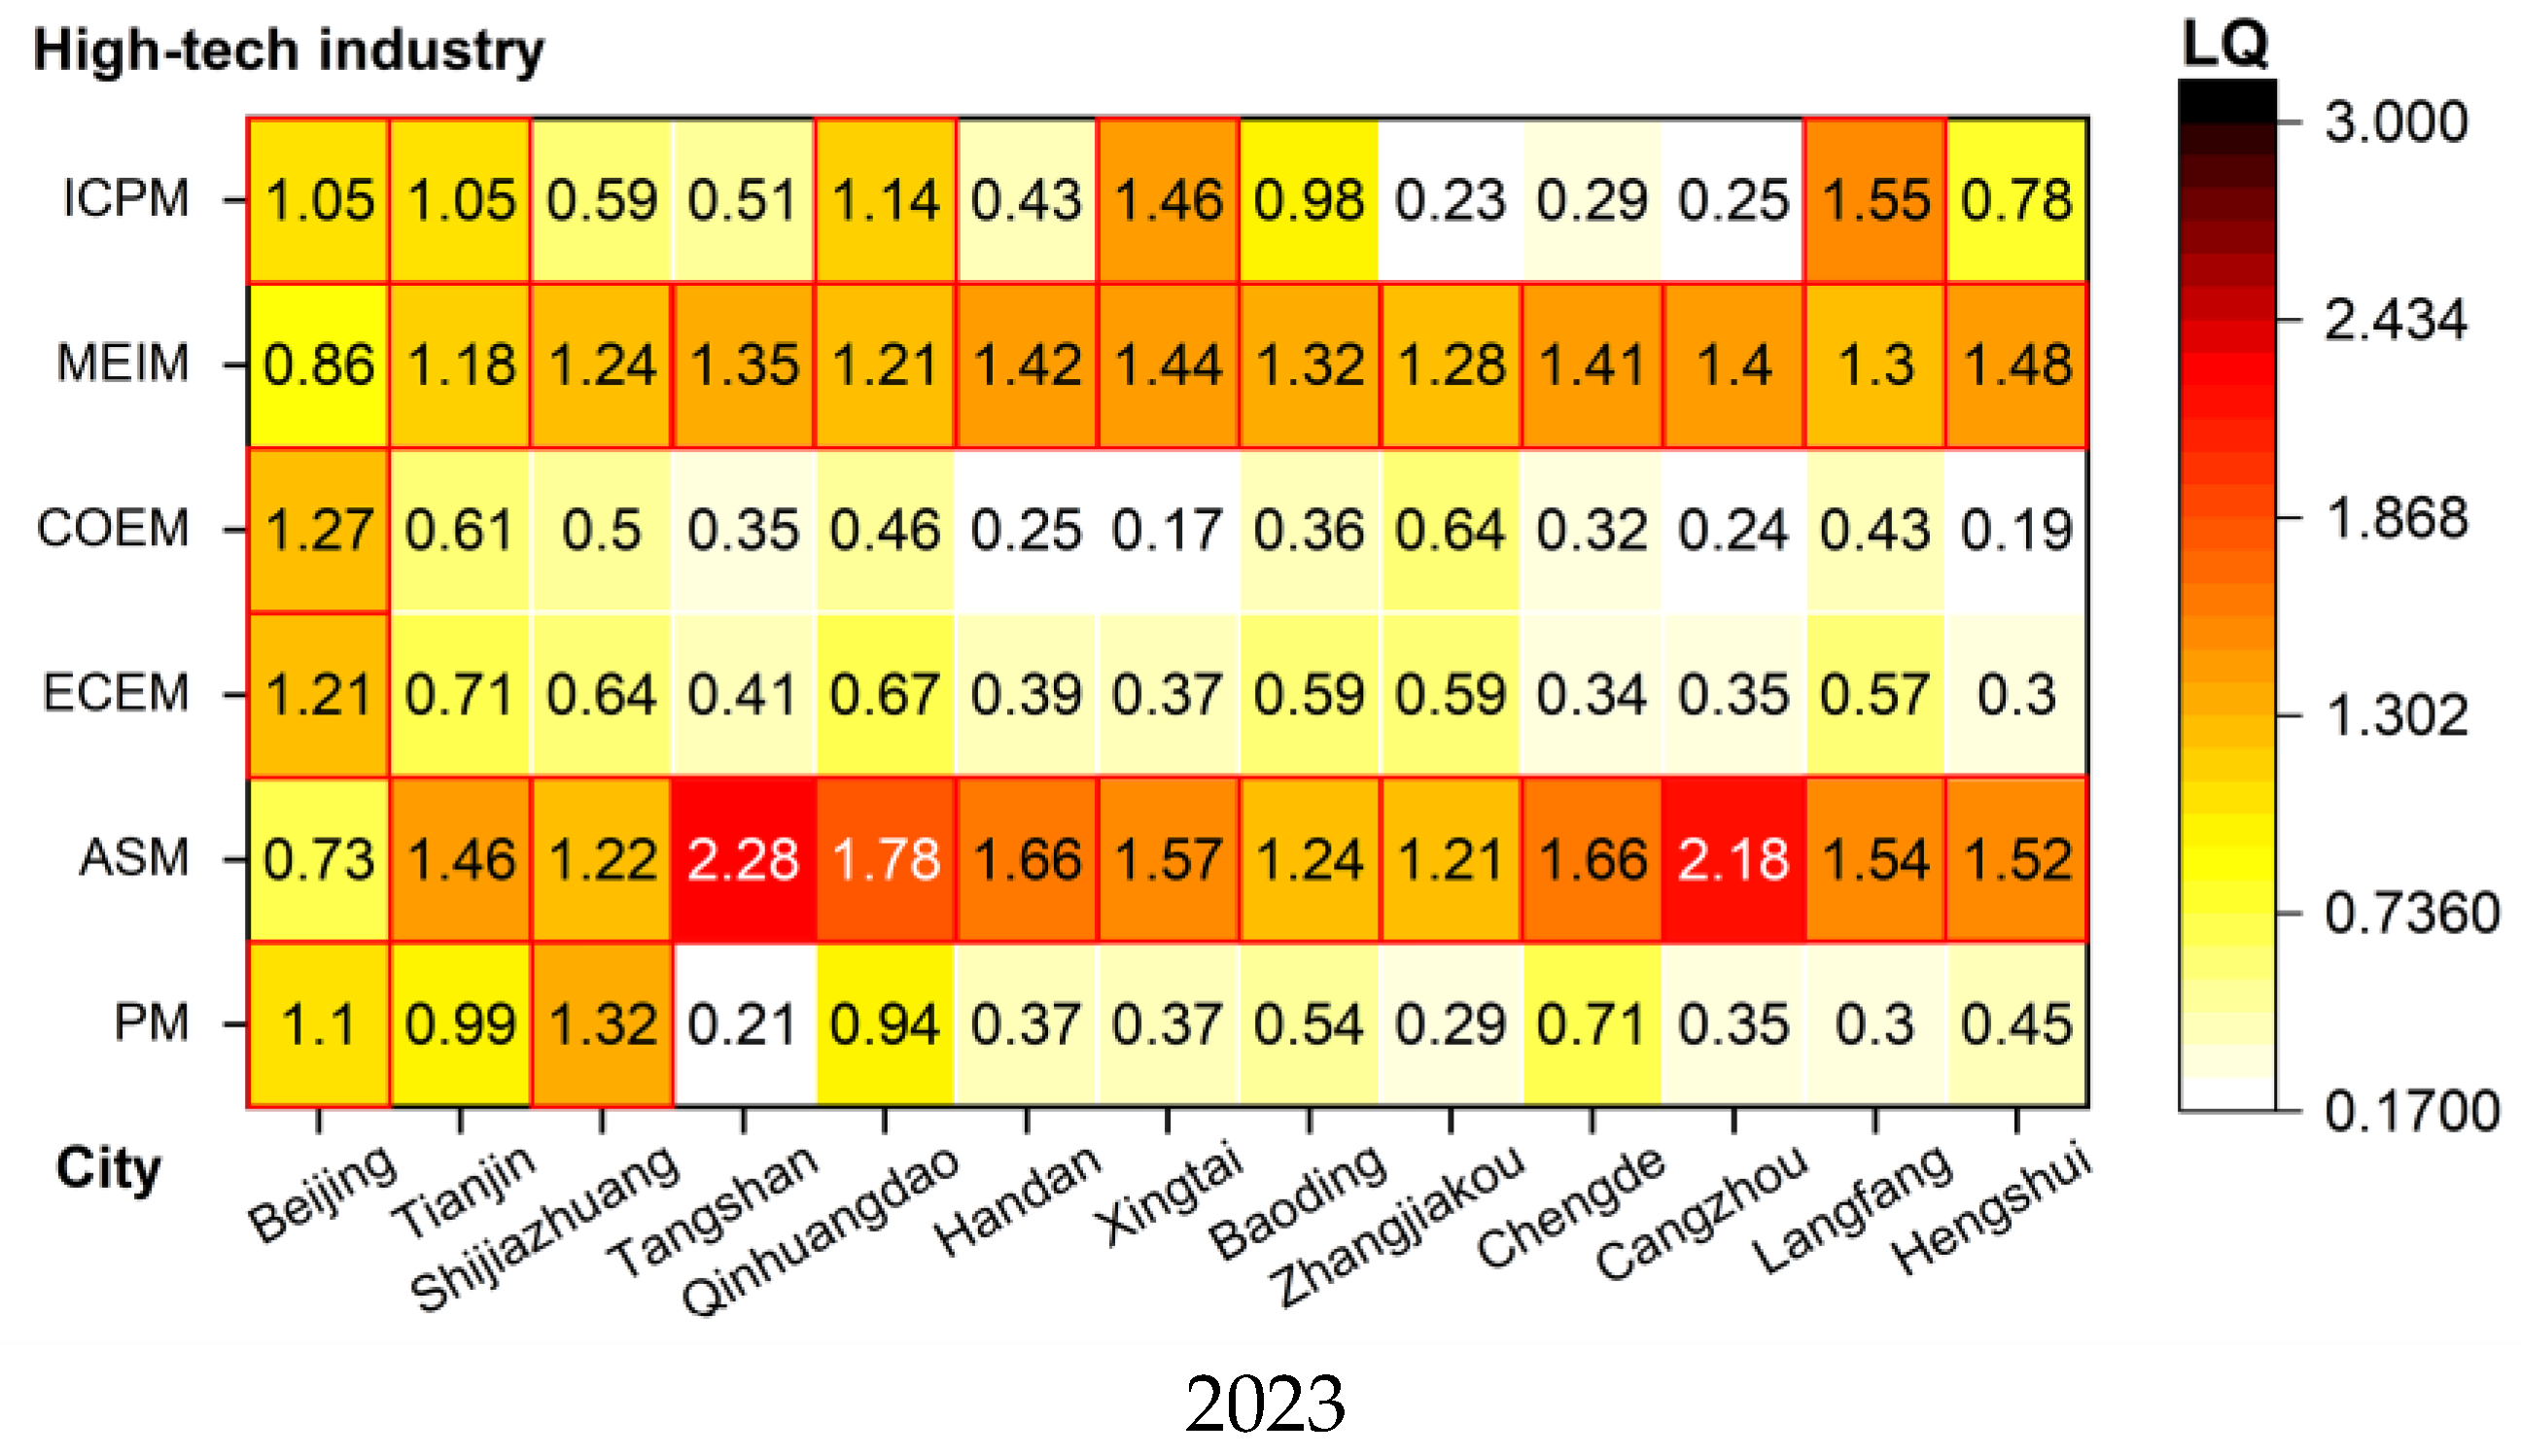
The BTH high-tech innovation landscape presents a “single-leader, multi-hub, layered-complementarity” structure: Beijing dominates high-tech innovation, Tianjin serves as an industrial commercialization hub, and Hebei focuses on manufacturing and industrialization functions. This functional division has fostered distinct patterns of industrial specialization across cities, resulting in clear gradient differences, as illustrated in Figure 9.
The PM exhibits clear regional differences in specialization. Supported by national biopharmaceutical bases and labs, Beijing and Shijiazhuang lead in R&D. Conversely, Zhangjiakou and Chengde demonstrate lower specialization levels, reflecting initial agglomeration driven by coordination policies but lacking sustained innovation support. The ASM rise in Tianjin steadily enhances its specialization through the Binhai New Area, while Tangshan becomes the region’s largest aerospace manufacturing hub by industry transfers. Peripheral cities like Chengde and Cangzhou achieve specialization breakthroughs via aerospace base development. Beijing holds an absolute edge in ECEM, marked by single-pole dominance and weak synergy with Tianjin–Hebei, highlighting a coordination gap and the need for better innovation factor flow mechanisms. COEM displays continuous agglomeration in Beijing, where strong siphoning effects have widened the digital gap with Tianjin and Hebei. Meanwhile, the MEIM sector shows high overall specialization, transitioning from a Beijing-centric model to a more balanced, multi-node structure, forming a “one-pole, multi-core” pattern. ICPM is heavily impacted by environmental policies. Xingtai’s specialization declined due to the closure of heavily polluting industries, while Tangshan’s specialization improved markedly following the green transition of its old industrial zone [61]. Collectively, these differentiated specialization patterns demonstrate how regional diversity supports the synergistic flow of innovation factors—including knowledge, technology, and industrial resources—across the BTH region.

4.2.3. Factors Influencing Innovation in High-Tech Industries

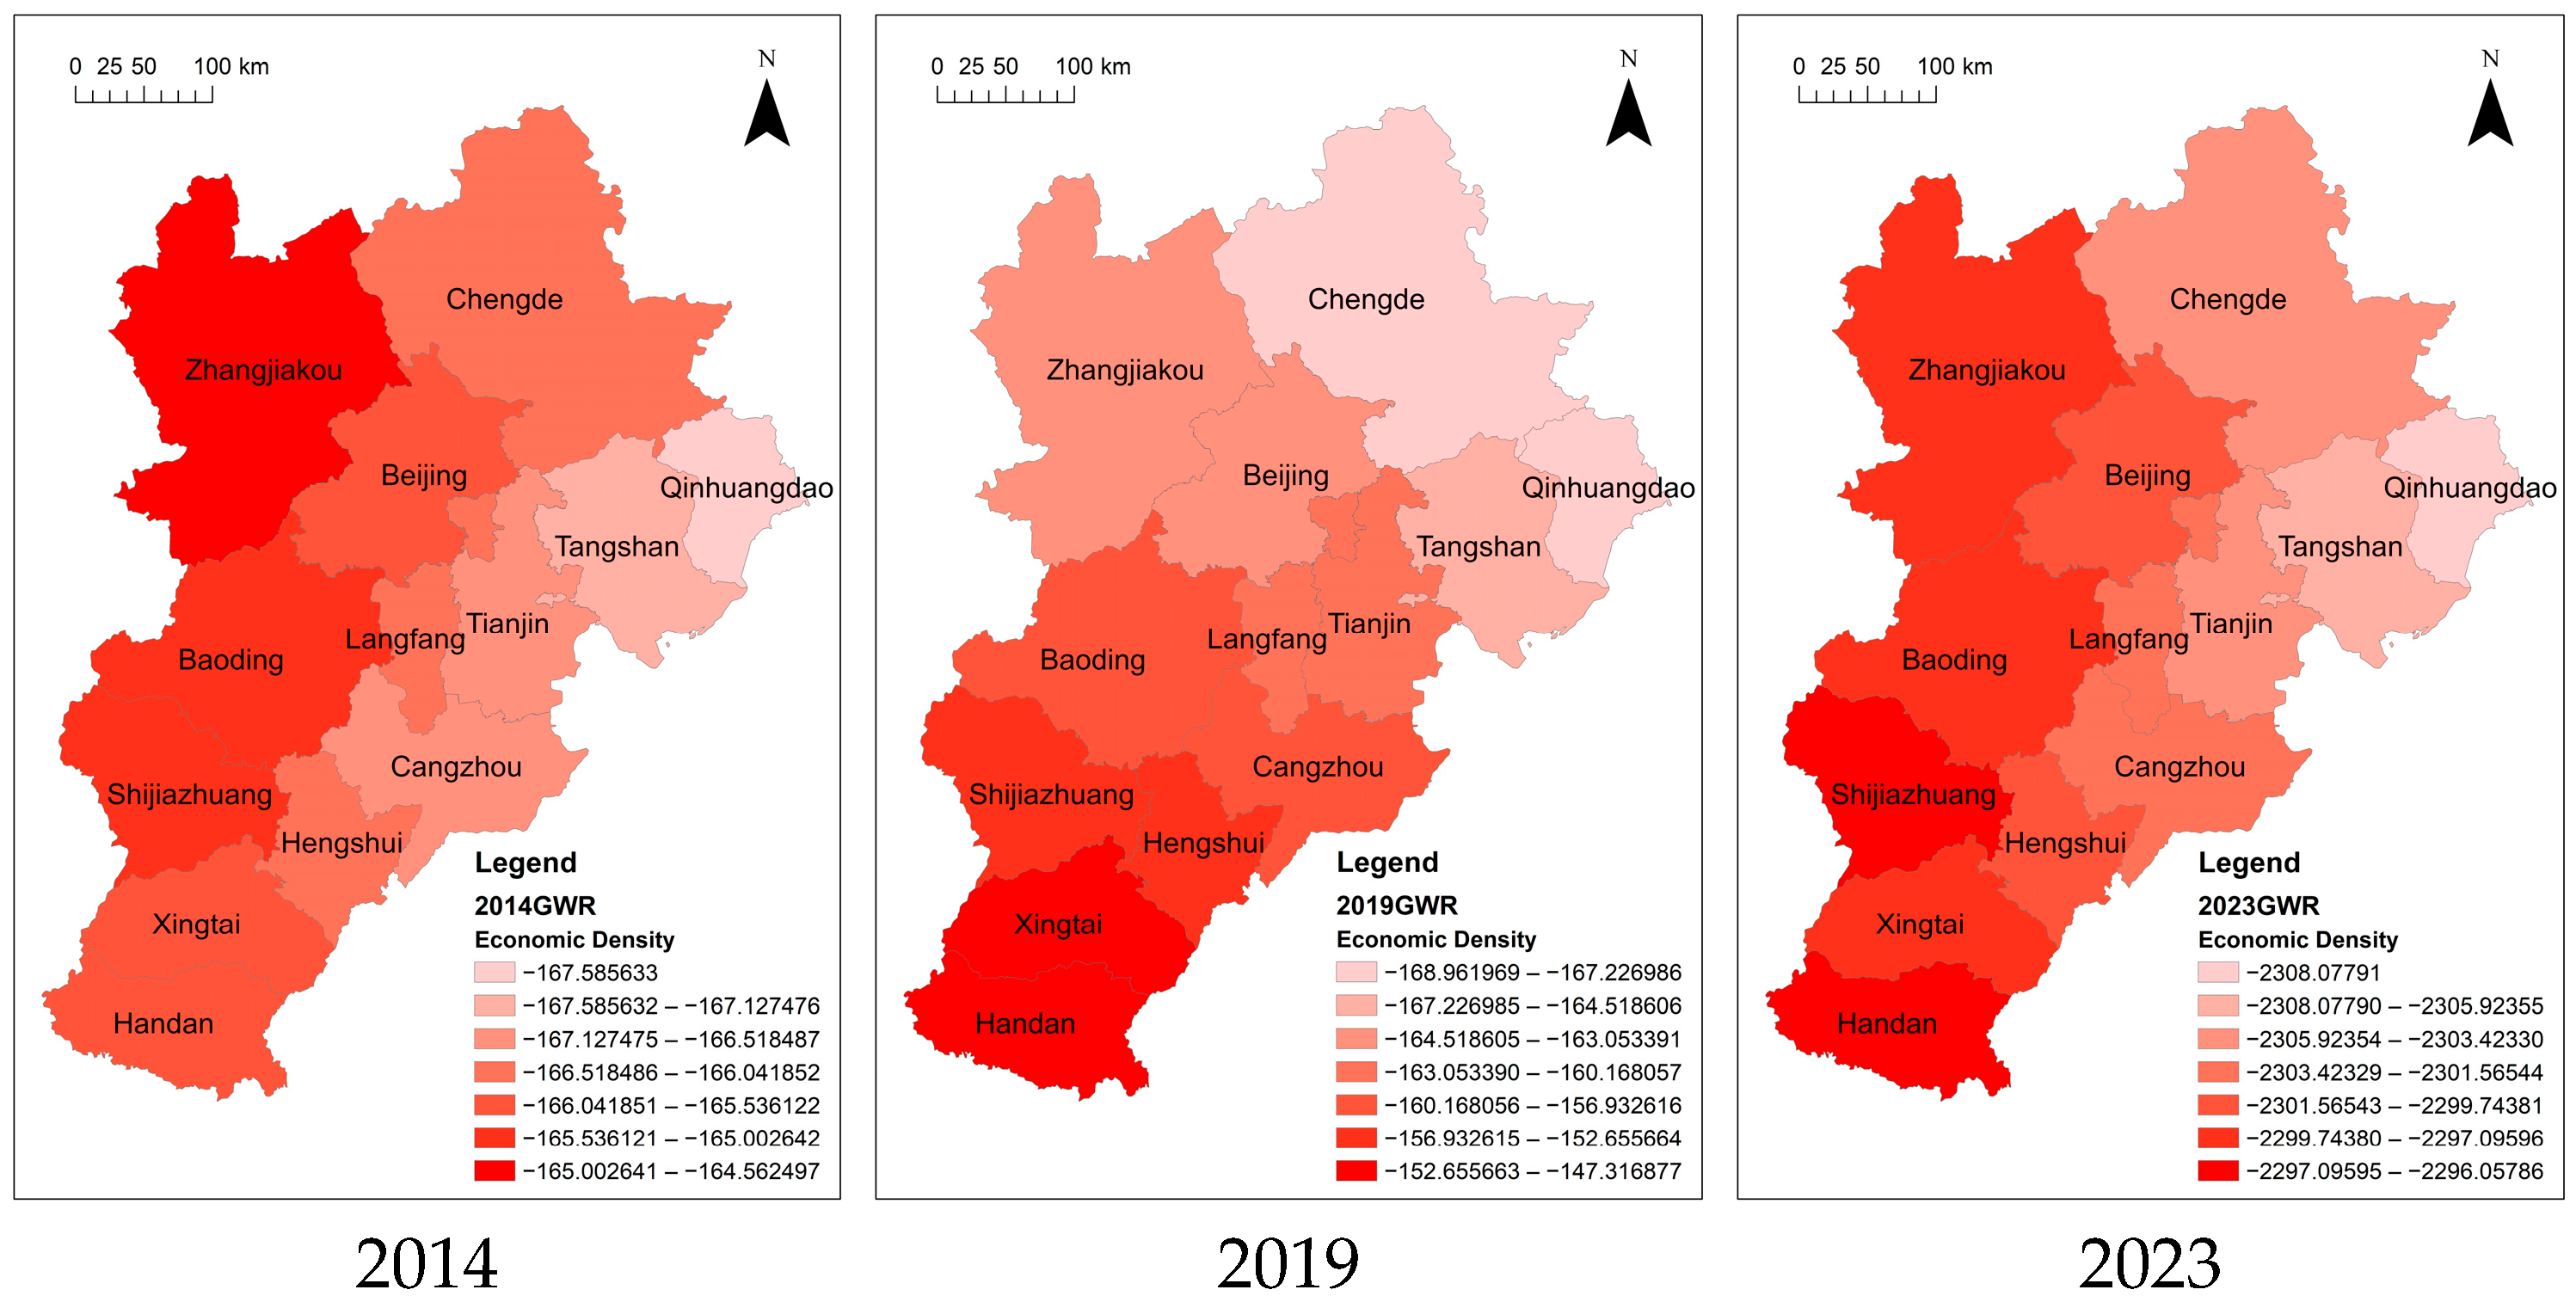
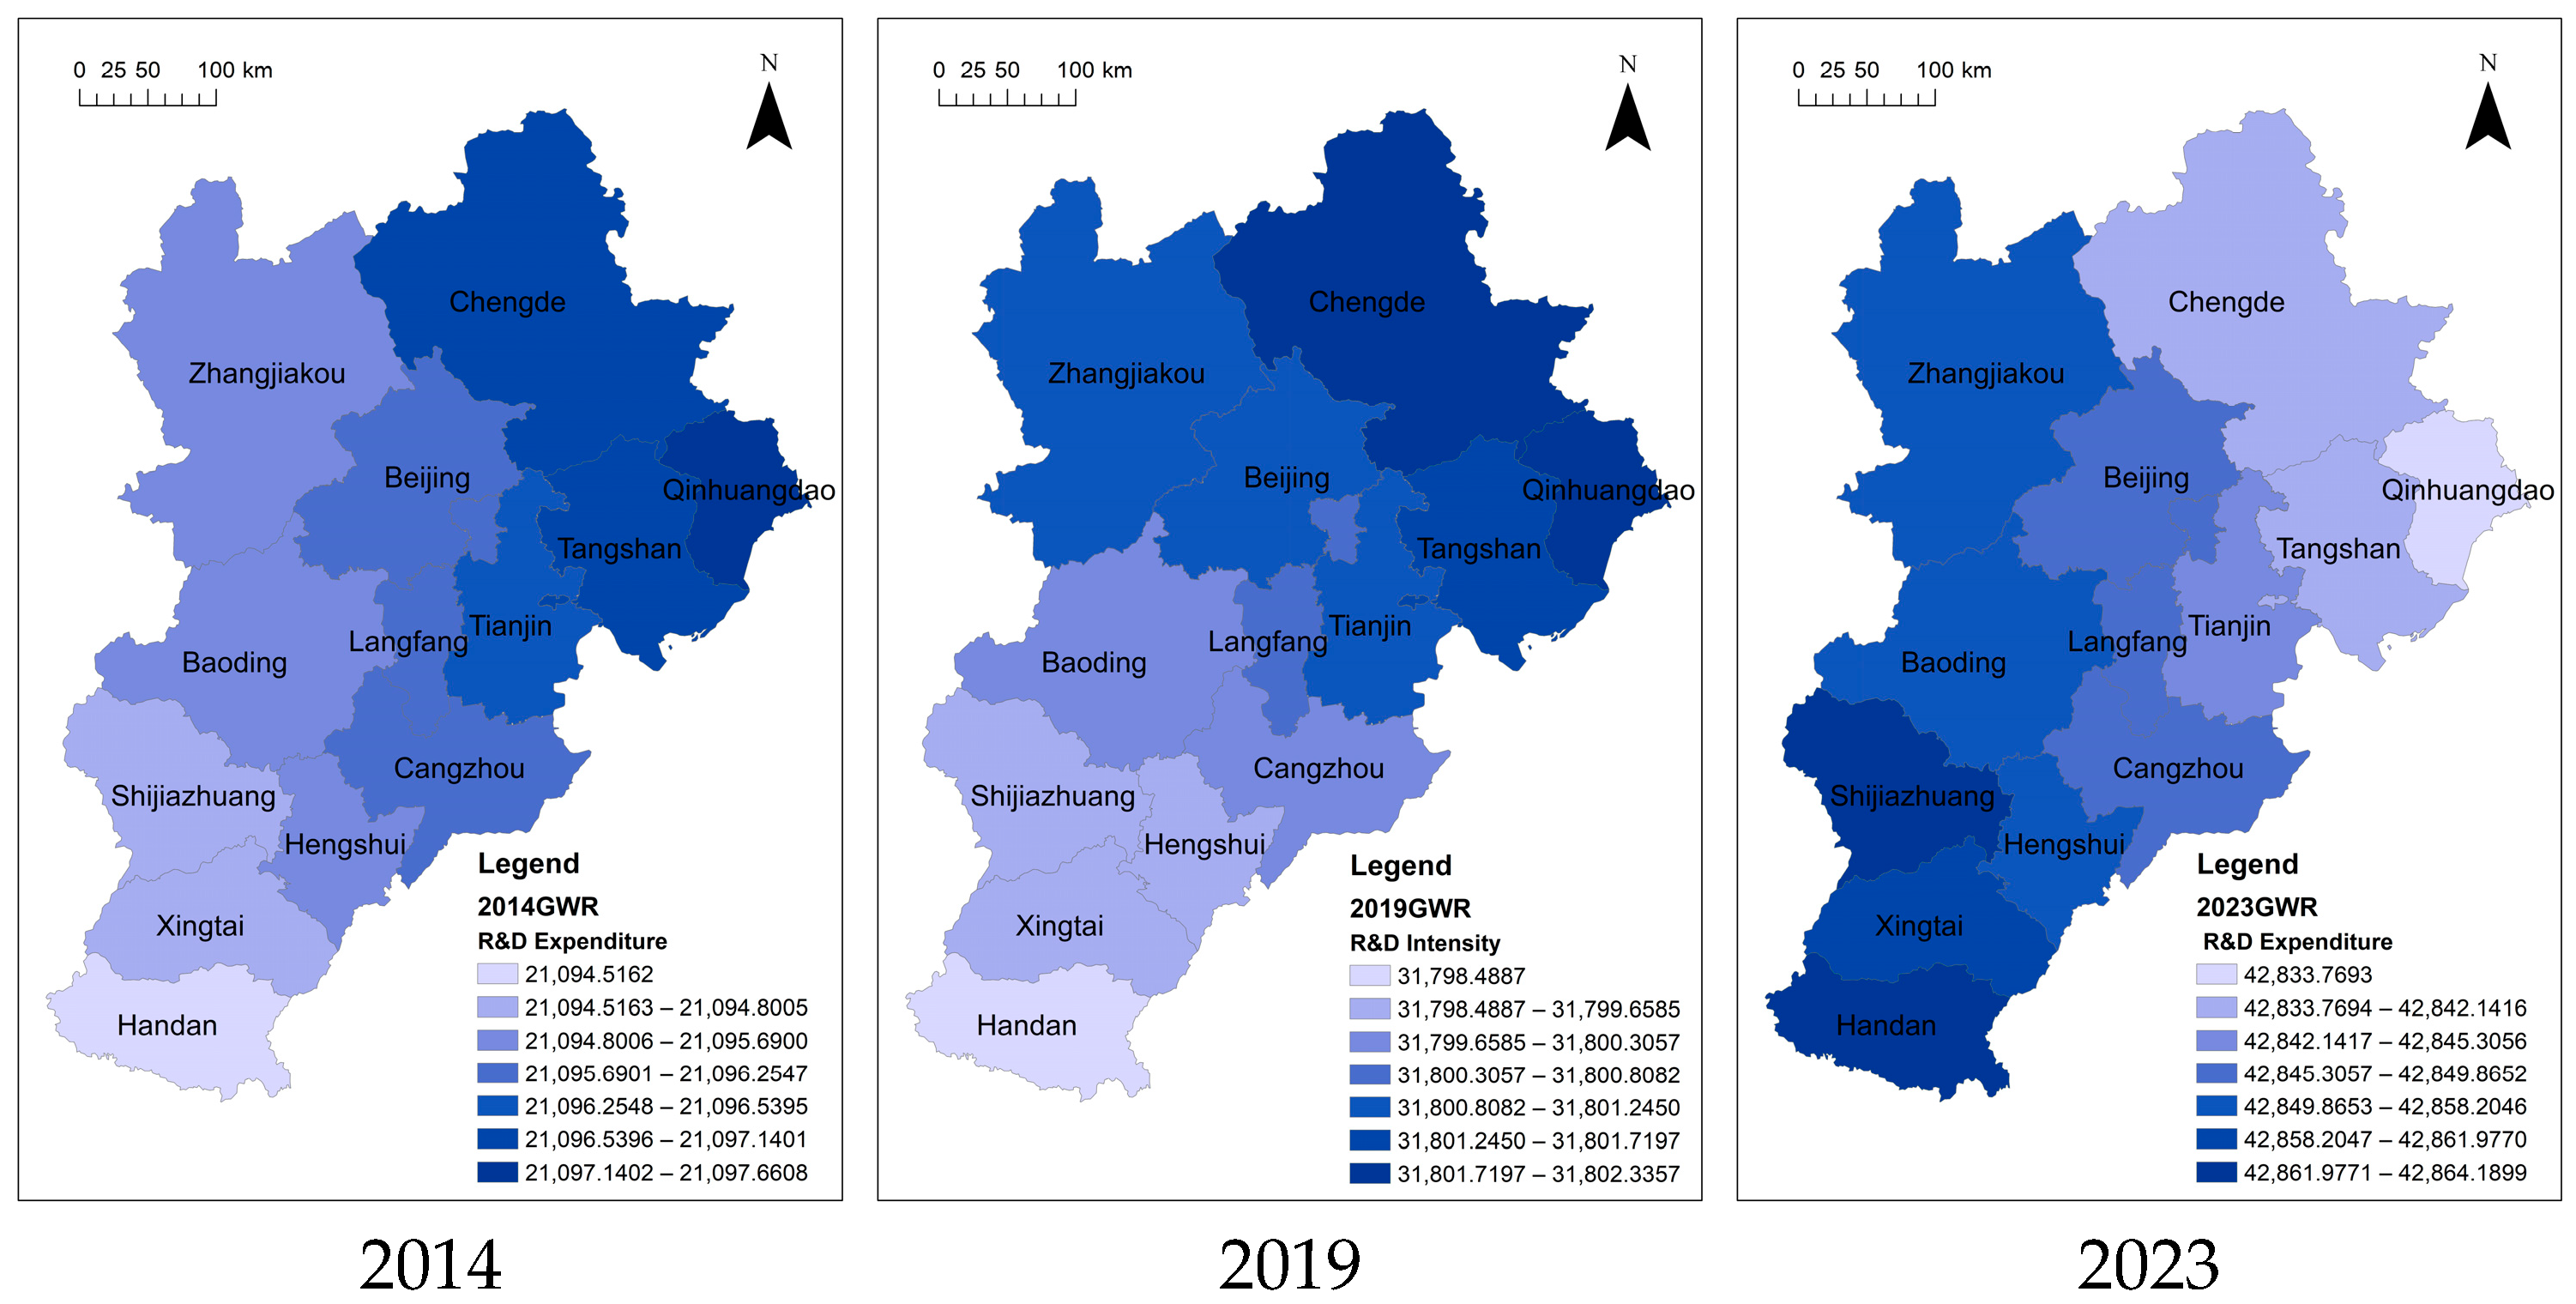
Based on the indicator system and exploratory regression results (Table 4), four key variables were selected for GWR analysis: economic density, R&D expenditure, foreign direct investment, and green space area. To account for the time-lag effect between innovation input and output [62], a one-year lag was applied. The Moran’s I results of the GWR are presented in Table 5. The residuals show no statistically significant spatial autocorrelation, indicating that the GWR model effectively captured and accounted for most of the spatial dependence in the data. The regression analysis reveals that R&D expenditure remains consistently significant, while economic density shows no significant effect across years. Green space area and FDI are significant only in 2014, suggesting temporally limited influences. Figure 10 presents the GWR results, which confirm spatial heterogeneity: the standard deviations and regression coefficients of all four factors vary across the 13 spatial units, validating the GWR approach. The regression coefficients of each factor are analyzed below.
Economic density (measured as GDP per unit area) consistently statistically insignificant and exhibits a negative correlation with innovation output (Figure 11)—a pattern that remained stable between 2014 and 2019 but intensified by 2023. High coefficient values cluster in central and southern Hebei, characterized by lower economic density. This finding indicates that modest economic input facilitates factor aggregation and stimulates innovation in regions with weaker innovation bases [63]. Conversely, in high-density areas like Beijing, Tianjin, and eastern Hebei, diminishing marginal returns and rising innovation costs hinder the achievement of high-quality innovation breakthroughs [64]. Collectively, these findings indicate that pursuing higher economic density alone is no longer an effective development strategy.
R&D expenditure, a key indicator of regional innovation investment and governmental support intensity, demonstrated a consistently significant and growing positive impact across all cities during the study period (Figure 12), reinforcing its crucial role in driving innovation. Concurrently, high-value clusters shifted from the northeast to the southwest. This shift was stimulated by Xiong’an’s large-scale, high-quality development initiatives since 2019 [65]. The establishment of the BTH National Technology Innovation Center has also accelerated R&D growth in southern Hebei cities like Shijiazhuang and Baoding, generating significant spillover effects in surrounding regions.
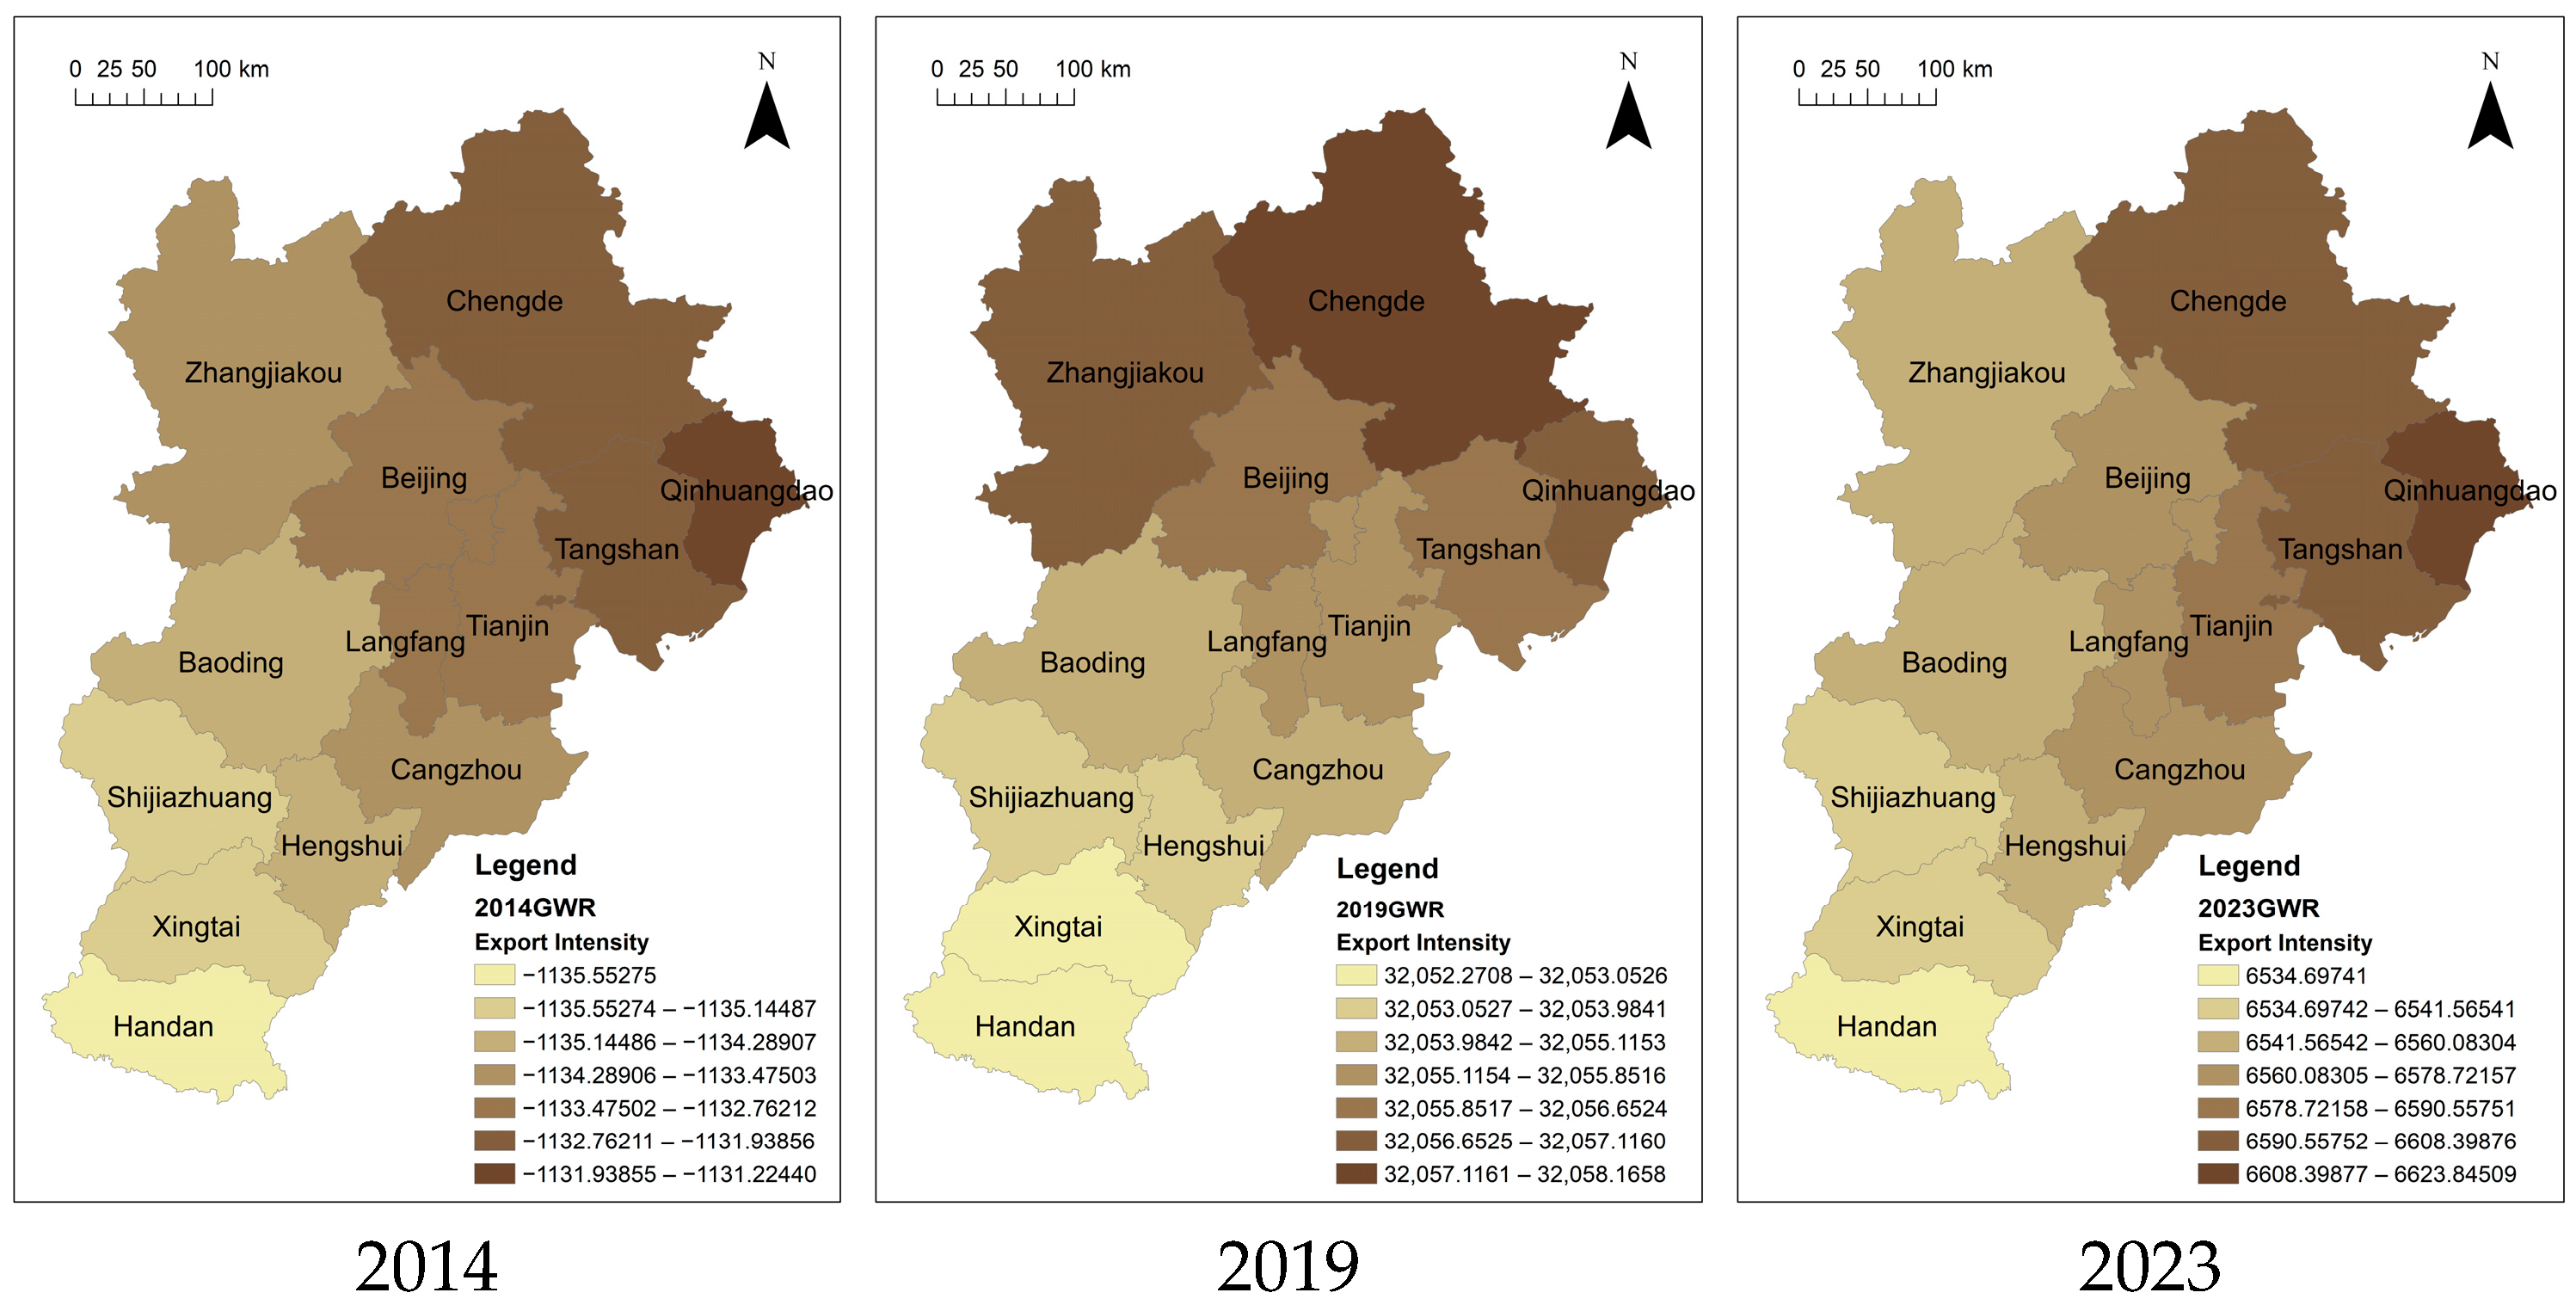
The strong dependence on foreign exports observed in 2014 reflected a transitional phase shaped by China’s shift toward domestic demand-driven growth (Figure 13), its evolving position in global value chains, and fluctuations in external demand during economic restructuring. Over the study period, the influence of foreign direct investment on innovation shifted from negative to positive, with traditional open cities such as Beijing, Tianjin, and eastern Hebei consistently emerging as high-value innovation hubs. This transition was driven by the establishment of the BTH Free Trade Zone and the Hebei Pilot Free Trade Zone, both of which attracted substantial international capital and fostered regional innovation capacity. However, foreign investment inflows declined notably after 2020, largely as a result of the disruptions caused by the COVID-19 pandemic.
As shown in Figure 14, the temporary but significant correlation between green space and exports observed in 2014 reflected a brief convergence of rising environmental awareness, export restructuring, and targeted policy initiatives. This relationship weakened as environmental standards became widely institutionalized. Meanwhile, the influence of green space on innovation shifted from negative to positive. Initially, high-value clusters transitioned from the southwest to the northeast, before returning to the southwest in later years. While environmental quality remained stable in the Beijing–Tianjin core, cities in the northern and southern parts regions experienced more substantial ecological improvements due to policy reforms. The strengthening positive relationship between green space and innovation suggests that enhanced environmental conditions can effectively stimulate innovation performance.

4.3. Research on the Coordination Mechanism of Innovation Space Policy

4.3.1. Analysis of Policy Intensity Findings

The PSI was developed to quantify policy effort and coordination intensity across the six strategic dimensions of the BTH coordinated development strategy, rather than to directly predict innovation output. Although the regression-weighted index achieves statistical significance, its explanatory power remains limited, underscoring its role as a complementary indicator rather than a primary determinant of innovation outcomes. The weak statistical association between the PSI and patent data reveals a critical insight: large-scale policy inputs do not immediately yield innovation gains. This lag arises from intervening constraints such as external shocks, structural transition delays, and short-term investment diversion that temporarily redirect resources away from innovation. Sustainable innovation outcomes therefore depend on long-term policy synergy to gradually unlock latent potential. This observed input–output disconnection reflects the incomplete maturation of coordinated innovation mechanisms within the BTH region. Three panel regression models were compared: the one-way Fixed Effects model (FE), the Random Effects model (RE), and the two-way Fixed Effects model (TWFE). Statistical tests confirmed the RE model’s optimal goodness-of-fit and variable significance (Table 6), establishing it as the final choice. Following data standardization for weight determination, the Policy Strength Index was constructed (Table 7).
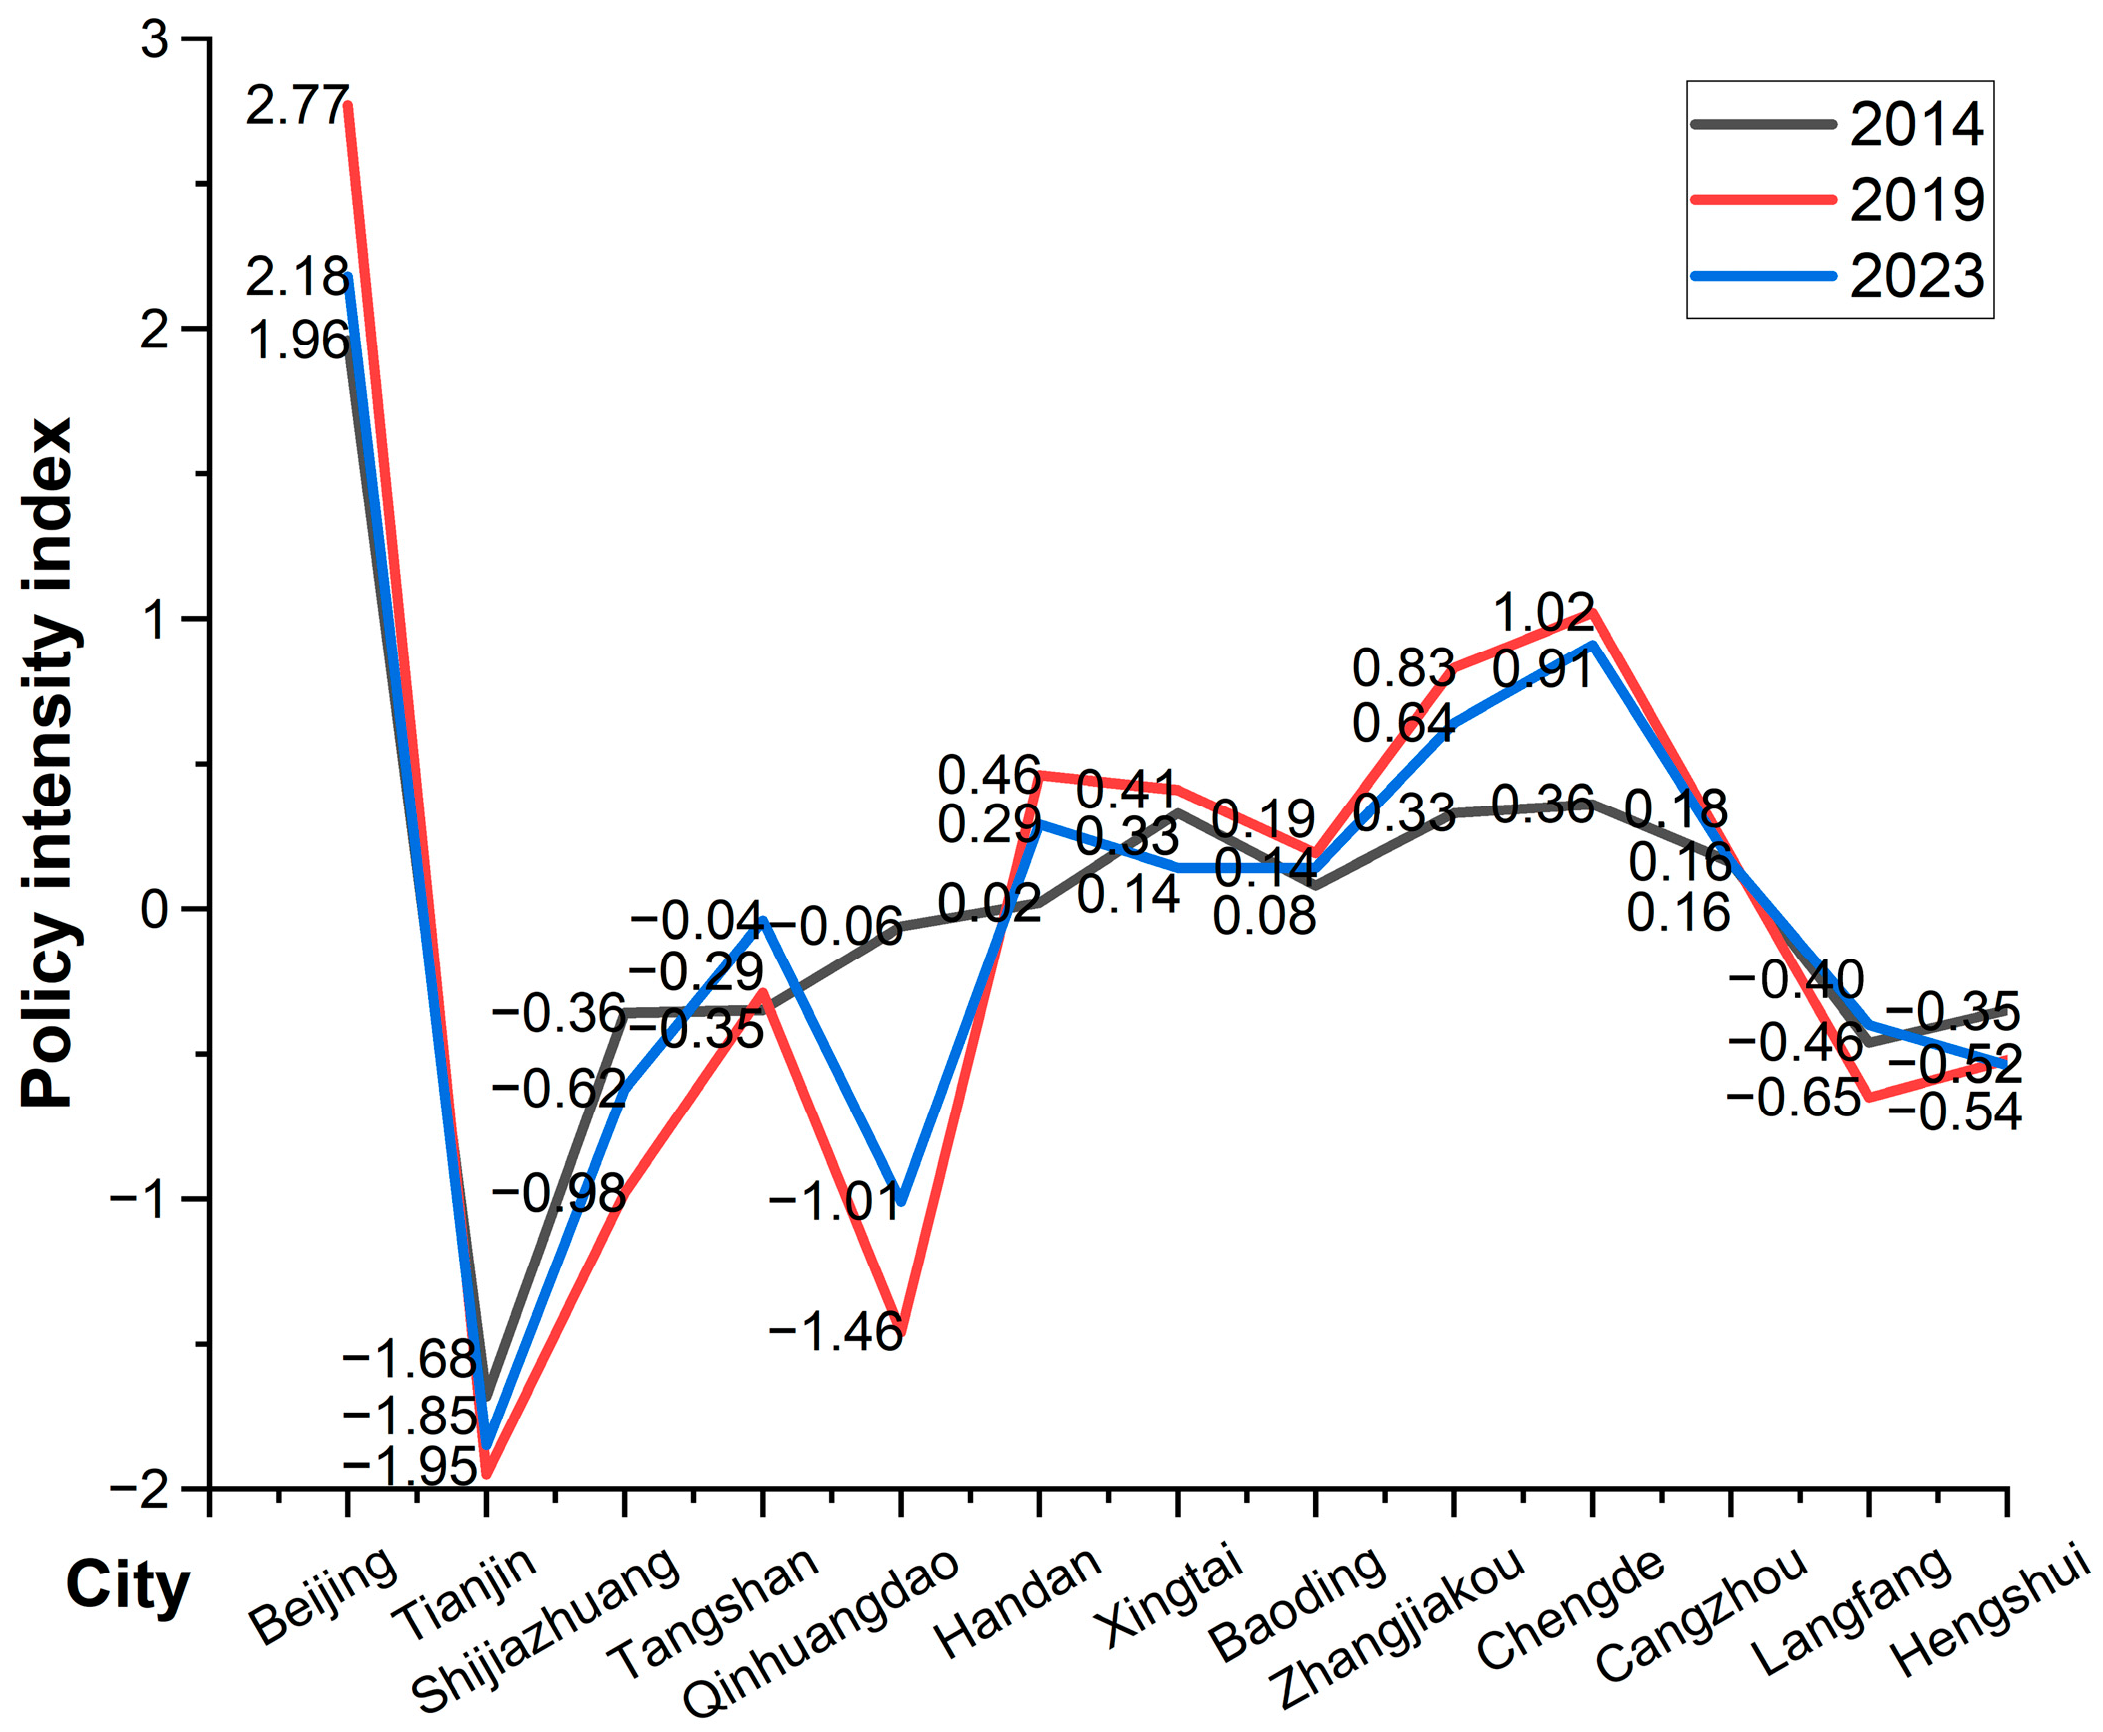
As illustrated in Table 6 and Table 7 and visualized in Figure 15, the PSI exhibits pronounced spatial heterogeneity and dynamic evolution across the region. Beijing consistently demonstrates significantly higher values, reflecting partial success in dispersing non-capital functions through coordinated policies. Tianjin, however, maintains persistently negative values with a downward trajectory, suggesting vulnerability to Beijing’s siphoning effect and insufficient coordination in competing for innovation resources with Hebei—highlighting gaps in regional industrial integration policies. Within Hebei, cities exhibit divergent trends: Tangshan and Chengde benefit from green industrial transformation, showing markedly strengthened policy-driven innovation effects. Langfang and Hengshui, constrained by agriculture and low-end manufacturing dependence and fiscal limitations, display persistent negative index growth and policy implementation challenges. Shijiazhuang experienced a sharp index drop followed by a slow recovery, driven by enhanced provincial capital functions but limited by slow industrial upgrading. Qinhuangdao, impacted by the pandemic, adopts active policy relief but sees slow recovery, further hindered by its industrial structure. Baoding and Cangzhou sustain relatively high and stable PSI levels, leveraging their proximity to Beijing and Tianjin as well as the spillover benefits from Xiong’an New Area. Other cities display cyclical fluctuations linked to ongoing industrial restructuring, emphasizing the need for long-term, stable policy frameworks to ensure sustainable innovation-driven growth.
Overall, the implementation of the BTH coordination policy has fostered a more balanced spatial distribution of innovation across the urban agglomeration. Through guiding targeted flows of innovation factors [66], enhancing infrastructure connectivity, and advancing institutional innovations [67], the region has established an effective policy intervention mechanism. However, administrative fragmentation continues to hinder cross-regional collaboration, limiting the movement of talent, capital, and technology. The concentration of resources in Beijing further widens regional disparities, while Tianjin and Hebei face difficulties in absorbing spillover effects due to industrial misalignment and weak market mechanisms. Findings from the PSI analysis suggest that, despite progress in regional integration, policy impacts on innovation output remain constrained by structural delays and external shocks. These challenges reveal the underdeveloped state of the regional innovation ecosystem and underscore the need for continued policy refinement to achieve more balanced, sustainable outcomes.

4.3.2. Comparative Insights from Global Urban Agglomerations

Compared to China’s Yangtze River Delta (YRD) and the Guangdong–Hong Kong–Macao Greater Bay Area (GBA), the BTH relies heavily on government-driven innovation with limited market synergy. This has led to an over-concentration of innovation resources in Beijing and weak absorption capacity in Tianjin and Hebei. While policy coordination under the BTH coordinated development has achieved progress in cross-regional research commercialization and joint industrial park development, persistent challenges include administrative fragmentation, industrial misalignment, and innovation resource flow barriers. By contrast, the YRD employs a “negative list” system, where sectors are open unless explicitly restricted, fostering a market-driven innovation model complemented by government coordination and multi-stakeholder networks. The GBA capitalizes on its “one country, two systems” framework [68] to implement distinctive governance, adopting cross-border research funding policies that attract international capital through the Pearl River Delta’s advanced manufacturing, thereby enhancing regional synergy.
Internationally, the San Francisco Bay Area operates through market-driven collaboration between universities and enterprises [69], supported by government policies such as R&D investment, tax incentives, patent protection, and procurement programs. Unlike the core–periphery polarization observed in the BTH region, the Bay Area’s decentralized governance fosters cross-county spillovers, particularly in AI and clean energy clusters. This model offers a valuable lesson for BTH on enhancing private-sector engagement. The Tokyo Bay Area employs a layered industrial chain model that combines governmental and corporate efforts [70]. Compared to the BTH region, this model mitigates polarization through balanced urban roles; however, it faces challenges such as an aging population and relatively slow digital adoption. These issues highlight the need for improved talent mobility, a concern that mirrors the talent disparities observed in the BTH region. The European Union enables transnational coordination via the Horizon Europe funding framework and unified technical standards [71,72], employing a decentralized, collaborative model that differs from China’s top-down approach. Nevertheless, opportunities for cooperation remain in areas such as sustainable urbanization, and this comparative analysis suggests that the BTH region could enhance its factor synergy by adopting cross-border funding mechanisms inspired by the Horizon Europe model.
Global cases offer useful insights for the BTH urban agglomeration, suggesting pathways to promote market-oriented innovation, guide industrial distribution, and overcome institutional constraints. Comparative analysis shows clear structural differences: BTH’s policy-driven model has led to uneven resource allocation, while market-based systems, such as those in the Yangtze River Delta and San Francisco, demonstrate higher efficiency. Governance structures further influence these outcomes. Centralized systems, as seen in BTH and Tokyo, tend to limit spillover effects, whereas decentralized models in San Francisco and the European Union foster stronger and more dynamic innovation linkages.

5. Discussion

5.1. Key Findings on the BTH Innovation Landscape

The BTH region exhibited a highly concentrated yet significantly differentiated innovation landscape. Structurally, Beijing and Tianjin specialized in R&D, while Hebei focused on commercialization, thereby perpetuating a core–periphery spatial model. Industrially, high-tech sectors drove innovation, with Beijing excelling in cutting-edge technologies, Tianjin specializing in industrial applications, and Hebei exploring emerging fields such as digital and green technologies. Further analysis revealed that economic density exerts heterogeneous effects, yielding positive agglomeration benefits in low-density areas but diminishing returns in high-density zones. Sustained R&D investments maintained a growing positive impact, and foreign investment, after a temporary pandemic-related decline, has made a positive contribution. Ecological improvements significantly boosted innovation. Regarding policy, the BTH coordination strategy revitalized Hebei’s innovation capacity through institutional guidance. This approach lays the foundation for enhanced market synergy and the eventual dismantling of administrative barriers.

5.2. Comparative Analysis with Planning Frameworks

The observed innovation patterns within the BTH urban agglomeration demonstrate a substantial alignment with the region’s coordinated development outline, which it structured around the “one core, two cities, three axes, four zones, and multiple nodes” structure. More specifically, Beijing’s position as the primary innovation hub corresponds to the “one core” designation; the identification of Beijing and Tianjin as dual engines for R&D and industrial application resonates with the “two cities” concept; and the Beijing–Tianjin–Xiong’an innovation corridor materially manifests the “three axes”. Furthermore, the “four zones” and “multiple nodes” strategy is reflected in the diffusion of innovation to cities in Hebei, guiding their specialized development and enhanced regional roles.
However, this study also reveals notable deviations between the empirical findings and the planned framework. While the outline emphasizes the orderly dispersal of non-capital functions and balanced polycentric development, Beijing continues to concentrate on innovative resources, highlighting a lack of effective diffusion. In addition, the establishment of an integrated regional network has been hindered by administrative barriers and weak collaboration, leading to uneven innovation absorption in Tianjin and Hebei. These findings underscore the need for enhanced policy coordination.

5.3. Policy Implications and Recommendations

This study provides policy recommendations for advancing the BTH innovation ecosystem through a stratified development approach that integrates industrial and spatial dimensions. Provincially, establishing coordinated mechanisms for division of labor [73] is essential to enhancing innovation resource integration and avoiding unproductive competition caused by uniform policy approaches. To enhance factor synergy, a regional coordination system is required to address resource gaps through improved mobility of innovation resources and industrial optimization. For reducing regional disparities, an innovation resource compensation mechanism should be explored to support less-developed areas, optimize the distribution of high-tech resources, and transition from passive industrial relocation to proactive collaboration. Institutionally, layered policy frameworks should be established to enhance coordination models. To overcome the region’s “policy-driven but market-constrained” dynamic, policy interventions should focus on promoting resource-sharing platforms [74] and fostering collaboration among innovation entities. Pilot policy initiatives can accelerate institutional innovation, while market-based tools should be employed to cultivate a more balanced relationship between government guidance and market forces.

5.4. Practical Applications of the Study

As core cities within the region, Beijing and Tianjin should prioritize achieving technological breakthroughs by attracting top-tier talent, strengthening their innovation infrastructures, and deepening industry–university–research collaboration. Concurrently, they should actively promote industrial restructuring in Hebei by facilitating knowledge and technology spillovers. For its part, Hebei needs to leverage government support to transition from low-end industries—often a result of passive industrial relocation—toward higher-value sectors. A practical approach involves capitalizing on Beijing’s high-tech advantages to establish regional technology hubs and develop joint innovation platforms. Initiatives such as enhanced collaboration between Z-Park in Beijing and the Binhai New Area in Tianjin can promote cross-regional technology exchange and help consolidate a more integrated model of “R&D in Beijing–Tianjin, Application in Hebei”.

6. Conclusions

In the context of intensifying global technological competition and the imperative for urban agglomerations to achieve high-quality development, this study investigates the spatial evolution and driving mechanisms of innovation within the BTH urban agglomeration. The findings reveal a persistent core–periphery structure, characterized by Beijing and Tianjin as R&D cores and Hebei as an industrial application base, thereby forming a hierarchical gradient in high-tech industries. The analysis of driving mechanisms demonstrates pronounced spatial heterogeneity: economic density’s role weakens in core areas, while R&D and ecological quality become stronger drivers. Recent institutional reforms have also turned foreign direct investment into a positive factor. Coordinated development policies have preliminarily strengthened regional innovation synergy, as reflected in the Policy Strength Index, yet persistent administrative barriers continue to constrain balanced resource allocation.
The primary contribution of this study lies in its integration of spatial econometric modeling with institutional analysis, introducing a new framework of “Spatial Structure-Factor Synergy-Institutional Drivers”, which is applicable to administratively coordinated urban agglomerations like BTH. Moving beyond conventional market-centered approaches, the empirical results reveal the intertwined effects of spatial structure and institutional coordination on regional innovation dynamics. This finding underscores the critical role of multi-level governance, cross-regional collaboration, and institutional synergy in promoting balanced and sustainable innovation development, thereby offering valuable and actionable insights for policy formulation in other administratively coordinated urban agglomerations.
The key limitation of this study is the lack of granular data, particularly regarding patent quality. Without detailed indicators of patent quality, the analysis of innovation is limited in scope. Future studies could address this limitation by incorporating high-quality patent data to refine the analytical framework, explore micro-level innovation entities, and integrate spatiotemporal big data for dynamic evaluation. In addition, comparative analyses of inter-city collaboration models would help identify transferable strategies to support China’s ongoing innovation-driven development [75].

Author Contributions

Conceptualization, R.D. and S.S.; methodology, R.D. and S.S.; validation, R.D. and S.S.; formal analysis, S.S.; data curation, S.S.; writing—original draft preparation, S.S.; writing—review and editing, R.D. and Y.Y.; visualization, R.D. and S.S.; supervision, R.D. and Y.Y.; project administration, R.D. and Y.Y.; funding acquisition, R.D. All authors have read and agreed to the published version of the manuscript.

Funding

This research was funded by Social Science Fund of Hebei Province, grant number HB24YS031.

Data Availability Statement

The data generated during the study are directly available within this article.

Conflicts of Interest

Author Yuhao Yang was employed by the Sichuan Hongtai Tongji Architectural Design Co., Ltd. The remaining authors declare that the research was conducted in the absence of any commercial or financial relationships that could be construed as a potential conflict of interest.

Appendix A

Figure A1. Spatial distribution of patent grants at the county level (2014–2023).
Land 14 02206 g0a1aLand 14 02206 g0a1b

References

  1. Zhang, J.X.; He, H.M. Beyond Growth: Innovation of Spatial Planning to Address Innovative Economy. City Plan. Rev. 2019, 43, 18–25. (In Chinese) [Google Scholar]
  2. Scott, A.J.; Storper, M. The Nature of Cities: The Scope and Limits of Urban Theory. Int. J. Urban Reg. Res. 2015, 39, 1–15. [Google Scholar] [CrossRef]
  3. Tang, S.; Zhang, J.X. Review on Progress and Prospect of Urban Innovation Space and Its Planning Practice. Urban Res. 2022, 3, 87–93. (In Chinese) [Google Scholar] [CrossRef]
  4. Florida, R.; Adler, P.; Mellander, C. The City as Innovation Machine. Reg. Stud. 2017, 51, 86–96. [Google Scholar] [CrossRef]
  5. Yang, N.; Liu, Q.; Chen, Y. Does Industrial Agglomeration Promote Regional Innovation Convergence in China? Evidence From High-Tech Industries. IEEE Trans. Eng. Manag. 2023, 70, 1416–1429. [Google Scholar] [CrossRef]
  6. Wang, W.; Liu, Y.; Hu, Q. How Does Urban Agglomeration Knowledge Network Structure Affect Innovation Productivity: The Moderating Role of Urban Digitalisation. Technol. Anal. Strateg. Manag. 2025, 37, 1–17. [Google Scholar] [CrossRef]
  7. Xiao, Z.; Li, H.; Gao, Y. Analysis of the Impact of the Beijing-Tianjin-Hebei Coordinated Development on Environmental Pollution and Its Mechanism. Environ. Monit. Assess. 2022, 194, 91. [Google Scholar] [CrossRef]
  8. Ma, B.; Li, Y.; Zhou, B.; Jian, Y.; Zhang, C.; An, J. The Green Development Mechanism of the Beijing-Tianjin-Hebei Coordinated Development Strategy in China: Novel Evidence of Green Finance. Int. Rev. Econ. Financ. 2025, 98, 103941. [Google Scholar] [CrossRef]
  9. Ge, L.; Li, C.; Sun, L.; Hu, W.; Ban, Q. The Relationship between High-Tech Industrial Agglomeration and Regional Innovation: A Meta-Analysis Investigation in China. Sustainability 2023, 15, 6545. [Google Scholar] [CrossRef]
  10. Tian, Y.; Kan, C.; Li, X.; Dang, A. An Analysis of Agglomeration Structure for Beijing, Tianjin, and Hebei Based on Spatial-Temporal Big Data. Comput. Urban Sci. 2024, 4, 11. [Google Scholar] [CrossRef]
  11. Sun, Y.; Zhao, S. Spatiotemporal Dynamics of Urban Expansion in 13 Cities across the Jing-Jin-Ji Urban Agglomeration from 1978 to 2015. Ecol. Indic. 2018, 87, 302–313. [Google Scholar] [CrossRef]
  12. Huang, D.; Wu, J.; Chen, W. Coordinated Development Strategy of the Beijing-Tianjin-Hebei Region. In Dictionary of Contemporary Chinese Economics; Hong, Y.X., Ed.; Springer Nature Singapore: Singapore, 2025; pp. 2041–2043. ISBN 978-981-97-4036-9. [Google Scholar]
  13. Chen, X.; Wang, H. Spatial–Temporal Evolution and Driving Factors of Industrial Land Marketization in Chengdu–Chongqing Economic Circle. Land 2024, 13, 972. [Google Scholar] [CrossRef]
  14. Cao, Y.; Kong, L.; Xu, Z.; Ding, Z.; Wang, L.; Liu, Y.; Li, R.; Shu, C.; Ouyang, Z. Exploring Coordinated Pathways for Sustainable Ecosystem and Socioeconomic Development: A Case Study of the Beijing-Tianjin-Hebei Region. Sustain. Futures 2025, 9, 100691. [Google Scholar] [CrossRef]
  15. Chen, Y.; Zhang, S.; Yang, L.; Zhang, X.; Yu, K.; Li, J. Ecological Footprint in Beijing-Tianjin-Hebei Urban Agglomeration: Evolution Characteristics, Driving Mechanism, and Compensation Standard. Environ. Impact Assess. Rev. 2024, 109, 107649. [Google Scholar] [CrossRef]
  16. Yue, Q. A Study on the Cooperative Innovation of Beijing-Tianjin-Hebei Based on System Model. In Proceedings of the 2020 International Conference on Urban Engineering and Management Science (ICUEMS), Zhuhai, China, 24–26 April 2020; pp. 83–86. [Google Scholar]
  17. Tian, J.; Ma, J.; Zeng, S.; Bai, Y. Characteristics and Driving Factors of the Spatial and Temporal Evolution of County Urban–Rural Integration—Evidence from the Beijing–Tianjin–Hebei Region, China. Land 2025, 14, 1563. [Google Scholar] [CrossRef]
  18. Chen, Q.; Liu, Y.; Yao, Z. Spatial–Temporal Pattern Evolution and Differentiation Mechanism of Urban Dual Innovation: A Case Study of China’s Three Major Urban Agglomerations. Land 2024, 13, 1399. [Google Scholar] [CrossRef]
  19. Kemeny, T.; Petralia, S.; Storper, M. Disruptive Innovation and Spatial Inequality. Reg. Stud. 2025, 59, 2076824. [Google Scholar] [CrossRef]
  20. Huang, D.; Xu, G.; Li, C.; Yang, S. Effects of High-Tech Industrial Agglomeration and Innovation on Regional Economic Development in China: Evidence from Spatial-Temporal Analysis and Spatial Durbin Model. Econ. Anal. Policy 2025, 86, 692–712. [Google Scholar] [CrossRef]
  21. Fan, D.C.; Li, S.N. Research on R&D Innovation Efficiency of Regional High-Tech Industry Considering Spatial Effect. In Proceedings of the 2017 International Conference on Management Science and Engineering (ICMSE), Nomi, Japan, 17–20 August 2017; pp. 313–320. [Google Scholar]
  22. Schumpeter, J.A. The Theory of Economic Development: An Inquiry into Profits, Capital, Credit, Interest, and the Business Cycle; Transaction Publishers: Piscataway, NJ, USA, 1934. [Google Scholar]
  23. Marshall, A. Principles of Economics; Palgrave Classics in Economics; Palgrave Macmillan London: London, UK, 1890; ISBN 978-1-137-37526-1. [Google Scholar]
  24. Jacobs, J. The Economy of Cities; The Economy of Cities; Vintage: New York, NY, USA, 1969. [Google Scholar]
  25. Portergoff, M.; Portergoff, M.; Porter, M.E.; Porter, M.; Porter, M.A.; Portergoff, M.E.; Porter, M.E.; Porter, M.E.; Porter, S.; Porter, M.E. The Competitive Advantage of Nations; The Competitive Advantage of Nations; Free Press: New York, NY, USA, 1990. [Google Scholar]
  26. Caragliu, A.; Del Bo, C.; Nijkamp, P. Smart Cities in Europe. In Creating Smart-er Cities; Routledge: London, UK, 2009. [Google Scholar]
  27. Florida, R. The Rise of the Creative Class. Wash. Mon. 2002, 35, 593–596. [Google Scholar]
  28. Taş, M.A.; Alptekin, S.E. Evaluation of Major Cities in Terms of Smart Cities: A Developing Country Perspective. Procedia Comput. Sci. 2023, 225, 1717–1726. [Google Scholar] [CrossRef]
  29. Yakubovich, V.; Wu, S. OrgTech: Evidence of Organizational Innovations in Patent Data. Res. Policy 2025, 54, 105209. [Google Scholar] [CrossRef]
  30. Cooke, P. Regional Innovation Systems: Competitive Regulation in the New Europe. Geoforum 1992, 23, 365–382. [Google Scholar] [CrossRef]
  31. Crepon, B.; Duguet, E.; Mairessec, J. Research, Innovation and Productivi[Ty: An Econometric Analysis at the Firm Level. Econ. Innov. New Technol. 1998, 7, 115–158. [Google Scholar] [CrossRef]
  32. Audretsch, D.B.; Lehmann, E.E.; Warning, S. University Spillovers and New Firm Location. Res. Policy 2005, 34, 1113–1122. [Google Scholar] [CrossRef]
  33. Strange, W.; Hejazi, W.; Tang, J. The Uncertain City: Competitive Instability, Skills, Innovation and the Strategy of Agglomeration. J. Urban Econ. 2006, 59, 331–351. [Google Scholar] [CrossRef]
  34. Berliant, M.; Reed, R.R.; Wang, P. Knowledge Exchange, Matching, and Agglomeration. J. Urban Econ. 2006, 60, 69–95. [Google Scholar] [CrossRef]
  35. Peirone, D.; Pereira, D.B.; Leitão, J.; Nezghoda, O. The Role of the Agglomeration Economy and Innovation Ecosystem in the Process of Competency Development and Growth of Small and Medium-Sized Enterprises. Adm. Sci. 2024, 14, 222. [Google Scholar] [CrossRef]
  36. Sun, Y.K.; Li, G.P.; Yuan, W.W.; Sun, T.S. The Spatial Concentration of Innovation and its Mechanisms: A Literature Review and Prospect. Hum. Geogr. 2017, 32, 17–24. [Google Scholar] [CrossRef]
  37. Gao, Y.; Cheng, L.; Ren, Y.; Hu, Y.; Chen, L.; Tian, J. High-Quality Development in Industrial Parks: New Narrative and Pathway to Sustainable Development from a Policy Perspective in China. Resour. Conserv. Recycl. 2025, 215, 108111. [Google Scholar] [CrossRef]
  38. Luo, Y.; Shen, J. Urban Entrepreneurialism, Metagovernance and ‘Space of Innovation’: Evidence from Buildings for Innovative Industries in Shenzhen, China. Cities 2022, 131, 104067. [Google Scholar] [CrossRef]
  39. Gao, Y.; Lin, R.; Lu, Y. A Visualized Analysis of the Research Current Hotspots and Trends on Innovation Chain Based on the Knowledge Map. Sustainability 2022, 14, 1708. [Google Scholar] [CrossRef]
  40. Li, G.; Yuan, Q.; Liu, X.; Zhan, W.; Yang, S. Measuring Intra-Urban Innovation Space from the Unit-Network Perspective: A Case Study of Guangzhou. Land 2025, 14, 504. [Google Scholar] [CrossRef]
  41. Yigitcanlar, T. (Ed.) Rethinking Sustainable Development: Urban Management, Engineering, and Design; Advances in Environmental Engineering and Green Technologies; IGI Global: New York, NY, USA, 2010; ISBN 978-1-61692-022-7. [Google Scholar]
  42. Li, Y.; Wei, Y.; Li, Y.; Lei, Z.; Ceriani, A. Connecting Emerging Industry and Regional Innovation System: Linkages, Effect and Paradigm in China. Technovation 2022, 111, 102388. [Google Scholar] [CrossRef]
  43. Mi, R.; Liu, S.; Liu, C.; Li, Z.; Li, S. The Nexus of Digitalization, Talent, and High-Quality Development: How Clusters Foster Sustainable Economic Growth. Sustainability 2025, 17, 503. [Google Scholar] [CrossRef]
  44. Qi, L.; Zhang, Y.; Chen, Y.; Chen, L.; Zhou, S.; Wei, X. The Spatial Pattern Evolution of Urban Innovation Actors and the Planning Response to Path Dependency: A Case Study of Guangzhou City, China. Urban Sci. 2024, 8, 111. [Google Scholar] [CrossRef]
  45. Alcácer, J.; Chauvin, J. The Extent and Drivers of Internal Agglomeration of U.S. Multi-Unit Firms. Strateg. Manag. J. 2025, 46, 1–39. [Google Scholar] [CrossRef]
  46. Lehmann, E.E.; Schenkenhofer, J.; Vismara, S. Hidden Champions and Knowledge Spillovers: Innovation-Enhancing Agglomeration Effects and Niche Technology Specificity. Small Bus. Econ. 2025, 65, 1–21. [Google Scholar] [CrossRef]
  47. Grieser, W.; Maturana, G.; Spyridopoulos, I.; Truffa, S. Agglomeration, Knowledge Spillovers, and Corporate Investment. J. Corp. Financ. 2022, 77, 102289. [Google Scholar] [CrossRef]
  48. Li, L.; Wang, L.; Zhang, X.; Wang, L. Technological Composition and Innovation Factors in Inventive Yangtze River Delta: Evidence from Patent Inventions. Appl. Sci. 2024, 14, 1842. [Google Scholar] [CrossRef]
  49. Chen, J.; Jiang, L.; Tian, Y.; Luo, J. The Study of Regional Innovation Network Structure: Evidence from the Yangtze River Delta Urban Agglomeration. ISPRS Int. J. Geo-Inf. 2023, 12, 428. [Google Scholar] [CrossRef]
  50. Hu, E.; Hu, D.; He, H. Spatial Patterns of Urban Innovation and Their Evolution from Perspectives of Capacity and Structure: Taking Shenzhen as an Example. ISPRS Int. J. Geo-Inf. 2021, 11, 7. [Google Scholar] [CrossRef]
  51. Liu, B.; Xue, D.; Zheng, S. Evolution and Influencing Factors of Manufacturing Production Space in the Pearl River Delta—Based on the Perspective of Global City-Region. Land 2023, 12, 419. [Google Scholar] [CrossRef]
  52. Li, Z.; Liu, Y. Research on the Spatial Distribution Pattern and Influencing Factors of Digital Economy Development in China. IEEE Access 2021, 9, 63094–63106. [Google Scholar] [CrossRef]
  53. Liang, L.; Chen, M.; Luo, X.; Xian, Y. Changes Pattern in the Population and Economic Gravity Centers since the Reform and Opening up in China: The Widening Gaps between the South and North. J. Clean. Prod. 2021, 310, 127379. [Google Scholar] [CrossRef]
  54. Yu, H. Generalized Geographically and Temporally Weighted Regression. Comput. Environ. Urban Syst. 2025, 117, 102244. [Google Scholar] [CrossRef]
  55. Zhang, L.; Zhang, R.; Wang, Z.; Yang, F. Spatial Heterogeneity of the Impact Factors on Gray Water Footprint Intensity in China. Sustainability 2020, 12, 865. [Google Scholar] [CrossRef]
  56. Sheng, S.; Huang, J. Spatiotemporal Dynamics and Driving Mechanisms of Ecosystem Services in the Beijing–Tianjin–Hebei Urban Agglomeration: Implications for Sustainable Land Use Planning. Land 2025, 14, 969. [Google Scholar] [CrossRef]
  57. Zhang, W.; Qian, Y.; Tang, J.; Liu, X. Exploring Cooperative and Competitive Relations in a Chinese Intercity Innovation Network. Appl. Geogr. 2025, 175, 103508. [Google Scholar] [CrossRef]
  58. Liu, D.; Zhang, K. Analysis of Spatial Differences and the Influencing Factors in Eco-Efficiency of Urban Agglomerations in China. Sustainability 2022, 14, 2611. [Google Scholar] [CrossRef]
  59. Yuan, X.; Ren, J.; Gu, C.; Shi, X.; Liu, X.; Chen, J.; Wang, L. Innovation Districts in Beijing: Evolution, Distribution, and Development Mechanisms. In Chinese Urban Planning and Construction: From Historical Wisdom to Modern Miracles; Bian, L., Tang, Y., Shen, Z., Eds.; Springer International Publishing: Cham, Switzerland, 2021; pp. 275–299. ISBN 978-3-030-65562-4. [Google Scholar]
  60. Zhang, G.; Liu, J.Q.; Li, J.Y. Leading the Construction of Beijing-Tianjin-Hebei World-Class Urban Agglomeration with Beijing-Tianjin-Xiong’an Innovation Triangle Area. Const. Communist Party China 2019, 21, 64–70. [Google Scholar] [CrossRef]
  61. Wang, N.; Guo, J.; Zhang, X.; Zhang, J.; Li, Z.; Meng, F.; Zhang, B.; Ren, X. The Circular Economy Transformation in Industrial Parks: Theoretical Reframing of the Resource and Environment Matrix. Resour. Conserv. Recycl. 2021, 167, 105251. [Google Scholar] [CrossRef]
  62. Dai, C.; Li, Y.; Lu, S. Research on Regional Economic Development Level Based on Spatial Econometric Model. In Proceedings of the 2024 7th International Conference on E-Business, Information Management and Computer Science, Hong Kong, China, 20–22 December 2024; Association for Computing Machinery: New York, NY, USA, 2025; pp. 47–52. [Google Scholar]
  63. Yang, A.; Tan, M. Research on Urbanization of Middle and South Hebei from the Perspective of High Mobility. Appl. Comput. Eng. 2024, 78, 181–186. [Google Scholar] [CrossRef]
  64. Zhuang, T.; Zhao, S.; Zheng, M.; Chu, J. Triple Helix Relationship Research on China’s Regional University–Industry–Government Collaborative Innovation: Based on Provincial Patent Data. Growth Change 2021, 52, 1361–1386. [Google Scholar] [CrossRef]
  65. Wu, Y.Q.; Leng, X.R. A Review and Outlook on the 10th Anniversary of the Coordinated Development of the Beijing-Tianjin-Hebei Region. Econ. Manag. 2024, 38, 1–8. [Google Scholar]
  66. Chen, J.; Yin, X.; Mei, L. Holistic Innovation: An Emerging Innovation Paradigm. Int. J. Innov. Stud. 2018, 2, 1–13. [Google Scholar] [CrossRef]
  67. Xu, A.; Qiu, K.; Jin, C.; Cheng, C.; Zhu, Y. Regional Innovation Ability and Its Inequality: Measurements and Dynamic Decomposition. Technol. Forecast. Soc. Change 2022, 180, 121713. [Google Scholar] [CrossRef]
  68. Tang, H.H. The Strategic Role of World-Class Universities in Regional Innovation System: China’s Greater Bay Area and Hong Kong’s Academic Profession. Asian Educ. Dev. Stud. 2020, 11, 7–22. [Google Scholar] [CrossRef]
  69. McNeill, D. Governing a City of Unicorns: Technology Capital and the Urban Politics of San Francisco. Urban Geogr. 2016, 37, 494–513. [Google Scholar] [CrossRef]
  70. Matsubara, H. Industrial Structural Changes in the Tokyo Metropolitan Area. J. Geogr. (Chigaku Zasshi) 2014, 123, 285–297. [Google Scholar] [CrossRef]
  71. Leijten, J. Innovation Policy and International Relations: Directions for EU Diplomacy. Eur. J. Futures Res. 2019, 7, 4. [Google Scholar] [CrossRef]
  72. Marullo, C.; Shapira, P.; Minin, A.D. Enhancing SME Innovation across European Regions: Success Factors in EU-Funded Open Innovation Networks. Technol. Forecast. Soc. Change 2024, 201, 123207. [Google Scholar] [CrossRef]
  73. Pan, W.; Wang, J.; Lu, Z.; Liu, Y.; Li, Y. High-Quality Development in China: Measurement System, Spatial Pattern, and Improvement Paths. Habitat. Int. 2021, 118, 102458. [Google Scholar] [CrossRef]
  74. Zhang, H.; Li, F.; Wei, S.; Jiang, L.; Xiong, J.; Zhang, T. Spatiotemporal Evolution Characteristics and Influencing Factors of Digital Industry in China. Sci. Rep. 2024, 14, 28591. [Google Scholar] [CrossRef] [PubMed]
  75. Chen, J.; Yin, X.; Fu, X.; McKern, B. Beyond Catch-up: Could China Become the Global Innovation Powerhouse? China’s Innovation Progress and Challenges from a Holistic Innovation Perspective. Ind. Corp. Change 2020, 30, 1037–1064. [Google Scholar] [CrossRef]
Figure 1. Research framework diagram.
Land 14 02206 g001
Figure 2. Study area of Beijing–Tianjin–Hebei (BTH) urban agglomeration, China.
Land 14 02206 g002
Figure 3. Technical roadmap.
Land 14 02206 g003
Figure 4. Temporal dynamics of patent grants in the BTH urban agglomeration (2014–2023).
Land 14 02206 g004
Figure 5. Spatial distribution of patent grants at the county level (2014, 2019, 2023).
Land 14 02206 g005
Figure 6. Temporal trends in the spatial Gini coefficient with confidence intervals (2014–2023).
Land 14 02206 g006
Figure 7. Temporal trends in the spatial coefficient of variation (2014–2023).
Land 14 02206 g007
Figure 8. Innovation relocation of high-tech industries in the BTH urban agglomeration (2014, 2019, 2023).
Land 14 02206 g008aLand 14 02206 g008b
Figure 9. Location Quotient of innovation in high-tech industries by sector (2014, 2019, 2023).
Land 14 02206 g009aLand 14 02206 g009b
Figure 10. GWR modeling of innovation space in the BTH urban agglomeration (2014, 2019, 2023).
Land 14 02206 g010
Figure 11. GWR coefficients of economic density in the BTH urban agglomeration (2014, 2019, 2023).
Land 14 02206 g011
Figure 12. GWR coefficients of R&D expenditure in the BTH urban agglomeration (2014, 2019, 2023).
Land 14 02206 g012
Figure 13. GWR coefficients of export intensity in the BTH urban agglomeration (2014, 2019, 2023).
Land 14 02206 g013
Figure 14. GWR coefficients of green space ratio in the BTH urban agglomeration (2014, 2019, 2023).
Land 14 02206 g014
Figure 15. Policy intensity index of cities in the BTH urban agglomeration (2014, 2019, 2023).
Land 14 02206 g015
Table 1. Data sources and description.
Data TypeSourceCorresponding YearsDescription
Patent grantsChina National Intellectual Property Administration (CNIPA)2014–2023Including Invention, Utility Model and Design patent
Supplementary MetricsProvincial and Municipal Statistical Yearbooks and Bulletins2013, 2018, 2022Including economic conditions, R&D capacity, openness level, living conditions, ecological quality, and transportation infrastructure
Spatial UnitsGeospatial Data CloudAs of year-end 2023 administrative divisionsBoundaries for 13 prefecture-level cities and 194 counties in the BTH urban agglomeration
Table 2. Indicator system of influencing factors.
CategoryCodeFactorDescription
Economic
Environment
X1Economic densityGDP/area
X2Economic developmentPer capita GDP
R&D environmentX3R&D expenditureR&D funding
X4Fiscal S&T expenditureGovernment S&T spending
Openness levelX5Export intensityExports/GDP
X6FDI utilizationActual FDI
Living conditionsX7Disposable incomeUrban per capita income
X8Urbanization rateUrban population share
Ecological qualityX9Green spaceGreen area
Transportation
infrastructure
X10Road densityHighway mileage
Table 3. Standard deviational ellipse and centroid parameter results.
SubsectorsYearMajor Axis
(km)
Minor Axis
(km)
RotationCentroid
Coordinates
PM2014231.24149.7931.16(116.47, 39.83)
2019237.37141.0832.38(116.42, 39.83)
2023230.29144.5234.62(116.44, 39.85)
ASM2014238.89175.7530.70(116.57, 39.73)
2019278.56189.7339.25(116.64, 39.59)
2023302.12189.1536.14(116.56, 39.56)
ECEM2014181.20131.7025.23(116.48, 39.95)
2019194.22140.0226.41(116.49, 39.92)
2023190.31131.3328.10(116.46, 39.95)
COEM2014141.67107.4313.12(116.48, 40.04)
2019169.96122.7823.91(116.47, 39.99)
2023161.26120.6923.94(116.47, 40.00)
MEIM2014226.93163.3126.64(116.54, 39.80)
2019269.21179.5334.19(116.55, 39.66)
2023291.45174.6633.04(116.46, 39.65)
ICPM2014289.11122.8226.70(116.28, 39.71)
2019282.60175.3936.22(116.54, 39.70)
2023225.64150.7928.31(116.50, 39.82)
Table 4. Summary of significance for each variable.
Variable201420192023
Sig.Pos.Neg.Sig.Pos.Neg.Sig.Pos.Neg.
X130.4728.1271.8852.7692.917.0911.7665.4934.51
X21.9523.4476.5611.0739.5360.478.3322.6277.38
X398.05100.000.0066.9497.932.0767.0687.7012.30
X468.3682.8117.1976.03100.000.0083.3397.562.44
X521.4857.8142.1910.2492.527.484.7163.5336.47
X668.362.3497.6642.1553.3146.6956.4595.564.44
X721.0980.8619.1413.0437.9462.0616.4776.0823.92
X827.3439.4560.5525.5964.5735.4315.0251.3848.62
X940.2322.6677.3453.4185.1414.8663.7194.765.24
X1023.8356.6443.369.6470.2829.7252.6362.7537.25
Table 5. GWR Moran’s I results.
YearIndexZ-Scorep-Value
2014−0.362084−1.3878810.165173
20190.1184381.0014580.316606
20230.0436890.6524860.514088
Table 6. Panel regression model results.
ParameterFERETWFE
Intercept
Economic density
18,156.993 **
(1,795,832.568)
18,157.002 **
(19.139)
18,156.993 **
(3,467,263.372)
75,454.047
(1.094)
7519.358
(0.837)
75,453.343
(0.966)
R&D expenditure−154,771.183
(−1.841)
29,368.885 **
(6.174)
−154,768.197
(−1.764)
Export/GDP−735.014
(−0.128)
−2007.484
(−0.415)
−735.140
(−0.173)
Disposable income15,124.476
(0.847)
−2396.551
(−0.640)
15,124.597
(0.819)
Green space249.301
(0.012)
4695.422
(0.987)
248.969
(0.010)
Road density−1936.936
(−0.775)
−2218.035
(−0.941)
−1936.926
(−0.672)
R2−7.7060.863−7.706
R2 (adjusted)0.3480.090.348
Test statisticF(6,20) = 3.622,
p = 0.013
x2(6) = 11,987.055,
p = 0.000
F(6,18) = 7.804,
p = 0.000
Notes: Dependent variable = patent grants; ** p < 0.01; t-values in parentheses.
Table 7. Policy Strength Index (PSI) weighting system.
DimensionIndicatorCoefficientWeight
Economic baseEconomic density7519.3580.13799
Innovation inputR&D expenditure29,368.8851.91952
OpennessExport/GDP−2007.484−0.63879
LivelihoodDisposable income−2396.551−0.67051
InfrastructureRoad density4695.422−0.09226
EcologyGreen space−2218.035−0.65595
Disclaimer/Publisher’s Note: The statements, opinions and data contained in all publications are solely those of the individual author(s) and contributor(s) and not of MDPI and/or the editor(s). MDPI and/or the editor(s) disclaim responsibility for any injury to people or property resulting from any ideas, methods, instructions or products referred to in the content.