Article

Unveiling the Spatial Mismatch Between Green Space Equity and Residents’ Subjective Well-Being: An Integrated Approach Based on Machine Learning and Social Media Data

Gold Mantis School of Architecture, Soochow University, Suzhou 215127, China
*
Author to whom correspondence should be addressed.
Land 2025, 14(11), 2205; https://doi.org/10.3390/land14112205
Submission received: 10 October 2025 / Revised: 31 October 2025 / Accepted: 4 November 2025 / Published: 6 November 2025

Abstract

The limited capacity of urban green spaces to equitably satisfy the well-being needs of populations in urbanized areas is a global challenge. However, research on the spatial mismatch between green space equity and residents’ subjective well-being (SWB) remains inadequate. Using Shanghai as a case study, this research integrates social media data with an improved GA2SFCA method to evaluate SWB and UPGS accessibility and analyzes and compares the geographical spatial distribution differences of UPGS accessibility across different travel modes. This study employs machine learning to reveal the potential drivers of the mismatch between SWB and UPGS accessibility (note that this study does not explore causal relationships). The results indicate that: (1) UPGS accessibility in Shanghai exhibits pronounced spatial heterogeneity, the equity results derived from the Lorenz curve and Gini coefficient indicate that public transit (Gini = 0.579) < walking (0.427) < driving (0.149), and community parks effectively mitigating disparities among other urban park types; (2) UPGS accessibility and SWB are spatially correlated (r = 0.013, p < 0.01, z > 2.58), with a distinct High-High clustering pattern identified in the inner-ring region; (3) Road network accessibility (SHAP = 0.9478), housing prices (0.7025), and company agglomeration (0.5695) are the three most influential factors contributing to the spatial mismatch where SWB is higher than accessibility, and they exhibit clear threshold effects. These findings link urban green space equity with residents’ SWB, providing a basis for targeted interventions to enhance social welfare and promote urban sustainability.

1. Introduction

The “World Urbanization Prospects 2024” states that by mid-2024, the global population is projected to reach 8.2 billion, peaking in the mid-2080s before beginning to decline [1]. With the advancement of urbanization, human health is facing numerous challenges. On the one hand, urban residents are exposed to increasing environmental problems, while on the other hand, the risk of declining quality of life is also rising [2]. Urban parks and green spaces are important public infrastructure [3], as an integral part of urban green space, urban parks provide residents with valuable and barrier-free access to natural areas. The majority of the well-documented benefits of urban greenery, particularly those associated with direct contact or immersion, are contingent upon physical access to these spaces. Therefore, convenient accessibility is a crucial prerequisite for people to obtain the various benefits provided by UPGS [4]. However, in reality, significant spatial disparities in the distribution of urban parks often result in a mismatch with residents’ needs [5,6]. Thus, enhancing green space equity to meet rising public demand is an essential prerequisite for sustainable urban development [7].
Research on environmental justice related to UPGS has partly focused on differences among population groups [8,9,10], such as discussions of racial disparities [11], variations across urban areas [12], differences in socioeconomic status [13], as well as studies concerning visitors’ gender [14] and age [15]. The second focuses on methodological advances in accessibility assessment. Early studies assessed accessibility using the cumulative opportunity method, but this approach has been criticized for its sensitivity to geographic boundary constraints [16]. Later, to address this limitation, methods such as space syntax and GIS-based techniques were introduced [17,18,19]. After that, Talen and Anselin [20] introduced the gravity model as a key indicator for accessibility evaluation. Building on this, subsequent researchers developed several floating catchment area (FCA) models to improve assessment, such as the Gaussian-decay 2SFCA method that incorporates a distance decay coefficient [21,22], the multi-modal 2SFCA method that accounts for accessibility differences across various travel modes [23], and the three-step floating catchment area (3SFCA) method that incorporates the probability of residents visiting parks [24]. Despite these methodological advancements, the uncertainty in travel time costs caused by traffic congestion is still often overlooked. Later research [25] incorporated real-time navigation data to improve the precision of UPGS accessibility assessment. In future research, the limitations of accessibility assessment need to be further addressed.
Subjective well-being (SWB) was initially defined by Diener [26]. As research has progressed, an increasing body of evidence has demonstrated a strong relationship between UPGS and subjective well-being [27,28,29], with most existing studies confirming that UPGS availability exerts a positive influence on SWB [30,31,32]. However, empirical investigations into the spatial relationship between UPGS accessibility and SWB remain limited, largely due to the difficulty of quantifying SWB at a fine spatial scale. Traditional approaches to measuring SWB have primarily relied on well-being scales and recall-based assessments, yet these methods suffer from various limitations, including high implementation costs and potential emotional biases caused by variations in respondents’ mood across different times or environmental contexts [33]. With the advancement of relevant research, data from social media platforms such as Twitter, Instagram, and Weibo have been shown to provide valuable sources for analyzing users’ emotional perceptions [27,34,35]. Notably, previous studies have found a striking degree of consistency between users’ online and offline emotional states [36]. However, previous studies have not integrated the results of green space perception assessment based on social media data to reveal the spatial matching mechanism between urban green space accessibility and residents’ subjective well-being. Therefore, this study aims to address and further investigate this research gap. At the same time, it must be acknowledged that social media data are ultimately generated by individuals, and their representativeness is inevitably influenced by population differences such as regional disparities in economic status, political background, education level, and age. Moreover, since social media users constitute only a portion of the total population, the collected social data are inevitably subject to population bias [37].
Regarding the relationship between UPGS accessibility and SWB, studies have shown that the more frequently people visit UPGS, the higher their SWB tends to be [38]. Although UPGS have well-documented public health benefits, their distribution is uneven, and promoting green space equity is therefore an essential component of developing just cities [39]. Subsequent studies have begun to explore the mismatch between UPGS accessibility and subjective well-being (SWB), with particular attention paid to vulnerable groups [40,41]. Many findings suggest that sociodemographic and economic factors such as residents’ age, gender, educational background, housing prices, and household income are key determinants influencing the spatial mismatch between UPGS and SWB. In addition, from a spatiotemporal perspective, several studies have examined the underlying relationships between nighttime UPGS accessibility, measured by indicators such as nighttime light intensity, and residents’ SWB [42]. Factors such as population density and land-use intensity have also been identified as important influences on the relationship between UPGS accessibility and residents’ well-being. These studies have explored the spatial mismatch between UPGS accessibility and SWB from different perspectives; however, a systematic framework that integrates the potential driving factors influencing this spatial mismatch is still lacking. For cities and society as a whole, the potential relationship between UPGS accessibility levels and the spatial mismatch of SWB remains insufficiently understood.
This study takes the Shanghai metropolitan area as a case, on the one hand, Shanghai is facing increasing inequality in urban park and green space (UPGS) accessibility, which is crucial for achieving social equity. On the other hand, the municipal government is actively promoting UPGS planning and construction, with the city entering its second phase of the Urban Park System (UPS) development that aims to add at least 500 new parks. To better support and inform Shanghai’s UPGS planning, this study employs natural language processing (NLP) to analyze 360,979 geotagged Weibo check-in records for an objective assessment of residents’ subjective well-being (SWB), and an improved GA2SFCA method is also applied to assess spatial inequality in UPGS accessibility. The study makes three key contributions: (1) integrating supervised classification with UPGS quality ratings to generate a composite supply index, improving the traditional network analysis method for evaluating UPGS accessibility by incorporating residents’ travel time data, and evaluating spatial disparities using the Gini coefficient; (2) operationalizing SWB measurement from social media content via NLP to examine correlations and spatial mismatches with UPGS accessibility; and (3) applying SHAP and XGBoost models to identify nonlinear effects, thresholds, and interaction patterns among determinants across built environment, infrastructure, and socioeconomic dimensions. The findings provide actionable insights for urban planners to design targeted interventions that improve social well-being and support the sustainable development of urban green infrastructure.

2. Materials and Methods

The theoretical framework of residents’ SWB and UPGS accessibility is illustrated in Figure 1. We quantified the SWB of residents within the study area and assessed UPGS accessibility using an improved GA2SFCA method. Prior to data analysis, we aggregated the data into hexagonal grids with a 300 m (5-min living circle) range, and used GeoDa to analyze the correlation and mismatch between SWB and UPGS accessibility. Furthermore, SHAP was used to interpret the results of the XGBoost model in order to reveal nonlinear factors influencing mismatch outcomes and to explore their potential mechanisms. The subsequent subsections provide a detailed description of the datasets employed and the methodological approaches adopted in this study.

2.1. Study Area

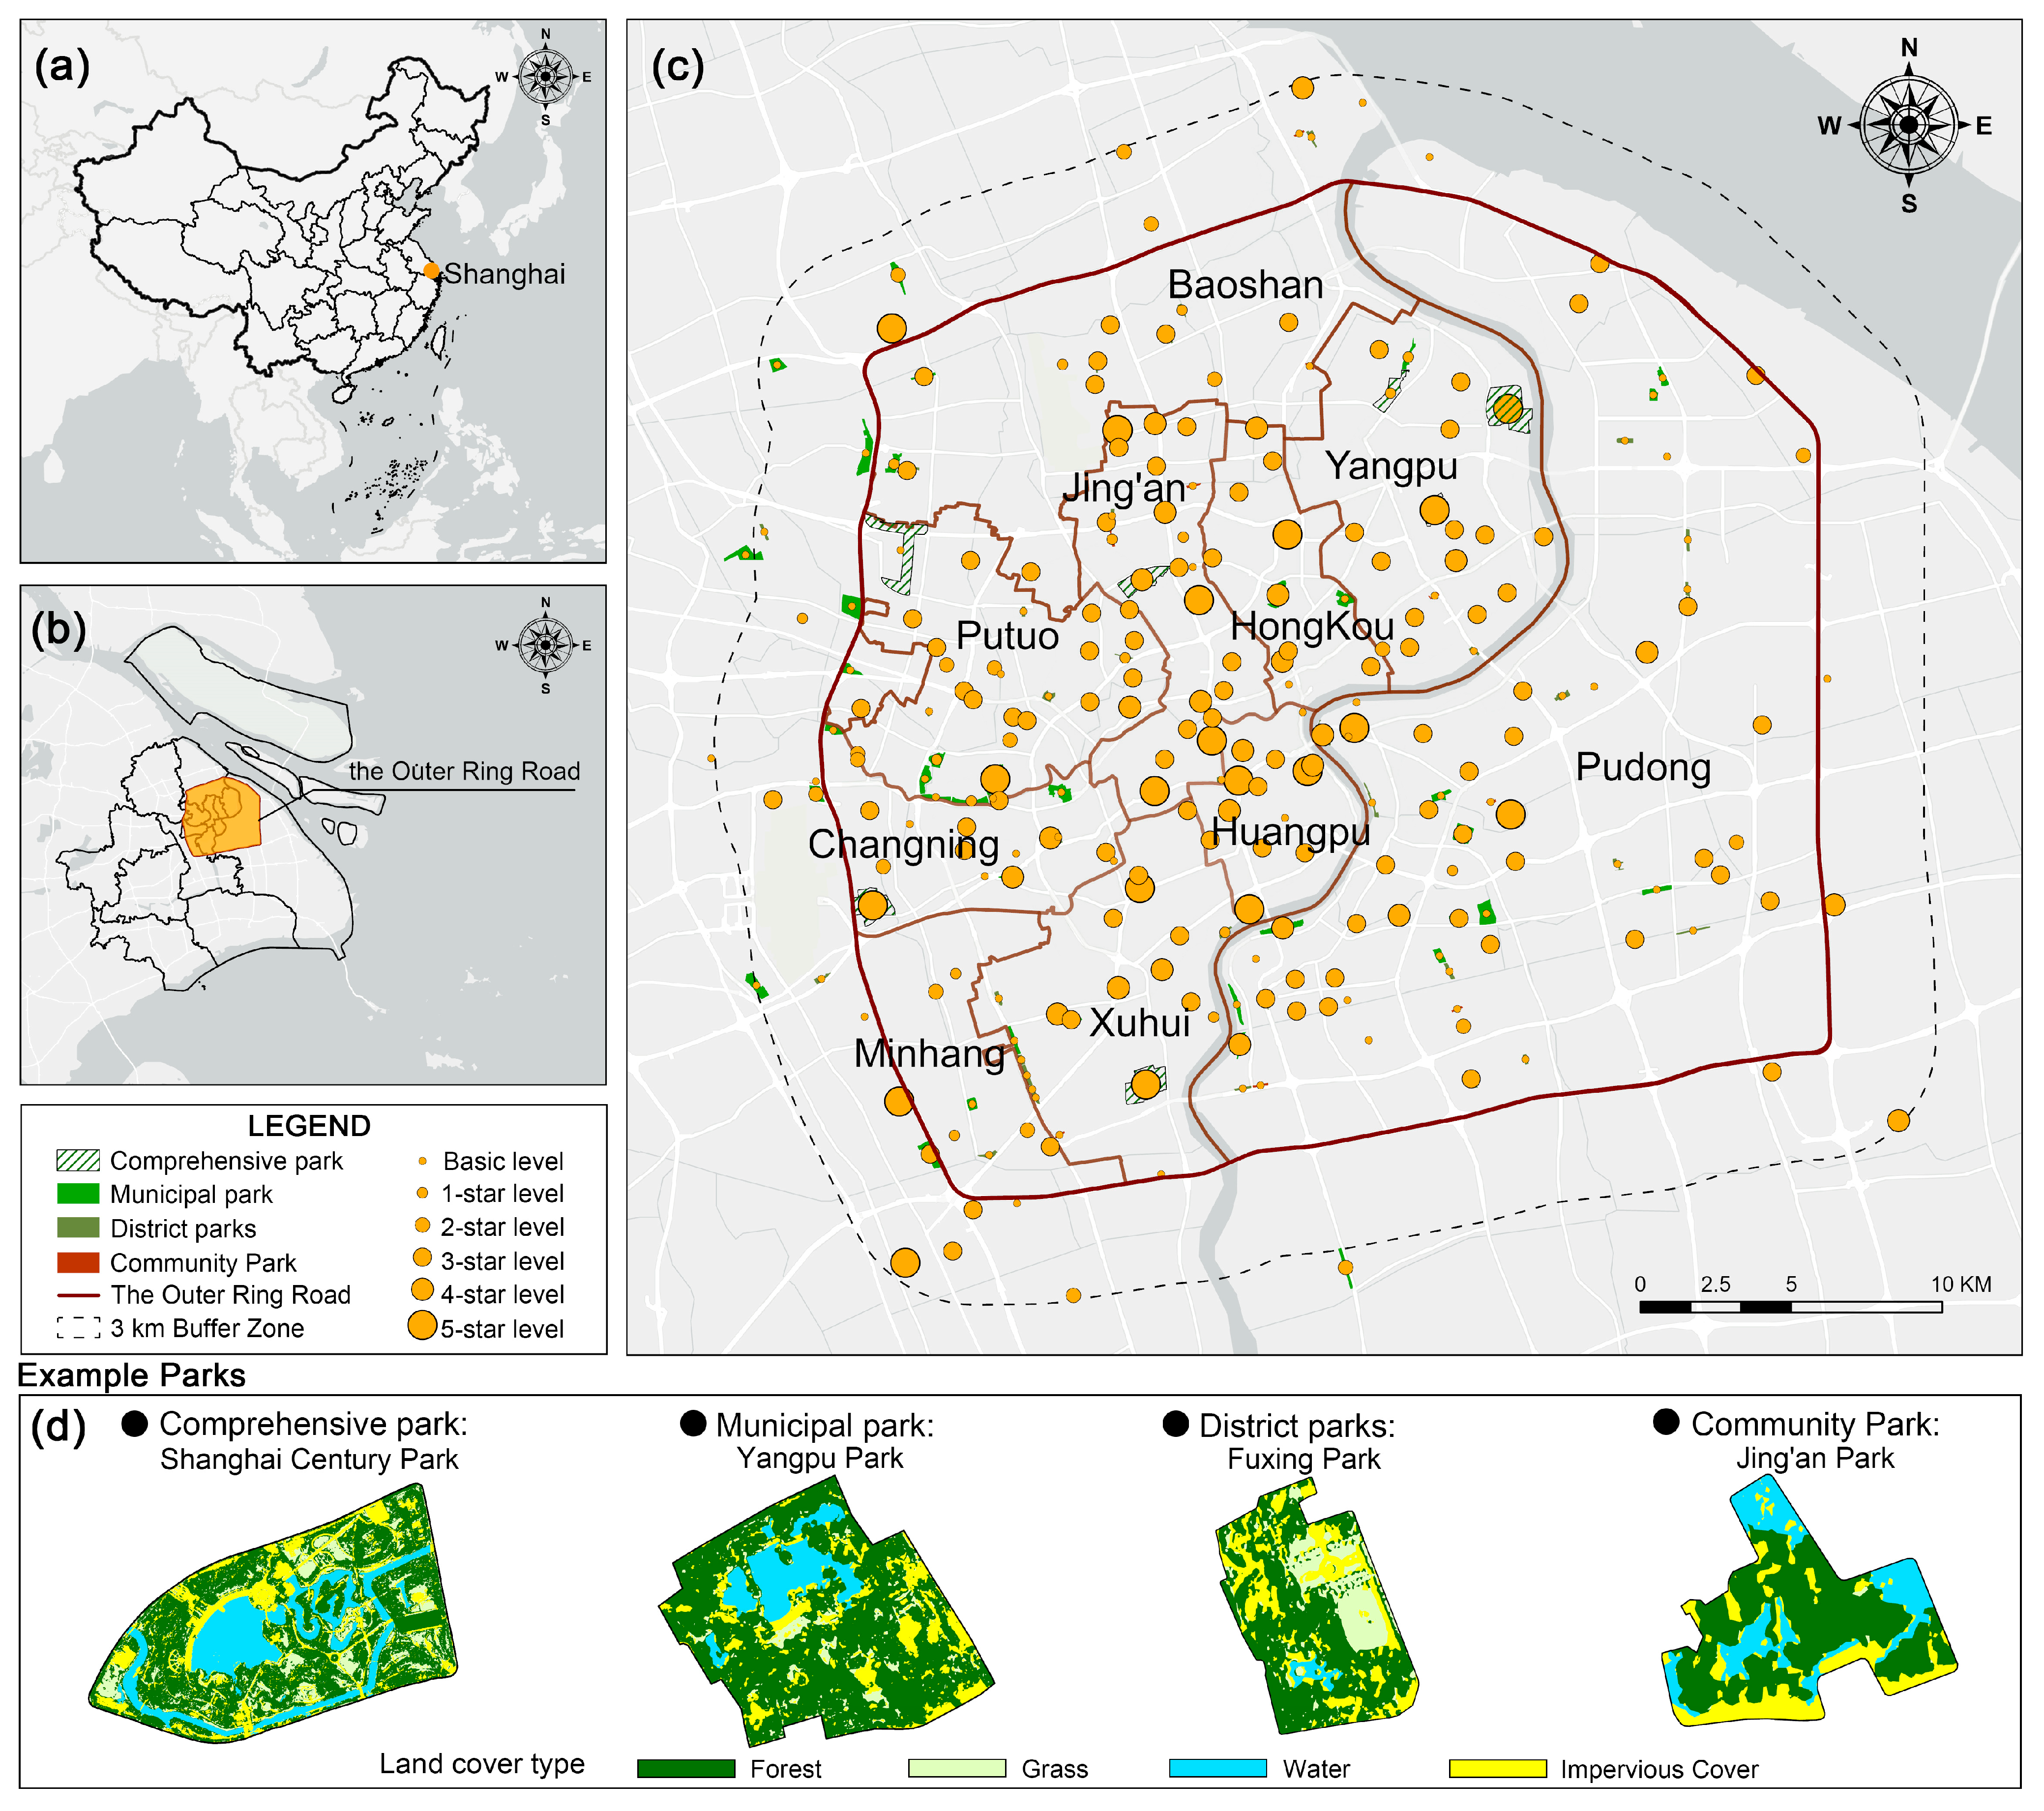
Shanghai is a municipality directly under the central government of China and one of the most developed cities in the country. As of the end of 2024, Shanghai’s permanent population was approximately 24.8026 million [43], the UPGS covers an area of 4726.64 hm2, although the Shanghai municipal government has been making great efforts to promote green space planning and construction, the inequality in UPGS across the city still persists [44]. Meanwhile, Shanghai has recorded 31.974 million internet users [43], which reflects the widespread penetration of social media among the urban population. Considering the completeness and consistency of social media data, and to reveal the spatial relationship between urban green space inequity and residents’ subjective well-being while responding to the Shanghai municipal government’s demand for rational green space planning, the central area of Shanghai was defined as the study area, which represents an ideal choice for this research (Figure 2). However, since residents living near the boundary may choose UPGS located just outside the Outer Ring, a 3 km buffer zone beyond the outer ring was included in the study in order to more accurately capture residents’ potential choices when accessing UPGS. As of May 2025, there were 257 UPGS within the study area, which were rated by the Shanghai Municipal Landscaping and City Appearance Bureau using a star rating system (i.e., 5, 4, 3, 2, 1 stars and basic level). Based on the “Classification Standard for Urban Green Space” in China (CJJ/T85-2017) [45] and the “Shanghai Ecological Spatial Plan (2021–2035)” of Shanghai [46], UPGS were categorized by area into four types: comprehensive parks (≥50 hm2, 20 parks), municipal parks (10–50 hm2, 51 parks), district parks (4–10 hm2, 76 parks), and community parks (0.3–4 hm2, 109 parks).

2.2. Data Source and Processing

We collected the following categories of data: (1) urban park data, (2) social media data, (3) real-time navigation data, and (4) explanatory feature data. The data sources and processing methods collected in this study were systematically summarized and are presented in Table 1.
The first category is urban park data. In December 2024, we used Python 3.12 scripts to retrieve the AOI data of UPGS within the study area from the Amap API (https://gaode.com/) and supplemented it with additional information from Google Maps (https://maps.google.com/). Through comparison with the official Shanghai park directory, a total of 257 polygon features of UPGS were identified in the study area.
The second category is social media data. We collected a total of 980,216 geotagged Weibo (https://m.weibo.cn/) check-in records from Shanghai between 1 September 2023 and 31 August 2024. Each post contains not only the user-generated textual content and related metadata but, more importantly, includes geographic coordinates (longitude and latitude) that were automatically generated by the platform when users enabled location services. The raw data were subjected to preliminary filtering, duplicate removal, normalization, and the elimination of hyperlinks and empty records. After this processing, 360,979 valid entries containing geographic coordinate information were retained. The valid Weibo records were then processed using Baidu’s NLP service to obtain a happiness sentiment index ranging from 0 to 1.
The third category is travel time data. This study focuses on evaluating UPGS accessibility for residents whose short-term travel purposes are related to recreation in daily life. To obtain residents’ travel times under real traffic conditions, we used the Amap (https://gaode.com/) Open Platform to collect data on travel to UPGS via walking, public transportation, and driving. We excluded days with strong winds (for example, the windy weather on 13 April 2025 in Shanghai was therefore omitted), rainy conditions, weekends, and peak traffic periods in the morning, midday, and evening [47]. Data collection was conducted on clear weekdays between 9 and 16 April 2025.
The fourth category is explanatory feature data. To further investigate the potential factors underlying the spatial mismatch between UPGS and residents’ SWB, a total of 15 indicators were selected from three dimensions. The built environment dimension included urban road network data, building height data, and NDVI data. The socioeconomic dimension included housing price data, nighttime light data, GDP data, and population data. We collected housing price data for 4292 residential communities within the study area through the Anjuke API (https://shanghai.anjuke.com/). The infrastructure dimension primarily comprised POI data, with 343,391 POIs collected via the Amap Open API.
Table 1. Data and processing involved in the research.
Data CategoriesData SubtypesData AcquisitionData Processing
UPGS dataAOI datahttps://ditu.amap.com/Spatial calibration
Gaofen-2 satellite datahttps://www.cpeos.org.cn/#/Supervised classification
Park star rating datahttps://lhsr.sh.gov.cn/Normalization
Social media dataWeibo check-in textshttps://m.weibo.cn/deduplication, text normalization, and removal of null values
SWBhttps://ai.baidu.com/ai-doc/index/NLP (accessed on 11 March 2025)Processed using Baidu NLP
Real-time navigation dataWalking travel timehttps://lbs.amap.com/api/webservice/guide/api/direction (accessed on 17 April 2025)Attribute Table Join
Public transit travel time
Driving travel time
Explanatory featuresRoad networkhttps://ditu.amap.com/OD cost matrix
POIhttps://lbs.amap.com/Kernel density analysis
Housing pricehttps://shanghai.anjuke.com/IDW interpolation and zonal statistics
NDVIhttps://modis.gsfc.nasa.gov/Zonal statistics
Night light indexhttps://data.tpdc.ac.cn/
GDPhttps://www.resdc.cn/
Population density[48]
Building height[49]

2.3. Methods

2.3.1. Measuring UPGS Accessibility Based on Improved GA2SFCA

Building upon the traditional GA2SFCA model, we introduced improvements to both spatial impedance and the attractiveness of green space catchments. Real-time travel conditions for different transportation modes were collected using Python 3.12 scripts that retrieved route planning data from Gaode Map. This enabled a more accurate measurement of UPGS accessibility for each residential location.
To assess the supply level of UPGS, we acquired four Gaofen-2 remote sensing images covering the study area, each with a spatial resolution of 0.8 m, and performed supervised classification to derive the relevant indicators. Regarding the environmental quality indicators of each urban park, extensive research has shown that park size, shape index, vegetation coverage, grassland coverage, tree canopy coverage, the presence of water bodies, and impervious surfaces are critical for determining the supply level of UPGS [50]. We ultimately used these indicators to calculate the supply level of each urban park ( M j ) through a weighted summation, as expressed in the following Equation (1):
M j = ( Σ j = 1 i X i W i ) 50 % + Z 50 %
Here, M j represents the supply level of each urban park, where j represents a specific park and i denotes the total number of indicators, X i represents the normalized value of each indicator, and W i denotes the corresponding weight assigned to each indicator, which are: park size ( W 1 ), park shape ( W 2 ), tree coverage rate ( W 3 ), grass coverage rate ( W 4 ), total vegetation coverage rate ( W 5 ), presence of water ( W 6 ), and impermeable coverage ( W 7 ). We applied the entropy weight method to determine the weights of physical environmental supply indicators of UPGS [51,52]. Z represents the star rating of each urban park, normalized into six levels: 0, 0.2, 0.4, 0.6, 0.8, and 1, corresponding to basic level through five-star level. Based on expert scoring, the final supply level of each urban park was obtained by applying equal weighting and summation of the total physical environmental score and the star-rating evaluation. Next, we quantified UPGS accessibility under different travel modes for residents in the study area.
Step 1: The first step was to calculate the supply-demand ratio. For each UPGS site j, a spatial catchment was defined within the threshold time t 0 . The total population P k of all communities within this catchment was then calculated and designated as the potential user base of site j. This study assumes that residents are able to access urban parks on foot within the defined time-based search radius under the walking mode, meaning the population ratio for walking mode is set to 1. Beyond the walking search radius, residents switch to public transportation or driving. Based on the “Shanghai Statistical Yearbook 2024” [43], we derived the number of private cars and the total number of households in Shanghai. It was found that there are approximately 42 private cars per 100 households in Shanghai, so the travel mode distribution is set with public transportation at 58% and driving at 42%. The total population of each demand point k is multiplied by the respective proportions of each travel mode to calculate the population for walking, public transport, and driving modes. These values are weighted using the Gaussian equation and summed up to derive the potential demand indicator for each j. Finally, the supply-demand ratio R j of UPGS to community population is expressed as follows (2):
R ( j ) = M j k t k j , w t 0 G t k j , t 0 P k M j k t 0 w t k j , p t 0 G t k j , t 0 P k M j k t 0 w t k j , c t 0 G t k j , t 0 P k
In this formula, t k j , w ,   t k j , p and t k j , c represent the travel times for visitors to travel from k to j via walking, public transportation, or driving, respectively. t 0 represents the travel time threshold from the origin to the destination. A review of previous studies indicates that 30 min is generally regarded as the maximum travel time limit for residents [53]. Therefore, in this study, t 0 was set to 30 min. In addition, we found that residents tend to prefer walking for trips with destinations located within 500 m, which aligns well with Shanghai’s park development principle of “a park within 500 m”. Accordingly, in this study, we introduced a prerequisite when evaluating accessibility by car and public transport: the travel time to the destination by these two modes must be greater than the walking time for 500 m. Assuming a walking speed of 4 km/h, the travel time for this distance is calculated to be 7.5 min, which we define as t 0 w . G t k j , t 0 is the distance decay function, expressed as follows:
G t k j , t 0 = e 1 2 × t k j t 0 2 e 1 2 1 e 1 2 0 , t k j t 0 , t k j t 0
Step 2: Calculating accessibility. Taking each community point k as the center, the supply-demand ratio R j of UPGS located within the spatial catchment defined by the time threshold t 0 is weighted using the Gaussian function G t k j , t 0 , The accessibility of community point k, denoted as A ( k ) , is then obtained as follows (4):
A ( k ) = j t k j t 0 G t k j , t 0 R j j t 0 w t k j , p t 0 G t k j , t 0 R j j t 0 w t k j , c t 0 G t k j , t 0 R j

2.3.2. Spatial Autocorrelation Analysis and Mismatch Analysis

The analysis results of UPGS accessibility and SWB were first averaged within geographic grids, and spatial autocorrelation analysis was then applied to examine their spatial relationship. First, this study employs the bivariate global Moran’s I to determine whether there is spatial correlation between the two variables. The index I ∈ [−1,1]: when I ∈ [−1,0), the two variables exhibit spatial dispersion; when I ∈ (0,1], they show spatial clustering; and when I = 0, they are randomly distributed (no correlation). Second, the bivariate local Moran’s I ( I ) was then applied to identify the specific types of spatial correlation. Based on the LISA cluster map, four categories of spatial correlation between UPGS accessibility and SWB were identified: H-H (high SWB & high accessibility), H-L (high SWB & low accessibility), L-H (low SWB & high accessibility), and L-L (low SWB & low accessibility). All spatial correlation analyses were conducted in GeoDa, with the calculation formulas refer to relevant studies [54].
Building on the spatial correlation analysis between UPGS accessibility and SWB, this study further explored their spatial mismatch. According to the clustering results, the outcomes were classified into three categories for subsequent analysis: (1) SWB significantly higher than UPGS accessibility, (2) SWB and UPGS accessibility relatively matched, and (3) SWB significantly lower than UPGS accessibility.

2.3.3. XGBoost Model Analysis

We employed the XGBoost model to assess the influence of 15 features across the urban built environment, urban infrastructure, and socioeconomic factors on the mismatch between UPGS accessibility and SWB. We defined the mismatched areas between UPGS accessibility and SWB as the target variable (assigned a value of 1) and the matched areas as the control group (assigned a value of 0). Together, these two categories constitute the outcome variable for the model prediction. XGBoost is a machine learning algorithm that leverages gradient boosting to enhance model performance [55], offers several advantages, including fast training speed, high accuracy, strong capability in handling missing values, and effective prevention of overfitting. In this study, the dataset was divided into 70% for training and 30% for testing. Model parameters were tuned using five-fold cross-validation and a grid search method, and the optimal parameter combination is presented in Table 2. To avoid bias in evaluating model performance due to class imbalance, the ROC curve was used as the primary metric for assessing predictive ability, as it is unaffected by sample proportions and better reflects the true performance of the model. After training and fine-tuning, the optimal model achieved an AUC of 0.85 and an F1 score of 0.858, demonstrating good generalization ability.

2.3.4. SHAP Interpretation

Machine learning models are often criticized as black-box approaches because it is difficult to intuitively understand the relationship between features and prediction outcomes. To address this limitation, Lundberg and Lee [56] introduced SHAP, a game-theory-based method for interpreting machine learning results. The Shapley value represents the contribution of a particular feature to a specific prediction relative to the baseline prediction, which is defined as the model output when all features are set to their average values. We adopted this method to interpret the output of the XGBoost model, as shown in the following Formula (5):
i = S F \ i | S | F S 1 ! | F | ! f s i f s  
where i represents the Shapley value of feature i, F is the set of all features, S is the subset of other features excluding feature i, f s is the prediction result of feature subset S, and f s i is the output result when feature i is added to the feature subset S. | S | and F are the sizes of the feature subset S and the full set of features F, respectively. In this study, we initialized the interpretation using a grid-level dataset representing the mismatch between residents’ subjective well-being (SWB) and UPGS accessibility. The Shapley values for all test samples were then calculated as follows, let f x be the prediction value, and 0 be the model’s baseline prediction. Then, we have (6):
f x = 0 + i = 1 d i
where f x is the model’s prediction for input x, 0 is the baseline value (the expected value or mean of the model output), i is the contribution of feature i to the prediction result, and d is the dimensionality of the features.

2.3.5. PDP Interpretation

The PDP algorithm visualizes the marginal effects of one or two specific features on the predictions of a machine learning model [57]. Its principle is to hold all other features constant, vary the values of the target feature, and record the resulting changes in predictions [58]. In this study, the PDP algorithm was implemented using a Python 3.12 open-source toolkit, and partial dependence plots together with interaction plots were employed to reveal the potential relationships between the features and the predicted outcomes. The explanation is as follows (7):
f ^ S x s = E X C = f ^ ( x s , X C ) f ^ ( x s , X C ) d P ( X C )
x s denotes the feature used to plot the partial dependence and interaction functions, and X C represents the remaining features. P ( X C ) is the probability distribution of the complementary features X C . f ^ refers to the predictive model used in this study.

3. Results

3.1. Spatial Equity of UPGS Under Multiple Modes of Transportation

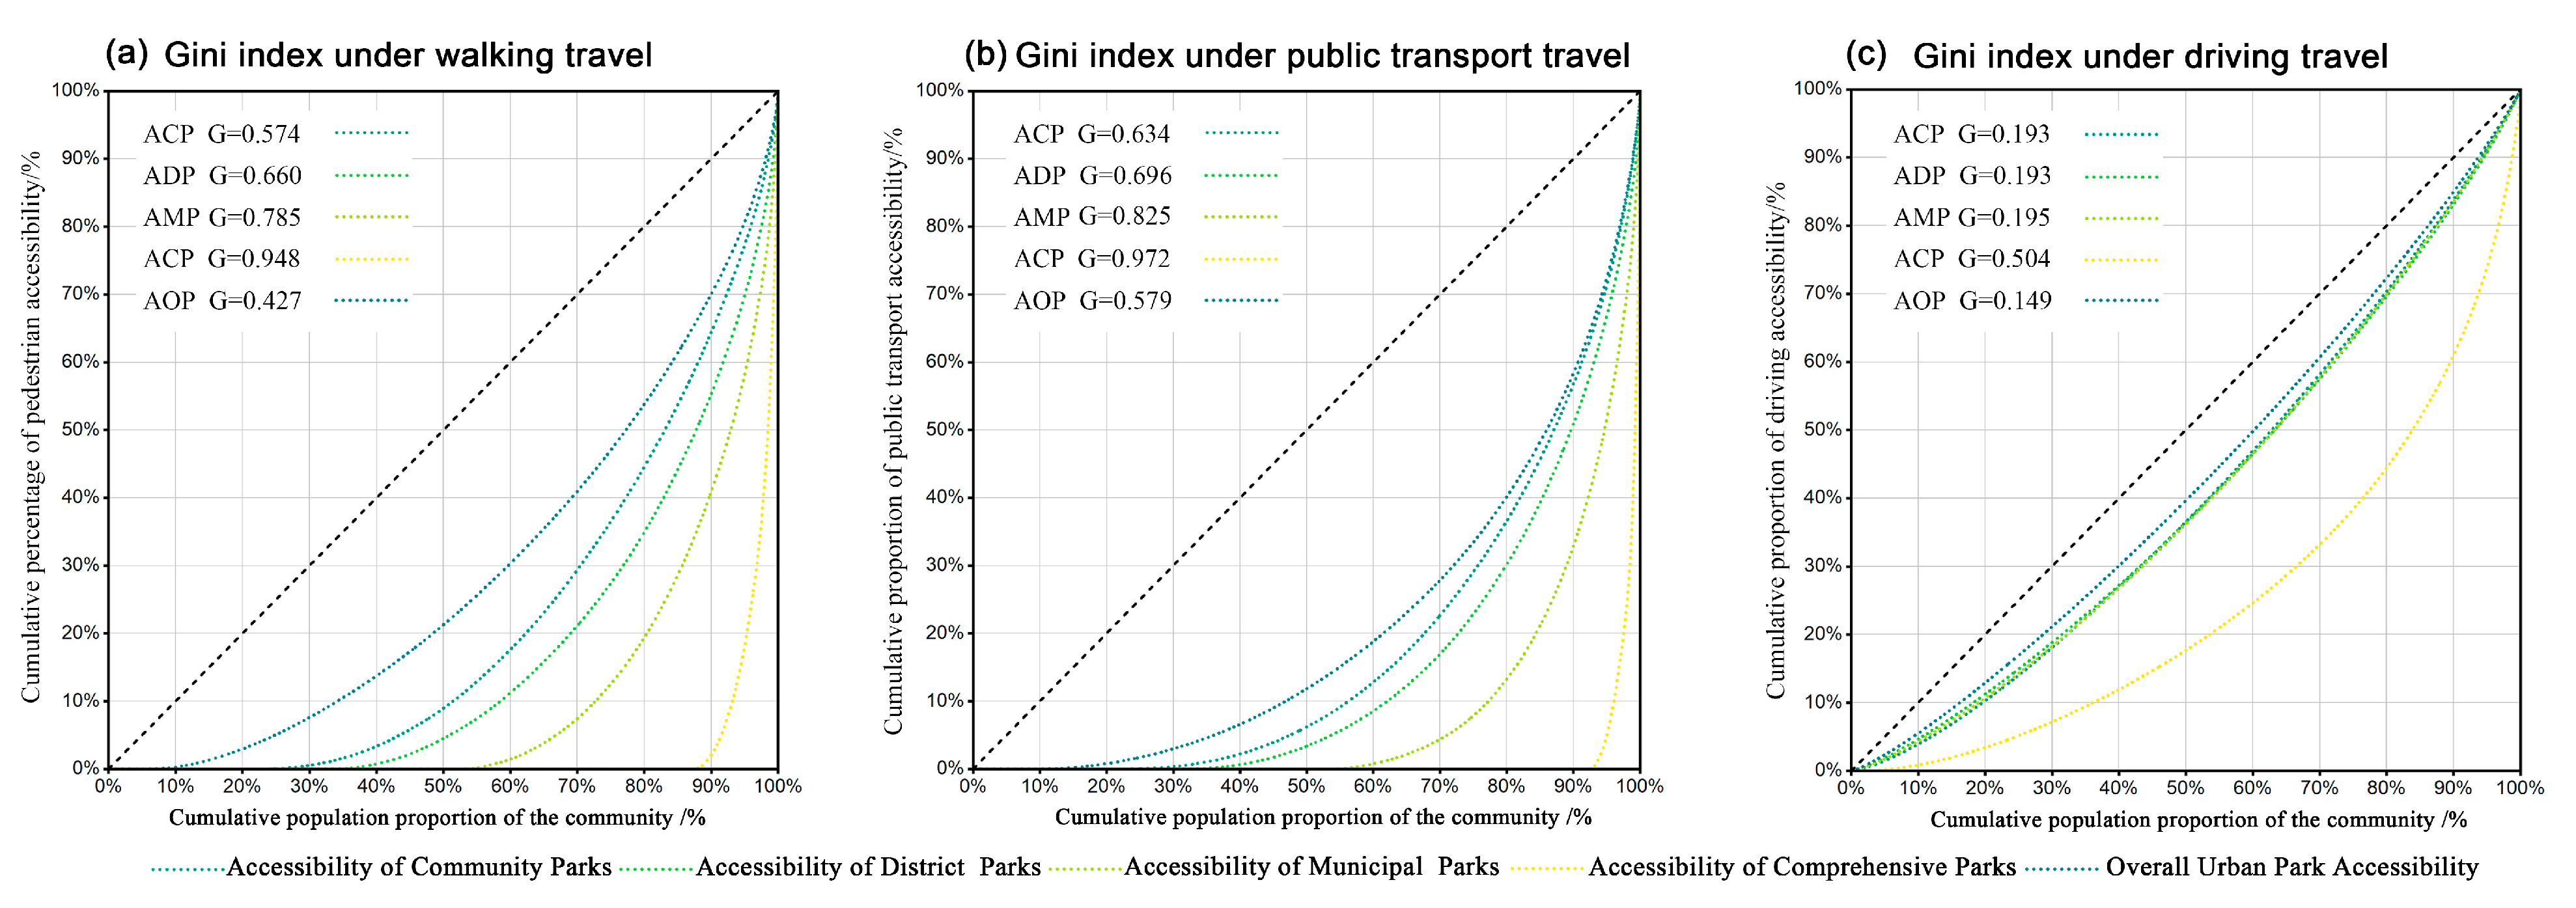
This study constructs a green space accessibility evaluation framework focusing on UPGS accessibility across walking, public transit, and driving modes. As shown in Figure 3, the Gini index reveals significant disparities in accessibility levels across different travel modes. Among them, driving exhibits the highest level of accessibility equity, while public transit shows the lowest. This suggests that the construction of urban parks should be closely integrated with the public transportation system to enhance the utilization of green spaces. Although the Gini coefficient results show that the highest level of equity occurs under the driving mode, this finding also reflects the potential risk of socioeconomic differences influencing spatial accessibility. Residents in areas with low car ownership, who are usually from low-income groups, tend to experience lower levels of public transport accessibility under higher travel time thresholds, which may further intensify social inequality [59]. Therefore, policymakers should maintain a careful balance between improving the convenience of private car travel and mitigating the potential risks of social stratification when promoting urban green space equity. In addition, notable differences exist in the accessibility levels of residents to different types of UPGS. Community parks exhibit the highest level of accessibility, followed by district parks and municipal parks, while comprehensive parks have the lowest accessibility.

3.2. Spatial Distribution Pattern of UPGS Accessibility

3.2.1. Spatial Distribution of UPGS Walking Accessibility

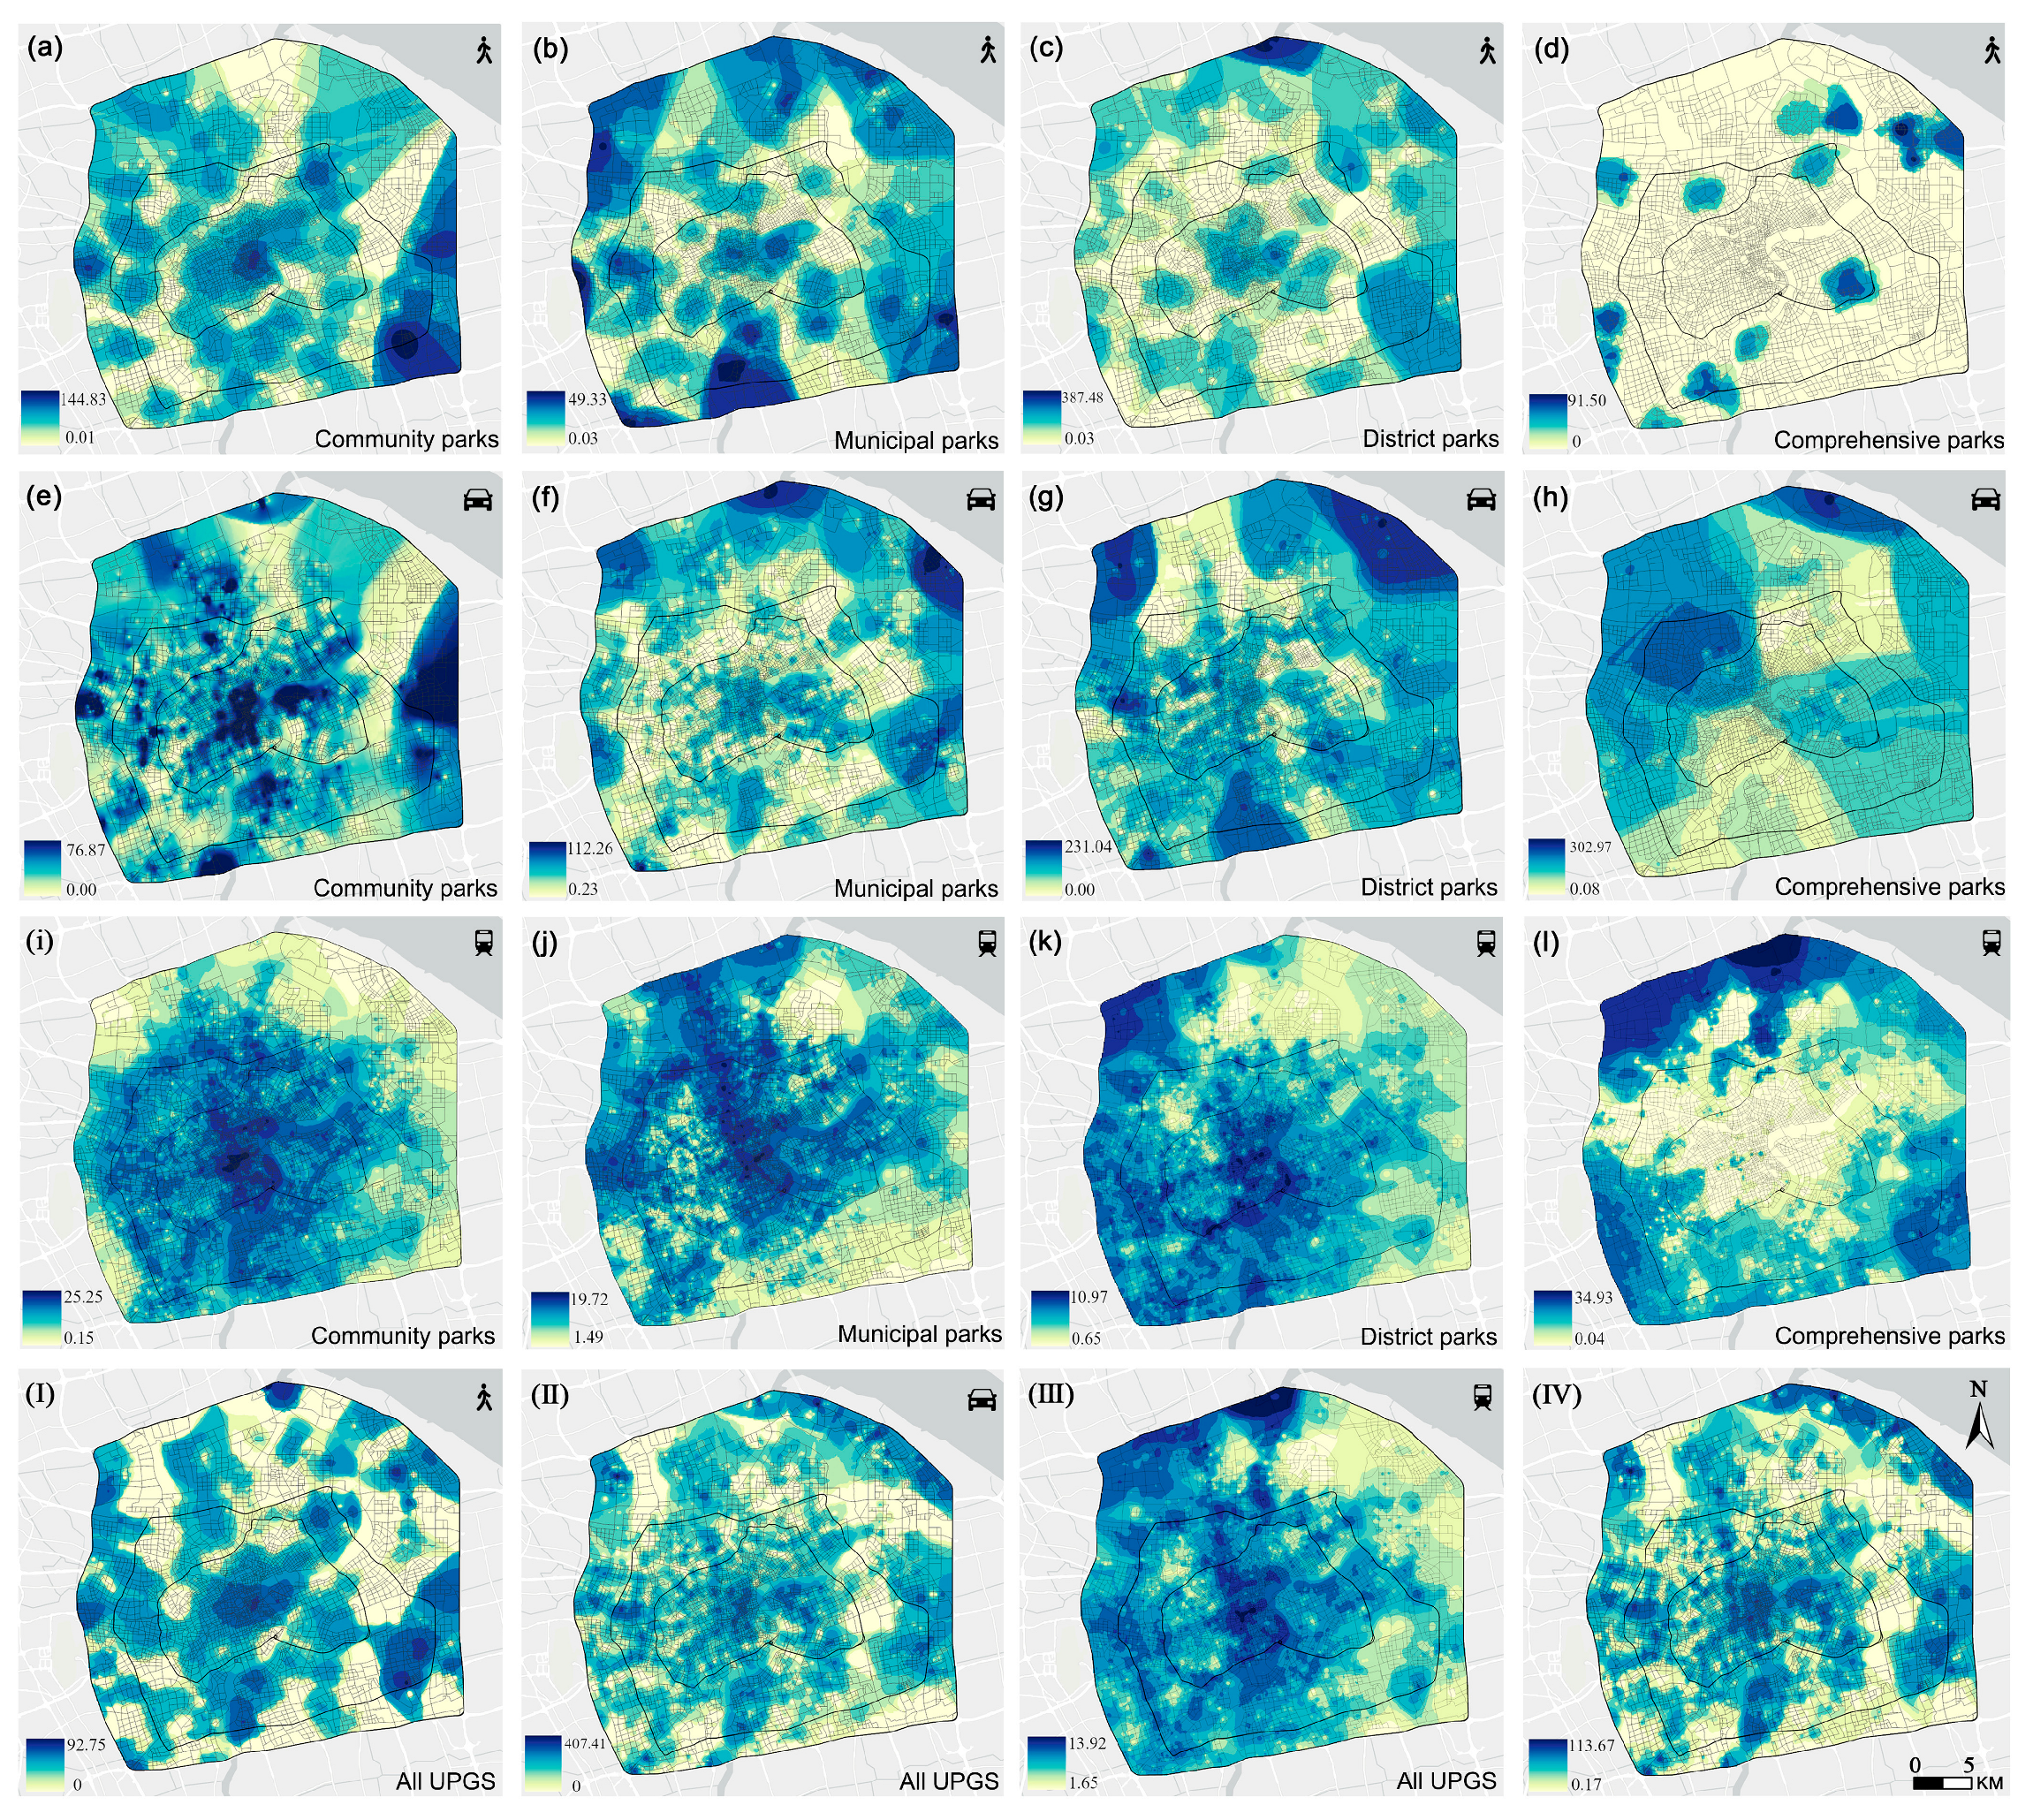
As shown in Figure 4, the walking accessibility of different types of UPGS varies significantly. High accessibility values for community parks (a), district parks (b), and municipal parks (c) are mainly concentrated in the southeastern area of the outer ring and within the inner ring. In contrast, high accessibility to comprehensive parks (d) is primarily observed in the northeastern and southwestern areas between the middle and outer rings. The low accessibility within the inner ring for comprehensive parks may be attributed to the high building density and the lack of sufficient space for the development of large-scale green areas. Overall, there are considerable disparities in walking accessibility to green spaces within the study area. Overall, there are considerable disparities in walking accessibility to green spaces within the study area (ranging from 0.00 to 92.95). UPGS accessibility is generally higher within the inner ring, indicating a pronounced spatial polarization pattern.

3.2.2. Spatial Distribution of UPGS Public Transit Accessibility

As shown in Figure 4, high public transit accessibility values for community parks (e) and district parks (f) are concentrated in the northwestern and southeastern areas between the inner and outer rings. For municipal parks (g), high accessibility is primarily located in the northwestern, northeastern, and southwestern parts of the outer ring. In contrast, high accessibility to comprehensive parks (h) is distinctly concentrated in the northwestern area. Overall, the public transit accessibility of UPGS in central Shanghai shows considerable variation, with a more polarized spatial distribution compared to walking accessibility. High-accessibility areas are mainly concentrated within the inner ring, which aligns with the fact that public transit systems tend to be more developed in central urban areas during the process of urban construction.

3.2.3. Spatial Distribution of UPGS Driving Accessibility

Except for comprehensive parks (l), the other three types of parks exhibit a spatial distribution characterized by higher driving accessibility within the inner ring. Additionally, community parks (i) show a clear pattern of decreasing driving accessibility from the inner ring center outward to the outer ring. In contrast, comprehensive parks (l) display the opposite trend, with driving accessibility increasing from the inner to the outer ring. This indicates that the inner-ring areas lack an adequate number of comprehensive parks, while areas outside the inner ring are deficient in community parks. Both municipal parks (k) and district parks (j) demonstrate higher accessibility within the inner ring; however, municipal parks (k) exhibit significantly higher accessibility in the western area compared to the eastern area, while district parks (j) show noticeably higher accessibility in the northern area than in the southern part. Overall, the driving accessibility of UPGS in central Shanghai is generally higher in the inner ring and western areas, whereas the eastern areas show a distinctly lower level of accessibility. It is noteworthy that users who visit UPGS by driving often face parking issues, as small green spaces usually lack dedicated parking lots and only certain parks are equipped with such facilities [60]. Therefore, appropriate parking facilities should be considered within or near UPGS during the construction process to improve the accessibility for users traveling by car.

3.3. Spatial Correlation Analysis

As shown in Figure 5, compared with the outer-ring grids, the grids within the inner ring exhibit relatively higher accessibility to UPGS, along with higher sentiment scores derived from Weibo posts. This reflects a significant degree of spatial clustering within the inner ring, indicating that residents living in the central area of Shanghai’s inner ring tend to experience higher levels of well-being and enjoy more equitable access to UPGS. In contrast, areas outside the inner ring demonstrate evident spatial heterogeneity in both UPGS accessibility and SWB (subjective well-being) sentiment scores, suggesting a spatial mismatch between the two variables. The bivariate spatial autocorrelation analysis conducted using GeoDa showed a correlation coefficient of r = 0.013 (r > 0) between UPGS accessibility and SWB, indicating a weak positive spatial association between the two variables. In addition, the analysis produced a p-value of 0.004 (<0.01) and a z-score of 2.6892 (>2.58), demonstrating that the correlation is statistically significant. The probability of such a clustering pattern occurring by random chance is less than 1%, suggesting that this weak positive relationship is not accidental but represents a meaningful spatial association.
To further support future planning for UPGS in central Shanghai, we performed a bivariate local spatial autocorrelation analysis to identify spatial clusters between the two indicators. This study focuses on diagnosing the spatial mismatch between UPGS accessibility and SWB. For areas within the inner ring that exhibit both high SWB and high UPGS accessibility, there is no immediate need to further increase UPGS provision. However, in areas with both low SWB and low UPGS accessibility, improving access to UPGS is essential for enhancing residents’ well-being. More attention should be directed to areas with low SWB but high accessibility, with a focus on improving SWB, such as enhancing residents’ life satisfaction, rather than further improving UPGS accessibility. Conversely, in areas with high SWB but low UPGS accessibility, further enhancement of UPGS access may not significantly improve SWB and could result in inefficient allocation of urban resources. Understanding the underlying causes of these mismatches is a central focus of this study.

3.4. Revealing Drivers of Mismatch via SHAP

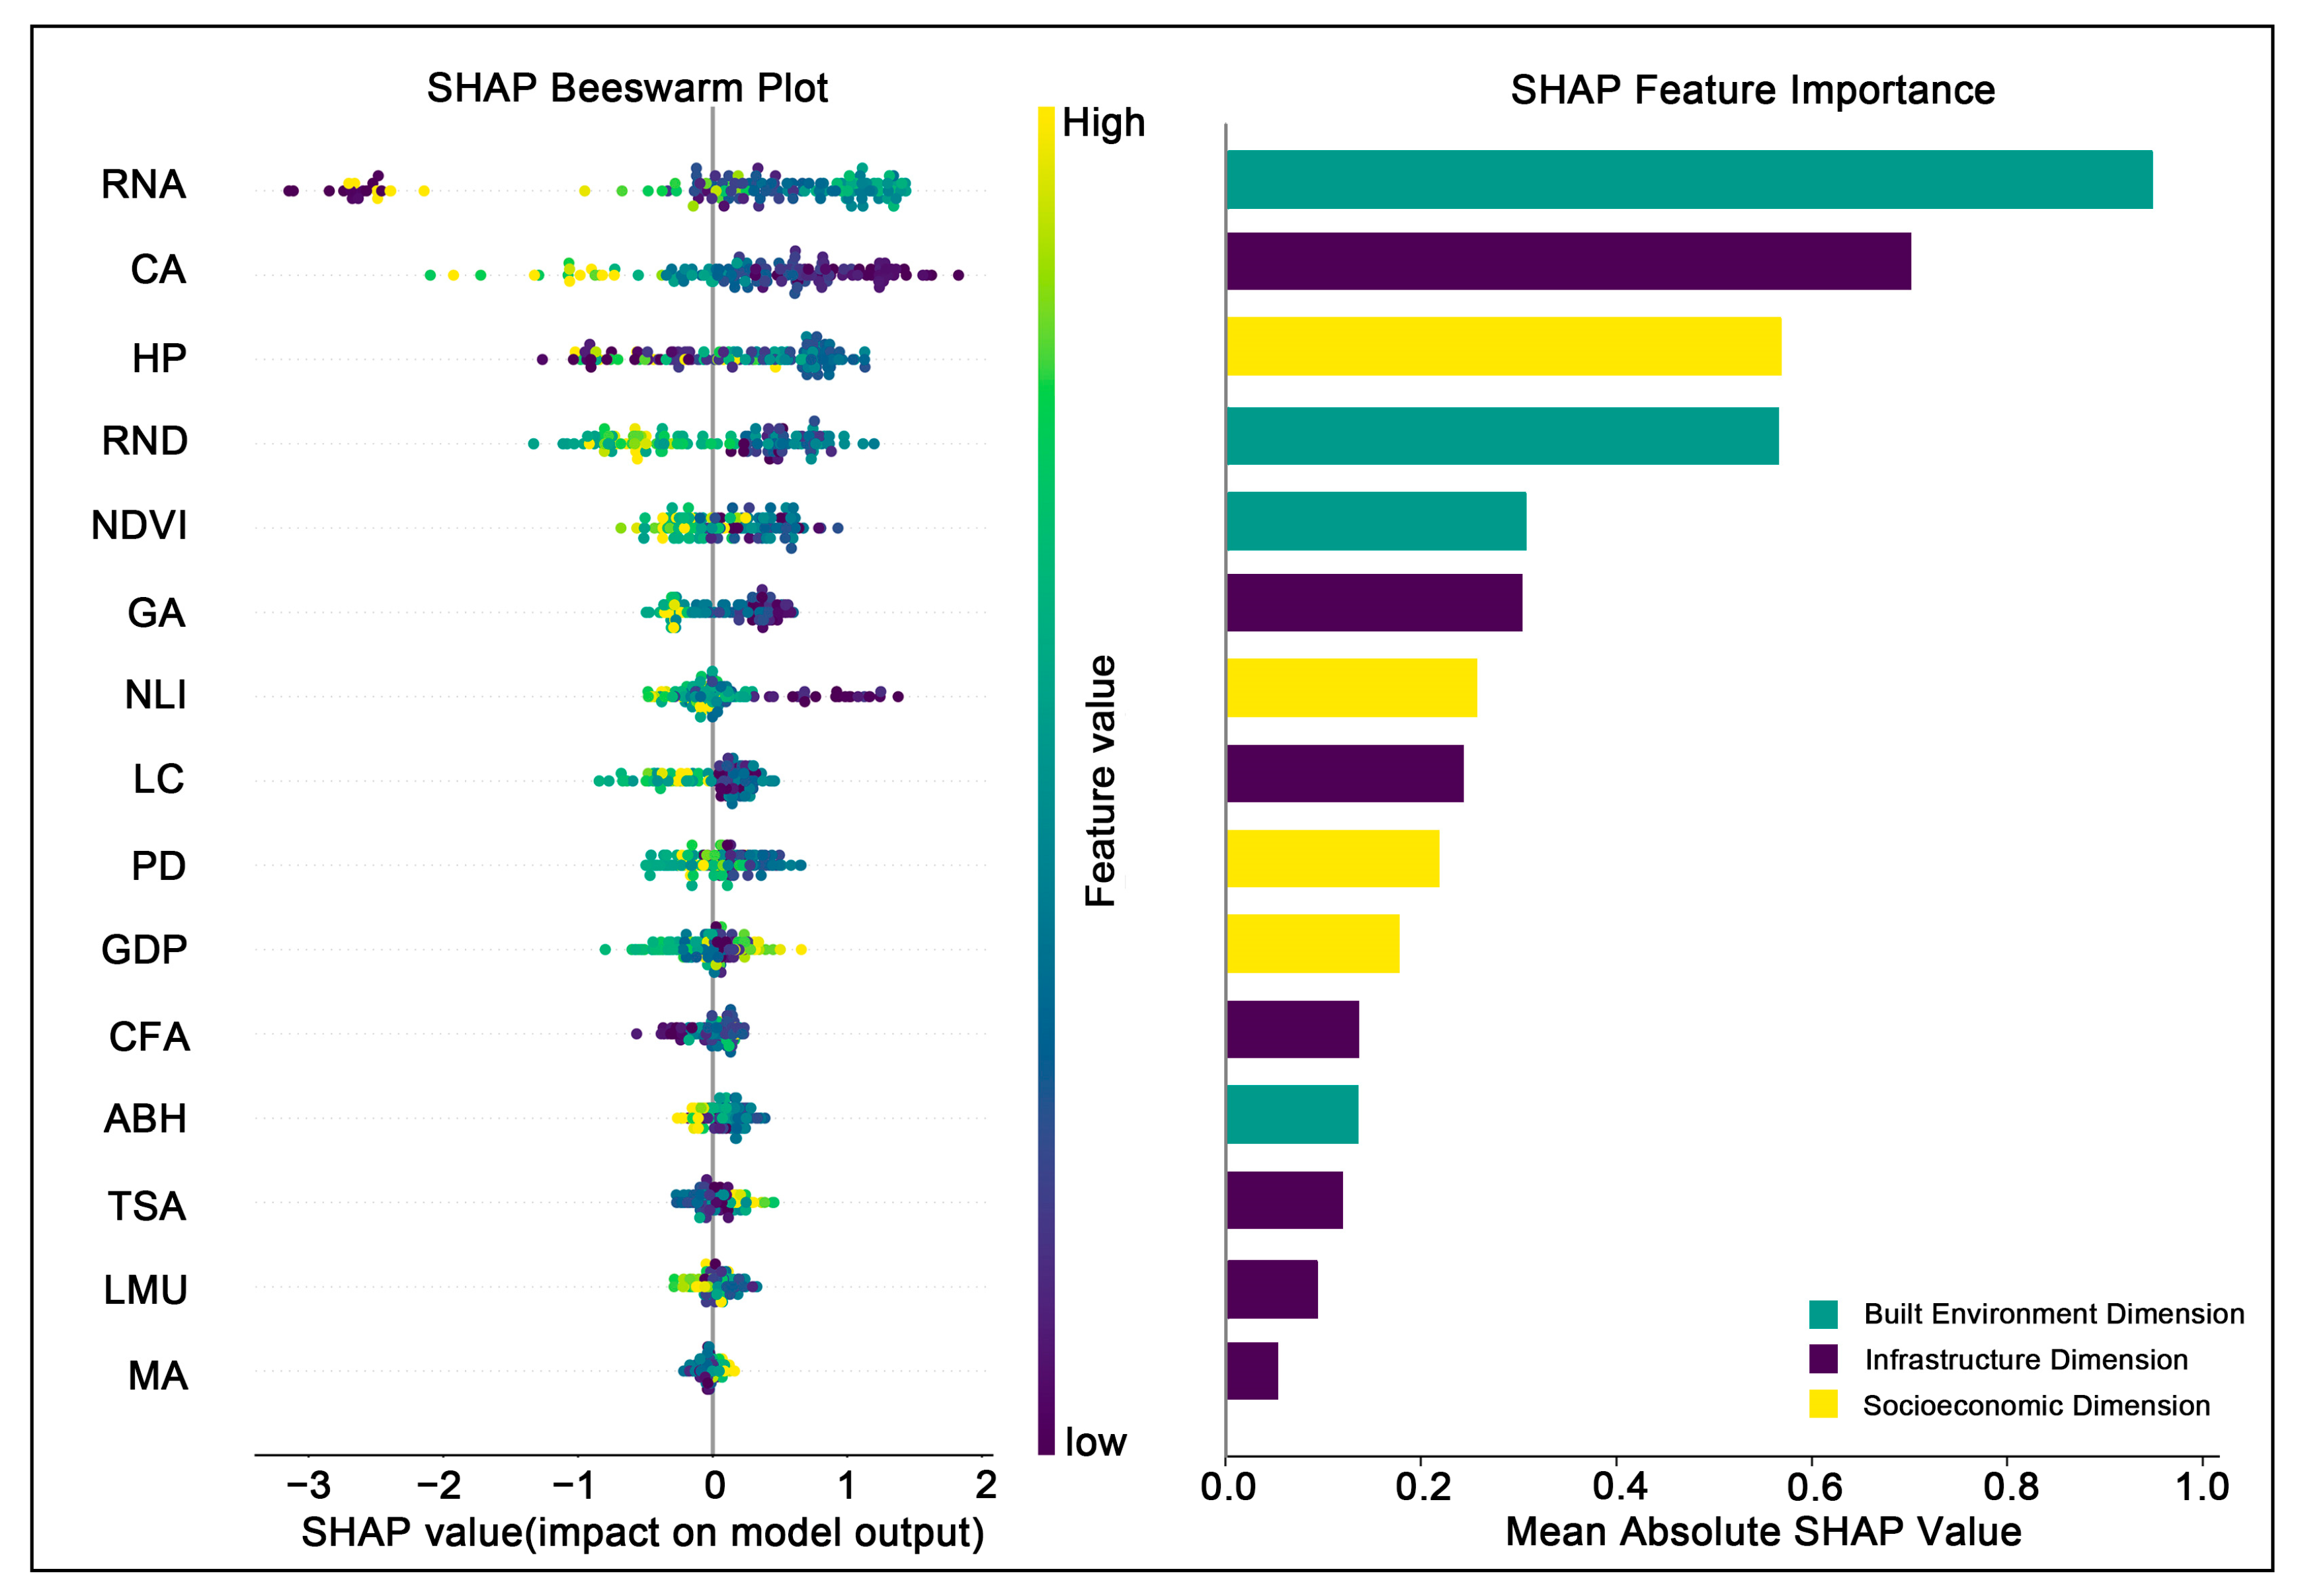
We defined the mismatched areas between UPGS accessibility and SWB as the target variable (assigned a value of 1) and the matched areas as the control group (assigned a value of 0). Together, these two categories constitute the outcome variable for the model prediction. This study employed the SHAP model to identify key feature variables contributing to the mismatch between SWB and the accessibility of UPGS, based on both the beeswarm plot and the feature importance summary (Figure 6).
The results show that road network accessibility (RNA) emerged as one of the most influential predictors, with a SHAP value of 0.9478, significantly exceeding that of any other variable, and exhibiting a positive correlation with the predicted outcome. Company agglomeration (CA) ranked second (SHAP value = 0.7025), followed by housing price (HP) (SHAP value = 0.5695). Within the built environment dimension, road network density (RND) and NDVI were the most important predictors after RNA, with SHAP values of 0.5654 and 0.3073, both variables show a positive influence on the prediction results. In the socioeconomic dimension, the night light index (NLI) ranked just below housing price with a SHAP value of 0.2585, and displayed a clear negative influence on the prediction. In the urban infrastructure dimension, living convenience (LC) also made a relatively notable contribution, with a SHAP value of 0.2445.
By integrating SHAP with the XGBoost model, the analysis identified road network accessibility, NDVI, and road network density from the built environment; housing price and night light index from the socioeconomic dimension; and company agglomeration and living convenience from urban infrastructure as the primary driving factors behind the mismatch between UPGS accessibility and SWB in urban areas.

3.5. Nonlinear Effects and Thresholds of Variables

We used partial dependence plots to interpret the effects of feature variables from different environmental dimensions on the outcome variable. This approach helps us better understand the nonlinear effects of each feature on the outcome, thereby facilitating the alignment between residents’ subjective well-being and green space equity and supporting the rational planning of urban resource allocation.
Using the SHAP model, we identified six relatively important environmental feature variables, as shown in Figure 7, within a certain range of RNA values, an increase in RNA contributes to the improvement and maintenance of residents’ subjective well-being (SWB). However, when RNA exceeds a critical threshold of 25.3 min, the predicted SWB values drop sharply. This indicates that even when UPGS accessibility is improved, excessive travel time may hinder residents’ subjective well-being, possibly due to reduced commuting efficiency that negatively affects their overall well-being. Therefore, relevant governmental agencies should consider implementing targeted interventions to reduce travel time under such conditions in order to mitigate negative impacts on residents’ SWB. As CA increases, the predicted SWB values consistently show a downward trend, and when the CA threshold exceeds 51.17, the predicted values decline sharply. This suggests that high CA levels significantly reduce SWB. On the one hand, this may be because greater CA is associated with increased work-related stress for residents. On the other hand, employees in areas with high CA values often face practical constraints that limit their ability to access UPGS nearby. Therefore, setting up small green parks or implementing vertical greening in high-CA areas could help alleviate work pressure. In contrast, housing prices (HP) exhibit a distinct inverted U-shaped relationship with SWB. Both extremely high and extremely low housing prices are unfavorable for improving well-being. For instance, excessively high housing prices (above 88,000 yuan/m2) may place a heavy financial burden on residents. In contrast, very low housing prices (below 57,000 yuan/m2) are often found in older residential areas, which tend to have limited access to quality services and amenities. For residents living in such neighborhoods, improving UPGS accessibility can help enhance their subjective well-being.
In addition, the steady increase of NDVI within a certain range confirms that an initial enhancement in green coverage can promote residents’ subjective well-being (SWB). However, when NDVI exceeds a threshold value of 0.25, the predicted probability of higher SWB significantly declines, which is consistent with previous findings [61]. Extremely high NDVI values are often found in ecological reserves, park peripheries, or low-density development zones, which tend to have weaker functionality. This highlights the need to regulate excessive NDVI growth to avoid resource over-allocation. The effect of NLI on the prediction outcome is also notable. When NLI exceeds a critical threshold of 37.1, the predicted SWB value drops sharply. Previous studies have found that areas with high night light index in Shanghai are often associated with more intense human activity [62]. As NLI increases, disturbances such as nighttime noise and light pollution are exacerbated, which can negatively affect residents’ well-being [63]. With the rise of LC, public investment in equitable UPGS development contributes to improved well-being. However, when LC exceeds a certain threshold (126.6), increased commercial density and population crowding tend to reduce available green space, leading to its compression or fragmentation. This spatial tension makes it difficult to sustain high levels of well-being in such areas.

3.6. Interval Analysis for Dual-Factor Optimization

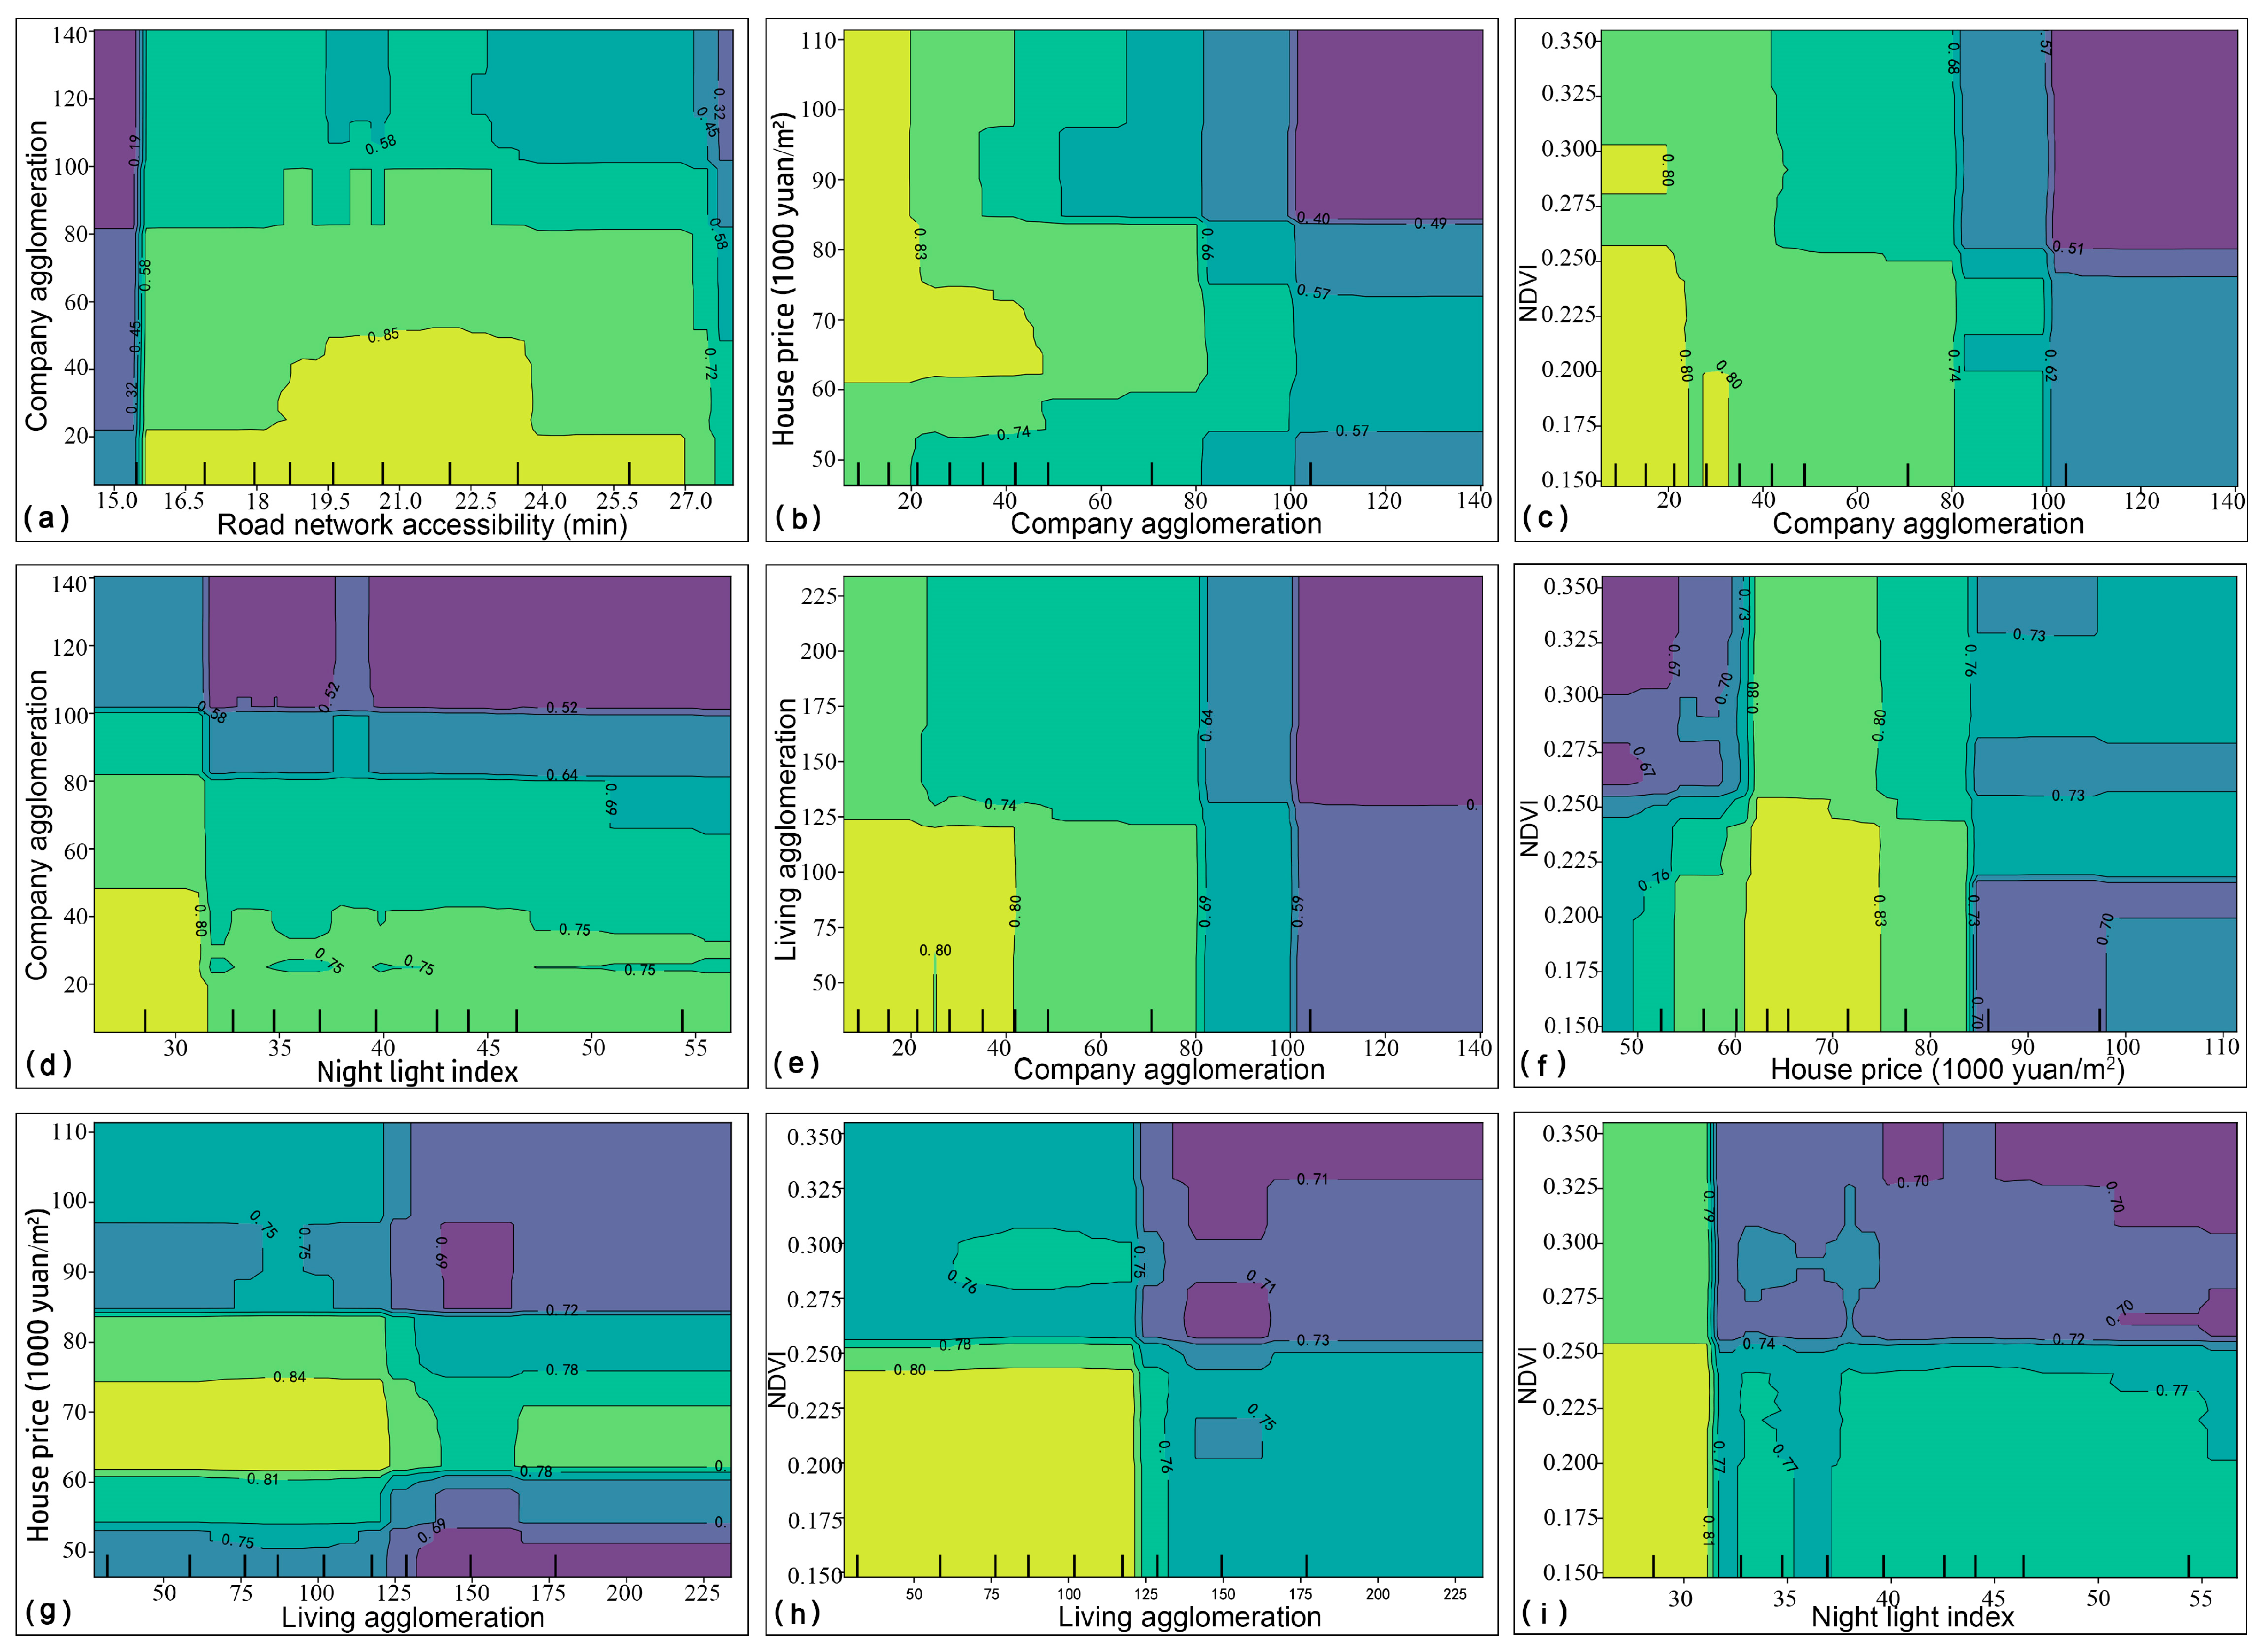
To further investigate the nonlinear mechanisms underlying the spatial mismatch between UPGS accessibility and residents’ subjective well-being (SWB), we conducted bivariate partial dependence plot (PDP) analyses focusing on the most influential features identified by the SHAP analysis. Six key factors were selected for interaction analysis: urban road accessibility (RNA), company agglomeration (CA), housing prices (HP), NDVI, nighttime light intensity (NLI), and living convenience (LC). As shown in Figure 8, when RNA is maintained below 27.2 min, the interaction between CA and RNA reaches an optimal level for improving SWB, suggesting that efficient commuting can mitigate the negative effects of dense employment environments. CA also shows strong interaction effects with HP, NDVI, NLI, and LC. As both CA and HP increase, their combined interaction effect exhibits a consistent downward trend. When CA exceeds 101 and HP exceeds 83,800 yuan/m2, the interaction reaches its lowest point, indicating that employment pressure and housing costs can jointly suppress residents’ well-being.
Furthermore, the interaction between CA and NLI is particularly significant. When both indicators remain below CA < 49.3 and NLI < 31.7, the interaction effect is maximized. As NLI increases alongside CA, the interaction effect declines, reflecting the compounded psychological strain caused by high-paced nighttime environments and job density. The interaction between CA and LC further demonstrates that “extremely convenient areas” do not necessarily correspond to “high well-being areas”, suggesting that commercial oversaturation may impose excessive spatial burdens on urban environments. In terms of socioeconomic variables, HP shows the strongest interaction effects with NDVI and LC when housing prices range between 61,475 and 74,608 yuan/m2. This highlights the need for coordinated planning of supporting facilities around high-value housing areas to avoid resource inefficiencies and underscores the importance of balanced development across urban environment, economic conditions, and infrastructure. When NDVI remains below 0.246, its interaction with LC reaches a peak. However, when NDVI exceeds 0.26, its interaction effects with CA and NLI progressively weaken. This suggests that an excessive amount of green space may have limited value in improving SWB among enterprise employees, and that the “functional use” of green spaces may, in some cases, be more critical than their “physical presence” [64]. Therefore, future planning should prioritize the usability of urban green spaces rather than solely their quantity.
Overall, the spatial mismatch between high SWB and low UPGS accessibility is not driven by a single dominant factor. The observed interactions among variables highlight the importance of cross-dimensional dynamics. Identifying these key interactions can provide more precise and targeted policy guidance for achieving spatial balance between green space equity and resident well-being. In future urban planning, governments should focus on controlling housing price fluctuations and commute times, optimizing green space and infrastructure allocation, and managing nighttime economic activity. These critical factors and policy interventions lay a strong foundation for future research and offer practical implications for improving the precision and effectiveness of urban green space planning.

4. Discussion

4.1. Equity Assessment of Green Space Planning Based on the Improved GA2SFCA

This study employs the Gini index and Lorenz curve to evaluate inequalities in UPGS accessibility. This approach has been widely adopted in prior research to measure overall inequality in green space provision [65,66]. While many existing studies assess accessibility solely based on road networks, they tend to neglect spatial impedance in daily travel, potentially leading to biased results. However, this study comprehensively considered the actual supply of UPGS and spatial impedance. Based on the results of accessibility distribution and the Gini index, we found that UPGS accessibility under low-speed travel modes (walking and public transport) was significantly lower than that under high-speed modes (private car use). This may be due to the limited number of large green spaces within the study area, especially in the inner ring, which makes green space searches within smaller catchments more unequal. Moreover, the Gini index of public transit accessibility indicates that public transportation facilities around UPGS are underdeveloped, a deficiency that substantially reduces the actual level of UPGS accessibility. From the perspective of UPGS types, a comparison of Gini indices shows that community parks perform considerably better than the other three categories. This suggests that small-scale green spaces, such as community parks, can effectively compensate for the shortcomings of other UPGS types in achieving equitable green space provision. Therefore, in cases where conditions for developing larger parks are limited, promoting the construction of community parks can improve residents’ accessibility to UPGS.
By examining the geographical distribution of green space accessibility, we observed that UPGS accessibility in Shanghai’s inner-ring is relatively concentrated and comparatively high. However, given the scarcity of available land for further development in this area, planning efforts should focus more on enhancing the usability of existing UPGS, such as by further improving facility services and enhancing vegetation growth conditions. In contrast, the southern and northern parts of central Shanghai are characterized by fewer built-up areas and lower commuter density, offering sufficient space to accommodate large-scale UPGS resources and thereby alleviate the shortage of green space. It is worth noting that users accessing UPGS by private vehicles often encounter parking difficulties. Small-scale green spaces typically lack dedicated parking areas, while only certain larger parks are equipped with such facilities [60]. Therefore, future UPGS planning should consider the inclusion of appropriate parking infrastructure both within and around parks to improve accessibility for car users. Moreover, the reasonable arrangement of barrier-free facilities and parking spaces can greatly enhance the convenience of use for both vulnerable groups and those traveling by car, thereby increasing the frequency of green space visits and promoting more equitable access to urban parks.

4.2. Impacts of Environmental Variables on Green Space Planning

Through the LISA analysis, we found that UPGS and SWB exhibited evident mismatches across most areas, except for a clear H-H clustering pattern within the inner-ring region. The widespread mismatch outcomes confirmed our hypothesis regarding the spatial inconsistency between the two. For areas characterized by high UPGS accessibility but low SWB, continuously improving accessibility may no longer be the most effective pathway to enhance residents’ well-being. For these areas, urban planners should instead focus on improving the usability and functional quality of UPGS [67], as such mismatches may reflect differences in green space quality, safety conditions, or cultural preferences. Kwan et al. [68] further pointed out that residents’ subjective perceptions of green spaces—such as comfort, safety, and maintenance—are stronger predictors of well-being than objective accessibility. Similarly, Xu et al. [69] emphasized that green space quality, facility maintenance, and environmental aesthetics have more stable and long-term effects on mental health than accessibility alone, while cultural preference differences also play a crucial role in explaining the “high accessibility but low SWB” phenomenon. Moreover, studies such as Ugolini et al. [70] revealed that different social groups exhibit significant variations in their green space use patterns, leisure habits, and activity preferences. Even when physical accessibility is high, residents may lack motivation or a sense of gain from using green spaces, which in turn reduces their SWB. For areas with high SWB but low accessibility, our SHAP and XGBoost analyses indicate that road network accessibility, living convenience, NDVI, and housing prices have positive effects on the spatial mismatch between SWB and UPGS accessibility, whereas company agglomeration, nighttime light index, and population density had negative effects. Specifically, within the built environment dimension, improvements in road network accessibility play an essential role in enhancing commuting efficiency and promoting social equity. Increases in NDVI are crucial for mitigating urban heat exposure, though threshold effects should be considered to avoid unnecessary green volume waste [71]. Therefore, under conditions of limited urban greenery, planners should focus on balancing investments in transportation infrastructure with the preservation and improvement of urban vegetation.
From the socio-economic perspective, housing prices within a certain range can enhance residents’ SWB, as price fluctuations directly alter household wealth stocks and thus influence family wealth levels. During periods of rising housing prices, the appreciation of residential assets increases total household wealth, while price declines impose risks of asset depreciation. At the same time, low-price areas often lack high-quality facilities, which further constrains SWB. This reflects how wealth disparities contribute to environmental injustice. Consequently, future green space planning should emphasize improving the provision and quality of UPGS in middle- and low-income neighborhoods, while remaining cautious about the risk of green gentrification. The increase in nighttime light intensity is associated with noise and light pollution, higher disease incidence, and other disturbances that reduce SWB, highlighting the necessity of controlling nighttime activity intensity in landscape planning practices.
In terms of urban infrastructure, areas with high enterprise density are often linked to greater work-related stress, thereby reducing SWB. These groups are typically located in high-rise office buildings, where mental health challenges can be mitigated through the provision of small-scale UPGS with high accessibility in two-dimensional urban spaces, alongside the promotion of three-dimensional greening strategies. Improvements in living convenience within a moderate range can promptly meet residents’ needs and enhance SWB, suggesting that coordinating urban service facilities with supporting green infrastructure can further improve well-being. Moreover, interaction effects exist among different dimensions of environmental variables, reinforcing the need for planners and decision-makers to rationally allocate and integrate these dimensions to maximize efficiency in the process of urban development.

4.3. Insights from a Globalperspective for Planning Decisions

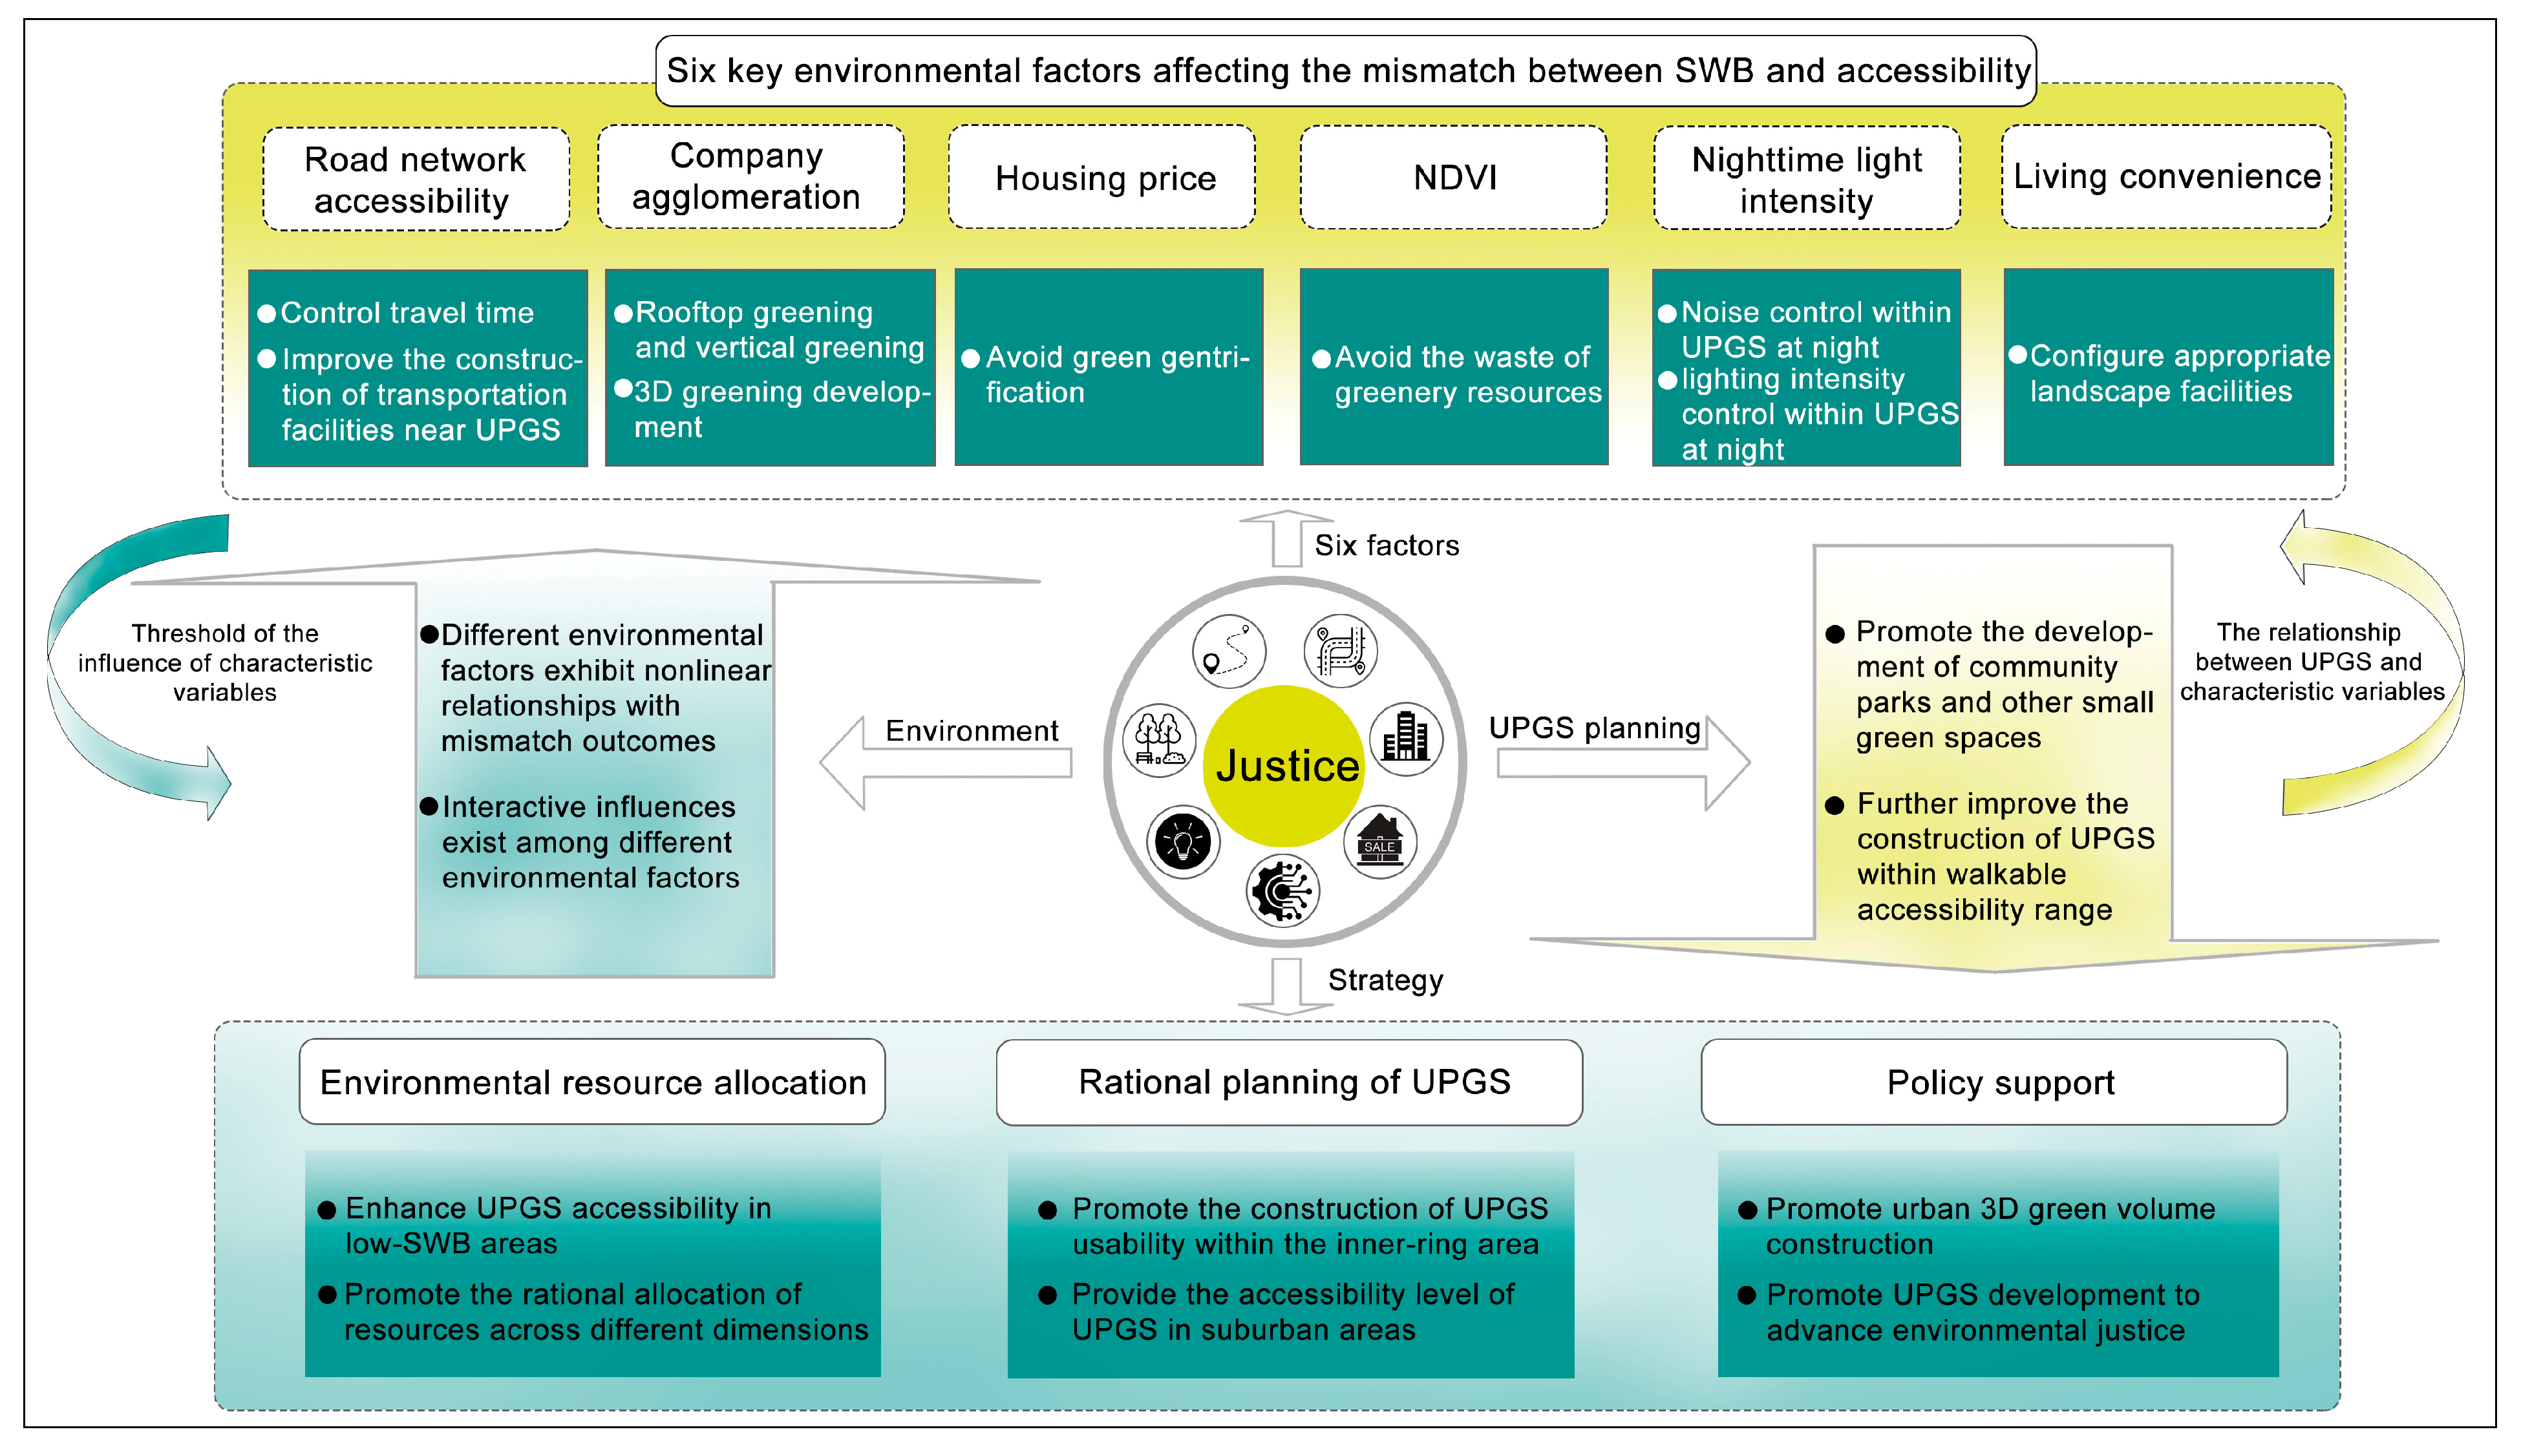
Our research findings hold strategic significance for urban sustainability (Figure 9):
(1) From the perspective of green space planning, Shanghai, like other global metropolises such as Hong Kong and London, faces the challenge of relatively well-developed inner-city infrastructure but insufficient green space services in suburban areas [72]. The presence of small-scale green spaces, such as community parks, can help mitigate spatial inequities [73]. Therefore, in central areas where land supply is limited and the construction of large parks is difficult, community-level green spaces can serve as effective substitutes to address inequities. At the same time, efforts should also be made to strengthen UPGS development in suburban areas.
(2) From the perspective of resource allocation, Shanghai, like cities such as New York and Beijing, reflects the tension between “green benefits” and “green gentrification” through the dual effects of housing prices [74,75]. Studies [76] have shown that environmental improvement measures such as urban greening, while enhancing the quality of public spaces, have unintentionally increased housing prices in surrounding areas, leading to the displacement of vulnerable residents and attracting higher-income and higher-educated groups, which in turn drives up land values and living costs. Therefore, governments should regulate housing price fluctuations within a reasonable range. Furthermore, given the established evidence that three-dimensional greening can improve the SWB of office workers in enterprise-dense areas such as CBDs [77], urban policymakers should actively promote the development of 3D green infrastructure.
(3) From the perspective of environmental justice, alleviating spatial inequities in UPGS contributes to the realization of social equity. Future planning should focus on strengthening public transportation infrastructure, improving residents’ UPGS accessibility across different travel modes, and, in particular, enhancing UPGS provision within walkable accessibility. Existing evidence demonstrates that walkability contributes most significantly to advancing green space equity. Beyond the impact of the spatial distribution of UPGS on social equity through objective accessibility, perceived green space accessibility has become an important predictor of residents’ green space usage patterns. Differences in age, gender, and socioeconomic status may lead to significant disparities among perceived, objective, and actual accessibility, which in turn influence subjective well-being (SWB). This underscores the importance of creating attractive, safe, and inclusive green spaces, rather than solely relying on improvements to public transportation or other factors that enhance objective accessibility [68]. These insights provide valuable implications for urban planners and policymakers seeking to promote a more equitable urban green space system.

4.4. Limitations and Future Research

Although this study performs well in evaluating the spatial heterogeneity of UPGS accessibility and revealing the spatial mismatch between UPGS accessibility and subjective well-being (SWB), several limitations remain. We assessed UPGS accessibility using the improved GA2SFCA method and conducted mismatch analysis between UPGS accessibility and SWB based on geotagged social media check-in data. However, it should be acknowledged that the binary classification of SWB and the equal weighting of general positive and negative emotions represent an oversimplification. In addition, social media data have inherent limitations due to the incomplete representativeness of their users. To ensure the stability and reliability of SWB measurement, future research should improve this approach by incorporating survey-based validation in combination with real-world conditions [78]. Meanwhile, although this study improved the traditional network-based accessibility assessment method by incorporating residents’ travel time data within a certain period to account for travel impedance, it simplified the purpose preferences of residents’ trips. Future research should further analyze residents’ travel purpose preferences [79], such as leisure or commuting, to improve the accuracy of accessibility evaluation. In terms of UPGS supply effects, although the analysis was improved by incorporating the latest park classification system and GF-2 satellite data, the evaluation of UPGS usability still requires further refinement. A growing body of research highlights the potential of leveraging social media data to better capture the actual perception and attractiveness of UPGS [80]. In the future, the actual supply level of UPGS can be further evaluated by combining big data perception with field surveys, which may contribute to the establishment of a comprehensive UPGS quality assessment system.
Moreover, the exploration of potential environmental feature variables remains challenging. For example, the grid-based analysis of population density in this study did not fully consider the influence of temporal population dynamics [81], nor did it include an empirical examination of the housing price spillover effects associated with green gentrification. Although this research identified several factors and their threshold effects contributing to the spatial mismatch between SWB and UPGS accessibility across three analytical dimensions, future studies should establish context-specific threshold standards tailored to the characteristics of different cities to more accurately capture variations in spatial equity. In addition, we must acknowledge that the causal relationships between the feature variables and the outcome variables have not been explicitly established in this study. Future research could apply causal inference methods to further examine these relationships. Moreover, since this study primarily focused on improving the evaluation of UPGS accessibility and identifying the spatial mismatch characteristics between SWB and UPGS accessibility, sensitivity and threshold variation analyses were not performed. Future work could further investigate sensitivity differences between the two variables to uncover deeper potential associations between SWB and urban green space equity.

5. Conclusions

Few prior studies have specifically focused on the spatial mismatch between UPGS accessibility and SWB. Taking the central area of Shanghai as a case study, this research proposes a novel analytical framework. First, we applied natural language processing (NLP) techniques to quantify residents’ SWB from social media data. Residents’ travel time data for walking, public transit, and driving were obtained through the Amap (Gaode) route planning API, and UPGS accessibility was measured using an improved GA2SFCA method. Second, the fairness of UPGS distribution was evaluated using the Gini index, and spatial mismatch was assessed through bivariate spatial correlation analysis between UPGS accessibility and SWB. Third, the SHAP method was employed to interpret an XGBoost model, revealing the nonlinear effects and interaction patterns of 15 feature variables related to the built environment, infrastructure, and socioeconomic dimensions on the mismatch outcome.
This study provides valuable insights for future urban planning and environmental justice decision-making. By identifying areas vulnerable to green space inequity, policymakers can more effectively prioritize resource allocation. The findings highlight that the integration of green space development with other urban environmental characteristics is essential for enhancing social well-being. Moreover, our results strengthen the linkage between urban planning practices and the needs of the public, thereby contributing to the advancement of environmental justice.

Author Contributions

H.G.: Conceptualization, Data curation, Formal analysis, Writing—original draft, Writing—review & editing. L.S.: Conceptualization, Funding acquisition, Methodology, Supervision, Writing—review & editing. All authors have read and agreed to the published version of the manuscript.

Funding

This research was funded by the National Natural Science Foundation of China (Grant No. 52078315).

Data Availability Statement

The raw data supporting the conclusions of this article will be made available by the authors on request.

Acknowledgments

We would like to express our gratitude to the anonymous reviewers and the editor for their constructive comments that helped improve the manuscript. In addition, we thank Wanyi Huang from Shenzhen University and many colleagues for their valuable suggestions during the revision process.

Conflicts of Interest

The authors declare that they have no known competing financial interests or personal relationships that could have appeared to influence the work reported in this paper.

References

  1. United Nations. 2024 Revision of World Population Prospects. Available online: https://www.un.org/zh/desa/UN-projects-world-population-to-peak-within-this-century-zh (accessed on 15 January 2025).
  2. Bhattarai, K.; Budd, D. Effects of Rapid Urbanization on the Quality of Life. In Multidimensional Approach to Quality of Life Issues: A Spatial Analysis; Sinha, B.R.K., Ed.; Springer: Singapore, 2019; pp. 327–341. [Google Scholar] [CrossRef]
  3. Lee, Y.-C.; Kim, K.-H. Attitudes of Citizens towards Urban Parks and Green Spaces for Urban Sustainability: The Case of Gyeongsan City, Republic of Korea. Sustainability 2015, 7, 8240–8254. [Google Scholar] [CrossRef]
  4. Xie, B.; An, Z.; Zheng, Y.; Li, Z. Healthy aging with parks: Association between park accessibility and the health status of older adults in urban China. Sustain. Cities Soc. 2018, 43, 476–486. [Google Scholar] [CrossRef]
  5. Liu, B.; Tian, Y.; Guo, M.; Tran, D.; Alwah, A.A.Q.; Xu, D. Evaluating the disparity between supply and demand of park green space using a multi-dimensional spatial equity evaluation framework. Cities 2022, 121, 103484. [Google Scholar] [CrossRef]
  6. Zhang, J.; Tan, P.Y. Assessment of spatial equity of urban park distribution from the perspective of supply-demand interactions. Urban For. Urban Green. 2023, 80, 127827. [Google Scholar] [CrossRef]
  7. Lu, Y.; Chen, R.; Chen, B.; Wu, J. Inclusive green environment for all? An investigation of spatial access equity of urban green space and associated socioeconomic drivers in China. Landsc. Urban Plan. 2024, 241, 104926. [Google Scholar] [CrossRef]
  8. Rigolon, A. A complex landscape of inequity in access to urban parks: A literature review. Landsc. Urban Plan. 2016, 153, 160–169. [Google Scholar] [CrossRef]
  9. Zhang, Y.; Zhao, J.; Mavoa, S.; Smith, M. Inequalities in urban green space distribution across priority population groups: Evidence from Tāmaki Makaurau Auckland, Aotearoa New Zealand. Cities 2024, 149, 104972. [Google Scholar] [CrossRef]
  10. Liu, Y.; Du, X.; Yang, W.; Zhang, G. Disparities in dynamic green exposure across residents’ mobility patterns: A case study in Chengdu. Urban For. Urban Green. 2025, 112, 128978. [Google Scholar] [CrossRef]
  11. Winkler, R.L.; Clark, J.A.G.; Locke, D.H.; Kremer, P.; Aronson, M.F.J.; Hoover, F.-A.; Joo, H.E.; La Rosa, D.; Lee, K.J.; Lerman, S.B.; et al. Unequal access to social, environmental and health amenities in US urban parks. Nat. Cities 2024, 1, 861–870. [Google Scholar] [CrossRef]
  12. Adorno, B.V.; Pereira, R.H.M.; Amaral, S. Combining spatial clustering and spatial regression models to understand distributional inequities in access to urban green spaces. Landsc. Urban Plan. 2025, 256, 105297. [Google Scholar] [CrossRef]
  13. Viinikka, A.; Tiitu, M.; Heikinheimo, V.; Halonen, J.I.; Nyberg, E.; Vierikko, K. Associations of neighborhood-level socioeconomic status, accessibility, and quality of green spaces in Finnish urban regions. Appl. Geogr. 2023, 157, 102973. [Google Scholar] [CrossRef]
  14. Sun, Z.; Lin, J.; Ta, N.; Wu, J. Gender differences in the impact of green space exposure on life satisfaction. Cities 2025, 158, 105678. [Google Scholar] [CrossRef]
  15. Lu, J.; Li, L.; Wang, W. Assessing accessibility and environmental equity in the context of sustained aging: Pathways for age-friendly urban park planning. Urban For. Urban Green. 2025, 108, 128768. [Google Scholar] [CrossRef]
  16. Talen, E. The social equity of urban service distribution: An exploration of park access in pueblo, colorado, and macon, georgia. Urban Geogr. 1997, 18, 521–541. [Google Scholar] [CrossRef]
  17. Hillier, B.; Hanson, J.; Grajewski, T.; Xu, J. Natural Movement: Or, Configuration and Attraction in Urban Pedestrian Movement. Environ. Plan. B Plan. Des. 1993, 20, 29–66. [Google Scholar] [CrossRef]
  18. Wang, S.; Yung, E.H.K.; Sun, Y. Effects of open space accessibility and quality on older adults′ visit: Planning towards equal right to the city. Cities 2022, 125, 103611. [Google Scholar] [CrossRef]
  19. Comber, A.; Brunsdon, C.; Green, E. Using a GIS-based network analysis to determine urban greenspace accessibility for different ethnic and religious groups. Landsc. Urban Plan. 2008, 86, 103–114. [Google Scholar] [CrossRef]
  20. Talen, E.; Anselin, L. Assessing spatial equity: An evaluation of measures of accessibility to public playgrounds. Environ. Plan. A 1998, 30, 595–613. [Google Scholar] [CrossRef]
  21. Dai, D. Racial/ethnic and socioeconomic disparities in urban green space accessibility: Where to intervene? Landsc. Urban Plan. 2011, 102, 234–244. [Google Scholar] [CrossRef]
  22. Li, C.; Wang, J. Using an age-grouped Gaussian-based two-step floating catchment area method (AG2SFCA) to measure walking accessibility to urban parks: With an explicit focus on elderly. J. Transp. Geogr. 2024, 114, 103772. [Google Scholar] [CrossRef]
  23. Liang, H.; Yan, Q.; Yan, Y.; Zhang, Q. Using an improved 3SFCA method to assess inequities associated with multimodal accessibility to green spaces based on mismatches between supply and demand in the metropolitan of Shanghai, China. Sustain. Cities Soc. 2023, 91, 104456. [Google Scholar] [CrossRef]
  24. Fang, D.; Liu, D.; Kwan, M.-P. Evaluating spatial variation of accessibility to urban green spaces and its inequity in Chicago: Perspectives from multi-types of travel modes and travel time. Urban For. Urban Green. 2025, 104, 128593. [Google Scholar] [CrossRef]
  25. Chen, H.; Yun, Z.; Xie, L.; Dawodu, A. Spatial disparities in urban park accessibility: Integrating real-time traffic data and housing prices in Ningbo, China. Urban For. Urban Green. 2024, 100, 128484. [Google Scholar] [CrossRef]
  26. Diener, E. Subjective well-being. Psychol. Bull. 1984, 95, 542–575. [Google Scholar] [CrossRef]
  27. Cheng, Y.; Browning, M.H.E.M.; Zhao, B.; Qiu, B.; Wang, H.; Zhang, J. How can urban green space be planned for a ‘happy city’? Evidence from overhead- to eye-level green exposure metrics. Landsc. Urban Plan. 2024, 249, 105131. [Google Scholar] [CrossRef]
  28. Patino, J.E.; Martinez, L.; Valencia, I.; Duque, J.C. Happiness, life satisfaction, and the greenness of urban surroundings. Landsc. Urban Plan. 2023, 237, 104811. [Google Scholar] [CrossRef]
  29. Rao, J.; Ma, J.; Dong, G. How mobility-based exposure to green space and environmental pollution influence individuals’ wellbeing? A structural equation analysis through the lens of environmental justice. Landsc. Urban Plan. 2024, 252, 105199. [Google Scholar] [CrossRef]
  30. Twohig-Bennett, C.; Jones, A. The health benefits of the great outdoors: A systematic review and meta-analysis of greenspace exposure and health outcomes. Env. Res. 2018, 166, 628–637. [Google Scholar] [CrossRef]
  31. Reyes-Riveros, R.; Altamirano, A.; De La Barrera, F.; Rozas-Vásquez, D.; Vieli, L.; Meli, P. Linking public urban green spaces and human well-being: A systematic review. Urban For. Urban Green. 2021, 61, 127105. [Google Scholar] [CrossRef]
  32. Zhao, X.; Lu, Y.; Huang, W.; Lin, G. Assessing and interpreting perceived park accessibility, usability and attractiveness through texts and images from social media. Sustain. Cities Soc. 2024, 112, 105619. [Google Scholar] [CrossRef]
  33. Huibers, M.J.; de Graaf, L.E.; Peeters, F.P.; Arntz, A. Does the weather make us sad? Meteorological determinants of mood and depression in the general population. Psychiatry Res. 2010, 180, 143–146. [Google Scholar] [CrossRef] [PubMed]
  34. Plunz, R.A.; Zhou, Y.; Carrasco Vintimilla, M.I.; McKeown, K.; Yu, T.; Uguccioni, L.; Sutto, M.P. Twitter sentiment in New York City parks as measure of well-being. Landsc. Urban Plan. 2019, 189, 235–246. [Google Scholar] [CrossRef]
  35. Cui, N.; Malleson, N.; Houlden, V.; Yan, Y.; Comber, A. Using Twitter to understand spatial-temporal changes in urban green space topics based on structural topic modelling. Cities 2025, 157, 105601. [Google Scholar] [CrossRef]
  36. Derks, D.; Fischer, A.H.; Bos, A.E.R. The role of emotion in computer-mediated communication: A review. Comput. Hum. Behav. 2008, 24, 766–785. [Google Scholar] [CrossRef]
  37. Martí, P.; Serrano-Estrada, L.; Nolasco-Cirugeda, A. Social Media data: Challenges, opportunities and limitations in urban studies. Comput. Environ. Urban Syst. 2019, 74, 161–174. [Google Scholar] [CrossRef]
  38. Bertram, C.; Rehdanz, K. The role of urban green space for human well-being. Ecol. Econ. 2015, 120, 139–152. [Google Scholar] [CrossRef]
  39. Sharifi, F.; Nygaard, A.; Stone, W.M.; Levin, I. Accessing green space in Melbourne: Measuring inequity and household mobility. Landsc. Urban Plan. 2021, 207, 104004. [Google Scholar] [CrossRef]
  40. Rui, J. Green disparities, happiness elusive: Decoding the spatial mismatch between green equity and the happiness from vulnerable perspectives. Cities 2025, 163, 106063. [Google Scholar] [CrossRef]
  41. De Luca, C.; Calcagni, F.; Tondelli, S. Assessing distributional justice around Cultural Ecosystem Services (CES) provided by urban green areas: The case of Bologna. Urban For. Urban Green. 2024, 101, 128556. [Google Scholar] [CrossRef]
  42. Zheng, Y.; Chen, X.; Zhang, M.; Zhu, R.; Jin, Y. Darker nights, happier lives? The impact of urban green space night-time accessibility on residents′ subjective happiness: A case study of the main urban area of Hangzhou. Cities 2026, 169, 106510. [Google Scholar] [CrossRef]
  43. Shanghai Municipal Bureau of Statistics. Shanghai Statistical Yearbook 2024. Available online: https://tjj.sh.gov.cn/tjnj/20250331/9f8ec62cc2234485b0aa411b8d967c37.html (accessed on 5 May 2025).
  44. Xiao, Y.; Cen, L. Do new urban parks really improve green equity? A longitudinal analysis of Shanghai (2000–2020). Landsc. Urban Plan. 2026, 265, 105519. [Google Scholar] [CrossRef]
  45. Ministry of Housing and Urban-Rural Development of China. Standard for classification of urban green space (CJJ/T85-2017). Available online: https://www.mohurd.gov.cn/gongkai/zc/wjk/art/2018/art_17339_236545.html (accessed on 3 May 2025).
  46. Shanghai Bureau of Planning and Natural Resources. Shanghai Ecological Space Special Plan (2021–2035). Available online: https://ghzyj.sh.gov.cn/zxgh/20231009/129e4b3c04104159bc2d424d5e24c1bb.html (accessed on 3 May 2025).
  47. Wang, Z.; Li, Z.; Cheng, H. The equity of urban park green space accessibility in large Chinese cities: A case study of Wuhan City. Prog. Geogr. 2022, 41, 621–635. [Google Scholar] [CrossRef]
  48. Chen, Y.; Xu, C.; Ge, Y.; Zhang, X.; Zhou, Y. A 100 m gridded population dataset of China’s seventh census using ensemble learning and big geospatial data. Earth Syst. Sci. Data 2024, 16, 3705–3718. [Google Scholar] [CrossRef]
  49. Wu, W.-B.; Ma, J.; Banzhaf, E.; Meadows, M.E.; Yu, Z.-W.; Guo, F.-X.; Sengupta, D.; Cai, X.-X.; Zhao, B. A first Chinese building height estimate at 10 m resolution (CNBH-10 m) using multi-source earth observations and machine learning. Remote Sens. Environ. 2023, 291, 113578. [Google Scholar] [CrossRef]
  50. Guo, R.; Ann Diehl, J.; Zhang, R.; Wang, H. Spatial equity of urban parks from the perspective of recreational opportunities and recreational environment quality: A case study in Singapore. Landsc. Urban Plan. 2024, 247, 105065. [Google Scholar] [CrossRef]
  51. Yaxian, G.; Wei, L.; Gang, H.; Shuhang, Z. Evaluation of industrial ecological security in industrial transformation demonstration area based on spatiotemporal differentiation. Geomat. Nat. Hazards Risk 2022, 13, 1422–1440. [Google Scholar] [CrossRef]
  52. Zhang, J. Inequalities in the quality and proximity of green space exposure are more pronounced than in quantity aspect: Evidence from a rapidly urbanizing Chinese city. Urban For. Urban Green. 2023, 79, 127811. [Google Scholar] [CrossRef]
  53. Wang, H. Mapping Walking Accessibility, Bus Availability, and Car Dependence: A Case Study of Xiamen, China. In Spatial Planning and Sustainable Development: Approaches for Achieving Sustainable Urban Form in Asian Cities; Kawakami, M., Shen, Z.-j., Pai, J.-t., Gao, X.-l., Zhang, M., Eds.; Springer: Dordrecht, The Netherlands, 2013; pp. 249–267. [Google Scholar] [CrossRef]
  54. Chen, Y.; Yue, W.; La Rosa, D. Which communities have better accessibility to green space? An investigation into environmental inequality using big data. Landsc. Urban Plan. 2020, 204, 103919. [Google Scholar] [CrossRef]
  55. Chen, T.; Guestrin, C. XGBoost. In Proceedings of the 22nd ACM SIGKDD International Conference on Knowledge Discovery and Data Mining, San Francisco, CA, USA, 13–17 August 2016; pp. 785–794. [Google Scholar] [CrossRef]
  56. Lundberg, S.M.; Lee, S.-I. A unified approach to interpreting model predictions. In Proceedings of the 31st International Conference on Neural Information Processing Systems, Long Beach, CA, USA, 4–9 December 2017; pp. 4768–4777. [Google Scholar] [CrossRef]
  57. Friedman, J.H. Greedy function approximation: A gradient boosting machine. Ann. Stat. 2001, 29, 1189–1232. [Google Scholar] [CrossRef]
  58. Zhao, X.; Yang, H.; Yao, Y.; Qi, H.; Guo, M.; Su, Y. Factors affecting traffic risks on bridge sections of freeways based on partial dependence plots. Phys. A Stat. Mech. Its Appl. 2022, 598, 127343. [Google Scholar] [CrossRef]
  59. Sharma, G.; Patil, G.R. Urban spatial structure and equity for urban services through the lens of accessibility. Transp. Policy 2024, 146, 72–90. [Google Scholar] [CrossRef]
  60. Tian, D.; Wang, J.; Xia, C.; Zhang, J.; Zhou, J.; Tian, Z.; Zhao, J.; Li, B.; Zhou, C. The relationship between green space accessibility by multiple travel modes and housing prices: A case study of Beijing. Cities 2024, 145, 104694. [Google Scholar] [CrossRef]
  61. Jiang, B.; Li, J.; Gong, P.; Webster, C.; Schumann, G.; Liu, X.; Suppakittpaisarn, P. A generalized relationship between dose of greenness and mental health response. Nat. Cities 2025, 2, 739–748. [Google Scholar] [CrossRef]
  62. Su, L.; Jia, J. The relationship between nighttime light intensity and GDP in Shanghai districts. J. Comput. Methods Sci. Eng. 2023, 23, 3–8. [Google Scholar] [CrossRef]
  63. Chepesiuk, R. Missing the Dark: Health Effects of Light Pollution. Environ. Health Perspect. 2009, 117, A20–A27. [Google Scholar] [CrossRef] [PubMed]
  64. Li, Q.; Wu, R.; Zhu, P. Quality or quantity of urban greenery: Which matters more to mental health? Evidence from housing prices in the Pearl River Delta. Landsc. Urban Plan. 2025, 263, 105438. [Google Scholar] [CrossRef]
  65. Wu, L.; Kim, S.K. Does socioeconomic development lead to more equal distribution of green space? Evidence from Chinese cities. Sci. Total Environ. 2021, 757, 143780. [Google Scholar] [CrossRef] [PubMed]
  66. Zhang, W.; Li, S.; Gao, Y.; Liu, W.; Jiao, Y.; Zeng, C.; Gao, L.; Wang, T. Travel changes and equitable access to urban parks in the post COVID-19 pandemic period: Evidence from Wuhan, China. J. Environ. Manag. 2022, 304, 114217. [Google Scholar] [CrossRef]
  67. Bakhtsiyarava, M.; Moran, M.; Ju, Y.; Zhou, Y.; Rodriguez, D.A.; Dronova, I.; de Fatima Rodrigues Pereira de Pina, M.; de Matos, V.P.; Skaba, D.A. Potential drivers of urban green space availability in Latin American cities. Nat. Cities 2024, 1, 842–852. [Google Scholar] [CrossRef]
  68. Liu, D.; Kwan, M.-P.; Yang, Z.; Kan, Z. Comparing subjective and objective greenspace accessibility: Implications for real greenspace usage among adults. Urban For. Urban Green. 2024, 96, 128335. [Google Scholar] [CrossRef]
  69. Xu, Z.; Marini, S.; Mauro, M.; Maietta Latessa, P.; Grigoletto, A.; Toselli, S. Associations Between Urban Green Space Quality and Mental Wellbeing: Systematic Review. Land 2025, 14, 381. [Google Scholar] [CrossRef]
  70. Ugolini, F.; Massetti, L.; Calaza-Martínez, P.; Cariñanos, P.; Dobbs, C.; Krajter Ostoić, S.; Marin, A.M.; Pearlmutter, D.; Saaroni, H.; Šaulienė, I.; et al. Understanding the benefits of public urban green space: How do perceptions vary between professionals and users? Landsc. Urban Plan. 2022, 228, 104575. [Google Scholar] [CrossRef]
  71. Navarrete-Hernandez, P.; Kiarostami, N.; Yang, D.; Ozcakir, A. Green Enough? A dose-response curve of the impact of street greenery levels and types on perceived happiness. Landsc. Urban Plan. 2024, 251, 105130. [Google Scholar] [CrossRef]
  72. Shan, L.; He, S. The role of peri-urban parks in enhancing urban green spaces accessibility in high-density contexts: An environmental justice perspective. Landsc. Urban Plan. 2025, 254, 105244. [Google Scholar] [CrossRef]
  73. Zhang, K.; Chen, M. Multi-method analysis of urban green space accessibility: Influences of land use, greenery types, and individual characteristics factors. Urban For. Urban Green. 2024, 96, 128366. [Google Scholar] [CrossRef]
  74. Assaad, R.H.; Jezzini, Y. Green gentrification vulnerability index (GGVI): A novel approach for identifying at-risk communities and promoting environmental justice at the census-tract level. Cities 2024, 148, 104858. [Google Scholar] [CrossRef]
  75. Wu, L.; Rowe, P.G. Green space progress or paradox: Identifying green space associated gentrification in Beijing. Landsc. Urban Plan. 2022, 219, 104321. [Google Scholar] [CrossRef]
  76. Wang, J.; Hu, Y.; Zhang, X. Is green gentrification a pernicious paradox in the urban greening process? Land Use Policy 2025, 158, 107766. [Google Scholar] [CrossRef]
  77. Xie, X.; Huang, W.; Liu, X.; Gou, Z. A framework for green space equity in central business districts: Exposure assessment and comparative analysis for office workers across global cities. Cities 2025, 167, 106397. [Google Scholar] [CrossRef]
  78. Cheng, Y.; Zhang, J.; Wei, W.; Zhao, B. Effects of urban parks on residents’ expressed happiness before and during the COVID-19 pandemic. Landsc. Urban Plan. 2021, 212, 104118. [Google Scholar] [CrossRef] [PubMed]
  79. Jianzhong, H.; Gangyu, H.; Yuhan, L.; Tianran, Z.; Siling, C.; Yishuai, Z. Study on the characteristics of weekend trips to three types of non-work destinations based on multi-source data: A case study of Shanghai, China. Front. Urban Rural Plan. 2024, 2, 25. [Google Scholar] [CrossRef]
  80. Yang, C.; Zhang, Y. Public emotions and visual perception of the East Coast Park in Singapore: A deep learning method using social media data. Urban For. Urban Green. 2024, 94, 128285. [Google Scholar] [CrossRef]
  81. Tan, X.; Huang, B.; Batty, M.; Li, W.; Wang, Q.R.; Zhou, Y.; Gong, P. The spatiotemporal scaling laws of urban population dynamics. Nat. Commun. 2025, 16, 2881. [Google Scholar] [CrossRef] [PubMed]
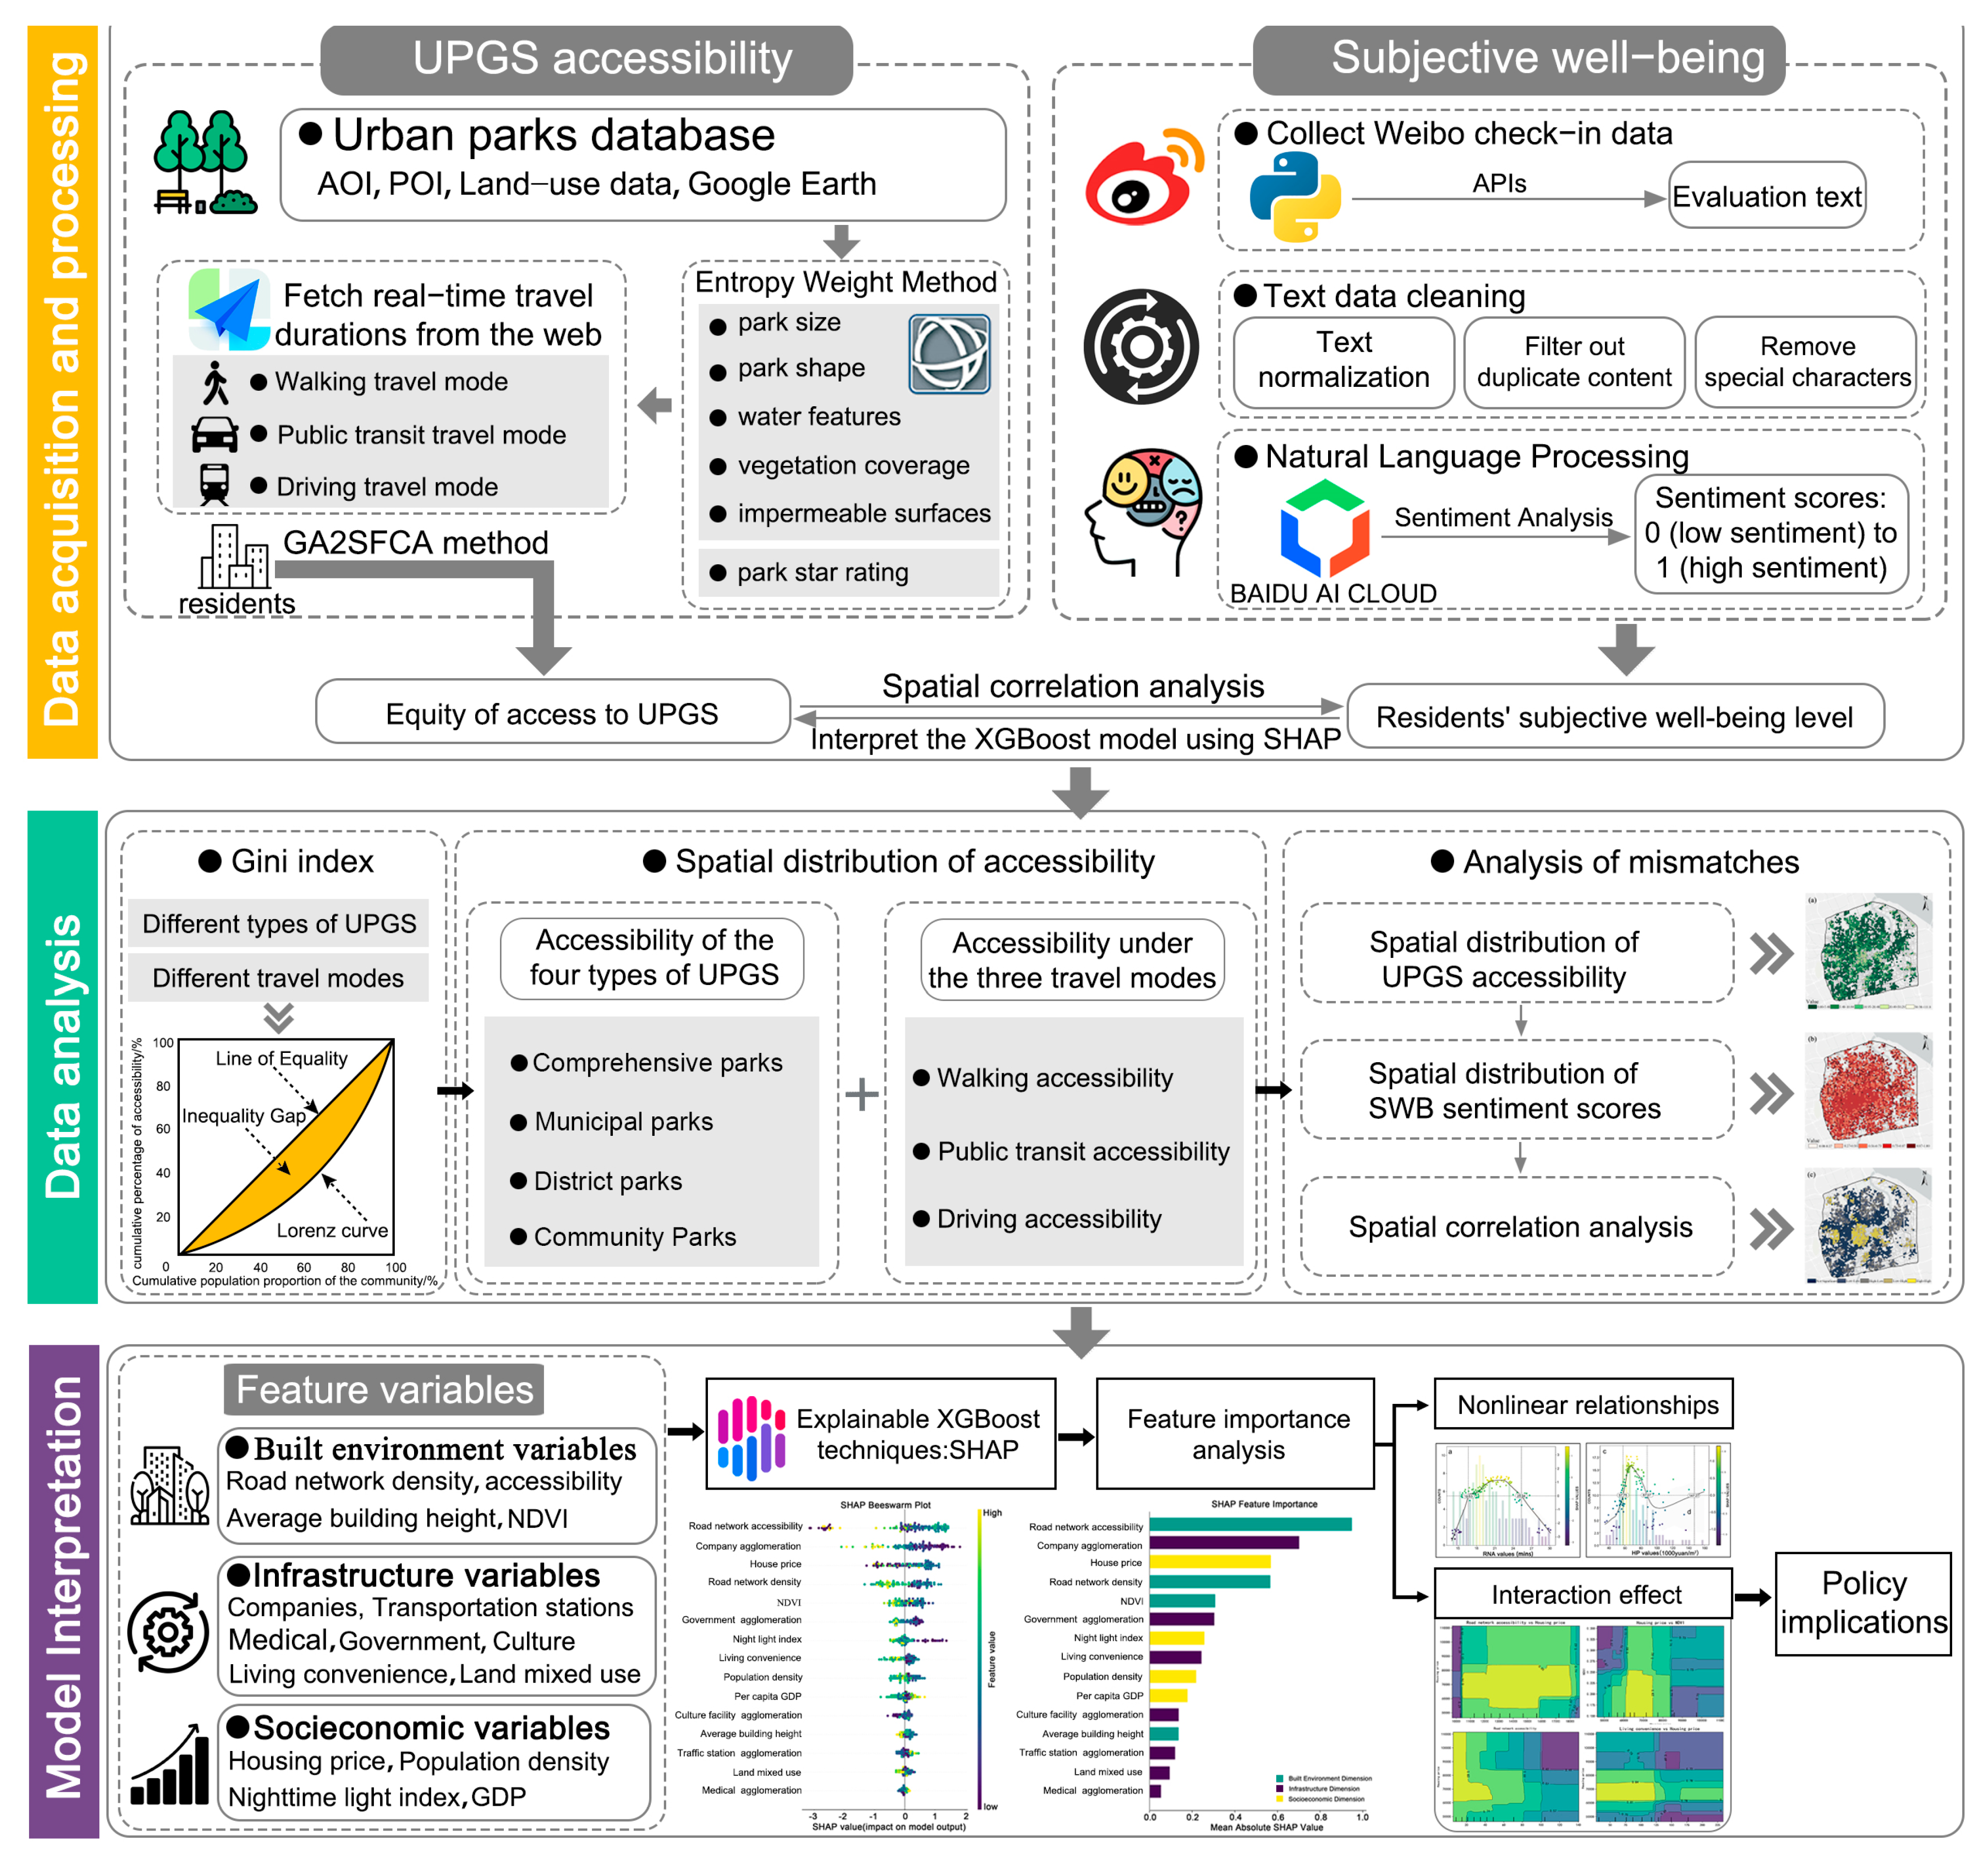
Figure 1. The research framework.
Land 14 02205 g001
Figure 2. Distribution of UPGS in the study area: (a) National location of China; (b) Location of the central area of Shanghai; (c) Distribution of four types of UPGS within central Shanghai; (d) Examples of UPGS based on supervised classification.
Land 14 02205 g002
Figure 3. Lorenz curves of UPGS accessibility for four park types under different travel modes: (a) Lorenz curves under the walking mode. (b) Lorenz curves under the public transit mode. (c) Lorenz curves under the driving mode.
Land 14 02205 g003
Figure 4. Spatial distribution of UPGS accessibility in central Shanghai: (ad) Walking accessibility of different types of UPGS; (eh) Public transit accessibility of different types of UPGS; (il) Driving accessibility of different types of UPGS; (IIII) The walking, public transit, and driving accessibility of all UPGS; (IV) shows the overall spatial distribution of integrated UPGS accessibility combining all three travel modes.
Land 14 02205 g004
Figure 5. Spatial mismatch between UPGS accessibility and SWB across geographic grids: (a) UPGS accessibility. (b) SWB levels. (c) mismatch results.
Land 14 02205 g005
Figure 6. SHAP summary plots display the beeswarm plot and the feature importance of 15 variables from three dimensions related to the mismatch outcome (SWB > Ai).
Land 14 02205 g006
Figure 7. Nonlinear effects of 15 environmental feature variables based on SHAP values. And they respectively represent: (a) Road network accessibility; (b) Company agglomeration; (c) Housing prices; (d) Road network density; (e) NDVI; (f) Government agglomeration; (g) Nighttime light index; (h) Living convenience; (i) Population density; (j) GDP; (k) Cultural facility density; (l) Building height; (m) Transportation station density; (n) Land use intensity; (o) Medical facility agglomeration.
Land 14 02205 g007
Figure 8. The interaction effects of RNA, CA, HP, NDVI, NLI, and LC are illustrated using partial dependence plots derived from the prediction model, specifically represented as: (a) Road accessibility and company agglomeration; (b) Housing prices and company agglomeration; (c) NDVI and company agglomeration; (d) Nighttime light index and company agglomeration; (e) Living convenience and company agglomeration; (f) NDVI and housing prices; (g) Living convenience and housing prices; (h) NDVI and living convenience; (i) NDVI and nighttime light index. The purple areas represent target intervals associated with the weakest levels of subjective well-being, while the yellow areas correspond to intervals with the highest predicted well-being. From yellow to green and finally to purple, the increasing color saturation indicates a gradual decrease in the predicted values.
Land 14 02205 g008
Figure 9. Implications for environmental justice decision-making.
Land 14 02205 g009
Table 2. Determination of XGBoost model hyperparameters.
HyperparameterValue RangeOptimal Parameter Combination
learning_rate[0.01, 0.05, 0.1]0.1
max_depth[3, 6, 9]6
n_estimators[50, 100, 200]100
subsample[0.8, 0.9, 1.0]1.0
colsample_bytree[0.8, 0.9, 1.0]0.8
Disclaimer/Publisher’s Note: The statements, opinions and data contained in all publications are solely those of the individual author(s) and contributor(s) and not of MDPI and/or the editor(s). MDPI and/or the editor(s) disclaim responsibility for any injury to people or property resulting from any ideas, methods, instructions or products referred to in the content.