Abstract
Guided by the “Healthy China” initiative, understanding the impact of the built environment on running behavior is essential for encouraging regular physical activity and advancing public health. This study addresses a critical gap in healthy city research by examining the spatial heterogeneity in how urban environmental contexts affect residents’ running preferences. Focusing on two contrasting areas of Suzhou, namely the historic Gusu District and the modern Industrial Park District, we developed a 5Ds-based analytical framework (density, accessibility, diversity, design, and visual) that incorporates Suzhou’s unique water networks and street features. Methodologically, we used Strava heatmap data and multi-source environmental indicators to quantify built-environment attributes and examined their relationships with running-space selection. We applied linear regression and interpretable machine learning to reveal overall associations, while geographically weighted regression (GWR) was used to capture spatial variations. Results reveal significant spatial heterogeneity in how the built environment influences running-space selection. While the two districts differ in their urban form, runners in Gusu District prefer dense and compact street networks, whereas those in Industrial Park District favor open, natural spaces with higher levels of human vibrancy. Despite these differences, both districts show consistent preferences for spaces with a more intense land use mix, stronger transportation accessibility, and larger parks and green spaces. The multi-dimensional planning strategies derived from this study can improve the urban running environment and promote the health and well-being of residents.
1. Introduction
According to the World Health Organization’s Global Status Report on Physical Activity 2022, approximately 1.4 billion adults—representing around 27.5% of the global adult population—do not meet the recommended levels of physical activity [1]. Insufficient physical activity is closely linked to a range of adverse outcomes, including detrimental effects on mental health, physical well-being, and overall quality of life [2,3]. Among various forms of physical exercise, running stands out as a widely practiced activity that offers substantial benefits for both physical and mental health, including significantly reducing the risk of cardiovascular diseases, depression, and anxiety [4,5,6]. Crucially, the running environment plays a fundamental role in shaping individuals’ perceptions, behaviors, and their broader experience of urban life [7,8,9]. A well-designed and supportive running environment can promote more frequent participation in running activities, thus serving as a powerful lever for improving public health outcomes on a large scale. Therefore, systematically investigating the mechanisms through which the built environment influences running behaviors, alongside the implementation of targeted urban design interventions, is not only a scientific necessity but also a critical component of the global public health agenda.
Building on the global imperative to promote physical activity and acknowledging the critical influence of the built environment on running behavior, China has increasingly prioritized the integration of health considerations into its urban development strategy. In the context of rapid urbanization and shifting lifestyles, the demand for health-oriented urban planning has become ever more urgent. Particularly in densely populated and fast-developing urban areas, insufficient physical activity and related health risks have become prominent public concerns. Under the comprehensive advancement of the “Healthy China 2030” national strategy, the creation of healthy environments has emerged as a pivotal objective in new urbanization development. The “Healthy China 2030” Planning Outline, released in 2016, explicitly advocates for the establishment of health-supportive environments, deeply integrating health concepts into urban planning. Guided by this strategic orientation, enhancing residents’ health and well-being through environmental optimization has become a crucial research topic.
As China places increasing emphasis on integrating health into urban development, it is essential to examine how different urban forms influence running activities. Distinct types of urban districts often exhibit varying environmental characteristics, which in turn play a critical role in shaping residents’ participation in health-promoting behaviors. Typically, historical urban districts face constraints such as limited public space and insufficient sports facilities, while newly developed zones are often challenged by a lack of diversity and user engagement in sports-space design. As one of China’s first national pilot cities for urban regeneration, Suzhou offers a unique case through the contrasting built environments of its Gusu District and Industrial Park District. The former preserves millennium-old historical heritage yet confronts spatial renewal pressures, while the latter, as a national-level development zone, showcases a modern urban landscape yet also faces the pressures of balancing rapid development with sustainable urban planning. This distinctive “dual-city” structure provides an ideal case for comparative studies on how different built environments influence residents’ health-related behaviors.
The spatial selection of running, as one of the most prevalent outdoor fitness activities, can effectively reflect the supportive capacity of built environments for healthy exercise. In the context of parallel development of old and new urban areas in China, investigating the mechanisms through which the built environment affects space selection holds significant theoretical and practical value. However, existing research has insufficiently explored the relationship between built environments and running behaviors, notably lacking comparative analyses of environmental heterogeneity between historical districts and newly developed modern areas.
This study aims to contribute to the improvement in residents’ health and well-being by systematically investigating how built environment characteristics influence residents’ running-space choice in Suzhou’s ancient Gusu District and modern Industrial Park District. The findings will provide scientific evidence for healthy city construction, offer practical guidance for reconciling historical district preservation with the creation of health-promoting spaces, and guide the refinement of health-oriented planning strategies in new urban areas.
2. Literature Review
2.1. General Research on Running Behavior
Running, as one of the most accessible and widely practiced forms of physical activity, has been extensively recognized for its multidimensional health benefits. From a physiological perspective, regular running contributes significantly to cardiovascular health, enhances immune system function, improves aerobic fitness, supports postural balance, and plays a preventive role in the development of metabolic disorders such as obesity [10,11,12,13]. Recent meta-analytic evidence further confirms that even modest amounts of running can substantially reduce all-cause, cardiovascular, and cancer mortality risk [14,15]. Concurrently, a growing body of psychological and public health research has demonstrated the positive effects of running on mental health, including its capacity to alleviate anxiety, reduce depressive symptoms, mitigate stress, and enhance overall well-being and life satisfaction [16,17,18,19,20,21]. Beyond individual health outcomes, running also carries important social and cultural significance. It frequently serves as a vehicle for community building, offering opportunities for social interaction and group identity formation through organized running clubs and marathons [22,23,24,25].
Given these wide-ranging benefits, scholars have increasingly turned their attention to the underlying motivations and mechanisms that influence running behavior, aiming to foster more effective running engagement. Studies on behavioral psychology and exercise motivation reveal that individuals are driven by a combination of intrinsic and extrinsic factors [26,27]. Intrinsic motivations often include the pursuit of personal achievement, enjoyment, and psychological relief, while extrinsic drivers encompass health improvement, weight management, and social engagement [28,29,30,31]. Understanding these motivational dynamics is crucial for designing effective interventions that encourage sustained participation in running.
2.2. The Multifaceted Impact of the Built Environment on Running Behavior
Among the various factors influencing running behavior, the built environment has been shown to have a significant association with residents’ running preference [32,33,34]. In many urban areas, the lack of accessible and appealing public spaces, inadequate sports facilities, and poorly designed transportation networks contribute to sedentary lifestyles [35,36]. Additionally, the prevalence of unsafe or uninviting neighborhoods can deter individuals from engaging in outdoor physical activities [37,38].
Empirical studies increasingly highlight the built environment as a key determinant of running behavior, with many adopting the “five Ds (5Ds)” framework—density, diversity, design, distance to transit, and destination accessibility—to systematically examine how urban form influences route choice and running frequency [10,39,40]. The original “three Ds,” coined by Cervero and Kockelman, include density, diversity, and design [41], which were later expanded to incorporate destination accessibility and distance to transit [42,43]. In terms of density, building and population metrics are commonly used to reflect spatial concentration, and related research has yielded divergent conclusions. On one hand, higher building density can facilitate physical activity by reducing the distance to service facilities [44]. On the other hand, excessive street network density may diminish the running experience due to increased traffic interference [45]. Moreover, the relationship between population density and running intensity exhibits a nonlinear pattern, indicating the need to identify an optimal density range that can enhance spatial vitality without triggering overcrowding [46]. Diversity refers to the degree of land use mix, often measured by entropy indices, where lower values indicate environments dominated by a single use and higher values reflect more varied land uses. Existing studies suggest that the degree of mixed land use has a context-dependent impact on running frequency. For instance, Park analyzed metropolitan data from the United States and reported a positive stimulating effect [47]. Jiang employed a POI entropy model in the context of Chinese cities and identified a suppressive effect, possibly attributed to differences in the spatial configuration of land uses [48]. Design focuses on the physical layout and features of the environment that influence pedestrian-friendly spaces. Within the design dimension, Wolf utilized GPS trajectory analysis and revealed that park environments significantly enhance running-related energy expenditure compared to ordinary green spaces, thereby encouraging running activities and promoting health, highlighting the critical role of urban parks in shaping runners’ spatial choices [49]. Scholars have also applied the Maximum Entropy (MaxEnt) model to examine the relationship between running behavior and environmental variables in Beijing, finding that the Normalized Difference Vegetation Index (NDVI) positively influences running activities [50]. Destination accessibility measures the ease of access to trip attractions. It may be regional or local [51]. Research has consistently highlighted its significance in shaping physical activity behaviors. For example, McCormack et al. analyzed physical activity data from Western Australian adults, linking it with GIS-based measures of destination proximity and diversity, and found that greater access to varied neighborhood destinations within 400–1500 m was significantly associated with increased physical activity [52]. Cerin et al., using both objective and perceived environmental data in 10 countries, found that greater destination accessibility—particularly higher residential density, public transport availability, and park access—was consistently associated with increased moderate-to-vigorous physical activity [53]. Distance to transit is another important dimension, typically measured by the average shortest route from residences or workplaces to the nearest transit station, or alternatively, by transit route density, distance between stops, or the number of stations per unit area. Zhou et al. applied the random forest algorithm and identified a positive correlation between the density of bus stops and metro stations and the frequency of running activities [54]. A study based on GPS trajectory data in Shanghai also revealed that high-density urban environments influence residents’ health through complex, mediated pathways involving running behavior, with distance to transit negatively affecting running participation [55].
In recent years, street-view imagery (SVI) technology, leveraging semantic segmentation and deep learning algorithms, has enabled a more precise identification of street-level visual elements, such as perceived greenery. A study utilizing Google Street View images and visual greenery scoring methods found that the probability of cycling was positively correlated with perceived greenery at eye level [56]. However, this correlation did not hold when using traditional greenness indices, such as the Normalized Difference Vegetation Index (NDVI), highlighting the superiority of SVI-based approaches in healthy city research and demonstrating the importance of eye-level greenery in the selection of spaces for physical activity.
2.3. The Methodology and Data of the Built Environment on Running Behavior
Methodologically, recent studies have increasingly integrated advanced analytical tools to address the limitations of traditional global regression models, which often fail to capture spatial heterogeneity and complex mechanisms. Geographically Weighted Regression (GWR) offers a key advantage by enabling the quantification and visualization of spatial variations in environmental influences across different geographic contexts. Meanwhile, machine learning techniques have proven particularly effective in capturing the nonlinear contributions and complex interactions among multiple variables [57,58,59]. These methods have rarely been jointly applied in environmental research. Some scholars employed GWR models to analyze influencing factors and artificial neural networks (ANN) for prediction [60]. In most research integrating both methods, machine learning is typically limited to data preprocessing tasks such as extracting visual variables from street-view images [61,62]. The application of approaches that account for spatial heterogeneity and nonlinear relationships in investigating how the built environment shapes running behavior remains underdeveloped and deserves further exploration.
In terms of data collection, many studies have employed survey-based methods [63,64,65]. However, Wang et al. pointed out that traditional survey methods suffer from validity issues due to recall bias and social desirability effects [66]. In response, emerging data sources such as Strava, which are derived from crowdsourced fitness applications, offer improved quantification of physical activity frequency through fine-grained analysis. For instance, Breyer et al. used Strava crowdsourced data and generalized additive models to examine the impact of urban greenspace on active mobility during extreme heat in Houston, finding that greenspace supports continued bicycling and walking under high-temperature conditions [67]. Similarly, a multiscale spatial analysis of Strava running routes in Inner London, combining the 5Ds framework with computer vision-based streetscape evaluation, identified road hierarchy characteristics and natural elements as key enablers while revealing urban density and pollution as critical barriers, providing evidence-based guidelines for running-oriented urban design across macro- and micro-scale built environments [48].
2.4. Research Gaps
Despite significant advancements, several limitations persist in the existing body of knowledge. First, in terms of data acquisition, challenges related to data quality and representativeness remain important, while the potential of crowdsourced fitness data from applications such as Strava has yet to be fully validated in running-related studies. Second, the selection of environmental variables remains inadequate. The indicators employed in many existing studies are still relatively rudimentary, and some important features, such as water system elements, are absent, thereby limiting the explanatory power of research findings. Third, from a methodological perspective, the overreliance on global regression models, coupled with the limited integration of machine learning and GWR, leads to an incomplete understanding of the underlying mechanisms. Lastly, the spatial scale of analysis in most studies remains at the citywide level, with a notable lack of intra-urban comparisons across multiple functional areas under the framework of urban renewal. In particular, the differential impact of built environment characteristics on running behavior between historic districts and newly developed urban areas remains unexplored.
To address these gaps, this study proposes the following four innovations: (1) Utilizing Strava Heatmap image data to identify spatial patterns in running-space selection; (2) Developing an integrated built environment assessment framework by incorporating street-view imagery (SVI) with multi-source data, and refining conventional greenness measurements by replacing overhead-view indices with eye-level alternatives; (3) Employing a hybrid methodological approach, combining machine learning with GWR to analyze both the nonlinear contributions and spatial heterogeneity of environmental factors; and (4) Comparing the environmental effects on running behavior between Suzhou’s historic district and industrial district, offering empirical insights for differentiated urban planning strategies that promote more supportive spaces for physical activity and accommodate diverse spatial contexts.
3. Study Area and Data
3.1. Study Area
This study focuses on two representative urban districts in Suzhou, China: Gusu District and Industrial Park District (Figure 1). Gusu District, located at the historical core of Suzhou, is characterized by a dense urban fabric, narrow alleyways, traditional courtyard houses, and a high concentration of cultural heritage sites and waterways. As the city’s oldest urban area, its compact spatial structure has been shaped by centuries of urban evolution, during which the river-street system gradually formed an intricate, pedestrian-scale spatial fabric where living, commerce, and cultural activities are closely intertwined. The district’s historical continuity also constrains large-scale modernization, resulting in limited infrastructure capacity and fragmented open spaces. In recent decades, conservation-oriented planning policies have aimed to preserve this fine-grained morphology while improving essential facilities. Measures such as heritage-district designation, height control, and micro-renewal projects have helped sustain the enclosed streetscape and mixed-use vitality while allowing gradual adaptation to contemporary urban needs.
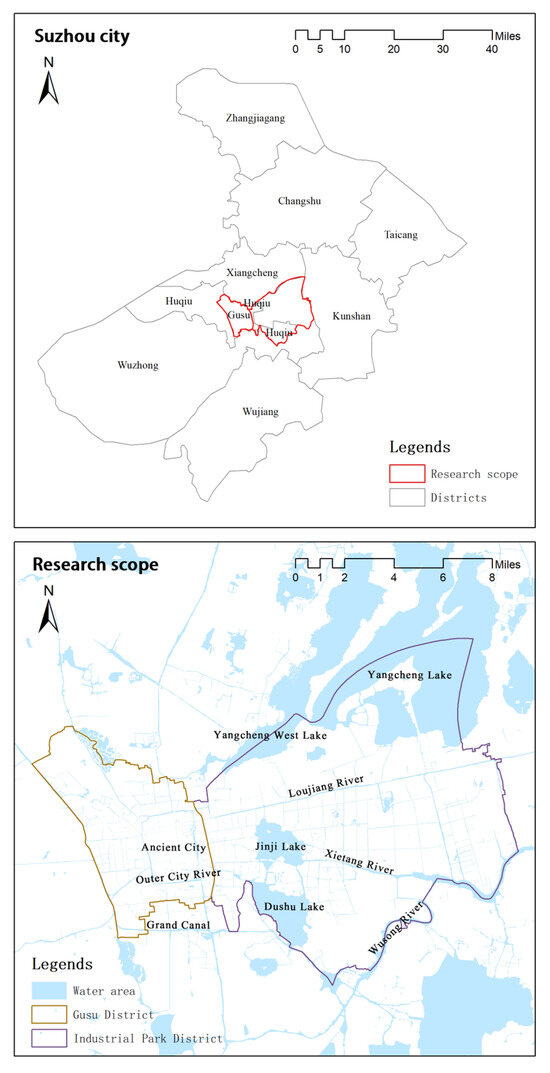
Figure 1.
Location map.
In contrast, Industrial Park District is situated in the eastern part of the city. It represents one of China’s flagship high-tech development zones, jointly developed by the Chinese and Singaporean governments in the 1990s. Guided by a comprehensive master plan that emphasized infrastructure-led growth, ecological corridors, and high-quality urban services, the district features a large-scale, modern urban layout with wide roads, planned residential neighborhoods, expansive green spaces, and well-distributed public service facilities. Large parks and lakes—such as Jinji Lake and Dushu Lake—were planned as the cores of the open-space system and linked to surrounding neighborhoods through continuous green-blue corridors. As a result, the area today is characterized by low-to-medium building densities, high street connectivity, and strong integration with public transportation systems, reflecting how modern planning has shaped an open and accessible urban environment.
The juxtaposition of these two districts—one rooted in historical continuity and conservation-led renewal and the other shaped by contemporary planning paradigms and large-scale development—highlights the contrasting formation mechanisms and provides an ideal comparative framework for this study. Their resulting urban forms, compact and fine-grained in Gusu District but open and large-scale in Industrial Park District, offer a compelling spatial context for examining how environmental factors influence residents’ running-space preferences across contrasting urban settings.
3.2. Data Source and Processing
3.2.1. Running-Space Selection
In this study, Strava heatmap data were employed to quantify running-space selection. Strava is a widely used fitness-tracking application that records and aggregates users’ running, cycling, and other activity trajectories. Its Global Heatmap visualizes the relative intensity of publicly shared activities over the last year, offering fine-grained spatial information on route popularity and usage intensity with a highest spatial resolution of approximately 2–4 m. Owing to its broad coverage, high spatial granularity, and growing application in urban and transport studies, Strava data serve as a valuable proxy for analyzing large-scale spatial patterns of running activities. Although the dataset is derived from a self-selected user group, its cumulative nature ensures a robust depiction of spatial variations in running-space preference.
The heatmap visually represents the relative intensity of running activities, with warmer colors and thicker lines indicating routes used more frequently by users. Notably, these visual patterns reflect the relative density of aggregated user trajectories rather than absolute counts of activities, due to internal normalization during rendering. Accordingly, this study interpreted the color intensity of each pixel as a proxy for the relative frequency and spatial intensity of running activities. The detailed workflow (Figure 2) is summarized as follows. First, a screenshot of the Strava heatmap was captured and georeferenced within a GIS environment. The georeferencing accuracy was verified by confirming that areas outside the image coverage correspond exclusively to water bodies within the study area. The background of the heatmap images was then removed to isolate the visual representation of running activities clearly. Pixel values corresponding to different heatmap colors were extracted and spatially aggregated to their respective grid cells in GIS, generating the dependent variable. Finally, grid cells with zero values for running activities were excluded, resulting in a refined spatial distribution of running-space selection across the study area. Based on the quantified results, the most frequently selected running spaces are primarily concentrated in the historic core of Gusu District, the areas surrounding Jinji Lake and Dushu Lake in Industrial Park District, and along Loujiang River, which traverses the central part of both districts.
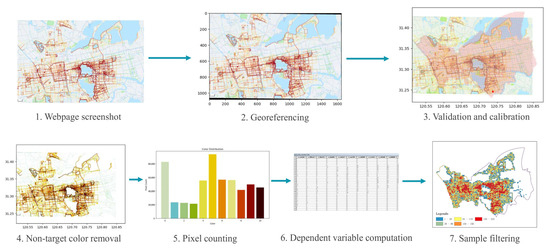
Figure 2.
Identification process of running-space selection.
3.2.2. Indicators
The traditional 5Ds framework encompasses five key built environment dimensions: density, diversity, design, distance to transit, and destination accessibility. However, in the context of this study, the dimension of destination accessibility was excluded because the traditional 5Ds framework was developed for daily travel behavior, where destinations play a crucial role in trip generation. In contrast, running is a self-contained recreational activity that serves as its own behavioral purpose rather than a means to reach other destinations. Additionally, the concept of distance to transit was broadened and reframed as accessibility to better reflect the diverse ways runners can reach suitable exercise environments. Unlike the conventional definition that measures the distance to transit stations, our accessibility indicators capture the ease of reaching running spaces through both private and public transport modes, represented by parking lot density and public transit station density.
Beyond these physical and functional dimensions, perceptual qualities of the built environment also exert a significant influence on outdoor activity choices. To account for these perceptual effects, this study introduces an additional dimension—vision—which comprises the green index and sky index, extending the analytical framework toward eye-level environmental perception. These indicators, derived from street view imagery (SVI), are grounded in environmental perception theory, highlighting how visible natural and spatial features influence human psychological and behavioral responses. Unlike nonvisual indicators such as land use-based green coverage, they capture the actual visible proportion of vegetation and sky from a pedestrian perspective, directly corresponding to how individuals experience naturalness and openness. Greenery conveys restorative and biophilic qualities associated with stress reduction and esthetic preference, whereas sky visibility conveys a sense of spaciousness, daylight exposure, and visual comfort. Compared with more abstract perceptual metrics (e.g., enclosure or color complexity), the greenery and sky indices capture runners’ most immediate visual impressions while being readily quantifiable and comparable across areas, making them both practical and theoretically grounded indicators of visual quality.
To calculate vision metrics, street-view panoramic images from Baidu Map were collected along the street network at approximately 50 m intervals throughout both districts. At each sampling point, a full 360° panorama was retrieved to approximate the complete streetscape. Each image was processed using a semantic segmentation model, the Pyramid Scene Parsing Network (PSPNet) [68], to classify pixels into vegetation, sky, and other categories. The green index was defined as the proportion of vegetation pixels (trees, shrubs, and grass), and the sky index as the proportion of sky pixels. Image-level values were then aggregated to grid cells by averaging all samples within each cell. To illustrate these visual indicators, Figure 3 presents representative panoramas and their segmentation results from the two study districts. The example from Gusu District (Figure 3a) shows a traditional streetscape characterized by dense roadside trees, narrow roadway space, and low-rise buildings, yielding a green index of 0.2201 and a sky index of 0.3917. In contrast, the Industrial Park District example (Figure 3b) features a wide arterial road flanked by high-rise buildings and open sky views, with a green index of 0.1054 and a sky index of 0.5914. These contrasts clearly illustrate how these indices capture the differing spatial forms and visual openness of the historic and modern districts.
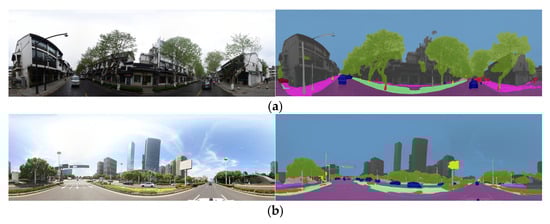
Figure 3.
Representative panoramic street-view images (left) and semantic segmentation results (right) in the two study districts. (a) Gusu District. (b) Industrial Park District.
The measurement methods and data sources for all variables—including both the traditional 5Ds and the additional vision dimension—are summarized in Table 1.

Table 1.
Variable table.
4. Methodology
To comprehensively examine the relationships between the built environment and running-space selection, this study adopted a multistage analytical framework integrating linear regression, interpretable machine learning, and Geographically Weighted Regression (GWR), following recent integrative approaches in urban analytics [70,71,72]. These three models were selected to provide complementary perspectives. Linear regression serves as the foundation, identifying overall linear associations and establishing benchmark relationships. Interpretable machine learning extends the analysis by revealing potential nonlinearities that may be overlooked in linear forms, while GWR accounts for spatial nonstationarity, uncovering how the strength and direction of relationships vary geographically. Together, this framework bridges global linearity, nonlinear mechanisms, and spatial heterogeneity, laying the conceptual foundation for the following methodological details. Data preprocessing, linear regression, and interpretable machine learning were implemented in Python 3.9, and GWR and other spatial processing were conducted in ArcGIS 10.8.
4.1. Linear Regression
A global linear regression model, estimated using the Ordinary Least Squares (OLS) method, was first employed to examine the overall linear relationships between the built environment variables and the intensity of running-space selection. The model was specified as follows:
where denotes the running-space selection intensity in grid cell i, represents the value of the k-th explanatory variable, and is the corresponding coefficient. The model was evaluated using the coefficient of determination (R2), adjusted R2, and the statistical significance of the predictors.
To assess model adequacy, a spatial autocorrelation analysis was conducted on the residuals. The results revealed significant positive spatial autocorrelation (Moran’s I = 0.3209, z = 66.7261, p < 0.001), indicating the presence of spatial dependence not captured by the global model and suggesting the need for more spatially sensitive methods.
In addition to the global model, separate OLS regressions were performed for Gusu District and Industrial Park District to provide a coarse comparison between traditional and modern urban contexts. Although these regional-specific regressions are not spatially continuous models, they offer preliminary evidence of spatial variation, complementing the fine-grained heterogeneity later examined through GWR.
4.2. Interpretable Machine Learning
To complement linear modeling and better capture complex, potentially nonlinear relationships between built environment factors and running-space selection, this study employed a series of machine learning algorithms. Specifically, five supervised learning models were tested: Random Forest, XGBoost, LightGBM, Support Vector Machine (SVM), and k-Nearest Neighbors (k-NN).
All models were trained using an 80:20 train–test split, and hyperparameters were tuned through grid search with cross-validation. Model performance was evaluated using R2 and the Root Mean Squared Error (RMSE) on the testing dataset.
To enhance interpretability, the Shapley Additive Explanations (SHAP) framework was applied to the tree-based models, enabling a transparent understanding of the marginal and interaction effects of each variable. SHAP summary and dependence plots provided insights into how built environment features influenced running-space selection, revealing both global importance rankings and localized nonlinear effects.
While the interpretable machine learning models uncover nonlinear patterns, it does not explicitly account for spatial heterogeneity. Therefore, the subsequent GWR analysis complements this investigation by identifying continuous, location-specific variations in environmental effects across the study area, providing a finer spatial perspective beyond regional contrasts and bridging global findings with spatially adaptive interpretations.
4.3. GWR
Given the evidence of spatial autocorrelation in both the dependent variable (Moran’s I = 0.4153, z = 86.3291, p < 0.001) and OLS residuals, Geographically Weighted Regression (GWR) was implemented to explore spatial heterogeneity in the effects of built environment features.
GWR allows regression coefficients to vary over space by fitting a localized model for each observation, using spatial weighting based on proximity. The GWR specification is defined as follows:
where are the spatial coordinates of observation i, and denotes the location-specific coefficient of predictor k. An adaptive Gaussian kernel function was employed, and the optimal bandwidth was selected through cross-validation to balance bias and variance.
5. Results
5.1. The Baseline Linear Regression
To investigate the overall associations between built environment characteristics and running-space selection, a linear regression analysis was first performed on the pooled sample comprising both Gusu District and Industrial Park District. This model served to establish a baseline understanding of the key environmental factors influencing running behavior across the broader urban landscape. To capture potential spatial heterogeneity and contextual differences, separate linear regression models were subsequently estimated for each district. This stratified approach enables a more nuanced interpretation of how environmental variables operate within distinct urban patterns. The results of both the pooled and district-specific regressions are presented in Table 2.
Table 2.
Linear and group-wise linear regression.
In the pooled model, the findings indicate that multiple built environment factors significantly and positively influence running-space selection. Higher street and intersection densities are associated with stronger running preferences, suggesting that well-connected street networks encourage running activities. Similarly, greater building and population densities also exhibit a positive impact, indicating that runners tend to choose high-density built environments. Mixed land use enhances running-space selection, highlighting the role of diverse urban functions in promoting physical activity. Natural environments, including waterfronts and green spaces, also positively influence running behavior, underscoring the appeal of scenic and open areas. Accessibility factors, such as the densities of parking lots and public transit stations, are positively associated with running-space selection, suggesting that improved connectivity facilitates access to preferred running spaces. Additionally, visual factors, including green coverage and sky openness, contribute to the attractiveness of the environment, further supporting running behavior.
The district-specific regressions largely mirrored the overall trends, with most factors exhibiting positive effects in both districts. This consistency suggests that well-designed street networks, diverse land use patterns, accessible transportation facilities, and high-quality natural scenes are universally conducive to enhancing the appeal of running spaces.
Despite these commonalities, notable differences emerged between the two districts. In Industrial Park District, population density is positively associated with running-space selection, highlighting the role of residential concentration in shaping running behaviors. However, this effect is not observed in Gusu District, possibly due to the already high baseline density and spatial constraints that limit running preference. Conversely, the sky index demonstrates a strong positive effect in Industrial Park District, suggesting that open and expansive street environments enhance the attractiveness of running spaces in this modern urban setting. In contrast, the sky index is negatively associated with running-space selection in Gusu District, where narrower streets and a more enclosed skyline may contribute to a sense of spatial continuity and comfort preferred by runners. These contrasting effects highlight how different urban forms can lead to divergent environmental preferences for running activities.
5.2. Nonlinear Effects Revealed by Interpretable Machine Learning
To further capture potential nonlinear relationships and improve explanatory accuracy beyond traditional linear models, multiple machine learning algorithms were applied to the pooled dataset from Gusu and Industrial Park Districts. A binary variable, region, was included in the feature set to capture potential contextual variations between the two districts. The dataset was split into a training set and a test set at an 80:20 ratio. Six models were evaluated, including Linear Regression, Random Forest, XGBoost, LightGBM, SVM, and k-NN. Among them, the Random Forest model achieved the best predictive performance on the test set, as measured by R2 (Figure 4).
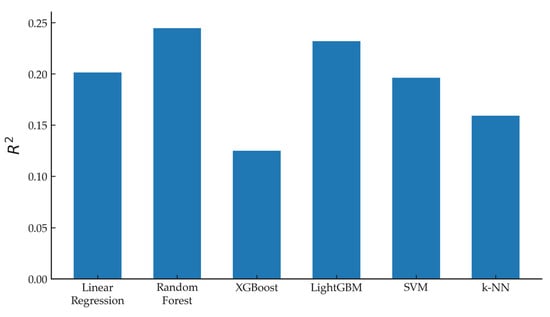
Figure 4.
R-square values of different machine learning models.
To further interpret the results of the Random Forest model, SHAP analysis was utilized. The SHAP summary plot (Figure 5) reveals both the relative importance and the distribution of effects for each predictor. Features are ranked by their mean absolute SHAP values, indicating their average contribution to the model output across all samples. Among them, intersection density and population density emerge as the most influential predictors, followed by mixed land use, street density, and the green index. This suggests that both the structural configuration of the built environment and the intensity of human activity play central roles in shaping running-space preferences. High intersection, street, and population densities likely correspond to areas with enhanced network connectivity and urban vitality, which may encourage running by offering greater route options and a heightened sense of safety. The prominence of mixed land use further underscores the importance of spatial diversity, while the contribution of the green index highlights the value of visually pleasant and greener environments in promoting running behaviors. Together, these findings illustrate the multifaceted interplay between urban form, land use patterns, and environmental perception in influencing running-space selection.
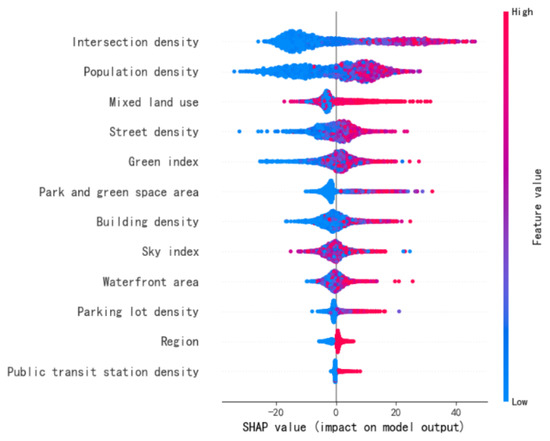
Figure 5.
SHAP summary plot of random forest model.
In addition, SHAP also provides insight into the direction and magnitude of each feature’s impact. Several key variables, such as intersection density, population density, street density, park and green space area, parking lot density, and public transit station density, show strong and consistently positive contributions. These results align closely with the coefficients and significance observed in the pooled and district-specific linear regression models (Table 2), reinforcing the robustness of these features across both linear and nonlinear model frameworks.
However, notable differences also emerged. For instance, the sky index, although positively significant in the linear model, exhibits a nonmonotonic effect in the SHAP analysis. While higher values of sky openness generally contribute positively, there is also substantial variability at lower and middle ranges, suggesting that its influence may depend on the broader spatial context. Similarly, mixed land use, despite its positive association in the regression model, shows a wide spread of SHAP values across the spectrum, indicating that not all mixed-use environments equally support running behavior, likely due to variations in land use composition and urban design quality. Moreover, the SHAP value distribution for the waterfront area highlights a complex nonlinear effect that is not captured in the linear model. Although larger waterfront areas tend to have a positive impact, there is notable fluctuation in SHAP values across different levels, implying that the functional quality, accessibility, and visual appeal of these areas may mediate their effects on running-space selection. These insights underscore the value of combining interpretable machine learning methods with traditional models to better understand the context-dependent nature of environmental influences on spatial behavior.
5.3. Spatial Heterogeneity Identified by GWR
Significant spatial autocorrelation was detected in both the dependent variable and the OLS residuals. Therefore, the GWR analysis was conducted to more effectively account for spatial heterogeneity and to uncover spatially varying relationships between built environment characteristics and running-space preferences. The adjusted R2 of GWR was 0.480, surpassing that of all other statistical and machine learning models, indicating superior model performance when spatial variation is considered.
The results of GWR and linear regression models show that the direction of influence for most variables remains consistent, though the magnitude of the effects differs (Table 3). Variables such as building density, the green index, and public transit station density show consistent positive effects in the OLS model, but display wide coefficient ranges in the GWR results, indicating their spatially divergent impacts. In contrast, variables like street density, intersection density, and mixed land use exhibit relatively stable effects across space, with GWR average values close to OLS estimates. These findings demonstrate that the OLS model may obscure localized variations, while the GWR model captures spatial nonstationarity more effectively.
Table 3.
Comparison of regression coefficients between GWR and OLS.
The spatial variation in regression coefficients for each influencing factor is represented through thematic maps, displaying only spatial units that are significant at the 0.05 level, based on the criterion of |t| > 1.96.
5.3.1. Density
The spatial distribution of the GWR coefficients for the four density indicators is illustrated in Figure 6. Street density predominantly exhibits a positive effect on running-space selection, with the most decisive influence observed in the southern part of Gusu District. This area is characterized by vibrant residential neighborhoods with a strong sense of daily life. The well-connected street network facilitates pedestrian movement and enhances accessibility, making the area conducive to running activities. However, the intensity of this positive effect gradually diminishes towards the periphery, especially in lower-density residential and industrial zones where street connectivity is relatively sparse. This spatial pattern highlights the critical role of fine-grained street networks in fostering active running behavior.
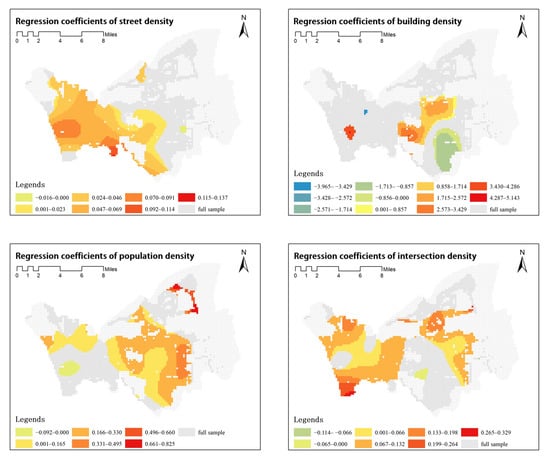
Figure 6.
GWR coefficient maps of different density variables.
The effect of building density demonstrates distinct spatial clustering patterns. Notable positive influences are observed around the northern and southern shores of Jinji Lake as well as in the vicinity of Tongjing Park—areas known for high environmental quality. This positive relationship suggests that in well-designed environments, higher building density does not necessarily deter physical activity; instead, it can promote running behavior. In contrast, the effect is mainly negative in the south of Industrial Park District, where building density is relatively high, but the surrounding environment is less appealing due to suburban adjacency and poor scenic values. In such a context, excessive building density may weaken the willingness of individuals to engage in running.
Population density exhibits contrasting effects between the two study areas. In Gusu District, higher population density corresponds to a negative impact on running-space selection; whereas in Industrial Park District, it is predominantly associated with a positive effect. This divergence may stem from differences in urban form—Gusu District features a compact built environment, where high population density can make runners feel uncomfortable and depressed. In contrast, the more spacious urban form of Industrial Park District allows higher population density to enhance environmental vibrancy, thereby increasing the availability and attractiveness of running spaces.
Intersection density generally contributes positively to running-space selection across most areas, highlighting the importance of well-connected street grids. Areas with a higher density of intersections tend to offer more route choices, enhanced permeability, and improved pedestrian accessibility, thereby encouraging running behavior. However, a notable exception is observed in the Xinghu Street area, northeast of Dushu Lake. As a major urban arterial road with heavy traffic flow, Xinghu Street creates an environment that is less conducive to running, likely due to increased vehicular congestion, air and noise pollution, and potential safety concerns for runners. This finding underscores the complex interplay between intersection density and running patterns, suggesting that while a well-connected street network generally supports running activities, its benefits may be counteracted in high-traffic corridors with inadequate pedestrian infrastructure or frequent pedestrian–vehicle conflicts.
5.3.2. Diversity
As shown in Figure 7, mixed land use exerts a predominantly positive effect on running-space selection across most regions. Notably, the highest influence is observed around the northern shore of Jinji Lake near the International Expo Center, within several clusters of Industrial Park District, and in the historic city center along Ganjiang West Road and Renmin Road. These areas are characterized by a high degree of land use mixing, integrating commercial, recreational, and residential functions. The presence of amenities such as retail shops, cultural landmarks, and waterfront promenades fosters a vibrant urban atmosphere, making these locations particularly attractive for running activities.
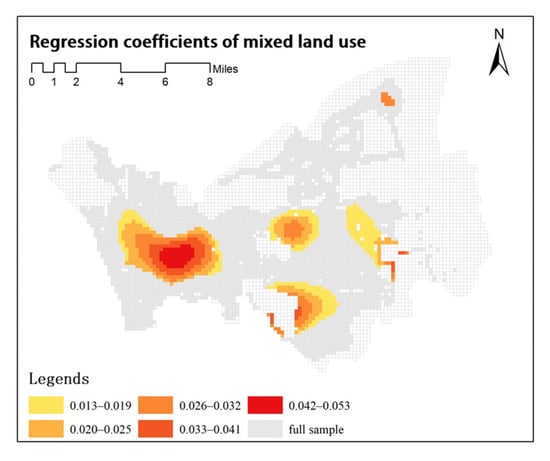
Figure 7.
GWR coefficient map of diversity variable.
5.3.3. Design
Figure 8 presents the spatial variation in the effects of design-related variables. Expansive and appealing waterfront environments appear to promote running activities. Positive effects are observed around Wusong River in Industrial Park District, the northern shore of Jinji Lake, the southern shore of Loujiang River, and the vicinity of Tiger Hill Wetland Park in Gusu District. These areas are characterized by wide water bodies that provide esthetically pleasing and open waterfront environments, which are conducive to recreational activities. In contrast, waterfront areas along Xietang River in Industrial Park District and the Old Canal in Gusu District exhibit negative effects. These regions are typically associated with narrower waterways and poor accessibility, which may deter runners from choosing these spaces. The identified pattern indicates that only waterfront areas with expansive water bodies, well-maintained landscapes, and seamless connectivity can effectively enhance running behavior.
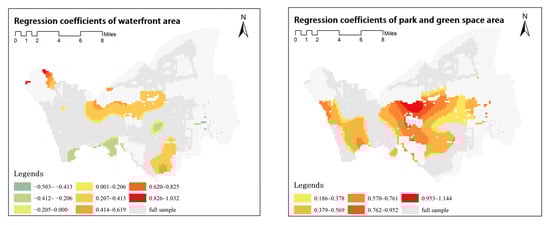
Figure 8.
GWR coefficient maps of design variables.
The influence of park and green space area on running-space selection is mainly positive. The strongest effects are concentrated around Jinji Lake, Loujiang River, and Dushu Lake in Industrial Park District, where extensive green spaces and well-planned park facilities enhance the appeal of these locations. Proper spatial planning and recreational programming within parks and green areas substantially enhance their attractiveness for running activities. Moreover, larger, well-maintained parks with integrated running paths and scenic landscapes contribute more significantly and effectively to running preference.
5.3.4. Accessibility
The spatial pattern of accessibility effects is displayed in Figure 9. In most areas, particularly within Gusu District, parking lot density demonstrates a significant positive effect. In this district, where land resources are limited and parking facilities are scarce, a higher parking lot density signifies greater accessibility for runners, enabling them to reach running spaces or return home after a workout more easily. Conversely, a negative effect is observed in the eastern periphery of Jinji Lake Avenue within Industrial Park District. This area, dominated by industrial clusters and heavy vehicular traffic, offers a less favorable environment for running due to reduced spatial comfort and safety.
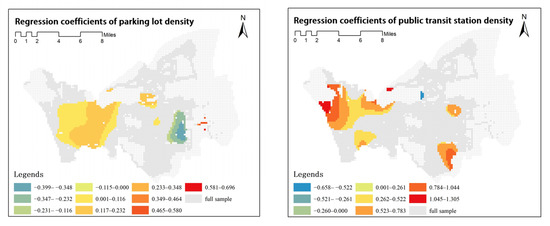
Figure 9.
GWR coefficient maps of accessibility variables.
The impact of public transit station density on running-space selection is also predominantly positive across both study areas. This effect is particularly pronounced in Gusu District, where the positive influence spans a larger geographical area. Given the district’s compact urban morphology and dense historical fabric, public transit likely plays a crucial role in facilitating access to running spaces. However, a distinct negative effect emerges around the high-speed railway station in Industrial Park District. This anomaly can be attributed to the predominant industrial land use surrounding the station. The fragmented urban form, combined with inadequate pedestrian-friendly design, diminishes the appeal of running spaces in this area. Additionally, the disorganized landscape surrounding metro stations in this vicinity further reduces the likelihood of runners selecting these locations.
5.3.5. Vision
Figure 10 illustrates the spatial heterogeneity associated with visual-perception variables. The impact of the green index on running-space selection exhibits notable spatial heterogeneity across different urban contexts. In the urban-rural transitional zones of Gusu District and the industrial-residential mixed-use areas within Industrial Park District, the green index demonstrates a negative effect. Although these areas exhibit relatively high levels of greenery, the presence of densely planted street trees along narrow sidewalks creates obstacles. Such a configuration disrupts the continuity of running routes, making the environment less conducive to an uninterrupted and comfortable running experience. Conversely, the green index exhibits a significant positive effect along the northwestern shore of Dushu Lake, the northern bank of Wusong River, and the eastern shore of Yangcheng West Lake. In these locations, greenery is effectively integrated with the surrounding pedestrian system, ensuring that greenery not only enhances visual appeal but also facilitates a seamless and unobstructed running environment. Additionally, the presence of high-quality waterfront landscapes further elevates the attractiveness of these spaces. The synergy between greenery and scenic water features creates a pleasant and inviting setting for running, thereby reinforcing the positive impact of the green index.
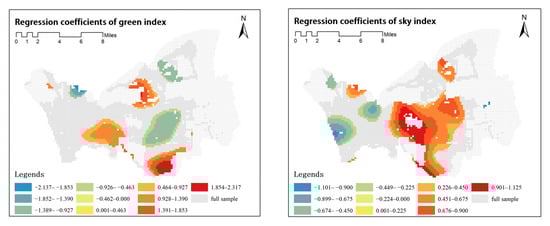
Figure 10.
GWR coefficient maps of vision variables.
The influence of the sky index on running-space selection also exhibits distinct spatial variations, with a negative impact concentrated in Gusu District and a positive effect prevailing in Industrial Park District. This contrast can be attributed to the fundamental differences in urban morphology between the two areas. Due to historical constraints, the streets in Gusu District are generally narrow, with tightly clustered buildings limiting the openness of the sky. In such environments combined with an ancient atmosphere, a lower sky index often corresponds to a more enclosed and compact streetscape, potentially promoting running activities. While in Industrial Park District, streets are typically wider, and urban planning emphasizes open spaces and broad avenues. In this context, a higher sky index indicates a more open environment, which may contribute to a greater perception of spatial comfort and freedom, thereby encouraging running activities.
6. Discussion
6.1. Integrated Nonlinearities and Spatial Heterogeneity in Environmental Effects
The results of the OLS, SHAP, and GWR models jointly provide an integrated understanding of how the built environment influences running-space selection through linear, nonlinear, and spatially heterogeneous processes. OLS identifies the global direction and magnitude of effects; SHAP reveals nonlinear effects that modify these relationships; and GWR illustrates how such effects vary across geographic contexts. Together, this synthesis bridges what, how, and where the built environment shapes running preferences.
Overall, the combination of results indicates that the street network and its connectivity play a critical yet context-dependent role. The OLS model identifies generally positive associations for both street and intersection densities, confirming that fine-grained and well-connected networks encourage outdoor physical activity [73,74,75,76]. However, SHAP results uncover a clear threshold effect—once intersections become too frequent, the marginal benefits decline—while GWR shows that this turning point is spatially concentrated in high-traffic corridors such as Xinghu Street. This pattern aligns with recent morphological studies, which indicate that the benefits of high intersection density depend on supportive conditions such as a sense of security and a pedestrian-friendly environment [77,78]. These findings reveal that street connectivity benefits, while generally favorable, may be offset by safety concerns, congestion, or unpleasant sensory environments [79].
Built-up and population densities exhibit similar nonlinear and spatially varied patterns. OLS suggests moderate positive global effects, implying that compactness supports a vibrant and engaging environment for runners [41,80,81]. However, SHAP demonstrates a “comfort window” in which moderate density levels maximize running preference, whereas overly crowded or underpopulated environments reduce it [77,82,83]. The GWR coefficients confirm this spatially: moderate-density neighborhoods in the Industrial Park show strong positive effects, while the highly compact traditional blocks of Gusu display local negatives, suggesting that density becomes unfavorable when crowding and limited openness compromise comfort [84].
The environmental perception variables—greenness, sky openness, and the extent of parks and waterfronts—jointly capture how natural and visual elements affect running comfort. OLS results show generally positive associations, consistent with prior findings that both green and blue spaces enhance physical activity and environmental comfort [78,85,86,87]. Nevertheless, the SHAP value distribution for the green and sky indices reveals nonmonotonic relationships, where moderate levels of enclosure and openness yield the greatest attractiveness. Excessive vegetation or extreme openness can diminish comfort. Similar conditional or even nonsignificant effects have been observed elsewhere, likely due to moderating factors such as green-space quality, socio-economic context, or urban form [85,88,89,90]. These nonlinear tendencies are further corroborated by GWR outcomes: positive coefficients cluster along broad, well-landscaped parks and open waterfronts in Industrial Park District, while narrow vegetated alleys and enclosed canals in Gusu District show reduced or even negative influences. The positive role of waterfront areas identified in OLS also exhibits a spatial threshold—benefits intensify only in locations with wide water bodies and high-quality landscapes, while narrow or inaccessible waterfronts may even exert diminishing effects. These differences are often masked in global models but are critical for understanding localized behavioral dynamics.
Land use mix and transit-accessibility indicators display more consistent global effects but still reveal certain variations. In line with previous studies [91,92,93,94], OLS shows that functional diversity and transit-station density both enhance running-space selection by providing diverse destinations and convenient access. However, SHAP reveals a wide dispersion in the contributions of land use mix, particularly at high levels, indicating that greater functional blending does not necessarily promote running activity. A similar antagonistic effect was observed where strong mixtures dominated by life-service uses became less appealing for outdoor engagement [77]. GWR adds a spatial layer to these results: strong positive effects concentrate in vibrant mixed-use and transit-rich clusters near major parks and commercial centers, while outer areas show weaker impacts. This core-periphery structure aligns with the findings of Liu et al. [95].
Overall, the integration of OLS, SHAP, and GWR establishes a coherent multi-model perspective on how the built environment influences running-space selection. The combined evidence highlights not only the global regularities captured by OLS but also the nonlinear responses and spatial variations revealed by SHAP and GWR. Rather than isolating the contribution of each model, the analysis uncovers both the stability and the contextual adaptability of environmental influences, demonstrating that running preferences emerge from the joint operation of global trends, behavioral nonlinearities, and spatial heterogeneity.
6.2. The Differential Results of Old District and New District
Different types of urban forms play a crucial role in shaping behavioral and environmental outcomes, not only across different cities [96] but also within the internal structure of a single city [97]. The comparative analysis between Gusu District (the historic core) and Industrial Park District (the contemporary new district) reveals significant spatial heterogeneity in the environmental determinants of running-space selection, further enriching the growing evidence on intra-urban variation in built environment effects reported in previous research [84,98,99]. These variations stem primarily from the contrasting urban morphologies, land use structures, and planning paradigms of the two areas, and are mainly reflected in the following aspects.
In terms of density, the effect of population density differs notably. In Gusu District, high population density correlates with a negative influence on running-space selection, possibly due to overcrowding, limited spatial openness, and constrained pedestrian environments of historical urban fabrics. Conversely, in Industrial Park District, higher population density tends to enhance the vibrancy of the environment, thereby exerting a positive effect. This divergence aligns with recent findings that behavioral effects of population density vary markedly across contexts and intensity levels, whereby excessive crowding, demographic group sensitivities, or cross-factor interactions offset the benefits of accessibility and vibrancy [78,84,99,100].
The sky index further underscores this contrast. In Industrial Park District, a higher sky index significantly promotes running behavior, as wider streets and planned openness provide visual relief and psychological relaxation. This result is consistent with findings that momentary well-being tends to increase with nature exposure such as seeing the sky [101]. Conversely, a higher sky index shows a negative association with running activity in Gusu District, which reflects the moderating role of sociocultural and experiential factors in shaping responses to environmental openness [102]. The enclosed, compact urban morphology of Gusu may foster a sense of spatial intimacy and cultural immersion that aligns well with running behavior in historically dense areas. Moreover, the sky index may also reflect other co-occurring elements in the visual field, such as greenery and artificial surfaces [86], whose differing spatial associations may further contribute to the opposite effects observed.
A similar pattern is also observed in the green index. Although greenery is generally perceived as beneficial, its effect is context-dependent. In Industrial Park District, greenery is often integrated with waterfront promenades and comfortable sidewalks, forming visually open spaces that encourage running activity. Such environments not only improve microclimatic conditions, reduce noise, and mitigate pollution [103,104,105], but also offer esthetically pleasant and restorative settings that foster relaxation and happiness [88,106]. In Gusu District, however, high green index values in urban-rural transitional areas often stem from dense street trees along narrow sidewalks, which obstruct movement and impair the continuity of running routes. Similar findings have shown that excessive greenery is not always beneficial, possibly because dense or poorly managed vegetation hinders open space usability [76,107], reduces visibility and perceived safety at night [77,108], and weakens opportunities for social interaction [109].
These findings indicate that built environment factors must be contextually calibrated when applied to areas with distinct histories and planning logics. Such factors may influence behavior through different mechanisms and can produce contrasting outcomes depending on variations in urban form, functional diversity, and design strategies.
6.3. Planning Implications for Historic and Modern Districts
Building upon the comparative findings above, this section translates the identified patterns into actionable planning implications. Across both districts, several common directions can be drawn. First, enhancing the connectivity of street networks is essential for improving accessibility and spatial continuity, allowing pedestrians and runners to move safely and comfortably through the urban fabric. Second, promoting mixed-use development helps sustain urban vitality and integrate active behaviors into everyday urban life by combining residential, commercial, and recreational functions within walkable distances. Third, natural and visual elements—such as parks, waterfronts, and greenery—should be planned with adequate quality, openness, and maintenance to enhance environmental comfort and usability.
Recognizing the spatially varying influences of built-environment factors, recent studies have underscored the need for planning measures that respond to local conditions rather than adopting one-size-fit-all solutions [84,99,110]. Accordingly, more context-specific strategies are proposed below for the two districts.
In the compact and enclosed urban fabric of historic Gusu District, planning interventions should prioritize micro-scale refinements that improve continuity, perceived safety, and spatial comfort along narrow lanes. Given that higher population density shows locally negative effects, urban design strategies should mitigate overcrowding and improve perceived spaciousness—through selective street widening, removal of obstacles, and better visibility along pedestrian routes—while maintaining the district’s human-scale enclosure. The stronger benefits of street and intersection density, together with the highly positive influence of accessibility, highlight the value of a fine-grained, pedestrian-oriented network. Convenient transit access and adequate parking supply can further support running activities, making such configurations especially effective here. Vegetation management is also essential: trimming over-dense canopies, introducing low-height planting or vertical greening, and improving waterfront access can preserve the historical atmosphere while enhancing visual openness and continuity.
In contrast, planning priorities in the modern Industrial Park District should shift toward large-scale spatial integration that links open landscapes, green-blue corridors, and mixed-use areas into a coherent urban fabric. The pronounced positive effects of natural openness suggest that planning should strengthen spatial permeability, visual continuity, and accessibility to major parks and waterfronts. To this end, continuous promenades and wide view corridors should be established and enriched with greenery, shading, resting facilities, and proper environmental maintenance. Meanwhile, moderate population density supported by multifunctional development should be encouraged to foster human activity and social vitality, ensuring that openness does not translate into emptiness. Additionally, the locally negative impacts of intersection density and traffic accessibility observed in some areas call for improving the pedestrian environment and safety around metro stations, parking areas, and busy intersections. Design efforts should focus on pedestrian-prioritized streets with protected crossings, efficient traffic organization, and landscape enhancements that reduce noise and air pollution while creating a more pleasant and accessible walking experience.
6.4. Limitations and Future Research
Although this study provides new insights into the spatial determinants of running-space selection, several limitations should be acknowledged. First, the analysis relies on Strava heatmap data, derived from a self-selected user population that tends to be younger, more affluent, and more technology-oriented than the general public. As a result, the quantified spatial patterns may underrepresent groups less inclined to use mobile fitness applications, introducing demographic bias in representing the overall running population. Moreover, the heatmap is an aggregated visualization rather than individual-level trajectory data; it reflects relative activity intensity instead of exact running counts. While the derived spatial patterns are internally consistent, their external validity would benefit from triangulation with ground-truth observations or manual counts of exercising behaviors in selected areas. If finer-grained individual data from other fitness applications (e.g., Keep) were available, they would help validate and extend the current findings by revealing behavioral differences across runner groups underlying the aggregated spatial patterns. In addition, complementary questionnaire surveys and structured interviews with actual runners could provide subjective information—such as perceived environmental quality, satisfaction, and motivational factors—that would further aid in interpreting the behavioral patterns observed from the data. Future research could integrate such data sources to enhance the robustness and representativeness of the observed results.
Second, this study explicitly excluded the dimension of destination accessibility, focusing on recreational jogging not aimed at a particular place. This decision represents a limitation, as some Strava records may involve runs with implicit destinations, and even non-purposeful runs can be influenced by amenities along the way, such as restrooms, water fountains, and convenience stores offering drinks and snacks for post-run replenishment. Future research could therefore incorporate additional destination-related factors to better capture these behavioral mechanisms.
Finally, future research could extend beyond the spatial scope of this study in two main directions. Recent research employing Geographically and Temporally Weighted Regression (GTWR) has demonstrated its potential to capture dynamic behavioral responses to changing urban environments [110]. Building on this progress, incorporating temporal dimensions—such as time-of-day variations, seasonal dynamics, or weather conditions—would help reveal how the attractiveness of running environments changes over time. Second, while this study focuses on Suzhou as a representative case of Chinese urban settings, comparative analyses across other Chinese cities and international contexts would be valuable for exploring how different cultural and environmental backgrounds shape running-space preferences. Such studies would also help verify the robustness and generalizability of the analytical framework proposed in this research.
7. Conclusions
This study examined how built environment factors shape running-space selection across two distinct urban contexts: the historic Gusu District and the modern Industrial Park District in Suzhou. The analysis integrated the traditional 5Ds framework with newly introduced visual-perception metrics, applying linear regression, interpretable machine learning, and geographically weighted regression within a unified analytical framework. The results revealed both consistent and context-dependent effects: while factors such as street density and mixed land use generally promote running activity, several variables—most notably population density, sky index, and green index—show pronounced spatial heterogeneity in their effects.
These differentiated patterns highlight that effective planning for urban running environments should combine shared principles with context-specific adaptations. Enhancing network connectivity, integrating mixed land uses, and improving the quality of natural and visual environments form the common foundation for both historic and modern districts. However, their implementation must respond to spatial form: compact historical areas benefit from refined, micro-scale design improvements that enhance continuity and comfort, whereas modern districts rely on macro-scale integration of openness, greenery, and multifunctional land uses to sustain vibrant and inclusive spaces.
Beyond their local implications, the methods and insights developed in this study contribute to a broader evidence base for advancing health-oriented, perception-informed, and human-centered urban design in rapidly urbanizing contexts.
Author Contributions
Conceptualization, C.W., J.X. and Y.M.; methodology, C.W., J.X. and Y.M.; software, C.W. and J.X.; validation, C.W. and Y.M.; formal analysis, C.W. and J.X.; investigation, J.X.; resources, J.X. and Y.M.; data curation, C.W. and J.X.; writing—original draft preparation, C.W. and J.X.; writing—review and editing, C.W., J.X. and Y.M.; visualization, J.X.; supervision, C.W. and Y.M.; project administration, C.W. and Y.M.; funding acquisition, C.W. and Y.M. All authors have read and agreed to the published version of the manuscript.
Funding
This research was funded by the National Natural Science Foundation of China (Grant Nos. 52208078 and 42571297).
Data Availability Statement
The raw data supporting the conclusions of this article will be made available by the authors on request.
Conflicts of Interest
The authors declare no conflict of interest.
References
- World Health Organization. Global Status Report on Physical Activity 2022; World Health Organization: Geneva, Switzerland, 2022. [Google Scholar]
- Guthold, R.; Stevens, G.A.; Riley, L.M.; Bull, F.C. Worldwide trends in insufficient physical activity from 2001 to 2016: A pooled analysis of 358 population-based surveys with 1.9 million participants. Lancet Glob. Health 2018, 6, 1077–1086. [Google Scholar] [CrossRef]
- Booth, F.W.; Roberts, C.K.; Laye, M.J. Lack of exercise is a major cause of chronic diseases. Compr. Physiol. 2012, 2, 1143. [Google Scholar] [CrossRef]
- Lee, D.C.; Brellenthin, A.G.; Thompson, P.D.; Sui, X.; Lee, I.M.; Lavie, C.J. Running as a key lifestyle medicine for longevity. Prog. Cardiovasc. Dis. 2017, 60, 45–55. [Google Scholar] [CrossRef] [PubMed]
- Oja, P.; Memon, A.R.; Titze, S.; Jurakic, D.; Chen, S.T.; Shrestha, N.; Pedisic, Z. Health benefits of different sports: A systematic review and meta-analysis of longitudinal and intervention studies including 2.6 million adult participants. Sports Med.-Open 2024, 10, 46. [Google Scholar] [CrossRef] [PubMed]
- Lavie, C.J.; Lee, D.C.; Sui, X.; Arena, R.; O’Keefe, J.H.; Church, T.S.; Blair, S.N. Effects of running on chronic diseases and cardiovascular and all-cause mortality. Mayo Clin. Proc. 2015, 90, 1541–1552. [Google Scholar] [CrossRef] [PubMed]
- Mouratidis, K. Urban planning and quality of life: A review of pathways linking the built environment to subjective well-being. Cities 2021, 115, 103229. [Google Scholar] [CrossRef]
- Belon, A.P.; Nieuwendyk, L.M.; Vallianatos, H.; Nykiforuk, C.I. How community environment shapes physical activity: Perceptions revealed through the photovoice method. Soc. Sci. Med. 2014, 116, 10–21. [Google Scholar] [CrossRef]
- Cattell, V.; Dines, N.; Gesler, W.; Curtis, S. Mingling, observing, and lingering: Everyday public spaces and their implications for well-being and social relations. Health Place 2008, 14, 544–561. [Google Scholar] [CrossRef]
- Chen, H.; Chen, C.; Spanos, M.; Li, G.; Lu, R.; Bei, Y.; Xiao, J. Exercise training maintains cardiovascular health: Signaling pathways involved and potential therapeutics. Signal Transduct. Target. Ther. 2022, 7, 306. [Google Scholar] [CrossRef]
- Fitzgerald, L. Exercise and the immune system. Immunol. Today 1988, 9, 337–339. [Google Scholar] [CrossRef]
- Montesi, L.; Moscatiello, S.; Malavolti, M.; Marzocchi, R.; Marchesini, G. Physical activity for the prevention and treatment of metabolic disorders. Intern. Emerg. Med. 2013, 8, 655–666. [Google Scholar] [CrossRef]
- Oja, P.; Titze, S.; Kokko, S.; Kujala, U.M.; Heinonen, A.; Kelly, P.; Koski, P.; Foster, C. Health benefits of different sport disciplines for adults: Systematic review of observational and intervention studies with meta-analysis. Br. J. Sports Med. 2015, 49, 434–440. [Google Scholar] [CrossRef]
- Lee, D.; Pate, R.R.; Lavie, C.J.; Sui, X.; Church, T.S.; Blair, S.N. Leisure-time running reduces all-cause and cardiovascular mortality risk. J. Am. Coll. Cardiol. 2014, 64, 472–481. [Google Scholar] [CrossRef] [PubMed]
- Pedisic, Z.; Shrestha, N.; Kovalchik, S.; Stamatakis, E.; Liangruenrom, N.; Grgic, J.; Titze, S.; Biddle, S.J.; Bauman, A.E.; Oja, P. Is running associated with a lower risk of all-cause, cardiovascular and cancer mortality, and is the more the better? a systematic review and meta-analysis. Br. J. Sports Med. 2020, 54, 898–905. [Google Scholar] [CrossRef] [PubMed]
- Herbert, C. Enhancing mental health, well-being and active lifestyles of university students by means of physical ac-tivity and exercise research programs. Front. Public Health 2022, 10, 849093. [Google Scholar] [CrossRef] [PubMed]
- Fox, K.R. The influence of physical activity on mental well-being. Public Health Nutr. 1999, 2, 411–418. [Google Scholar] [CrossRef]
- Carek, P.J.; Laibstain, S.E.; Carek, S.M. Exercise for the treatment of depression and anxiety. Int. J. Psychiatry Med. 2011, 41, 15–28. [Google Scholar] [CrossRef]
- Kvam, S.; Kleppe, C.L.; Nordhus, I.H.; Hovland, A. Exercise as a treatment for depression: A meta-analysis. J. Affect. Disord. 2016, 202, 67–86. [Google Scholar] [CrossRef]
- Schuch, F.B.; Vancampfort, D.; Richards, J.; Rosenbaum, S.; Ward, P.B.; Stubbs, B. Exercise as a treatment for depression: A meta-analysis adjusting for publication bias. J. Psychiatr. Res. 2016, 77, 42–51. [Google Scholar] [CrossRef]
- Noetel, M.; Sanders, T.; Gallardo-Gómez, D.; Taylor, P.; Del Pozo Cruz, B.; van den Hoek, D.; Smith, J.J.; Mahoney, J.; Spathis, J.; Moresi, M.; et al. Effect of exercise for depression: Systematic review and network meta-analysis of randomised controlled trials. BMJ 2024, 384, e075847. [Google Scholar] [CrossRef]
- Yang, J.; Ju, F.Y.; Tian, Z.G. Sports and social interaction: Sports experiences and attitudes of the urban running community. Int. J. Environ. Res. Public Health 2022, 19, 14412. [Google Scholar] [CrossRef]
- Shipway, R.; Holloway, I.; Jones, I. Organisations, practices, actors, and events: Exploring inside the distance running social world. Int. Rev. Sociol. Sport 2013, 48, 259–276. [Google Scholar] [CrossRef]
- Filo, K.; Funk, D.C.; O’Brien, D. The meaning behind attachment: Exploring camaraderie, cause, and competency at a charity sport event. J. Sport Manag. 2009, 23, 361–387. [Google Scholar] [CrossRef]
- Scheerder, J.; Breedveld, K.; Borgers, J. (Eds.) Running Across Europe: The Rise and Size of One of the Largest Sport Markets; Palgrave Macmillan: London, UK, 2015; ISBN 978-1-349-49601-3. [Google Scholar]
- Ryan, R.M.; Deci, E.L. Intrinsic and extrinsic motivations: Classic definitions and new directions. Contemp. Educ. Psychol. 2000, 25, 54–67. [Google Scholar] [CrossRef] [PubMed]
- Sebire, S.J.; Standage, M.; Vansteenkiste, M. Examining intrinsic versus extrinsic exercise goals: Cognitive, affective, and behavioral outcomes. J. Sport Exerc. Psychol. 2009, 31, 189–210. [Google Scholar] [CrossRef]
- Vallerand, R.J. From motivation to passion: In search of the motivational processes involved in a meaningful life. Can. Psychol. Can. 2012, 53, 42. [Google Scholar] [CrossRef]
- Richard, M.; Christina, M.F.; Deborah, L.S.; Rubio, N.; Kennon, M.S. Intrinsic motivation and exercise adherence. Int. J. Sport Psychol. 1997, 28, 335–354. [Google Scholar]
- Ingledew, D.K.; Markland, D. The role of motives in exercise participation. Psychol. Health 2008, 23, 807–828. [Google Scholar] [CrossRef]
- Rodriguez, K.M. Intrinsic and extrinsic factors affecting patient engagement in diabetes self-management: Perspectives of a certified diabetes educator. Clin. Ther. 2013, 35, 170–178. [Google Scholar] [CrossRef]
- Xie, M.; Feng, Z.; Long, W.; Wang, S.; Liu, X.; Ji, G.; Guo, X. What are the environmental preferences of runners? evidence from Guangzhou. Appl. Geogr. 2025, 174, 103469. [Google Scholar] [CrossRef]
- Yang, W.; Hu, J.; Liu, Y.; Guo, W. Examining the influence of neighborhood and street-level built environment on fitness jogging in chengdu, china: A massive gps trajectory data analysis. J. Transp. Geogr. 2023, 108, 103575. [Google Scholar] [CrossRef]
- Huang, D.; Jiang, B.; Yuan, L. Analyzing the effects of nature exposure on perceived satisfaction with running routes: An activity path-based measure approach. Urban For. Urban Green. 2022, 68, 127480. [Google Scholar] [CrossRef]
- Laddu, D.; Paluch, A.E.; LaMonte, M.J. The role of the built environment in promoting movement and physical activity across the lifespan: Implications for public health. Prog. Cardiovasc. Dis. 2021, 64, 33–40. [Google Scholar] [CrossRef] [PubMed]
- Badland, H.; Schofield, G. Transport, urban design, and physical activity: An evidence-based update. Transp. Res. Part Transp. Environ. 2005, 10, 177–196. [Google Scholar] [CrossRef]
- Lopez, R.P.; Hynes, H.P. Obesity, physical activity, and the urban environment: Public health research needs. Environ. Health 2006, 5, 25. [Google Scholar] [CrossRef]
- Molnar, B.E.; Gortmaker, S.L.; Bull, F.C.; Buka, S.L. Unsafe to play? neighborhood disorder and lack of safety predict reduced physical activity among urban children and adolescents. Am. J. Health Promot. 2004, 18, 378–386. [Google Scholar] [CrossRef]
- Zeng, Q.; Bao, X.; Dewancker, B.J. Association between built environment on transport and recreational walking in japan: The case of kitakyushu. City Built Environ. 2023, 1, 10. [Google Scholar] [CrossRef]
- Zhang, L.; Ye, Y.; Zeng, W.; Chiaradia, A. A systematic measurement of street quality through multi-sourced urban data: A human-oriented analysis. Int. J. Environ. Res. Public Health 2019, 16, 1782. [Google Scholar] [CrossRef]
- Cervero, R.; Kockelman, K. Travel demand and the 3Ds: Density, diversity, and design. Transp. Res. Part Transp. Environ. 1997, 2, 199–219. [Google Scholar] [CrossRef]
- Ewing, R.; Cervero, R. Travel and the built environment: A synthesis. Transp. Res. Rec. 2001, 1780, 87–114. [Google Scholar] [CrossRef]
- Ewing, R.; Cervero, R. Travel and the built environment: A meta-analysis. J. Am. Plann. Assoc. 2010, 76, 265–294. [Google Scholar] [CrossRef]
- Sallis, J.F.; Cerin, E.; Conway, T.L.; Adams, M.A.; Frank, L.D.; Pratt, M.; Owen, N. Physical activity in relation to urban environments in 14 cities worldwide: A cross-sectional study. Lancet 2016, 387, 2207–2217. [Google Scholar] [CrossRef] [PubMed]
- Huang, D.; Tian, M.; Yuan, L. Sustainable design of running friendly streets: Environmental exposures predict runnability by volunteered geographic information and multilevel model approaches. Sustain. Cities Soc. 2023, 89, 104336. [Google Scholar] [CrossRef]
- Wang, S.; Scheider, S.; Sporrel, K.; Deutekom, M.; Timmer, J.; Kröse, B. What are good situations for running? A machine learning study using mobile and geographical data. Front. Public Health 2021, 8, 536370. [Google Scholar] [CrossRef] [PubMed]
- Park, K.; Ewing, R.; Scheer, B.C.; Tian, G. The impacts of built environment characteristics of rail station areas on household travel behavior. Cities 2018, 74, 277–283. [Google Scholar] [CrossRef]
- Jiang, H.; Dong, L.; Qiu, B. How are macro-scale and micro-scale built environments associated with running activity? The application of Strava data and deep learning in inner London. ISPRS Int. J. Geo-Inf. 2022, 11, 504. [Google Scholar] [CrossRef]
- Wolf, I.D.; Wohlfart, T. Walking, hiking and running in parks: A multidisciplinary assessment of health and well-being benefits. Landsc. Urban Plan. 2014, 130, 89–103. [Google Scholar] [CrossRef]
- Song, L.; Zhang, A. Predict the suitable places to run in the urban area of beijing by using the maximum entropy model. ISPRS Int. J. Geo-Inf. 2021, 10, 534. [Google Scholar] [CrossRef]
- Handy, S. Regional versus local accessibility: Implications for nonwork travel. Transp. Res. Rec. 1993, 1400, 58–66. [Google Scholar]
- McCormack, G.R.; Giles-Corti, B.; Bulsara, M. The relationship between destination proximity, destination mix and physical activity behaviors. Prev. Med. 2008, 46, 33–40. [Google Scholar] [CrossRef]
- Cerin, E.; Conway, T.L.; Adams, M.A.; Barnett, A.; Cain, K.L.; Owen, N.; Sallis, J.F. Objectively-assessed neighbourhood destination accessibility and physical activity in adults from 10 countries: An analysis of moderators and perceptions as mediators. Soc. Sci. Med. 2018, 211, 282–293. [Google Scholar] [CrossRef]
- Zhou, W.; Liang, Z.; Fan, Z.; Li, Z. Spatio–temporal effects of built environment on running activity based on a random forest approach in Nanjing, China. Health Place 2024, 85, 103176. [Google Scholar] [CrossRef]
- Zhong, Q.; Li, B.; Jiang, B.; Dong, T. Unleashing the potential of urban jogging: Exploring the synergistic relationship of high-density environments and exercise on residents’ health. J. Clean. Prod. 2024, 466, 142882. [Google Scholar] [CrossRef]
- Lu, Y.; Yang, Y.; Sun, G.; Gou, Z. Associations between overhead-view and eye-level urban greenness and cycling behaviors. Cities 2019, 88, 10–18. [Google Scholar] [CrossRef]
- Lu, X.; Sun, L.; Zhang, Y.; Du, J.; Wang, G.; Huang, X.; Wang, X. Predicting cd accumulation in crops and iden-tifying nonlinear effects of multiple environmental factors based on machine learning models. Sci. Total Environ. 2024, 951, 175787. [Google Scholar] [CrossRef] [PubMed]
- Tang, Y.; Kurths, J.; Lin, W.; Ott, E.; Kocarev, L. Introduction to focus issue: When machine learning meets complex systems: Networks, chaos, and nonlinear dynamics. Chaos Interdiscip. J. Nonlinear Sci. 2020, 30, 063151. [Google Scholar] [CrossRef]
- Ryo, M.; Rillig, M.C. Statistically reinforced machine learning for nonlinear patterns and variable interactions. Ecosphere 2017, 8, 01976. [Google Scholar] [CrossRef]
- Lu, Y.; Chen, Q.; Yu, M.; Wu, Z.; Huang, C.; Fu, J.; Yao, J. Exploring spatial and environmental heterogeneity affecting energy consumption in commercial buildings using machine learning. Sustain. Cities Soc. 2023, 95, 104586. [Google Scholar] [CrossRef]
- Zhang, T.; Lin, Z.; Wang, L.; Zhang, W.; Zhang, Y.; Hu, Y. The heterogeneous effects of microscale-built environ-ments on land surface temperature based on machine learning and street view images. Atmosphere 2024, 15, 549. [Google Scholar] [CrossRef]
- Han, C.; Zhou, L.; Zhou, T. How does the built environment affect hotel prices? A study using multiscale gwr and deep learning. J. Asian Archit. Build. Eng. 2024, 23, 1717–1734. [Google Scholar] [CrossRef]
- Huang, X.; Lu, G.; Yin, J.; Tan, W. Non-linear associations between the built environment and the physical activity of children. Transp. Res. Part Transp. Environ. 2021, 98, 102968. [Google Scholar] [CrossRef]
- Schaefer-McDaniel, N.; Dunn, J.R.; Minian, N.; Katz, D. Rethinking measurement of neighborhood in the context of health research. Soc. Sci. Med. 2010, 71, 651–656. [Google Scholar] [CrossRef]
- Spittaels, H.; Foster, C.; Oppert, J.M.; Rutter, H.; Oja, P.; Sjöström, M.; Bourdeaudhuij, I. Assessment of envi-ronmental correlates of physical activity: Development of a european questionnaire. Int. J. Behav. Nutr. Phys. Act. 2009, 6, 39. [Google Scholar] [CrossRef]
- Wang, R.; Liu, Y.; Lu, Y.; Yuan, Y.; Zhang, J.; Liu, P.; Yao, Y. The linkage between the perception of neighbourhood and physical activity in guangzhou, china: Using street view imagery with deep learning techniques. Int. J. Health Geogr. 2019, 18, 18. [Google Scholar] [CrossRef] [PubMed]
- Breyer, B.; Cummings, C.; Hoang, K.; Ng, V. Greenspace moderates heat avoidance in physical activity during extreme heat: Evidence from strava data in houston, texas. J. Transp. Health 2025, 43, 102058. [Google Scholar] [CrossRef]
- Zhao, H.; Shi, J.; Qi, X.; Wang, X.; Jia, J. Pyramid scene parsing network. In Proceedings of the IEEE Conference on Computer Vision and Pattern Recognition (CVPR), Honolulu, HI, USA, 21–26 July 2017; pp. 2881–2890. [Google Scholar]
- Shi, Q.; Zhu, J.; Liu, Z.; Guo, H.; Liu, M.; Liu, Z.; Liu, X. A First High-Quality Vector Data of Buildings in East Asian Countries Based on a Comprehensive Large-Scale Mapping Framework. 2023. Available online: https://doi.org/10.5281/zenodo.8174931 (accessed on 20 November 2024).
- Li, X.; Li, B.; Su, Y. Temporal evolution of multi-dimensional built environment perceptions and street vitality: A longitudinal analysis in rapidly urbanizing cities. Sustainability 2025, 17, 8428. [Google Scholar] [CrossRef]
- Zhang, Y.; Wang, X.; Ye, Y.; Wang, L.; Zhang, Y.; Qin, W.; Chi, Y.; Liu, G.; Yao, S. Nonlinear relationships and interaction effects of urban built environment on urban vitality based on explainable machine learning. City Environ. Interact. 2025, 28, 100244. [Google Scholar] [CrossRef]
- Soltani, A.; Heydari, M.; Aghaei, F.; Pettit, C.J. Housing price prediction incorporating spatio-temporal dependency into machine learning algorithms. Cities 2022, 131, 103941. [Google Scholar] [CrossRef]
- Cerin, E.; Nathan, A.; van Cauwenberg, J.; Barnett, D.W.; Barnett, A.; on behalf of the Council on Environment and Physical Activity (CEPA)—Older Adults working group. The neighbourhood physical environment and active travel in older adults: A systematic review and meta-analysis. Int. J. Behav. Nutr. Phys. Act. 2017, 14, 15. [Google Scholar] [CrossRef]
- Grasser, G.; Van Dyck, D.; Titze, S.; Stronegger, W. Objectively measured walkability and active transport and weight-related outcomes in adults: A systematic review. Int. J. Public Health 2013, 58, 615–625. [Google Scholar] [CrossRef]
- Horak, J.; Kukuliac, P.; Maresova, P.; Orlikova, L.; Kolodziej, O. Spatial pattern of the walkability index, walk score and walk score modification for elderly. ISPRS Int. J. Geo-Inf. 2022, 11, 279. [Google Scholar] [CrossRef]
- Zhang, C.; Shi, D.; Xiao, Z. Integrating variable importance and spatial heterogeneity to reveal the environmental effects on outdoor jogging. Comput. Urban Sci. 2024, 4, 45. [Google Scholar] [CrossRef]
- He, S.; Zhang, Z.; Yu, S.; Xia, C.; Tung, C.-L. Investigating the effects of urban morphology on vitality of community life circles using machine learning and geospatial approaches. Appl. Geogr. 2024, 167, 103287. [Google Scholar] [CrossRef]
- Yang, Y.; He, D.; Gou, Z.; Wang, R.; Liu, Y.; Lu, Y. Association between street greenery and walking behavior in older adults in Hong Kong. Sustain. Cities Soc. 2019, 51, 101747. [Google Scholar] [CrossRef]
- Balsas, C.J.L. Making hidden sustainable urban planning and landscape knowledge visual and multisensorial. Land 2025, 14, 1. [Google Scholar] [CrossRef]
- Montgomery, J. Making a city: Urbanity, vitality and urban design. J. Urban Des. 1998, 3, 93–116. [Google Scholar] [CrossRef]
- Ye, Y.; Li, D.; Liu, X. How block density and typology affect urban vitality: An exploratory analysis in Shenzhen, China. Urban Geogr. 2018, 39, 631–652. [Google Scholar] [CrossRef]
- Chen, L.; Zhang, Z.; Long, Y. Association between leisure-time physical activity and the built environment in china: Empirical evidence from an accelerometer and GPS-based fitness app. PLoS ONE 2021, 16, e0260570. [Google Scholar] [CrossRef]
- Xu, Q.; Park, Y.; Huang, X.; Hollenbeck, A.; Blair, A.; Schatzkin, A.; Chen, H. Physical activities and future risk of parkinson disease. Neurology 2010, 75, 341–348. [Google Scholar] [CrossRef]
- Cheng, L.; Shi, K.; De Vos, J.; Cao, M.; Witlox, F. Examining the spatially heterogeneous effects of the built environment on walking among older adults. Transp. Policy 2021, 100, 21–30. [Google Scholar] [CrossRef]
- Ki, D.; Lee, S. Analyzing the effects of green view index of neighborhood streets on walking time using Google street view and deep learning. Landsc. Urban Plan. 2021, 205, 103920. [Google Scholar] [CrossRef]
- Qi, F.; Parra, A.O.; Block-Lerner, J.; McManus, J. Psychological impacts of urban environmental settings: A micro-scale study on a university campus. Urban Sci. 2024, 8, 73. [Google Scholar] [CrossRef]
- White, M.P.; Elliott, L.R.; Gascon, M.; Roberts, B.; Fleming, L.E. Blue space, health and well-being: A narrative overview and synthesis of potential benefits. Environ. Res. 2020, 191, 110169. [Google Scholar] [CrossRef] [PubMed]
- Gascon, M.; Triguero-Mas, M.; Martínez, D.; Dadvand, P.; Forns, J.; Plasència, A.; Nieuwenhuijsen, M.J. Mental health benefits of long-term exposure to residential green and blue spaces: A systematic review. Int. J. Environ. Res. Public Health 2015, 12, 4354–4379. [Google Scholar] [CrossRef] [PubMed]
- Li, B.; Zhang, H.; Yang, Y. Mapping environmental influences on walking behavior across urban morphologies: A local climate zone-based study. Urban Clim. 2025, 62, 102503. [Google Scholar] [CrossRef]
- Pasanen, T.P.; White, M.P.; Wheeler, B.W.; Garrett, J.K.; Elliott, L.R. Neighbourhood blue space, health and wellbeing: The mediating role of different types of physical activity. Environ. Int. 2019, 131, 105016. [Google Scholar] [CrossRef]
- Barreno, M.; Sisa, I.; García, M.C.Y.; Shen, H.; Villar, M.; Kovalskys, I.; Fisberg, M.; Gomez, G.; Rigotti, A.; Cortés, L.Y. Association between built environment and physical activity in latin american countries: A multicentre cross-sectional study. BMJ Open 2021, 11, e046271. [Google Scholar] [CrossRef]
- Fang, C.; He, S.; Wang, L. Spatial characterization of urban vitality and the association with various street network metrics from the multi-scalar perspective. Front. Public Health 2021, 9, 677910. [Google Scholar] [CrossRef]
- Kamruzzaman, M.; Washington, S.; Baker, D.; Brown, W.; Giles-Corti, B.; Turrell, G. Built environment impacts on walking for transport in brisbane, australia. Transportation 2016, 43, 53–77. [Google Scholar] [CrossRef]
- Kang, C.; Fan, D.; Jiao, H. Validating activity, time, and space diversity as essential components of urban vitality. Environ. Plan. B Urban Anal. City Sci. 2021, 48, 1180–1197. [Google Scholar] [CrossRef]
- Liu, S.; Zhang, L.; Long, Y.; Long, Y.; Xu, M. A new urban vitality analysis and evaluation framework based on human activity modeling using multi-source big data. ISPRS Int. J. Geo-Inf. 2020, 9, 617. [Google Scholar] [CrossRef]
- Xia, C.; Zhang, A.; Yeh, A.G.O. The varying relationships between multidimensional urban form and urban vitality in chinese megacities: Insights from a comparative analysis. Ann. Am. Assoc. Geogr. 2022, 112, 141–166. [Google Scholar] [CrossRef]
- Guyot, M.; Araldi, A.; Fusco, G.; Thomas, I. The urban form of brussels from the street perspective: The role of vegetation in the definition of the urban fabric. Landsc. Urban Plan. 2021, 205, 103947. [Google Scholar] [CrossRef]
- Jia, Q.; Zhang, T.; Cheng, L.; Cheng, G.; Jin, M. The impact of the neighborhood built environment on the walking activity of older adults: A multi-scale spatial heterogeneity analysis. Sustainability 2022, 14, 13927. [Google Scholar] [CrossRef]
- Wu, W.; Liu, X.; Zhou, Y.; Zhao, K. Spatial heterogeneity of built environment’s impact on urban vitality using multi-source big data and mgwr. Sci. Rep. 2025, 15, 23459. [Google Scholar] [CrossRef]
- Silva, C.; Xue, S. Situating spatial determinism in urban design and planning for sustainable walkability: A simulation of street morphology and pedestrian behaviour. Discov. Sustain. 2024, 5, 212. [Google Scholar] [CrossRef]
- Chen, Y.-R.; Nakagomi, A.; Hanazato, M.; Abe, N.; Ide, K.; Kondo, K. Perceived urban environment elements associated with momentary and long-term well-being: An experience sampling method approach. Sci. Rep. 2025, 15, 4422. [Google Scholar] [CrossRef]
- Jorgensen, A. Beyond the view: Future directions in landscape aesthetics research. Landsc. Urban Plan. 2011, 100, 353–355. [Google Scholar] [CrossRef]
- Reid, C.E.; Clougherty, J.E.; Shmool, J.L.; Kubzansky, L.D. Is all urban green space the same? A comparison of the health benefits of trees and grass in New York city. Int. J. Environ. Res. Public Health 2017, 14, 1411. [Google Scholar] [CrossRef]
- Sakamoto, S.; Kogure, M.; Hanibuchi, T.; Nakaya, N.; Hozawa, A.; Nakaya, T. Effects of greenery at different heights in neighbourhood streetscapes on leisure walking: A cross-sectional study using machine learning of streetscape images in Sendai city, Japan. Int. J. Health Geogr. 2023, 22, 29. [Google Scholar] [CrossRef]
- Tabatabaie, S.; Litt, J.S.; Carrico, A. A study of perceived nature, shade and trees and self-reported physical activity in Denver. Int. J. Environ. Res. Public Health 2019, 16, 3604. [Google Scholar] [CrossRef]
- Syamili, M.S.; Takala, T.; Korrensalo, A.; Tuittila, E.-S. Happiness in urban green spaces: A systematic literature review. Urban For. Urban Green. 2023, 86, 128042. [Google Scholar] [CrossRef]
- Zhou, C.; An, Y.; Zhao, J.; Xue, Y.; Fu, L. How do mini-parks serve in groups? A visit analysis of mini-park groups in the neighbourhoods of Nanjing. Cities 2022, 129, 103804. [Google Scholar] [CrossRef]
- Hartig, T.; Mitchell, R.; de Vries, S.; Frumkin, H. Nature and health. Annu. Rev. Public Health 2014, 35, 207–228. [Google Scholar] [CrossRef] [PubMed]
- Maas, J.; Van Dillen, S.M.; Verheij, R.A.; Groenewegen, P.P. Social contacts as a possible mechanism behind the relation between green space and health. Health Place 2009, 15, 586–595. [Google Scholar] [CrossRef]
- Di, X.; Zhang, J. Spatiotemporal heterogeneity of influencing factors for urban spaces suitable for running workouts based on multi-source big data. ISPRS Int. J. Geo-Inf. 2025, 14, 366. [Google Scholar] [CrossRef]
Disclaimer/Publisher’s Note: The statements, opinions and data contained in all publications are solely those of the individual author(s) and contributor(s) and not of MDPI and/or the editor(s). MDPI and/or the editor(s) disclaim responsibility for any injury to people or property resulting from any ideas, methods, instructions or products referred to in the content. |
© 2025 by the authors. Licensee MDPI, Basel, Switzerland. This article is an open access article distributed under the terms and conditions of the Creative Commons Attribution (CC BY) license (https://creativecommons.org/licenses/by/4.0/).