Article

Comparing the Current and Future Thermal Comfort Offered by Urban Park Configurations

Australian Urban Design Research Centre (AUDRC), School of Design, The University of Western Australia, Perth 6009, Australia
*
Author to whom correspondence should be addressed.
Land 2025, 14(11), 2172; https://doi.org/10.3390/land14112172
Submission received: 29 September 2025 / Revised: 23 October 2025 / Accepted: 30 October 2025 / Published: 31 October 2025

Abstract

There is growing interest in utilising urban parks as nature-based solutions to mitigate the effects of climate change and rising temperatures by improving thermal comfort. Nonetheless, understanding remains limited on how different park configurations influence summer thermal comfort, particularly under future warming scenarios. This novel study evaluates park configurations across different neighbourhood layouts within Perth’s Mediterranean climate under both present and future conditions. Study precincts were modelled and simulated using ENVI-met version 5.5 for an average current summer day, based on 25 years of local weather data and climate projections for 2090 under the Representative Concentration Pathway 8.5 scenario, representing the worst-case scenario. Results showed that park surfaces were consistently cooler than surrounding streets based on LST; however, this did not always translate into improved thermal comfort, as exposed grass areas often exhibited high Physiological Equivalent Temperature (PET) values. PET has been confirmed as the most suitable outdoor human thermal comfort index. Canopy cover and vegetation type, particularly tall trees and bushland, were more influential than park size or configuration in enhancing thermal comfort. These findings provide evidence-based insights, highlighting the importance of strategies that prioritise tree canopy coverage to enhance urban cooling and resilience to climate change.

1. Introduction

The projected climate-driven risks to people in cities and urban areas have increased significantly. The Intergovernmental Panel on Climate Change (IPCC) predicts a ‘highly challenging future’ for Australia, with significant disruptions expected for both human and natural systems [1]. Australian cities are particularly vulnerable to climate hazards, encompassing both gradual changes, such as rising temperatures, and extreme events, including heatwaves, floods, and bushfires. These changes threaten ecosystems that underpin social well-being, deliver essential health services, and provide protection against natural disasters [2]. Heatwaves represent one of Australia’s most severe natural hazards, causing more fatalities than all other natural disasters combined [3,4]. Under the high-emission SSP5-8.5 climate change scenario, annual temperatures in southern Western Australia (e.g., Perth) are projected to increase by 2.7 to 4.2 °C [5]. While this scenario is undoubtedly extreme [6], it offers valuable insights into potential temperature changes under more moderate emission pathways beyond 2100 (e.g., SSP3-7.0) and provides insights into the potential upper limits of thermal stress. This approach enables the evaluation of worst-case outcomes, thereby supporting urban planning and adaptation strategies that account for the most challenging future conditions.
Urban heat and the Urban Heat Island (UHI) effect are anticipated to worsen the heat-related impacts of climate change in cities. Driven by solar energy trapped by urban surfaces and heat emissions from air conditioners, the UHI effect intensifies heat stress, compounding challenges in urban areas [7]. Extreme heat significantly affects daily life by disrupting sleep, lowering productivity, and restricting outdoor activities [8]. Extreme heat further affects energy consumption as people retreat indoors, increasing demand for cooling systems and exacerbating public health concerns [9]. Additionally, heatwaves severely impact ecosystems critical to urban liveability and sustainability [10]. Addressing these interconnected challenges necessitates proactive and comprehensive strategies to reduce the impacts of extreme heat on individuals, communities, and the environment.

1.1. Nature-Based Solutions and Public Open Spaces

Nature-based solutions, particularly vegetation, are widely recognised for their effectiveness in mitigating UHI effects, enhancing climate adaptation, reducing heat intensity, and improving thermal comfort. Shade provision and transpiration are the primary mechanisms through which Public Open Spaces, especially parks, contribute to cooling via vegetation [11,12]. Trees capture solar energy by reflecting some radiation and absorbing some for photosynthesis, and reducing heat absorption by hard surfaces [13]. Evaporative cooling occurs through transpiration from plant stomata and evaporation from water bodies and soil surfaces [14]. As water evaporates, it absorbs heat, cooling the air and surrounding surfaces, helping to lower urban temperatures and mitigate the urban heat island effect [13].
The cooling benefits of urban parks, often described as the Park Cool Island (PCI) effect, refer to the phenomenon where temperatures within and around parks are lower than those in the surrounding urban environment [15,16,17,18,19]. Cooling Effect Distance (CED), also known as PCI extent, and Cooling Effect Intensity (CEI) are key metrics for quantifying the cooling impact of urban parks on their surroundings [20,21,22]. This cooling effect is primarily attributed to the presence of vegetation, water bodies, and other green infrastructure within the park. Studies have assessed PCI using Land Surface Temperature (LST) derived from remote sensing data [15,23,24], as well as air temperature and various human thermal comfort indices, primarily through modelling and, to a lesser extent, empirical observations [25,26]. These human thermal comfort indices are influenced by Mean Radiant Temperature (MRT), which is a function of the shortwave and longwave radiative fluxes at a particular location and is heavily influenced by exposure to direct solar radiation. Longwave radiation emitted from surfaces (including the ground) is one element of MRT and is reflected by LST. LST is a key indicator of surface heat, directly linked to the Urban Heat Island (UHI) effect, where urban areas experience higher temperatures than their rural and suburban surroundings due to heat-retaining materials and reduced vegetation [7].

1.2. Human Outdoor Thermal Comfort

Outdoor thermal comfort is an important factor influencing the use of urban parks and is of increasing concern to climatologists and urban planners [27]. Outdoor human thermal comfort is an environmental condition where a person feels comfortable and is neither hot nor cold [28]. It is typically evaluated using thermal comfort indices. These indices describe how the human body experiences atmospheric conditions and combine objective climatic and subjective human factors, including body type, activity level, and clothing [29].
Land Surface Temperature (LST) is commonly used to assess UHI intensity and reflects surface-level cooling. While previous research has applied LST to evaluate broader cooling effects beyond just surface cooling, thermal comfort indices focus on human thermal comfort and microclimate conditions, making them more relevant for assessing the impact of urban design and park configurations on perceived comfort.
The most common human thermal comfort indices explicitly designed for measuring levels of thermal comfort in outdoor environments are Physiological Equivalent Temperature (PET), Universal Thermal Climate Index (UTCI), and Outdoor Standard Effective Temperature (OUT_SET) [9,29,30,31]. PET has been confirmed by previous research as the most suitable index, due to its effectiveness in evaluating microclimates, its use of °C units easily understood by the public, and its broad applicability across diverse climates and large built environments [32]. PET reflects the air temperature at which the human body’s heat budget remains balanced under complex outdoor conditions, with the same core and skin temperatures as in a typical indoor setting without wind or solar radiation [33].

1.3. The Research Gap

The IPCC underscores that urban climate change adaptation is now “essential and urgent” [1]. Similarly, the United Nations’ Sustainable Development Goals (SDGs) emphasise the need for urgent action to address climate change and its impacts, aiming to make cities and human settlements more inclusive, safe, resilient, and sustainable [34]. Given the escalating risks of heatwaves in Australia [3,8], which is also expected to increase with rising temperatures, adapting cities to extreme heat is vital.
While a substantial body of research has examined factors such as park size, geometry, vegetation type, local climate, and biophysical conditions [15,20,21,35,36,37,38], there is limited understanding of how various park configurations affect their cooling benefits from an urban planning perspective. Additionally, most of the previous research on the cooling effects of parks is based on LST rather than human thermal comfort [39], and is conducted across different climate zones, which influence the cooling outcomes [40]. Moreover, very few studies have explored the cooling potential of parks in the context of future climate scenarios, highlighting a significant gap. This novel study presents a comparative analysis of the effectiveness and role of urban park configurations across various planning layouts. Using the microclimate simulation software ENVI-met version 5.5 to compare LST, Mean Radiant Temperature (MRT), and the PET human thermal comfort index to understand human thermal comfort, the research evaluates conditions under both present and future climate scenarios. It aims to provide evidence-based insights for planners, urban designers, and landscape architects regarding the impacts of climate change on existing urban parks. Accordingly, this paper addresses the following question:
What are the present and future cooling and microclimate conditions of various urban parks—including those resulting from Radburn planning, New Urbanism, Bush Forever policies, the Recreation movement, and the Public Parks movement, within the Mediterranean climate of Perth, Western Australia?

2. Materials and Methods

2.1. Study Context—Perth, Western Australia

Perth is the capital city of Western Australia and is defined as Csa (C: warm temperature, s: summer dry, a: hot summer) in the Koppen-Geiger climate classification [41]. Summers are usually hot and dry, spanning from December to March. In the hottest month (February), maximum daily temperatures frequently exceed 40 °C, with inner metropolitan suburbs being up to six degrees warmer than coastal suburbs [42]. By 2090, Perth is expected to experience warmer weather, characterised by an increase in heatwaves and a reduction in cool days [5]. Under the high-emission SSP5-8.5 climate change scenario, annual temperatures in southern Western Australia (e.g., Perth) are projected to increase by 2.7 to 4.2 °C [5] Additionally, annual rainfall in the region is projected to decline by—26% to 4%, while evapotranspiration may increase by 8% to 17% [43], exacerbating water stress and intensifying climate risks.

2.2. Case Studies

Five case studies were selected to represent different park case studies within 500 m × 500 m frames, based on key urban development approaches over the last 80 years in Perth, Western Australia. These sites are presented in Table 1. The selection of case studies reflects two levels of representativeness, including diverse urban and neighbourhood typologies as well as diverse approaches to park planning in Perth. These spaces are typically categorised based on their function (e.g., sport, recreation, and nature) and size (e.g., local: 0.4 ha to 1 ha, neighbourhood: 1 ha to 5 ha, district: 5 ha to 15+ ha, and regional: 20+ ha) [44]. A detailed explanation of each case study is provided below.

2.2.1. Public Park Movement Case Study

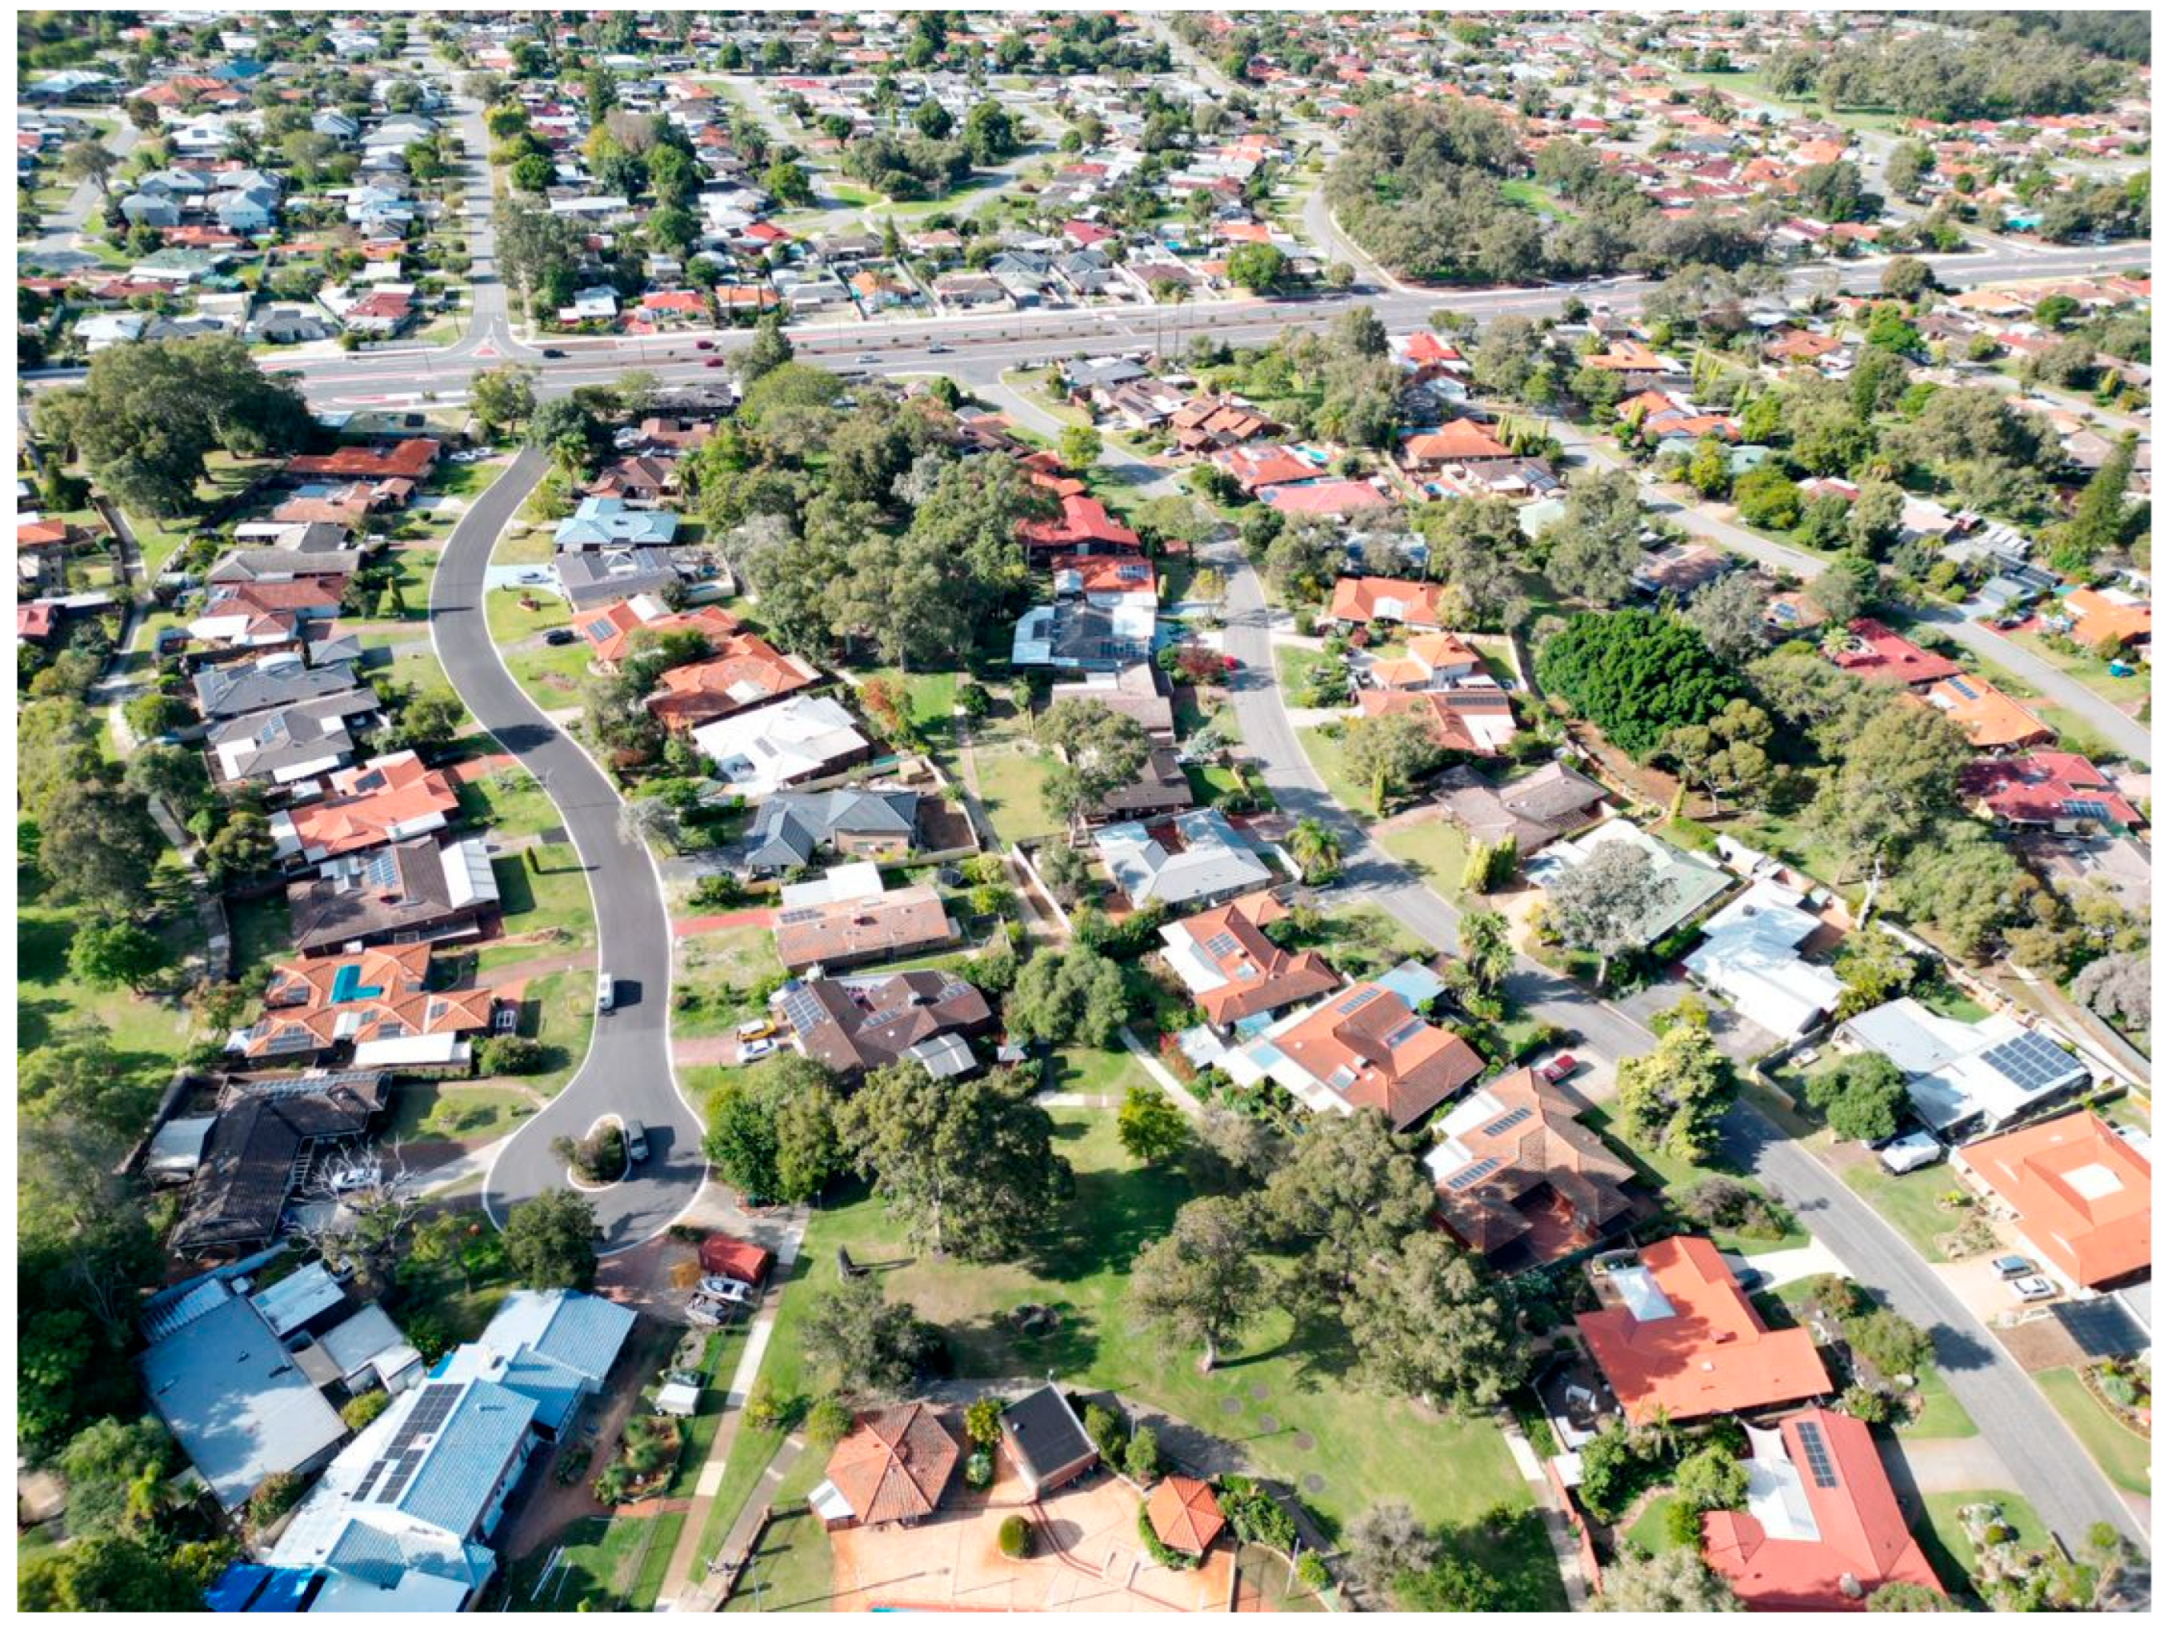
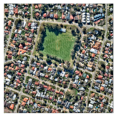
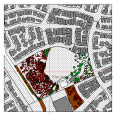
The Hyde Park case study in Highgate (Figure 1) exemplified the intricately designed landscaped parks of the late nineteenth century, often referred to as ‘pleasure grounds’ [45], and represented the public parks movement [46]. Covering an area of 15.5 hectares, with a canopy cover of 59.5%, and a grass cover of 18.7% [47], the study frame of 500 m by 500 m encompassed nearly half of the park. Hyde Park’s design reflects a pastoral approach, with shaded walking paths bordered by tree-lined avenues surrounding a central lake, originally a wetland. Hyde Park was classified as a ‘District Park’ [44]. There are 82 different types of trees in Hyde Park, primarily non-native trees, such as deciduous Platanus acerifolia, Ficus macrophylla, Washingtonia filifera, Xanthorrhoea preissii, Jacaranda mimosifolia, and native trees such as Eucalyptus gomphocephala and Agonis flexuosa. Recently, one Ficus rubiginosa and three Platanus acerifolia were removed due to shot hole borer infestation [48].

2.2.2. Recreation Movement Case Study

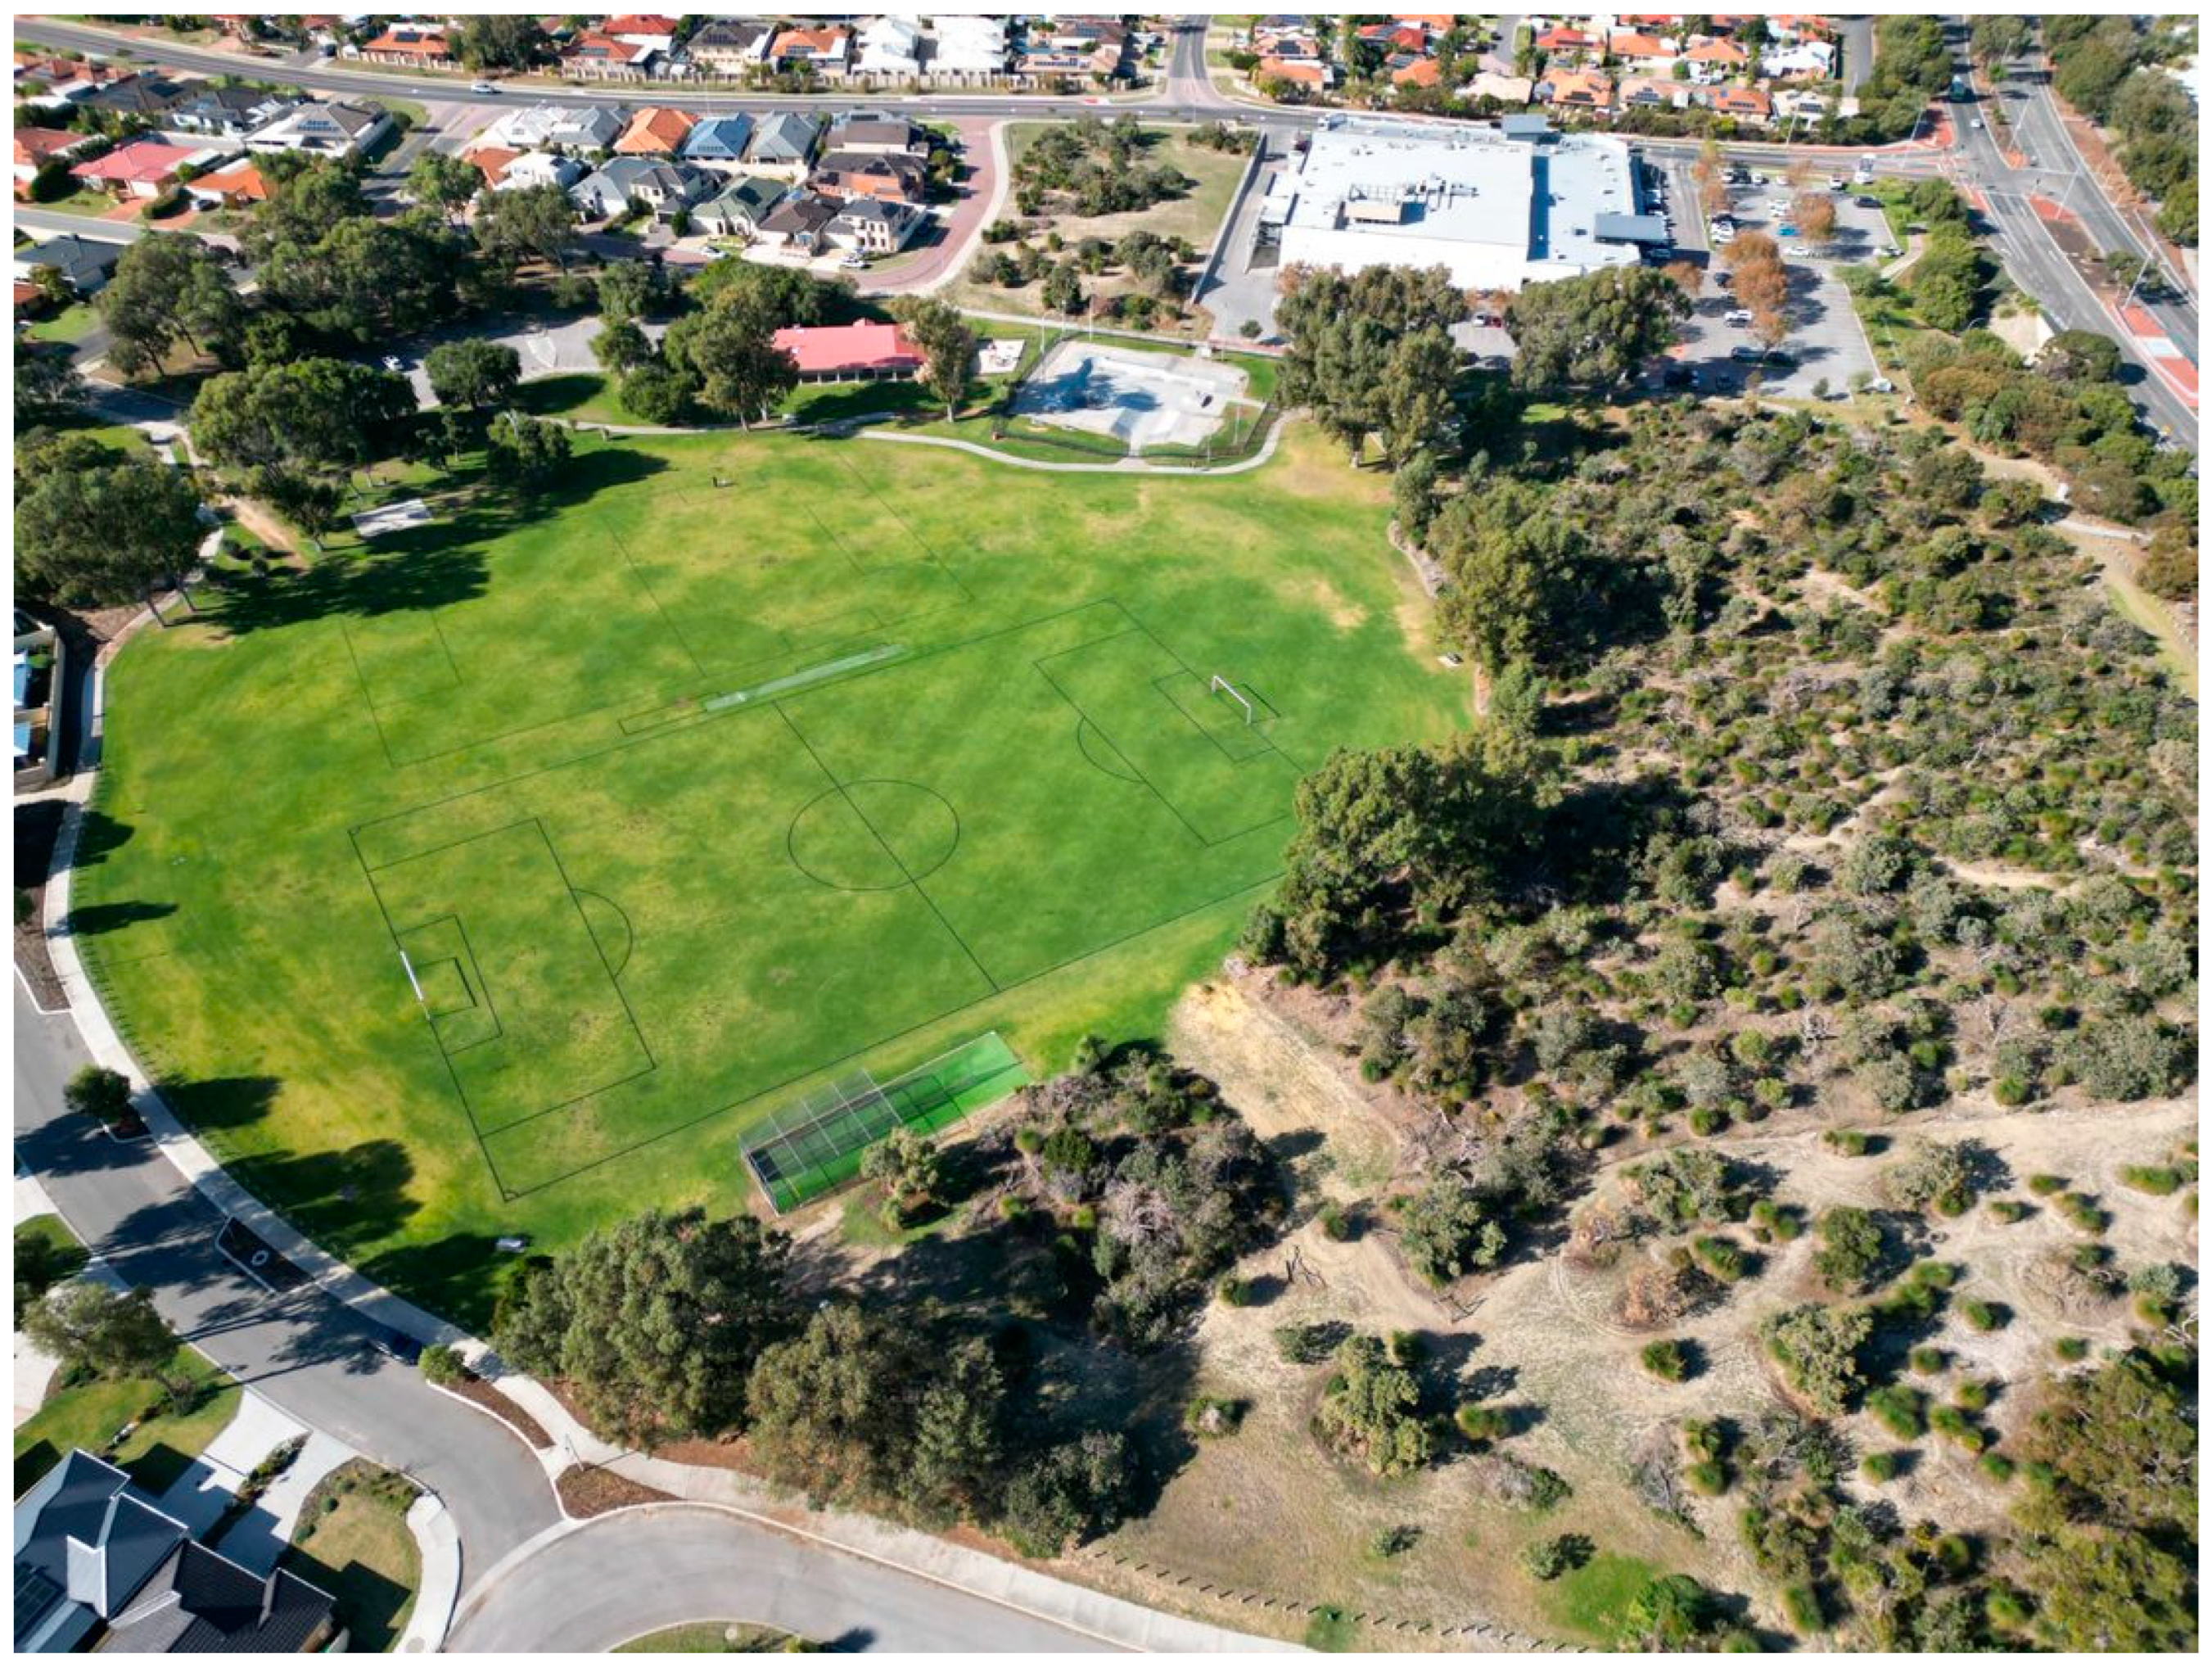
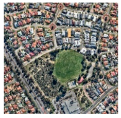
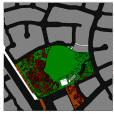
The Enright Reserve case study in Hamilton Hill (Figure 2) exemplified a typical older suburban park designed for sports use, covering an area of 3 hectares, with a canopy cover of 26.3% and grass cover of 53% [47]. The focus on active sports in parks originated from the ‘Recreation Movement’ [45], which gained prominence in mid-twentieth-century Australia, coinciding with significant growth in greyfield areas. This movement advocated for creating spaces where citizens could exercise, strengthen and discipline their bodies, ‘temper immoral impulses,’ and find an escape from urban life [45]. As a result, parks were transformed from the highly landscaped designs of the nineteenth and early twentieth centuries into spaces resembling sports fields. Parks in Perth’s greyfield (middle-ring) suburbs were characteristic of this movement, featuring limited vegetation, expansive irrigated lawns, and facilities tailored for team sports, including clubrooms, goal posts, and cricket pitches [45].

2.2.3. Radburn Linear Parks Case Study

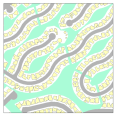
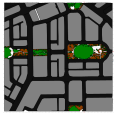
The linear parks in Crestwood (Figure 3) were designed according to principles of Radburn planning. Initially developed by Stein and Wright in Radburn, New Jersey, this approach separated vehicular and pedestrian traffic through internal landscaped spines that served as open spaces and pedestrian pathways [49]. The Crestwood Estate neighbourhood in Perth was developed in 1970 [50]. These open space spines in Crestwood include communal facilities, a significant tree canopy, and irrigated turf. Three species of native trees, Corymbia maculata, Nuytsia floribunda (Christmas Tree), and Melaleuca (Tea Tree), dominate these parks and are not permitted to be removed [50]. Crestwood Reserve parks were classified as ‘Local’ and ‘Neighbourhood Park’, ranging in size from 0.5 to 2.5 ha [44,51], with a tree canopy cover of 53.8% and grass cover of almost 20% [47].

2.2.4. Bush Forever Case Study

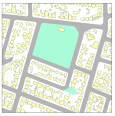
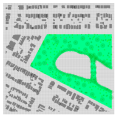
The MacNaughton Park case study in Kinross represents a larger, newer suburban park that includes a sports oval and surrounding remnant bushland (Figure 4), reflecting the principles of the Bush Forever policy introduced in the early 1990s. This policy aimed to conserve bushland areas within parks [52]. The park spans nearly 5 hectares, comprising approximately 3.5 hectares of recreational space and 1.5 hectares of bushland. Its canopy cover was 13.8%, and the grass cover was 33% [47]. Bush Forever was a policy framework designed to conserve and manage bushland on the coastal plain of the Perth Metropolitan Region [53]. The park featured an irrigated oval and predominantly native trees, such as Agonis flexuosa, Xanthorrhoea preissii (Grass Tree), Allocasuarina species, and Eucalyptus torquate, Eucalyptus leucoxylon megalacarpa, and Eucalyptus decipiens, which were notably larger compared to those in smaller parks at Butler. Classified as a ‘Neighbourhood Park’ under Western Australia’s public open space framework [44,51], the park also included clubrooms.

2.2.5. Neighbourhood Parks Case Study

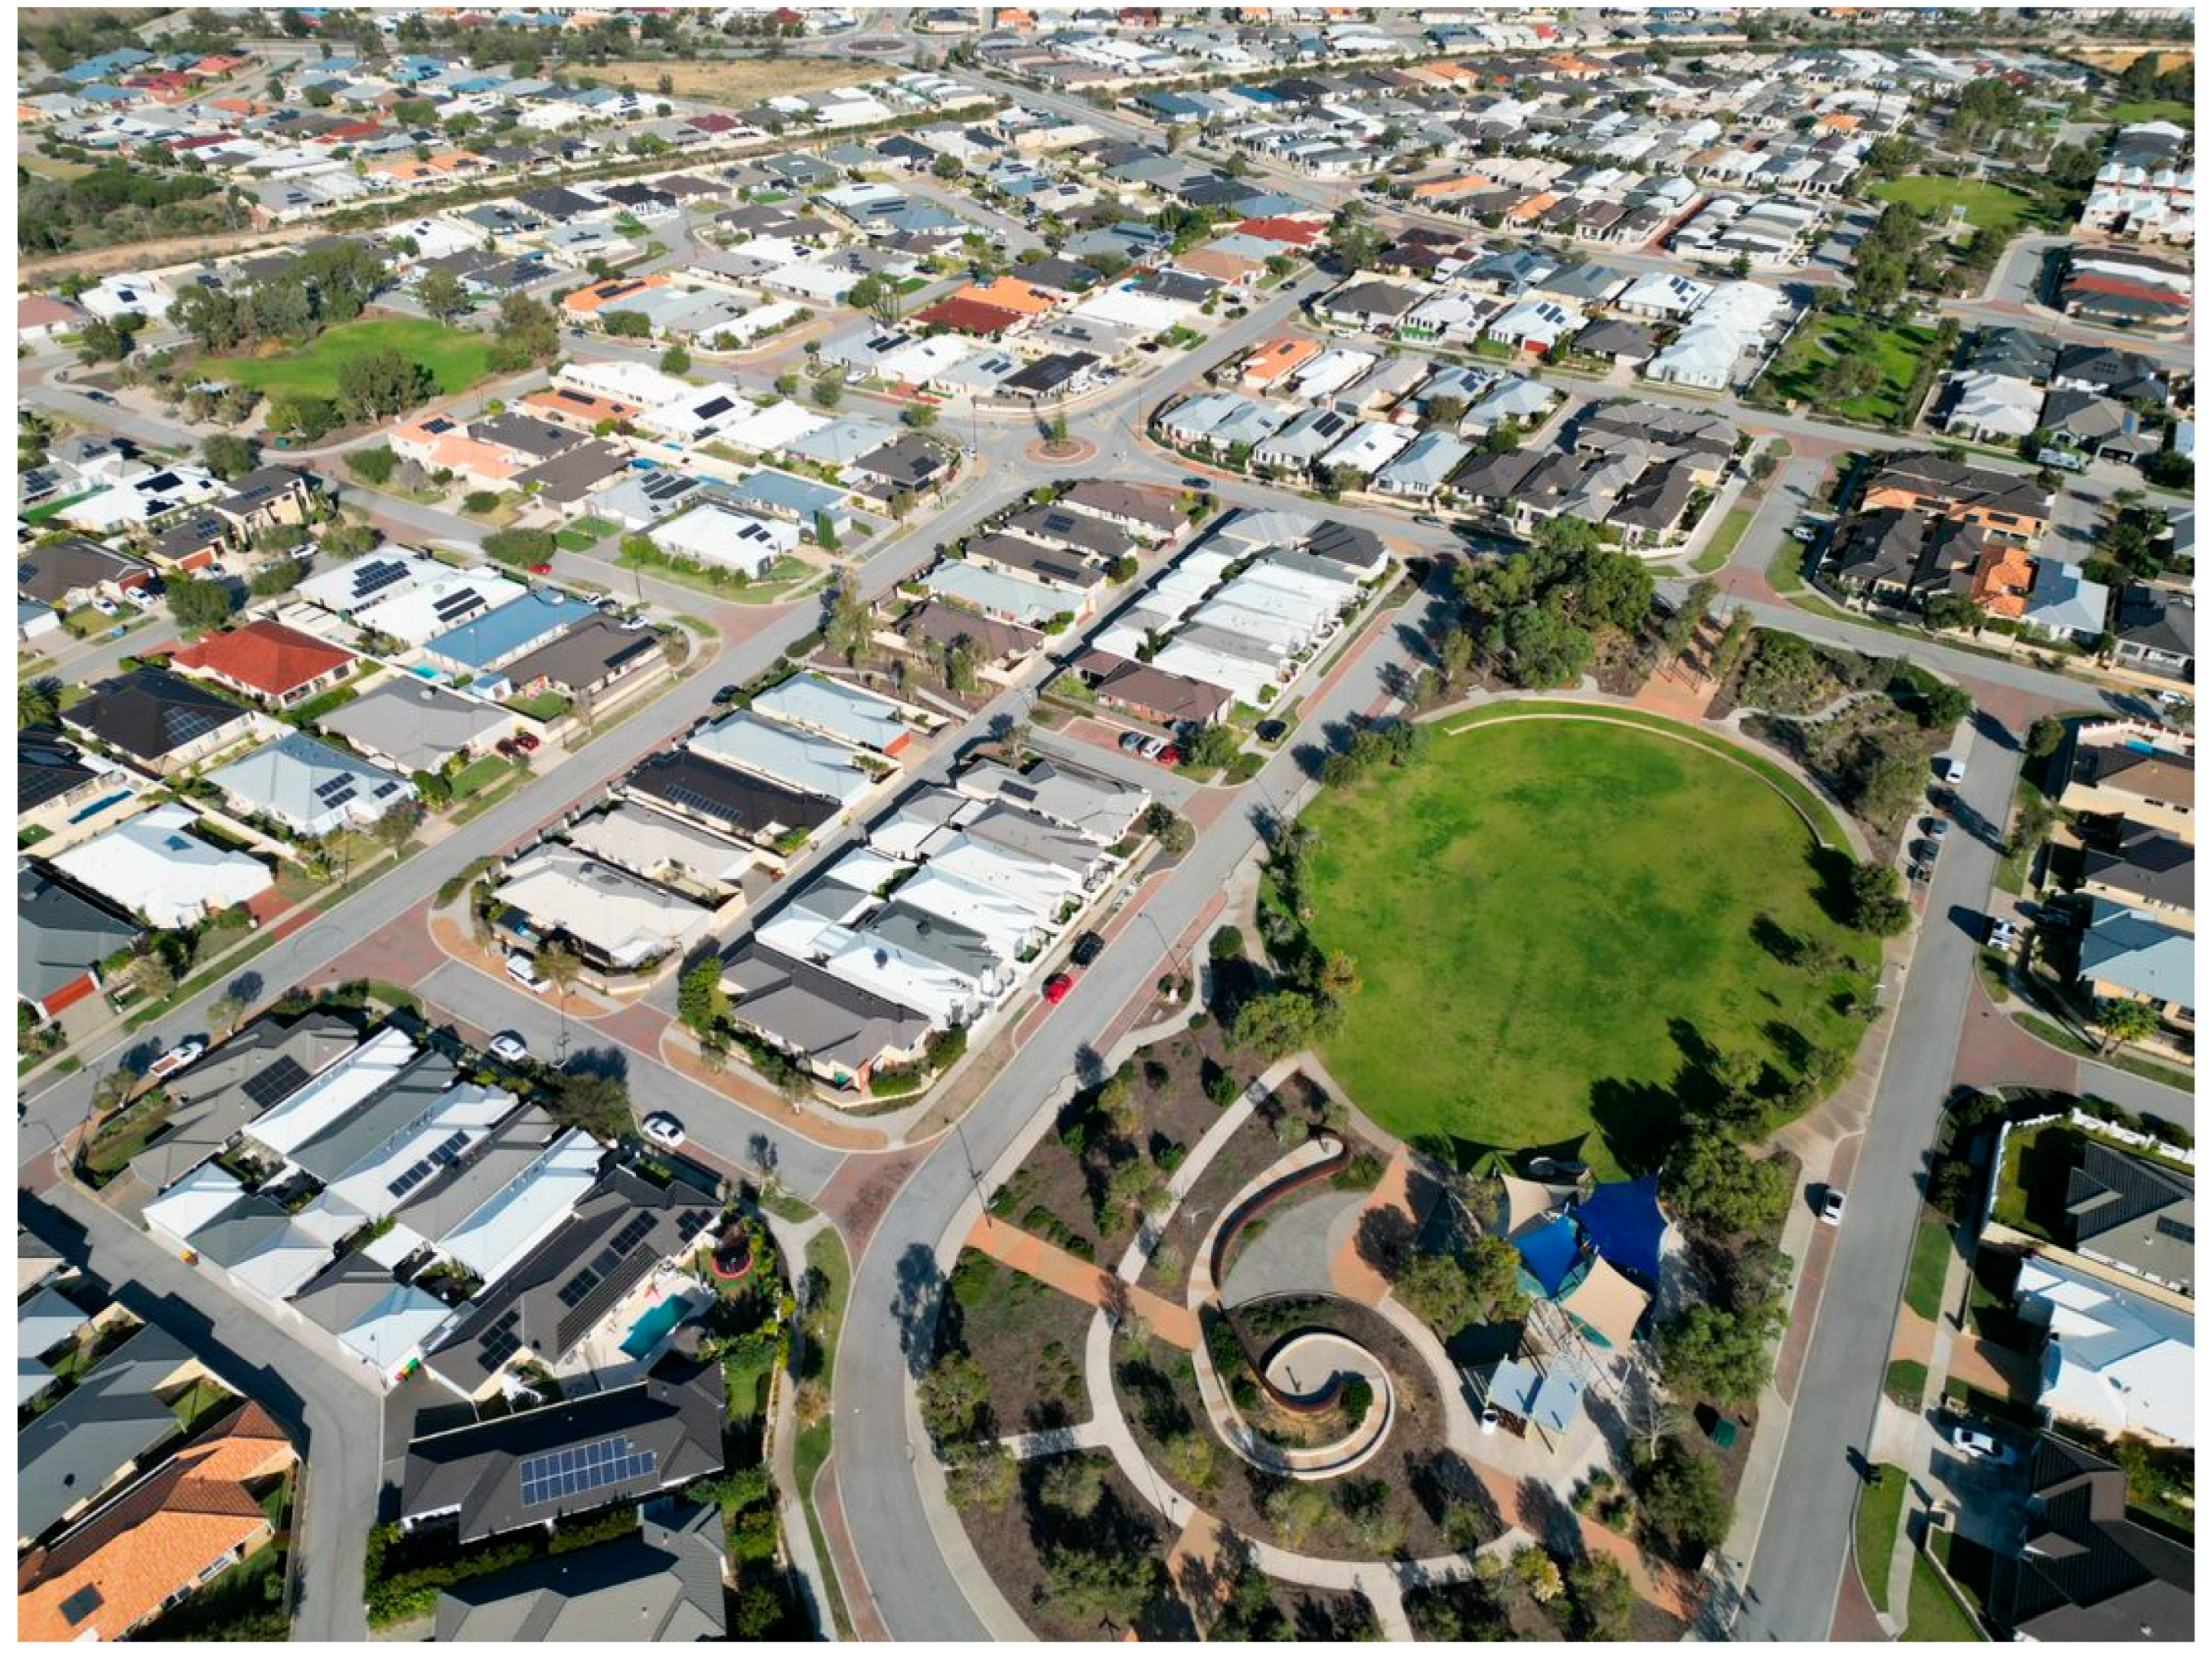
Smaller, more accessible parks were advocated by the LN design code for outer suburban development [54]. Aligned with New Urbanism (NU) principles, this policy promoted compact suburban layouts where smaller, easily accessible parks were integrated within neighbourhoods composed of small lots [54]. These parks were designated as ‘local parks’ [44,51]. The landscaping primarily consisted of extensive irrigated lawns, with some perimeter tree plantings. As newly developed areas, these parks lacked tall, dense trees and featured several low-height trees and shrubs. Garry Meinck Park, Killcarry Park, Portsalon Park, and parts of Oban Park and Rosegreen Park at Butler (Figure 5) were included within this study area. Native tree species, such as Eucalyptus gomphocephala, Agonis flexuosa, Corymbia calophylla, and Melaleuca quinquenervia, were present, with ground cover primarily consisting of wood mulch. These parks were generally one hectare or smaller, with a canopy cover of less than 5% and grass cover of around 20% [47].

2.3. Microclimate Modelling

Microclimate modelling of the case studies was conducted using ENVI-met, a three-dimensional microclimate simulation software designed to analyze interactions between the built and natural environment and the surrounding local climate [55]. The software consists of pre- and post-processing programs [19].
First, the built and natural environment were modelled, after which simulations were run for a specific date and duration by inputting local climate data. For this study, version 5.5 of ENVI-met was used. Second, all trees were audited through a site visit using the Arboreal Tree App, which records the tree’s location (longitude and latitude), height, crown width, crown base height, and images. Then, trees in each park were classified based on height and species. Australian native tree species, identified during data collection but not included in the default ENVI-met vegetation library, were created in the Albero program, considering their dimensions, leaf type, canopy shape, and Leaf Area Density (LAD). An example and detailed explanation are provided in Appendix A. Concurrently, a GIS spatial layer of trees was prepared, including a column of ENVI-met tree IDs. GIS spatial layers were compiled, including building footprints and heights, trees represented as 3D vegetation, and grass and shrubs as 2D vegetation. Surfaces such as asphalt, wood chip mulch, pavement, and soil were converted using the Monde program. The final modelling study area was configured in the Space program. The associated input data and overall modelling process are presented in Table 2 and Table 3.
ENVI-met validation and calibration for this research were confirmed through previously published studies by the authors within the same climatic zone [18,19], thereby supporting the model’s suitability and accuracy. One study compared modelled and observed surface temperatures in a 0.48-hectare park in Perth, Western Australia, reporting an index of agreement (d) of 0.985, where 0 indicates no agreement and 1 indicates perfect agreement [19]. Another study compared ENVI-met outputs with in-situ measurements of land surface temperature, air temperature, and relative humidity, collected progressively at three time periods on a typical summer day across three parks of varying sizes. Measurements were taken at 25-m intervals along transects extending up to 200 m from the park boundaries. Results demonstrated close agreement within the parks [18], supporting the applicability of ENVI-met for the present study, which examines the comparative performance of parks.

2.3.1. Weather Data

The weather conditions for the ENVI-met simulations were derived from Energy Plus Weather (EPW) files produced by the Commonwealth Scientific and Industrial Research Organisation (CSIRO). The typical meteorological year (TMY) files used for present-day climate conditions were based on historical weather data from 1990 to 2015. Future climate conditions were modelled using CSIRO’s “morphing” technique, which adjusts present-day weather data according to projections based on Representative Concentration Pathways (RCPs) from the Coupled Model Intercomparison Project Phase 5 (CMIP5). Simulations for the five models were conducted for a typical summer day under present conditions and a projected summer day in 2090 under the RCP 8.5 scenario. 16 February was identified as a typical summer day in the EPW file by comparing the hourly dry bulb temperature, relative humidity, and wind speed with the median hourly values of those variables. Graphs from the Fox files, which represent weather input to the simulations, are shown in Figure 6 below.

2.3.2. Measuring Variables

LST maps were generated using the ENVI-met Leonardo program to compare the differences between parks and the surrounding environment. Additionally, to understand human thermal comfort, which is more influenced by Mean Radiant Temperature (MRT), the PET human thermal comfort index was calculated using the ENVI-met BioMet program, a post-processing tool that calculates human thermal comfort indices from ENVI-met output files. In this study, the main variables that give rise to the PET result are also reported, i.e., MRT, air temperature, and wind speed. PET values of 29–35 °C represent moderate heat stress, 35–41 °C represent strong heat stress, and above 41 °C represent extreme heat stress [56,57].

3. Results

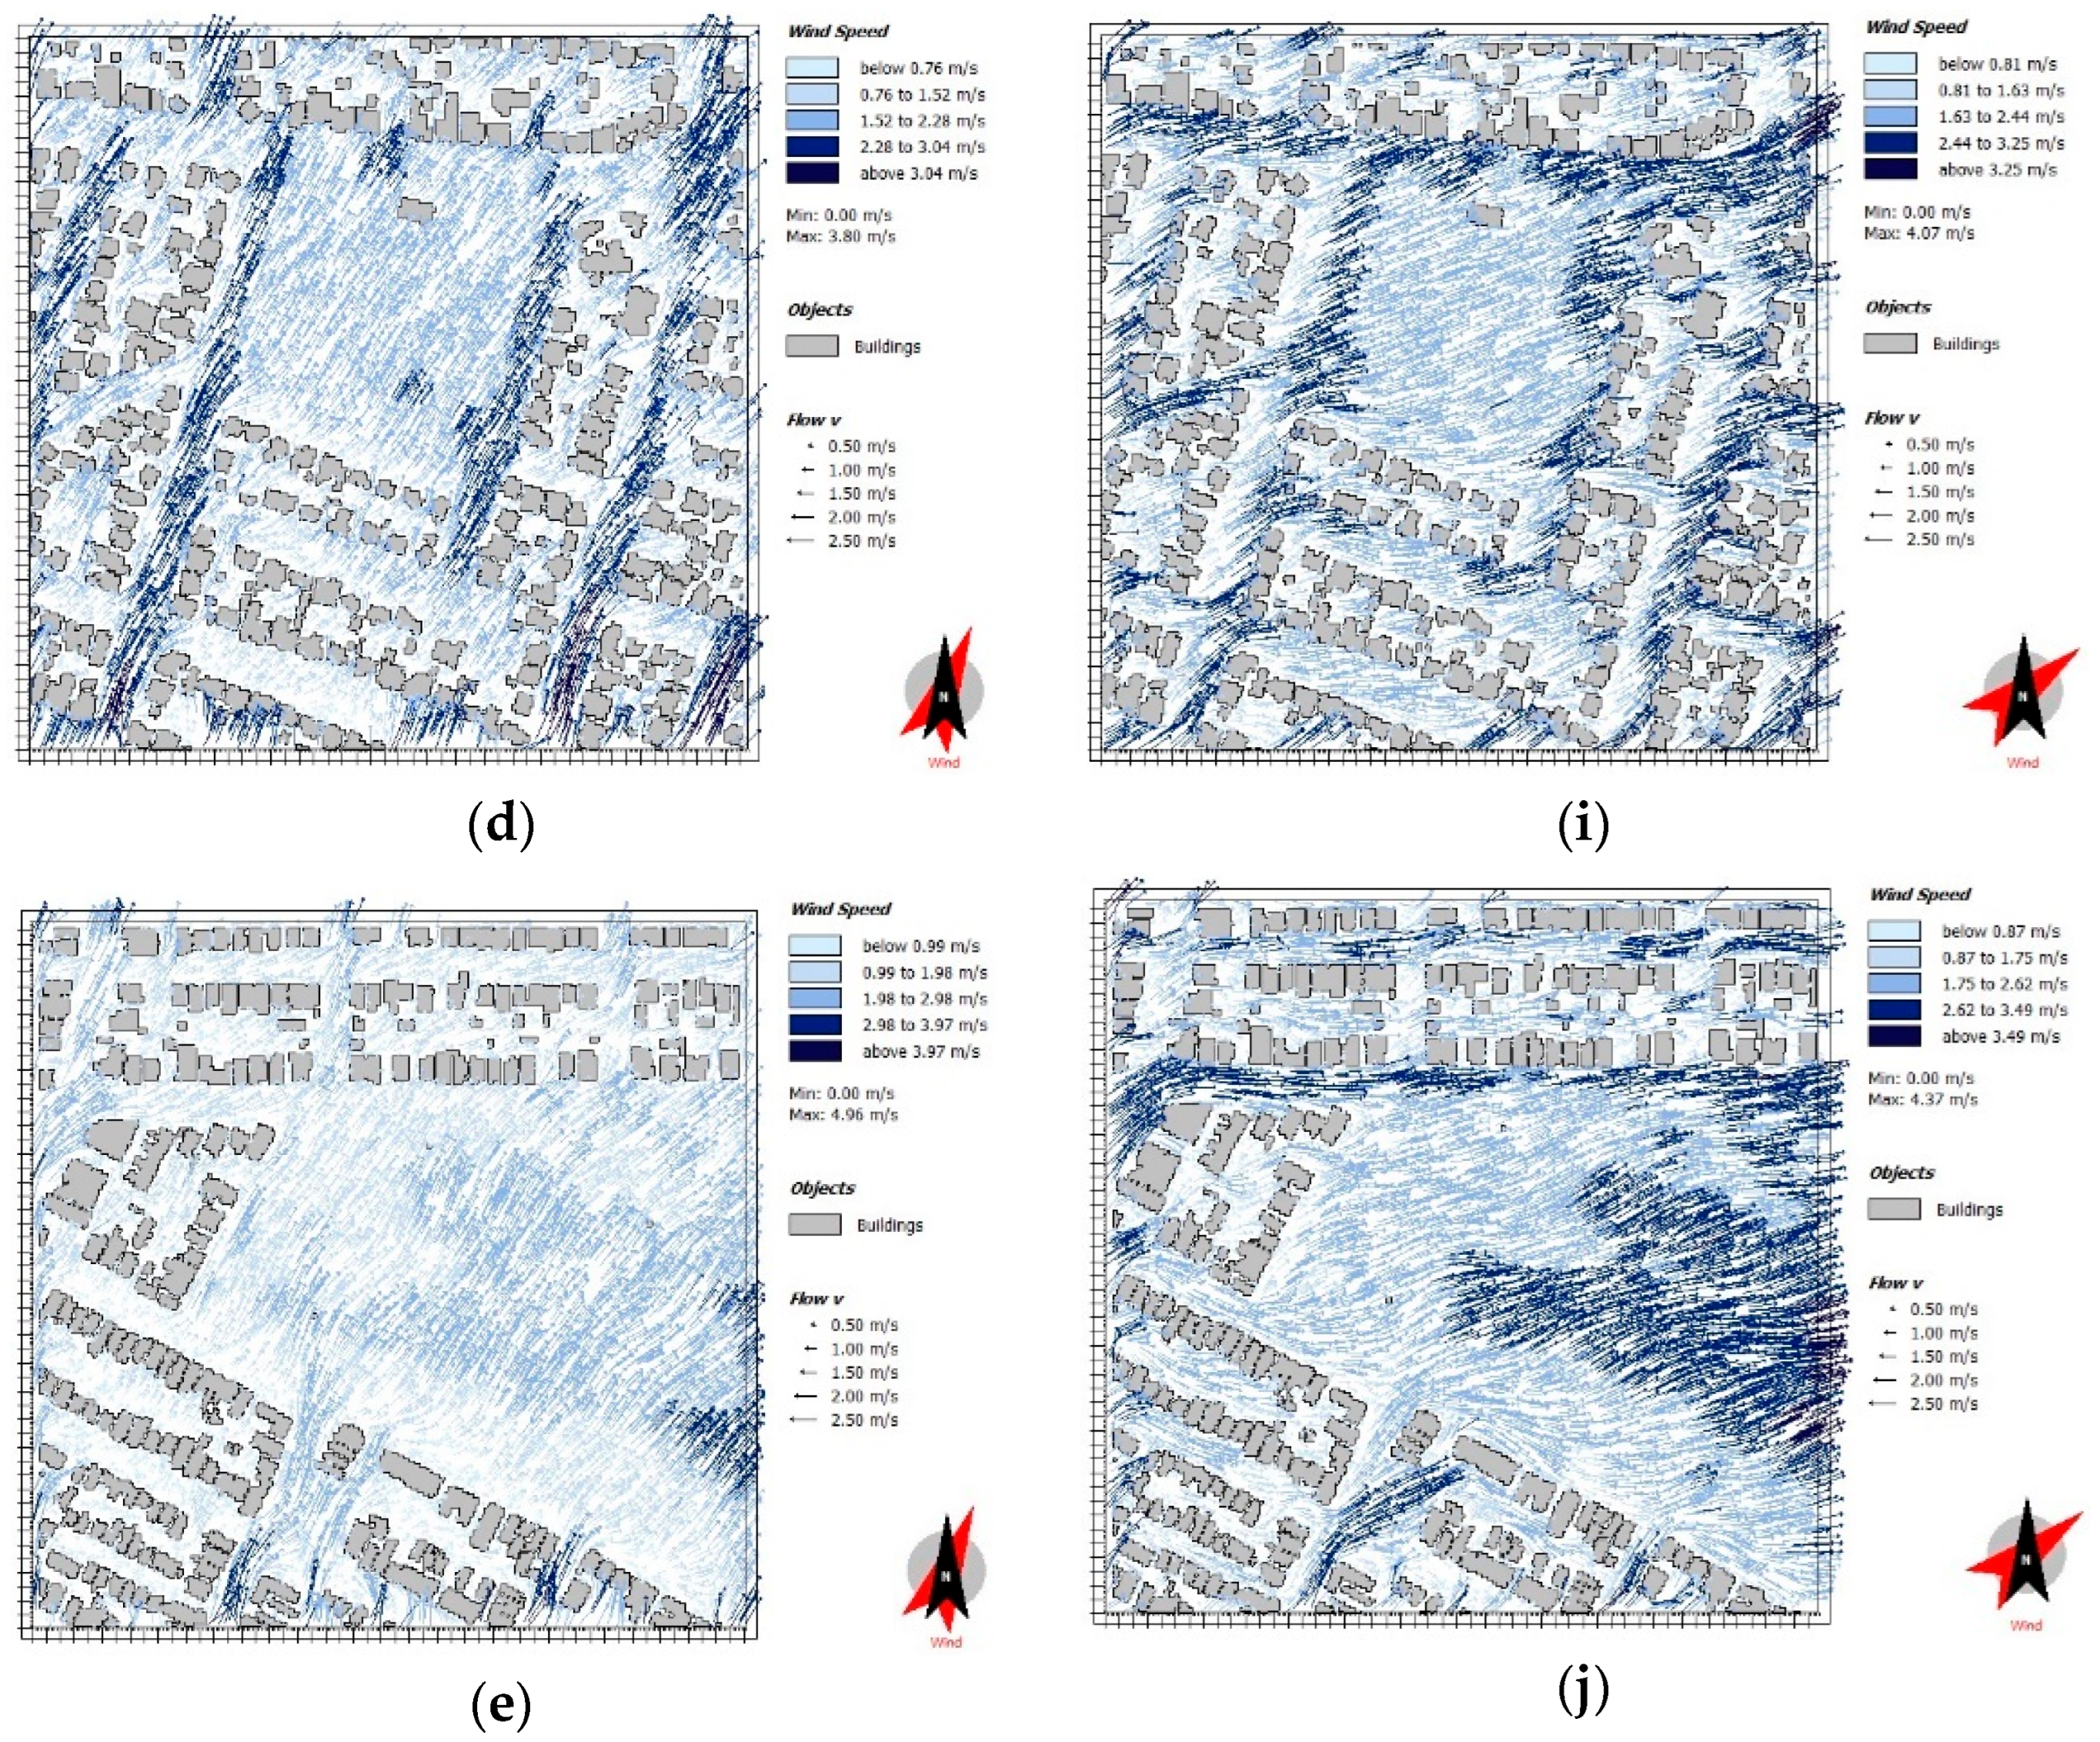
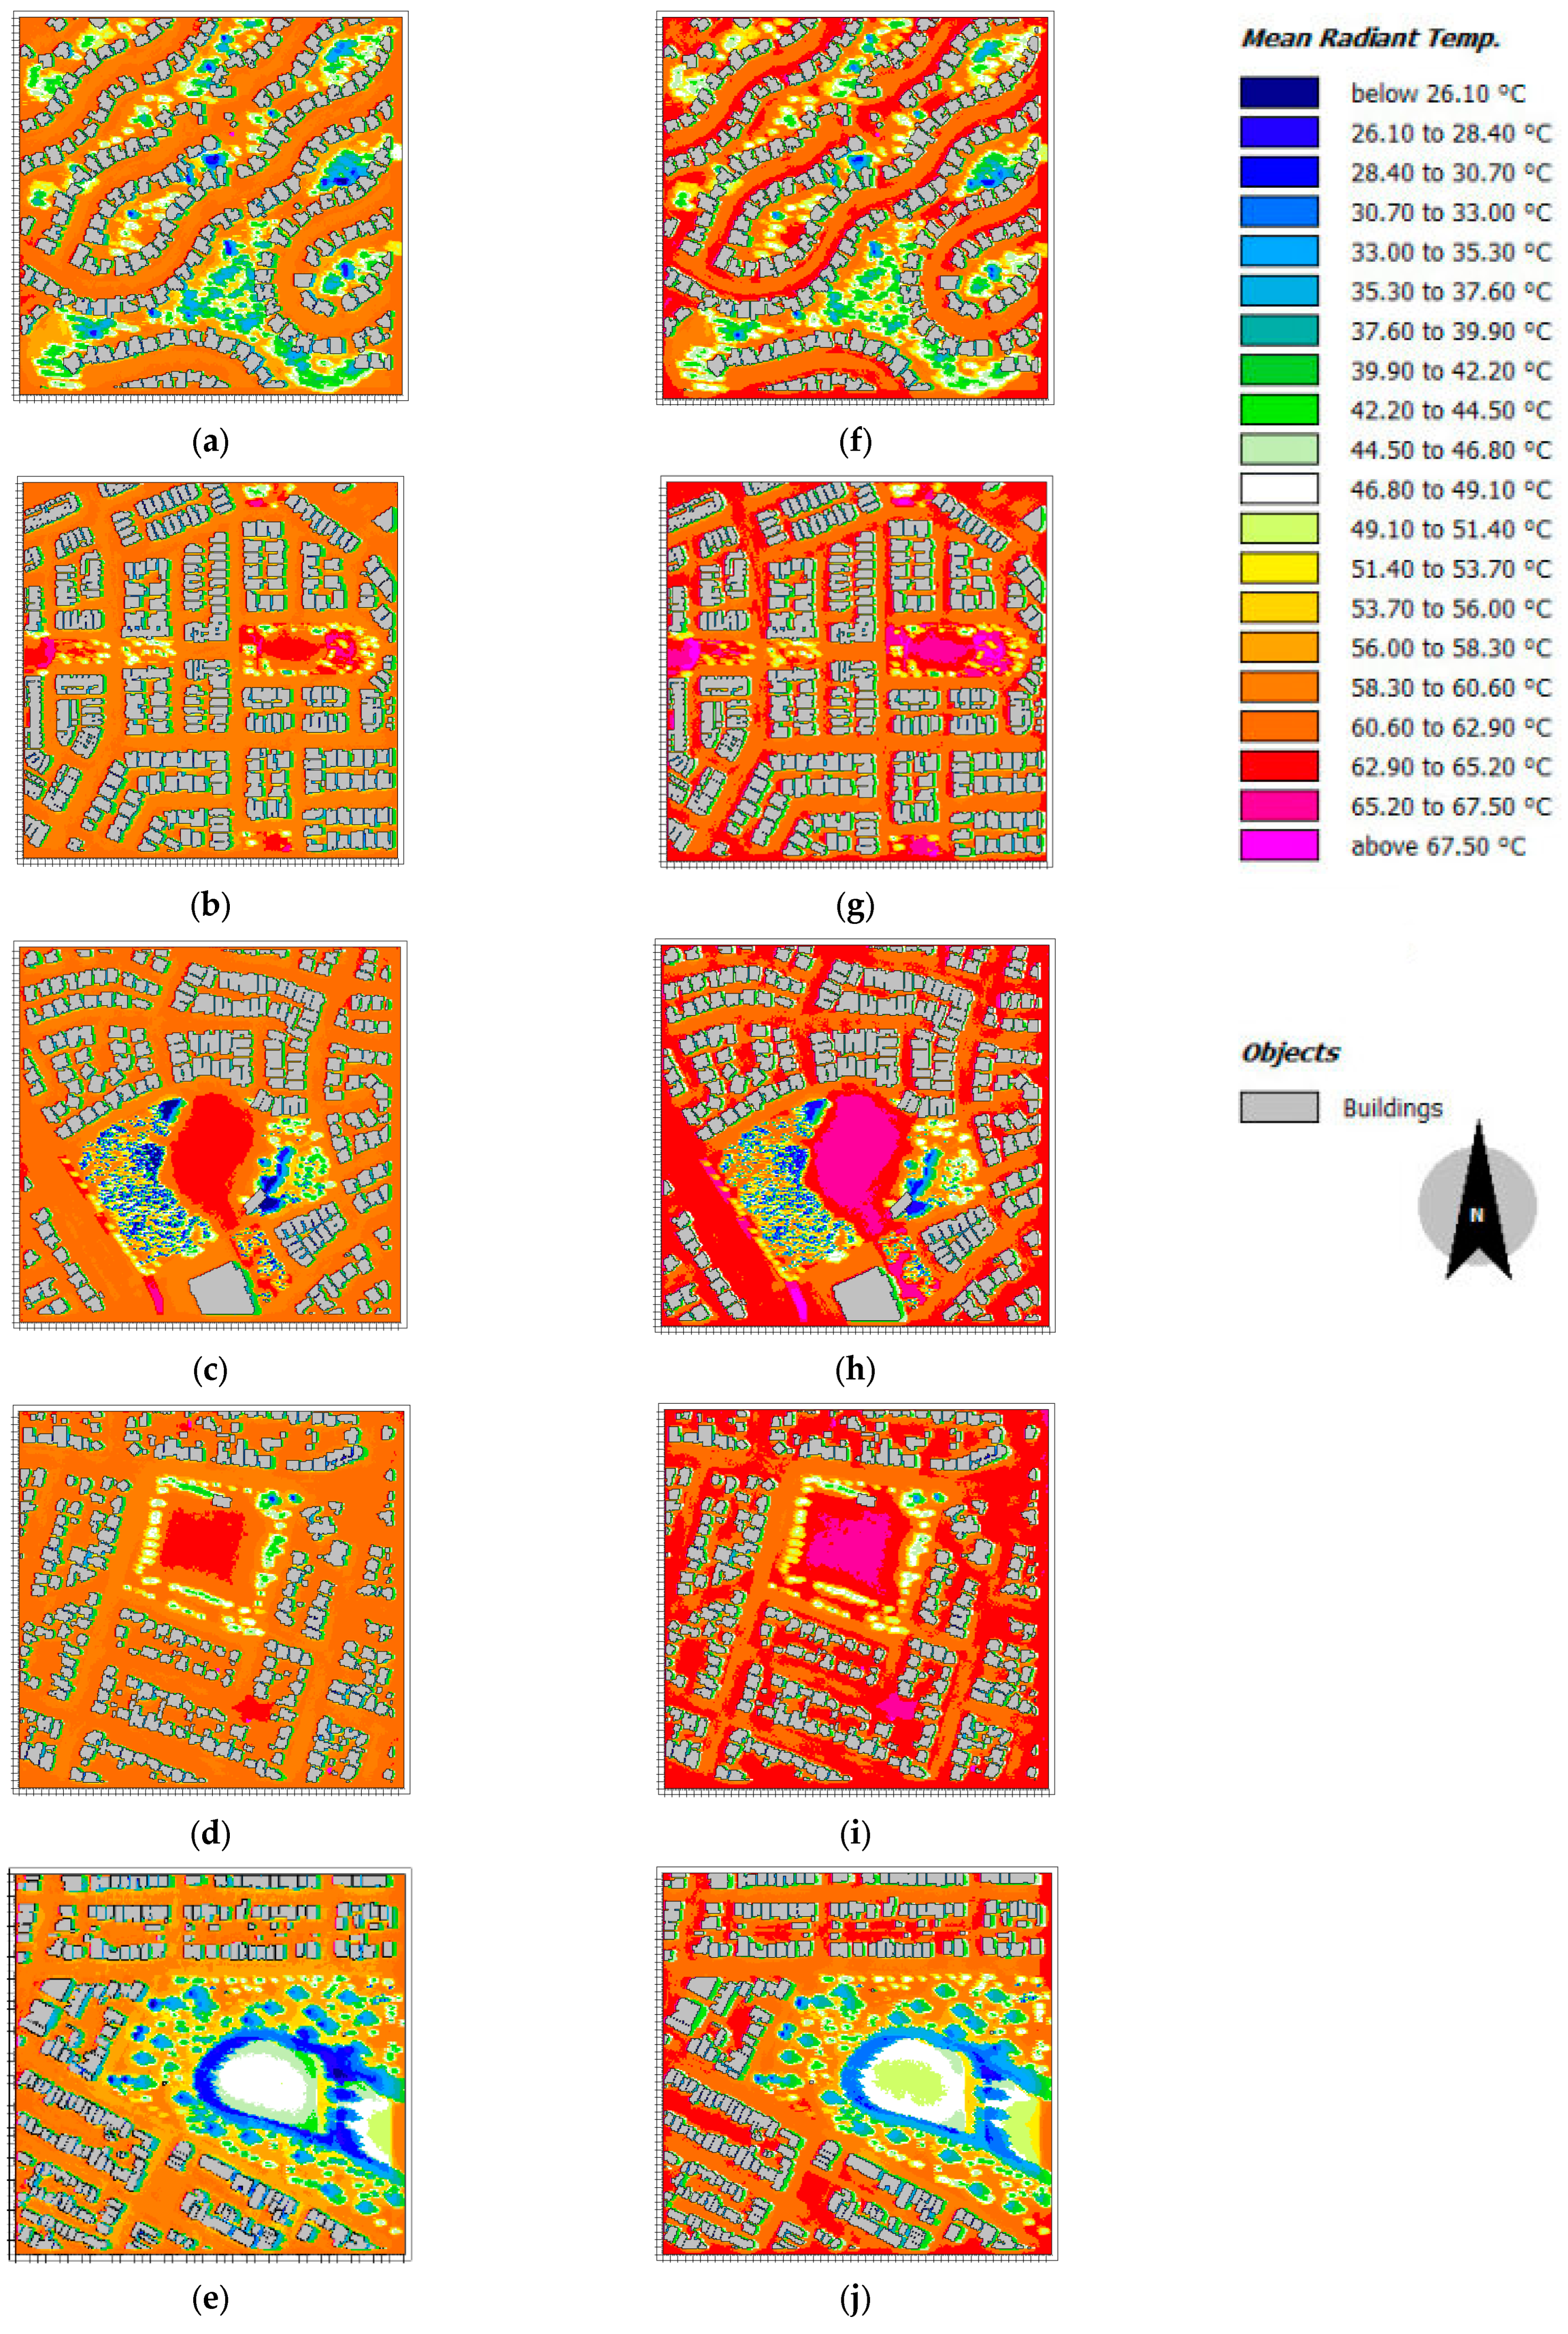
The results of the climatic modelling for the case studies at 4:00 pm, the hottest time of day, on an average summer day under both present climate conditions and the projected 2090 climate (RCP 8.5 scenario) are presented below. These results include LST and PET, as well as their key contributing variable, Mean Radiant Temperature (MRT), all evaluated at a height of 1.4 m. Wind speed and direction maps are provided in Appendix B.

3.1. Land Surface Temperature (LST)

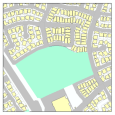
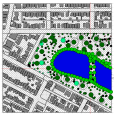
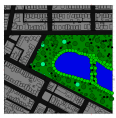
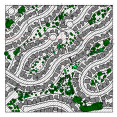
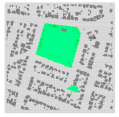
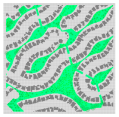
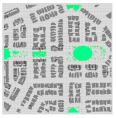
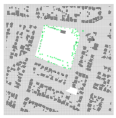
Across all case studies, the LST maps (Figure 7) clearly showed that surface temperatures within the parks were consistently cooler than those of the surrounding streets, under both current and future summer conditions. However, the degree of cooling in future summer conditions is significantly reduced. Among the study areas, the Bush Forever case study exhibited the widest range of cooling, with the LST within the park 7.5–19.5 °C lower than that of adjacent streets under present conditions (Figure 7c) and 9.0–19.5 °C lower under future climate scenarios (Figure 7h). The Public Park movement case study showed surface temperatures 9.0–15.0 °C cooler than those of surrounding streets in the present (Figure 7e) and 7.5–13.5 °C cooler in the future (Figure 7j), as indicated by the LST maps. A significant reduction in LST was also observed in the lake area within this park, further highlighting the cooling potential of integrated water features.
In the Radburn linear parks case study, LST maps (Figure 7a,f) revealed cooling effects of 9.0–13.5 °C under current summer conditions, and 7.5–10.5 °C under projected future conditions. The Recreation movement case study with sports fields showed a cooling of 7.5–12.0 °C in the present (Figure 7d), and 6.0–10.5 °C in the future (Figure 7i). In the New Urbanism-inspired Neighbourhood parks case study, the cooling effect was more moderate, with park surfaces 4.5–10.5 °C cooler than adjacent streets in the present (Figure 7b), and 3.0–10.5 °C cooler under future conditions (Figure 7g).

3.2. Mean Radiant Temperature (MRT)

Across all case studies, MRT maps (Figure 8) demonstrated that tree canopy-covered areas consistently exhibited lower MRTs compared to grass surfaces and surrounding streets, under both present and future climate conditions. The Bush Forever case study showed the widest range of MRT reduction, with tree canopy and bushland areas exhibiting values 11.5–36.8 °C lower than surrounding streets in both present (Figure 8c) and future conditions (Figure 8h). However, MRT values were notably higher above the exposed grass areas in the centre of the park. In the Public Park movement case study, MRT maps indicated that the entire park boundary was cooler, with reductions of 11.5–36.8 °C in the present (Figure 8e) and 13.8–36.8 °C in the future (Figure 8j), with the most significant cooling observed near large canopy trees and the lake.
The Radburn linear parks case study also demonstrated substantial MRT reductions, with tree canopy areas showing values 11.5–36.8 °C lower than adjacent streets under both current (Figure 8a) and future conditions (Figure 8f). In the Recreation movement case study with sports fields, MRT values were lower only in tree canopy-covered zones, with reductions of 11.5–23.0 °C in both present (Figure 8d) and future conditions (Figure 8i). MRT values above the central grass areas were higher than those of the surrounding streets in both present and the future. The Neighbourhood parks case study showed more moderate MRT reductions, with tree canopy-covered areas 11.5–20.7 °C cooler in the present (Figure 8b) and 11.5–23.0 °C cooler in the future (Figure 8g) compared to surrounding streets. However, MRT values were up to 2 °C higher above grass and wood mulch surfaces across all parks in this category.

3.3. Physiological Equivalent Temperature (PET)

PET human thermal comfort index distribution maps at a height of 1.4 m (Figure 9), which indicate how people feel in different urban park configurations, revealed that tree canopy-covered areas consistently improved thermal comfort across all case studies. Reductions in PET values showed transitions from extreme heat stress on exposed streets to moderate or strong heat stress beneath canopy cover under both present and future climate scenarios. The greatest PET reductions were observed in the Bush Forever case study, where canopy-covered and bushland areas were 12.6–16.8 °C cooler than surrounding streets in the present climate (Figure 9c) and 9.8–18.2 °C cooler in the future (Figure 9h). These reductions corresponded to a shift from extreme heat stress in exposed areas to moderate heat stress in the present and moderate to strong heat stress in the future. Notably, PET values above the exposed grass in the park’s centre exceeded those of the surrounding streets. In contrast, adjacent streets near bushland and tall trees showed localised cooling effects, more pronounced under present conditions. Similarly, the Public Park movement case study demonstrated PET reductions of 14.0–16.8 °C in the present (Figure 9e) and 9.8–18.2 °C in the future (Figure 9j). Deciduous trees near the lake and those with the largest canopy coverage provided the most significant cooling benefits. Streets surrounding the park also exhibited lower PET values than other streets in the broader study area, reinforcing the park’s influence on adjacent microclimates.
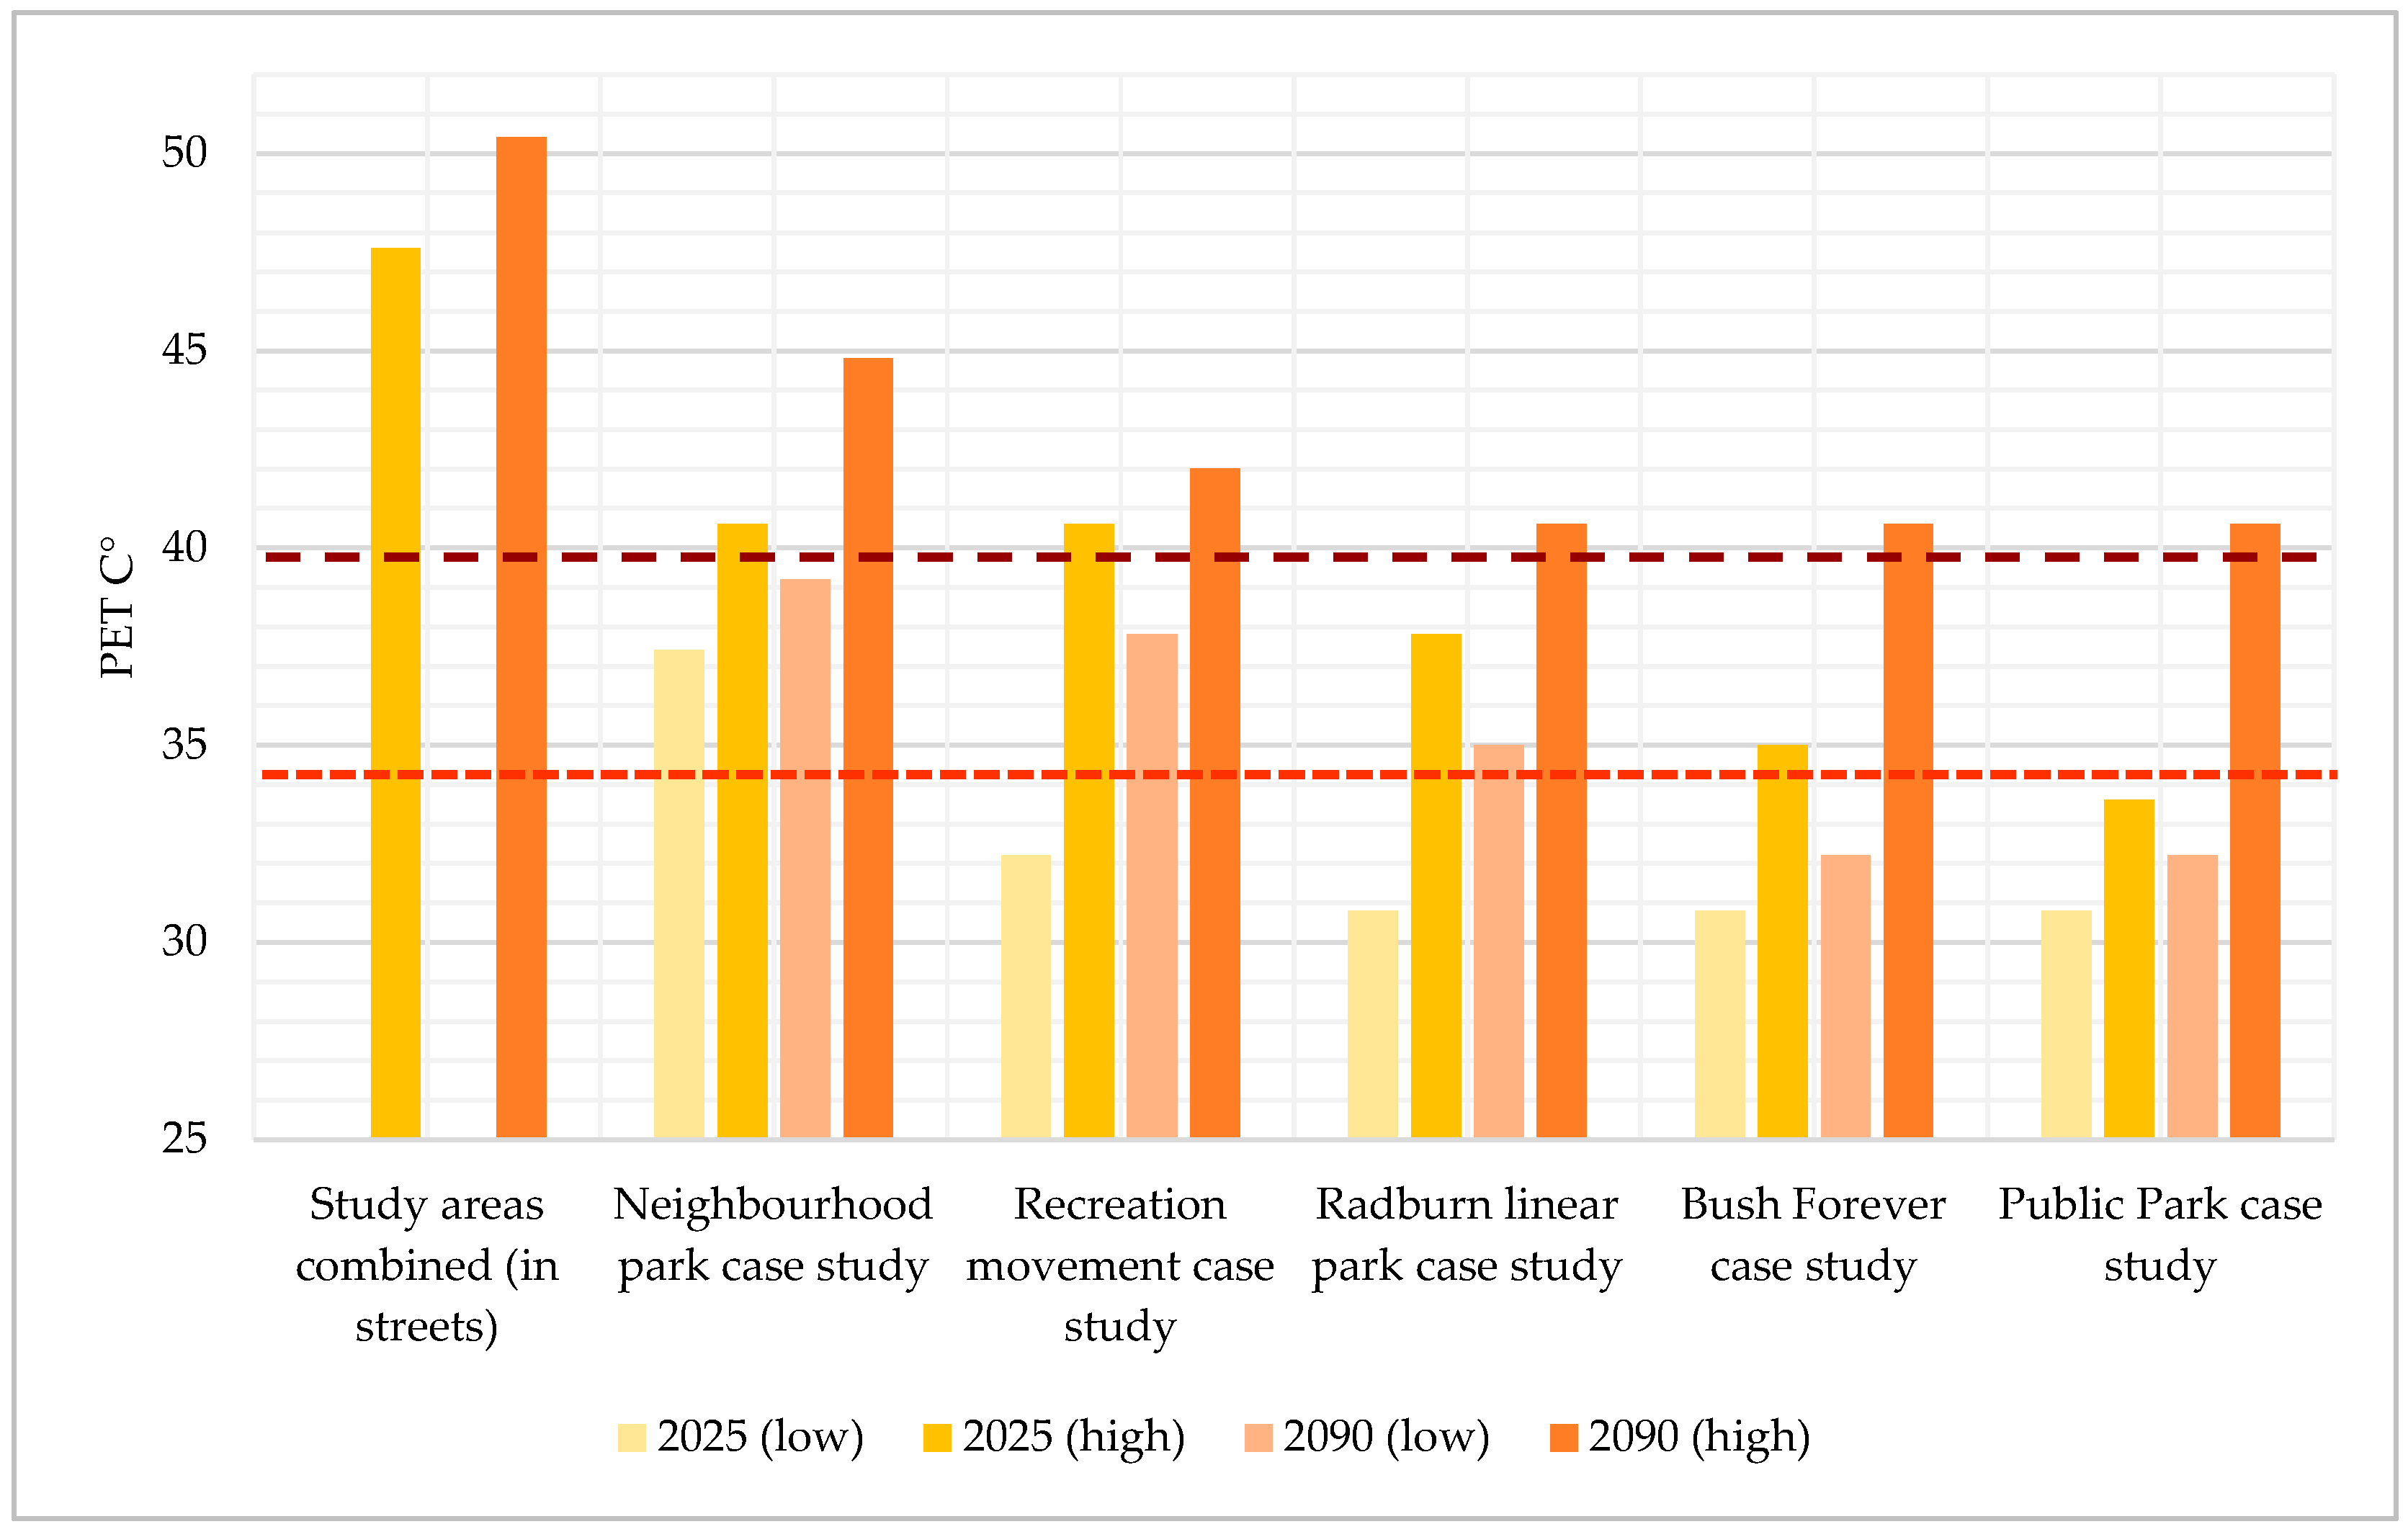
In the Radburn linear parks case study, tree canopy areas showed PET reductions of 9.8–16.8 °C in the present (Figure 9a) and 9.8–15.4 °C in the future (Figure 9f), compared to surrounding streets. These reductions marked a transition from extreme heat stress on the streets to moderate or strong heat stress under canopy cover. Additionally, buildings adjacent to linear parks with substantial tree cover experienced lower PET values, suggesting improved thermal comfort in the immediate built environment. The Recreation movement case study with sports field site exhibited PET reductions of 7.0–15.4 °C in the present (Figure 9d) and 8.4–12.6 °C in the future (Figure 9i) under tree canopies. However, PET values above grass areas were consistently higher than those on surrounding streets, indicating limited thermal relief in open grass areas. Finally, the Neighbourhood parks case study showed more moderate PET reductions, with canopy-covered areas 7.0–9.8 °C cooler than streets in the present (Figure 9b) and 5.6–11.2 °C cooler in the future (Figure 9g). Street temperatures reached up to 47.61 °C in the present and 50.41 °C in the future, while tree-covered areas offered strong heat stress relief. Slightly lower thermal stress was also observed in the southern portion of the study area, attributed to prevailing wind direction under both climate scenarios (Appendix B Figure A1b,g).
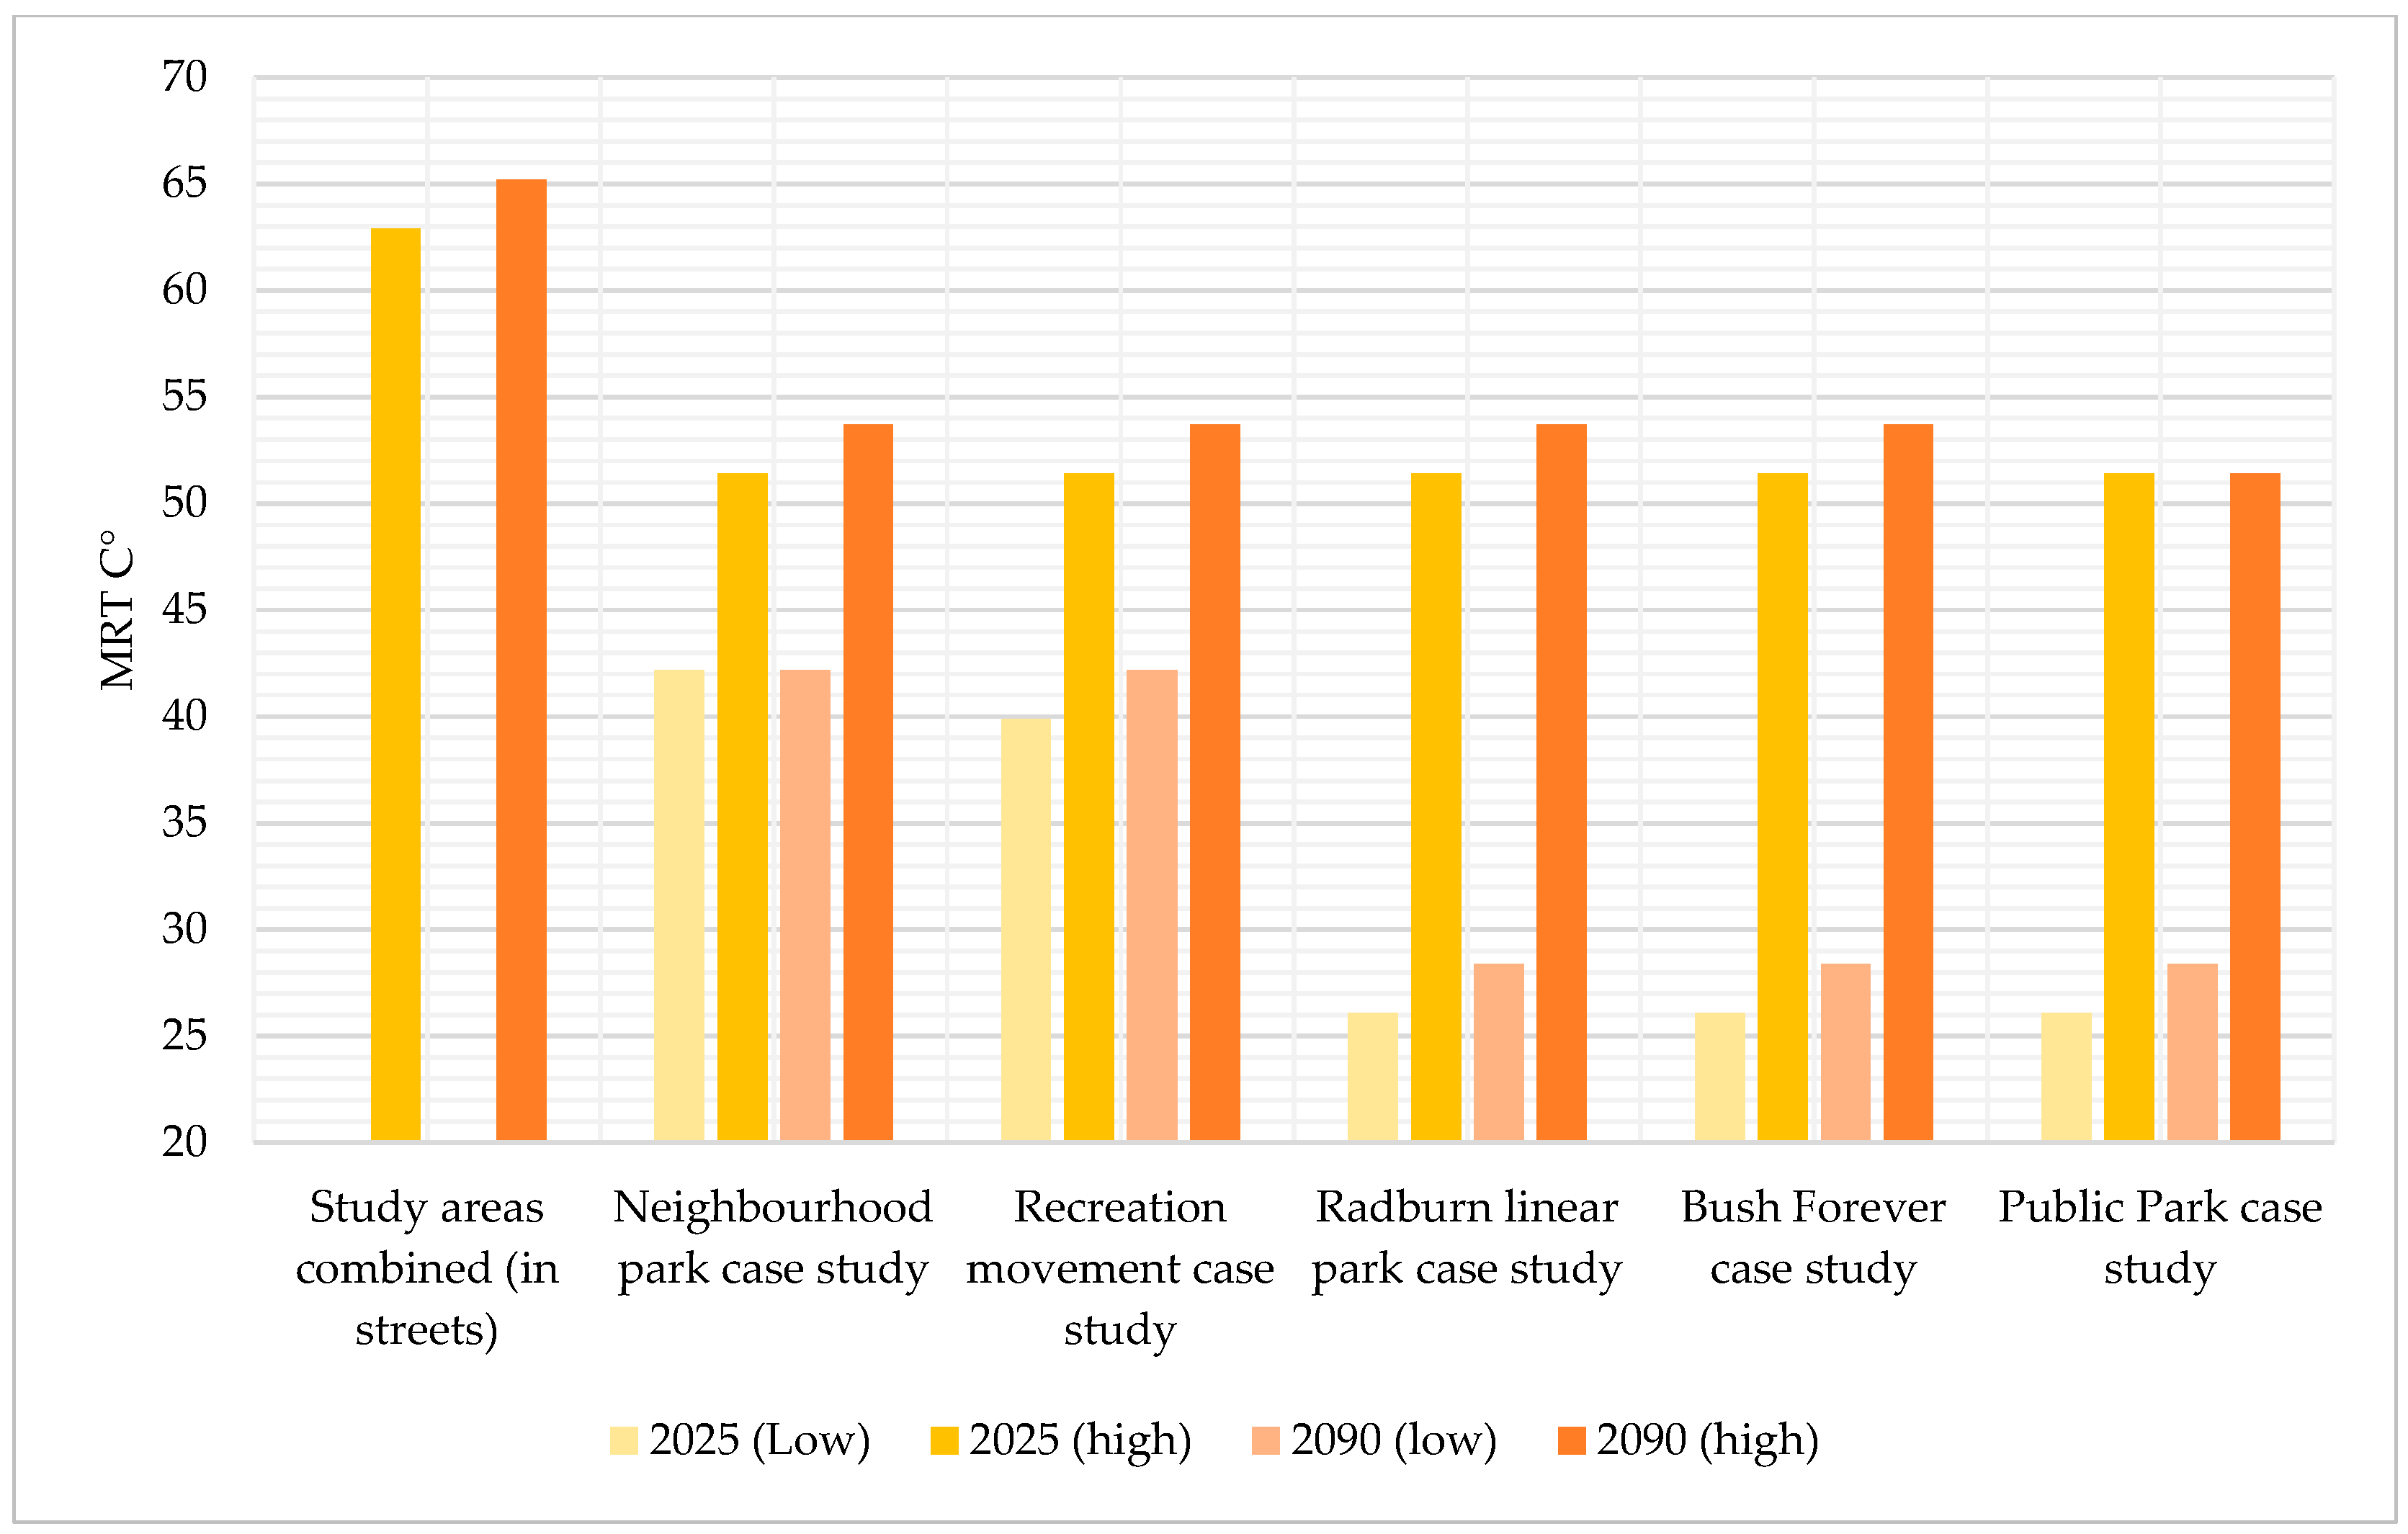
Table 4 summarises the thermal differences between selected canopy-covered locations within parks and their surrounding streets, based on PET, MRT, and LST values. Figure 10, Figure 11 and Figure 12 separately present the results for each variable. The results indicate that prolonged exposure to present daytime conditions leads to extreme heat stress across all case studies in the adjacent street environment. While thermal conditions within the parks have improved comparatively, they still give rise to moderate to strong heat stress under the current climate, and this is expected to intensify under future climate scenarios.

4. Discussion

The study identified no clear relationship between park size, configuration and PCI, with only a minor impact observed on PCI extent. Tree canopies and bushland areas provided the greatest cooling, while exposed grass areas were sometimes hotter than adjacent streets. Overall, the study suggests that tree canopy is the primary driver of cooling under both present and future climates.
Trees provide cooling through shade provision and transpiration, although the latter is expected to decline under climate change. The study’s findings confirm that the cooling mechanisms will persist, reinforcing previous conclusions that shade is the dominant contributor, while transpiration plays a more limited role [19]. These findings support Perth-based strategies by the Western Australian government aimed at enhancing canopy coverage in parks and public open spaces in Perth and Peel, including the Urban Greening Strategy 2023–2036 [58] and the Urban Forest Plan 2016–2036, aiming to increase canopy cover within the public realm from 19 per cent to 30 per cent over 30 years [59].
Among the three categories of parks, recreation, sport and nature, land allocation for sport has significantly decreased due to the implementation of Bush Forever and LN planning policies in new suburbs [60]. These planning policy shifts favour smaller, more accessible green spaces, which the findings indicate could still help mitigate urban heat in a warmer future, particularly when shade provision and radiation dynamics are properly considered. The linear parks integrated with housing in the Radburn case study demonstrated cooling benefits in the vicinity of surrounding homes, highlighting the efficiency of integrated park-housing systems. These insights are valuable for planners, urban designers, and landscape architects seeking to enhance thermal resilience through vegetation strategies.

4.1. Comparison of PCI Intensity Across Different Variables (LST, MRT and PET) and Case Study Parks

This study found that across all case studies examined, park surfaces were generally cooler than surrounding streets. This was consistent with previous research that examined LST in parks under present climate conditions and confirmed the PCI effect [15,61,62,63,64]. Nonetheless, lower LST did not necessarily correspond to lower air temperatures, reduced MRT values, and hence improved thermal comfort, as observed in this study in the exposed grass areas of small Neighbourhood parks case study, the sports field in the Recreation movement case study, and the open grass in the middle of the Bush Forever case study. Although Balany, et al. [65] found that 37% of reviewed studies included grass as a strategy to mitigate the UHI effect, our findings indicate that, under certain conditions, sun-exposed grass-covered areas may exhibit higher PET values than adjacent streets during peak summer heat, primarily due to the increased reflection of solar radiation from their higher-albedo surfaces. Therefore, the findings of this research suggest that relying on LST alone, as done in previous studies [62,64], is insufficient for assessing the intensity of the PCI effect, particularly if human thermal comfort is the primary focus.
The PET maps across all case studies showed that clusters of tall trees (e.g., at the lake perimeter of the Public Park movement case study, in the bushland areas at the Bush Forever case study, in the Radburn linear parks case study, and large canopies at the perimeter of the Recreation movement park case study) provided the most significant cooling benefits under their canopies and in their immediate surroundings. This finding is consistent with a previous study by Petralli, et al. [66], which concluded that trees and their shade, especially dense tree canopies, effectively cool and improve thermal comfort by reducing exposure to both short- and long-wave radiation. Additionally, consistent with research by Kong, et al. [67], trees with large crowns and dense canopies most effectively reduced MRT and enhanced thermal comfort.
The findings of this research indicated that bushland areas also provided significant cooling benefits, similar to those of large trees in parkland, in both the present and future climates. Although most studies have identified trees as the most effective cooling element [68], this research showed that bushland areas with native trees and understory can provide comparable cooling benefits to large trees planted in parks. While trees provided shaded spaces for park users, bushland areas may offer less direct interaction for people, depending on the level of access provided.
Studies conducted in Western Europe, and elsewhere, have concluded that larger parks with a square configuration provide more intense PCI effects [69]. In contrast, the Radburn linear parks case study, with areas ranging from 0.5 to 2.5 hectares, demonstrated nearly the same cooling intensity as the Public Park movement case study in present conditions, which contradicts previous research. The Recreation movement case study, with its compact square configuration and 3-hectare area, provided the least cooling benefits. These findings suggest that canopy cover and vegetation density are more important than park configuration in determining the efficiency of PCI.

4.2. Comparison of PCI Extents Across Different Variables (LST, MRT and PET) and Case Study Parks

The study revealed that the PCI effects extended downwind beyond the boundaries of the Public Park movement case study (the largest), which has 59.5% canopy cover, in both present and future weather conditions (Appendix B). A similar, but more minor effect was observed in the Bush Forever case study, which has 13.8% canopy cover and 1.5 hectares of bushland and in Radburn linear parks case study, which have 53.8% canopy cover, under both present and future weather conditions.
However, no cooling effect extended beyond the park boundaries in the smaller Neighbourhood parks case study, which have less than 5% canopy cover, or in the Recreation movement case study, which is predominantly a sports field with only 26.3% canopy cover and 53% grass cover. This finding contrasts with previous research in Melbourne, which concluded that all parks provided cooling benefits extending to their surrounding urban areas [15], noting that this research was based on LST measurements. In contrast, the LST results from this study showed sharp thermal boundaries between parks and adjacent surrounding streets. Other research made similar conclusions about the PCI extent based on air temperature measurements [70]. The findings here were based on PET, which is more influenced by MRT than air temperature or LST.
Previous research conducted in a humid subtropical climate in Fujian identified park size and shape as key factors, concluding that compact green spaces in the shape of a circle or square, around 4.55 ± 0.5 hectares in area, were the most effective in cooling the city [63]. This conclusion was reached based on the analysis of LST measurements obtained from Landsat, which did not directly translate to an assessment of human thermal comfort. Among the park configurations in this study, the Public Park movement case study, with its compact configuration and 15.5-hectare area, exhibited the most significant (albeit minor) PCI extent, confirming prior research suggesting that large urban parks over 10 hectares provide the greatest PCI extent or PCD [21]. However, while previous research found that the cooling effects of parks extended up to half of the park’s width [70], the PCI extent of the Public Park movement case study was less extensive, reaching less than half its width.

4.3. Comparison of Parks in Present and Future Conditions

On a projected average summer day in 2090 under the RCP8.5 scenario, results across all five study areas indicated that all parks would, generally, continue to exhibit cooler LST than surrounding streetscapes. However, the temperature contrast between parks and adjacent urban areas is expected to be less pronounced in the future compared with present conditions. Across both present and future climates, the coolest LST values were consistently observed near lakes, bushland areas, clustered trees, and trees with large canopies.
MRT maps showed persistent reductions in MRT provided by tree canopies and bushland areas in both present and future conditions. In contrast, MRT values remained elevated above exposed grass surfaces in the small Neighbourhood parks case study, the larger Bush Forever case study, and the Recreation movement case study. Notably, in the Radburn linear parks case study and the Public Park movement case study, tree canopies influenced surrounding grass surfaces by reducing reflected radiation, resulting in lower MRT and improved PET thermal comfort in both present and future conditions.
PET maps indicated that the minor cooling effects beyond park boundaries would persist under future weather conditions in the Public Park movement case study, Radburn linear parks case study, and the Bush Forever case studies. However, no such cooling extended beyond the boundaries of small Neighbourhood parks case study or the Recreation movement case study, similar to current weather conditions. Nevertheless, vegetation, particularly trees, continued to offer localised cooling, with PET values under canopies remaining lower than those in surrounding areas. In contrast, non-irrigated grass did not provide comparable cooling benefits and often exhibited higher PET values. Overall, parks are projected to maintain their cooling function for users within their boundaries, with future cooling effects being almost equivalent to those in present, assuming trees and all vegetation remain unchanged. These findings align with previous studies by Barghchi, Grace, Edwards, Bolleter and Hooper [19] in Perth and Gherri, et al. [71] on open spaces in the subtropical climate of Venice.

4.4. Limitations and Future Research

The weather files used for future climate conditions are based on CSIRO-produced “morphing” of present weather, which is informed by RCPs from the Coupled Model Intercomparison Project Phase 5 (CMIP5). The RCPs have since been superseded by CMIP6 models, which vary somewhat from the earlier models. Future research will be based on CMIP6 models.
This study used non-irrigated grass in modelling all case studies due to software constraints in the version used. However, modelling with irrigated grass is expected to indicate cooler surface temperatures. This limitation should be addressed in future studies.
Additionally, the study utilised existing models to represent future projection conditions. However, future climates are likely to result in reduced canopy cover due to a drying climate and decreased irrigation of grass. Future research is necessary to examine the impacts of climate change on morphological changes in the built and natural environment. Furthermore, the New Urbanism neighbourhood parks in this study lack tall and dense trees because they are newly developed areas. Future research should examine this configuration over time as the trees mature and grow taller.
While this research focused on the cooling and microclimate conditions of various urban park configurations resulting from different planning theories, future research should expand to investigate the intensity and extent of PCI across alternative suburban layouts (e.g., Water-Sensitive Urban Design-inspired layouts) in the Mediterranean climate of Perth, Western Australia.
Moreover, future studies should explore various adaptation strategies, particularly under future weather conditions, to provide a comprehensive understanding of potential mitigation techniques. Finally, future studies could integrate additional quantitative tree canopy metrics such as patch metrics or green plot ratios to examine its influence on microclimate and cooling performance across park configurations.

5. Conclusions

There is an urgent need to prepare cities for future climate conditions and develop appropriate adaptation strategies. Urban parks, through their vegetation, can provide the PCI effect and offer some relief from hot weather. Nonetheless, there appears to be no definitive relationship between park size or configuration and the extent of PCI in providing thermal comfort, with only a minor impact on PCI extent. Tree canopies offer the greatest cooling, regardless of park size, while exposed grass areas were sometimes hotter than surrounding streets. While bushland areas may offer less direct interaction depending on accessibility, tree canopy emerged as the main driver of cooling under both present and future climates, highlighting the importance of prioritising canopy cover in future planning and design decisions by urban designers, planners, and policymakers. Future research is needed to understand how climate change may drive morphological changes in both the built and natural environment.

Author Contributions

Conceptualization, M.B., B.G., J.B. and N.E.; methodology, M.B., B.G., and J.B.; software, M.B.; validation, M.B. and B.G.; formal analysis, M.B. and B.G.; investigation, M.B. and B.G.; resources, J.B.; data curation, M.B.; writing—original draft preparation, M.B.; writing—review and editing, M.B., B.G., N.E. and J.B.; visualization, M.B.; supervision, J.B.; project administration, J.B.; funding acquisition, J.B. All authors have read and agreed to the published version of the manuscript.

Funding

This research was funded by the Western Australian Planning Commission (WAPC), the Department of Planning, Lands and Heritage (DPLH), Development WA and the Department of Housing and Works grant number [GR000705]. It was also supported by an Australian Government Research Training Program (RTP) Scholarship awarded to M.B.

Data Availability Statement

The original contributions presented in this study are included in the article. Further inquiries can be directed to the corresponding author.

Conflicts of Interest

The authors declare no conflicts of interest.

Abbreviations

The following abbreviations are used in this manuscript:
CEDCooling Effect Distance
CEICooling Effect Intensity
CMIP5Coupled Model Intercomparison Project Phase 5
IPCCIntergovernmental Panel on Climate Change
LADLeaf Area Density
LNLiveable Neighbourhoods
LSTLand Surface Temperature
MRTMean Radiant Temperature
OUT_SETOutdoor Standard Effective Temperature
PCIPark Cool Island
PETPhysiological Equivalent Temperature
POSPublic Open Space
RCPRepresentative Concentration Pathway
UHIUrban Heat Island
UTCIUniversal Thermal Climate Index
WSUDWater-Sensitive Urban Design

Appendix A

For the creation of each tree species in ENVI-met, the closest match in canopy shape was selected from the existing QSM (Quantitative Structure Model) trees in the software’s default library using the Albedo program. The selected trees were then modified according to the following parameters: leaf type, leaf positioning, number of leaves per node, leaf rotational angle, plant geometry (including height and width), and root diameter and depth. The tree calendar was also adjusted for both leaves and florescence. Skeleton adjustments were not required; however, in some cases, a scaling factor was applied to the skeleton. Additionally, the software help centre advised that other parameters, such as leaf weight and isoprene capacity, are only necessary for BVOC–ozone studies and therefore did not need to be specified for this study. An example is provided below.
Table A1. Process of Tree Creation in ENVI-met.
Identified Tree Species in Site Visit/ImageClassification Modelled Tree in ENVI-Met Details in ENVI-Met
Eucalyptus (old)/
Land 14 02172 i041
30 m > Eucalyptus Trees ≥ 25 mLand 14 02172 i042Land 14 02172 i043

Appendix B

Figure A1. Wind Speed & Direction Distribution Maps—4 pm Average Summer Day. (a) Radburn case study: present climate. (b) Neighborhood parks case study: present climate. (c) Bush Forever case study: present climate. (d) Recreation movement case study: present climate. (e) Public Park case study: present climate. (f) Radburn case study: future 2090. (g) Neighborhood parks case study: future 2090. (h) Bush Forever case study: future 2090. (i) Recreation movement case study: future 2090. (j) Public Park case study: future 2090.
Land 14 02172 g0a1aLand 14 02172 g0a1b

References

  1. IPCC. Working Group Ii Sixth Assessment Report; IPCC: Geneva, Switzerland, 2022. [Google Scholar]
  2. Australian Government. National Climate Resilience and Adaptation Strategy; Australian Government: Canberra, Australia, 2015. [Google Scholar]
  3. Nairn, J.R.; Fawcett, R.J.B. The Excess Heat Factor: A Metric for Heatwave Intensity and Its Use in Classifying Heatwave Severity. Int. J. Environ. Res. Public Health 2015, 12, 227–253. [Google Scholar] [CrossRef]
  4. Zander, K.; Oppermann, E.; Kjellstrom, T.; Garnett, S. Heat Stress Causes Substantial Labour Productivity Loss in Australia. Nat. Clim. Chang. 2015, 5, 647–651. [Google Scholar] [CrossRef]
  5. Government of Western Australia. Western Australian Climate Projections; Department of Water and Environmental Regulation: Perth, Australia, 2021. [Google Scholar]
  6. Hausfather, Z. Explainer: The High-Emissions ‘Rcp8.5′ Global Warming Scenario. Carbon Brief. Available online: https://www.carbonbrief.org/explainer-the-high-emissions-rcp8-5-global-warming-scenario (accessed on 21 May 2021).
  7. Santamouris, M. Analyzing the Heat Island Magnitude and Characteristics in One Hundred Asian and Australian Cities and Regions. Sci. Total Environ. 2015, 512-513, 582–598. [Google Scholar] [CrossRef]
  8. Sharifi, E.; Sivam, A.; Boland, J. Resilience to Heat in Public Space: A Case Study of Adelaide, South Australia. J. Environ. Plan. Manag. 2016, 59, 1833–1854. [Google Scholar] [CrossRef]
  9. Shooshtarian, S.; Lam, C.K.C.; Kenawy, I. Outdoor Thermal Comfort Assessment: A Review on Thermal Comfort Research in Australia. Build. Environ. 2020, 177, 106917. [Google Scholar] [CrossRef]
  10. Corella, J.P.; Stefanova, V.; El Anjoumi, A.; Rico, E.; Giralt, S.; Moreno, A.; Plata-Montero, A.; Valero-Garcés, B.L. A 2500-Year Multi-Proxy Reconstruction of Climate Change and Human Activities in Northern Spain: The Lake Arreo Record. Palaeogeogr. Palaeoclimatol. Palaeoecol. 2013, 386, 555–568. [Google Scholar] [CrossRef]
  11. Coutts, A.M.; White, E.C.; Tapper, N.J.; Beringer, J.; Livesley, S.J. Temperature and Human Thermal Comfort Effects of Street Trees across Three Contrasting Street Canyon Environments. Theor. Appl. Climatol. 2015, 124, 55–68. [Google Scholar] [CrossRef]
  12. Howe, D.A.; Hathaway, J.M.; Ellis, K.N.; Mason, L.R. Spatial and Temporal Variability of Air Temperature across Urban Neighborhoods with Varying Amounts of Tree Canopy. Urban For. Urban Green. 2017, 27, 109–116. [Google Scholar] [CrossRef]
  13. Cooperative Research Centre for Water Sensitive Cities. Designing for a Cool City–Guidelines for Passively Irrigated Landscapes; Cooperative Research Centre for Water Sensitive Cities: Melbourne, Australia, 2020. [Google Scholar]
  14. Lenzholzer, S. Weather in the City: How Design Shapes the Urban Climate. Hung. Geogr. Bull. 2016, 65, 198–199. [Google Scholar] [CrossRef]
  15. Algretawee, H.; Rayburg, S.; Neave, M. Estimating the Effect of Park Proximity to the Central of Melbourne City on Urban Heat Island (Uhi) Relative to Land Surface Temperature (Lst). Ecol. Eng. 2019, 138, 374–390. [Google Scholar] [CrossRef]
  16. Aram, F.; Solgi, E.; Ester Higueras, G.; Mosavi, A.; Várkonyi-Kóczy, A.R. The Cooling Effect of Large-Scale Urban Parks on Surrounding Area Thermal Comfort. Energies 2019, 12, 3904. [Google Scholar] [CrossRef]
  17. Yan, H.; Wu, F.; Dong, L. Influence of a Large Urban Park on the Local Urban Thermal Environment. Sci. Total Environ. 2018, 622–623, 882–891. [Google Scholar] [CrossRef]
  18. Grace, B.; Bolleter, J.; Barghchi, M.; Lund, J. Unpacking Park Cool Island Effects Using Remote-Sensed, Measured and Modelled Microclimatic Data. Land 2025, 14, 1686. [Google Scholar] [CrossRef]
  19. Barghchi, M.; Grace, B.; Edwards, N.; Bolleter, J.; Hooper, P. Park Thermal Comfort and Cooling Mechanisms in Present and Future Climate Scenarios. Urban For. Urban Green. 2024, 101, 128533. [Google Scholar] [CrossRef]
  20. Al-Gretawee, H.; Rayburg, S.; Neave, M. The Cooling Effect of a Medium Sized Park on an Urban Environment. Int. J. Geomate 2016, 11, 2541–2546. [Google Scholar] [CrossRef]
  21. Aram, F.; Higueras García, E.; Solgi, E.; Mansournia, S. Urban Green Space Cooling Effect in Cities. Heliyon 2019, 5, e01339. [Google Scholar] [CrossRef]
  22. Ouyang, W.; Morakinyo, T.E.; Lee, Y.; Tan, Z.; Ren, C.; Ng, E. How to Quantify the Cooling Effects of Green Infrastructure Strategies from a Spatio-Temporal Perspective: Experience from a Parametric Study. Landsc. Urban Plan. 2023, 237, 104808. [Google Scholar] [CrossRef]
  23. Qiu, K.; Jia, B. The Roles of Landscape Both inside the Park and the Surroundings in Park Cooling Effect. Sustain. Cities Soc. 2020, 52, 101864. [Google Scholar] [CrossRef]
  24. Zhang, Y.; Lin, Z.; Fang, Z.; Zheng, Z. An Improved Algorithm of Thermal Index Models Based on Envi-Met. Urban Clim. 2022, 44, 101190. [Google Scholar] [CrossRef]
  25. Yu, Z.; Yu, R.; Ge, X.; Fu, J.; Hu, Y.; Chen, S. Tabular Prior-Data Fitted Network for Urban Air Temperature Inference and High Temperature Risk Assessment. Sustain. Cities Soc. 2025, 128, 106484. [Google Scholar] [CrossRef]
  26. Pan, Y.; Morimoto, T.; Ichinose, T. Combining Multi-Source Satellite Data with a Microclimate Model to Analyze the Microclimate of an Urban Park. Climate 2024, 12, 197. [Google Scholar] [CrossRef]
  27. Chen, L.; Wen, Y.; Zhang, L.; Xiang, W.-N. Studies of Thermal Comfort and Space Use in an Urban Park Square in Cool and Cold Seasons in Shanghai. Build. Environ. 2015, 94, 644–653. [Google Scholar] [CrossRef]
  28. Staiger, H.; Laschewski, G.; Grätz, A. The Perceived Temperature—A Versatile Index for the Assessment of the Human Thermal Environment. Part A: Scientific Basics. Int. J. Biometeorol. 2012, 56, 165–176. [Google Scholar] [CrossRef] [PubMed]
  29. Zhang, J.; Gou, Z.; Lu, Y.; Lin, P. The Impact of Sky View Factor on Thermal Environments in Urban Parks in a Subtropical Coastal City of Australia. Urban For. Urban Green. 2019, 44, 126422. [Google Scholar] [CrossRef]
  30. Golasi, I.; Salata, F.; de Lieto Vollaro, E.; Coppi, M.; de Lieto Vollaro, A. Thermal Perception in the Mediterranean Area: Comparing the Mediterranean Outdoor Comfort Index (Moci) to Other Outdoor Thermal Comfort Indices. Energies 2016, 9, 550. [Google Scholar] [CrossRef]
  31. Zare, S.; Hasheminejad, N.; Shirvan, H.E.; Hemmatjo, R.; Sarebanzadeh, K.; Ahmadi, S. Comparing Universal Thermal Climate Index (Utci) with Selected Thermal Indices/Environmental Parameters during 12 Months of the Year. Weather Clim. Extrem. 2018, 19, 49–57. [Google Scholar] [CrossRef]
  32. Deb, C.; Alur, R. The Significance of Physiological Equivalent Temperature (Pet) in Outdoor Thermal Comfort Studies. Int. J. Eng. Sci. Technol. 2010, 2, 2825–2828. [Google Scholar]
  33. Höppe, P. The Physiological Equivalent Temperature-a Universal Index for the Biometeorological Assessment of the Thermal Environment. Int. J. Biometeorol. 1999, 43, 71–75. [Google Scholar] [CrossRef]
  34. United Nations. Transforming Our World: The 2030 Agenda for Sustainable Development; United Nations: New York, NY, USA, 2015. [Google Scholar]
  35. Bartesaghi Koc, C.; Osmond, P.; Peters, A. Evaluating the Cooling Effects of Green Infrastructure: A Systematic Review of Methods, Indicators and Data Sources. Sol. Energy 2018, 166, 486–508. [Google Scholar] [CrossRef]
  36. Carter, J.G. Climate Change Adaptation in European Cities. Curr. Opin. Environ. Sustain. 2011, 3, 193–198. [Google Scholar] [CrossRef]
  37. Meili, N.; Manoli, G.; Burlando, P.; Carmeliet, J.; Chow, W.T.L.; Coutts, A.M.; Roth, M.; Velasco, E.; Vivoni, E.R.; Fatichi, S. Tree Effects on Urban Microclimate: Diurnal, Seasonal, and Climatic Temperature Differences Explained by Separating Radiation, Evapotranspiration, and Roughness Effects. Urban For. Urban Green. 2021, 58, 126970. [Google Scholar] [CrossRef]
  38. Taleghani, M.; Kleerekoper, L.; Tenpierik, M.; van den Dobbelsteen, A. Outdoor Thermal Comfort within Five Different Urban Forms in the Netherlands. Build. Environ. 2015, 83, 65–78. [Google Scholar] [CrossRef]
  39. Cheng, H.; Han, Y.; Park, C. Quantitative Analysis of Differences in Cooling Effect and Efficiency after Changes in Green Infrastructure Types (Git). Sustain. Cities Soc. 2025, 119, 106101. [Google Scholar] [CrossRef]
  40. Lu, Y.; Wu, J.; Liu, M. Decoding the Cooling Potential of Urban Green Spaces: A Cross-City Investigation of Driving Factors in 311 Chinese Cities under Varying Climate Zones. Sustain. Cities Soc. 2025, 126, 106410. [Google Scholar] [CrossRef]
  41. Rubel, F.; Kottek, M. World Maps of Köppen-Geiger Climate Classification. Available online: http://koeppen-geiger.vu-wien.ac.at (accessed on 2 August 2023).
  42. Young, E. Research Reveals Perth’s Hottest Real Estate. In Terms of Tree Cover; WAtoday: Perth, Australia, 2015. [Google Scholar]
  43. Australian Academy of Science. The Risks to Australia of a 3 °C Warmer World; Australian Academy of Science: Canberra, Australia, 2021. [Google Scholar]
  44. Department of Sport and Recreation. Classification Framework for Public Open Space; Department of Sport and Recreation: Perth, Australia, 2012. [Google Scholar]
  45. Byrne, J.; Sipe, N. Green and Open Space Planning for Urban Consolidation—A Review of the Literature and Best Practice; Griffith University: Brisbane, Australia, 2010. [Google Scholar]
  46. Summers, L. From Wasteland to Parkland: A History of Designed Public Open Space in the City of Perth, Western Australia, 1829–1965; University of Melbourne: Parkville, Australia, 2007. [Google Scholar]
  47. Department of Planning Lands and Heritage. Urban Forest Mesh Blocks; Department of Planning Lands and Heritage: Perth, Australia, 2020. [Google Scholar]
  48. City of Vincent. Polyphagous Shot-Hole Borer. Available online: https://www.vincent.wa.gov.au/our-neighbourhood/environment-liveability/trees/polyphagous-shot-hole-borer.aspx (accessed on 5 December 2024).
  49. Garnaut, C.; Freestone, R.; Iwanicki, I. Cold War Heritage and the Planned Community: Woomera Village in Outback Australia. Int. J. Herit. Stud. 2012, 18, 541–563. [Google Scholar] [CrossRef]
  50. Crestwood Home Owners’ Association. “Estate Information.” Crestwood Home Owners’ Association. Available online: https://www.crestwood.org.au/the-estate/estate-information/ (accessed on 12 June 2025).
  51. Hooper, P.; Edwards, N. The Australian Park Life Project: Development of a Nationally Standardised Spatial Layer and Public Participatory Gis for Greenspace in Australian Capital Cities. MethodsX 2024, 13, 102856. [Google Scholar] [CrossRef]
  52. Western Australian Planning Commission. Bushland Policy for the Perth Metropolitan Region; Western Australian Planning Commission: Perth, Australia, 2005. [Google Scholar]
  53. Davis, G.; Harford-Mills, G. Examining 60 Years of Strategic Planning in Metropolitan Perth and Peel; Fact Base Bulletin Committee for Perth: Perth, Australia, 2016. [Google Scholar]
  54. Western Australian Planning Commission. Liveable Neighbourhoods: A Western Australian Government Sustainable Cities Initiative; Western Australian Planning Commission: Perth, Australia, 2009. [Google Scholar]
  55. Envi-Met. Available online: https://envi-met.com/ (accessed on 28 September 2025).
  56. Fischereit, J.; Schlünzen, K.H. Evaluation of Thermal Indices for Their Applicability in Obstacle-Resolving Meteorology Models. Int. J. Biometeorol. 2018, 62, 1887–1900. [Google Scholar] [CrossRef]
  57. Morakinyo, T.E.; Lam, Y.F. Simulation Study on the Impact of Tree-Configuration, Planting Pattern and Wind Condition on Street-Canyon’s Micro-Climate and Thermal Comfort. Build. Environ. 2016, 103, 262–275. [Google Scholar] [CrossRef]
  58. City of Perth. Urban Greening Strategy 2023–2036; City of Perth: Perth, Australia, 2024. [Google Scholar]
  59. City of Perth. Urban Forest Plan 2016–2036; City of Perth: Perth, Australia, 2016. [Google Scholar]
  60. Middle, G.; Tye, M.; Middle, I. Emerging Constraints for Public Open Space in Perth Metropolitan Suburbs: Implications of Bush Forever, Water Sensitive Urban Design and Liveable Neighbourhoods for Active Sport and Recreation; Department of Sport and Recreation WA: Perth, Australia, 2010. [Google Scholar]
  61. Lin, W.; Yu, T.; Chang, X.; Wu, W.; Zhang, Y. Calculating Cooling Extents of Green Parks Using Remote Sensing: Method and Test. Landsc. Urban Plan. 2015, 134, 66–75. [Google Scholar] [CrossRef]
  62. Sun, Y.; Gao, C.; Li, J.; Gao, M.; Ma, R. Assessing the Cooling Efficiency of Urban Parks Using Data Envelopment Analysis and Remote Sensing Data. Theor. Appl. Climatol. 2021, 145, 903–916. [Google Scholar] [CrossRef]
  63. Yu, Z.; Guo, X.; Jørgensen, G.; Vejre, H. How Can Urban Green Spaces Be Planned for Climate Adaptation in Subtropical Cities? Ecol. Indic. 2017, 82, 152–162. [Google Scholar] [CrossRef]
  64. Zhu, W.; Sun, J.; Yang, C.; Liu, M.; Xu, X.; Ji, C. How to Measure the Urban Park Cooling Island? A Perspective of Absolute and Relative Indicators Using Remote Sensing and Buffer Analysis. Remote Sens. 2021, 13, 3154. [Google Scholar] [CrossRef]
  65. Balany, F.; Ng, A.W.; Muttil, N.; Muthukumaran, S.; Wong, M.S. Green Infrastructure as an Urban Heat Island Mitigation Strategy—A Review. Water 2020, 12, 3577. [Google Scholar] [CrossRef]
  66. Petralli, M.; Massetti, L.; Pearlmutter, D.; Brandani, G.; Messeri, A.; Orlandini, S. Utci Field Measurements in an Urban Park in Florence (Italy). Misc. Geogr. 2020, 24, 111–117. [Google Scholar] [CrossRef]
  67. Kong, L.; Lau, K.K.-L.; Yuan, C.; Chen, Y.; Xu, Y.; Ren, C.; Ng, E. Regulation of Outdoor Thermal Comfort by Trees in Hong Kong. Sustain. Cities Soc. 2017, 31, 12–25. [Google Scholar] [CrossRef]
  68. Adams, M.P.; Smith, P.L. A Systematic Approach to Model the Influence of the Type and Density of Vegetation Cover on Urban Heat Using Remote Sensing. Landsc. Urban Plan. 2014, 47–54. [Google Scholar] [CrossRef]
  69. Wu, Y.; Patuano, A.; Mashhoodi, B.; Lenzholzer, S.; Acred, A.; Narvaez Zertuche, L. How Small Green Spaces Cool Urban Neighbourhoods: Optimising Distribution, Size and Shape. Landsc. Urban Plan. 2025, 253, 105224. [Google Scholar] [CrossRef]
  70. Motazedian, A.; Coutts, A.M.; Tapper, N.J. The Microclimatic Interaction of a Small Urban Park in Central Melbourne with Its Surrounding Urban Environment during Heat Events. Urban For. Urban Green. 2020, 52, 126688. [Google Scholar] [CrossRef]
  71. Gherri, B.; Maiullari, D.; Finizza, C.; Maretto, M.; Naboni, E. On the Thermal Resilience of Venetian Open Spaces. Heritage 2021, 4, 4286–4303. [Google Scholar] [CrossRef]
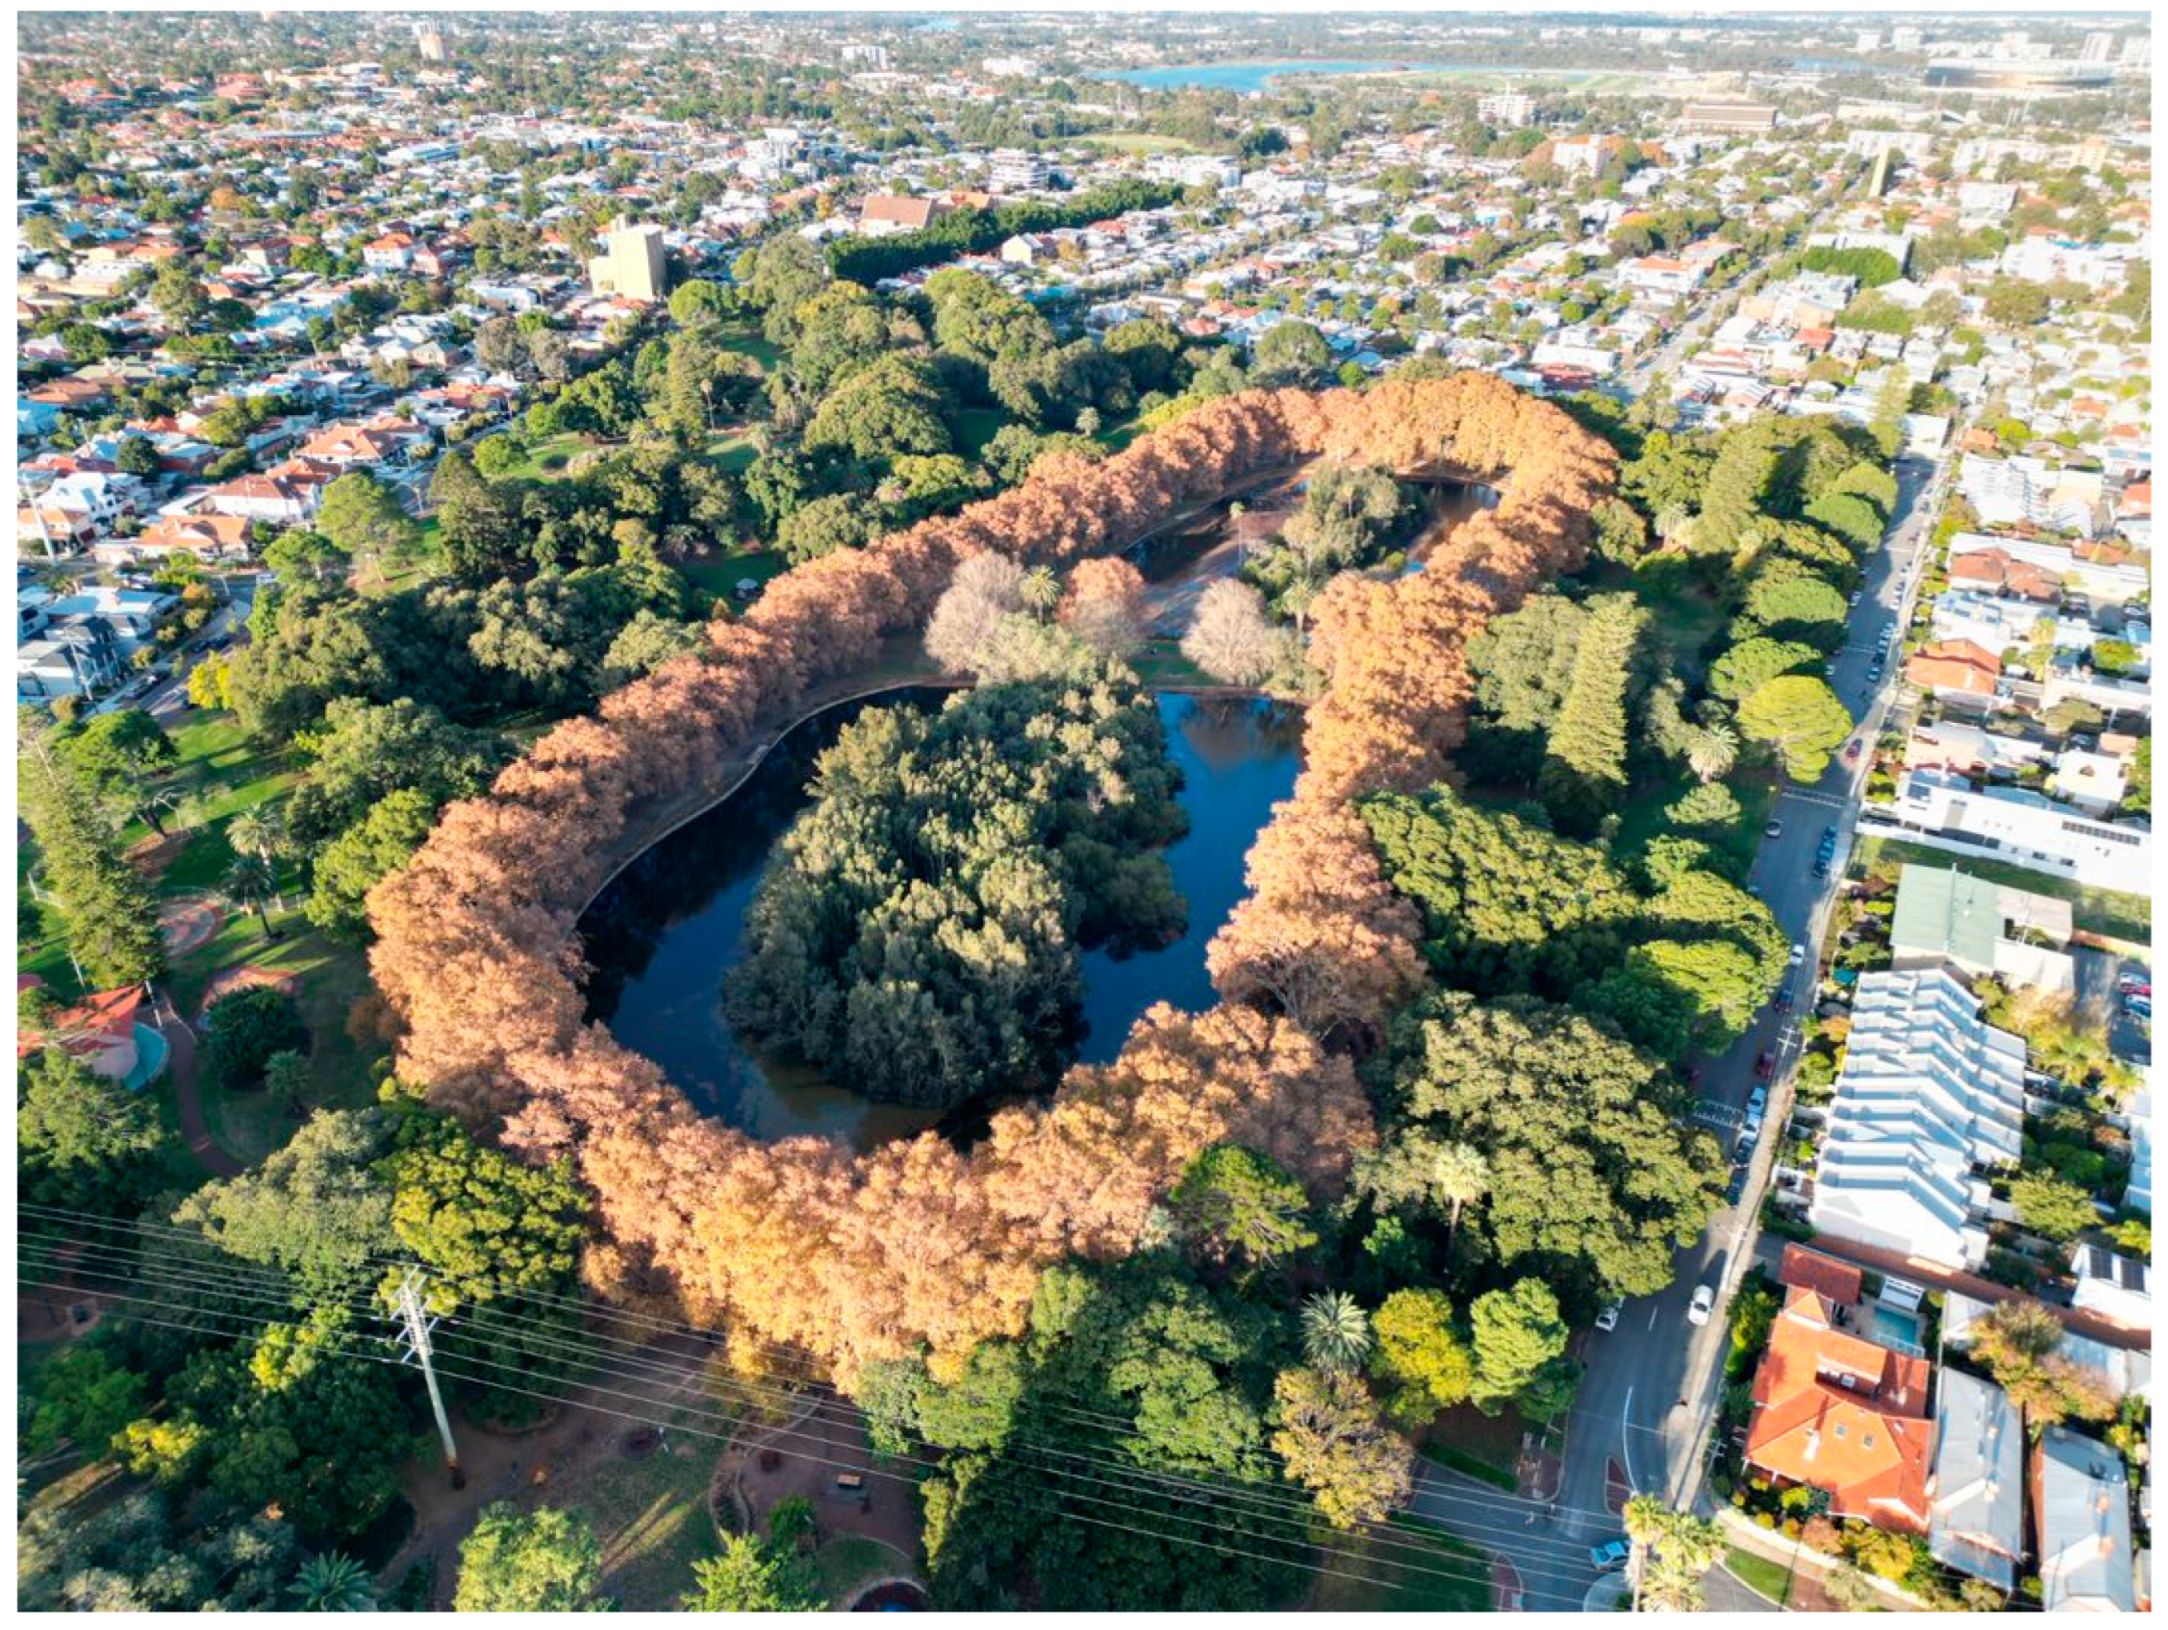
Figure 1. Drone image—Hyde Park—Public Park movement.
Land 14 02172 g001
Figure 2. Drone image—Enright Reserve—Recreation movement.
Land 14 02172 g002
Figure 3. Drone image—Crestwood Estate Parks—Radburn linear park system.
Land 14 02172 g003
Figure 4. Drone image—Mac Naughton Park—Bush Forever.
Land 14 02172 g004
Figure 5. Drone image—Garry Meinck, Killcarry & Portsalon Parks—New Urbanism neighbourhood parks.
Land 14 02172 g005
Figure 6. Present (a) vs. 2090 under RCP 8.5 (b) weather input.
Land 14 02172 g006
Figure 7. LST Distribution Maps—4 pm Average Summer Day. (a) Radburn case study: present climate. (b) Neighborhood parks case study: present climate. (c) Bush Forever case study: present climate. (d) Recreation movement case study: present climate. (e) Public Park case study: present climate. (f) Radburn case study: future 2090. (g) Neighborhood parks case study: future 2090. (h) Bush Forever case study: future 2090. (i) Recreation movement case study: future 2090. (j) Public Park case study: future 2090.
Land 14 02172 g007
Figure 8. MRT Distribution Maps—4 pm Average Summer Day. (a) Radburn case study: present climate. (b) Neighborhood parks case study: present climate. (c) Bush Forever case study: present climate. (d) Recreation movement case study: present climate. (e) Public Park case study: present climate. (f) Radburn case study: future 2090. (g) Neighborhood parks case study: future 2090. (h) Bush Forever case study: future 2090. (i) Recreation movement case study: future 2090. (j) Public Park case study: future 2090.
Land 14 02172 g008
Figure 9. PET Distribution Maps—4 pm Average Summer Day. (a) Radburn case study: present climate. (b) Neighborhood parks case study: present climate. (c) Bush Forever case study: present climate. (d) Recreation movement case study: present climate. (e) Public Park case study: present climate. (f) Radburn case study: future 2090. (g) Neighborhood parks case study: future 2090. (h) Bush Forever case study: future 2090. (i) Recreation movement case study: future 2090. (j) Public Park case study: future 2090.
Land 14 02172 g009
Figure 10. PET comparisons under tree canopies across different park case studies—the upper dashed line represents the extreme heat stress threshold, and the lower dashed line represents the strong heat stress threshold.
Land 14 02172 g010
Figure 11. MRT comparisons under tree canopies across different park case studies.
Land 14 02172 g011
Figure 12. LST comparisons under tree canopies across different park case studies.
Land 14 02172 g012
Table 1. Parks and Study Areas.
Case Study NamePublic Park
Movement Case Study
Recreation
Movement Case Study
Radburn Linear Parks Case StudyBush Forever Case StudyNeighbourhood Parks Case Study
Park nameHyde ParkEnright ReserveCrestwood Estate ParksMac Naughton ParkGarry Meinck, Kill carry & Portsalon Parks
Urban Planning PhaseInner Suburbs (Pre-1950s)Middle Suburbs (1950s–1970s) and contemporary infill planningMiddle Suburbs (1960s–1980s)Bush Forever Suburbs (1990s)Liveable Neighbourhoods (LN) Suburbs (Post-1997)
Aerial imageLand 14 02172 i001Land 14 02172 i002Land 14 02172 i003Land 14 02172 i004Land 14 02172 i005
Area of park in hectares (ha)15.5 ha3 haEach park has an area of 0.5 to 2.5 ha5 ha (incl 1.5 ha of bushland)Each park has an area of <1 ha
Category/functionDistrict/recreation, natureNeighbourhood/sports,
recreation
Local & Neighbourhood/
recreation, nature
Neighbourhood/sports,
recreation, nature
Local/
recreation
Tree canopy cover in the park59.5%26.3%53.8%13.8%4.95%
Grass cover in the park18.7%53.2%19.6%33.1%22%
Park configurationLand 14 02172 i006
Rectangular
Land 14 02172 i007
Square
Land 14 02172 i008
Linear
Land 14 02172 i009RectangularLand 14 02172 i010
Rectangular
(distributed)
Table 2. ENVI-met Modelling and simulation input parameters.
Domain Size500 × 500 × 50 (Height)
Grid spatial resolution2 m
MeteorologyFull forcing using EPW file + enabled IVS radiation
Modelling featuresBuildings: (default building) moderate insulation wall, between and below buildings: Pavement (concrete)
Soils: Default unsealed soil (Sandy soil), sandy soil placed below simple and 3D vegetation
Surfaces: Asphalt road, wood chip mulch, light concrete pavement
Vegetation (2D): non-irrigated grass: 2 cm, 5 cm, 20 cm
Trees (3D): Simplified to 11 different trees in different sizes (in total 30)
Duration14 h
Table 3. Modelling Process.
Case
Studies
Public Park Case StudyRecreation
Movement Case Study
Radburn Linear Park Case StudyBush Forever Case StudyNeighbourhood Park Case Study
Simulation ProcessGISLand 14 02172 i011Land 14 02172 i012Land 14 02172 i013Land 14 02172 i014Land 14 02172 i015
MondeLand 14 02172 i016
Land 14 02172 i021
Land 14 02172 i017
Land 14 02172 i022
Land 14 02172 i018
Land 14 02172 i023
Land 14 02172 i019
Land 14 02172 i024
Land 14 02172 i020
Land 14 02172 i025
Space 2DLand 14 02172 i026Land 14 02172 i027Land 14 02172 i028Land 14 02172 i029Land 14 02172 i030
Space 3DLand 14 02172 i031Land 14 02172 i032Land 14 02172 i033Land 14 02172 i034Land 14 02172 i035
VegetationSimpleGrass 2 cmGrass 5 cm Grass 5 cmGrass 5 cm & 20 cmGrass 5 cm
3D plantsLand 14 02172 i036Land 14 02172 i037Land 14 02172 i038Land 14 02172 i039Land 14 02172 i040
Table 4. Summary of differences across park case studies under tree canopies and study areas combined in streets—present and future—4 pm average summer day.
VariablesTimeframeStreetsNeighbourhood Parks Case StudyRecreation Movement Case StudyRadburn Linear Parks Case StudyBush Forever Case StudyPublic Park Movement Case Study
PET(°C)Present47.6137.41–40.6132.21–40.6130.81–37.8130.81–35.0130.81–33.61
Future50.4139.21–44.8137.81–42.0135.01–40.6132.21–40.6132.21–40.61
MRT (°C)Present62.9042.20–51.4039.90–51.4026.10–51.4026.10–51.4026.10–51.40
Future65.2042.20–53.7042.20–53.728.4–53.7028.40–53.7028.4–51.40
LST (°C)Present42.532–3830.5–3529–33.523–3527.5–33.5
Future4433.5–4133.5–3833.5–36.524.5–3530.5–36.5
Disclaimer/Publisher’s Note: The statements, opinions and data contained in all publications are solely those of the individual author(s) and contributor(s) and not of MDPI and/or the editor(s). MDPI and/or the editor(s) disclaim responsibility for any injury to people or property resulting from any ideas, methods, instructions or products referred to in the content.