Article

Exploring Multi-Scale Synergies, Trade-Offs, and Driving Mechanisms of Ecosystem Services in Arid Regions: A Case Study of the Ili River Valley

1
School of Resources and Environment, Yili Normal University, Yining 835000, China
2
Institute of Resources and Ecology, Yili Normal University, Yining 835000, China
3
State Key Laboratory of Desert and Oasis Ecology, Key Laboratory of Ecological Safety and Sustainable Development in Arid Lands, Xinjiang Institute of Ecology and Geography, Chinese Academy of Sciences, Urumqi 830011, China
4
Xinjiang Institute of Ecology and Geography, Chinese Academy of Sciences, Urumqi 830011, China
*
Authors to whom correspondence should be addressed.
Land 2025, 14(11), 2166; https://doi.org/10.3390/land14112166
Submission received: 8 October 2025 / Revised: 25 October 2025 / Accepted: 28 October 2025 / Published: 30 October 2025

Abstract

Understanding the interactions among ecosystem services (ESs) and their spatiotemporal dynamics is pivotal for sustainable ecosystem management, particularly in arid regions where water scarcity imposes significant constraints. This study focuses on the Ili River Valley, a representative arid region, to investigate the evolution of ESs, their trade-offs and synergies, and the underlying driving mechanisms from a water-resource-constrained perspective. We assessed five key ESs—soil retention (SR), habitat quality (HQ), water purification (WP), carbon sequestration (CS), and water yield (WY)—utilizing multi-source remote sensing and statistical data spanning 2000 to 2020. Employing the Integrated Valuation of Ecosystem Services and Tradeoffs (InVEST) model, Spearman correlation analysis, Geographically Weighted Regression (GWR), and the Geodetector method, we conducted a comprehensive analysis at both sub-watershed and 500 m grid scales. Our findings reveal that, except for SR and WP, the remaining three ESs exhibited an overall increasing trend over the two-decade period. Trade-off relationships predominantly characterize the ESs in the Ili River Valley; however, these interactions vary temporally and across spatial scales. Natural factors, including precipitation, temperature, and soil moisture, primarily drive WY, CS, and SR, whereas anthropogenic factors significantly influence HQ and WP. Moreover, the impact of these driving factors exhibits notable differences across spatial scales. The study underscores the necessity for ES management strategies tailored to specific regional characteristics, accounting for scale-dependent variations and the dual influences of natural and human factors. Such strategies are essential for formulating region-specific conservation and restoration policies, providing a scientific foundation for sustainable development in ecologically vulnerable arid regions.

1. Introduction

Ecosystem services (ESs) encompass the myriad benefits that natural ecosystems confer upon humanity through their inherent functions and processes. These services are typically categorized into provisioning, regulating, supporting, and cultural services, each playing a pivotal role in sustaining human survival and well-being [1,2]. For instance, forest ecosystems contribute to climate regulation via carbon sequestration while simultaneously offering timber resources and enhancing water retention capacities [3]. However, the escalating impacts of global climate change, land-use transformations, and intensified anthropogenic activities have markedly compromised the capacity of ecosystems to deliver these essential services. This degradation is particularly pronounced in arid and semi-arid regions, where the inherent fragility of ecosystems exacerbates the instability of service functions. In China, for example, grassland degradation in these regions has led to significant declines in soil retention and water conservation services, thereby posing substantial threats to ecological security [4]. In this context, a systematic investigation into the dynamic evolution and interrelationships of ecosystem services emerges as a critical endeavor. Such research not only addresses a central theme in ecology but also fulfills an urgent need for informed regional ecological management and the sustainable utilization of resources [5].
ESs exhibit complex trade-offs and synergies, with spatiotemporal heterogeneity in these relationships being particularly pronounced across different regions and scales [6,7]. In the Yellow River Basin of China, ecological restoration policies have significantly enhanced the synergies between soil retention and carbon sequestration, although a trade-off exists with water yield [8]. In agricultural landscapes, excessive fertilization often leads to multiple trade-offs between water purification services and other ESs [9]. In recent years, trade-off and synergy analyses have become a central focus in ecosystem service research. Scholars have utilized correlation analysis, scenario modeling, and spatial regression methods to uncover the dynamic interactions between services. For example, Ling et al. (2023) used scenario modeling to assess the impact of urbanization on service trade-offs [10], while Lan et al. (2023) employed spatial regression to explore regional differences in service interactions [11]. However, existing studies have primarily focused on single time periods or coarse spatial scales, overlooking the evolving patterns of service relationships across multiple scales and temporal phases. This gap is especially pronounced in arid regions, where the complexity of ecological processes and resource limitations have hindered a thorough understanding of service interactions [12,13]. Furthermore, the spatial heterogeneity of driving factors and their integrated influence on service relationships have not been systematically explored, limiting a comprehensive understanding of the dynamic patterns of ecosystem services [14,15].
Traditional approaches to ES assessment often rely on the InVEST model, which integrates biophysical and socioeconomic data to quantitatively evaluate service provision levels. Many researchers utilized the InVEST model to assess global carbon stocks and habitat quality [16]. However, this model typically employs global statistical methods, such as Pearson correlation analysis or ordinary least squares regression, which struggle to capture the full spatial non-stationarity of service interactions [17]. Furthermore, while Spearman correlation analysis can provide preliminary insights into positive or negative correlations between services, it lacks the depth needed to uncover spatial heterogeneity and driving mechanisms. To address these limitations, this study introduces a novel methodological framework by integrating the InVEST model with bidirectional geographically weighted regression (bi-GWR) and geographic detectors. This approach enhances the spatial resolution of service interaction analysis by allowing regression coefficients to vary spatially, thus capturing fine-scale heterogeneity that traditional global models overlook. The use of geographic detectors further enables a robust quantification of the interactive effects of natural and anthropogenic drivers, providing a deeper understanding of the mechanisms shaping ES dynamics in arid regions.
Current ES research often uses administrative boundaries or watershed units, which results in relatively coarse spatial scales that fail to account for intra-regional ecological heterogeneity [18,19,20]. Wei et al. (2022) [21] evaluated service changes at the provincial scale but were unable to capture spatial variation at the county level. In particular, in arid regions, the high variability in topography, hydrology, and land use underscores the necessity of fine-scale studies [21]. This research takes an innovative approach by subdividing the study area into 160 sub-watersheds and conducting multi-scale analysis with a 500 m grid resolution. This dual-scale framework captures both macro-level ecological processes and micro-level spatial variations, offering a comprehensive perspective on scale-dependent ES dynamics. Unlike previous studies that rely on single-scale analyses, this approach reveals nuanced patterns of trade-offs and synergies, particularly in the context of water resource constraints, thereby advancing the precision of ecological management strategies in arid environments. The goal is to reveal the micro-level differences in service changes and scale effects. By comparing service relationships at the sub-watershed and grid scales, this study provides a more comprehensive understanding of the spatial patterns of ecosystem service synergies and trade-offs, offering high-resolution data support for precise ecological management in arid regions.
The Ili River Valley, located at the confluence of the Tianshan Mountains and the Ili River in western China, serves as a crucial ecological and geographical node connecting Central Asia with the inland of China [22]. This region is characterized by complex topography, diverse vegetation, and unique hydrothermal conditions, making it an ideal study area for examining the evolution of ecosystem services in arid regions. The wetlands and forest ecosystems in the area provide critical habitats for various rare and endangered species, while also regulating regional climate and hydrological cycles [23]. However, in recent years, the unchecked expansion of agriculture and livestock farming, coupled with land-use changes and climate change, has exacerbated ecological issues. As such, the Ili River Valley offers a unique perspective for investigating multi-scale trade-offs and synergies in ecosystem services, while simultaneously underscoring the urgent need for regional ecological conservation and sustainable development.
To address the gap in research on the synergies and trade-offs of ecosystem services in river valley regions under the constraints of water resources in arid areas, this study focuses on the Ili River Valley. A multi-scale analysis framework was developed, integrating fine-scale 500 m grid data with macro-scale sub-watershed data, to comprehensively assess the spatiotemporal dynamics of five key ecosystem services (carbon sequestration, soil retention, water purification, water yield, and habitat quality) from 2000 to 2020. This framework leverages the complementary strengths of both scales to enhance the resolution and interpretability of ecological processes, a novel contribution to ES research in arid regions where such integrated approaches are scarce. Using geographic detectors, the study examines the driving mechanisms of service relationship dynamics from two dimensions: natural environmental factors (such as precipitation, temperature, and topography) and socioeconomic factors (such as population density, GDP, and land use intensity). The objectives of this research are as follows: (1) to identify the spatiotemporal changes in the major ecosystem services of the Ili River Valley and the synergies and trade-offs among them, along with their spatial heterogeneity; (2) to analyze the key natural and anthropogenic drivers of service relationship evolution; and (3) to provide scientific support for optimizing ecosystem service allocation and ecological protection policies in arid regions.

2. Materials and Methods

2.1. Study Area

The Ili River Valley (42°14′16″ N–44°53′30″ N, 80°9′42″ E–84°56′50″ E) is located in the northwest of Xinjiang, China, and represents an important component of the upper Ili River basin. The region’s topography follows a “three mountains and two valleys surrounding one basin” pattern, with a total area of approximately 110,169 km2. The climate in the Ili River Valley is classified as temperate continental, with an annual precipitation range of 300–900 mm [24]. The hydrothermal conditions are relatively favorable, and the dominant vegetation type is grassland, with diverse ecosystem types present. The area is rich in biodiversity and is one of the priority regions for biodiversity conservation in Xinjiang. It is home to a variety of typical grassland species and nationally protected wildlife, including the Ili horse, Argali sheep, the goose-necked gazelle, and Xinjiang safflower, all of which hold significant ecological and habitat value In addition to providing critical ecosystem services, the Ili River Valley also serves as an important agricultural and pastoral production base for Xinjiang, with traditional livestock activities being widespread. Furthermore, the region is rich in mineral resources such as coal, oil, and natural gas [25,26]. Due to its strategic location connecting Central Asia with the inland of China, the Ili River Valley plays a vital role in both ecological security and regional economic development (Figure 1).
To enhance the accuracy of ecosystem service assessment in the Ili River Valley, this study delineated the study area into 160 sub-watersheds using elevation data within ArcGIS 10.3 and conducted analysis at a 500 m grid resolution. Each sub-watershed was treated as an independent spatial unit to capture localized ecological characteristics and service-specific variations. This multi-scale framework allows for a more nuanced evaluation of ecosystem service dynamics across spatial scales, thereby offering robust scientific support for targeted regional ecological management and sustainable development strategies.

2.2. Data Sources and Research Processes

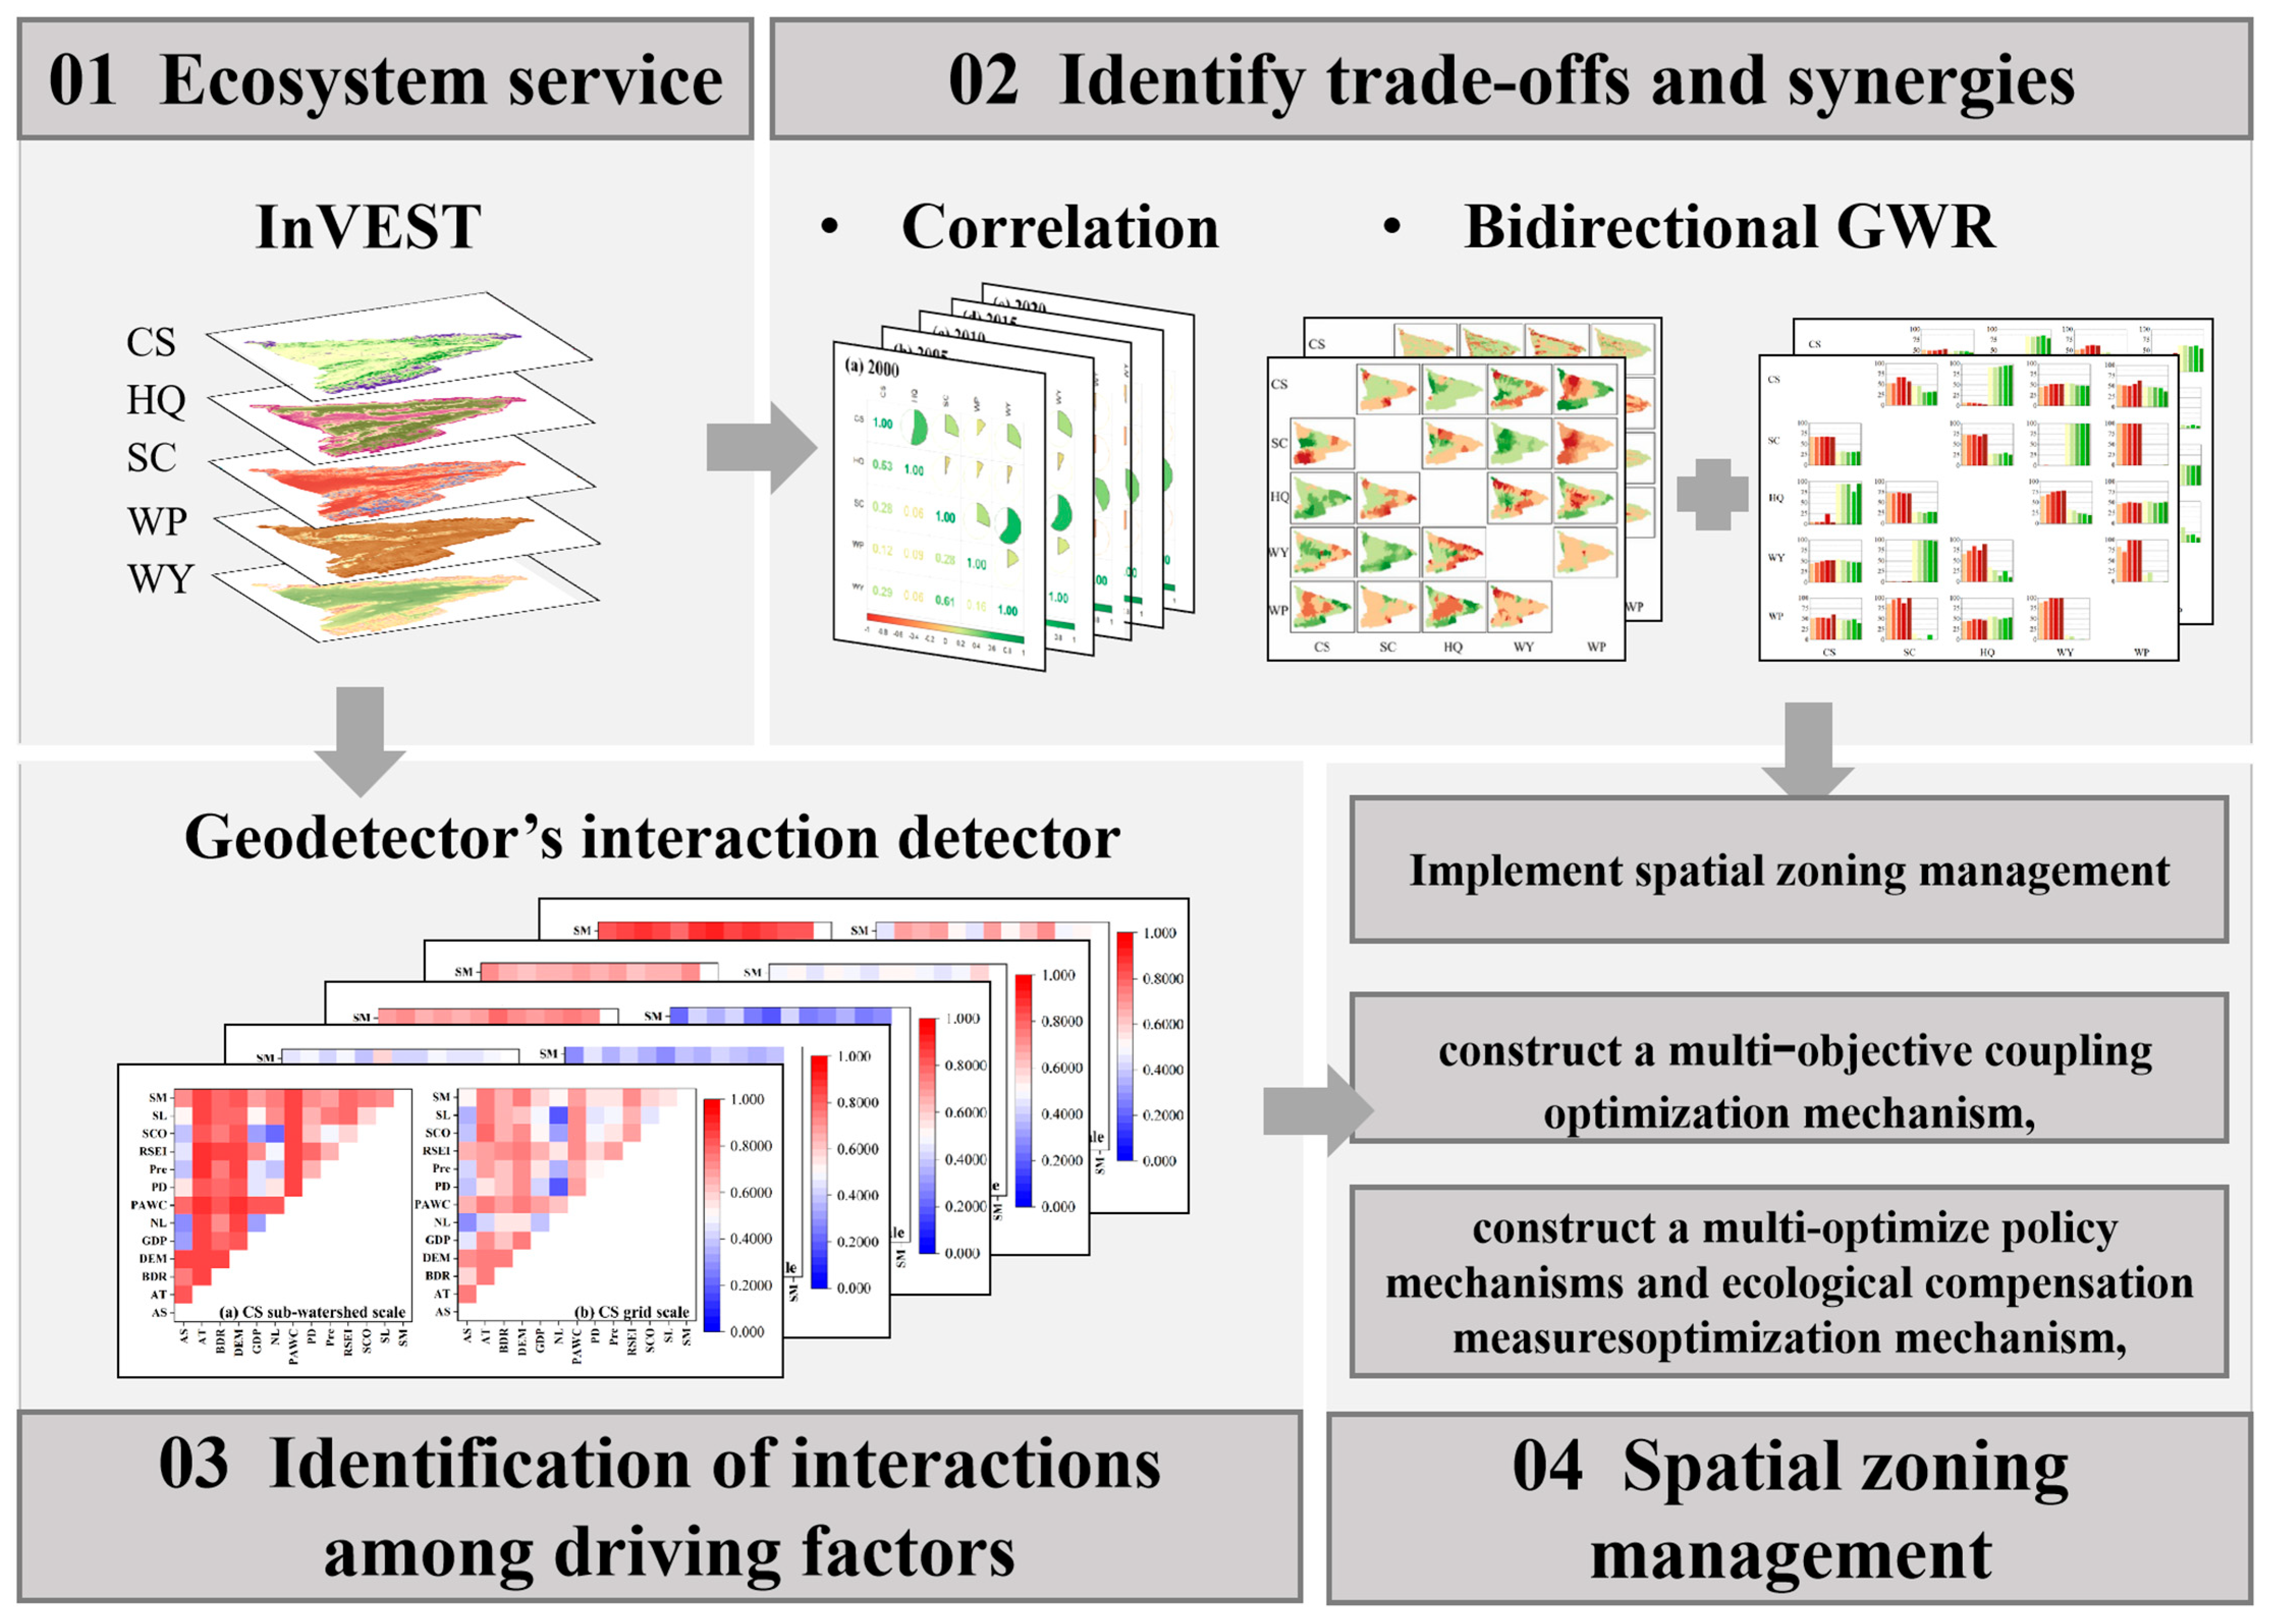
This study utilized a diverse array of datasets, as detailed in Supplementary Material, to comprehensively assess the trade-offs, synergies, and driving factors of ESs)in the Ili River Valley from 2000 to 2020. To ensure both temporal and spatial consistency, all datasets were systematically collected at five-year intervals (2000, 2005, 2010, 2015, and 2020), maintaining uniform temporal periodicity across all data sources. To ensure consistency in spatial resolution, all datasets were resampled to a uniform 500 m grid using ArcGIS10.3. Subsequently, normalization procedures were applied to standardize the data, facilitating integrated analyses across multiple ESs and enhancing the robustness of spatial-temporal evaluations (Figure 2).
This study develops an integrated analytical framework to assess five key ESs—CS, SC, WP, WY, and HQ—within the Ili River Valley, a representative arid region facing significant water resource constraints. Initially, Pearson correlation analysis is employed to identify preliminary trade-offs and synergies among these ESs. Subsequently, a bi-directional GWR approach is utilized to capture spatially explicit relationships and heterogeneity in ES interactions. To further elucidate the underlying drivers, the GeoDetector method is applied to quantify the influence and interactions of natural and anthropogenic factors. Based on these analyses, the study delineates ecological management zones, providing a scientific basis for optimizing ESs under the dual pressures of climate variability and human activities in arid environments.

2.3. Dual-Scale Assessment of Ecosystem Services

This study identifies selected ecosystem services based on the following criteria: (1) Compliance with the Millennium Ecosystem Assessment (MEA) framework: ensuring that the selected services align with the MEA classification system, which is widely applicable and scientifically recognized. (2) Water resource constraints: considering the impact of both uncontrolled agricultural and pastoral expansion and natural climate variability on the ecological environment in the Ili River Valley, water resources emerge as a critical limiting factor, emphasizing the importance of ecological protection and management. (3) Geographical specificity: the Ili River Valley, located at the western boundary of China, is a key ecological and geographical node connecting Central Asia, featuring unique ecosystem functions and service values. (4) Relevance to agricultural impacts: in the Ili River Valley, where agriculture dominates land use and contributes significantly to provisioning services such as crop yields and livestock production, the selected regulating and supporting services (carbon sequestration, soil retention, water purification, water yield, and habitat quality) were chosen because they are highly sensitive to trade-offs induced by intensive farming practices. For instance, agricultural expansion in this arid region often enhances provisioning outputs like grain and forage but degrades regulating services through phosphorus runoff, soil erosion, and habitat fragmentation, leading to conflicts that threaten long-term ecological stability [24,27]. This focus allows for a targeted analysis of how agriculture-driven changes affect these key services, providing insights into balancing economic needs with environmental sustainability in similar arid valleys [28]. (5) Data availability and feasibility: the quantitative methods for evaluating the selected services are well-supported by data and practical, facilitating spatial heterogeneity analysis and scale sensitivity studies.
To address the research gap in capturing fine-scale ecological heterogeneity in arid regions, this study employs an innovative dual-scale approach, integrating 160 sub-watersheds with a 500 m grid resolution. While sub-watersheds are commonly used in hydrological studies, their application in this study is novel due to the combination with high-resolution grid analysis and advanced spatial modeling techniques, such as bi-GWR and geographic detectors. This dual-scale framework allows for a nuanced examination of ecosystem service dynamics, capturing both broad hydrological processes at the sub-watershed level and localized variations driven by topography, land use, and human activities at the grid level. This approach is particularly innovative in the context of arid regions, where such multi-scale, high-resolution analyses are rare, enabling a more precise understanding of trade-offs and synergies under water resource constraints. The sub-basin scale, based on natural hydrological units, effectively integrates key processes such as precipitation, runoff, and transport, reflecting the overall functional patterns of services such as water supply and water quality regulation. This scale directly corresponds to practical units in watershed management and water resource allocation. In contrast, the 500 m grid scale captures finer spatial variations in vegetation cover, land use, and topographical conditions, making it more suitable for revealing the effects of local human activities, such as farming and grazing, on services like SC and HQ, thus highlighting the high spatial heterogeneity of service supply. Various grid resolutions, including 250 m, 500 m, and 1 km, were compared in the study design. Results show that while the 250 m resolution provides higher spatial detail, it leads to significant computational overhead and data noise. On the other hand, the 1 km resolution, while advantageous for computational efficiency, overly smooths out local process features. Considering data availability and the accuracy of spatial heterogeneity representation, the 500 m resolution offers the most balanced approach for modeling different ecosystem services. Consequently, this study selects the sub-basin and 500 m grid scales as analytical units, and by comparing the spatial patterns and dominant driving factors of service clusters at these two scales, it reveals cross-scale heterogeneity and scale effects, providing more targeted insights for regional ecological management. The detailed process and formulas for ecosystem service calculations are provided in the Supplementary Materials and have been validated.

2.4. Spatiotemporal Quantification of Ecosystem Service Trade-Offs and Synergies

2.4.1. Correlation Analysis Among Ecosystem Services

We employ Spearman’s nonparametric correlation analysis to determine the trade-offs and synergies among ESs [29]. This widely used quantitative method identifies the interactions and the strength of relationships among these ES. A positive correlation indicates synergistic effects among ES, whereas a negative correlation suggests trade-offs. Spearman correlation analyses are conducted using R4.3.3 version 4.0, focusing on the period from 2000 to 2020, with analyses conducted every five years.

2.4.2. Geographically Weighted Regression

GWR is a regression technique used to analyze geospatial data [30]. Unlike traditional global regression models, GWR allows regression coefficients to vary across geographical space, capturing spatial heterogeneity. It weights geographic locations, meaning that each spatial unit’s regression parameters are calculated based on data from its neighboring units [31]. This method is particularly effective in studying the spatial variability of ecosystem services.
y i = β 0 u i , v i + k = 1 p β k u i , v i x i k + ε i
In this model, i is the response variable at location, xik is the explanatory variable, βk(ui,vi) represents the regression coefficients at location (ui,vi) and εi is the random error.

2.5. Geodetector

Geodetector is a spatial analysis tool based on statistical theory designed to detect and quantify spatial heterogeneity and its influencing factors [32]. This study employs the interaction detector of Geodetector, which can reveal the explanatory power of combined geographic factors on the spatial distribution of ESs [33]. We exported raster data to Excel using R4.3.3 and selected 13 variables from ecological, environmental, and socio-economic categories as independent variables: aspect (AS), temperature (AT), root depth of vegetation (BDR), elevation (DEM), per capita GDP (GDP), nighttime light data (NL), plant available water capacity (PAWC), population density (PD), precipitation (Pre), Remote Sensing Ecological Index (RSEI), soil organic content (SCO), slope (SL), and soil moisture content (SM).
q ( X 1 X 2 ) = 1 h = 1 L   N h σ h 2 N σ 2
In this analysis, X1 and X2 represent two factors, L is the number of categories for combined factors, N is the total number of samples, σ2 is the total variance, and Nh is the number of samples in the σ2h is the variance within the h category.
q = 1 h = 1 L   N h σ h 2 N σ 2
Here, L represents the number of categories for the factors, N is the total number of samples, σ2 is the total variance, Nh is the number of samples in the h-th category, and σ2h is the variance within the h-th category.

3. Results

3.1. Temporal and Spatial Changes of Ecosystem Services

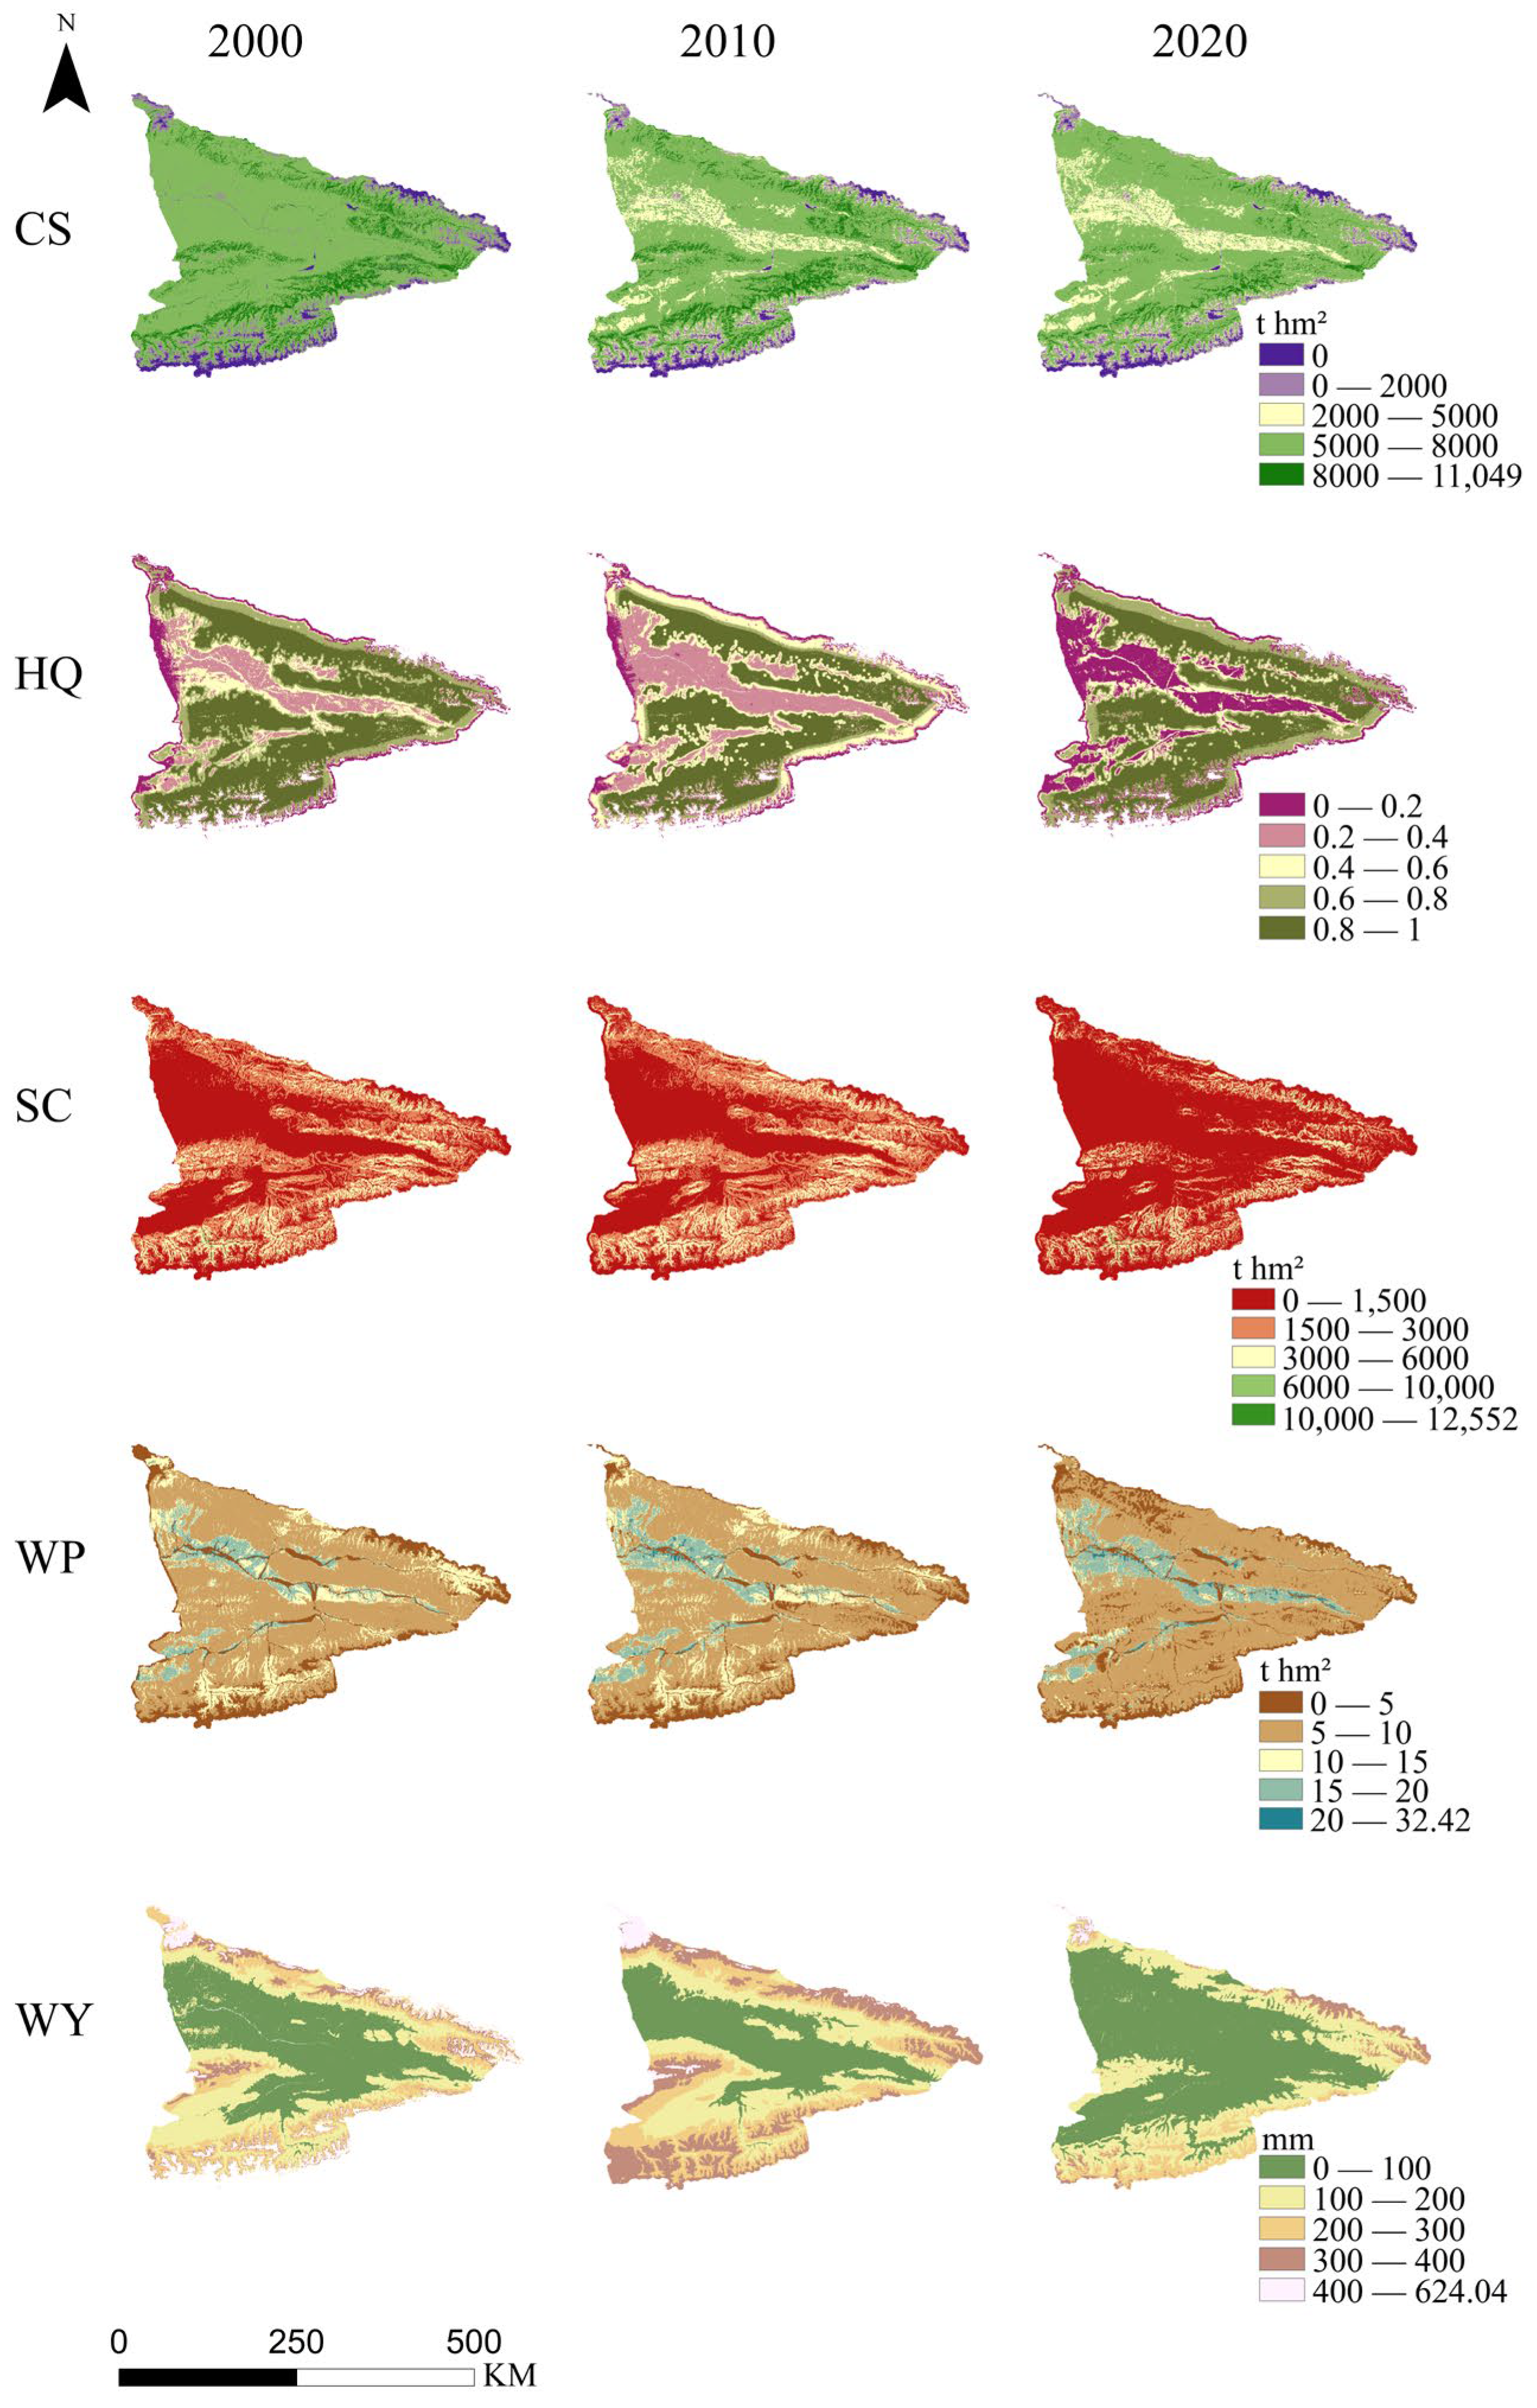
Between 2000 and 2020, ESs in the Ili River Valley remained relatively stable overall but exhibited stage-specific fluctuations and pronounced spatial heterogeneity. CS showed a persistent decline, decreasing by approximately 7.6% over the study period. The decline was most evident in the central valley and peripheral zones with intensive human activity, suggesting that reduced vegetation cover diminished regional carbon storage capacity. HQ generally remained high, with hotspots concentrated in grassland and forested areas along both sides of the valley, reflecting strong ecological continuity and integrity. However, by 2020, extensive low-value areas (0–0.2) had emerged, indicating local ecosystem disturbance and a reduction in habitat integrity. SC exhibited a “decline–recovery” trajectory: a 12.4% decrease between 2000 and 2015, followed by an increase of approximately 20.5% relative to 2000 by 2020, reaching a peak of 12,060.16 t. This recovery is closely associated with ecological restoration initiatives such as grassland rehabilitation and cropland-to-forest programs. High-value SC zones were primarily distributed in mountainous and hilly areas. WP declined by 9.8% from 2000 to 2015 but rose by 7.5% relative to 2000 by 2020. High-value WP zones were mainly concentrated in agricultural–pastoral belts of the valley, exhibiting a distinctive banded distribution that reflects improvements in water-use efficiency in farming and grazing systems. WY displayed the most dramatic fluctuations: increasing by 24.8% in 2010 relative to 2000, but subsequently dropping by 31.3% in 2020 compared with 2010. High-value WY areas were located primarily in central valley zones and low-elevation regions, reflecting declining hydrological stability under the combined influence of climate change and anthropogenic water use.
Overall, high ES supply areas were concentrated in the mountainous regions flanking the valley and in the western Wusuli Mountains, dominated by grassland and forest cover. Low ES supply areas were concentrated in the central valley floor and peripheral desert zones, where human disturbance was pronounced. These dynamics reveal the complex responses of the Ili River Valley ecosystem to the dual pressures of climate change and human activities: CS showed continuous decline; SC and WP initially decreased but later improved; WY exhibited marked volatility; while HQ showed early signs of degradation by 2020 (Figure 3).

3.2. ESs Trade-Offs and Synergy

3.2.1. Correlation Analysis

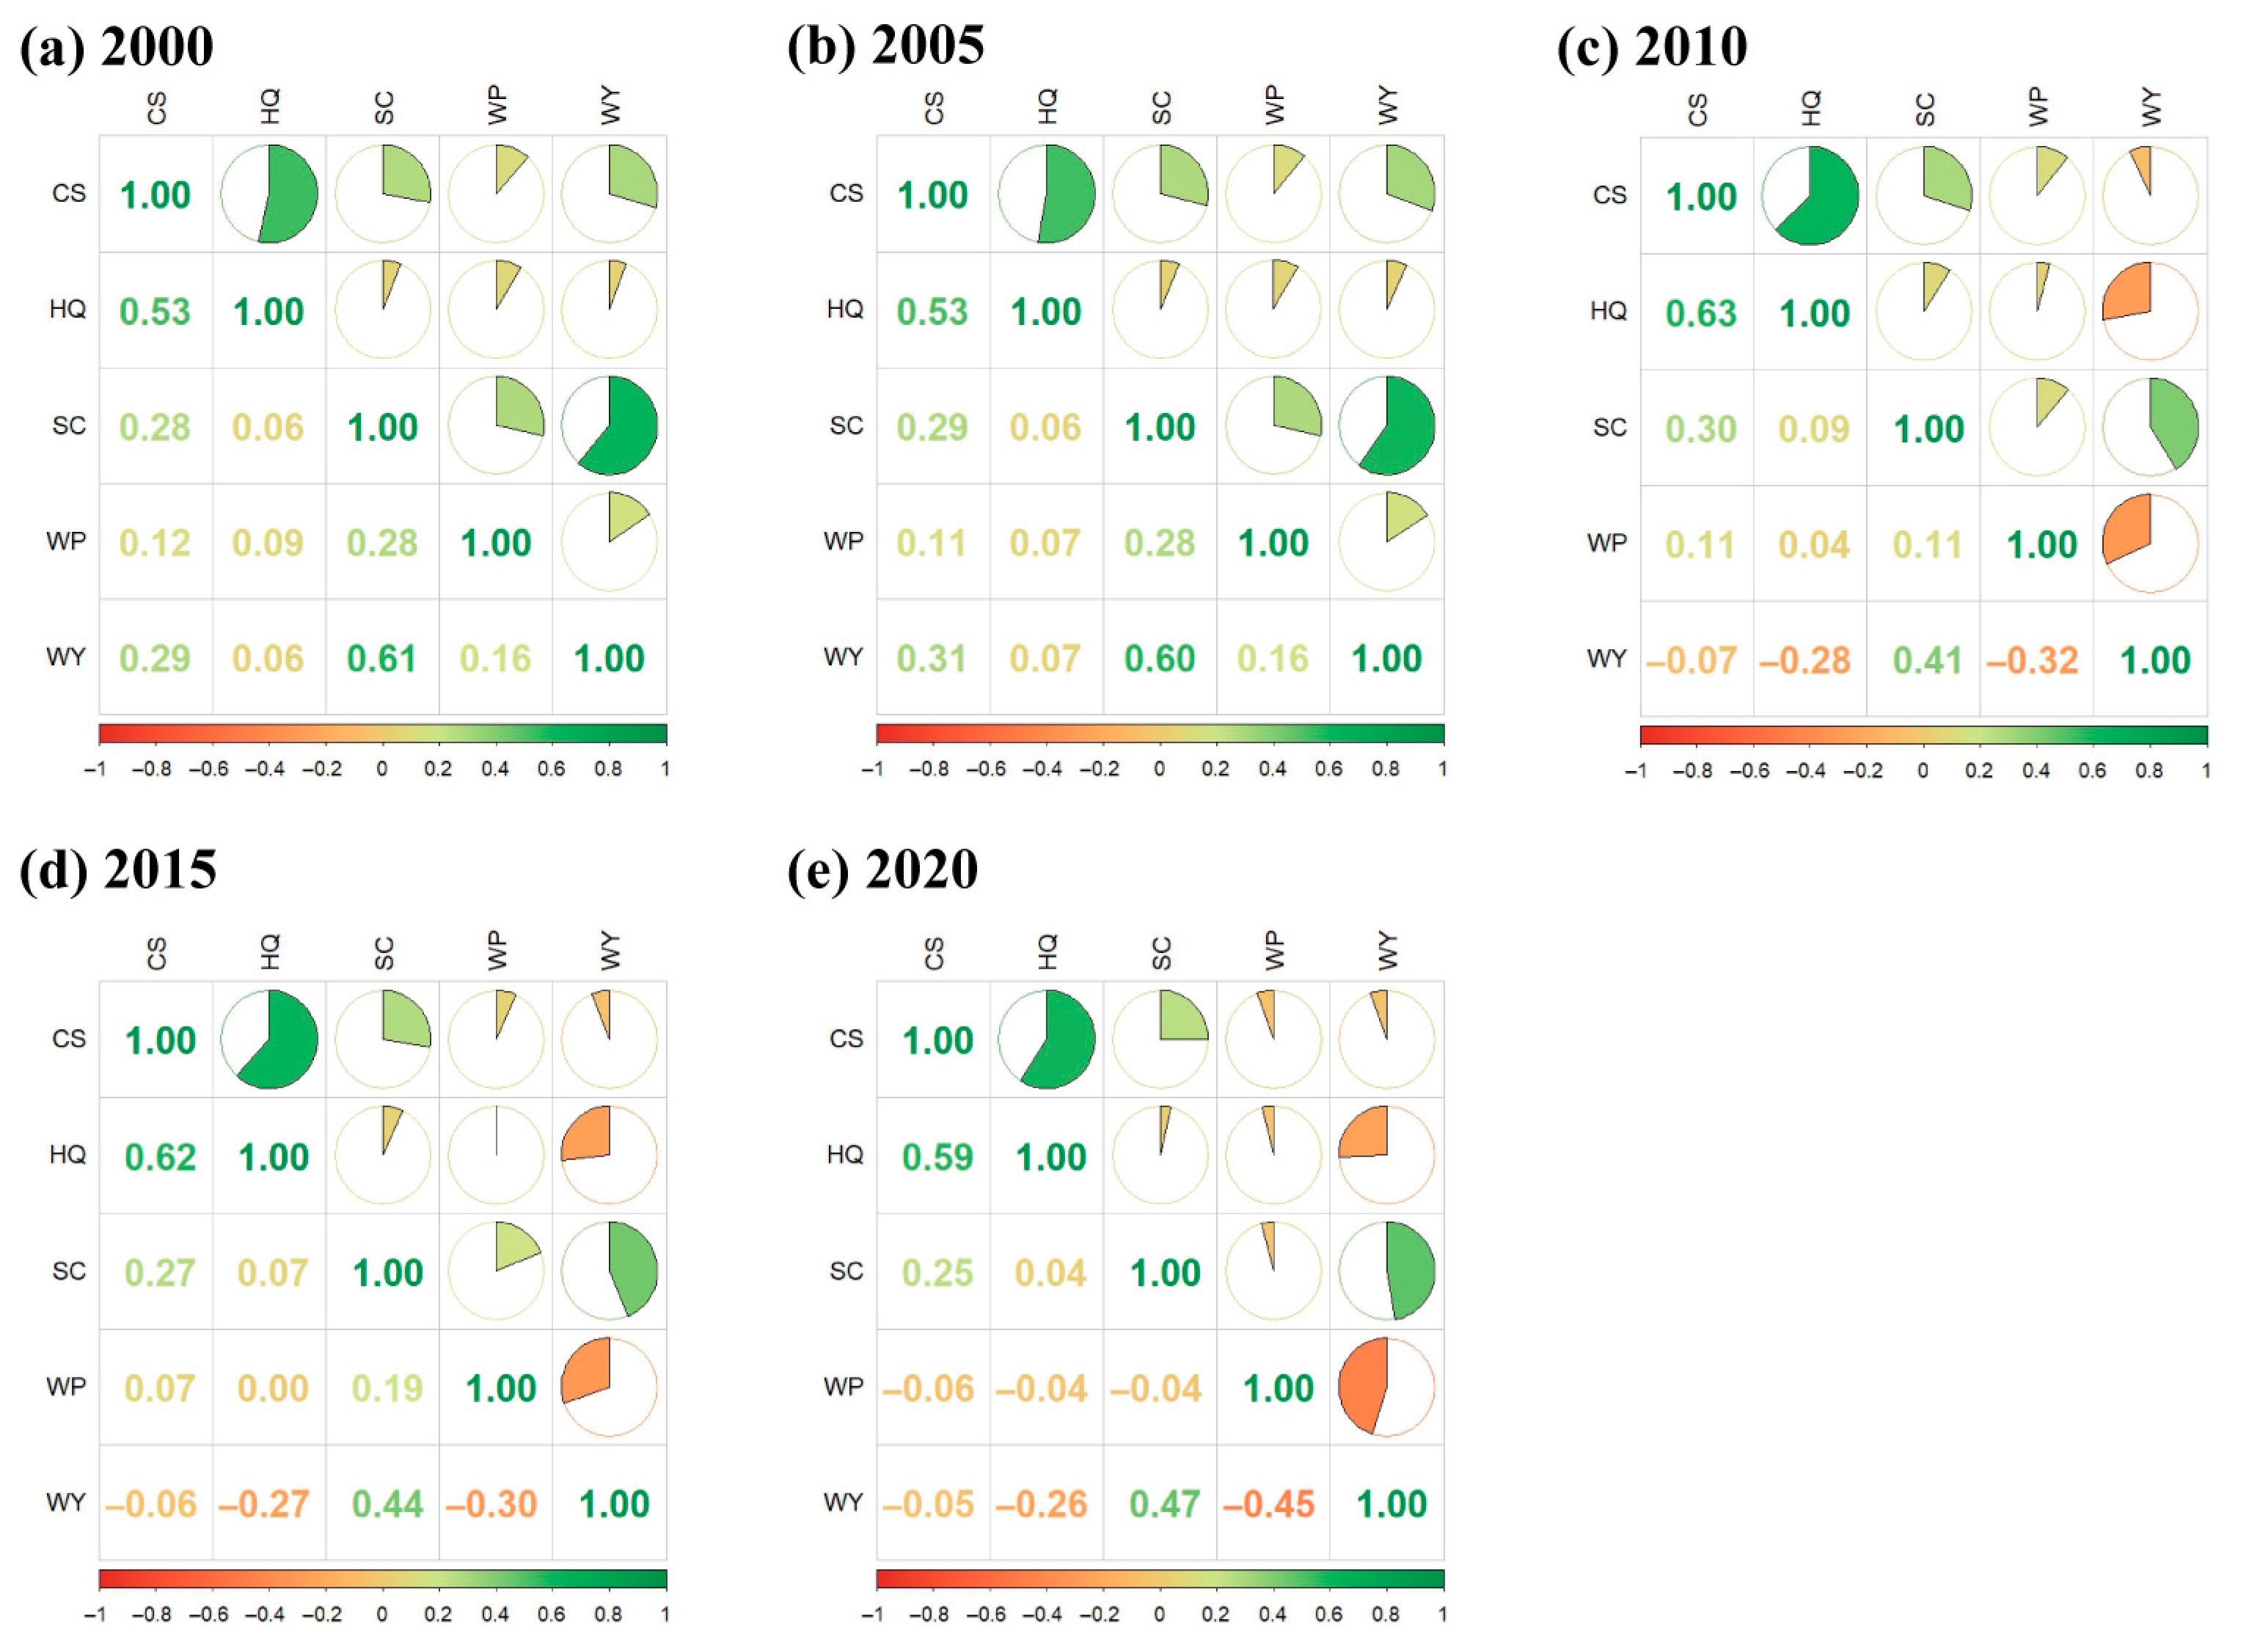
Between 2000 and 2020, the correlations among the five ESs exhibited notable variations, and most of these correlations were statistically significant (p < 0.05). As shown in Figure 4, during this period, several ESs demonstrated significant positive correlations, particularly the correlation between carbon sequestration (CS) and habitat quality (HQ), which consistently exhibited high positive correlation coefficients, with the peak values occurring in 2000 and 2020 (0.62 and 0.59, respectively). This stable positive correlation suggests that increases in carbon storage contribute to improved habitat quality, and the synergies between the two were evident throughout the study period. Moreover, the correlation between soil conservation (SC) and water purification (WP) also exhibited a strong synergistic effect in 2000 and 2020. In particular, in 2020, the correlation coefficient between SC and WP reached 0.66, indicating a robust positive correlation between these two ecosystem services. This suggests that soil conservation measures may contribute to enhanced water purification. However, the relationship between water yield (WY) and WP changed significantly from 2000 to 2020, shifting from an initial synergy to a trade-off. In 2000, the correlation was 0.31, but by 2020, this value had decreased to −0.45, indicating that over time, the relationship between water yield and water purification transitioned into a negative correlation. This suggests that, under certain conditions, there may be a trade-off between increased water yield and water purification, potentially involving resource allocation or ecological process conflicts. Another notable trend was the relationship between HQ and WY, which experienced a similar transformation. From 2000 to 2020, the correlation between the two fluctuated, decreasing from 0.59 to −0.45. Notably, in 2015, the negative correlation between HQ and WY was most pronounced, reflecting that the enhancement of habitat quality during this period may have come at the cost of water resource utilization. This indicates that hydrological regulation and ecological quality improvement in certain regions may involve functional conflicts, constrained by the spatial distribution of water resources and the ecosystem’s structure.
Although the synergies between carbon storage and habitat quality remained highly correlated at all time points, the relationships between other ecosystem services displayed dynamic changes. In particular, the transition from synergy to trade-off between water purification and water yield reveals potential conflicts between water resource management and ecological protection. Future ecosystem management strategies should give greater attention to the interactions among different ESs, especially in the context of the dual impacts of climate change and human activities.

3.2.2. Spatial Trade-Offs and Synergy

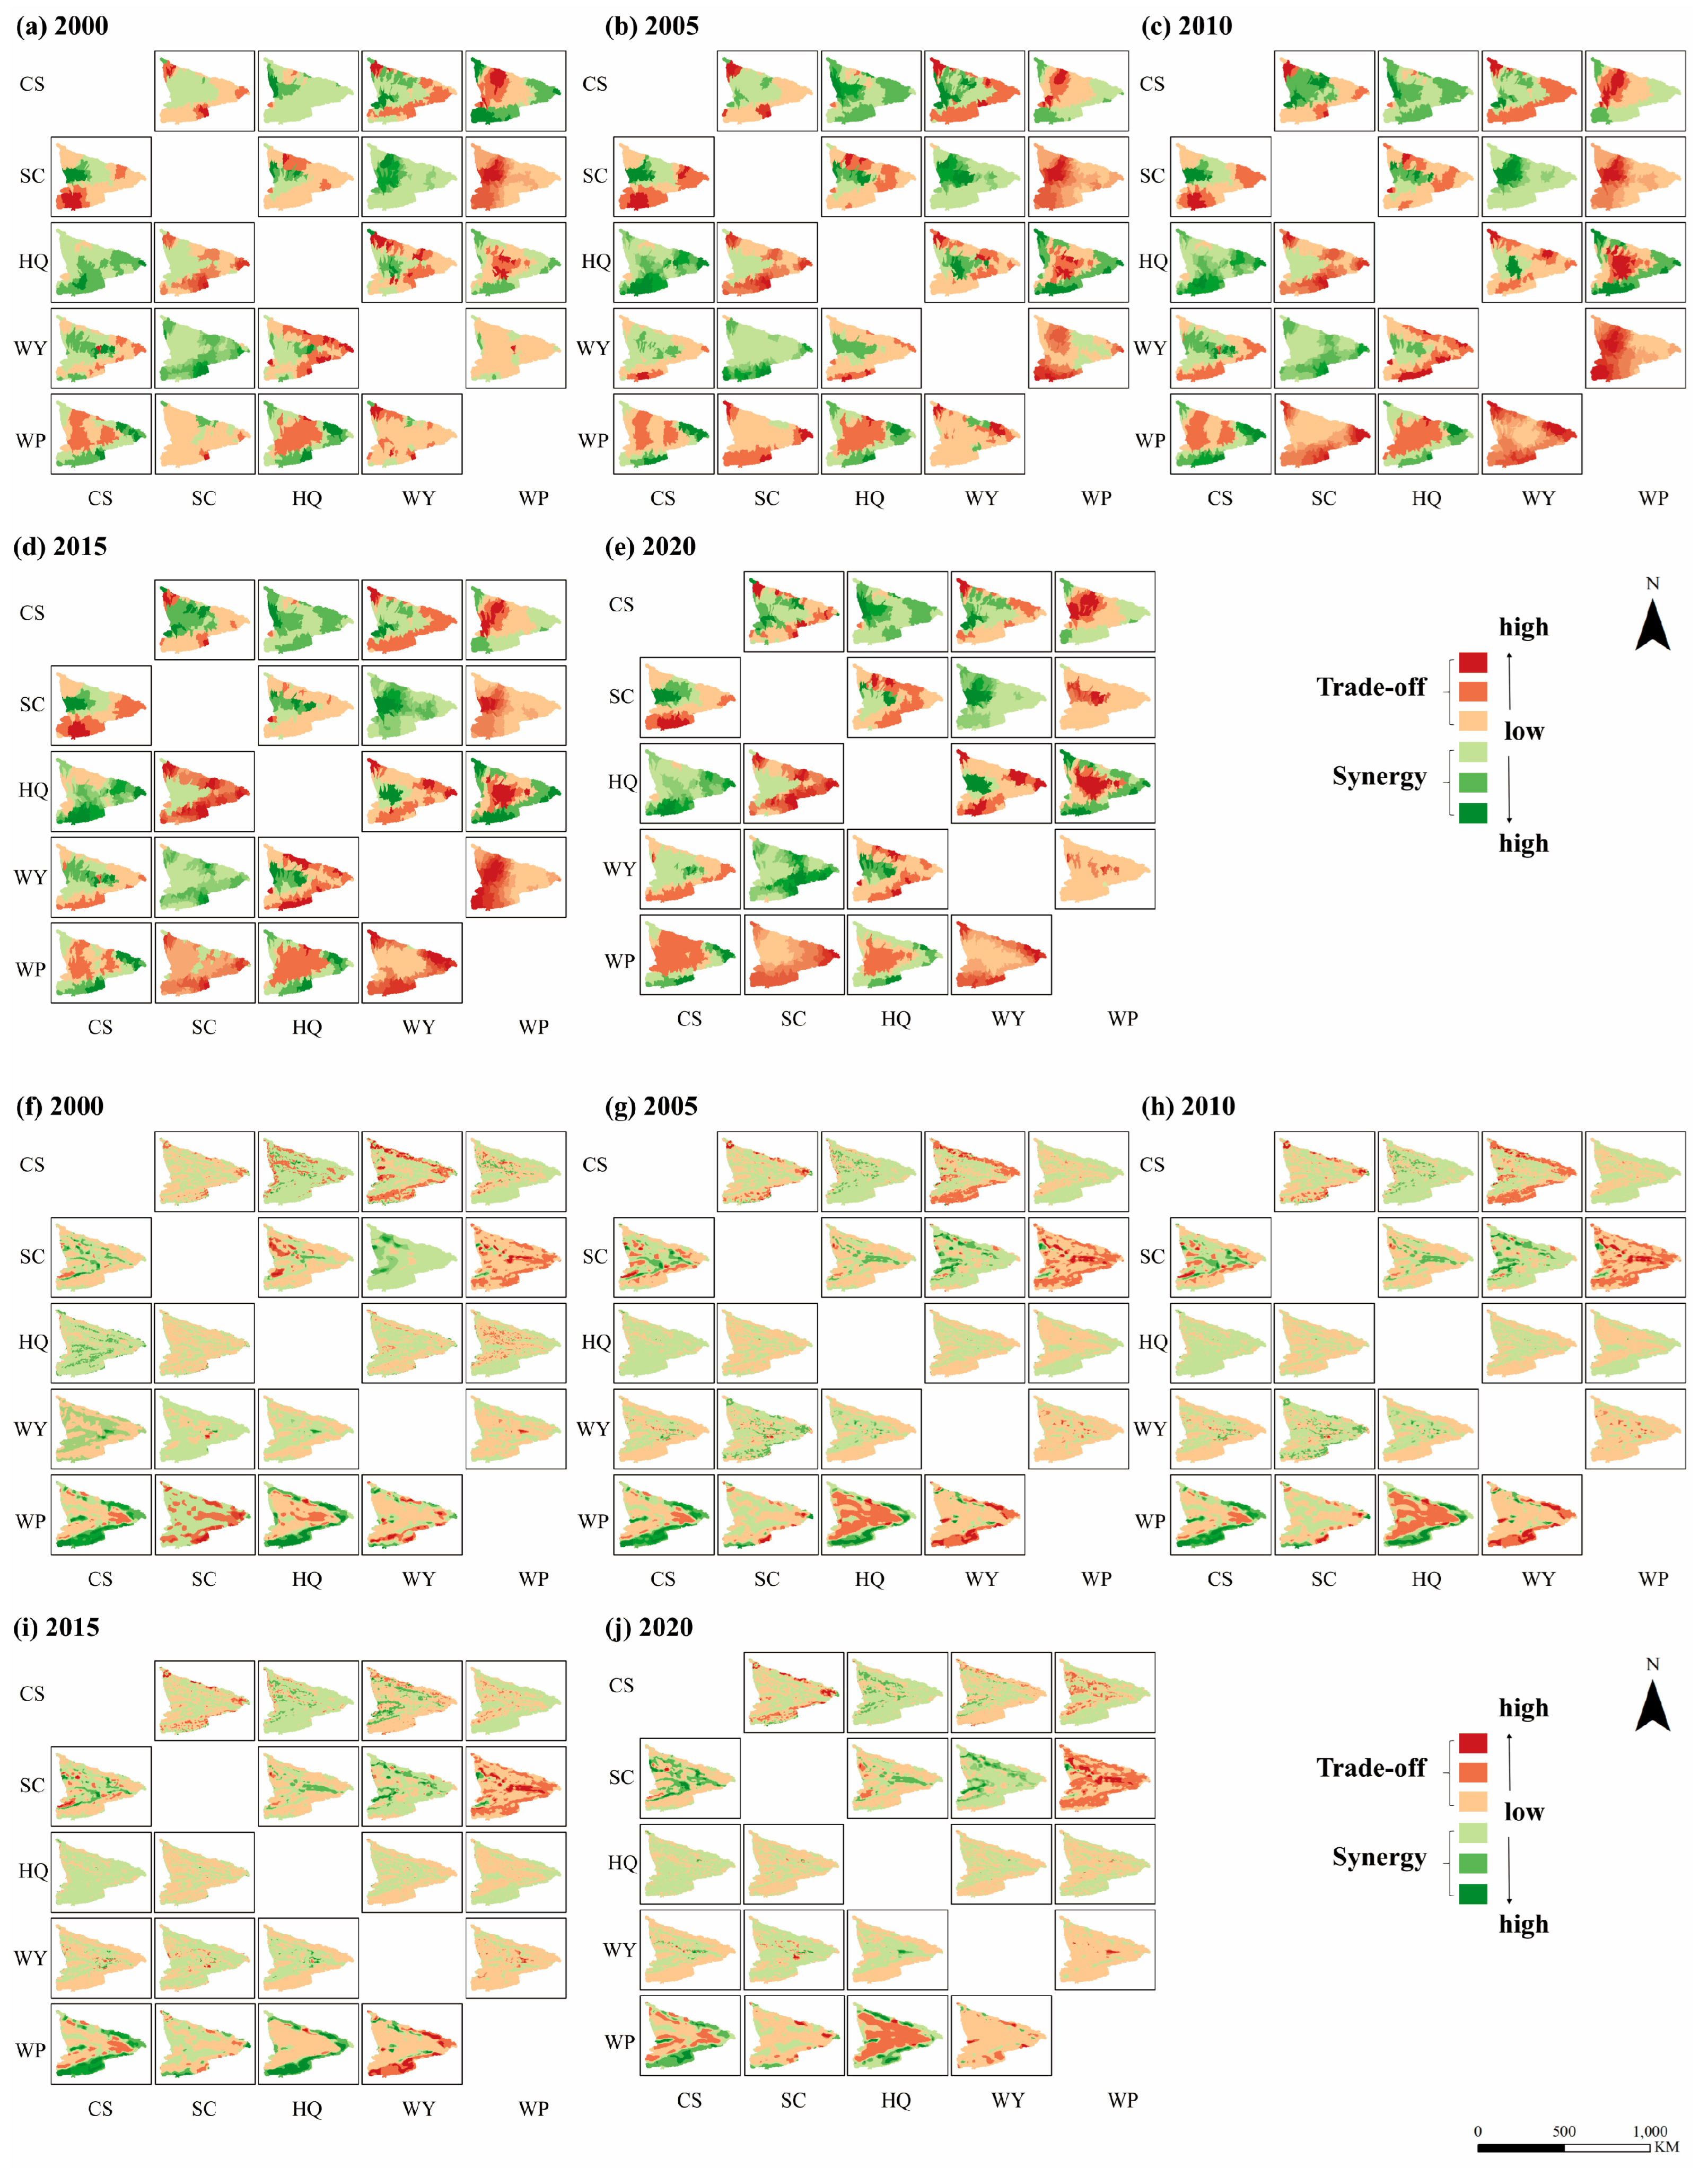
According to the results of the GWR analysis at both the watershed and grid scales (Figure 5), the synergies and trade-offs among the five ESs exhibit pronounced spatial heterogeneity. At the watershed scale, the service pairs with the highest proportion of synergistic areas were CS–HQ (carbon sequestration–habitat quality), SC–WY (soil conservation–water yield), WY–SC, and HQ–CS, accounting for 62.4%, 58.7%, 54.3%, and 51.8% of their respective service-responsive areas. These synergistic zones were mainly concentrated in the mountainous and hilly regions in the southern and eastern Ili River Valley and in the undulating plains of the valley’s central areas. These regions are characterized by favorable vegetation cover, soil structure, and hydrological regulation capacity, indicating strong positive linkages and mutual reinforcement among underlying ecological processes.
Conversely, notable trade-offs were observed for service pairs such as WY–HQ, SC–WP (soil conservation–water purification), WP–WY, and HQ–WY, with trade-off areas accounting for 65.1%, 61.9%, 59.8%, and 58.2%, respectively. These trade-offs were predominantly distributed in the arid mountainous zones at the valley margins and irrigation-intensive areas with high human disturbance. This spatial pattern reflects competing service objectives, such as mismatches between water resource allocation and habitat conservation priorities, likely driven by land-use transitions, hydrological perturbations, or policy interventions.
At the finer grid scale, the spatial distribution of synergies and trade-offs among services becomes more localized and exhibits higher sensitivity. Certain service pairs, such as WY–CS and WP–CS, showed a reversal in interaction types at this scale. For instance, the WY–CS relationship shifted from synergy to trade-off dominance (with trade-offs comprising 60.3% of the area). WP–CS transitioned from trade-off to synergy dominance (synergies accounting for 57.5%). This indicates that at finer spatial resolutions, interactions among ecosystem processes are more strongly influenced by topography, hydrological regimes, and land-use patterns.
Temporally, from 2000 to 2020, the spatial extent of synergies and trade-offs among ecosystem service pairs changed across both scales (Figure 6). At the watershed scale, synergistic areas increased for six service pairs, while trade-off areas expanded for twelve pairs. At the grid scale, four service pairs exhibited more substantial synergies, and eight pairs experienced an increase in trade-off areas. To comprehensively assess the dominant trends in ES interactions across the watershed, we analyzed the proportional area of synergies versus trade-offs for each service pair. As of 2020, trade-offs accounted for approximately 53.2% of the watershed-scale interactions, while synergies represented 37.1%; at the grid scale, trade-offs made up 55.7%, and synergies 34.2%.
Despite localized regions exhibiting strong synergies, trade-off relationships among ESs spatially dominate across the Ili River Valley and have shown an intensifying trend over time. This is particularly evident in WY, HQ, and WP interactions, where competition for resources and ecological function conflicts are increasingly pronounced. Hydrological variability under climate change and shifts in land-use practices exacerbate such tensions among ecological processes. Therefore, future ecosystem management strategies should prioritize high-sensitivity trade-off zones, establish differentiated ecological compensation mechanisms, and implement service-weighted regulatory frameworks. These measures will be essential to achieving multi-objective optimization and the coordinated development of ecosystem service functions.

3.3. Detection of Driving Factors

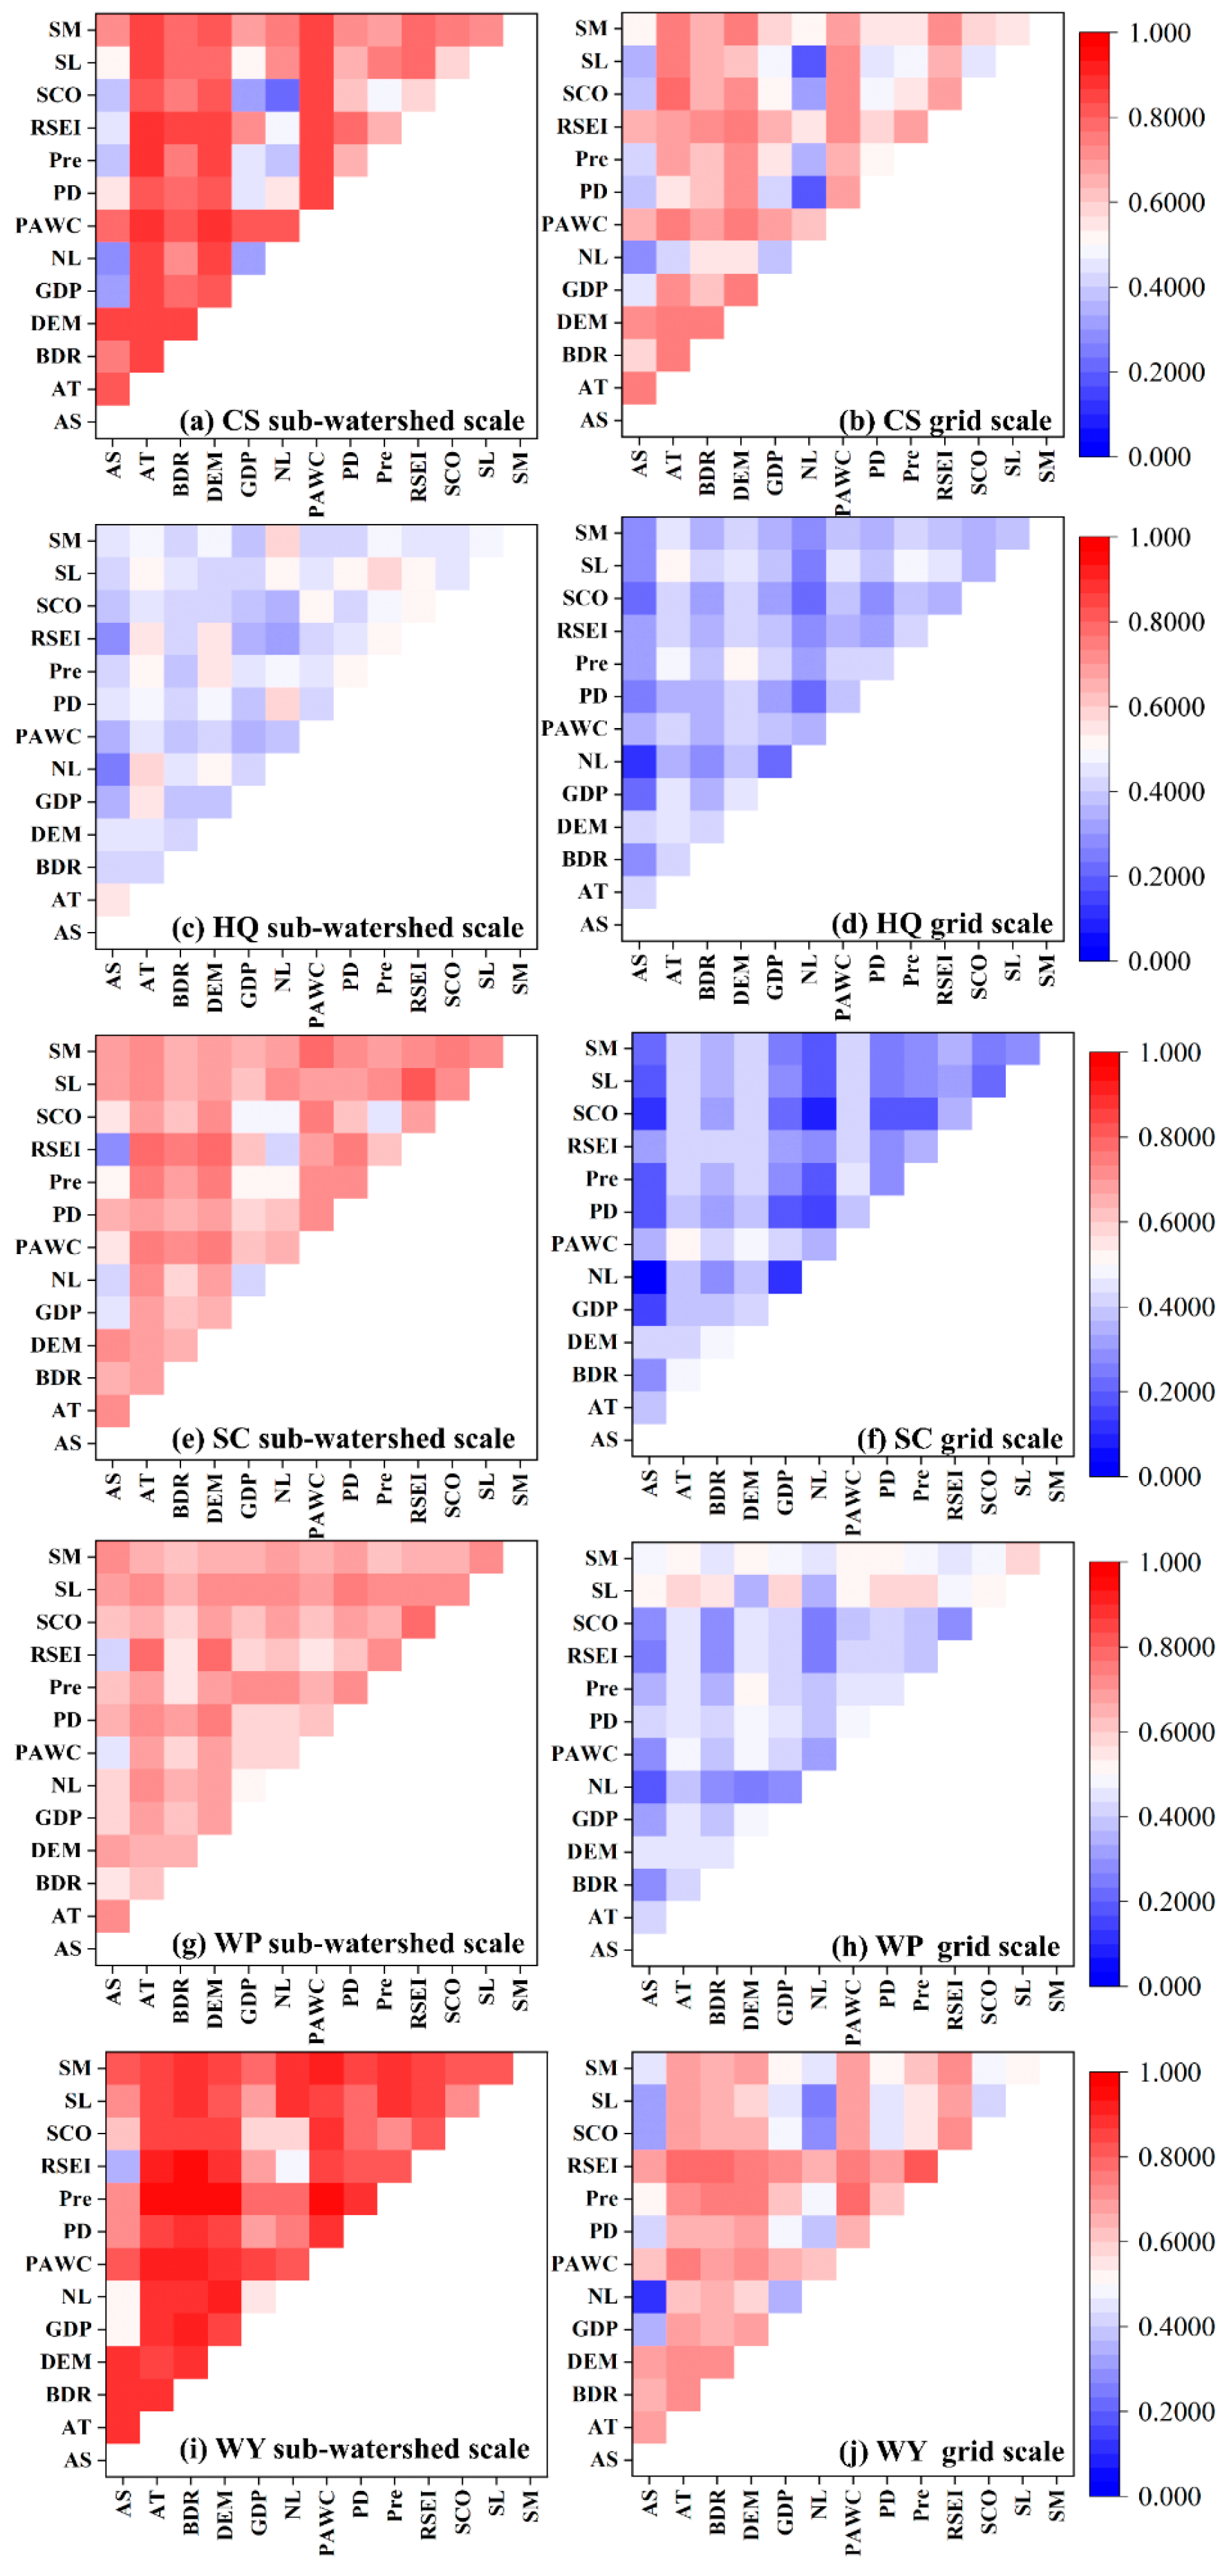
Based on the geographical detector analysis results, 13 x-factors were selected across two scales—watershed and grid scales—resulting in 78 interaction pairs. Using 2020 as a case study (Figure 7), we explored the multi-factorial synergies (Figure 6) and the explanatory power of the target ESs, with additional results provided in the Supplementary Materials (Figures S1–S4).
CS at the watershed scale showed enhanced interactions in 76 factor pairs, with the highest value of 0.76 observed between AT-PAWC. AT-DEM and PAWC-DEM also showed significant q-values around 0.7, indicating that temperature, topography, and soil moisture conditions significantly influence the spatial variation in CS. At the grid scale, 70 factor pairs exhibited enhancement, with the highest value of 0.76 between AT-DEM. Overall, factor combinations that enhance CS were more pronounced at both scales, with CS being predominantly driven by natural factors. High q-values suggest that improving soil moisture utilization efficiency under climate warming may enhance vegetation productivity and carbon storage. Additionally, permafrost thaw in high-altitude areas could alter PAWC, further impacting CS distribution.
HQ at the watershed scale saw enhanced interactions in 64 factor pairs, with the highest value of 0.58 observed between NL-PD, a human activity-intensive area. AT-SL had a q-value of 0.55, while NL-AT had a q-value of 0.5, indicating that natural and socio-economic factors jointly shape HQ. At the grid scale, 66 pairs exhibited enhancement, with the highest q-value of 0.5 occurring between AT-SL. NL-PD had a q-value of 0.48. Overall, high interaction between NL and PD at both scales may amplify the urbanization-induced fragmentation of habitats. At the same time, strong effects from AT and SL suggest that climate and soil conditions form the natural foundation of HQ. Considering the potential disruption of ecological connectivity due to human activities is crucial.
SC at the watershed scale showed enhanced interactions in all 78 factor pairs, with the highest value of 0.81 occurring between RSEI-SL. AT-PAWC had a q-value of 0.75, and Pre-SL had a q-value of 0.7, highlighting the critical role of vegetation cover and soil characteristics in erosion control. At the grid scale, all 78 factor pairs showed enhancement, with the highest value of 0.51 between AT-PAWC and RSEI-SL, which had a q-value of 0.48. Overall, factor combinations enhancing SC were evident across both scales, with natural factors predominantly driving SC. Notably, the high q-value between RSEI and SL suggests a positive feedback mechanism between vegetation recovery and soil stability. At the same time, the interaction between Pre and SL indicates that precipitation intensity and soil type jointly determine erosion risk.
WP at the watershed scale exhibited enhanced interactions in 67 factor pairs, with the highest value of 0.78 observed between AT-RSEI. Pre-SL had a q-value of 0.72, and AT-Pre had a q-value of 0.7, highlighting the strong dependency of WP on water-thermal conditions and vegetation health. At the grid scale, 66 factor pairs exhibited enhancement, with the highest value of 0.58 observed between Pre-SL and AT-RSEI, which had a q-value of 0.55. Overall, enhanced factor combinations for WP were more pronounced at both scales, with natural factors playing a dominant role. Notably, the high interaction between AT and RSEI suggests that climate warming could improve water quality by enhancing vegetation function.
WY at the watershed scale showed enhanced interactions in 77 factor pairs, with the highest value of 0.95 observed between AT-Pre. Pre-RSEI had a q-value of 0.9, and AT-RSEI had a q-value of 0.88, underscoring the dominant role of hydrological and climatic conditions. At the grid scale, all 78 factor pairs exhibited enhancement, with the highest q-value of 0.8 occurring between Pre-RSEI and AT-Pre, which had a q-value of 0.78. Overall, enhanced interactions at both scales were significant, with natural and socio-economic factors jointly influencing WY. Particularly, WY exhibited a high sensitivity to climate change, with extreme precipitation or temperature fluctuations likely to significantly affect water resources. The high interaction between RSEI suggests that vegetation influences the water cycle through evapotranspiration, highlighting the need to monitor feedback effects related to vegetation change.
In summary, the enhancement of various ESs was evident, with the explanatory power typically being stronger at the watershed scale. This suggests that, at larger spatial scales, the interactions between factors are more complex and pronounced. The watershed scale better captures and reflects the combined impacts of natural and socio-economic factors, with the distribution and trends of different factors across larger regions more likely to exhibit synergies, leading to stronger explanatory power for ESs. At the grid scale, lower q-values but finer hotspot distributions reflect the complexity of local ecological processes. Natural factors dominate in most ESs, while socio-economic factors influence HQ and WY to a certain extent. This pattern indicates that the ecosystem services in the Ili River Valley are primarily driven by climate, topography, and vegetation conditions, with human activities playing a supporting role in specific services.

4. Discussion

4.1. The Spatial-Temporal Dynamic Relationship Between ESs

Between 2000 and 2020, the synergies and trade-offs among ESs in the Ili River Valley exhibited significant spatiotemporal heterogeneity at both the watershed and grid scales. Overall, trade-off relationships dominated, with synergies being locally significant.
Spatially, areas with high values of HQ, CS, SC, and WY are concentrated in mountainous hilly regions and undulating plains in the central areas, where vegetation coverage is good and hydrological conditions are stable. These areas also exhibit relatively higher synergistic areas between service pairs such as CS-HQ, SC-WY, and WY-SC, indicating positive coupling between ecological processes. However, in regions with higher human activity intensity, such as agricultural–pastoral ecotones and irrigated zones, Water Purification (WP) is significantly elevated. These areas are primarily used for cropland and pasture, with frequent phosphorus fertilizer application. High phosphorus loads from livestock manure and feed lead to increased phosphorus concentrations in water bodies, contributing to the eutrophication problem [34]. Consequently, service pairs like SC-WP, WY-WP, and WP-WY exhibit clear trade-offs, reflecting ecological function conflicts between water resource utilization, water quality, and habitat protection.
At the grid scale, synergies and trade-offs exhibit more localized differences, with certain service pairs (e.g., WY-CS and WP-CS) undergoing directional shifts at finer scales. This suggests that factors such as topography, hydrology, and land use have stronger influences at the local scale, making interactions between ecosystem services more sensitive [35,36].
From a temporal perspective, trade-offs at both scales show an increasing trend. By 2020, the proportion of trade-off areas reached 53.2% at the watershed scale and 55.7% at the grid scale, indicating intensifying resource competition between multifunctional services. The long-term stable synergy between CS and HQ contrasts with the shift of service pairs like WY-HQ and WP from positive to negative correlations. This suggests that the enhancement of ecological functions is increasingly constrained by resource supply–demand conflicts, with changes in hydrological processes and land use disturbances being key driving factors [37,38].
Thus, we conclude that the interactions among ESs in the Ili River Valley follow a pattern of “dominant trade-offs, auxiliary synergies, with structure evolving over time and space.” This reflects the weakening of regional ecosystem functional coordination under the dual influences of climate change and human activities. Future management strategies should focus on high trade-off sensitivity areas, optimize land use structure, enhance the synergistic capacity of ecological processes, and achieve a comprehensive balance of service functions [39,40].

4.2. Analysis of Driving Mechanism

The spatiotemporal evolution of trade-offs and synergies among ESs in the Ili River Valley essentially reflects the dynamic reconstruction of ecological functions shaped by both natural processes and anthropogenic disturbances [41]. This study reveals that, from 2000 to 2020, although certain service pairs (e.g., CS-HQ, SC-WY) maintained synergies in specific ecological zones, the trade-off effects gradually intensified. The driving mechanisms behind this trend can be attributed to three core factors: 1. Climate Change and Hydrological Fluctuations: The intense fluctuations in services such as WY and WP directly altered the availability of water resources, subsequently affecting habitat stability and carbon sequestration capacity [42]. For example, after the peak of WY in 2010, a sharp decline occurred, compounded by an increasing trend of droughts, weakening WP’s self-regulation capacity and the ecosystem. This post-2010 period marks a critical turning point where trade-off intensification accelerated notably. Three mechanisms explain this shift: (1) the sharp WY decline after 2010, combined with drought intensification, triggered heightened competition for scarce water resources among ecosystem functions, weakening WP’s capacity to maintain water quality under reduced flows; (2) agricultural expansion during 2010–2020 amplified phosphorus loading, strengthening negative coupling between WP and other regulating services; (3) cumulative degradation from the preceding decade reduced ecosystem buffering capacity, making systems more sensitive to disturbances. These converging factors created a feedback loop, driving trade-off proportions from ~45% in 2010 to >53% by 2020 at the watershed scale.
Additionally, the uneven distribution of water resources across both time and space exacerbated the competition for resources between WP and services like HQ and SC. This resulted in a situation where an increase in water quantity did not necessarily lead to improvements in water quality or habitat, creating an ecological tension between water production and purification [43]. 2. Our geodetector analysis reveals that population density and GDP are the strongest drivers of WP increases in agricultural zones, with their interactive effect exceeding individual contributions. WP has notably increased in these agricultural and pastoral areas, intensifying phosphorus loads and strengthening the trade-offs between WP and SC, HQ, and other services [44]. Especially in irrigated zones, frequent fertilization and livestock activities have led to phosphorus runoff, diminishing the water quality purification function [45]. Concurrently, urban expansion and land conversion into cropland have compressed ecological patch connectivity, exacerbating the degradation of HQ. The continued decline in CS in certain regions suggests damage to biomass and soil carbon sequestration functions [46,47]. 3. Limitations of Ecological Protection Policies and Restoration Projects: While ecological programs, such as the conversion of cropland to grassland, have contributed to the recovery of SC and the stabilization of CS to some extent, their spatial effectiveness remains variable. Most ecological restoration projects are concentrated in mountainous or high-altitude areas, whereas the trade-off conflicts in mid- and low-altitude, agricultural–pastoral ecotones remain pronounced. This indicates that current ecological compensation and land control strategies have failed to effectively address trade-off-sensitive zones, resulting in regulatory mechanisms lagging.
In conclusion, the “synergy-limited, trade-off-augmented” pattern of ESs in the Ili River Valley is a composite response to the dual pressures of heightened instability in the natural hydrological system and increasing human development. Future regional ecological management must shift from “functional restoration” to “process regulation,” reconstructing land use patterns, enhancing ecological process coupling, and scientifically configuring service weights and ecological compensation mechanisms to mitigate the structural conflicts between resource utilization and ecological protection.

4.3. Management Implications

4.3.1. Spatial Zoning Management and Differentiated Regulation

The significant trade-off characteristics observed in service pairs such as CS-WP, WP-WY, and HQ-WY in the mid- and low-altitude agricultural–pastoral ecotones suggest the need to designate this region as an “ecological service trade-off sensitive zone.” Ecological compensation resources and engineering projects should be prioritized in this zone. Conversely, high-synergy areas (e.g., mountain forest and grassland regions) should be identified as “core ecological function synergy zones,” where their role as ecological buffers should be strengthened, and natural processes should be encouraged to self-repair, thereby enhancing service synergies. This zoning framework can be integrated with Xinjiang’s existing “ecological red line” policy and the “Three-North Shelterbelt Program” to enhance implementation feasibility and policy coherence [48].

4.3.2. Multi-Objective Coupling Optimization Mechanism

The dynamic trade-offs between ESs suggest that a single-function management approach is inadequate to meet complex ecological demands [16]. Moving forward, it is recommended to establish multi-objective coupling decision-making models based on the spatial identification of “ecosystem service trade-offs and synergies.” These models should incorporate water resource regulation, land-use adjustments, and habitat conservation while integrating dynamic ES supply and demand simulations. Such models will help identify conflict points and synergistic potential areas, thereby enhancing policy interventions’ precision and systemic nature and achieving the overall optimization of multifunctional service provision [40].

4.3.3. Ecological Compensation Mechanisms and Policy Innovation

Although ecological engineering and policy measures have been effective in synergy zones, their impact has been delayed in areas with strong trade-offs. It is recommended to develop a horizontal ecological compensation mechanism based on “ecological contribution, service supply value, and externality costs,” strengthening the ecological benefit linkage between upstream and downstream areas, urban and rural zones, and agricultural and pastoral areas. This compensation framework can build upon existing programs such as the “Grassland Ecological Protection Subsidy and Reward Policy” and the “Conversion of Cropland to Forest and Grassland Program” in Xinjiang, expanding their scope to specifically target trade-off-sensitive zones identified in this study. Additionally, guiding the transition to green agriculture and restricting high-pollution land-use intensities will help reduce the negative feedback resulting from the abnormal increase in WP services, thus alleviating trade-off pressures at their source. Consequently, the ecological management of the Ili River Valley should shift from traditional ecological element protection to a focus on regulating ecosystem service trade-offs, combining spatial zoning, process coupling, and institutional guidance for comprehensive management. This will ensure the multifunctional stability and sustainable development of the regional ecosystem [49].

4.4. Limitations

While this study provides valuable insights into ecosystem service relationships in the Ili River Valley, several limitations should be acknowledged. First, our analysis does not include formal quantitative uncertainty assessment, such as probabilistic error propagation or confidence interval estimation. The computational demands of propagating uncertainty through multiple InVEST models across five time periods and large spatial extents, combined with the lack of reported uncertainty estimates for many historical input datasets, precluded comprehensive uncertainty quantification. However, we implemented multiple validation strategies—including comparison with statistical data, remote sensing observations, published research, and multi-scale consistency checks—that collectively support the reliability of our identified spatial patterns and temporal trends. Future research should incorporate formal uncertainty analysis through ensemble modeling or Bayesian frameworks to more rigorously quantify confidence in ecosystem service estimates.
Second, the InVEST models, while widely validated, rely on simplifying assumptions about ecological processes that may not fully capture the complexity of arid and semi-arid ecosystems. Third, our five-year temporal resolution, while appropriate for capturing decadal trends and policy-relevant timescales, may not detect shorter-term fluctuations in ecosystem services driven by interannual climate variability. Finally, parameter calibration was based primarily on published studies from similar regions rather than extensive field campaigns in the Ili River Valley itself, which may introduce regional bias.
Despite these limitations, our multi-scale analytical framework, integration of diverse data sources, and consistency with independent validation data provide reasonable confidence that the major patterns and relationships identified in this study reflect actual ecosystem dynamics. The absolute magnitudes of individual service values should be interpreted with caution, but the relative patterns of trade-offs, synergies, and their scale-dependent characteristics represent robust findings that can inform watershed management and policy development.

5. Conclusions

This study, based on multi-source remote sensing data from 2000 to 2020 and ecosystem service assessment models in the Ili River Valley, systematically analyzed the spatiotemporal synergies and trade-offs among five key ecosystem services at both watershed and 500 m grid scales. The main conclusions are as follows: 1. Over the past 20 years, the services of SC, WY, and WP have significantly improved, with increases of 19.6%, 18.3%, and 14.2%, respectively, reflecting overall enhancements in regional vegetation restoration, water conservation, and non-point source pollution control. In contrast, CS has slightly declined by 0.4%. 2. The trade-off relationships among ecosystem services have continuously strengthened: Over the past 20 years, at both scales, the areas exhibiting trade-offs between ESs have significantly expanded, while areas of synergy have relatively contracted. Some service pairs, such as WY–WP (correlation decreased from 0.31 in 2000 to −0.45 in 2020) and HQ–WY (from 0.59 to −0.45), have gradually transitioned from weak synergy or no correlation to significant trade-offs, reflecting the increasingly prominent conflicts in resource allocation within the ecosystem. 3. Trade-off relationships dominate, with synergies being locally significant: We identified 20 pairs of trade-offs. In areas with intensive agricultural and pastoral activities and irrigated agriculture, service pairs such as WP–SC, WP–WY, and HQ–WP exhibit clear functional trade-offs, indicating significant ecological function conflicts between water quality, water quantity, and habitat services under intensified human interference. However, service pairs like HQ–CS and SC–WY show stable synergistic relationships in high-altitude areas with good vegetation cover, reflecting strong coupling of natural processes. 4. The interactive relationships among ESs exhibit significant scale sensitivity: The grid scale reveals more detailed spatial heterogeneity, with some service pairs (such as WY–CS) showing reversals in the direction of synergy/trade-off at local scales, indicating that differences in topography, hydrology, and land use play a crucial regulatory role in the relationships between ecosystem services at micro-spatial scales. 5. The dual driving mechanisms of climate and human activities determine the evolutionary pattern of trade-offs: At the watershed scale, natural factors (such as temperature, precipitation, and topography) predominantly influence CS, SC, and WY, while human activities significantly affect HQ and WP.

Supplementary Materials

The following supporting information can be downloaded at: https://www.mdpi.com/article/10.3390/land14112166/s1, Table S1: Data sources and descriptions for ecosystem services quantification; Table S2: Habitat suitability and threat sensitivity parameters for InVEST habitat quality module; Table S3: Threat source parametzzers for habitat quality model; Table S4: Carbon storage module parameters for different land use types; Table S5: Cover management factor (C) and conservation practice factor (P) for soil conservation; Table S6: Water yield module parameters; Table S7: Nitrogen parameters for nutrient delivery ratio (NDR) module; Table S8: Phosphorus parameters for nutrient delivery ratio (NDR) module; Figure S1: Geodetector interaction detection results for ecosystem services drivers in 2000 at sub-watershed and grid scales; Figure S2: Geodetector interaction detection results for ecosystem services drivers in 2005 at sub-watershed and grid scales; Figure S3: Geodetector interaction detection results for ecosystem services drivers in 2010 at sub-watershed and grid scales; Figure S4: Geodetector interaction detection results for ecosystem services drivers in 2015 at sub-watershed and grid scales; Supplementary Material S1: Detailed methodologies for quantification of ecosystem services using InVEST model; Supplementary Material S2: Supplementary results of ecosystem services drivers analysis. References [50,51,52,53,54,55,56,57,58,59] are cited in main text.

Author Contributions

Conceptualization, R.P., J.Y., H.L. and Q.X.; methodology, R.P. and H.L.; software, R.P. and J.Y.; validation, R.P. and J.Y.; formal analysis, R.P. and H.L.; investigation, J.Y. and Q.X.; resources, J.Y.; data curation, R.P., J.Y., H.L. and Q.X.; writing—original draft preparation, R.P. and Q.X.; writing—review and editing, R.P., J.Y., H.L. and Q.X.; visualization, R.P.; supervision, J.Y.; project administration, J.Y. and Q.X.; funding acquisition, J.Y. and Q.X. All authors have read and agreed to the published version of the manuscript.

Funding

This research was funded by Doctoral Foundation of Yili Normal University (2024YSBS002), the Xinjiang Water Resources Science and Technology Special Fund Program of Xinjiang Uygur Autonomous Region Ecological Water Resources Research Center (Academician and Expert Workstation of the Department of Water Resources of the Xinjiang Uygur Autonomous Region) (2023.B-003), the Third Batch of Tianchi Innovation Leading Talent Fund of Xinjiang Autonomous Region (Grant No. 2025CXLJ005) and Basic Scientific Research Operating Expenses for Universities in Xinjiang Uygur Autonomous Region in 2025 (XJEDU2025P087).

Data Availability Statement

The original contributions presented in the study are included in the article/Supplementary Material; further inquiries can be directed to the corresponding authors.

Conflicts of Interest

All authors declare no conflicts of interest. The funders had no role in the design of the study, in the collection, analyses, or interpretation of data, in the writing of the manuscript, or in the decision to publish the results.

References

  1. Watson, L.; Straatsma, M.W.; Wanders, N.; Verstegen, J.A.; de Jong, S.M.; Karssenberg, D. Global ecosystem service values in climate class transitions. Environ. Res. Lett. 2020, 15, 024008. [Google Scholar] [CrossRef]
  2. Diaz, S.; Settele, J.; Brondizio, E.S.; Ngo, H.T.; Agard, J.; Arneth, A.; Balvanera, P.; Brauman, K.A.; Butchart, S.H.M.; Chan, K.M.A.; et al. Pervasive human-driven decline of life on Earth points to the need for transformative change. Science 2019, 366, 1327. [Google Scholar] [CrossRef]
  3. Pan, Y.; Birdsey, R.A.; Fang, J.; Houghton, R.; Kauppi, P.E.; Kurz, W.A.; Phillips, O.L.; Shvidenko, A.; Lewis, S.L.; Canadell, J.G.; et al. A Large and Persistent Carbon Sink in the World’s Forests. Science 2011, 333, 988–993. [Google Scholar] [CrossRef]
  4. Lyu, X.; Li, X.; Dang, D.; Dou, H.; Wang, K.; Gong, J.; Wang, H.; Liu, S. A Perspective on the Impact of Grassland Degradation on Ecosystem Services for the Purpose of Sustainable Management. Remote Sens. 2022, 14, 5120. [Google Scholar] [CrossRef]
  5. Polasky, S.; Tallis, H.; Reyers, B. Setting the bar: Standards for ecosystem services. Proc. Natl. Acad. Sci. USA 2015, 112, 7356–7361. [Google Scholar] [CrossRef] [PubMed]
  6. Bennett, E.M.; Peterson, G.D.; Gordon, L.J. Understanding relationships among multiple ecosystem services. Ecol. Lett. 2009, 12, 1394–1404. [Google Scholar] [CrossRef]
  7. Cord, A.F.; Bartkowski, B.; Beckmann, M.; Dittrich, A.; Hermans-Neumann, K.; Kaim, A.; Lienhoop, N.; Locher-Krause, K.; Priess, J.; Schroeter-Schlaack, C.; et al. Towards systematic analyses of ecosystem service trade-offs and synergies: Main concepts, methods and the road ahead. Ecosyst. Serv. 2017, 28, 264–272. [Google Scholar] [CrossRef]
  8. Wu, X.; Yan, Z.; Yang, H.; Wang, S.; Zhang, H.; Shen, Y.; Song, S.; Liu, Y.; Guo, Y.; Yang, D.; et al. Ecological restoration in the Yellow River Basin enhances hydropower potential. Nat. Commun. 2025, 16, 2566. [Google Scholar] [CrossRef]
  9. Wang, Z.; Xu, M.; Penny, G.; Hu, H.; Zhang, X.; Tian, S. Impact of revegetation and agricultural intensification on water storage variation in the Yellow River Basin. J. Hydrol. 2024, 635, 131218. [Google Scholar] [CrossRef]
  10. Ling, Y.; Yang, Y.; Xu, J.; Wang, L.; Wang, Z.; Sun, Y.; Yao, C.; Wang, Y. Impacts of urbanization on the supply and demand relationship of typical ecosystem services in Beijing-Tianjin-Hebei region. Acta Ecol. Sin. 2023, 43, 5289–5304. [Google Scholar]
  11. Lan, Y.; Sun, T.; Li, W. Trade-offs and synergies of farmland ecosystem services in Loess Plateau: A case study of Longdong Region, Northwest China. Trans. Chin. Soc. Agric. Eng. 2023, 39, 236–244. [Google Scholar]
  12. Chen, W.; Chi, G. Ecosystem services trade-offs and synergies in China, 2000-2015. Int. J. Environ. Sci. Technol. 2023, 20, 3221–3236. [Google Scholar] [CrossRef]
  13. Guo, Z.; Liu, Y.; Zhang, L.; Feng, C.; Chen, Y. Research progress and prospect of ecosystem services. J. Environ. Eng. Technol. 2022, 12, 928–936. [Google Scholar]
  14. Yi, H. Ecosystem Services Valuation and Research Methodology for Mapping Ecosystem Services: Concepts, Trends, Issues, and Applications. J. Korean Geogr. Soc. 2022, 57, 189–208. [Google Scholar] [CrossRef]
  15. Huang, Y.; Wu, J. Spatial and temporal driving mechanisms of ecosystem service trade-off/synergy in national key urban agglomerations: A case study of the Yangtze River Delta urban agglomeration in China. Ecol. Indic. 2023, 154, 110800. [Google Scholar] [CrossRef]
  16. Baskent, E.Z.; Kaspar, J. Exploring the effects of management intensification on multiple ecosystem services in an ecosystem management context. For. Ecol. Manag. 2022, 518, 120299. [Google Scholar] [CrossRef]
  17. Gong, X.J.; Chang, C.C. Correlation and trade-off analysis of ecosystem service value and human activity intensity: A case study of Changsha, China. Environ. Dev. Sustain. 2025, 27, 3081–3102. [Google Scholar] [CrossRef]
  18. Harris, L.R.; Defeo, O. Sandy shore ecosystem services, ecological infrastructure, and bundles: New insights and perspectives. Ecosyst. Serv. 2022, 57, 101477. [Google Scholar] [CrossRef]
  19. Liu, Q.; Du, G.; Liu, H. A Quantitative Study on the Identification of Ecosystem Services: Providing and Connecting Areas and Their Impact on Ecosystem Service Assessment. Sustainability 2022, 14, 7904. [Google Scholar] [CrossRef]
  20. Su, B.; Liu, M. Study on extra services of integrated agricultural landscapes: A case study conducted on the Costal Bench Terrace System. Ecol. Indic. 2022, 145, 109634. [Google Scholar] [CrossRef]
  21. Wei, Y.; Song, B.; Wang, Y. Designing cross-region ecological compensation scheme by integrating habitat maintenance services production and consumption-A case study of Jing-Jin-Ji region. J. Environ. Manag. 2022, 311, 114820. [Google Scholar] [CrossRef]
  22. Pan, R.Y.; Yan, J.J.; Xia, Q.Q.; Jin, X.F. Enhancing Ecological Security in Ili River Valley: Comprehensive Approach. Water 2024, 16, 1867. [Google Scholar] [CrossRef]
  23. Min, Y.F.; Huang, W.L.; Ma, M.J.; Zhang, Y.N. Simulations in the Topography Effects of Tianshan Mountains on an Extreme Precipitation Event in the Ili River Valley, China. Atmosphere 2021, 12, 750. [Google Scholar] [CrossRef]
  24. Shi, M.J.; Wu, H.Q.; Fan, X.; Jia, H.T.; Dong, T.; He, P.X.; Baqa, M.F.; Jiang, P.G. Trade-Offs and Synergies of Multiple Ecosystem Services for Different Land Use Scenarios in the Yili River Valley, China. Sustainability 2021, 13, 1577. [Google Scholar] [CrossRef]
  25. Zhao, L.Y.; Yang, J.Z.; Sun, W.D.; Yu, H.; Xing, Y.; Chen, D.; Ma, X.; Wang, T.; Wang, C. Study on evaluation and analysis of geological environment of mines in Ili Valley and ecological restoration countermeasures. Remote Sens. Nat. Resour. 2024, 36, 23–30. [Google Scholar]
  26. Yang, Y.H.; Chen, Y.N.; Li, W.H.; Chen, Y.P. Distribution of soil organic carbon under different vegetation zones in the Ili River Valley, Xinjiang. J. Geogr. Sci. 2010, 20, 729–740. [Google Scholar] [CrossRef]
  27. Wu, J.H.; Wang, H.W.; Wang, C.; Huang, X.; Wei, J.X.; Wang, Z.G.; Zhang, C.; Chen, B.; Yiming, Y.; Lei, C.; et al. Zoning and spatial resilience: Land use and food security in the Ili River Valley, China. Land Use Policy 2025, 157, 19. [Google Scholar] [CrossRef]
  28. Zhao, T.; Pan, J.H.; Bi, F. Can human activities enhance the trade-off intensity of ecosystem services in arid inland river basins? Taking the Taolai River asin as an example. Sci. Total Environ. 2023, 861, 13. [Google Scholar] [CrossRef] [PubMed]
  29. Karimi, J.D.; Corstanje, R.; Harris, J.A. Bundling ecosystem services at a high resolution in the UK: Trade-offs and synergies in urban landscapes. Landsc. Ecol. 2021, 36, 1817–1835. [Google Scholar] [CrossRef]
  30. Stout, D.T.; Walsh, T.C.; Burian, S.J. Ecosystem services from rainwater harvesting in India. Urban Water J. 2017, 14, 561–573. [Google Scholar] [CrossRef]
  31. Hu, X.S.; Hong, W.; Qiu, R.Z.; Hong, T.; Chen, C.; Wu, C.Z. Geographic variations of ecosystem service intensity in Fuzhou City, China. Sci. Total Environ. 2015, 512, 215–226. [Google Scholar] [CrossRef] [PubMed]
  32. Wang, J.F.; Li, X.H.; Christakos, G.; Liao, Y.L.; Zhang, T.; Gu, X.; Zheng, X.Y. Geographical Detectors-Based Health Risk Assessment and its Application in the Neural Tube Defects Study of the Heshun Region, China. Int. J. Geogr. Inf. Sci. 2010, 24, 107–127. [Google Scholar] [CrossRef]
  33. Yuan, W.R.; Chen, L.K.; Chen, H.X.; Deng, S.F.; Ji, H.; Liang, F.S. Assessing habitat quality at Poyang Lake based on InVEST and Geodetector modeling. Ecol. Evol. 2023, 13, e10759. [Google Scholar] [CrossRef]
  34. Zhang, Y.; Song, C.L.; Ji, L.; Liu, Y.Q.; Xiao, J.; Cao, X.Y.; Zhou, Y.Y. Cause and effect of N/P ratio decline with eutrophication aggravation in shallow lakes. Sci. Total Environ. 2018, 627, 1294–1302. [Google Scholar] [CrossRef]
  35. Shen, J.; Li, S.; Wang, H.; Wu, S.; Liang, Z.; Zhang, Y.; Wei, F.; Li, S.; Ma, L.; Wang, Y.; et al. Understanding the spatial relationships and drivers of ecosystem service supply-demand mismatches towards spatially-targeted management of social-ecological system. J. Clean. Prod. 2023, 406, 136882. [Google Scholar] [CrossRef]
  36. Rodriguez, B.C.; Palma-Torres, V.M.; Castanenda, T.E.; Codtiyeng, S.K.; Castillo, J.F.; Sasi, A.P.V.; Tercero, M.U.; Andrada, R.T., II. Drivers and impacts of land use and land cover changes on ecosystem services provided by the watersheds in the Philippines: A systematic literature review. Int. For. Rev. 2023, 25, 473–490. [Google Scholar] [CrossRef]
  37. Schirpke, U.; Tasser, E.; Borsky, S.; Braun, M.; Eitzinger, J.; Gaube, V.; Getzner, M.; Glatzel, S.; Gschwantner, T.; Kirchner, M.; et al. Past and future impacts of land-use changes on ecosystem services in Austria. J. Environ. Manag. 2023, 345, 118728. [Google Scholar] [CrossRef] [PubMed]
  38. Deng, Y.-Y.; Wang, D.; Xu, H. Trade-offs and synergies relationships of ecosystem services and their socio-ecological driving factors under different spatial scales in Shaoguan City, Guangdong, China. Ying Yong Sheng Tai Xue Bao J. Appl. Ecol. 2023, 34, 3073–3084. [Google Scholar] [CrossRef]
  39. Hu, X.; Zhao, J.; Wang, B.; Gao, C. Changes of spatial synergies or trade-offs of ecosystem services in Heihe River Basin. Chin. J. Ecol. 2022, 41, 580–588. [Google Scholar]
  40. Su, B.; Liu, M. An ecosystem service trade-off management framework based on key ecosystem services. Ecol. Indic. 2023, 154, 110894. [Google Scholar] [CrossRef]
  41. Zhu, C.; Zhong, S.; Long, Y.; Yan, D. Spatiotemporal variation of ecosystem services and their drivers in the Yellow River Basin, China. Chin. J. Ecol. 2023, 42, 2502–2513. [Google Scholar]
  42. Liu, W.; Zhan, J.; Zhao, F.; Wang, C.; Zhang, F.; Teng, Y.; Chu, X.; Kumi, M.A. Spatio-temporal variations of ecosystem services and their drivers in the Pearl River Delta, China. J. Clean. Prod. 2022, 337, 130466. [Google Scholar] [CrossRef]
  43. Mashizi, A.K.; Sharafatmandrad, M. Dry forests conservation: A comprehensive approach linking ecosystem services to ecological drivers and sustainable management. Glob. Ecol. Conserv. 2023, 47, e02652. [Google Scholar] [CrossRef]
  44. Makovnikova, J.; Kolosta, S.; Flaska, F.; Palka, B. Factors Influencing the Spatial Distribution of Regulating Agro-Ecosystem Services in Agriculture Soils: A Case Study of Slovakia. Agriculture 2023, 13, 970. [Google Scholar] [CrossRef]
  45. Birkhofer, K.; Bird, T.; Alfeus, M.; Arvidsson, F.; Buxton, M.; Djoudi, E.A.; Fabiano, E.; Kasinda, E.; Machekano, H.; Mpofu, P.; et al. Smallholder agriculture in African dryland agroecosystems has limited impact on trophic group composition, but affects arthropod provision of ecosystem services. Agric. Ecosyst. Environ. 2024, 363, 108860. [Google Scholar] [CrossRef]
  46. Petrosillo, I.; Valente, D.; Scavuzzo, C.M.; Selvan, T. Land degradation pattern and ecosystem services. Front. Environ. Sci. 2023, 11, 1137768. [Google Scholar] [CrossRef]
  47. Fang, Z.; Ding, T.; Chen, J.; Xue, S.; Zhou, Q.; Wang, Y.; Wang, Y.; Huang, Z.; Yang, S. Impacts of land use/land cover changes on ecosystem services in ecologically fragile regions. Sci. Total Environ. 2022, 831, 154967. [Google Scholar] [CrossRef] [PubMed]
  48. Petit, S.; Landis, D.A. Landscape-scale management for biodiversity and ecosystem services. Agric. Ecosyst. Environ. 2023, 347, 108370. [Google Scholar] [CrossRef]
  49. Zhuang, X.; Wang, X. Study on Estuarine Wetland Restoration Based on Ecosystem Services Theory: A Case Study of Blue Bay Initiative of Quanzhou. Chin. Landsc. Archit. 2023, 39, 114–119. [Google Scholar]
  50. Variations of Habitat Quality and Its Response of Landscape Dynamic in the Three Gorges Reservoir Area, China. Int. J. Environ. Res. Public Health 2022, 19, 3594. [CrossRef]
  51. Wu, L.L.; Sun, C.G.; Fan, F.L. Estimating the Characteristic Spatiotemporal Variation in Habitat Quality Using the InVEST Model-A Case Study from Guangdong-Hong Kong-Macao Greater Bay Area. Remote Sens. 2021, 13, 1008. [Google Scholar] [CrossRef]
  52. Liu, C.; Liu, D.H.; Li, P.; Li, X.X.; Liu, Z.H.; Zhao, Y.N. Assessment of occupation of natural habitat by urban expansion and its impact on crucial ecosystem services in China’s coastal zone. Ecol. Indic. 2023, 154, 110682. [Google Scholar] [CrossRef]
  53. Makkonen, M.; Huttunen, S.; Primmer, E.; Repo, A.; Hildén, M. Policy coherence in climate change mitigation: An ecosystem service approach to forests as carbon sinks and bioenergy sources. For. Policy Econ. 2015, 50, 153–162. [Google Scholar] [CrossRef]
  54. Robert, M.; Saugier, B. Contribution of terrestrial ecosystems to carbon sequestration. Comptes Rendus Geosci. 2003, 335, 577–595. [Google Scholar] [CrossRef]
  55. Gebre, A.B.; Birhane, E.; Gebresamuel, G.; Hadgu, K.M.; Norgrove, L. Woody species diversity and carbon stock under different land use types at Gergera watershed in eastern Tigray, Ethiopia. Agrofor. Syst. 2019, 93, 1191–1203. [Google Scholar] [CrossRef]
  56. Adelisardou, F.; Zhao, W.; Chow, R.; Mederly, P.; Minkina, T.; Schou, J.S. Spatiotemporal change detection of carbon storage and sequestration in an arid ecosystem by integrating Google Earth Engine and InVEST (the Jiroft plain, Iran). Int. J. Environ. Sci. Technol. 2022, 19, 5929–5944. [Google Scholar] [CrossRef]
  57. Uri, N.D. An evaluation of the economic benefits and costs of conservation tillage. Environ. Geol. 2000, 39, 238–248. [Google Scholar] [CrossRef]
  58. Vanwalleghem, T.; Gomez, J.A.; Amate, J.I.; de Molina, M.G.; Vanderlinden, K.; Guzman, G.; Laguna, A.; Giraldez, J.V. Impact of historical land use and soil management change on soil erosion and agricultural sustainability during the Anthropocene. Anthropocene 2017, 17, 13–29. [Google Scholar] [CrossRef]
  59. Bashie, A.L.; Ayankukwa, A.U.; Owojoku, O.D.; Nicholas, O.G.; Ishoro, A.P.; Christiana, U.A. Predicting Environmental Covariates of Soil Organic Matter at Sub-Regional Scale for Sustainable Agricultural Development in Southeast Nigeria. Pol. J. Environ. Stud. 2025, 34, 2011–2021. [Google Scholar] [CrossRef]
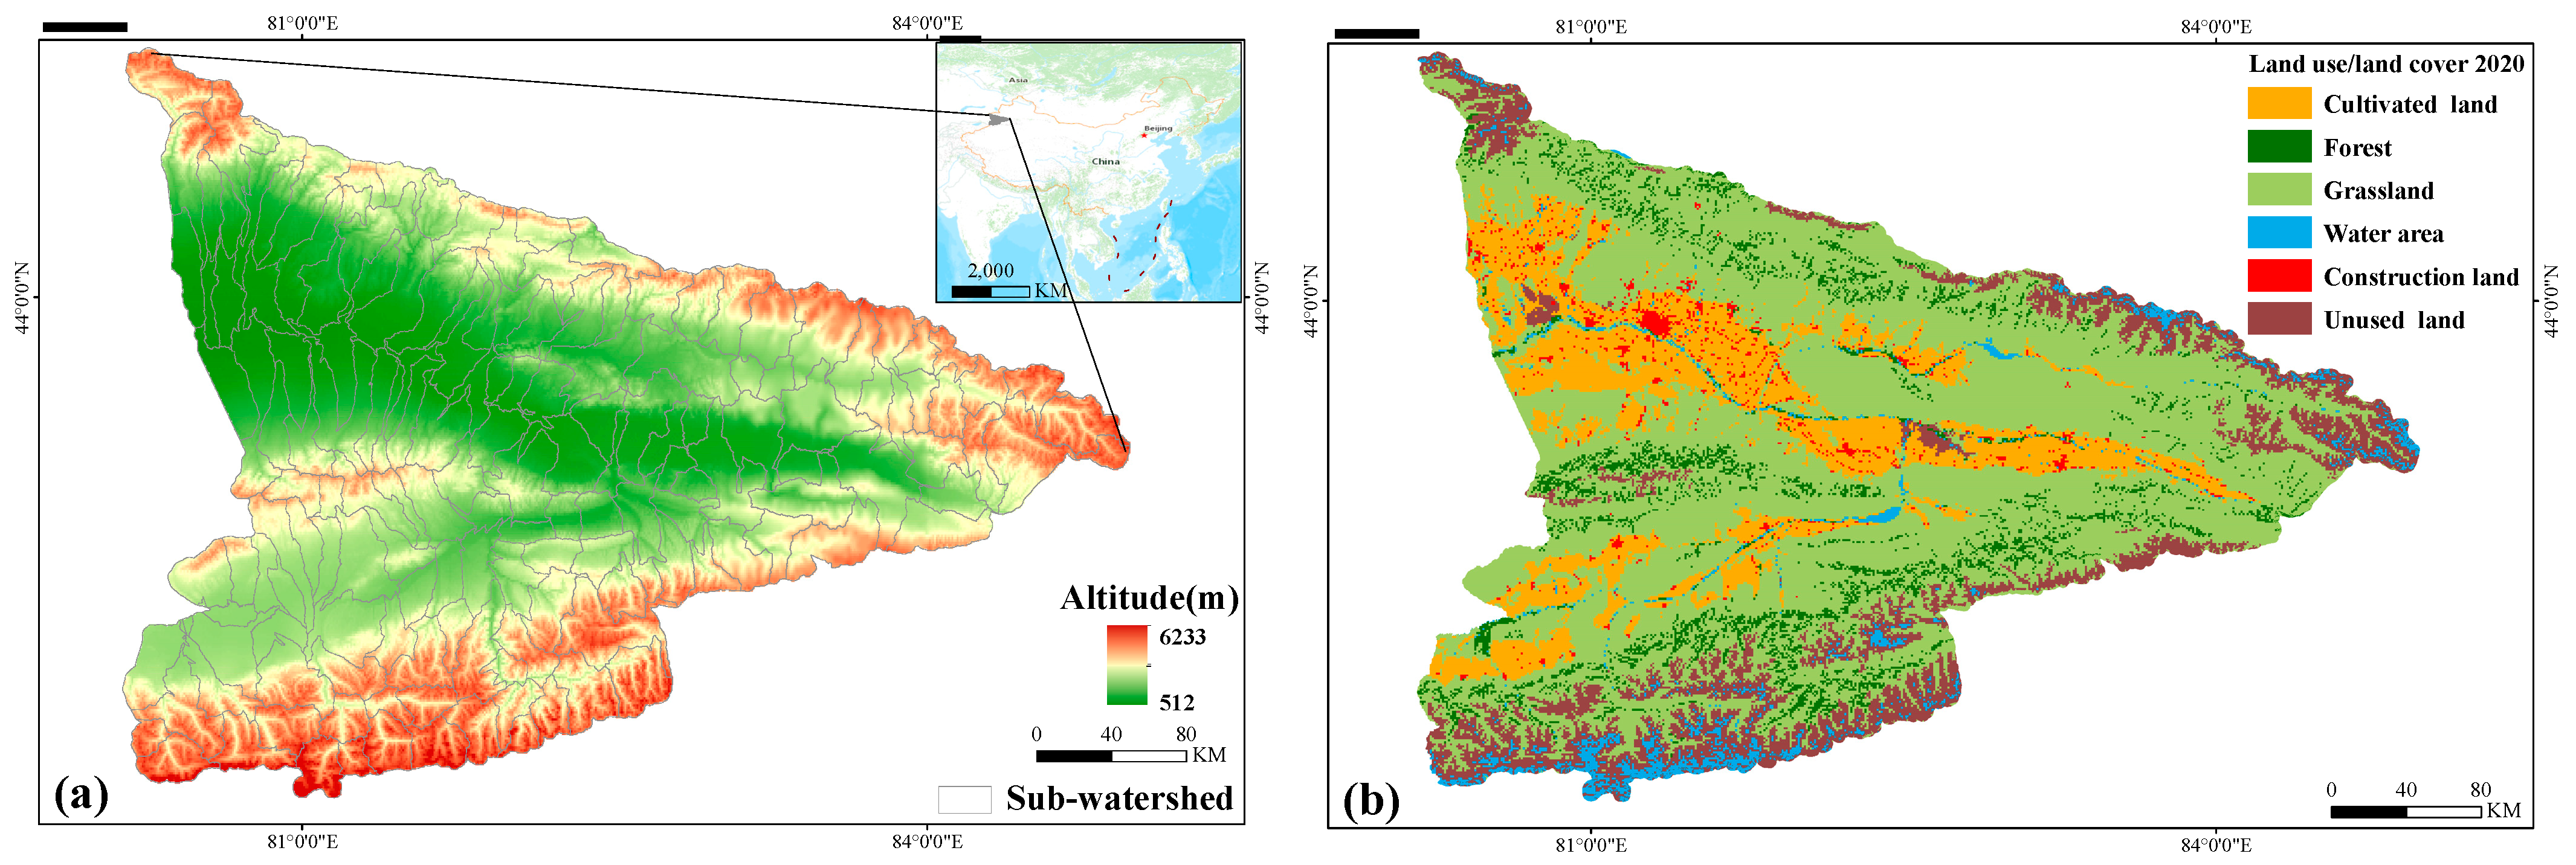
Figure 1. Study Area Overview. (a) Digital elevation model (DEM); (b) Land use distribution.
Land 14 02166 g001
Figure 2. Integrated Analytical Framework for Ecosystem Services.
Land 14 02166 g002
Figure 3. The spatial-temporal patterns of ecosystem services.
Land 14 02166 g003
Figure 4. Analysis of correlation between ES pairs.
Land 14 02166 g004
Figure 5. (ae) Watershed Scale, (fj) Grid Scale. The figure, the x-axis represents the independent variables, while the y-axis represents the dependent variables.
Land 14 02166 g005
Figure 6. Analysis of the Area Proportions of Spatial Synergies and Trade-offs: (a) Watershed Scale, (b) Grid Scale. In the figure, the x-axis represents the independent variables, while the y-axis represents the dependent variables.
Land 14 02166 g006
Figure 7. Results of Interaction Factors at the Sub-watershed Scale (a,c,e,g,i) and the Grid Scale (b,d,f,h,j).
Land 14 02166 g007
Disclaimer/Publisher’s Note: The statements, opinions and data contained in all publications are solely those of the individual author(s) and contributor(s) and not of MDPI and/or the editor(s). MDPI and/or the editor(s) disclaim responsibility for any injury to people or property resulting from any ideas, methods, instructions or products referred to in the content.