Article

Application of Principal Component and Multi-Criteria Analysis to Evaluate Key Physical and Chemical Soil Indicators for Sustainable Land Use Management in Arid Rangeland Ecosystems

by
Hesham M. Ibrahim
1,2,*,
Zafer Alasmary
1,
Mosaed A. Majrashi
1,
Meshal Abdullah Harbi
3,
Abdullah Abldubise
3 and
Abdulaziz G. Alghamdi
1
1
Department of Soil Sciences, College of Food and Agricultural Sciences, King Saud University, P.O. Box 2460, Riyadh 11451, Saudi Arabia
2
Department of Soils and Water, Faculty of Agriculture, Suez Canal University, Ismailia 41522, Egypt
3
National Center for Vegetation Cover Development and Combating Desertification, 6336 Northern Ring Br. Rd., An Nafal, P.O. Box 3372, Riyadh 13312, Saudi Arabia
*
Author to whom correspondence should be addressed.
Land 2025, 14(11), 2167; https://doi.org/10.3390/land14112167 (registering DOI)
Submission received: 27 September 2025 / Revised: 27 October 2025 / Accepted: 28 October 2025 / Published: 30 October 2025

Abstract

Vast areas of natural rangelands in the Kingdom of Saudi Arabia (KSA) suffer from deterioration due to the scarcity of vegetation cover and poor soil quality. Assessing soil quality in rangelands is crucial to identifying degraded lands and to implementing proper sustainable management practices. In this study, a total data set (TDS) containing 27 physical and chemical soil indicators was generated for three rangelands (Al-Fahyhyl, Al-Sahwa, and Al-Tamryate) in KSA. Principal component analysis (PCA) and analytic hierarchy process (AHP) analysis were employed to establish a minimum data set (MDS) and to evaluate key physical and chemical properties affecting soil quality, along with the associated weight factor for each indicator. Results indicated that the MDS represented ≥70% of the total variability of the TDS and accurately estimated the soil quality index (SQI) based on determined physical and chemical soil properties in the study regions. Linear regression indicated high correlation between SQI-TDS and SQI-MDS, with the R2 ranging between 0.51–0.87. On the surface layer (0–30 cm), the MDS contained seven soil indicators (sand, dispersion ratio (DR), mean weight diameter (MWD), bulk density (BD), total organic carbon (TOC), available phosphorus (Pa), and available potassium (Ka)), whereas in the sub-surface layer it contained six indicators (sand, DR, MWD, BD, TOC, Pa, and Ka). In all regions, sand had the largest weight factor (0.4514–0.4835), followed by TOC (0.2441–0.2512). Under the arid climate present in all the study sites, sand and TOC levels are crucial for nutrient retention, soil structure, and water retention. Most of the study areas had very low and low SQI (Al-Fahyhyl, 74.4%; Al-Sahwa, 61.8%; and Al-Tamryate, 81.7%), indicating an immediate need for suitable agricultural practices such as reduced tillage, increased organic amendments, and proper water management. The outcomes of this study offer valuable insights for land managers, legislators, and agricultural stakeholders to pinpoint regions in need of development, conduct comprehensive and continuous monitoring of SQI in rangeland areas, and implement land management plans for rangeland rehabilitation and environmental sustainability.

1. Introduction

A sustainable ecosystem depends on healthy soils because they store carbon, generate food and wood, filter water, and sustain wildlife and natural vegetation. However, soils are frequently ignored when performing environmental assessments, despite the fact that it can be very challenging to restore them if they are highly degraded. The idea of “Soil Quality”, which emphasizes the soil’s ability to function as a living ecosystem that supports plants, animals, environmental quality, and human needs, has gained greater interest in recent years [1]. More people are realizing the importance of soil quality for climate resilience and sustainable land management, particularly in arid and semi-arid ecosystems. Through proper management, soil quality entails finding a balance between environmental quality, production, and the health of plants and animals—all of which are greatly impacted by decisions made about land use and management [2,3].
A variety of physical, chemical, and biological characteristics that collectively describe the soil’s capacity to perform within the specific boundaries of an ecosystem define the quality of the soil [4]. Over the years, these characteristics have been the focus of multiple evaluations that emphasize soil as a complex system made up of these interacting constituents [5,6,7,8,9]. The increasing intensity of global concerns, such as urbanization, land degradation, and climate change, necessitates the development of practical and scientifically sound methodologies for evaluating soil quality [8]. The relevance of traditional soil assessments to stakeholders such as farmers, land managers, and policymakers is limited, since they frequently need specific knowledge and equipment [10]. A simplified approach to soil quality evaluation can help to facilitate the interpretation of this information, enabling stakeholders to make informed decisions on land management practices [11].
Key soil quality indicators must be identified in order to assess the quality of the soil. However, the list of potential properties can be long [12]. Therefore, a combination of qualitative and quantitative standards has been used to assist in identifying soil characteristics that contribute significantly to the explanation of dataset variance and designating them as important soil quality indicators [13]. Quantitative methods like principal component analysis (PCA) have been widely used to minimize large datasets of soil properties to identify the most relevant soil properties for accurate assessment of soil quality [14]. For example, Merrington et al. [7], narrowed the list of 67 features to measure to six chemical, five biological, and nine physical properties, as well as four “proxy” variables that have the greatest influence on the interaction between soil and environment. Similarly, Bünemann et al. [5] identified 27 important properties from reviewing 65 soil quality assessment approaches. Lehmann et al. [8] reviewed 65 soil quality testing frameworks and found that more than 50–75% of these frameworks contained measures of pH, plant-available potassium and phosphorus, soil organic matter, bulk density, and water storage.
It is generally accepted that important aspects of soil quality include properties like pH, microbial biomass, soil organic matter, and nutrient availability [15,16]. These indicators offer information about the long-term sustainability of land use practices, in addition to reflecting the condition of the soil at the current time. For example, decreasing soil organic matter could indicate decreased fertility and increased erosion risks, endangering ecosystem stability and agricultural output [17]. Furthermore, as soil microbial biomass is intimately related to nutrient cycling and disease prevention, it is an important indicator of soil resilience [18]. Although there has been an improvement in our understanding of soil quality, there are still large information gaps. Chapman et al. [9] examined 240 publications and found a significant vacuum in the literature; the majority of research focuses on agricultural lands and on soil thicknesses of 30 cm or less, offering little insight into the assessment of soil quality for other types of land use (e.g., rangelands) and deeper soil depths. Furthermore, because soils vary across time and geography, the process of selecting a number of trustworthy soil quality indicators is still difficult, and there is disagreement about how to score these indicators across a range of land uses, soil types, and climatic conditions [19].
The establishment of reference values for evaluating soil quality indicators has been based on two major concepts [20]. Maharjan et al. [21] suggested a generalized concept defining broad criteria without taking local soil variance into account. The second concept suggests that a single value might not be appropriate. Instead, important factors, including multiple soil properties and land usage, should be taken into account [22]. Therefore, the assessment of soil quality must rely on the computation of a soil quality index (SQI), which incorporates the spatial variations of important physical, chemical, and biological attributes of the soil [23]. In general, there are no common standards for the characteristics of soil properties that should be included in the assessment of SQI [24]. Most soil properties are dynamic (e.g., bulk density, organic matter, nutrient content, etc.), and as such, they are highly sensitive to management practices [25]. Moreover, despite the interdependent nature of soil properties, the effect of certain soil properties on soil quality may vary depending on different management systems based on land use and environmental conditions [26].
The estimation of SQI starts with the collection of a total dataset (TDS), which includes various indicators based on measured and collected data. Multivariate analysis techniques such as PCA are then employed to eliminate data redundancy and to indicate the most relevant indicators [27]. Multiple techniques have been suggested to assign unbiased weights to soil indicators, including the analytical hierarchy process (AHP) [28], which solves a numerical matrix of pair-wise comparisons among the different indicators to calculate proper weights and checks the consistency of the resulting values to eliminate any bias in the process [29]. Based on the previous process, a minimum dataset (MDS) is generated, and mathematical standard scoring functions (SSF) are used to normalize data and assign a scoring value ranging between zero and one for each selected indicator [30]. The relative importance of indicators is determined by assigning weights to each indicator. Finally, a weighted-average process is carried out using the numerical values of the scoring functions to determine the SQI value.
Many studies have investigated the application of the MDS method to identify important soil indicators and to assess SQI. For example, Qian et al. [31] used the MDS method to examine 26 soil indicators and found that only 8 indicators (clay, pH, soil water content, soil organic matter, cation exchange capacity, total potassium, copper, and zinc) can be used to accurately assess SQI in the study region. Shi et al. [27] evaluated the impact of land use alteration on the SQI of a red soil using an MDS assessment. MDS has also been applied to evaluate SQI in various ecosystems, including grassland, wetlands, and coastal regions [32,33,34]. Qi et al. [35] applied AHP to determine individual weights for a TDS of 22 soil indicators to assess soil quality in the agricultural region of Jiangsu Province, China.
Rangelands and pasture areas represent about 26% of the world’s land [36]. Based on this large extent, it is crucial to implement a sustainable land management approach to achieve effective functionality for rangelands and pasture areas while maintaining natural soil resources [37]. The assessment of SQI in rangelands is a central key factor to alter management practices to rehabilitate degraded soils, ensure long-term productivity, and optimize resource utilization [38]. In KSA, natural rangelands occupy approximately 170,000,000 ha, which represents about 76% of the total land area of the kingdom [39]. Despite the large extent of rangelands in KSA, few studies have addressed the assessment of soil quality in rangelands. Therefore, the aim of this study was to present a simplified methodology based on a multi-criteria assessment and MDS to identify the most important physical and chemical indicators that can be used as proxies to evaluate soil quality in various scenarios. This strategy simplifies the evaluation process, making it more approachable for researchers, stakeholders, land managers, policymakers, and farmers. The specific objective of this research was to establish an MDS of soil indicators based on a PCA and AHP analysis to quantitatively assess variations in key physical and chemical soil properties affecting SQI on the surface and in the sub-surface layers of three rangelands (Al-Fahyhyl, Al-Sahwa, and Al-Tamryate) located in the arid environment of the Kingdom of Saudi Arabia.

2. Materials and Methods

2.1. Description of the Study Sites

Saudi Arabia’s arid climate and desert terrain cause many places to experience higher rates of desertification and natural vegetation deterioration, endangering these regions’ productivity and reducing their suitability for agriculture, grazing, and other uses. KSA has put in place an ambitious National Environmental Strategy Plan, with the main objective to combat desertification by promoting the growth of natural vegetation in degraded rangelands in Saudi Arabia. In this regard, the current study was carried out in three natural regions representing different ecosystems in KSA: Al-Fahyhyl (Riyadh region), Al-Ṣahwa (Madinah region), and Al-Tamryate (Al-Jouf region). Digital elevation models (DEMs) and topographic data (Figure 1) were gathered in order to gain a better understanding of the characteristics and shape of the study locations. A DEM with a resolution of 12.5 m was acquired from the photos of the Advanced Land Observing Satellite (ALOS PALSAR). Rainfall and temperature records spanning the interval from 1991 to 2022 for the study sites were obtained from the General Authority of Meteorology and Environmental Protection (GAMEP) in KSA.

2.1.1. Al-Fahyhyl Site

The Al-Fahyhyl site is located in the Thadeq district (Riyadh Region) between latitudes 25°12′38″ and 25°17′44.1″ N and longitudes 45°58′5.6″ and 46°0′51.6″ E. The total area of the site is 2908 hectares. Weather records indicate a dry climate with hot summers and mild dry winters. Mean average temperatures range between 10.2 and 37.9 °C, and the average humidity ranges between 7 and 75%. The area receives an average annual precipitation of approximately 101 mm. Topographic analysis of the Al-Fahyhyl site showed that high mountains encircle the region from the east, west, and south. The region’s elevations vary from 700 to 888 m, progressively dropping from the higher southern and eastern sections to the lower northern and western portions (Figure 1).

2.1.2. Al-Ṣahwa Site

The Al-Ṣahwa site is located in the Al-Madinah district (Al-Madina region), 60 km northeast of Al-Madinah City, between latitudes 24°44′59.6″ and 25°3′42.1″ N and longitudes 39°40′12″ and 40°0′18″ E. Its total area is 46,176 hectares. The region experiences a very dry climate with extremely hot summers and mild, dry winters. Mean average temperatures range between 13.9 and 39.3 °C, and the average humidity ranges between 6 and 53%. The area receives an average annual precipitation of approximately 78 mm. Topographic analysis revealed greater variation as compared to other study sites, with elevation levels ranging from 793 to 1409 m. The lower elevation was observed in the southwestern parts of the study site, with elevations between 793 and 905 m, while the central and northeastern parts showed higher mountainous areas with elevations between 1049 and 1409 m (Figure 1).

2.1.3. Al-Tamryate Site

Al-Tamryate is located in the Sakaka district (Al-Jouf region), between latitudes 30°26′20.4″ and 30°36′46.7″ N and longitudes 40°17′42″ and 40°28′26.3″ E, approximately 80 km northeast of Sakaka City. The total area of the Al-Tamryate site is 19,500 hectares. The study area is characterized by a dry climate with hot summers and short cool winters. Mean average temperatures range between 5.9 and 37.5 °C, and the average humidity ranges between 11 and 76%. The study area receives a very low average annual precipitation of approximately 57 mm. Al-Tamryate has the least variance in elevation compared to the other study sites, with heights ranging from 708 to 790 m. The highest parts are located in the north and west, with a few isolated highland places in the south (Figure 1).

2.2. Soil Sample Collection

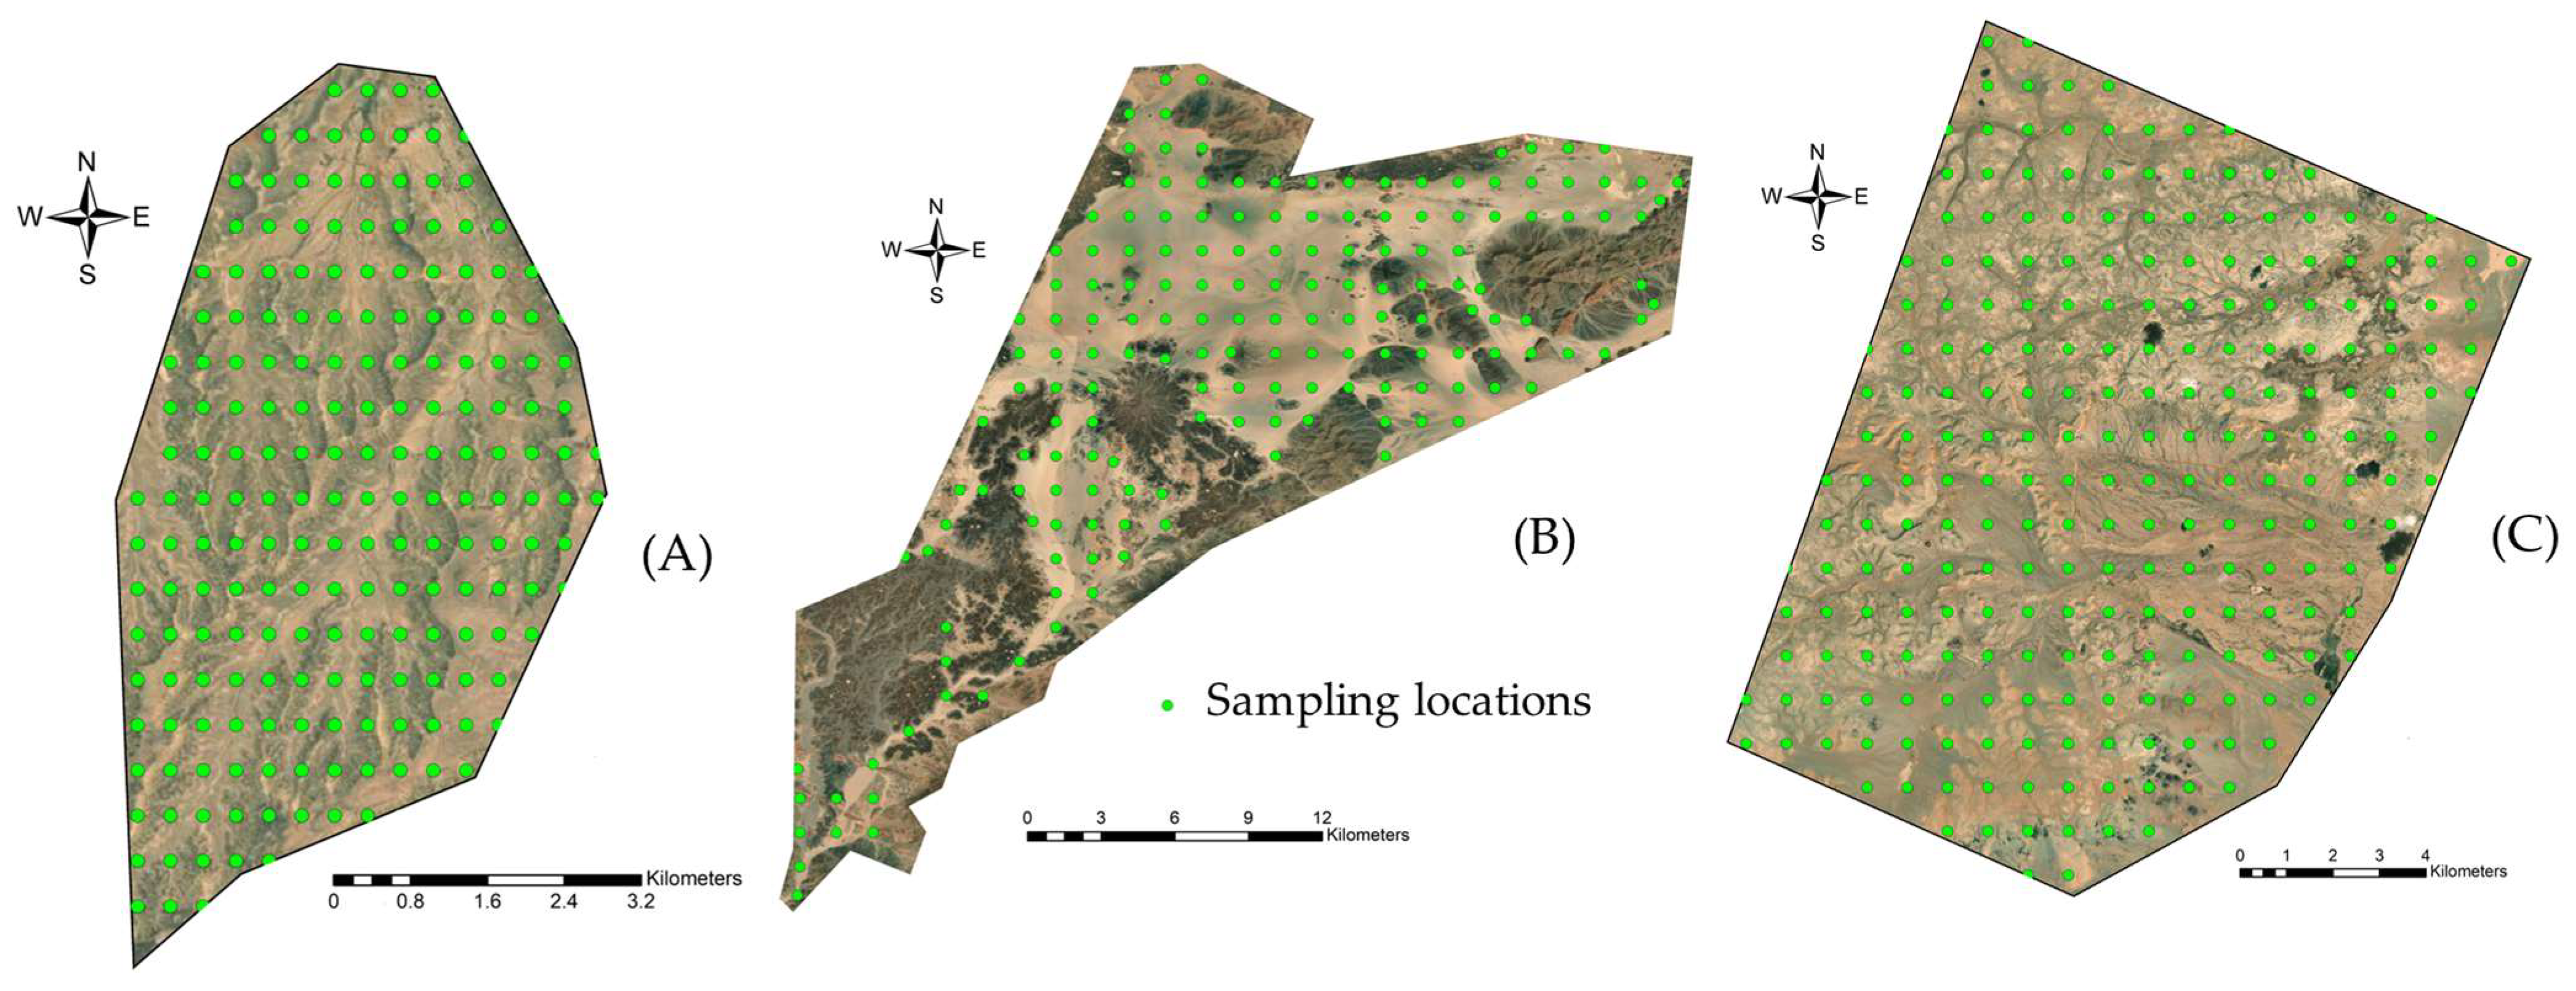
Due to the large aerial extent of the study sites and to ensure that the collected soil samples are a good representation of all areas and the spatial differences in the soil properties, the method of dividing the study area into a group of squares was used by using the Fishnet protocol within the GIS program. Based on the Fishnet protocol, the study area was divided into a group of squares with identical areas. The area of each square depends on the number of horizontal and vertical lines within the division grid, which varies according to the total area of each site to ensure good representation of all differences within the study area. Finally, the shape of the study area boundaries was loaded onto the grid of collected squares, and only the squares located within the study area boundaries were cut off to determine the final number of sample collection sites and the coordinates of these sites. Based on the previous methodology, 199, 246, and 239 sites were identified for collecting soil samples from the Al-Fahyhyl, Al-Sahwa, and Al-Tamryate areas, respectively. However, due to terrain difficulties, particularly in the Al-Sahwa site, several sampling locations were unreachable. Therefore, soil samples were collected from 193 locations in Al-Fahyhy, 170 locations in Al-Sahwa, and 217 locations in Al-Tamryate (Figure 2). Soil sampling was carried out simultaneously at the three sites during the month of April 2023. Surface (0–30 cm) and sub-surface (30–60 cm) soil samples were collected at each sampling location. Three separate soil samples were collected at each location from the designated soil depth using a soil auger. The three collected soil samples were thoroughly mixed to form one composite soil sample.

2.3. Field Measurements and Soil Sample Analysis

At each sampling location, both bulk density and soil permeability were measured in the surface soil layer (0–30 cm). Soil bulk density (BD) was measured by the Blacke and Hartge method [40] using a soil core (5 cm internal diameter and 5 cm height). Cumulative infiltration (CI) was also measured using the Mini-disk Infiltrometer method (2 cm suction; Meter Devices, Pullman, WA, USA). In addition, surface runoff was also calculated in the surface soil layer at each sampling location. The curve number (CN) method was used to calculate potential maximum retention (S) and surface runoff (Q), as outlined by the United States Department of Agriculture (USDA), Natural Resources Conservation Service (NRCS) [41]:
Q = P 0.2   S 2 P + 0.8   S
where P is the average rainfall (mm), and S is the potential maximum retention (mm), calculated as:
S = 25400 C N 254
where CN is the curve number based on the soil texture, hydrologic group, and land use. Surface runoff was calculated based on a worst-case scenario of a 100 mm rainstorm (determined based on average climatic data for the interval from 1991 to 2022 in the study areas).
Collected soil samples were transferred to the laboratory of the Department of Science at King Saud University for further analysis. Soil samples were air-dried and sieved to pass a 2 mm sieve, and the stone percentage was determined. Soil texture and the percentage of sand, silt, and clay particles were determined by the hydrometer method [42]. The dispersion ratio (DR) [43] and the mean weight diameter (MWD) [44] of water stable aggregates were measured. A pressure plate apparatus (Soilmoisture Equipment Corp., Santa Barbara, CA, USA) was used to determine water content at field capacity ( θ F ) and permanent wilting ( θ W ) at 100 and 15,000 hPa matric potentials, respectively [45].
The soil pH and electrical conductivity (EC) were measured in soil suspension at a 1:2.5 w/v ratio using pH (WTW-pH-523, WTW GmbH, Troistedt, Germany) and EC (Jenway 4510 conductivity meter, Stone, Staffordshire, UK) meters [46]. Total organic carbon (TOC) was determined according to the method of Nelson and Sommers [47]. The ammonium acetate (NH4 OAc) method was used to determine cation exchange capacity (CEC) according to the method of Sumner and Miller [48]. Calcium carbonate (CaCO3) was determined by the calcimeter method [49]. Major soluble cations (Ca2+, Mg2+, Na+, and K+) and anions (Cl, HCO3, and SO42–) were determined according to standard procedures [50]. Available phosphorus (Pa) and potassium (Ka) were determined by the Olsen and Dean [51] and McLean and Watson [52] methods, respectively.
Based on the measured physical and chemical soil properties, a total of 27 soil quality indicators were measured, which were grouped into two main categories: (1) physical indicators (BD, CI, CN, S, Q, stones, sand, silt, clay, DR, MWD, θ F , and θ W ) and (2) chemical indicators (pH, EC, TOC, CEC, CaCO3, Ca2+, Mg2+, Na+, K+, Cl, HCO3, SO42−, Pa, and Ka), (Table 1).

2.4. Determining Key Factors Affecting Soil Quality

Based on the measured physical and chemical characteristics of the soil, a multi-criteria evaluation approach was utilized to determine key physical and chemical soil properties affecting the quality of the soil. Several steps have been carried out to fulfill this objective. In the first step, a comprehensive total database (TDS) was created for both the surface and subsurface layers at each site. The compiled TDS included all measured and calculated soil properties (29 and 24 soil properties in the surface and sub-surface soil layers, respectively), which were used as soil indicators for the assessment of SQI. To assess the suitability of the compiled TDS for a multivariate analysis (i.e., PCA), the Kaiser–Meyer–Olkin (KMO) was carried out to determine the amount of variance that may be attributed to the variable’s nature in the generated TDS [53]. KMO values were measured separately for each soil indicator and as a combined average for all indicators (Table 2). For data in the collected database to be appropriate for the application of multivariate statistical analysis techniques, the average KMO value needs to be ≥0.5. Based on this analysis and the data presented in Table 2, the average KMO values in the three study sites ranged between 0.64–0.73 and 0.59–0.65 for the TDS collected from the surface and sub-surface soil layers, respectively, indicating high suitability for the collected data to undergo multivariate analysis using PCA techniques.

2.4.1. Establishment of the MDS Using PCA

The second step involved the application of PCA to narrow down the list of soil indicators and select just those with the highest relative importance and statistical independence (i.e., finding the main markers of soil indicators having the biggest impact on soil quality). PCA was carried out using the XLSTAT software (ver. 2024.1.1, LUMIVERO, LLC, Denver, CO, USA). PCA is a statistical technique that reshapes the aggregated data into a set of orthogonal dimensions, known as principal components (PC). PCs are often represented by the letters F1, F2, F3, …, etc., to indicate PC1, PC2, PC3, …, etc. The first component (F1) represents the largest amount of variance in the collected data, followed by the second component (F2), and so forth [54]. Within each PC, soil indicators with the largest factor loadings (i.e., within 10% of maximum factor loadings) were selected as the indicators having a significant effect on soil quality in the study sites. Following the completion of the analysis, soil indicators with the highest relative relevance were identified using the subsequent criteria: (1) the total number of PCs and the associated indicators must account for at least ≥ 70% of the total variation in TDS; (2) PCs with eigenvalues ≥1; (3) each selected PC must represent ≥ 5% of total variations; and (4) if one PC contained more than one indicator, only one indicator from strongly correlated pairings is chosen (Pearson’s correlation coefficient > 0.5) [55]. Based on the above selection criteria, an MDS was generated that includes the least number of uncorrelated physical and chemical soil indicators that are most relevant for the assessment of soil quality in the study sites. Results of the principal component analysis of soil quality in the surface and sub-surface layers of the study sites are presented in Tables S1–S6 in the Supplementary Materials.

2.4.2. Assigning Weight Factors Using AHP

AHP analysis was carried out to assign a weight factor for each soil indicator in the MDS. Pair-wise comparison between all selected indicators was assessed and was identified as a value between 1 and 9. A value of 1 is assigned if the indicators in a pair-wise comparison are determined to be equally important. In contrast, the value of 9 indicates that the first indicator is extremely more important than the second indicator in the pair-wise comparison. In case the first indicator is extremely less important than the second indicator in the pair-wise comparison, the reciprocal of 9 (i.e., 1/9) is assigned [28]. A reciprocal square matrix A = [ajk] is then generated with all values assigned for the pair-wise comparisons. Each entry ajk of matrix A represents the importance of the jth relative to the kth soil indicators. Entries in matrix A must satisfy the following condition:
a j k · a k j = 1 F o r   j   a n d   k = 1 ,   2 ,     n
where n is the number of soil indicators. The weight factors of each soil indicator are then determined by solving the matrix to determine the normalized principal eigenvectors of the matrix [56]. To ensure unbiased selection during the process of pair-wise comparison, the consistency ratio (CR) of the generated A matrix was calculated as:
C R = C I R I
where CI is the consistency index and RI is a random inconsistency index determined based on Saaty [57]. The consistency index (CI) was calculated according to the equation:
C I = ( λ m a x m ) ( m 1 )
where λ m a x is the largest eigenvalue of the A matrix. According to Saaty [28], CR ≤ 0.1 indicates reasonable consistency and acceptable factor weights.

2.4.3. Standard Scoring Functions (SFF)

The standard scoring functions (SSF) approach was utilized to determine a specific scoring value (scores ranging from zero to one) for each soil indicator selected in the MDS. These scores reflect the relative importance of each soil indicator in the assessment of soil quality. This approach is particularly effective since the different indicators have variable parameter units [58]. Selected soil indicators were linked to soil quality based on their low and high values (see values of the SQF in Table 1). For soil indicators where high values are advantageous for enhancing soil quality (i.e., more is better (MB), Table 1), the following mathematical equations were used to calculate the scoring weights for each soil indicator:
f x = 0.1       x L 1 0.9 × x L U L + 0.1 L x U 1       x L
As for soil indicators where low values are advantageous for enhancing soil quality (i.e., less is better (LB), Table 1), the following mathematical equations were used to calculate the scoring weights for each soil indicator:
f x = 0.1       x L 0.9 × x L U L + 0.1 L x U 1       x L
where (L) and (U) in Equations (3) and (4) denote the minimum and the maximum limits for the selected soil indicators, respectively, and x reflects the measured or calculated value of the selected soil indicator.

2.4.4. Soil Quality Index (SQI)

The normalized scoring values obtained for each observation by linear transformation of each soil indicator were multiplied by the weighting factors obtained from the AHP analysis. A soil indicator scoring based on the selected key physical and chemical soil indicators was used to determine the soil quality index (SQI) using a weighted linear average of the calculated scores for all soil indicators according to the following equation [59]:
S Q I = i = 1 n W i × S i
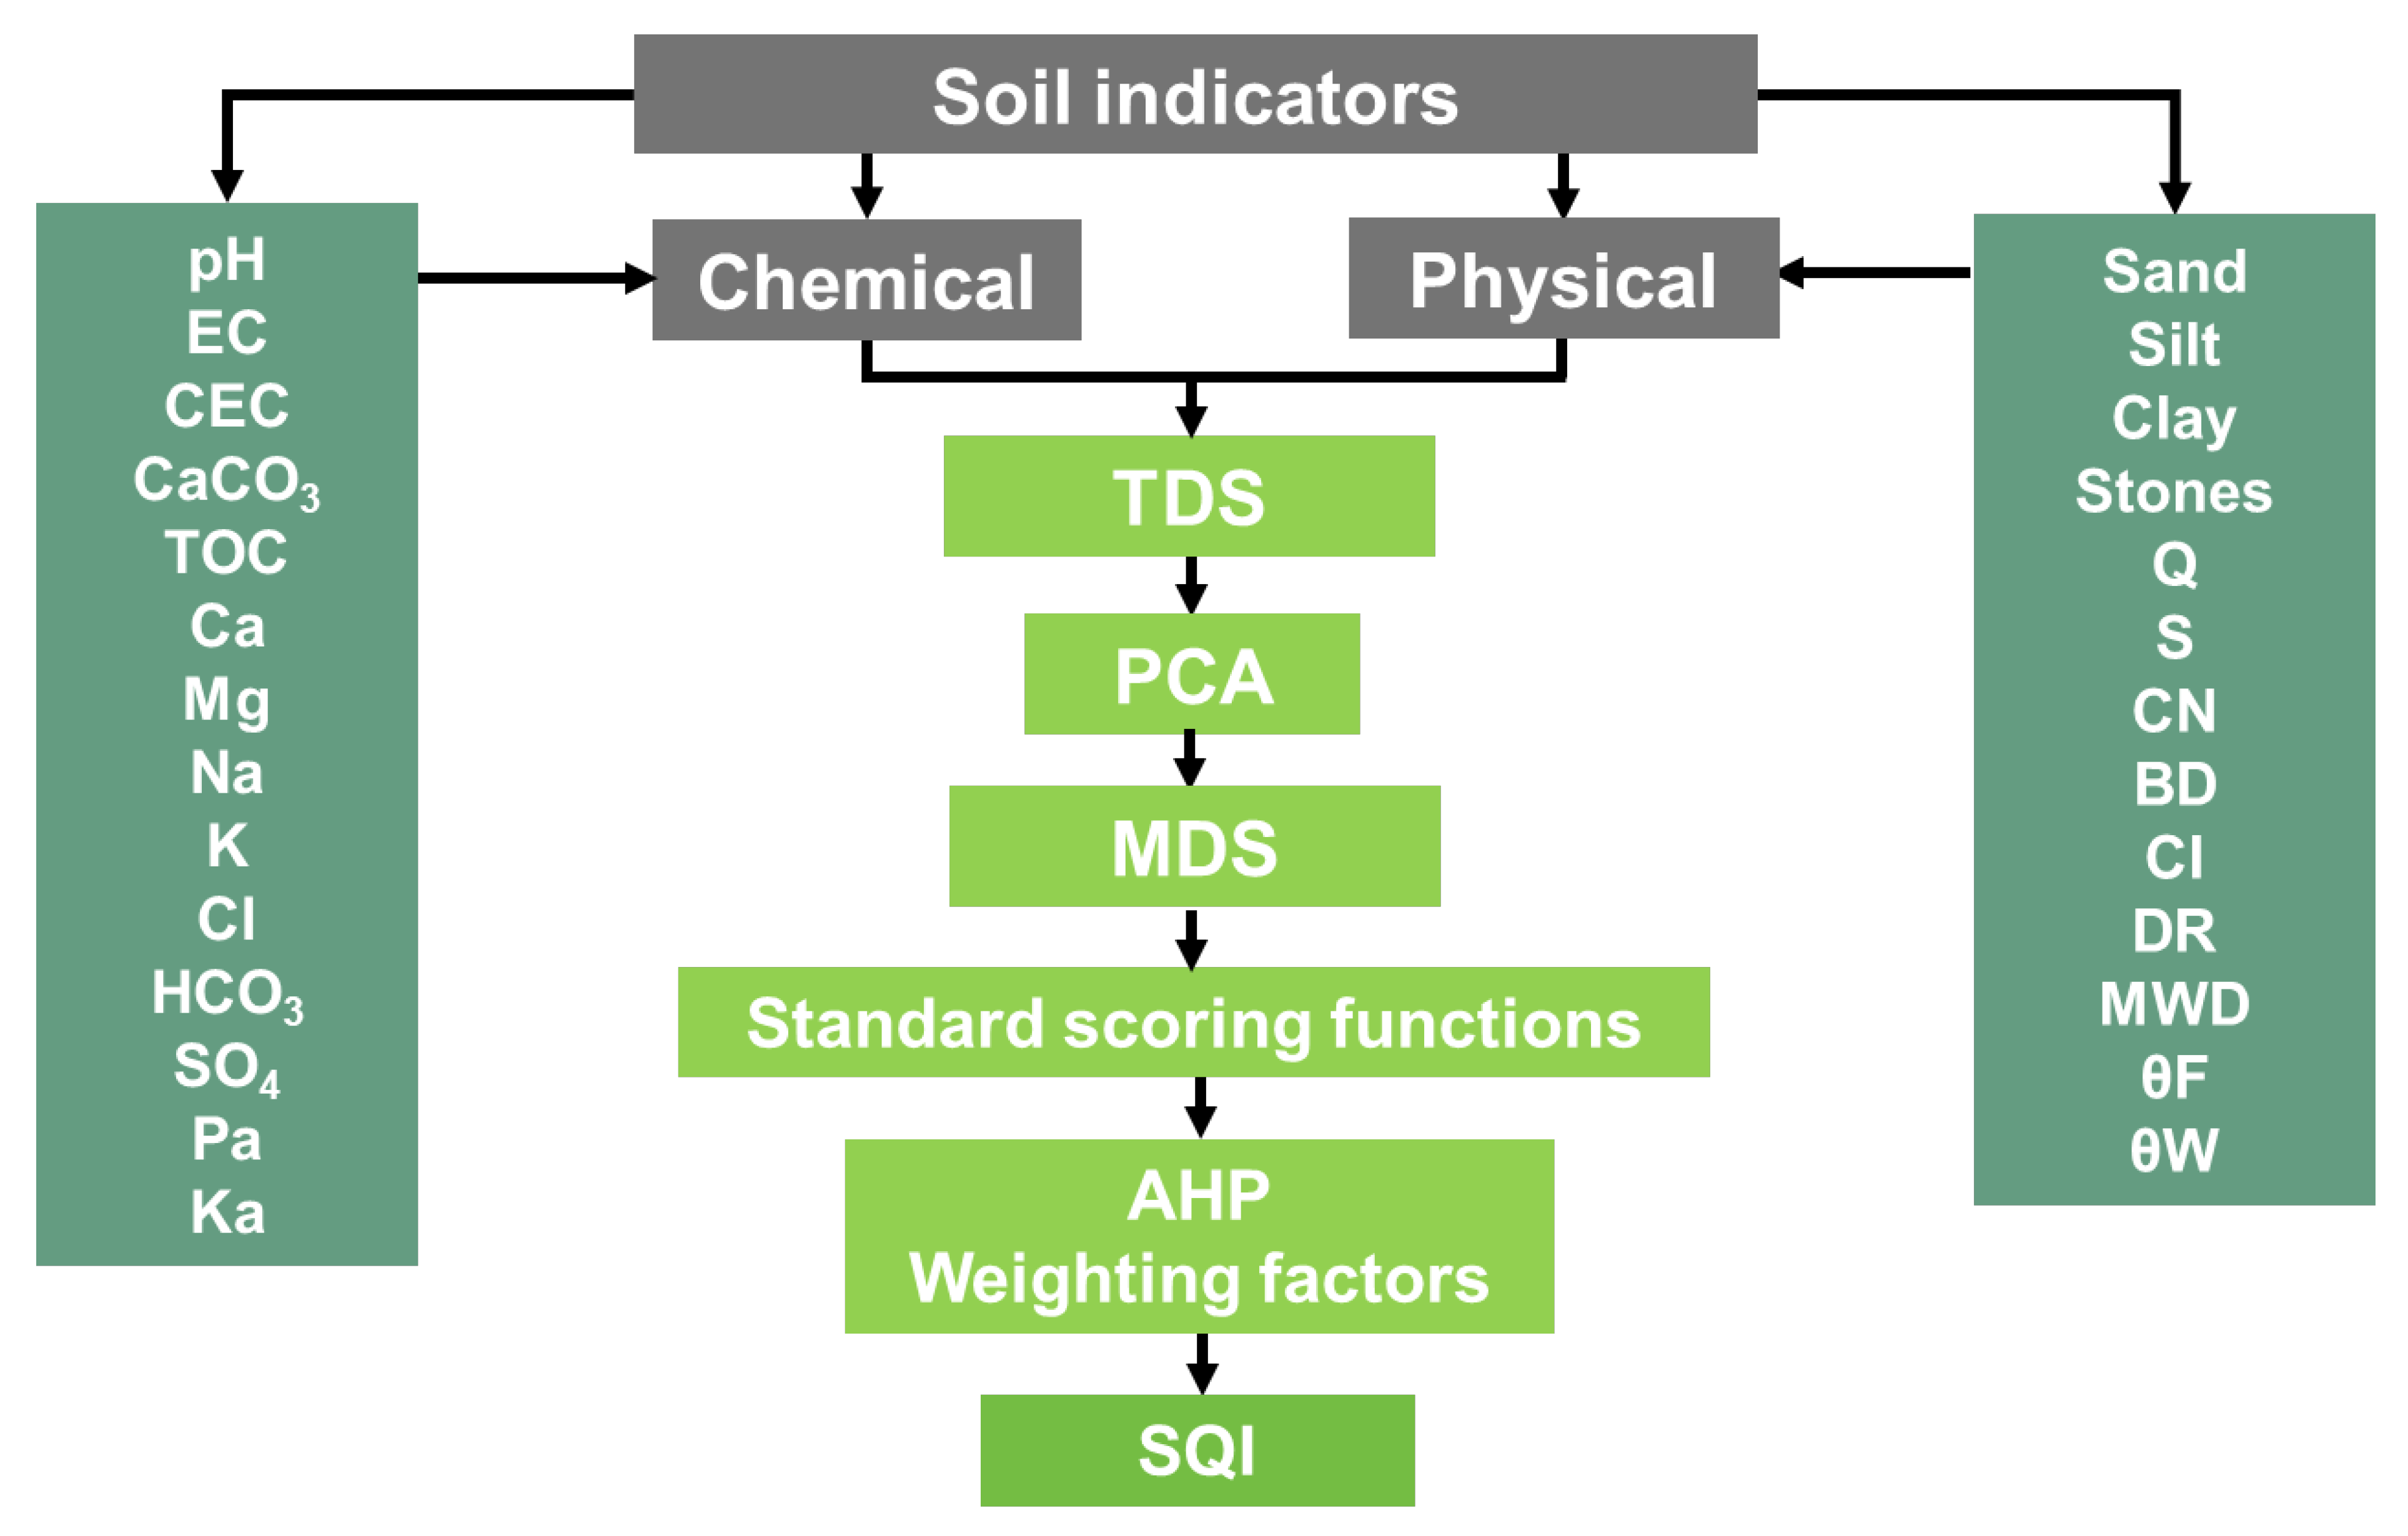
where W i is the relative scoring weight for each indicator i, S i is the measured or calculated value for the ith soil indicator, and n is the number of all soil indicators included in the calculation. For both surface and sub-surface soil layers, values of the SQI were divided into five groups, corresponding to different levels of soil quality (i.e., 0.10–0.30, very low; 0.31–0.40, low; 0.41–0.5, moderate; 0.51–0.60, high; 0.61–0.80, very high). A flow chart representing the different steps that were carried out to determine the SQI is presented in Figure 3.

2.5. Spatial Interpolation of Soil Quality Index (SQI)

Based on the selected physical and chemical soil indicators in the MDS and the calculated SQI, an overall soil quality index for each sampling location was then calculated. Geographic Information System (GIS) software (version 10.8) was used to evaluate the spatial distribution of SQI maps. A variety of interpolation models were implemented inside ArcGIS 10.8 to generate the spatial distribution maps of SQI based on results from the MDS. These models included the inverse distance weighing (IDW), the global polynomial interpolation (GPI), the local polynomial interpolation (LPI), the radial basis function (RBF), simple Kriging (SK), ordinary Kriging (OK), and universal Kriging (UK). For the Kriging methodology, three variogram models were used: Gaussian, spherical, and exponential variograms. The accuracy of the prediction was evaluated using two statistical indices, the root mean square error (RMSE) and the standardized mean difference (SMD), according to the following equations:
R M S E = i = 1 n ( Z i Z i ) 2 n
S M D = M e a n Z i M e a n Z i s t d v p
where Z i and Z i are the predicted and observed values, respectively, s t d v p is a pooled standard deviation, and n is the number of observations. A smaller RMSE and an SMD close to zero indicate better accuracy for the interpolation process.

3. Results and Discussion

3.1. Assessment of Soil Properties Across the Study Sites

Understanding the physical and chemical features of the soil is crucial since they impact agricultural output, water retention, and overall soil quality. Descriptive statistics (minimum, maximum, mean, and standard deviation) of all soil indicators in the TDSs of surface and sub-surface soil layers in the three study sites (Al-Fahyhyl, Al-Sahwa, and Al-Tamryate) are presented in Table 3 and Table 4, respectively. Significant differences were found when comparing the soil indicators of the three locations. These variances have an immediate impact on agricultural productivity and land management techniques.

3.1.1. Al-Fahyhy Site

Soil particle analysis at Al-Fahyhyl revealed that the dominant soil textures were sandy loam, loamy sand, and sandy clay loam. Mean percentages of sand, silt, and clay were 62.36, 24.07, and 13.56, and 63.50, 23.97, and 12.51% for the surface and sub-surface layers, respectively. Al-Fahyhyl soils showed the largest EC and CaCO3 values compared to other study sites. Mean EC values were 2.31 and 3.27 dSm−1 in the surface and sub-surface layers, respectively, indicating moderate salinity, which may have an adverse impact on plant development. CaCO3 content reached 97% in several locations, with a mean value of 56% in both the surface and sub-surface layers. Zhang et al. [3] have pointed out that high amounts of calcium carbonate may indicate conditions that restrict the availability of essential nutrients for plant growth, particularly under alkaline pH conditions similar to the conditions in Al-Fahyhyl (mean pH is 7.95).
Al-Fahyhyl soil also showed the lowest TOC as compared to the other study sites. The mean TOC was as low as 0.1 and 0.09% in the surface and sub-surface layers, respectively. These results are consistent with earlier studies. According to Yao et al. [60], soils with larger TOC concentrations maintain balanced nutrient release levels and a stable carbon cycle [61]. On the other hand, soils with low TOC indicate decreased nutrient cycling and microbial activity, leading to lower soil quality and an increase in the risk of degradation in soil properties [62].

3.1.2. Al-Sahwa Site

Similar to the soil in Al-Fahyhyl, the dominant soil textures in Al-Sahwa were sandy loam, loamy sand, and sandy clay loam. However, the mean percentage of sand (72.45 and 70.14% in the surface and sub-surface layers, respectively) was greatly larger than that found in other sites. Moreover, Al-Sahwa soils showed the largest percentage of stones and BD with mean values of 41.7% and 1.63 g cm−3, respectively. The increased sand content and decreased clay content imply that Al-Sahwa soils may drain more quickly, leading to less water retention, which could affect their appropriateness for plants that depend on steady moisture availability, particularly at earlier growth stages [5]. Our results confirm these findings, as indicated by the much lower water content at field capacity (θF) in Al-Sahwa soils compared to other sites. The mean (θF) in Al-Sahwa soils was 0.145 g g−1, which resulted in an average available water content (AWC) of 0.106 g g−1. In comparison, average AWC in Al-Fahyhyl and Al-Tamryate sites were 0.122 and 0.151 g g−1, which shows that soils in Al-Sahwa have much less ability to retain water. The mean weight diameter (MWD) was also much less in Al-Shawa soils and showed a mean value of 0.009 mm, whereas in Al-Fahyhyl and Al-Tamryate soils, the mean values of MWD were 0.082 and 0.083 mm, respectively. Because of the increased sand and lower MWD, soil in Al-Sahwa will be more susceptible to wind erosion risks, which necessitates the implementation of protective management practices to sustain soil and plant growth in the region [6].
Analysis of the selected soil indicators in Al-Sahwa revealed that vast areas in the region are subject to deterioration in soil quality based on the assessment of the physical soil indicators. In contrast, the assessment of the chemical soil indicators provided much more enhanced conditions for soil quality in Al-Sahwa. Al-Sahwa soils showed the largest CEC and TOC compared to the values of these indicators in Al-Fahyhyl and Al-Tamryate sites. The mean CECs and TOCs in both the surface and sub-surface layers of Al-Sahwa, Al-Fahyhyl, and Al-Tamryate were 9.02 cmol+ kg−1 and 0.44%; 5.37 cmol+ kg−1, and 0.09%; and 6.55 cmol+ kg−1 and 0.36%, respectively. Increased CEC and TOC in Al-Sahwa soil will lead to an increase in water retention and nutrient retention ability. This suggests that the region has superior chemical properties compared to other sites, which promotes soil fertility and enhances soil quality over the long term [20,25]. Al-Sahwa soil also showed larger available phosphorus (Pa) present in the surface (2.92 mg kg−1) and sub-surface (3.08 mg kg−1) layers. The average Pa in both surface and sub-surface layers reached 3.0 mg kg−1 in Al-Sahwa, whereas it only reached 1.12 and 1.31 mg kg−1 in the Al-Fahyhyl and Al-Tamryate soils, respectively. Despite these values of Pa remaining in the low category for available phosphorus in the soil, larger values in Al-Sahwa soil will contribute to better root development and plant energy transfer, leading to enhanced plant growth [63]. Average available potassium (Ka) in Al-Sahwa (87.5 mg kg−1) was the only exception, as it was slightly less than that in Al-Tamryate soil, which showed the largest Ka (109.1 mg kg−1) among all the study sites. Other chemical indicators (EC, pH, and soluble ions) in Al-Sahwa soil were comparable to the values present in other study sites (Table 3 and Table 4).

3.1.3. Al-Tamryate Site

Al-Tamryate soil showed the largest clay content in comparison to the other study sites, with mean values of 18.23 and 19.26% in the surface and sub-surface layers, respectively. Therefore, dominant soil textures in Al-Tamryate were sandy loam and sandy clay loam, followed by loamy sand soil texture. Other physical indicators in Al-Tamryate soil (stones, BD, DR, and θF) showed moderate levels between those of Al-Fahyhyl and Al-Sahwa sites, indicating that, in terms of the physical soil indicators, the soil quality in Al-Tamryate will be slightly better than that of Al-Fahyhyl and Al-Sahwa sites. Surface runoff (Q) was the only exception, as it was slightly larger in the Al-Tamryate soil (20.27 mm) in comparison to that in Al-Fahyhyl (15.46 mm) and Al-Sahwa (14.36 mm) sites. Al-Tamryate soil also showed acceptable levels of CEC, TOC, EC, pH, and soluble ions, comparable to the same levels observed in the Al-Sahwa site, and again much better than those found in the Al-Fahyhyl site. In particular, the average available potassium (Ka) in Al-Tamryate showed a much higher concentration compared to Ka in the Al-Fahyhyl and Al-Sahwa sites. Mean ka in the surface and sub-surface layers in Al-Tamryate was 109.2 mg kg−1, whereas it reached only 57.5 and 87.5 mg kg−1 in Al-Fahyhyl and Al-Sahwa sites, respectively. Enhancement of soil quality over the long term requires a proper balance between the physical and chemical indicators, along with climatic and management factors [11]. Based on the measured soil properties in Al-Tamryate, a reasonable balance between the different physical and chemical indicators was found, which positively impacts soil quality by providing better conditions to enhance water retention, nutrient availability, and soil fertility.

3.2. Principal Component Analysis (PCA) and the Establishment of MDS

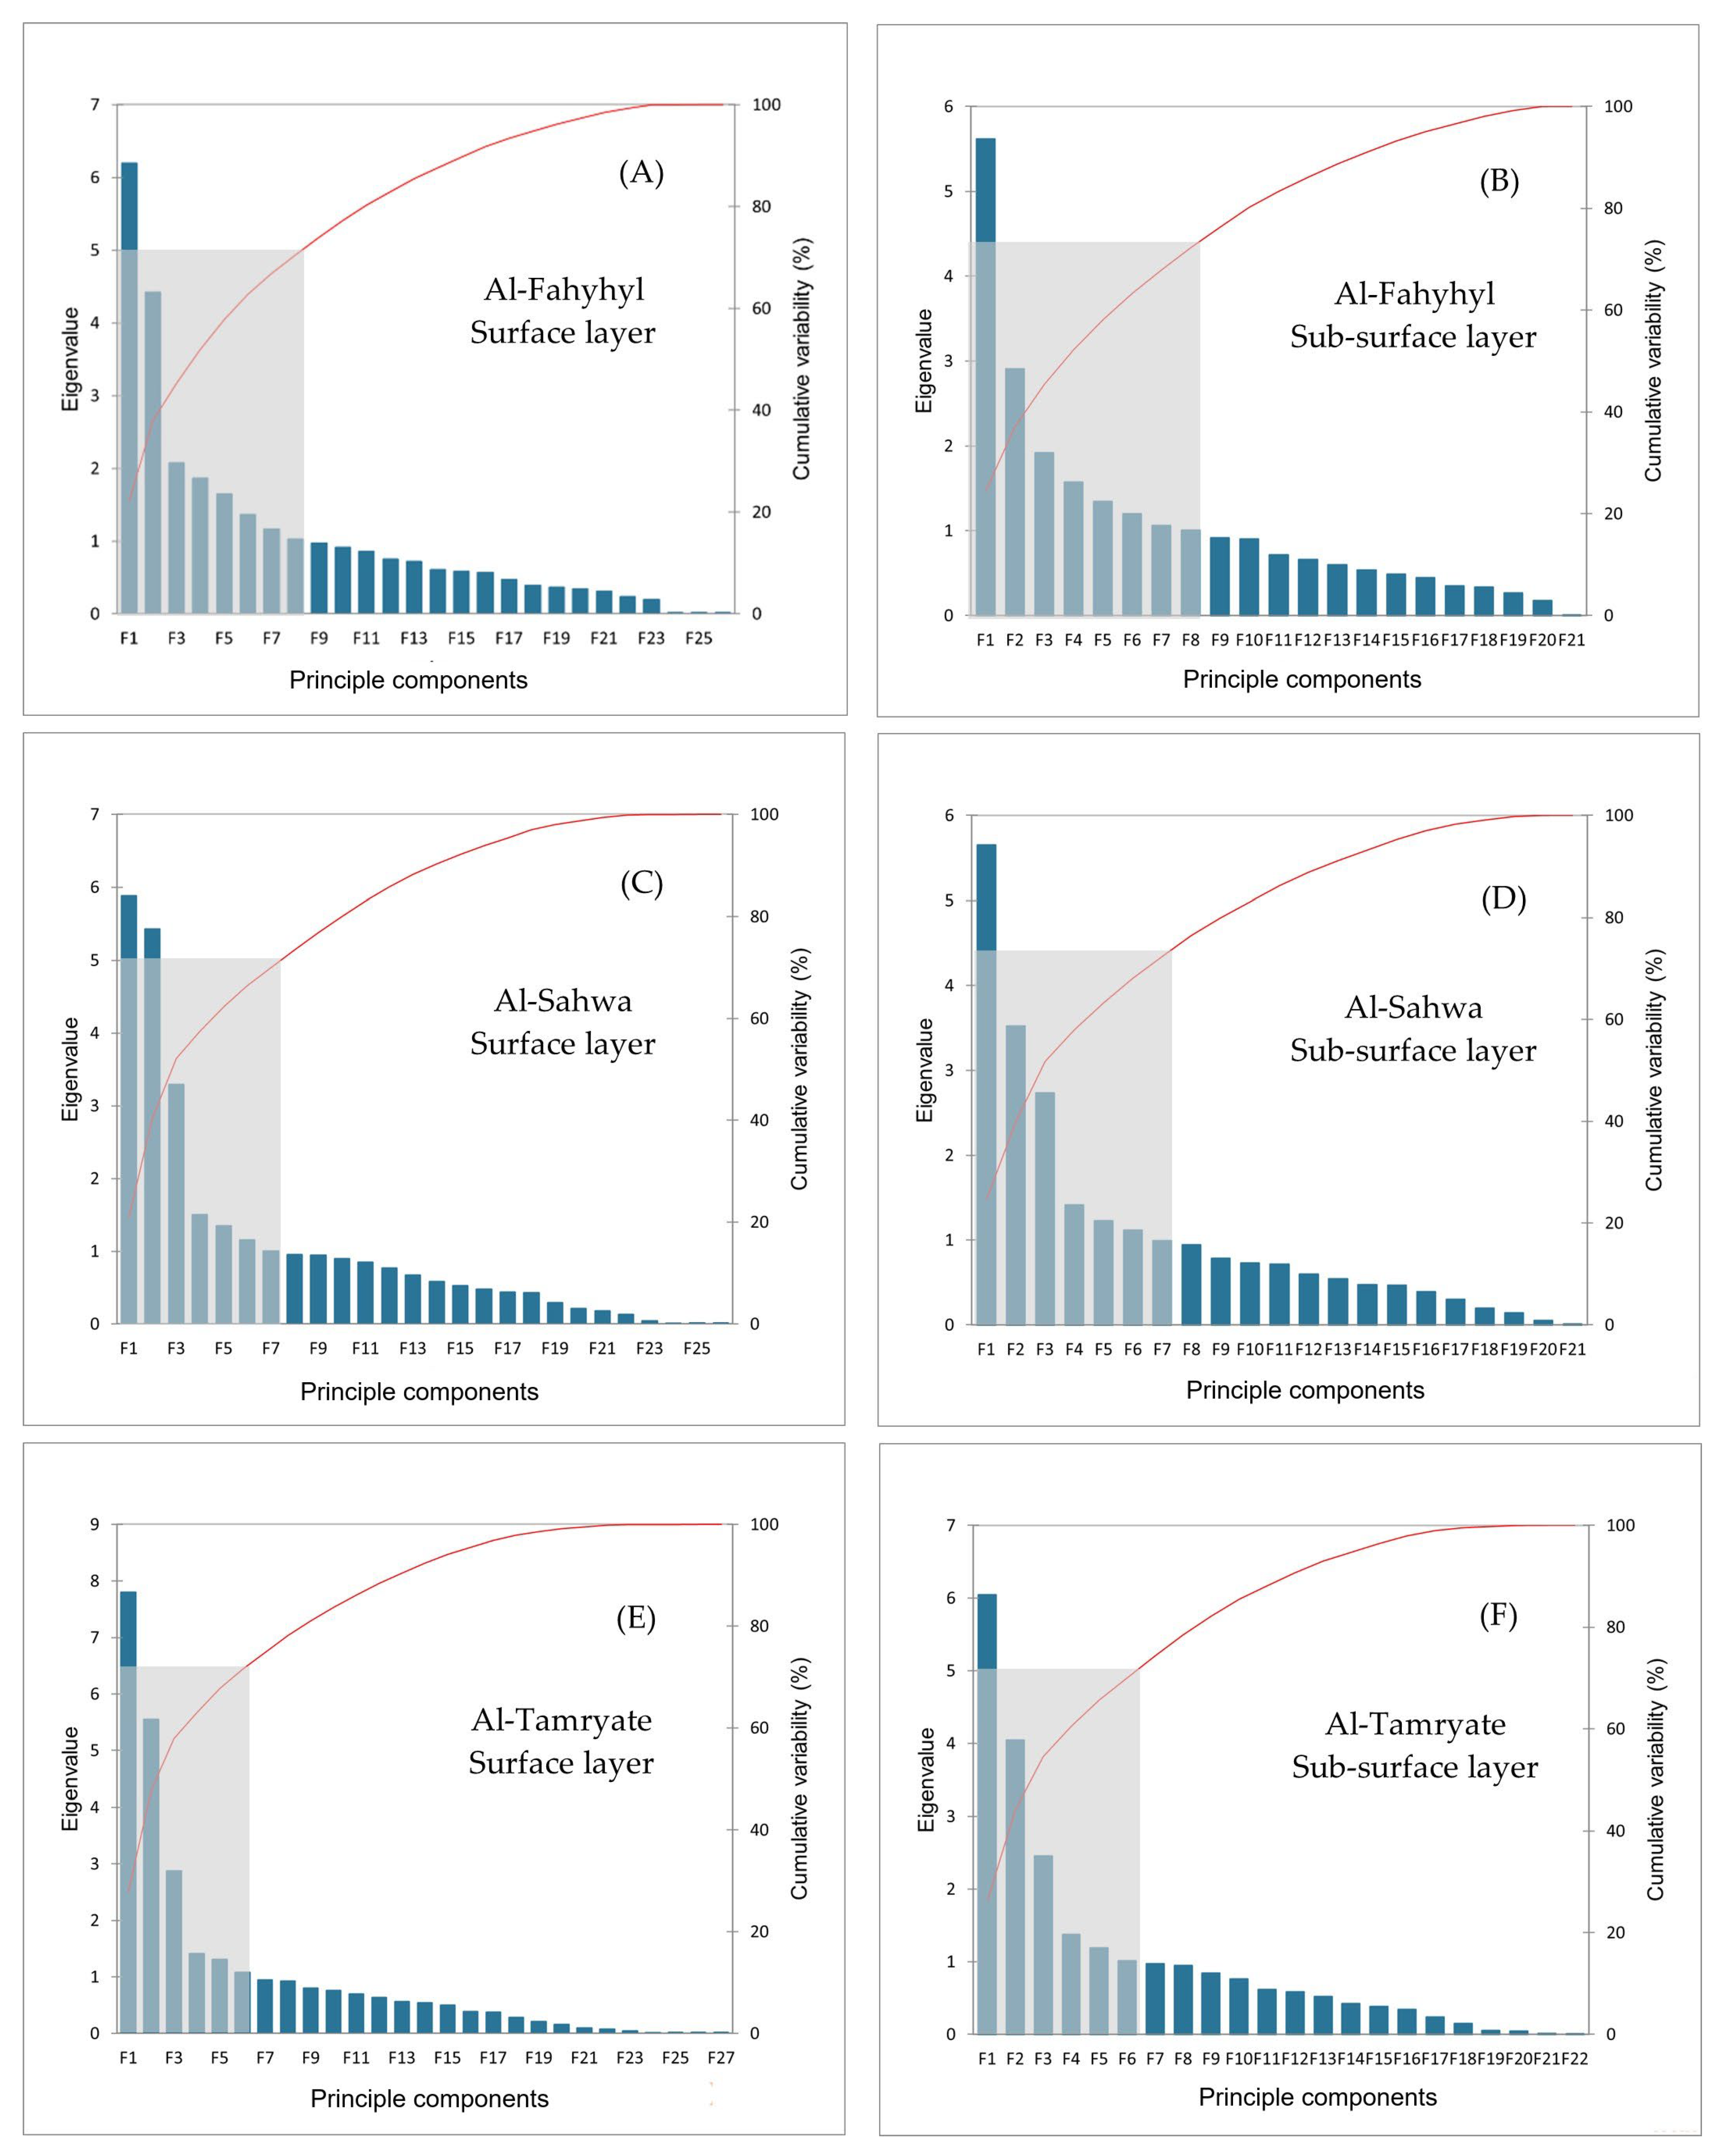
Selected physical and chemical soil indicators were combined to establish the TDS for the surface and sub-surface layers of each study site. Principal component analysis (PCA) was carried out to determine the eigenvalues, proportions of variance, and cumulative variance of each PC and the associated soil indicators. The MDS was generated by the selection of the most important PCs based on the defined criteria. Selection of the PCs in each MDS ensured that only PCs with eigenvalues ≥ 1 were selected to establish the MDS. The number of PCs to be included to establish the MDS was determined based on the minimum number of PCs that represent ≥70% of the variability in the TDS. PCA revealed distinct variance distributions, guiding the focus on key soil characteristics for each region. Figure 4 illustrates the principal components, eigenvalues, and variances for the different PCs, as measured in the surface and sub-surface layers of Al-Fahyhyl, Al-Sahwa, and Al-Tamryate sites.

3.2.1. Al-Fahahil Site

The MDS established for Al-Fahyhyl included eight PCs in both the surface and subsurface soil layers, representing 70.50 and 72.25% of the total variability, respectively (Figure 4A,B). The first two PCs (F1 and F2) account for 22.11 and 15.79%, and 24.43 and 12.65% of total variability in the surface and sub-surface layers, respectively. Thus, the establishment of the MDS in the surface and sub-surface layers of Al-Fahyhyl was based on soil indicators with the largest scores in PCs from F1 to F8. PCs from F9 to F29 in the surface layer and from F9 to F24 in the sub-surface layers make up a small portion of the total variability. Therefore, in order to streamline focus on the soil indicators with large relative impacts, components beyond F9 for the surface and sub-surface layers were removed from the next steps in the analysis, as they have a negligible effect on the factors affecting soil quality in the study area. This implies that a smaller selection of soil characteristics that predominate soil variability best describes soil quality in Al-Fahahil soils, increasing the accuracy of soil management interventions [5].
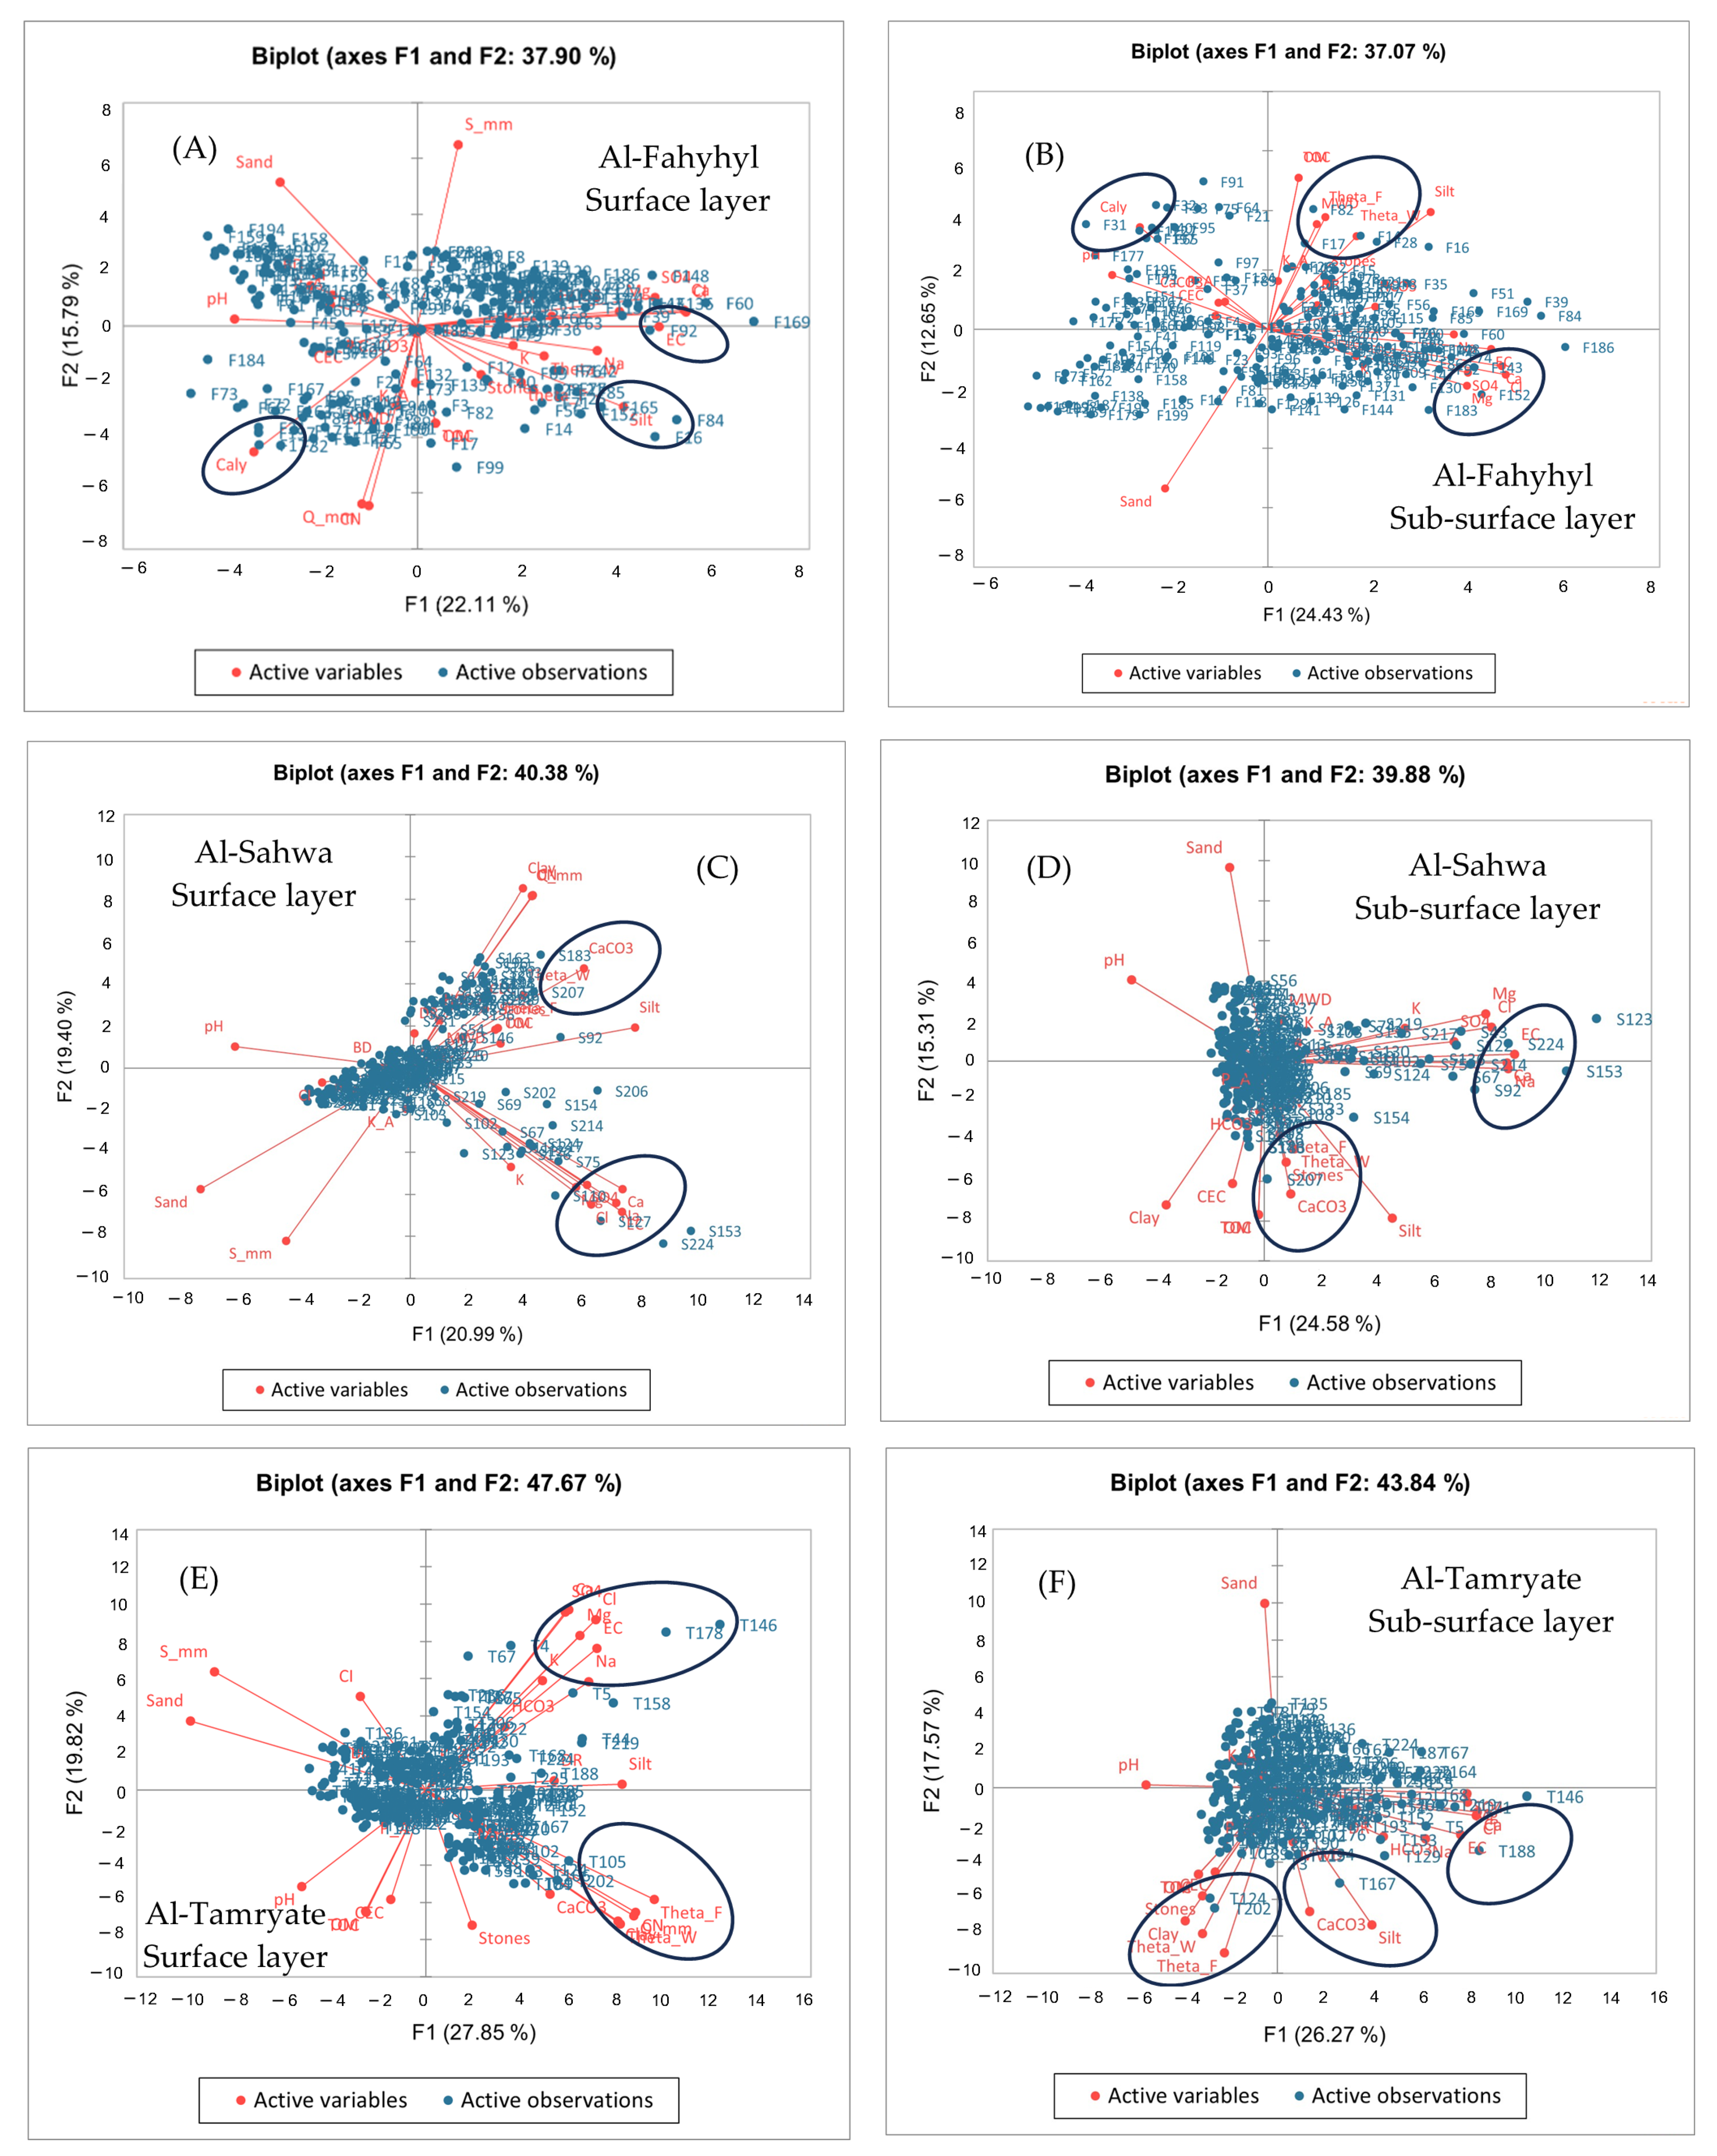
Principal components F1 and F2 represent the largest amount of variability (37.9 and 37.1% in the surface and sub-surface layers, respectively) associated with soil indicators in Al-Fahyhyl. Therefore, F1 and F2 are critical for elucidating the variation in soil qualities throughout the Al-Fahyhyl site, emphasizing the major elements in each location. Figure 4 shows a biplot of the first (F1) and the second (F2) principal components and the distribution of scores of samples and loadings of variable soil indicators measured in the surface and sub-surface layers in the study sites. The correlation of F1 and F2 in the surface layer of Al-Fahyhyl site showed that F1 was connected to 10 soil indicators (i.e., silt, θF, pH, EC, Ca2+, Mg2+, Na+, Cl, HCO3, and SO42−), while the second component (F2) was connected to 5 soil indicators (i.e., sand, clay, CN, S, and Q) (Figure 5A,B). These results show that silt, EC, and soluble ions have a significant impact on soil quality, especially at particular sites like site number F92 (EC = 9.6 dSm−1) in Al-Fahyhyl. Similarly, clay plays a significant role at site number F177 (clay = 27%) (Figure 5A).
Similar trends were seen in the sub-surface layer, where F1 is associated with nine (i.e., silt, clay, pH, EC, Ca2+, Mg2+, Na+, Cl, and SO42−) and F2 with four soil indicators (i.e., sand, MWD, θF, and TOC). The analysis of the distribution of soil indicators between F1 and F2 illustrated their correlation with soil properties in the subsurface layer and sampling sites in the Al-Fahyhyl site, revealing, for example, the strong influence of EC and soluble ions in explaining variances at sites F143 and F152, as well as the significant impact of clay at sites F95 and F122. On the other hand, θF and MWD played a notable role in explaining variances at site F82 and nearby locations (Figure 5B).
To reduce the number of soil indicators in the MDS to the minimum number of most important and uncorrelated indicators, Pearson correlation coefficients were calculated for all soil indicators included in the TDS, identifying those with correlation coefficients ≥ 0.5. To streamline the process of obtaining accurate and easily estimable soil quality index values, one indicator was excluded from any pair of indicators with a correlation coefficient ≥ 0.5, prioritizing the exclusion of the indicator that was more challenging to estimate. This process facilitates the obtaining of soil quality indicators that are characterized by accuracy and ease of estimation [21]. The elimination process, based on the values of the Pearson coefficients, indicated that 10 soil indicators have a substantial impact on the assessment of soil quality in the surface layer of the Al-Fahyhyl site area: sand, clay, DR, CI, CaCO3, CEC, TOC, K+, Pa, and Ka. In the sub-surface soil in Al-Fahyhyl, 11 soil indicators (sand, clay, DR, pH, CaCO3, CEC, TOC, K+, HCO3, Pa, and Ka) met the selection criteria and were most important in the assessment of soil quality in the soil layer below 30 cm. As noted by Rinot et al. [6], at this stage of the analysis, it is crucial to remember that the previous order of ranking of the selected soil indicators does not reflect a descending order of importance or that one of these indicators is more significant than the others. Because each indicator’s relative influence might change based on particular soil management and other climatic and environmental aspects, it is crucial to assess the relative importance of the different soil indicators by determining their relative weight factors using techniques like AHP, as will be detailed in the next section [57].
Equations (6) and (7) were used to calculate the standard scoring functions (SSF) for each soil indicator selected in the MDS. Based on the type of SQF listed in Table 1, Equation (6) was applied for all soil indicators having a “more better” SQF, whereas Equation (7) was applied for soil indicators having a “less better” SQF. A scoring value (between zero and one) was calculated for each soil indicator at each sampling location in the surface and sub-surface layers of the study sites.

3.2.2. Al-Sahwa Site

The MDS established for Al-Sahwa included seven PCs in both the surface and subsurface soil layers, representing 70.02 and 72.40% of the total variability, respectively (Figure 4C,D). The first two components (F1 and F2) account for 20.9 and 19.4% of the variance in surface layers and 24.5 and 15.3% in subsurface layers, respectively. PCs from F8 to F29 were all designated by eigenvalues <1 and were eliminated from further analysis. Cumulative variability represented by F1 and F2 in Al-Sahwa reached 40.38 and 39.88% for the surface and sub-surface layers, respectively, which was slightly larger than that observed in Al-Fahyhyl site. Based on the biplot of F1 and F2 in the surface layer of Al-Sahwa, F1 and F2 were connected with 11 (sand, silt, θW, CaCO3, pH, EC, Ca2+, Mg2+, Na+, Cl, and SO42−) and 5 (clay, CN, S, Q, and K+) soil indicators, respectively (Figure 5C). In the sub-surface layer, F1 and F2 were connected to 12 soil indicators (F1: pH, EC, Ca2+, Mg2+, Na+, K+, Cl, and SO42−; F2: sand, silt, clay, and CaCO3) (Figure 5D). PCA also revealed that F3 in the Al-Sahwa site contributed a substantial amount of variability (11.76 and 11.88% in the surface and sub-surface layers, respectively), and was connected to MWD, stones, CEC, TOC, and Pa soil indicators. Correlations between F1 and F2 in the surface and sub-surface layers in Al-Sahwa shed light on the impact of certain soil indicators on soil quality at specific locations in the Al-Sahwa site. For example, a notable impact of soluble ions (Ca2+, Mg2+, Na+, Cl, and SO42−) was observed in the surface layer at sites S110 and S127, while sites S183 and S207 were more impacted by CaCO3 and θW (Figure 5C). Within the sub-surface layer, the same pattern was observed, with sites like S214 and S92 highly impacted by soluble ions and sites like S207 highly impacted by CaCO3 and θW (Figure 4D).
The elimination process based on the values of the Pearson coefficients among all soil indicators indicated that 10 soil indicators have a substantial impact on the assessment of soil quality in both the surface (sand, BD, DR, CI, MWD, pH, Mg+, HCO3, Pa, and Ka) and sub-surface (sand, stones, DR, MWD, θF, pH, Mg+, HCO3, Pa, and Ka) layers of the Al-Sahwa site. Scoring values were calculated, using Equations (6) and (7), for all the soil indicators included in the MDS of the surface and sub-surface layers in the Al-Sahwa site.

3.2.3. Al-Tamryate Site

In Al-Tamryate, only 6 PCs were selected to establish the MDSs in both the surface and subsurface soil layers, representing 71.51 and 70.10% of the total variability, respectively (Figure 4E,F). Other PCs from F7 to F29 had eigenvalues <1 and were eliminated from further analysis. The first two components (F1 and F2) account for 27.9 and 19.8% of the variance in surface layers and 26.3 and 17.6% in subsurface layers, respectively. The cumulative variability, represented by F1 and F2, in Al-Tamryate reached 47.67 and 43.84% for the surface and sub-surface layers, respectively, which were much larger than the total variability presented by F1 and F2 in Al-Fahyhyl and Al-Sahwa sites. Biplot charts of F1 and F2 in the surface layer of Al-Tamryate showed that F1 and F2 were connected with 13 (sand, silt, clay, CN, S, Q, DR, θF, θW, CaCO3, pH, EC, and Na+) and 6 (stones, Ca2+, Mg2+, Na+, Cl, and SO42−) soil indicators, respectively (Figure 5E,F). As for the sub-surface layer, F1 and F2 were connected to 15 soil indicators (F1: pH, EC, Ca2+, Mg2+, Na+, Cl, HCO3, and SO42−; F2: sand, silt, clay, stones, θF, θW, and CaCO3). Similar to the Al-Sahwa site, F3 in the Al-Tamryate site contributed a substantial amount of variability (10.26 and 10.69% in the surface and sub-surface layers, respectively) and was connected to the CI, CEC, TOC, and Pa soil indicators. The fact that F1 and F2 represent that large portion of total variability in Al-Tamryate soil implies that, in comparison to the other sites, Al-Tamriyat soils vary more with important soil indicators like sand, DR, and TOC. Thus, optimizing soil quality would require a more balanced approach to soil management that takes into account proper practices to enhance TOC content and reduce potential risk or soil erosion [3].
Biplots of F1 versus F2 in the surface and sub-surface layers in Al-Tamryate pointed to the impact of certain soil indicators on soil quality at specific locations in the Al-Tamryate site. For example, in the surface layer, a notable impact of soluble ions (Ca2+, Mg2+, Na+, Cl, and SO42−) was observed at sites T4 and S178, while sites T105 and S202 were more impacted by clay, Q, θF, and θW (Figure 5E). Within the sub-surface layer, sites like T188 were highly impacted by EC, Cl, and Ca2+, site T167 was highly impacted by silt and CaCO3, and sites T124 and T202 were impacted by stones, clay, θF, and θW (Figure 5F). The elimination process based on the values of the Pearson coefficients among all soil indicators resulted in an overall seven and eight soil indicators that were found to have a stronger relative impact on the evaluation of soil quality at the surface (sand, BD, MWD, pH, TOC, Pa, and Ka) and sub-surface (sand, DR, MWD, pH, TOC, Na+, Pa, and Ka) layers in the Al-Tamryate site. These results indicate that many elements (soil indicators) should be taken into account when assessing soil quality because differences in these attributes can have a big impact on sustainability initiatives and soil management strategies [4].
The PCA of soil indicators included in the TDS in Al-Fahyhyl, Al-Sahwa, and Al-Tamryate sites highlights how intricately soil characteristics interact to determine the quality of the soil. The qualities that have been identified encompass physical and chemical aspects, suggesting that a thorough comprehension of these elements is necessary for efficient soil management [24]. Due to variations in soil properties in the study sites, the established MDS for each soil layer contained different soil indicators. In total, 17 and 16 soil indicators were included in the established MDS from all study sites in the surface and sub-surface layers, respectively (a total of six MDSs were established, three for each of the surface and sub-surface layers). Nevertheless, several soil indicators were repeatedly included in the established MDSs. For example, sand, Pa, and Ka were included in all six MDSs, indicating their greater impact on soil quality in the study sites. Similarly, DR and pH were included in five out of the six established MDSs, whereas MWD and TOC were included in four out of the six established MDSs. Other soil indicators were included ≤3 times in the six established MDSs. Improved soil quality and plant productivity can be achieved by integrated soil management practices that are customized to the enhancement of these unique features, showing greater impact on soil quality [3].
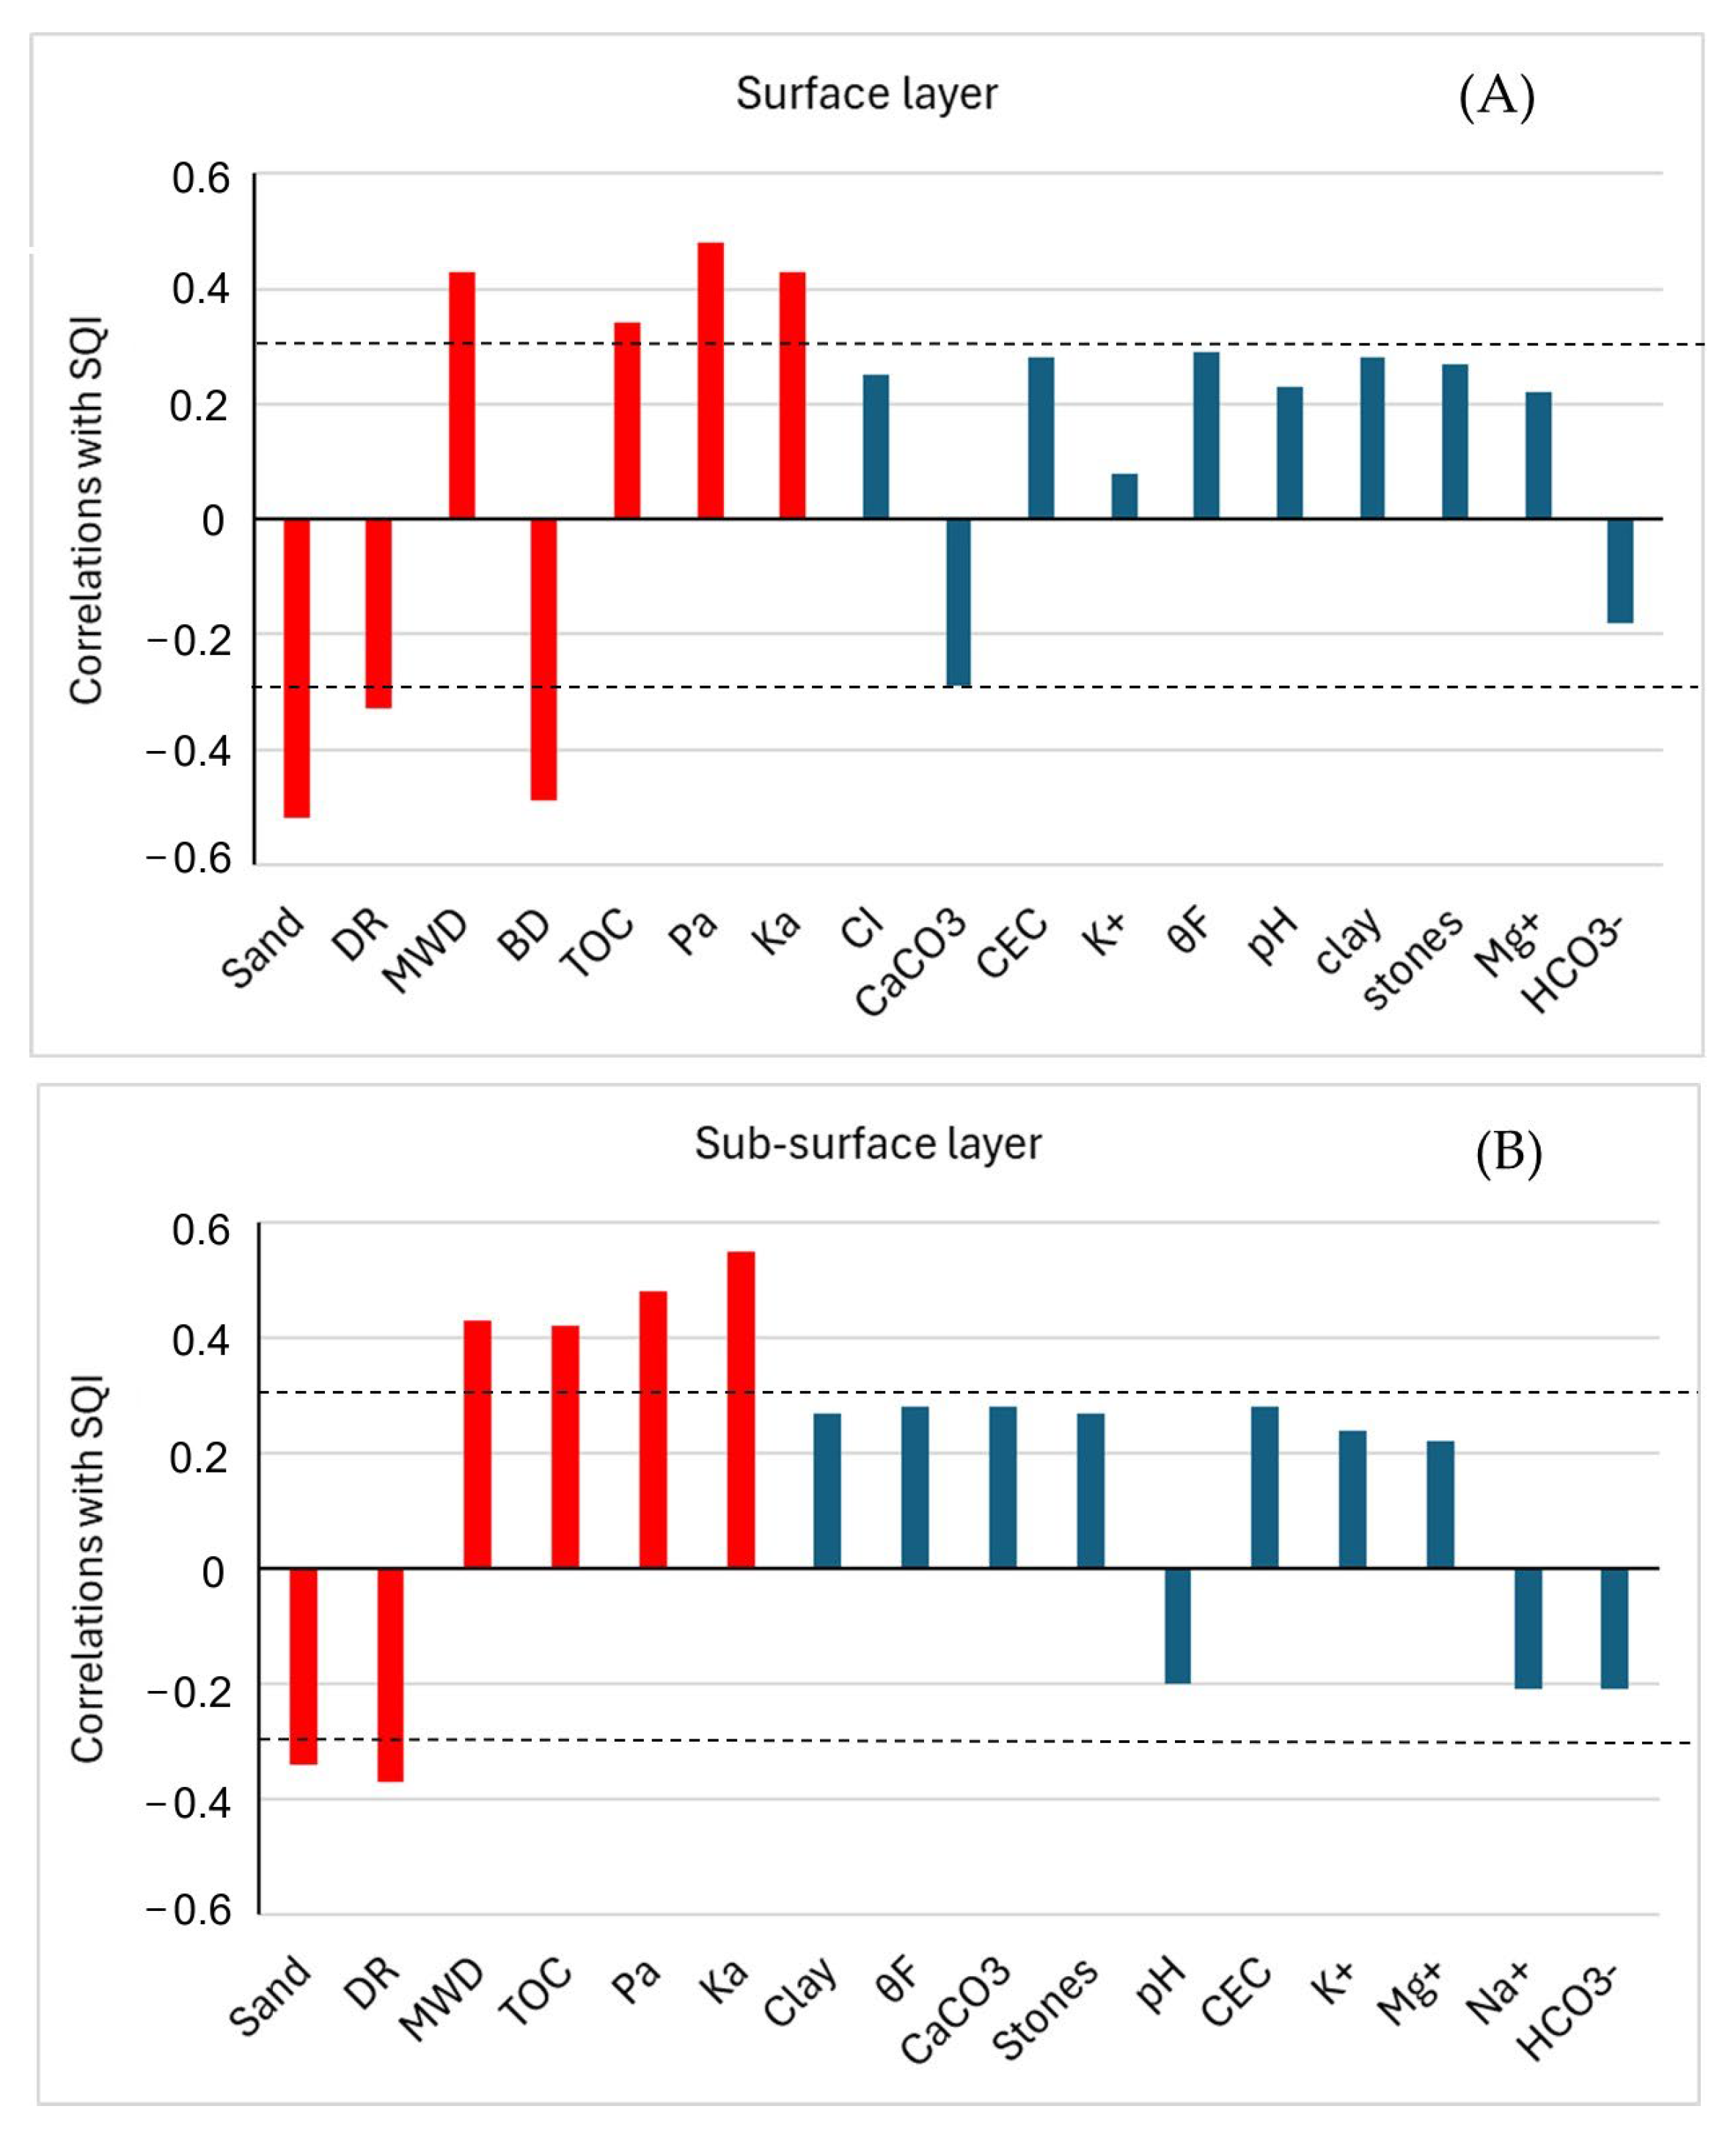
We assessed the correlation between soil indicators and SQI, as established by the MDS in the surface and sub-surface layers of the study sites. Correlations were carried out separately for soil indicators in the MDSs of the surface and sub-surface layers (three MDSs for each layer). A threshold value of ≥0.3 was assigned to determine the soil indicators with higher correlations with SQI. In addition, for any indicator to be selected, it must be included in at least two out of the three MDSs for each layer. Results showed that seven and six soil indicators met the selection criteria in the surface (sand, DR, MWD, BD, TOC, Pa, and Ka) and sub-surface (sand, DR, MWD, TOC, Pa, and Ka) layers, respectively (Figure 6A,B).

3.3. AHP and the Calculation of Weight Factors

Unbiased selection of weight factors for each of the soil indicators in the MDS is crucial to ensure accurate assessment of the SQI. We used the AHP approach along with expert opinions to assign accurate weight factors for the selected soil indicators. A pairwise comparison matrix was generated based on the relative importance of the soil indicators. Table 5 represents seven soil indicators used to formulate the pairwise comparison matrix in the surface layer of the study sites. The consistency ratio was 0.047, which is much lower than the threshold value of 0.1, indicating that the values assigned for the pairwise comparison were randomly generated and that the calculated weight factors are acceptable [57]. For the sub-surface soil layer in the study sites, the generated pairwise comparison matrix contained six soil indicators (Table 6) and had a consistency ratio of 0.054, indicating that the calculated weight factors are acceptable to use.
In both the surface and sub-surface soil layers, sand had the largest weight factor (0.4514 and 0.4835 in the surface and sub-surface soil layers, respectively). This result is consistent with previous research of Karaca et al. [64], who assessed the quality of pasture soil in a semi-arid ecosystem and found that physical soil indicators (e.g., sand, aggregate stability, and DR) would contribute the highest weight factor (0.396), followed by chemical (0.324) and biological (0.151) indicators. In rangeland soil, the sand percentage would highly determine erosion risks, leading to loss of soil fertility and the lack of ability of the soil to retain water and sustain plant growth. Similar findings were also reported by Turan et al. [65], who indicated that, in rangelands, particularly where overgrazing is a major contributor to land degradation, coarse-texture soils (i.e., more sand percentage) would adversely impact soil quality due to decreased water holding capacity and nutrient retention, leading to deteriorated plant development and increased erodibility risks.
Total organic carbon (TOC) had the highest weight factor among all chemical soil indicators and came overall as the second-highest important indicator with weight factors of 0.2441 and 0.2512 for the surface and sub-surface soil layers, respectively. Despite the general low content of TOC in arid lands similar to the study sites, TOC plays an important role in supporting plant growth through the enhancement of nutrient retention, soil structure, and water holding capacity. TOC also contributes significantly to reducing erosion risks in rangelands and, as such, is considered a significant soil indicator in the assessment of soil quality for both land productivity and environmental sustainability [66]. According to research by Sánchez-Cañete et al. [67], unsustainable land management decreases TOC and carbon cycling, whereas sustainable management practices in rangelands encourage increased microbial activity and soil resilience. All other soil indicators included in the MDS (i.e., DR, MWD, BD, Pa, and Ka) for both the surface and sub-surface layers had weight factors ≤ 0.1. However, they remain important factors in determining soil quality in the study sites, compared to other soil indicators included in the TDS.

3.4. Assessment of SQI

The linear transformation functions presented in Equations (6) and (7) were applied to calculate the normalized scoring values for the physical and chemical soil indicators in both the TDS and the MDS in the surface and sub-surface layers of the study sites. For the MDS, calculated scores were multiplied by the weighted factor obtained from the AHP analysis to determine the SQI values. To calculate an overall value for SQI, the scores of all included soil indicators were combined using a weighted linear average equation (Equation (8)). The calculation of SQI was carried out based on the measured physical and chemical soil indicators for each sampling location in the surface and sub-surface soil layers in the study sites.
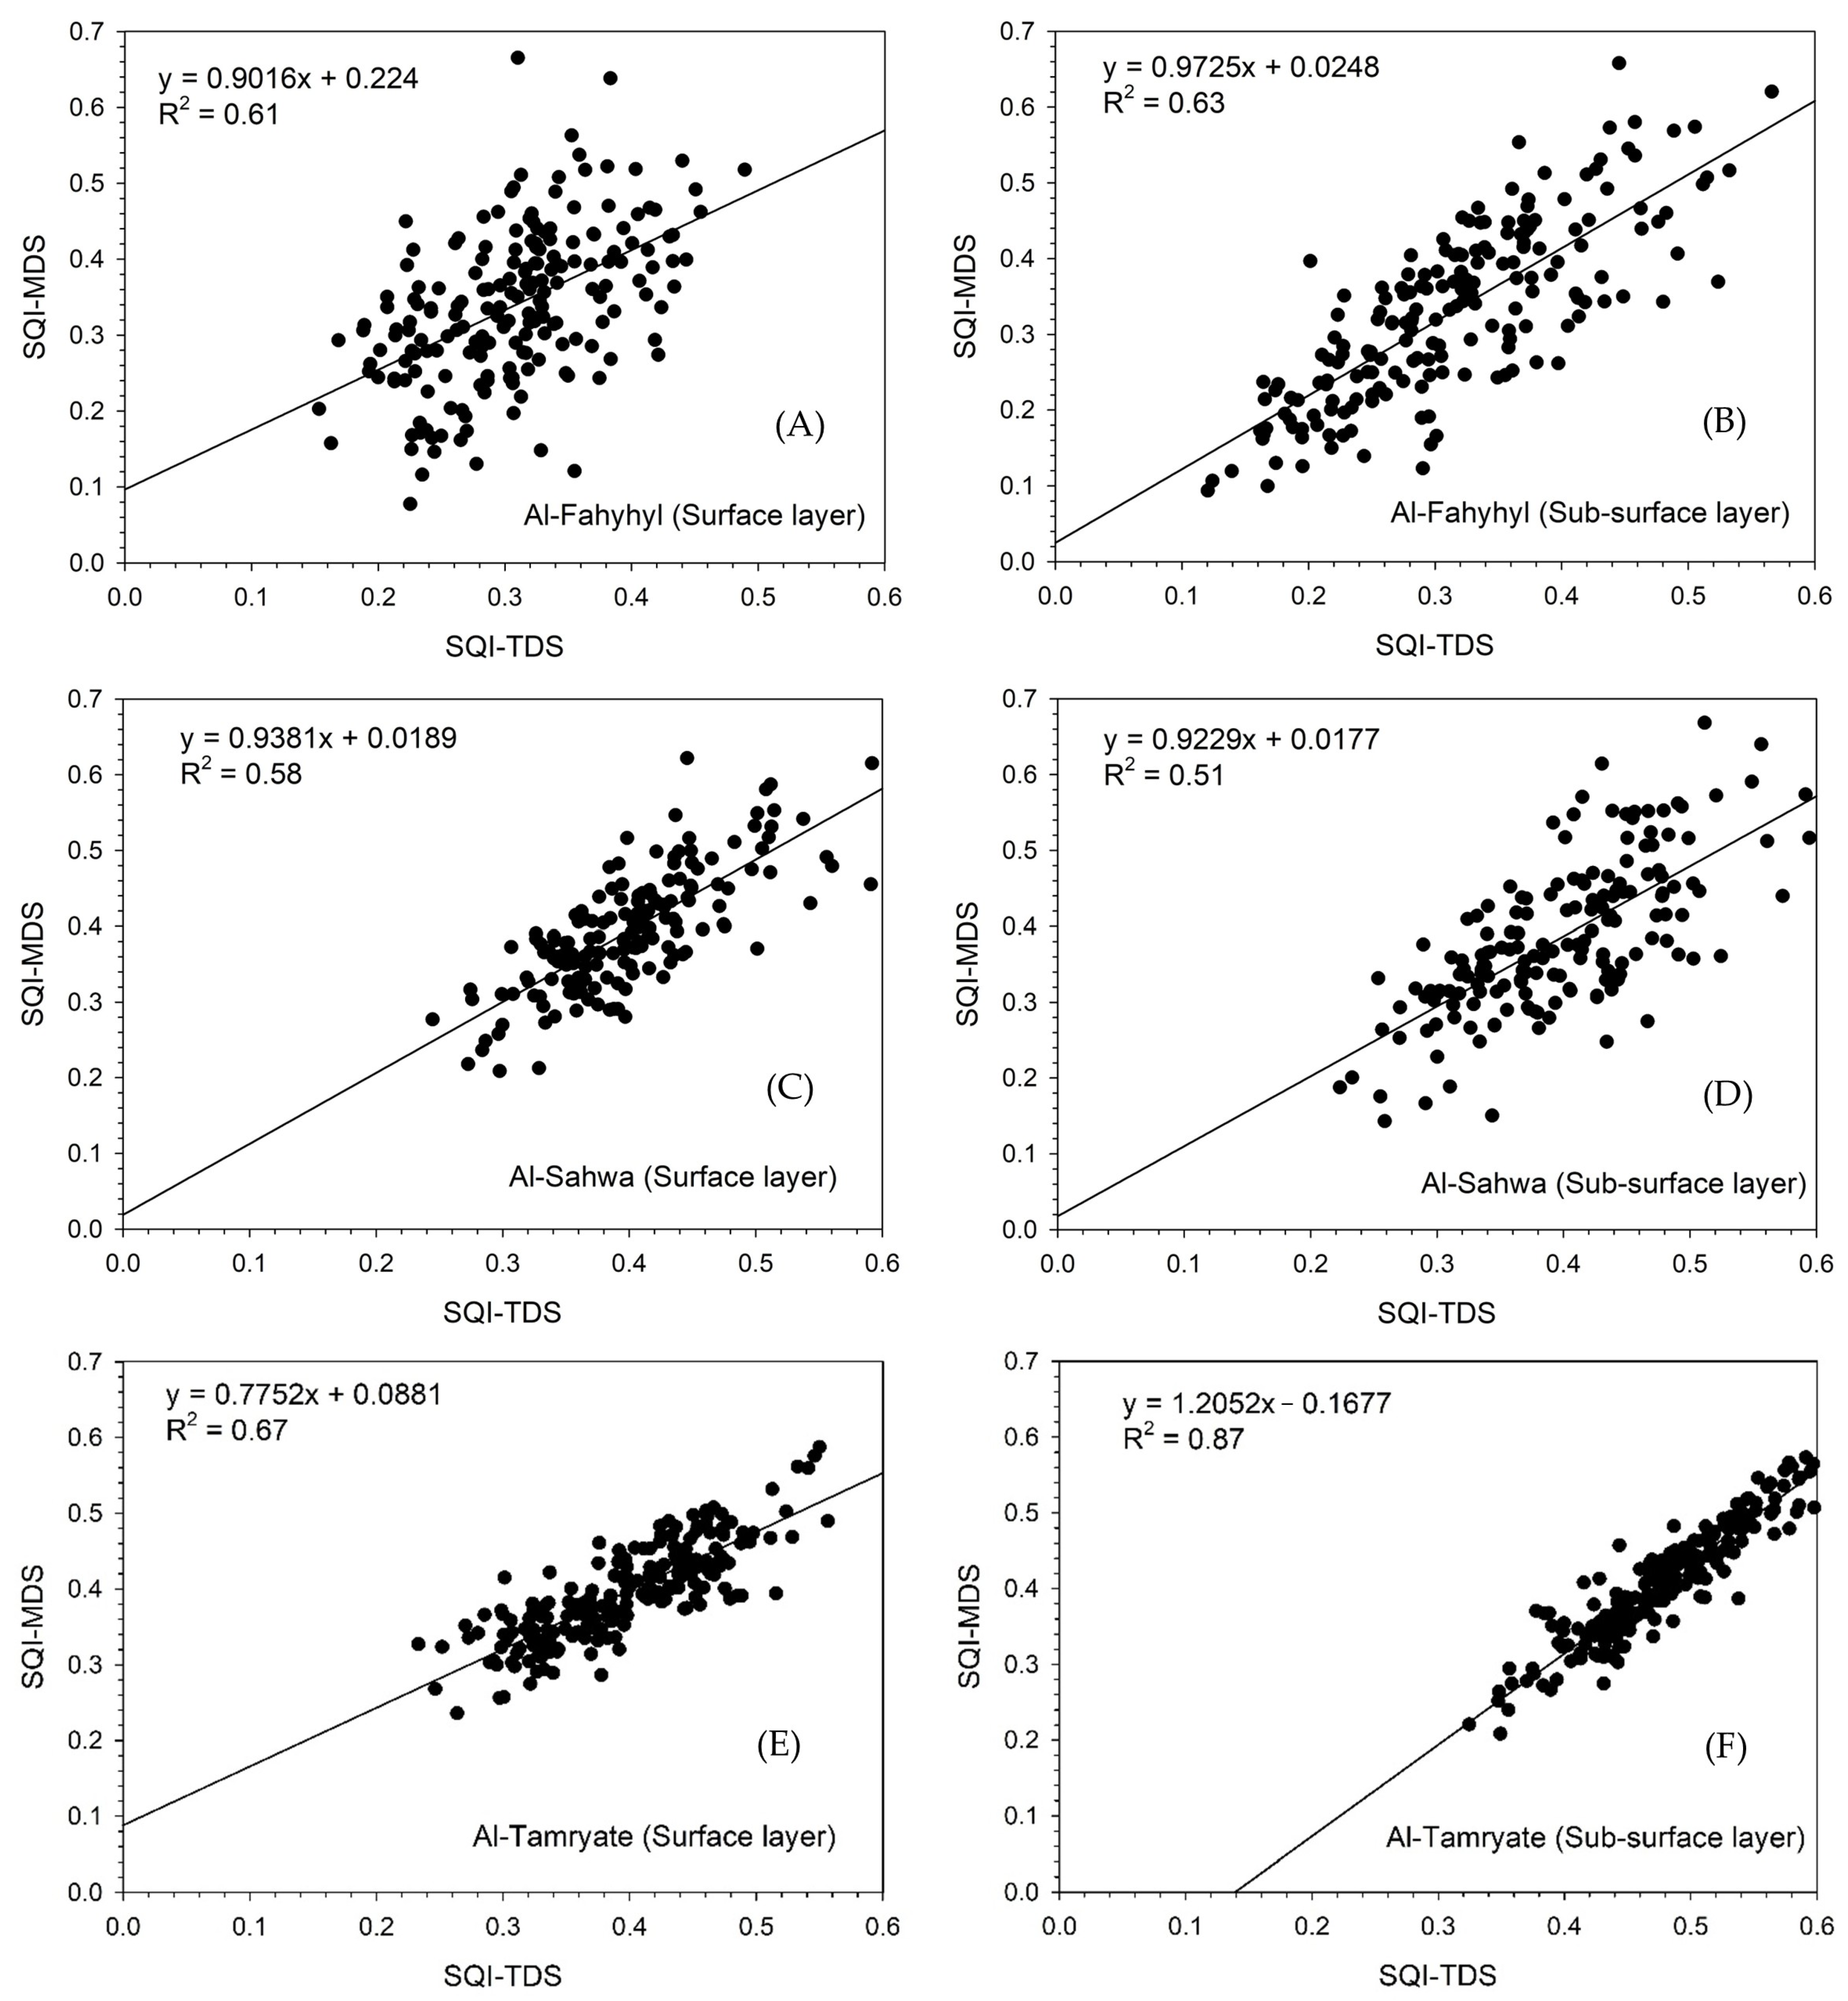
To assess the accuracy of the MDS to represent the total variability observed in the TDS, the relationship between SQI as determined by the TDS (SQI-TDS) and by the MDS (SQI-MDS) was evaluated based on simple linear regression. Figure 7 describes the form of the linear regression equations between SQI-TDS and SQI-MDS in the surface and sub-surface layers of the study sites. The results indicate good agreement between SQI-TDS and SQI-MDS, with R2 values of 0.61 and 0.63; 0.58 and 0.51; 0.67 and 0.87, for the surface and sub-surface layers in the Al-Fahyhyl, Al-Sahwa, and Al-Tamryate sites, respectively. Based on these results, it can be concluded that SQI-MDS well-represents the variability within the TDS and that it can be used with confidence to assess the quality of the soil in the surface and sub-surface layers of the study sites. Eliminating the number of soil indicators required to assess soil quality from 29 in the TDS to only 7 in the MDS (6 in the case of the sub-surface layer), while maintaining the same level of accuracy in the assessment, will greatly help to save time and effort and reduce the cost for obtaining an accurate evaluation of soil quality in the study sites. A similar conclusion was reported by Liu et al. [68], who assessed soil quality under different microtopography using a TDS that contained 18 physical and chemical soil indicators. They generated an MDS that included only 5 indicators out of the 18 included in the TDS. However, it accurately represented 74.8% of the total variability found in the TDS. They concluded that soil quality assessment using MDS simplifies the process by concentrating on a smaller number of the most important soil indicators, which makes the assessment of soil quality less costly and more time-efficient.

3.5. Interpolation and Spatial Distribution of SQI

The SQI-MDS values were geo-referenced inside ArcGIS to their corresponding sampling locations in the surface and sub-surface layers of the study sites. The SQI-MSD values were then grouped into five general groups that describe the level of soil quality (i.e., very low, low, moderate, high, and very high) within the ArcGIS application. The patterns of distribution for the SQI-MDS in the surface and sub-surface layers of the study sites were examined by analyzing the statistical characteristics of SQI-MDS histograms (Table 7).
In the surface layer of the Al-Fahyhyl site, SQI-MDS had a mean value of 0.307 and a standard deviation of 0.066. A slightly positive skewness (0.145) was observed, suggesting a distribution with a tiny tail to the right. The distribution of the SQI-MDS was almost normal, with a slight flat nature, as indicated by a kurtosis value of 2.563. A slightly larger mean SQI-MDS (0.348) was observed in the sub-surface layer of Al-Fahyhyl. The distribution also showed a moderate positive skewness (0.40719), implying a larger right tail, and a close-to-normal distribution (kurtosis = 2.8791), a mean SQI of 0.34868, and a standard deviation of 0.061897. Both the surface and subsurface soils of Al-Fahyhyl exhibit a little positive skewness, with the sub-surface soil exhibiting a more significant skewness and a higher mean. The surface layer in Al-Sahwa had a mean SQI-MDS of 0.399 and a much larger kurtosis (3.419), indicating a more peaked distribution. The distribution had a longer tail, as evident by a moderate right skewness (0.449). In subsurface soil, the mean SQI-MDS was 0.399. The skewness was 0.294 (slightly skewed to the right), and the kurtosis was 2.9736 (very close to normal). The surface soil in Al-Sahwa has the highest skewness and kurtosis, indicating a more peaked and concentrated SQI distribution around the mean, particularly in the surface layer. The distribution of the sub-surface soil was somewhat normal. The SQI-MDS in Al-Tamryate had the largest mean among all study sites, particularly in the sub-surface soil (0.479). The surface soil had a mean of 0.396, a skewness of −0.002073 (near zero, indicating a nearly symmetrical distribution), and a kurtosis of 2.4918 (suggesting a flatter distribution). In the sub-surface soil, a slightly positive skewness and kurtosis of 3.0149 were observed, suggesting some variance with a slight rightward tail.
A total of 13 interpolation methods, with variable variogram models, were implemented inside ArcGIS 10.8 to establish the best predictive interpolation model to generate the spatial distribution of the SQI-MDS in the surface and sub-surface layers of the study sites. The accuracy of the different models to predict values of SQI in unsampled locations was tested using two statistical parameters, namely the RMSE and the SMD (Table 8).
In the Al-Fahyhyl site, the IDW showed RMSEs of 0.06569 and 0.06361 for the surface and sub-surface layers, respectively. These small values indicate reasonable performance for IDW in this region, with minimal prediction errors for both layers. Similarly, both RBF and LPI performed well in the prediction of SQI in the Al-Fahyhyl site, with the RMSE close to that observed with the IDW interpolation. GPI has the highest RMSE values across all models, with surface RMSEs of 0.22369 and 0.22403 for the surface and sub-surface layers, respectively. This indicates that the GPI is not suitable for interpolating SQI in Al-Fahyhyl due to its poor fit. All the kriging models had RMSE close to 1.0, indicating that these models may be overfitting or not suitable to predict SQI in the Al-Fahyhyl site.
In Al-Sahwa, IDW provided surface RMSEs of 0.06465 and 0.07493 for the surface and sub-surface layers, respectively, indicating good performance, though not as precise in the sub-surface layer as in Al-Fahyhyl. GPI again performed poorly, with RMSE values around 0.07796, showing that it is not an effective method for this region. RBF performed better than IDW, with RMSE values of 0.06590 (surface) and 0.07490 (subsurface), making it one of the better-performing models in this region. LPI provided the lowest surface RMSE of 0.06187, suggesting it is the best for surface layer interpolation in Al-Sahwa, though it has a slightly higher RMSE for subsurface (0.07434). Kriging models showed very high RMSE values close to 1.0, making it less suitable for this area.
In the Al-Tamryate site, IDW showed reasonable performance, with RMSEs of 0.06387 and 0.05953 for the surface and sub-surface layers, respectively, indicating a low prediction error for this area. GPI provided slightly larger RMSE values, showing poor accuracy for both surface (0.06533) and subsurface (0.05941) interpolation. RBF offered a slightly better RMSE (0.06320) for the surface and a slightly lower RMSE (0.05988) for the sub-surface compared to IDW. LPI had a slightly higher RMSE for surface soil (0.06539) but offered competitive performance for the subsurface layer (0.05890). Kriging models again showed very high RMSE values, close to 1.0, which suggests poor applicability for SQI interpolation in Al-Tamryate.
Overall, IDW performed reasonably well across all three sites, particularly in the Al-Tamryate, with consistently low RMSE values. Its simplicity makes it a good choice for general applications, though other methods like RBF may offer better precision. The GPI had larger RMSE values in all sites, indicating it is not well-suited for interpolating SQI in these areas. RBF offered strong performance, with lower RMSE than IDW in most cases, particularly in the Al-Sahwa site and the sub-surface layer of Al-Tamryate. This method provides smoother interpolation and handles variability well. LPI showed strong performance in the Al-Sahwa region for surface soils, offering the lowest RMSE across all models in that context. It is also competitive in the other regions, particularly for sub-surface layers. Kriging models, despite their theoretical sophistication, produced higher RMSE values than simpler methods like IDW and RBF, indicating that they may not be the best fit for the variability found in the datasets collected.
Values of the SMD confirmed previous findings, with lower values with IDW, LPI, and RBF models compared to other interpolation models (Table 8). Negative and positive SMD values indicate an underestimation and an overestimation of SQI, respectively.
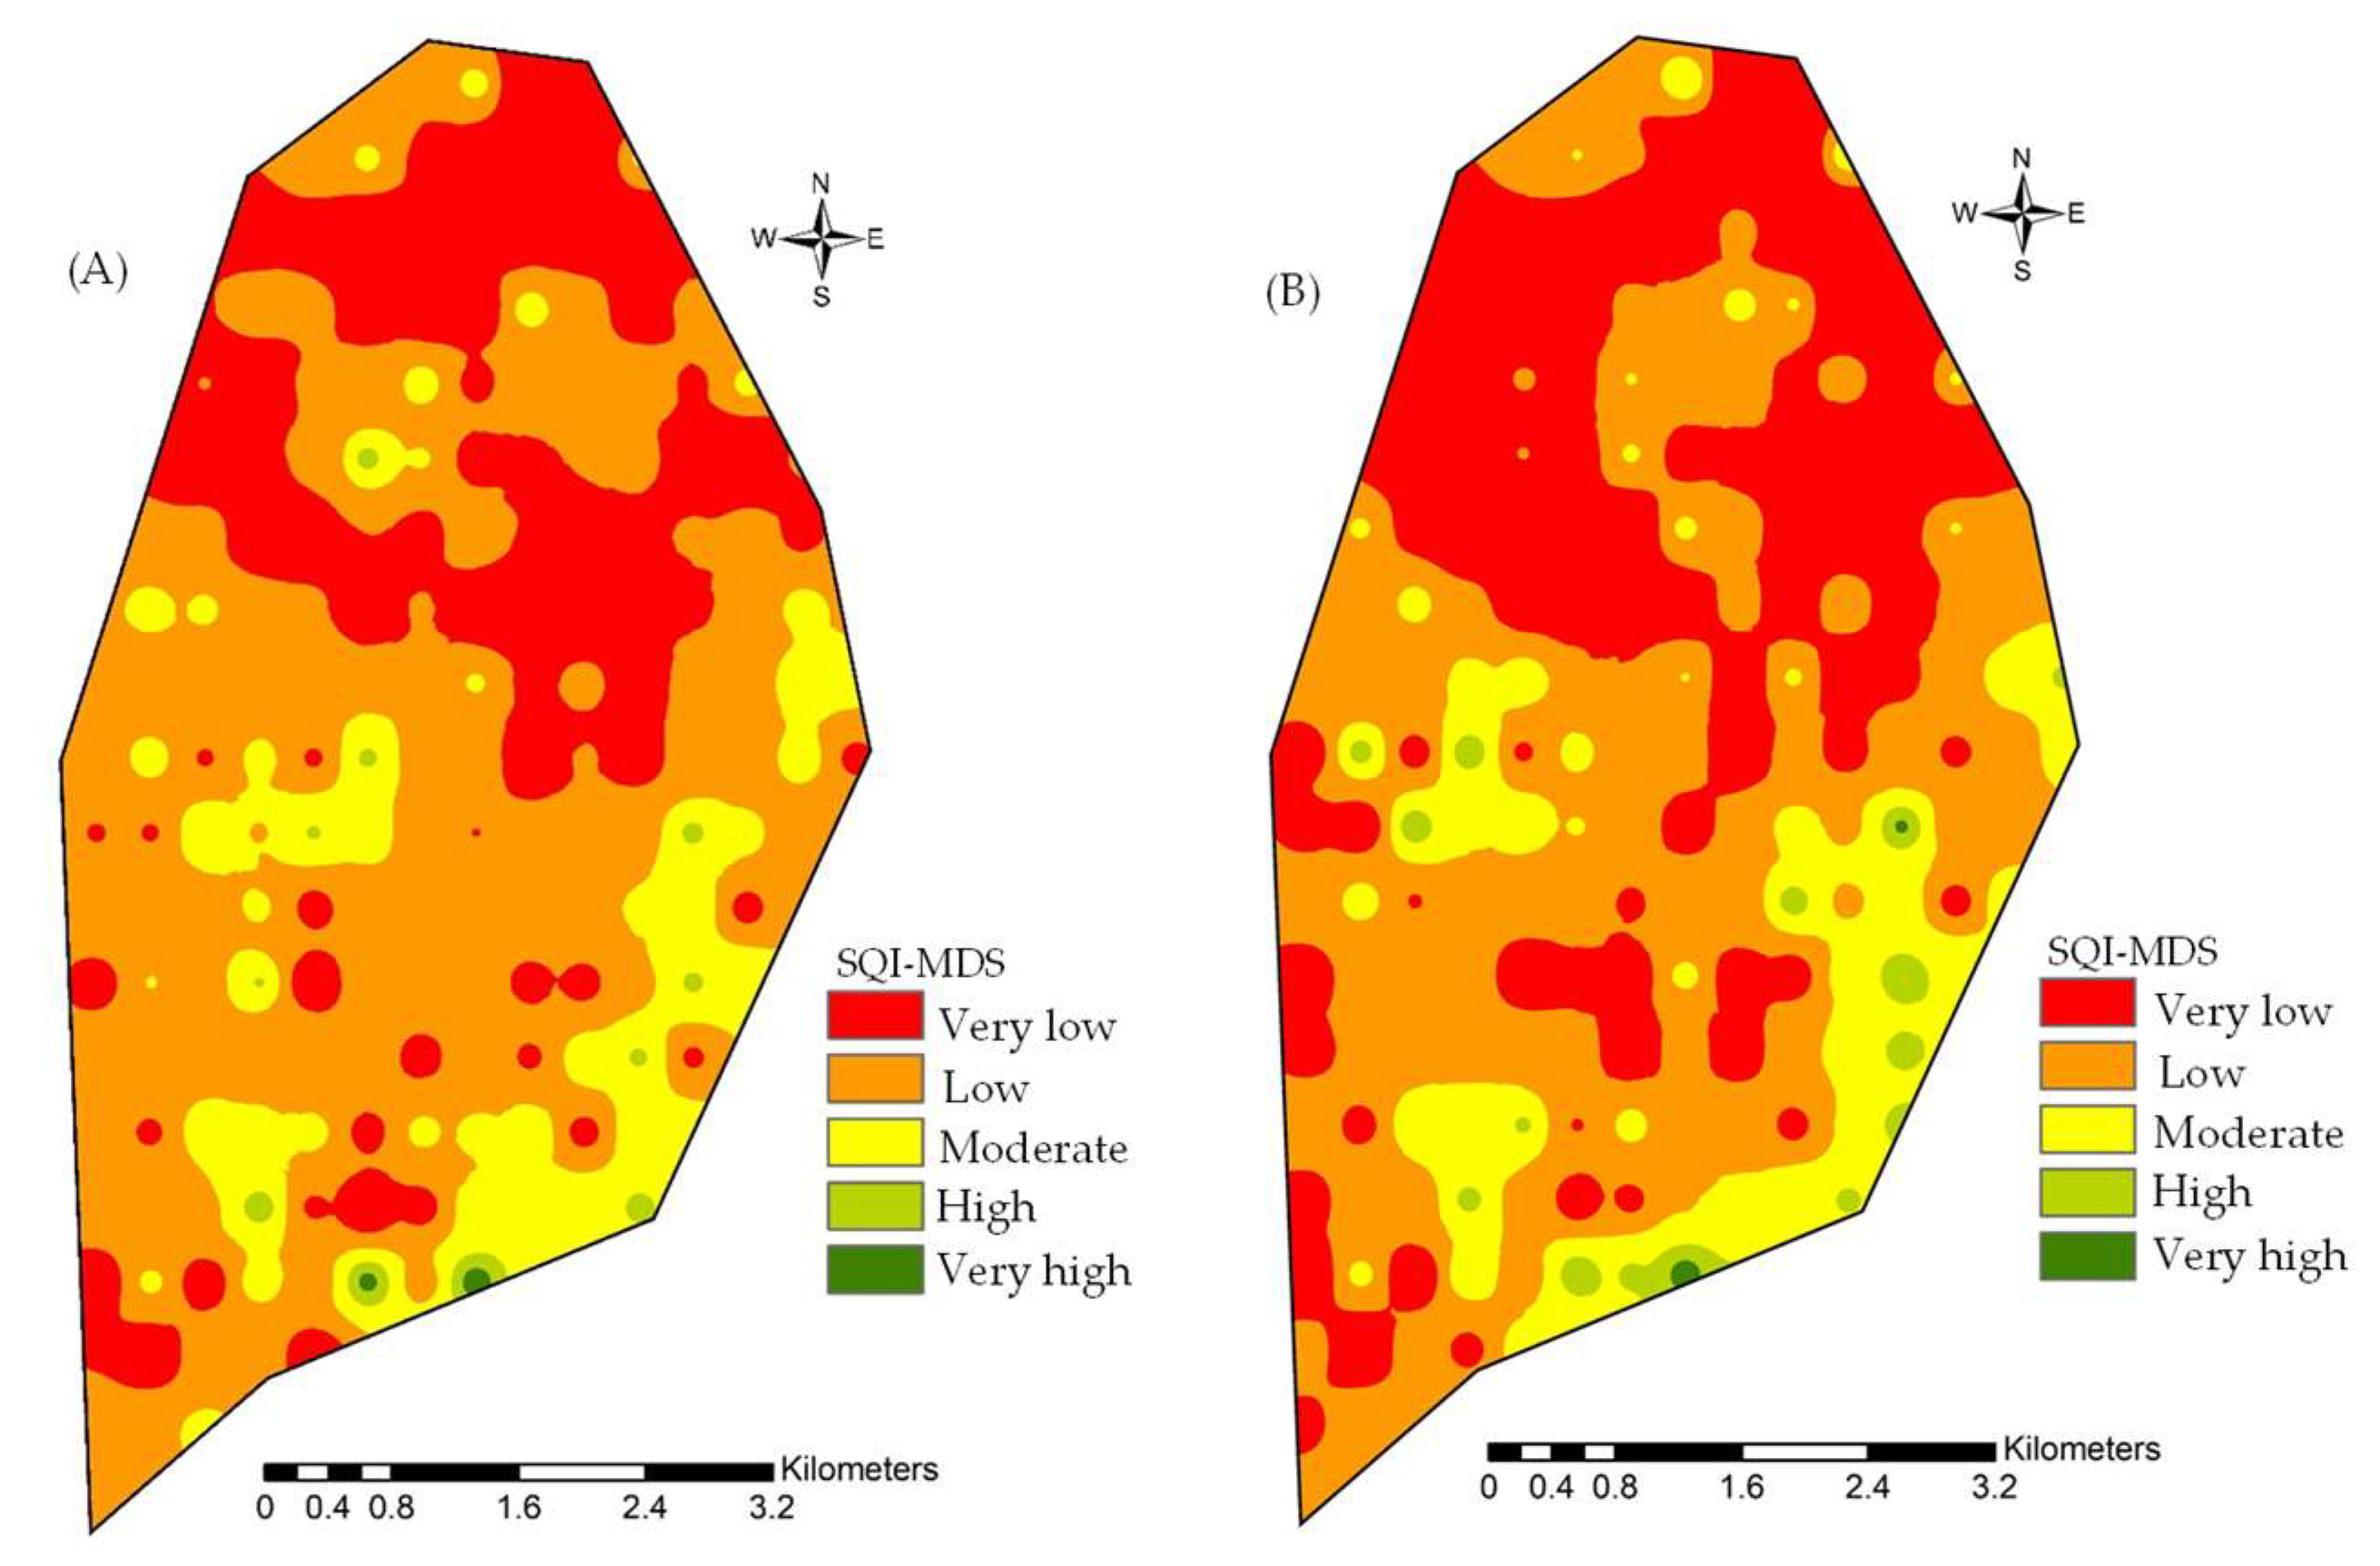
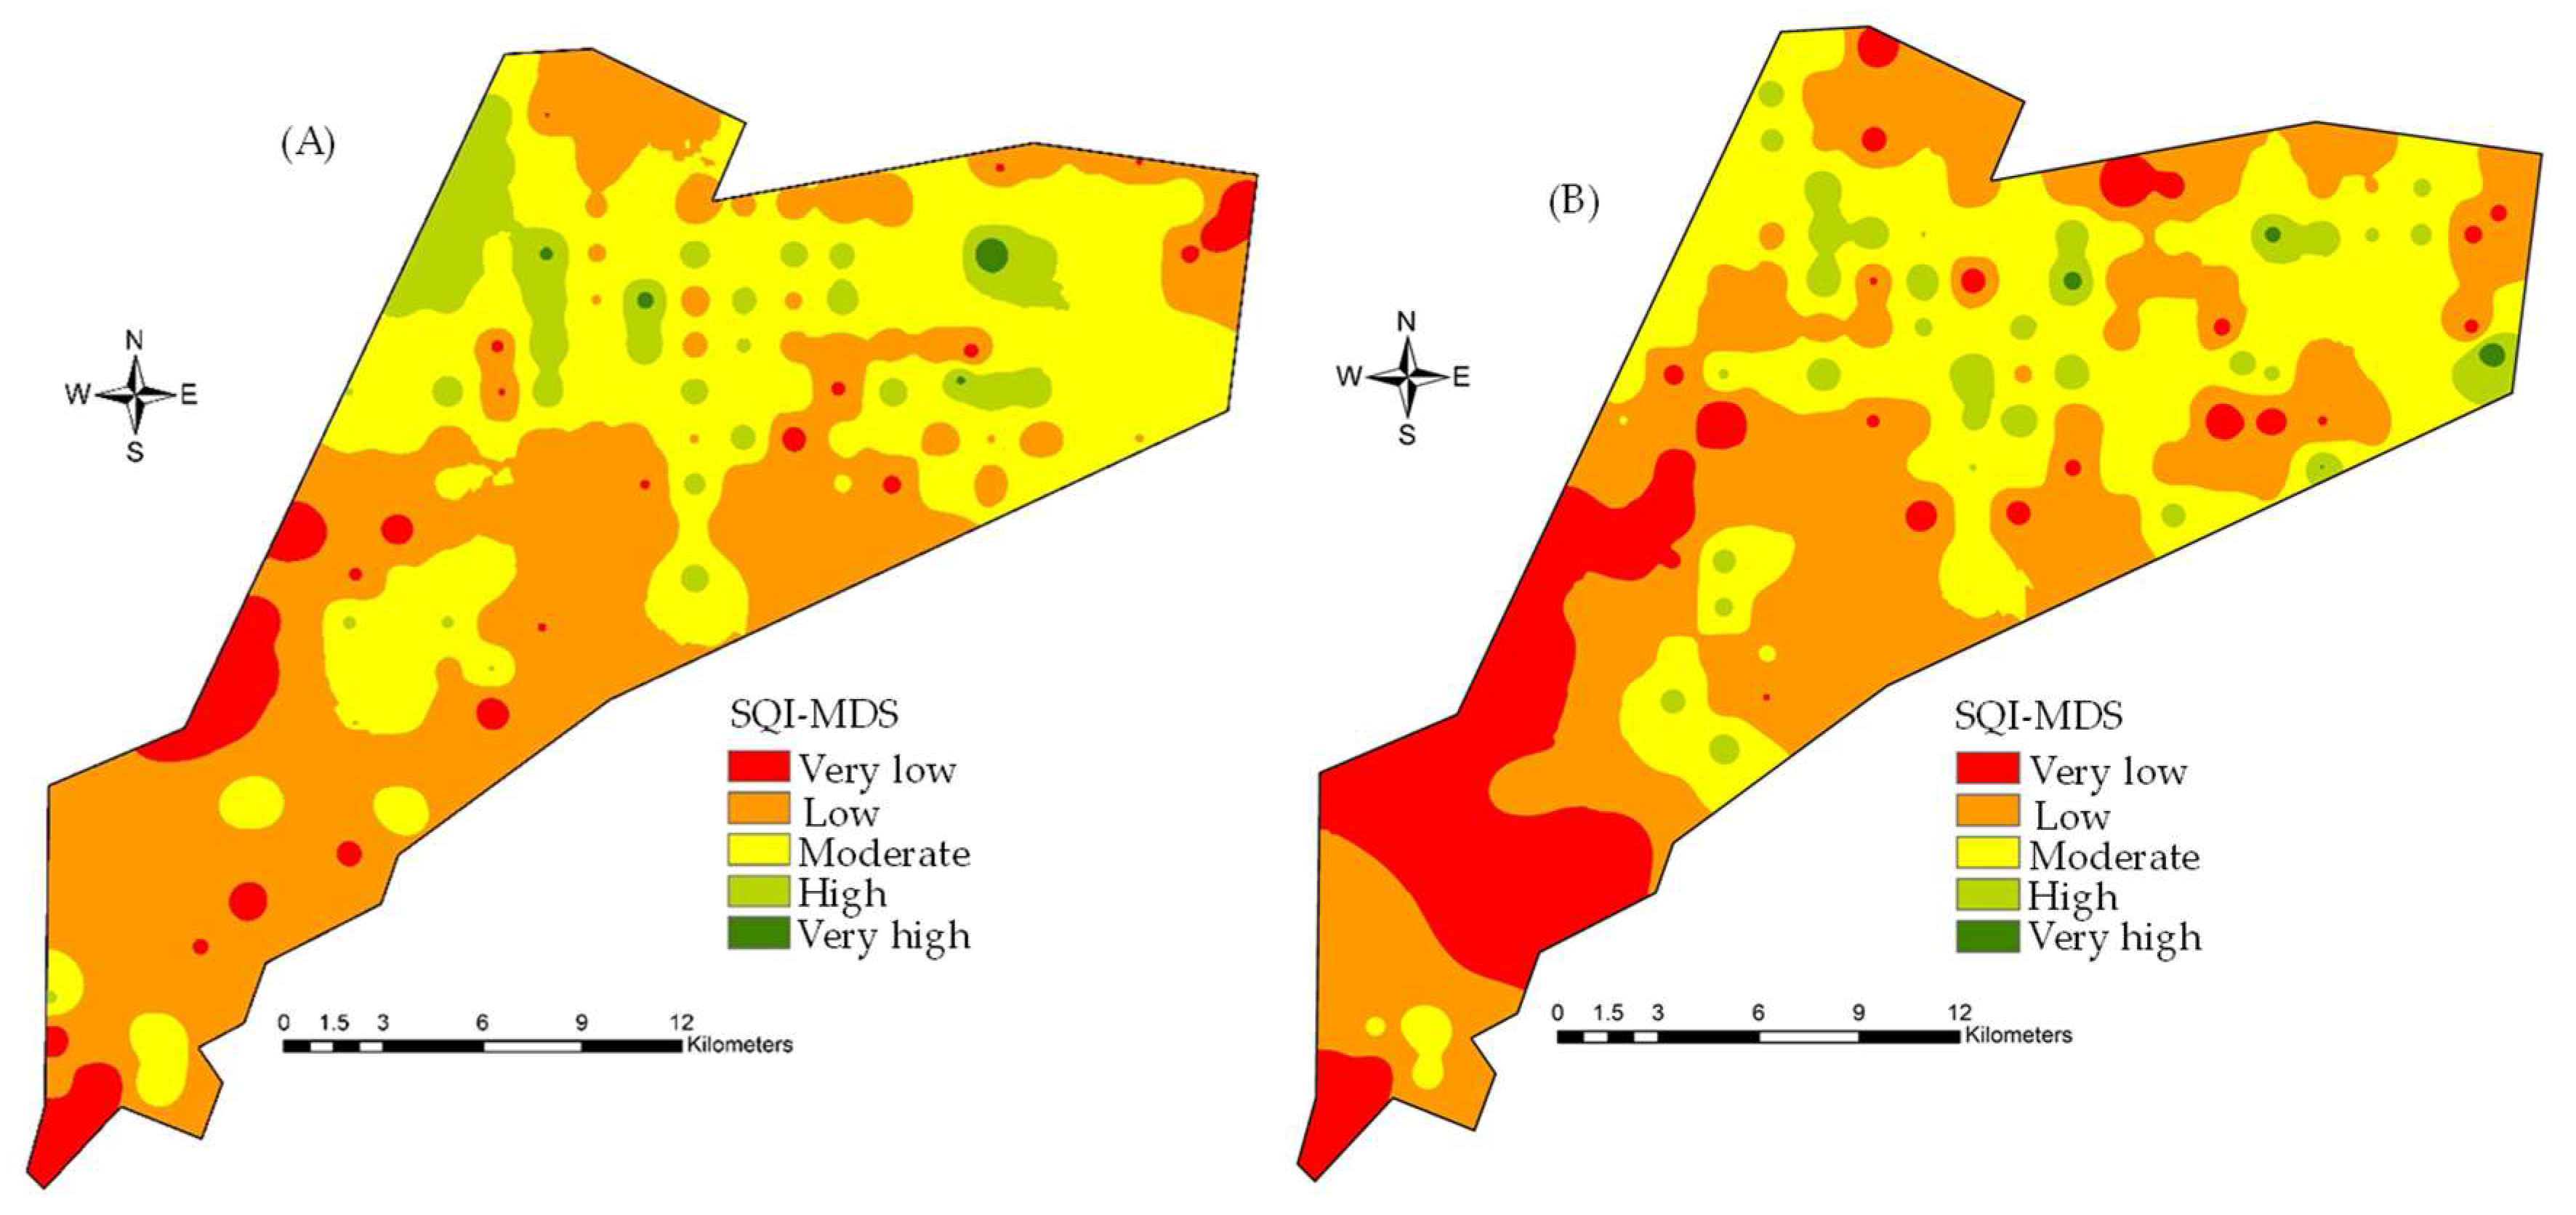
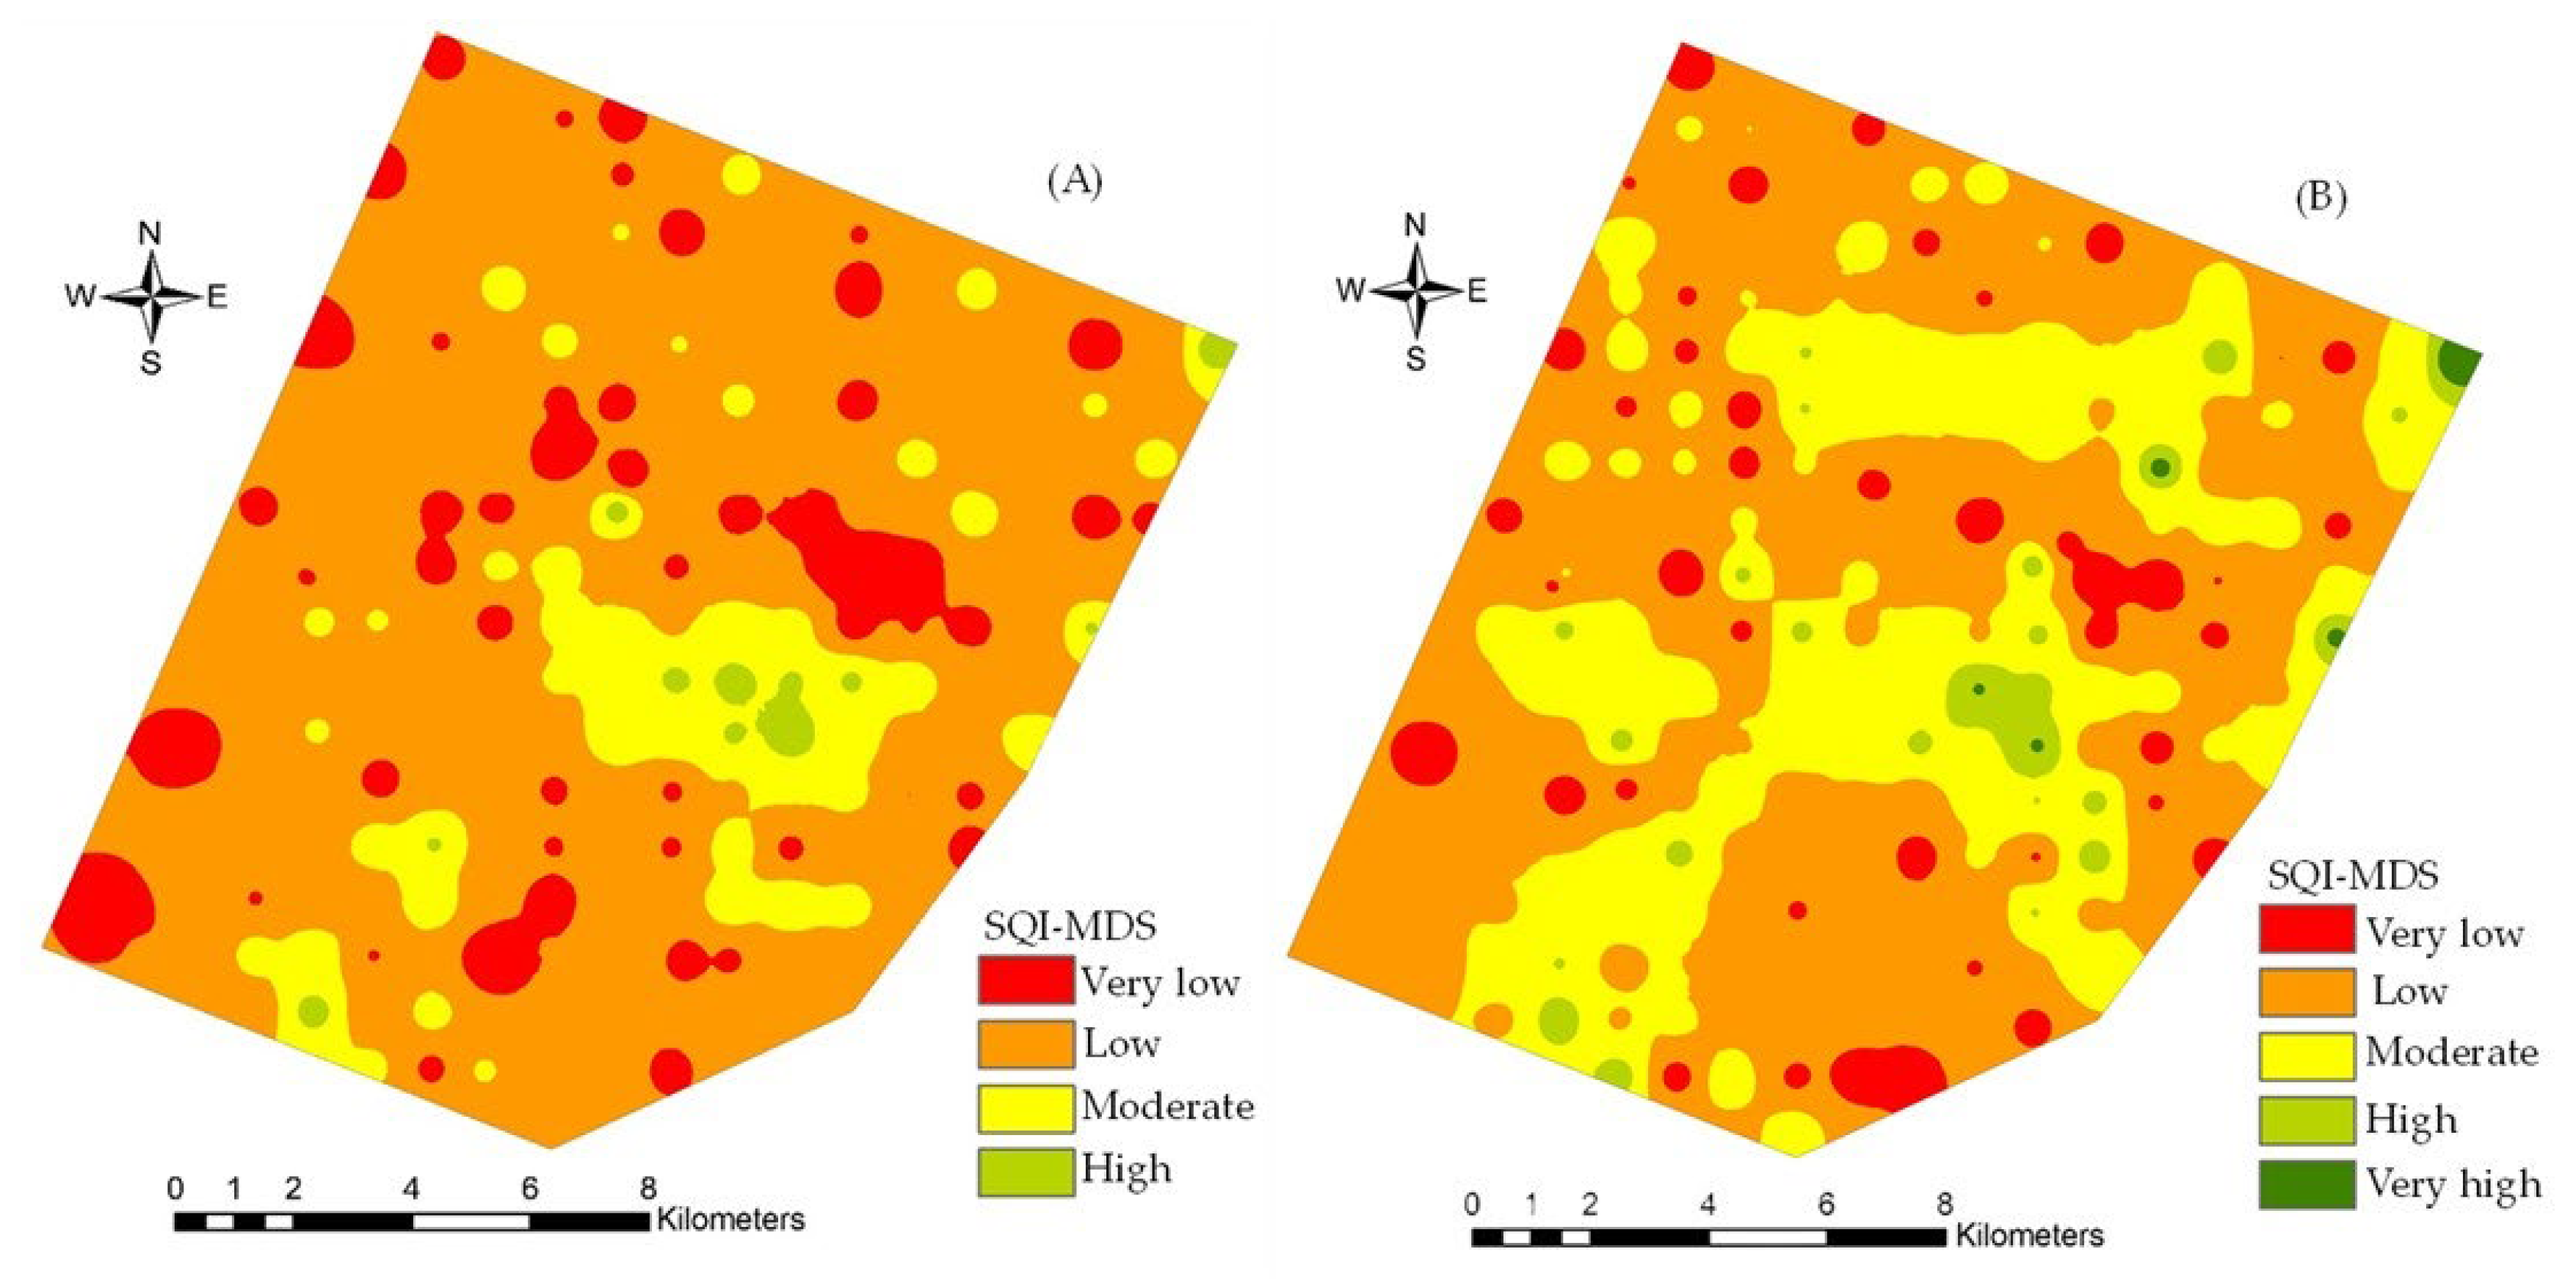
Based on the determined SQI-MDS values, maps depicting the spatial distribution of soil quality status throughout the study sites were created using ArcGIS’s spatial analysis functions. This method enables a thorough evaluation of the region’s heterogeneity in soil quality, enabling focused soil management techniques [3]. The spatial distribution of the different categories for the SQI-MDS in the surface and sub-surface layers of Al-Fahyhyl, Al-Sahwa, and Al-Tamryate sites is presented in Figure 8, Figure 9 and Figure 10, respectively. The percentage of the areal extension and total area of the different SQI-MDS categories is presented in Table 9. In Al-Fahyhyl, 75.5 and 73.2% of the total land area were classified as having very low and low SQI for the surface and sub-surface layers, respectively. These areas were mainly located in the north, central, and southwest parts (Figure 8A,B). In Al-Sahwa, the percentages of these same categories (very low and low) were slightly less and reached 64.7 and 58.9% for the surface and sub-surface layers, respectively. These areas were mainly located in the south, with small areas located in the north and southeast parts (Figure 9A,B). In contrast, the percentages of these two categories in Al-Tamryate mounted to 91.3 and 72.1% for the surface and sub-surface layers, respectively. These areas covered most of the study site, except for small areas located in the central, south, and northeast parts (Figure 10A,B).
Moderate SQIs were observed in 23.5 and 25.1% of the total area in the surface and sub-surface layers of Al-Fahyhyl, respectively, and were located in the southeast and small areas in the west (Figure 8A,B). This category (Moderate SQI) was represented by slightly larger areas in Al-Sahwa, with 30.6 and 39.1% in the surface and sub-surface layers, respectively. Moderate SQIs were located in Al-Sahwa mainly in the central, north, and east parts (Figure 9A,B). The percentages of the moderate SQI in Al-Tamryate were 8.1 and 25.8% for the surface and sub-surface layers, respectively, and were mainly located in the central and eastern parts. Additionally, small areas in the south and southeast also had moderate SQIs (Figure 10A,B).
The percentage of soil having high and very high SQIs was very small in all study sites. In Al-Fahyhyl, only 0.7 and 1.7% of the total land areas were classified as having high and very high SQIs for the surface and sub-surface layers, respectively. These areas were mainly located in the south and southeast parts (Figure 8A,B). Al-Sahwa showed the largest area having high and very high SQIs, with percentages of 4.7 and 2.0% for the surface and sub-surface layers, respectively. These areas were mainly located in the west and scattered areas in the central and eastern parts (Figure 9A,B). In Al-Tamryate, soils with high and very high SQIs represented 0.6 and 2.1% for the surface and sub-surface layers, respectively, and were mainly located in the central and small areas in the east and northeast parts (Figure 10A,B).
Assessing SQI over the entire sampling depth (0–60 cm), approximately 74.4, 61.8, and 81.7% of the total area in Al-Fahyhyl, Al-Sahwa, and Al-Tamryate, respectively, were classified as having very low and low SQIs. This indicates that large areas of the study sites are suffering from deterioration and low soil quality. The observed spatial range of soil quality in the study sites highlights the diversity of soil properties impacted by regional environmental conditions, land use patterns, and soil management techniques [3]. Based on the multivariate analysis performed in this study, the main reasons for low soil quality in the study site were attributed to the high sand and low TOC content, which reduced water and nutrient retention, leading to low vegetation cover and land degradation [58].
As for the moderate SQI category, the analysis revealed that, over the entire sampling depth, approximately 24.4, 34.8, and 16.9% of the total area in Al-Fahyhyl, Al-Sahwa, and Al-Tamryate, respectively, were classified as having a moderate SQI. This is interesting and highly promising for environmental sustainability in the study sites. Many researchers have demonstrated that rehabilitation of soils having a moderate SQI through techniques including reduced tillage, organic amendments, and increased water and nutrient retention have great potential for significant enhancement in soil quality and subsequently restoration of plant growth and vegetation cover in rangelands [11,64]. On the other hand, even though locations having high and very high SQIs were extremely small and reached (over the entire sampling depth) only 1.2, 3.4, and 1.4% for Al-Fahyhyl, Al-Sahwa, and Al-Tamryate, respectively, they remain considerable, taking into account the large areal extent of each study site. Based on the total area of each site, locations with high and very high SQIs amount to 35, 1570, and 273 ha for the Al-Fahyhyl, Al-Sahwa, and Al-Tamryate, respectively. These areas have excellent soil quality, indicating that these locations would be highly suited for immediate plantation and restoration projects with natural local plant species. By giving decision-makers a visual depiction of the soil quality across various landscapes, GIS-based mapping of soil quality enables more informed choices. By using this method, policymakers and land managers may focus their efforts on the regions that most require improvement, which will ultimately increase agricultural output and sustainable land management [1].

3.6. Implications for the Assessment of SQI in the Study Sites

Throughout the study sites, there are differences in the spatial distribution of soil quality due to factors such as terrain, climate, soil physical and chemical properties, land use, and soil management practices. Topography and climate play a critical role when determining the relationship between potential erodibility risk and soil quality index (SQI) values. For example, parts of Al-Fahyhyl and other areas with lower SQI values are particularly vulnerable to soil erosion because of their coarse texture, low total organic carbon, and poor water retention. Greater SQI values, on the other hand, are indicative of better-structured soils with a greater TOC and better water and nutrient retention in areas like Al-Sahwa and the sub-surface layer of Al-Tamriyat, which improve soil stability and lower the risk of erodibility [27]. In order to reduce the risk of erosion and encourage sustainable land use, the interaction of topography, climate, and soil quality calls for focused soil conservation measures, especially in more vulnerable areas having low and very low SQIs [30,31].
The evaluation of soil quality is closely related to several United Nations Sustainable Development Goals (SDGs), especially SDG 15 (Life on Land), which focuses on restoring damaged land and sustainable land management. Stakeholders may efficiently monitor the health of the land by using multivariate analysis and accurate indicators of soil quality. This allows for improved resource management and land use planning. In light of climate change, soil quality is also very important. In addition to improving resistance against the effects of climate change, healthy soils are important for water retention, biodiversity preservation, and carbon sequestration. Enhancing the quality of soil can reduce greenhouse gas emissions and modify agricultural operations to become more sustainable in the face of shifting climate patterns. Effective resource management and sustainable environmental practices are critical, in line with Saudi Arabia’s Vision 2030. The creation and implementation of a soil quality index are directly aligned with the country’s objectives of augmenting agricultural output, guaranteeing food sovereignty, and advancing sustainable land utilization. Thorough evaluations of soil quality and the ensuing restoration initiatives will support a more sustainable future while fulfilling Saudi Arabia’s environmental and economic goals.

4. Summary and Conclusions

This study provides a simplified methodology to evaluate key physical and chemical soil properties that are essential for the assessment of soil quality in three different rangeland sites (Al-Fahyhyl, Al-Sahwa, and Al-Tamryate) in Saudi Arabia. The methodology applies PCA and AHP analysis to establish an MDS by identifying critical physical and chemical soil indicators necessary for assessing soil quality and assigning proper weight to each indicator based on its relative importance. Out of the 27 physical and chemical soil indicators included in the TDS, only seven (sand, DR, MWD, BD, TOC, Pa, and Ka) and six (sand, DR, MWD, TOC, Pa, and Ka) were included in the MDS for the surface and sub-surface layers, respectively, and were able to represent >70% of total variability in the TDS and accurately assess SQI in the study sites.
Results indicated that sand had the most significant weight factor (0.4514 and 0.4835 in the surface and sub-surface soil layers, respectively), followed by TOC (0.2441 and 0.2512 for the surface and sub-surface soil layers, respectively). Additional soil indicators found in the MDS had weight factors ≤ 0.1. However, they continue to be important factors in evaluating SQI in relation to the other soil indicators in the TDS. In the arid climate found at all of the research locations, the percentage of sand will significantly influence the erosion risks and the soil’s capacity to retain water and support plant growth. Conversely, TOC significantly contributes to plant development by improving nutrient retention, soil structure, and water-holding capacity.
SOIs were classified into five categories (very low, low, moderate, high, and very high). The percentages of very low and low SQIs were 74.4, 61.8, and 81.7% of the total area in Al-Fahyhyl, Al-Sahwa, and Al-Tamryate, respectively. This suggests that extensive regions in the research areas are experiencing degradation and poor soil quality, necessitating the implementation of proper management practices like reduced tillage, organic additives, and enhanced water and nutrient retention. In contrast, areas having high and very high SQI were extremely limited to approximately 1.2, 3.4, and 1.4% for Al-Fahyhyl, Al-Sahwa, and Al-Tamryate, respectively. Nevertheless, the excellent soil quality in these locations would facilitate the immediate initiation of restoration projects using natural local plant species in these areas.
The findings of this research provide valuable insight into key physical and chemical soil properties affecting soil quality levels in the study regions. A soil indicator scoring equation based on key physical and chemical soil properties was used to assess soil quality levels in the study regions. However, a thorough evaluation of the SQI in the study regions would require the collection and analysis of a comprehensive dataset, including all physical, chemical, and biological properties impacting soil quality in the rangeland areas. In addition, several considerations must be followed to ensure the integrity of the assessment process of SQI in rangelands, including adequate representation of soil sampling sites in quantity and distribution, comprehensive coverage of at least 70% of observed variability through the selected indicators, and strict, unbiased criteria for selecting the weights of impactful indicators. Nevertheless, the methodology presented to assess SQI in rangelands has several benefits, including localized soil assessments, optimization of influential indicators, efficient monitoring of soil quality changes, and targeted interventions for regions needing restoration, ultimately enhancing soil quality, plant growth, and environmental sustainability in rangelands.
The results of this research offer essential direction for land managers, lawmakers, and agricultural participants seeking to carry out effective soil quality evaluations in rangeland regions. Utilizing simplified techniques aligns with global issues like land degradation and climate change, particularly relevant to Saudi Arabia’s Vision 2030. Evaluating soil quality using key indicators is crucial for resilient agricultural systems, enhancing food security, and promoting sustainable resource management, thus supporting ecological sustainability alongside economic growth in rangeland regions under the arid climate in Saudi Arabia.

Supplementary Materials

The following supporting information can be downloaded at https://www.mdpi.com/article/10.3390/land14112167/s1.

Author Contributions

Conceptualization H.M.I., Z.A., M.A.M. and A.G.A.; methodology H.M.I., Z.A., M.A.M. and A.G.A.; investigation, H.M.I., Z.A., M.A.M. and A.G.A.; samples collection H.M.I., Z.A., M.A.M. and A.G.A.; designing H.M.I. and A.G.A.; preparation and formal analyses, H.M.I.; statistical analyses, H.M.I.; software, H.M.I.; resources, H.M.I., Z.A., M.A.M. and A.G.A.; writing—original draft preparation, H.M.I.; manuscript review and editing H.M.I., Z.A., M.A.M., M.A.H., A.A. and A.G.A.; funding acquisition, H.M.I., Z.A., M.A.M. and A.G.A.; project administration A.G.A., M.A.H. and A.A.; supervision A.G.A., M.A.H. and A.A. All authors have read and agreed to the published version of the manuscript.

Funding

The National Center for Vegetation Cover Development and Combating Desertification (NCVC) financially supported this work.

Data Availability Statement

The data presented in this study are available on reasonable request from the corresponding author.

Acknowledgments

The authors would like to express their sincere appreciation to the National Center for Vegetation Cover Development and Combating Desertification, represented by the General Department of Rangelands, for their guidance and support throughout the implementation of this research. Special thanks are also extended to King Saud University, College of Food and Agricultural Sciences, Department of Soil Sciences, for their technical assistance and academic collaboration during the planning and execution phases of the research.

Conflicts of Interest

The authors declare no conflicts of interest.

References

  1. Stevens, A.W. Review: The economics of Soil quality. Food Pol. 2018, 80, 1–9. [Google Scholar] [CrossRef]
  2. Kremer, R.J. Chapter 16—Biotechnology impacts on soil and environmental services. In Soil Quality and Intensification of Agroecosytems; Al-Kaisi, M.M., Lowery, B., Eds.; Academic Press: Cambridge, MA, USA, 2017; pp. 353–375. [Google Scholar]
  3. Zhang, J.; Dyck, M.; Quideau, S.A.; Norris, C.E. Assessment of Soil quality and identification of key Soil quality indicators for five long-term crop rotations with varying fertility management. Geoderma 2024, 443, 116836. [Google Scholar] [CrossRef]
  4. Doran, J.W.; Parkin, T.B. Defining and Assessing Soil Quality. Defining Soil Quality for a Sustainable Environment; Soil Science Society of America: Madisson, WI, USA, 1994; pp. 3–21. [Google Scholar]
  5. Bünemann, E.K.; Bongiorno, G.; Bai, Z.; Creamer, R.E.; de Deyn, G.; de Goede, R.; Fleskens, L.; Geissen, V.; Kuyper, T.W.; Mader, P.; et al. Soil quality—A critical review. Soil Biol. Biochem. 2018, 120, 105–125. [Google Scholar] [CrossRef]
  6. Rinot, O.; Levy, G.J.; Steinberger, Y.; Svoray, T.; Eshel, G. Soil quality assessment: A critical review of current methodologies and a proposed new approach. Sci. Total Environ. 2019, 648, 1484–1491. [Google Scholar] [CrossRef] [PubMed]
  7. Merrington, G.; Fishwick, S.; Barraclough, D.; Morris, J.; Preedy, N.; Boucard, T.; Reeve, M.; Smith, P.; Fang, C. The Development and Use of Soil Quality Indicators for Assessing the Role of Soil in Environmental Interactions; Environment Agency Science Report SC030265; Environment Agency: Bristol, UK, 2006. [Google Scholar]
  8. Lehmann, J.; Bossio, D.A.; Kögel-Knabner, I.; Rillig, M.C. The concept and future prospects of Soil quality. Nat. Rev. Earth Environ. 2020, 1, 544–553. [Google Scholar] [CrossRef]
  9. Chapman, P.J.; Eze, S.; de Bell, S.; Barlow-Duncan, F.; Firbank, L.; Helgason, T.; Holden, J.; Leake, J.R.; Kay, P.; Brown, C.D.; et al. Agricultural Land Management for Public Goods Delivery: iCASP Evidence Review on Soil Quality; Yorkshire Integrated Catchment Solutions Programme (iCASP) Report; ICASP: Leeds, UK, 2018. [Google Scholar]
  10. Lal, R. Restoring Soil Quality to Mitigate Soil Degradation. Sustainability 2015, 7, 5875–5895. [Google Scholar] [CrossRef]
  11. Weil, R.; Brady, N. The Nature and Properties of Soils, 15th ed.; Pearson: New York, NY, USA, 2017. [Google Scholar]
  12. Evangelou, E.; Giourga, C. Identification of Soil Quality Factors and Indicators in Mediterranean Agro-Ecosystems. Sustainability 2024, 16, 10717. [Google Scholar] [CrossRef]
  13. Fine, A.K.; van Es, H.M.; Schindelbeck, R.R. Statistics, scoring functions, and regional analysis of a comprehensive Soil quality database. Soil Sci. Soc. Am. J. 2017, 81, 589–601. [Google Scholar] [CrossRef]
  14. Parra-González, S.; Rodriguez-Valenzuela, J. Determination of the soil quality index by principal component analysis in cocoa agroforestry system in the Orinoco region. Colombia J. Agric. Ecol. Res. Int. 2017, 10, 1–8. [Google Scholar] [CrossRef]
  15. Holechek, J.L.; Geli, H.M.E.; Cibils, A.F.; Sawalhah, M.N. Climate Change, Rangelands, and Sustainability of Ranching in the Western United States. Sustainability 2020, 12, 4942. [Google Scholar] [CrossRef]
  16. Gosnell, H.; Charnley, S.; Stanley, P. Climate change mitigation as a co-benefit of regenerative ranching: Insights from Australia and the United States. Interface Focus 2020, 10, 20200027. [Google Scholar] [CrossRef] [PubMed] [PubMed Central]
  17. Lehmann, J.; Hansel, C.M.; Kaiser, C.; Kleber, M.; Maher, K.; Manzoni, S.; Nunan, N.; Reichstein, M.; Schimel, J.P.; Torn, M.S.; et al. Persistence of soil organic carbon caused by functional complexity. Nat. Geosci. 2020, 13, 529–534. [Google Scholar] [CrossRef]
  18. Singh, P.; Jain, K.R.; Lakhmapurkar, J.; Gavali, D.; Desai, C.; Madamwar, D. Microbial community structure and functions during chronosequence-based phytoremediation programme of Lignite tailing soil. Environ. Technol. Innov. 2022, 27, 102447. [Google Scholar] [CrossRef]
  19. Gutierrez, S.; Greve, M.H.; Møller, A.B.; Beucher, A.; Arthur, E.; Normand, S.; de Jonge, L.W.; Gomes, L.D.C. A systematic benchmarking framework for future assessments of Soil quality: An example from Denmark. J. Environ. Manag. 2024, 366, 121882. [Google Scholar] [CrossRef]
  20. Drexler, S.; Broll, G.; Flessa, H.; Don, A. Benchmarking soil organic carbon to support agricultural carbon management: A German case study. J. Plant Nutr. Soil Sci. 2022, 185, 427–440. [Google Scholar] [CrossRef]
  21. Maharjan, B.; Das, S.; Acharya, B.S. Soil quality Gap: A concept to establish a benchmark for Soil quality management. Glob. Ecol. Conserv. 2020, 23, ep1116. [Google Scholar]
  22. Feeney, C.J.; Robinson, D.A.; Keith, A.M.; Vigier, A.; Bentley, L.; Smith, R.P.; Garbutt, A.; Maskell, L.C.; Norton, L.; Wood, C.M.; et al. Development of Soil quality benchmarks for managed and seminatural landscapes. Sci. Total Environ. 2023, 886, 163973. [Google Scholar] [CrossRef] [PubMed]
  23. Baroudy, A.A.E.; Ali, A.; Mohamed, E.S.; Moghanm, F.S.; Shokr, M.S.; Savin, I.; Poddubsky, A.; Ding, Z.; Kheir, A.; Aldosari, A.A. Modeling land suitability for rice crop using remote sensing and soil quality indicators: The case study of the Nile Delta. Sustainability 2020, 12, 9653. [Google Scholar] [CrossRef]
  24. Janzen, H.H.; Janzen, D.W.; Gregorich, E.G. The ‘Soil quality’ metaphor: Illuminating or illusory? Soil Biol. Biochem. 2021, 159, 108167. [Google Scholar] [CrossRef]
  25. Carter, M.R. Soil quality for sustainable land management: Organic matter and aggregation interactions that maintain soil functions. Agronomy 2002, 94, 38–47. [Google Scholar] [CrossRef]
  26. Raiesi, F. A minimum data set and soil quality index to quantify the effect of land use conversion on soil quality and degradation in native rangelands of upland arid and semiarid regions. Ecol. Ind. 2017, 75, 307–320. [Google Scholar] [CrossRef]
  27. Shi, Z.-H.; Chen, L.-D.; Hao, J.-P.; Wang, T.-W.; Cai, C.-F. The Effects of Land Use Change on Environmental Quality in the Red Soil Hilly Region, China: A Case Study in Xianning County. Environ. Monit. Assess. 2009, 150, 295. [Google Scholar] [CrossRef] [PubMed]
  28. Saaty, T.L. The Analytic Hierarchy Process: Planning, Priority Setting and Resource Allocation; McGraw-Hill: New York, NY, USA, 1980. [Google Scholar]
  29. Çomakli, E.; Turgut, B. Determining the effects of the forest stand age on the soil quality index in afforested areas: A case study in the Palandöken mountains. Soil Water Res. 2021, 16, 237–249. [Google Scholar] [CrossRef]
  30. Chen, Y.-D.; Wang, H.-Y.; Zhou, J.-M.; Xing, L.; Zhu, B.-S.; Zhao, Y.-C.; Chen, X.-Q. Minimum Data Set for Assessing Soil Quality in Farmland of Northeast China. Pedosphere 2013, 23, 564–576. [Google Scholar] [CrossRef]
  31. Qian, F.; Yu, Y.; Dong, X.; Gu, H. Soil Quality Evaluation Based on a Minimum Data Set (MDS)—A Case Study of Tieling County, Northeast China. Land 2023, 12, 1263. [Google Scholar] [CrossRef]
  32. Lyu, S.; Chen, W. Soil Quality Assessment of Urban Green Space under Long-Term Reclaimed Water Irrigation. Environ. Sci. Pollut. Res. 2016, 23, 4639–4649. [Google Scholar] [CrossRef]
  33. Volchko, Y.; Norrman, J.; Rosèn, L.; Norberg, T. A Minimum Data Set for Evaluating the Ecological Soil Functions in Remediation Projects. J. Soils Sediments 2014, 14, 1850–1860. [Google Scholar] [CrossRef]
  34. Liu, Z.; Zhou, W.; Shen, J.; Li, S.; Ai, C. Soil Quality Assessment of Yellow Clayey Paddy Soils with Different Productivity. Biol. Fertil. Soils 2014, 50, 537–548. [Google Scholar] [CrossRef]
  35. Qi, Y.; Jeremy, L.; Darilek, B.H.; Yongcun, Z.; Weixia, S.; Zhiquan, G. Evaluating soil quality indices in an agricultural region of Jiangsu Province, China. Geoderma 2009, 149, 325–334. [Google Scholar] [CrossRef]
  36. FAO. Are Pastures Under Threat? 2019. Available online: http://www.fao.org/uploads/media/grass_stat s_1.pdf (accessed on 10 September 2025).
  37. Kumar, T.; Jhariya, D.C. Land quality index assessment for agricultural purpose using multicriteria decision analysis (MCDA). Geocarto Int. 2015, 30, 822–841. [Google Scholar] [CrossRef]
  38. Sillero-Medina, J.A.; Hueso-González, P.; Ruiz-Sinoga, J.D. Differences in the Soil Quality Index for Two Contrasting Mediterranean Landscapes in Southern Spain. Land 2020, 9, 405. [Google Scholar] [CrossRef]
  39. Abuzinada, A.H.; Al-Wetaid, Y.I.; Al-Basyouni, S.Z. The National Strategy for Conservation of Biodiversity in the Kingdom of Saudi Arabia; Conservation of Biological Diversity; The National Commission for Wildlife Conservation and Development: Riyadh, Saudi Arabia, 2005. [Google Scholar]
  40. Blacke, G.R.; Hartge, K.H. Bulk density. In Methods of Soil Analysis. Part 1. Physical and Mineralogical Methods, 2nd ed.; Klute, A., Ed.; Wiley: Hoboken, NJ, USA, 1986; Volume 9, pp. 363–382. [Google Scholar]
  41. USDA; NRCS. National Engineering Handbook, Part 630 Hydrology; US Soil Conservation Service: Washington, DC, USA, 1964; Chapter 10. [Google Scholar]
  42. Gee, W.G.; Or, D. Particle-size analysis. In Methods of Soil Analysis; Book Series: 5; Dane, J., Topp, G.C., Eds.; Soil Science Society of America: Madison, WI, USA, 2002; Part 4; pp. 255–293. [Google Scholar]
  43. Lal, R.; Elliot, W. Erodibility and erosivity. In Soil Erosion Research Methods, 2nd ed.; Lal, R., Ed.; St. Lucie Press: Delray Beach, FL, USA, 1994; pp. 181–210. [Google Scholar]
  44. Nimmo, J.R.; Perkins, K.S. Aggregate stability and size distribution. In Methods of Soil Analysis Part 4; Dane, J.H., Topp, G.C., Eds.; SSSA: Madison, WI, USA, 2002; pp. 317–328. [Google Scholar]
  45. Dane, J.H.; Topp, G.C. (Eds.) Methods of Soil Analysis, Part 4, Physical Methods; Soil Science Society of America: Madison, WI, USA, 2002. [Google Scholar]
  46. Richard, L.A. Diagnosis and Improvement of Saline and Alkali Soils; US Department of Agriculture Handbook: Washington, DC, USA, 1954; Volume 60, p. 160. [Google Scholar]
  47. Nelson, D.W.; Sommers, L.E. Total carbon, organic carbon, and organic matter. In Methods of Soil Analysis: Part 3—Chemical Methods; Sparks, D.L., Ed.; Soil Science Society of America: Madison, WI, USA, 1996; pp. 961–1010. [Google Scholar] [CrossRef]
  48. Sumner, M.E.; Miller, W.P. Cation exchange capacity and exchange coefficients. In Methods of Soil Analysis Part 3—Chemical Methods; Sparks, D.L., Page, A.L., Helmke, P.A., Loeppert, R.H., Soltanpour, P.N., Tabatabai, M.A., Johnston, C.T., Sumner, M.E., et al., Eds.; Soil Science Society of America: Madison, WI, USA, 1996; pp. 1201–1229. [Google Scholar]
  49. Loeppert, R.H.; Suarez, D.L. Carbonate and gypsum. In Methods Soil Analysis Part 3 Chem. Methods; Wiley: Hoboken, NJ, USA, 1996; Volume 5, pp. 437–474. [Google Scholar]
  50. Sparks, D.L. Methods of Soil Analysis; Soil Society of American: Madison, WI, USA, 1996. [Google Scholar]
  51. Olsen, S.R.; Dean, L.A. Phosphorus, Methods of Soil Analysis Part 2, Chemical and Microbiological Properties; American Society of Agronomy, Inc.: Madison, WI, USA, 1965. [Google Scholar]
  52. McLean, E.O.; Watson, M.E. Soil measurements of plant available potassium. In Potassium in Agriculture; Munson, R.D., Ed.; ASA, CSSA, and SSSA: Madison, WI, USA, 1985; pp. 277–308. [Google Scholar]
  53. Kaiser, H.F. An index of factorial simplicity. Psychometrika 1974, 39, 31–36. [Google Scholar] [CrossRef]
  54. Govaerts, B.; Sayre, K.D.; Deckers, J. A minimum data set for soil quality assessment of wheat and maize cropping in the highlands of Mexico. Soil Tillage Res. 2006, 87, 163–174. [Google Scholar] [CrossRef]
  55. Nabiollahi, K.; Taghizadeh-Mehrjardi, R.; Kerry, R.; Moradian, S. Assessment of soil quality indices for salt-affected agricultural land in Kurdistan Province. Iran. Ecol. Indic. 2017, 83, 482–494. [Google Scholar] [CrossRef]
  56. Ramanathan, R. A note on the use of the analytic hierarchy process for environmental impact assessment. J. Environ. Manag. 2001, 63, 27–35. [Google Scholar] [CrossRef] [PubMed]
  57. Saaty, T.L. Decision-making with the AHP: Why is the principal eigenvector necessary? Eur. J. Oper. Res. 2003, 145, 85–91. [Google Scholar] [CrossRef]
  58. Karlen, D.L.; Stott, D.E.; Cambardella, C.A.; Kremer, R.J.; King, K.W.; McCarty, G.W. Surface soil quality in five Midwestern cropland conservation effects assessment project watersheds. J. Soil Water Conserv. 2014, 69, 393–401. [Google Scholar] [CrossRef]
  59. Cude, C.G. Oregon water quality index a tool for evaluating water quality management effectiveness 1. J. Am. Water Resour. Assoc. (JAWRA) 2001, 37, 125–137. [Google Scholar] [CrossRef]
  60. Yao, X.; Zhang, X.; Duan, M.; Yang, Y.; Xie, Q.; Luo, H.; Peng, J.; Mo, Z.; Pan, S.; Tang, X. Effects of Organic Matter Addition on Soil Carbon Contents, CO2 Emissions, and Bacterial Compositions in a Paddy Field in South China. Agronomy 2024, 14, 443. [Google Scholar] [CrossRef]
  61. Bienes, R.; Marques, M.J.; Sastre, B.; García-Díaz, A.; Esparza, I.; Antón, O.; Navarrete, L.; Hernánz, J.L.; Sánchez-Girón, V.; Sánchez del Arco, M.J.; et al. Tracking Changes on Soil Structure and Organic Carbon Sequestration after 30 Years of Different Tillage and Management Practices. Agronomy 2021, 11, 291. [Google Scholar] [CrossRef]
  62. Li, Y.; Zhang, J.; Li, E.; Miao, Y.; Han, S.; Liu, Y.; Liu, Y.; Zhao, C.; Zhang, Y. Changes in carbon inputs affect soil respiration and its temperature sensitivity in abroadleavedforest in central China. Catena 2022, 213, 106197. [Google Scholar] [CrossRef]
  63. Wang, Y.; Xie, J.; Fan, F.; Sun, Z.; Yuan, F.; Wang, Q.; Yu, L.; Liu, Y.; Li, J.; Cui, L. Phosphorus fertilization enhanced overwintering, root system and forage yield of late-seeded alfalfa in sodic soils. Sci Rep. 2024, 14, 18090. [Google Scholar] [CrossRef] [PubMed]
  64. Karaca, S.; Dengiz, O.; Turan, I.D.; Özkan, B.; Dedeoğlu, M.; Gülser, E.; Sargin, B.; Demirkaya, S.; Abdurahman, A. An assessment of pasture soils quality based on multi-indicator weighting approaches in semi-arid ecosystem. Ecol. Indic. 2021, 121, 107001. [Google Scholar] [CrossRef]
  65. Turan, I.D.; Dengiz, O.; Özkan, B. Spatial assessment and mapping of soil quality index for desertification in the semi-arid terrestrial ecosystem using MCDM in interval type-2 fuzzy environment. Comput. Electron. Agric. 2019, 164, 104933. [Google Scholar] [CrossRef]
  66. Dengiz, O. Potential impact of land use change on land productivity dynamics with focus on land degradation in a sub-humid terrestrial ecosystem. Theor. Appl. Climatol. 2018, 133, 73–88. [Google Scholar] [CrossRef]
  67. Sánchez-Cañete, E.P.; Scott, R.L.; Haren, J.V.; Barron-Gafford, G.A. Improving the accuracy of the gradient method for determining soil carbon dioxide efflux. J. Geophys Res. Biogeosci. 2017, 122, 50–64. [Google Scholar] [CrossRef]
  68. Liu, L.; Qin, F.; Sheng, Y.; Li, L.; Dong, X.; Zhang, S.; Shen, C. Soil quality evaluation and limiting factor analysis in different microtopographies of hilly and gully region based on minimum data set. Catena 2025, 254, 108973. [Google Scholar] [CrossRef]
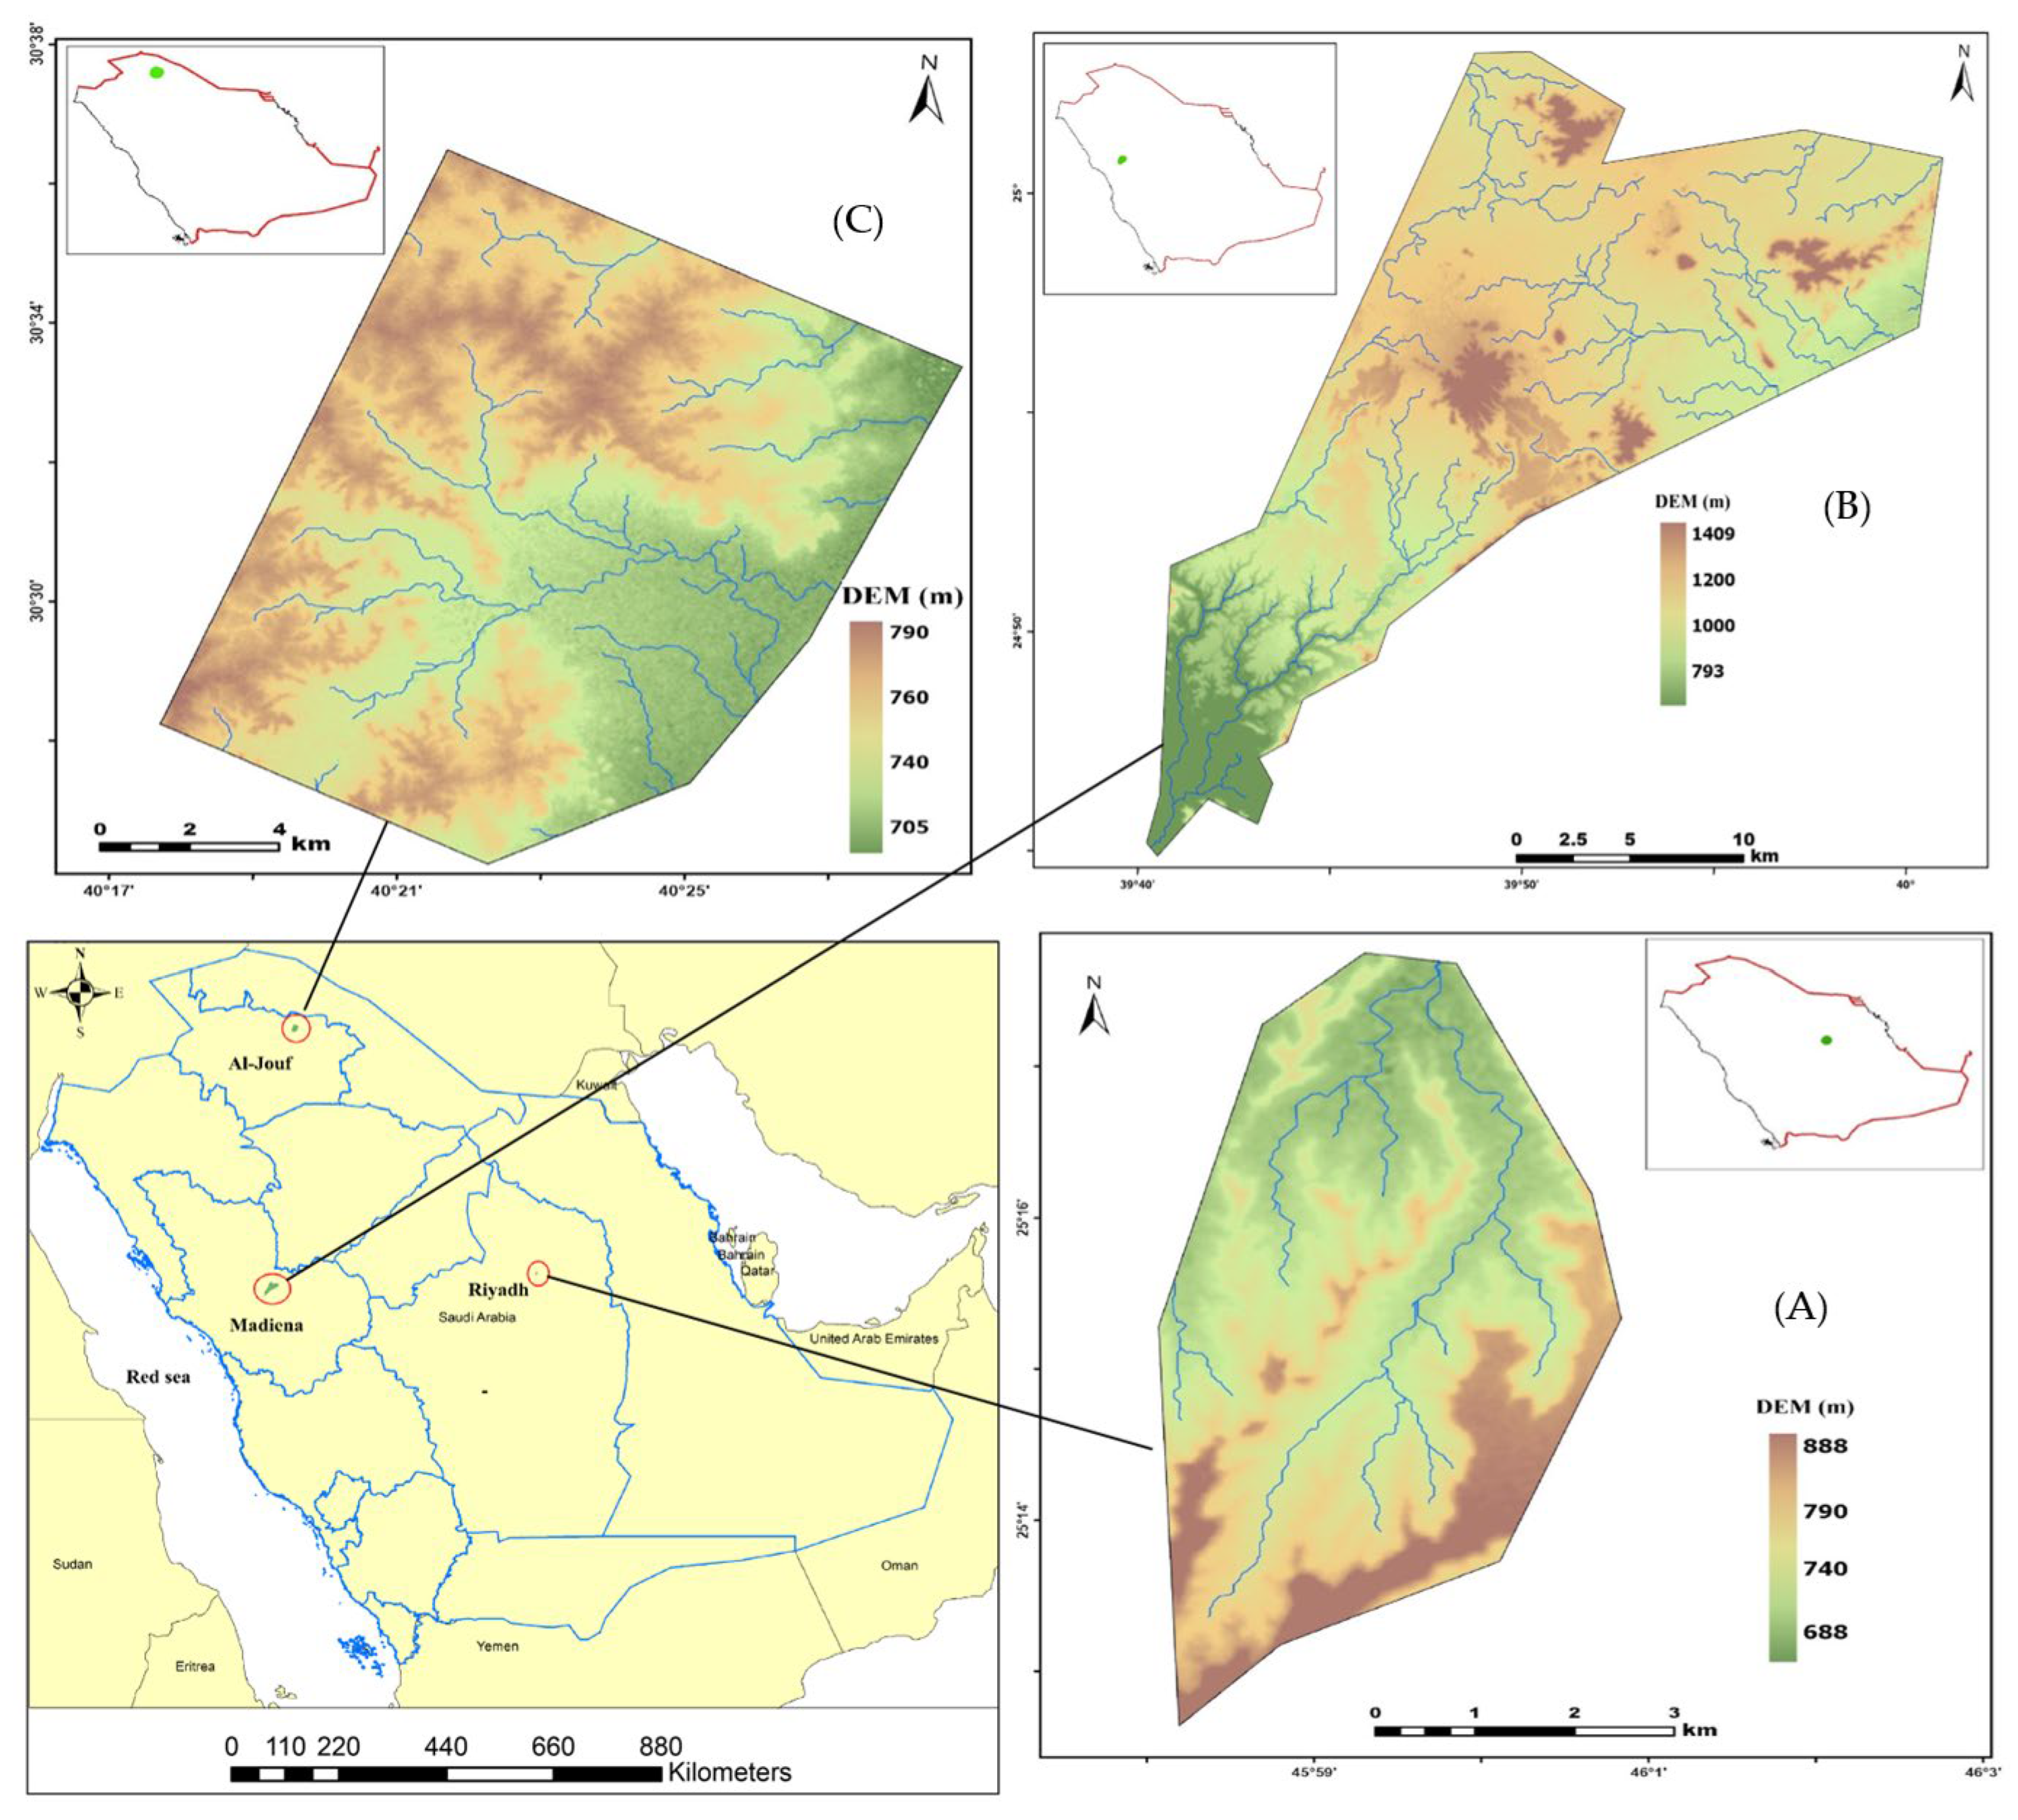
Figure 1. Study sites (locations inside the red circles) and digital elevation models (DEM) of Al-Fahyhyl (Riyadh region), (A); Al-Sahwa (Al-Madinah region), (B), and Al-Tamryate (Al-Jouf region), (C).
Land 14 02167 g001
Figure 2. Locations of surface and subsurface soil samples in Al-Fahyhyl (A); Al-Sahwa (B); and Al-Tamryate regions (C). The number of sampling locations was 193, 170, and 217 in Al-Fahyhyl, Al-Sahwa, and Al-Tamryate regions, respectively.
Land 14 02167 g002
Figure 3. A flow chart showing the different steps used to calculate soil quality index (SQI) based on key physical and chemical soil properties in the study regions. TDS, total dataset; PCA, principal component analysis; MDS, minimum dataset; AHP, analytical hierarchy process; Q, surface runoff; S, potential maximum retention; CN, curve number; BD, bulk density; CI, cumulative infiltration; DR, dispersion ratio; MWD, mean weight diameter; θ F , water content at field capacity; θ W , water content at permanent wilting; EC, electrical conductivity; CEC, cation exchange capacity; TOC, total organic carbon; Pa, available phosphorus; Ka, available potassium.
Land 14 02167 g003
Figure 4. Scree plots of principal components (PCs), eigenvalues, and cumulative variability based on the analysis of the TDS in the surface and sub-surface layers in Al-Fahyhyl (A,B), Al-Sahwa (C,D), and Al-Tamryate (E,F) sites. The shaded area represents the number of principal components used to establish the MDS and complete the analysis according to the specified selection criteria. The red line represents the cumulative variability of the PCs.
Land 14 02167 g004
Figure 5. Biplot of the first (F1) and the second (F2) principal components and the distribution of scores of samples and loadings of variable soil indicators measured in the surface and sub-surface layers in Al-Fahyhyl (A,B), Al-Sahwa (C,D), and Al-Tamryate (E,F) sites. Symbols F1 to F199, S1 to S246, and T1 to T239 represent sampling locations in Al-Fahyhyl, Al-Sahwa, and Al-Tamryate sites, respectively. Black circles represent important soil indicators affecting soil quality in certain sampling locations.
Land 14 02167 g005
Figure 6. Correlation between soil indicators and SQI as established by the MDS in the surface (A) and sub-surface (B) layers of the study sites. Dr, dispersion ratio; MWD, mean weight diameter; TOC, total organic carbon; CEC, cation exchange capacity. Red and blue bars represent selected and eliminated soil indicators, respectively. Dashed lines represent the threshold value of 0.3.
Land 14 02167 g006
Figure 7. Relationship between SQI-TDS and SQI-MDS in the surface ((A), (C), and (E)) and sub-surface ((B), (D), and (F)) soil layers in Al-Fahyhyl, Al-Sahwa, and Al-Tamryate sites, respectively.
Land 14 02167 g007
Figure 8. Spatial distribution of SQI-MDS in the surface (A) and sub-surface (B) layers in Al-Fahyhyl.
Land 14 02167 g008
Figure 9. Spatial distribution of SQI-MDS in the surface (A) and sub-surface (B) layers in Al-Sahwa.
Land 14 02167 g009
Figure 10. Spatial distribution of SQI-MDS in the surface (A) and sub-surface (B) layers in Al-Tamryate.
Land 14 02167 g010
Table 1. Selected physical and chemical soil indicators affecting soil quality in the study regions.
Soil IndictorsAbbreviationUnitSQF *
Physical:
Bulk density **BDkg m−3LB
Cumulative infiltration **CImLMB
Curve number ***CN-MB
Potential maximum retention ***SmmMB
Surface runoff ***QmmLB
StonesStones%LB
SandSand%LB
SiltSilt%LB
ClayClay%MB
Dispersion ratioDR%LB
Mean weight diameterMWDmmMB
Water content at field capacity θ F g g−1MB
Water content at permanent wilting θ W g g−1LB
Chemical:
pHpH-LB
Electrical conductivityECdS m−1LB
Cation exchange capacityCECcmol+ kg−1MB
Calcium carbonateCaCO3%LB
Soluble cations (Ca2+, Mg2+, Na+, K+)Ca2+, Mg2+, Na+, K+meq L−1LB
Soluble anions (Cl, HCO3, SO42−)Cl, HCO3, SO42−meq L−1LB
Available phosphorousPamg kg−1MB
Available potassiumKamg kg−1MB
Total organic carbonTOC%MB
* Soil quality function (SQF); LB, lower value is better; MB, more (higher) value is better. ** Both bulk density (BD) and cumulative infiltration (CI) were measured in the surface layer only. *** Calculated, in the surface layer only, by the curve number (CN) method developed by the United States Department of Agriculture (USDA), Natural Resources Conservation Service (NRCS) [41].
Table 2. Results of calculating the Kaiser–Meyer–Olkin (KMO) values to determine the suitability of the aggregated data for multivariate analysis.
Soil IndicatorsAl-FahyhyAl-SahwaAl-Tamryate
SurfaceSub-SurfaceSurfaceSub-SurfaceSurfaceSub-Surface
Physical:
BD0.85-0.25-0.45-
CI0.62-0.69-0.88-
CN0.57-0.61-0.65-
S0.57-0.61-0.65-
Q0.57-0.60-0.66-
Stones0.740.550.760.710.900.82
Sand0.740.440.770.640.830.51
Silt0.770.520.710.670.730.48
Clay0.830.390.790.730.810.49
DR0.660.520.650.550.780.80
MWD0.620.650.710.640.600.47
θ F 0.710.670.620.650.810.72
θ W 0.740.670.680.590.860.71
Chemical:
pH0.860.800.730.910.930.91
EC0.890.920.770.910.840.74
CEC0.570.700.670.830.880.76
CaCO30.530.490.730.610.840.91
Ca2+0.600.580.590.610.640.60
Mg2+0.480.520.530.580.730.63
Na+0.810.740.850.940.760.62
K+0.550.760.770.810.830.82
Cl0.610.600.540.570.700.61
HCO30.450.460.250.150.430.44
SO42−0.720.700.510.470.680.59
Pa0.760.570.720.420.680.63
Ka0.610.550.660.400.390.35
TOC0.570.540.610.610.680.59
Overall average0.650.590.640.650.730.62
BD, bulk density; CI, cumulative infiltration; CN, curve number; S, potential maximum retention; Q, surface runoff; DR, dispersion ratio; MWD, mean weight diameter; θ F , water content at field capacity; θ W , water content at permanent wilting; EC, electrical conductivity; CEC, cation exchange capacity; Pa, available phosphorus; Ka, available potassium; TOC, total organic carbon.
Table 3. Minimum, maximum, mean, and standard deviation of soil indicator values in the surface soil layer (0–30 cm) in the study sites.
Soil IndicatorsAl-FahyhyAl-SahwaAl-Tamryate
Min.Max.MeanMin.Max.MeanMin.Max.Mean
Physical:
BD1.111.791.44 ± 0.161.311.861.63 ± 0.091.121.961.52 ± 0.15
CI0.3914.155.58 ± 3.961.4114.157.45 ± 3.231.1314.157.38 ± 3.65
CN48.0083.0055.2 ± 11.6248.0083.0054.11 ± 11.7248.0083.0058.46 ± 14.11
S52.02275.16223.3 ± 82.352.02275.1232.8 ± 80.852.02275.16203.5 ± 96.1
Q6.3156.6815.46 ± 15.06.3156.6814.36 ± 15.536.3156.6820.27 ± 18.94
Stones1.9487.6439.96 ± 17.12.0799.4559.32 ± 26.451.3198.9146.62 ± 24.91
Sand14.3290.7262.36 ± 12.643.3295.5272.45 ± 10.7513.5289.1267.66 ± 11.74
Silt2.0072.0024.07 ± 13.11.0036.0012.54 ± 7.191.0068.0014.11 ± 7.64
Clay4.6834.8813.56 ± 5.93.4831.2815.01 ± 5.666.8842.0818.23 ± 6.55
DR26.0094.0069.93 ± 13.121.0068.0043.96 ± 11.921.0094.0065.29 ± 14.01
MWD0.070.090.08 ± 0.010.0010.0310.009 ± 0.010.060.090.08 ± 0.003
θ F 0.0510.3110.173 ± 0.060.1000.1990.146 ± 0.030.0910.3180.179 ± 0.04
θ W 0.0050.1070.051 ± 0.020.0110.0600.039 ± 0.010.0370.1590.078 ± 0.03
Chemical:
pH7.228.737.95 ± 0.297.219.008.19 ± 0.37.118.998.23 ± 0.29
EC0.00410.612.31 ± 2.130.086.540.56 ± 1.010.0715.150.96 ± 1.92
CEC3.677.925.37 ± 0.764.0617.399.22 ± 3.364.539.216.59 ± 0.97
CaCO313.1497.0656.57 ± 16.90.0132.327.66 ± 6.933.1727.5813.33 ± 4.54
Ca2+0.8051.0013.85 ± 10.50.6037.005.79 ± 5.690.4034.004.16 ± 6.37
Mg2+0.6021.005.08 ± 4.10.1033.003.80 ± 3.960.2017.001.97 ± 2.30
Na+0.014.410.81 ± 0.830.0043.230.42 ± 0.540.0049.8170.897 ± 1.55
K+0.010.880.13 ± 0.120.0031.430.12 ± 0.180.0030.8440.156 ± 0.12
Cl1.0062.0015.99 ± 12.31.0044.006.34 ± 6.690.8035.005.07 ± 5.97
HCO31.005.002.35 ± 0.770.105.002.29 ± 1.020.605.001.56 ± 0.72
SO42−0.023.241.36 ± 1.080.0529.812.07 ± 3.620.0516.941.67 ± 2.82
Pa0.018.201.42 ± 1.60.019.502.92 ± 2.560.0113.201.52 ± 2.41
Ka1.00240.0060.74 ± 62.61.10210.092.4 ± 53.12.00338.0115.3 ± 53.7
TOC0.0010.4310.104 ± 0.060.0781.1190.440 ± 0.140.0760.8300.367 ± 0.136
BD, bulk density; CI, cumulative infiltration; CN, curve number; S, potential maximum retention; Q, surface runoff; DR, dispersion ratio; MWD, mean weight diameter; θ F , water content at field capacity; θ W , water content at permanent wilting; EC, electrical conductivity; CEC, cation exchange capacity; Pa, available phosphorus; Ka, available potassium; TOC, total organic carbon. Numbers of observation sites are 193, 170, and 217 in AL-Fahyhy, Al-Sahwa, and Al-Tamryate, respectively. Mean values are presented ± 1 SD.
Table 4. Minimum, maximum, mean, and standard deviation of soil indicator values in the sub-surface soil layer (30–60 cm) in the study sites.
Soil IndicatorsAl-FahyhyAl-SahwaAl-Tamryate
Min.Max.MeanMin.Max.MeanMin.Max.Mean
Physical:
Stones2.0091.0043.53 ± 16.31.7999.3062.23 ± 26.181.8799.2351.66 ± 26.09
Sand14.3290.7263.50 ± 13.537.7293.5270.14 ± 11.8519.1290.1265.75 ± 11.02
Silt0.8072.0023.97 ± 13.21.0039.0013.65 ± 8.371.0047.0014.98 ± 8.18
Clay3.6838.4812.51 ± 5.92.4833.2816.20 ± 6.756.8844.0819.26 ± 6.91
DR23.0094.0066.64 ± 14.125.0063.0042.54 ± 11.132.0093.0071.21 ± 11.11
MWD0.0710.0960.084 ± 0.010.0010.0250.009 ± 0.0060.0670.0940.087 ± 0.004
θ F 0.0330.3670.175 ± 0.060.1000.2130.145 ± 0.030.0800.2830.176 ± 0.039
θ W 0.0040.1250.052 ± 0.020.0040.0600.038 ± 0.010.0230.1420.073 ± 0.026
Chemical:
pH7.208.607.89 ± 0.277.118.988.13 ± 0.297.109.108.19 ± 0.32
EC0.00311.913.27 ± 2.650.088.240.73 ± 1.280.0518.361.44 ± 2.25
CEC3.517.545.36 ± 0.753.6716.428.82 ± 3.174.849.076.55 ± 0.98
CaCO313.6997.7256.49 ± 17.20.1047.888.51 ± 7.851.0956.7615.31 ± 6.95
Ca2+0.8067.0017.57 ± 12.21.0038.006.56 ± 6.630.4056.006.95 ± 9.23
Mg2+0.4019.006.04 ± 4.511.0029.004.10 ± 4.850.2014.002.55 ± 2.74
Na+0.055.121.15 ± 0.940.0093.790.53 ± 0.720.00414.231.10 ± 1.71
K+0.010.780.17 ± 0.130.0051.280.12 ± 0.180.0031.2050.15 ± 0.13
Cl1.6073.0020.56 ± 14.91.4090.007.26 ± 9.470.8061.007.19 ± 8.39
HCO31.004.002.37 ± 0.720.106.002.26 ± 1.170.608.001.78 ± 1.01
SO42−0.023.371.57 ± 1.100.0537.232.39 ± 4.440.05515.912.55 ± 3.61
Pa0.016.900.82 ± 1.160.019.703.08 ± 2.750.01013.501.08 ± 2.08
Ka1.00216.054.31 ± 58.41.00212.082.61 ± 50.441.000199.0103.03 ± 52.1
TOC0.0040.3270.09 ± 0.060.0781.2670.438 ± 0.150.0760.7560.357 ± 0.123
DR, dispersion ratio; MWD, mean weight diameter; θ F , water content at field capacity; θ W , water content at permanent wilting; EC, electrical conductivity; CEC, cation exchange capacity; Pa, available phosphorus; Ka, available potassium; TOC, total organic carbon. Numbers of observation sites are 193, 170, and 217 in AL-Fahyhy, Al-Sahwa, and Al-Tamryate, respectively. Mean values are presented ± 1 SD.
Table 5. Pairwise comparisons for the MDS and weight factors assigned for soil indicators in the surface layer of the study sites.
Soil
Indicators
Soil IndicatorsWeight FactorsCR
SandDRMWDBDTOCPaKa
Sand15694770.45140.047
DR1/51241/4330.1091
MWD1/61/2131/5220.0715
BD1/91/41/311/61/21/20.0297
TOC1/44561550.2441
Pa1/71/31/221/5120.0517
Ka1/71/31/221/51/510.0425
DR, dispersion ratio; MWD, mean weight diameter; BD, bulk density; TOC, total organic carbon; Pa, available phosphorus; Ka, available potassium; CR, consistency ratio.
Table 6. Pairwise comparisons for the MDS and weight factors assigned for soil indicators in the sub-surface layer of the study sites.
Soil
Indicators
Soil IndicatorsWeight FactorsCR
SandDRMWDTOCPaKa
Sand1564770.48350.054
DR1/5121/4330.1064
MWD1/61/211/5220.0684
TOC1/4451550.2512
Pa1/71/31/21/5120.0504
Ka1/71/31/21/51/210.0401
DR, dispersion ratio; MWD, mean weight diameter; BD, bulk density; TOC, total organic carbon; Pa, available phosphorus; Ka, available potassium; CR, consistency ratio.
Table 7. Descriptive statistics of SQI-MDS histogram analysis in the surface and subsurface soil layers in the Al-Fahyhyl, Al-Sahwa, and Al-Tamryate study sites.
Descriptive
Statistics
Al-FahyhyAl-SahwaAl-Tamryate
SurfaceSub-SurfaceSurfaceSub-SurfaceSurfaceSub-Surface
n193193170170217217
Min0.15310.20950.24450.22300.23300.3245
Max0.48940.54120.59190.63180.55630.6594
Mean0.30780.34860.39990.39940.39650.4793
Std. Dev.0.06660.06180.06330.07780.06550.0606
Median0.31000.33960.39700.39920.39630.4774
Skewness0.14510.40710.44960.2944−0.0020.1792
Kurtosis2.56332.87913.41902.97362.49183.0149
1st Quartile0.25980.30700.35620.33980.34770.4385
3rd Quartile0.34850.38820.43560.44960.44450.5186
n, the number of sampling locations.
Table 8. RMSE and SMD values of interpolation models used to generate the spatial distribution of SQI-MSD in the surface and sub-surface layers of the study sites.
InterpolationAl-FahyhyAl-SahwaAl-Tamryate
SurfaceSub-SurfaceSurfaceSub-SurfaceSurfaceSub-Surface
RMSE
IDW0.065690.063610.064650.074930.063870.05953
GPI0.223690.224030.077960.077960.065330.05941
RBF0.067050.065440.065900.074900.063200.05988
LPI0.065740.064520.061870.074340.065390.05890
Kriging (Ordinary):
Gaussian1.002740.992520.986951.004111.007221.01738
Spherical1.001120.992670.989681.009721.009241.01616
Exponential1.001510.991990.994050.999311.001291.01469
Kriging (Simple):
Gaussian0.998850.992520.993200.992750.994510.99566
Spherical0.997960.992670.993810.991860.995090.99398
Exponential0.997030.991990.996550.992220.992240.99698
Kriging (Universal):
Gaussian1.002741.002550.986951.004111.007221.01738
Spherical1.001121.018490.989681.009721.009241.01616
Exponential1.001511.002410.994050.999311.001291.01469
SMD
IDW0.00062−0.001460.00030−0.001050.002020.00134
GPI−0.00009−0.00052−0.00022−0.000220.000220.00046
RBF0.00030−0.000720.00018−0.000360.000620.00058
LPI0.001580.001280.002100.00305−0.00031−0.00146
Kriging (Ordinary):
Gaussian0.00310−0.001480.009840.012040.003400.00609
Spherical0.00614−0.000860.009990.013800.007770.00441
Exponential0.00344−0.001110.010100.999310.009870.00572
Kriging (Simple):
Gaussian0.00354−0.001480.00007−0.012580.019010.01003
Spherical0.00307−0.00086−0.00017−0.013590.020200.01004
Exponential0.00375−0.00111−0.00019−0.012720.016670.01124
Kriging (Universal):
Gaussian0.00310−0.012690.009840.012040.003400.00609
Spherical0.00614−0.018230.009990.013800.007770.00441
Exponential0.00344−0.012530.010100.011460.009870.00572
RMSE, root mean square error; SMD, standardized mean difference; IDW, inverse distance weight; GPI, global polynomial interpolation; RBF, radial basis functions; LPI, local polynomial interpolation.
Table 9. Percentage of the areal extension and total area of the different SQI-MDS categories in the study sites.
SQI-MDS
Category
Al-FahyhyAl-SahwaAl-Tamryate
%Area (ha)%Area (ha)%Area (ha)
Surface Layer (0–30 cm)
Very low28.31823.43.271508.16.321232.0
Low47.191372.461.4128,354.484.9616,567.9
Moderate23.84693.130.6014,127.88.081576.2
High0.5817.04.642141.70.64124.0
Very high 0.072.10.1043.9--
Sub-Surface Layer (30–60 cm)
Very low36.521062.111.965522.53.24630.8
low36.691067.046.9521,677.368.8813,431.2
Moderate25.11730.239.1018,053.625.875044.0
High1.6046.61.92887.61.78347.4
Very high0.072.10.0835.00.2446.6
SQI-MDS, soil quality index based on the minimum data set (MDS).
Disclaimer/Publisher’s Note: The statements, opinions and data contained in all publications are solely those of the individual author(s) and contributor(s) and not of MDPI and/or the editor(s). MDPI and/or the editor(s) disclaim responsibility for any injury to people or property resulting from any ideas, methods, instructions or products referred to in the content.