Article

Ecological Security Pattern Construction Based on Multi-Scenario Trade-Offs of Ecosystem Services: A Case Study of the Shiyang River Basin

1
School of Geography and Tourism, Shaanxi Normal University, Xi’an 710119, China
2
Northwest Institute of Eco-Environment and Resources, Chinese Academy of Sciences, Lanzhou 730000, China
3
Center for Environmental and Societal Sustainability, Gifu University, Gifu 501-1193, Japan
4
School of Biological and Environmental Engineering, Xi’an University, Xi’an 710065, China
5
School of Politics and Public Administration, Qinghai Minzu University, Xining 810007, China
6
Key Laboratory of Ecological Safety and Sustainable Development in Arid Lands, Northwest Institute of Eco-Environment and Resources, Chinese Academy of Sciences, Lanzhou 730000, China
*
Author to whom correspondence should be addressed.
Land 2025, 14(11), 2159; https://doi.org/10.3390/land14112159
Submission received: 26 September 2025 / Revised: 22 October 2025 / Accepted: 24 October 2025 / Published: 29 October 2025

Abstract

Constructing ecological security patterns (ESPs) from an ecosystem services perspective is critical for sustaining regional ecological stability. However, existing research often overlooks the complex trade-offs among multiple ecosystem services. This study focuses on the Shiyang River Basin, assessing four key ecosystem services in 2021: habitat quality, water yield, soil retention, and carbon sequestration. Ecological sources were identified using the Ordered Weighted Averaging (OWA) method. Subsequently, the minimum cumulative resistance model in conjunction with circuit theory was employed to delineate ecological corridors, identify pinch points, and detect barrier points. Spatial syntax analysis was employed to assess the network’s structural characteristics. The results revealed 46 ecological sources covering 12,336.34 km2 (29.7% of the study area), along with 94 corridors, 80 pinch points, and 39 barrier points. Based on these findings, a regional ecological framework—“Three Zones, Three Corridors, One Belt, and Multiple Points”—is proposed to guide ecosystem service optimization.

1. Introduction

Since the 20th century, continuous economic and social progress has enhanced human disruption of natural landscapes. As a result, natural areas have become increasingly fragmented, giving rise to environmental problems like landscape degradation and ecological disruption. Such transformations have inflicted severe damage on ecosystems, further intensifying the tension between environmental conservation and economic development. This dilemma highlights the urgency of adopting sustainable development strategies to balance ecological health and socioeconomic progress [1,2,3]. Derived from landscape ecology [4], the ecological security pattern (ESP) concept depicts a sustainable landscape structure that combines spatial configuration with ecological processes to sustain the integrity of ecosystem services [5].
An ESP is constructed by identifying ecological sources and establishing ecological corridors, together forming a connected ecological network composed of nodes, links, and patches. This network supports both ecological stability and sustainable socioeconomic development [6]. The typical framework for ESP construction involves three key steps: Ecological source identification, resistance surface generation, and ecological corridor delineation [7,8]. Acting as origin nodes for species migration and ecological processes [9], ecological sources play a decisive role in shaping corridor routes and the overall network configuration [10]. Many studies choose protected areas or scenic areas with significant ecological value as ecological sources [11]. Nonetheless, such methods frequently neglect ecological processes and spatial heterogeneity. More objective approaches integrate indicators including ecosystem services, ecological sensitivity [12,13,14], and morphological spatial pattern analysis (MSPA) [15,16]. A common limitation, however, is the assignment of equal weights to different indicators, which oversimplifies their relationships and neglects trade-offs. For example, provisioning and regulating ecosystem services frequently compete [17,18,19]. Ignoring these interactions can lead to flawed spatial planning and ineffective ecological protection. The Ordered Weighted Averaging (OWA) method addresses this challenge by assigning flexible weights to indicators based on their values and decision-makers’ risk preferences. When integrated with Geographic Information Systems (GIS), OWA becomes a practical tool for identifying ecological priority areas while accounting for trade-offs, thus aiding in balancing multiple conflicting goals in environmental planning [20,21,22]. Ecological corridors, as linear elements of the ESP, facilitate species movement and ecological flows. They are commonly identified using the Minimum Cumulative Resistance (MCR) model [23] or circuit theory. Some studies additionally apply algorithms such as ant colony optimization or genetic algorithms [24,25]. The circuit model conceptualizes species movement analogously to the random flow of electrons, enabling identification of broader and more realistic corridors, as well as critical areas like pinch points and barrier points, which are essential for ecological restoration [26]. Resistance surfaces represent the cost or difficulty for species migrating across different land cover types. They are often derived from land-use data but can be further refined by incorporating factors such as nighttime light intensity, ecological sensitivity, and terrain features [12,27,28]. While many studies focus on theoretical connectivity metrics, they often neglect species’ perceptions of distance and directionality, which influence movement behavior in real landscapes. To address this, spatial syntax provides a framework to analyze interactions between agents (e.g., species) and their environment [29]. Originally developed for studying human spatial behavior, spatial syntax holds potential for ecological network analysis by quantifying how network structures influence ecological processes and identifying key ecological areas more effectively [14,30].
In 2021, the Chinese government introduced the 14th Five-Year Plan and the National Territorial Spatial Planning Outline (2021–2035), emphasizing ecological protection and environmental restoration. The Shiyang River Basin, situated within a strategic area for constructing China’s national ecological barrier, is a typical arid inland basin characterized by severe water scarcity [31]. Rapid urbanization and population expansion have caused biodiversity decline, land degradation, and decreasing carbon sequestration [32,33], posing significant risks to regional ecological security. Accordingly, this research assesses four key ecosystem services: habitat quality, water production, carbon sequestration, and soil conservation. This evaluation aims to address the ecological challenges posed by rapid development, providing a scientific basis for regional sustainable planning. This study employs the OWA method to identify ecological priority areas, extracts ecological corridors and key nodes using the MCR and circuit models, and uses spatial syntax to analyze the network’s structural properties [34]. Based on these analyses, an optimized ecological security pattern is proposed, with management strategies tailored to local conditions to enhance ecosystem service provision and promote regional ecological recovery.

2. Materials and Methods

2.1. Study Area

The Shiyang River Basin lies in the eastern reaches of the Hexi Corridor, Gansu Province, bordered by the Yellow River to the west and the Qilian Mountains to the north. Covering approximately 41,200 km2, it extends between 101°22′–104°16′ E and 36°29′–39°27′ N, and ranks among the three major inland river basins within Gansu. Deep in the continental interior, the basin is subject to a temperate continental arid climate, marked by low precipitation, abundant solar radiation, and strong annual evaporation, as shown in Figure 1. This climatic condition exacerbates water scarcity, making the basin highly vulnerable to ecological degradation. Geographically, the terrain exhibits a general gradient from southern highlands to northern lowlands, sloping downward from southeast to northwest. The southern region is dominated by the Qilian Mountains, which harbor extensive alpine meadows and forest ecosystems. Glaciers from the Lenglong Ridge and parts of the Daxueshan Mountains, supplemented by atmospheric precipitation, serve as the primary water sources for the basin. The central basin area predominantly comprises plains that function as the main irrigated agricultural zone and human settlement area. Towards the north, the landscape transitions into low mountains and hills, with increasing susceptibility to desertification and large expanses of desertified land. Administratively, the basin encompasses three prefecture-level cities and eight counties within Gansu Province: fully covering Gulang County, Liangzhou District, and Minqin County of Wuwei City, parts of Tianzhu County; all of Yongchang County and Jinchuan District of Jinchang City; and portions of Sunan Yugur Autonomous County and Shandan County in Zhangye City. A dual-core urban development pattern has emerged, centered on Liangzhou and Jinchuan Districts, with urban populations concentrated therein as well as in Hexibao Town and county-level administrative centers. By the end of 2022, the basin’s population reached approximately 1.79 million, yielding a population density of 55 persons per km2—roughly 3 to 4 times greater than the broader Hexi region average. In several oasis areas, population density exceeds 300 persons per km2, a notably high figure for arid inland regions. Approximately 77% of the population relies on crop production, underscoring a strong dependence on the primary sector. Coupled with water scarcity and uneven spatial water distribution, ecological land has steadily diminished, resulting in reduced river and lake areas, biodiversity loss, and increasingly severe constraints on the basin’s ecological security and sustainable development.

2.2. Data Sources

Land use data were acquired from the European Space Agency (ESA) WorldCover dataset (https://esa-worldcover.org/en), accessed on 13 August 2024. DEM originated from the China Geospatial Data Cloud (http://www.gscloud.cn), accessed on 13 August 2024. Monthly evapotranspiration, precipitation, and soil data were sourced from the National Tibetan Plateau Data Center (https://data.tpdc.ac.cn/), accessed on 13 August 2024. NDVI data were obtained from the Resource and Environment Science and Data Center (https://www.resdc.cn/), accessed on 15 August 2024. Road network data were extracted from OpenStreetMap (https://www.openstreetmap.org/), accessed on 23 August 2024. All spatial datasets were reprojected to the WGS_1984_UTM_Zone_48N coordinate system. Subsequently, raster data were resampled to a uniform spatial resolution of 30 × 30 m using ArcMap, ensuring consistency for subsequent analyses. This study’s dataset summary is comprehensively presented in Table 1. To ensure temporal consistency for the year 2021, processing was required for datasets with monthly temporal resolution (precipitation, evapotranspiration, and NDVI). For the NDVI data, the maximum value composite (MVC) method was applied to generate the annual maximum NDVI value for 2021, which effectively represents the optimal vegetation growth conditions during that year. Additionally, the monthly precipitation and evapotranspiration data from all 12 months of 2021 were summed separately to create annual total precipitation and annual total evapotranspiration datasets for 2021.

2.3. Methods

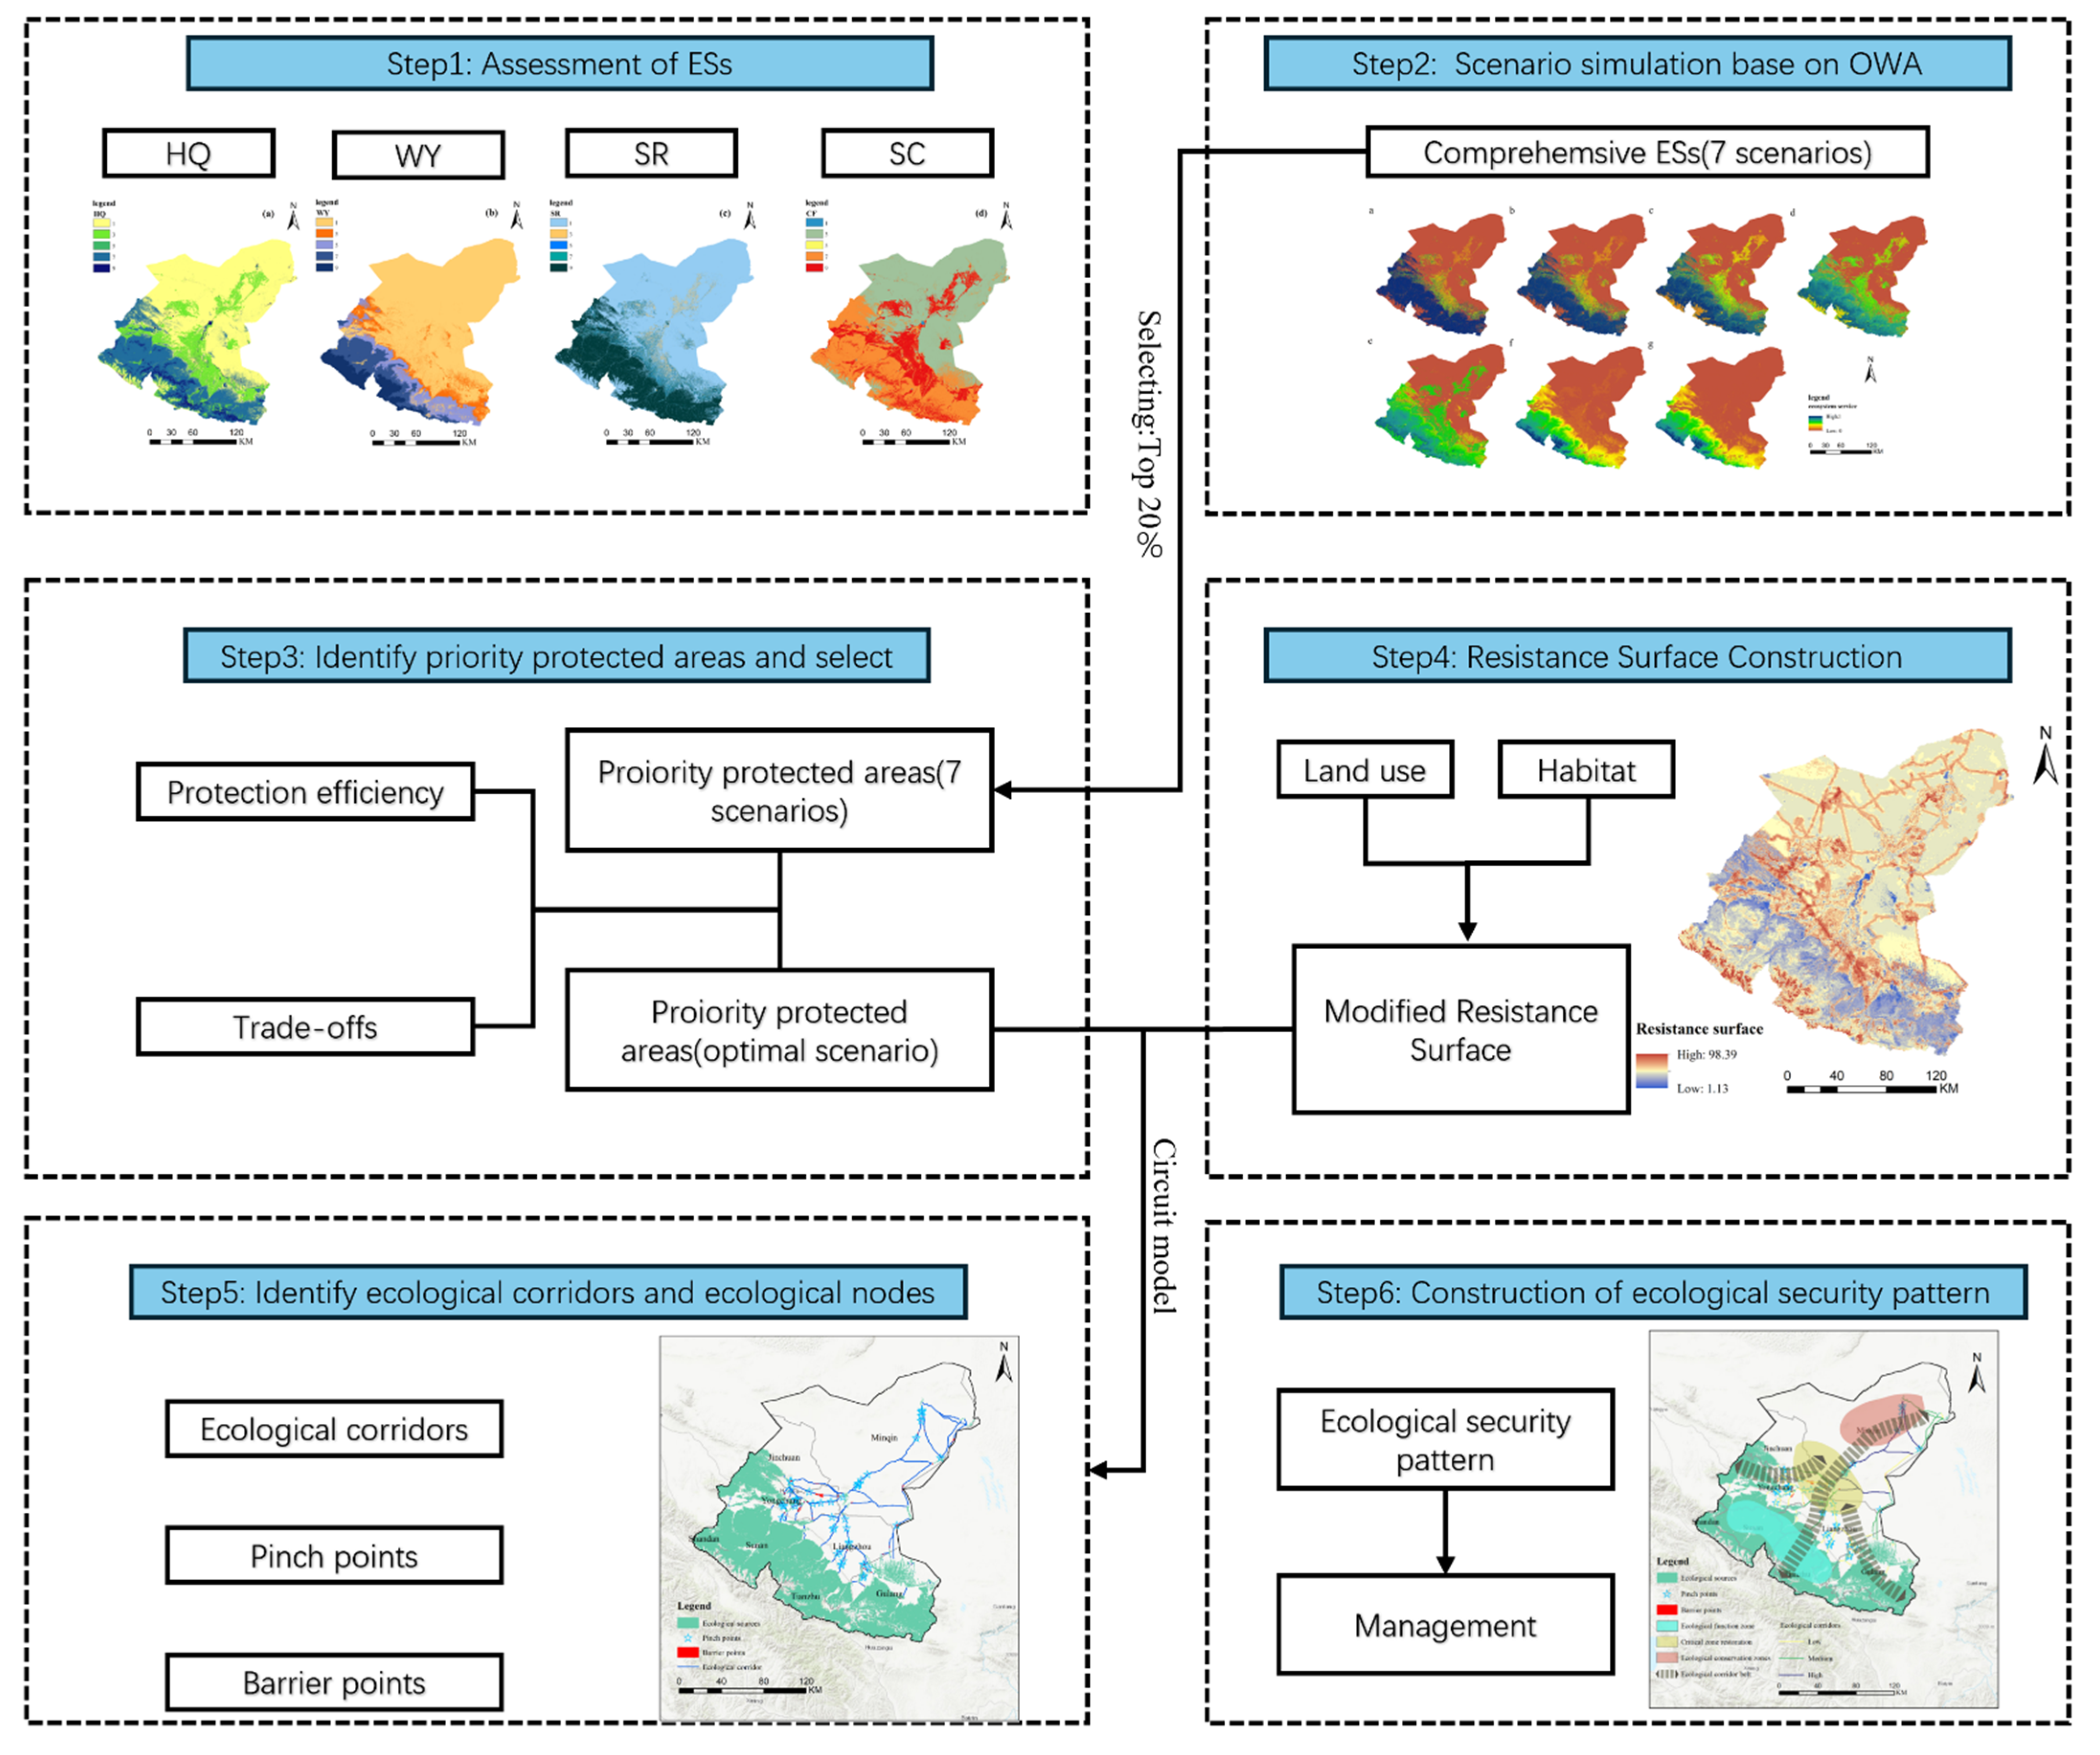
As shown in Figure 2, the construction of the ESP in the Shiyang River Basin involves the identification of ecological sources, resistance surfaces, ecological corridors, pinch points, and barrier points.

2.3.1. Evaluation of Ecosystem Service Importance

This study uses the InVEST model (Integrated Valuation of Ecosystem Services and Trade-offs) to quantify four essential ecosystem services within the research area. InVEST is designed to spatially visualize and quantify ecosystem service provision [35]. Its modular architecture allows independent operation of components with standardized input formats, offering flexibility for researchers to select modules based on their analytical needs [32,36]. The model produces spatially explicit raster or vector maps, which capture ecosystem service heterogeneity. Furthermore, parameters can be regionally calibrated to enhance result accuracy. Quantitatively assessing ecosystem services is critical for recognizing ecological sources, with areas exhibiting high service values generally being prioritized. This study selected four services—habitat quality, water yield, soil conservation, and carbon sequestration—based on three main considerations [37]. Alignment with problem-solving needs: As an arid inland river basin, the Shiyang River Basin faces primary ecological challenges such as water scarcity, land desertification, and biodiversity decline [33]. The four selected services directly correspond to the needs for addressing these issues. Data availability and quantification feasibility: Cultural services (e.g., aesthetic value, ecotourism) lack objective quantitative indicators, and relevant survey data in the study area are scarce. Pollination services depend on insect species distribution data, yet there is no systematic pollinator monitoring data within the basin, making accurate assessment difficult. Relevance to agriculture: 77% of the basin’s population relies on agriculture. Water yield (which ensures irrigation) and soil conservation (which prevents farmland erosion) already directly support agricultural sustainability, while the ecological contribution of pollination services can be indirectly reflected through habitat quality.
The four ecosystem service layers were normalized using the range method in ArcGIS, scaling values between 0 and 1 to facilitate further analysis. The specific table of key parameters regarding the four ecosystem services is as follows:
(1)
Habitat Quality
The Habitat Quality Module InVEST model requires designating specific land use types as threat factors that degrade habitat quality. It establishes connections between various land use types and these threat factors, then evaluates the distribution and degradation of habitat quality under different land use types based on the response of different habitats (i.e., land use types) to the threat factors. Changes in the Habitat Quality Index (HQI) can reflect the impact of land use pattern changes on habitat quality. This study comprehensively considers the practical application of the InVEST model and combines existing data [38] to identify three land use types—Cropland, Built-up, and bare land—as threat factors. The impact weights and maximum impact ranges of these three threat factors are assigned with reference to the values recommended by the model and on-site conditions. Each land use type corresponds to a type of habitat, and its habitat quality is related to its own habitat suitability and sensitivity to threat factors. Higher habitat suitability of a habitat type results in better corresponding habitat quality; greater sensitivity to threat factors means weaker anti-disturbance ability and a lower Habitat Quality Index. By referring to the values recommended by the model, and comprehensively considering relevant studies and on-site conditions, the habitat suitability of each habitat type and its sensitivity to threat factors are determined as shown in Table 2 and Table 3.
(2)
Water Yield
According to the InVEST Model Guidelines, the Water Yield Module is an estimation method based on the principle of water balance and targeting grid cells. The detailed working principle is as follows: At the corresponding grid cell scale, the water yield at the grid cell scale is obtained by calculating the difference between the corresponding precipitation and the corresponding actual evapotranspiration. Among them, actual evapotranspiration mainly includes vegetation evaporation and surface transpiration [39]. The calculation equation is as follows:
Y x = 1 A E T x P x × P ( x )
In the formulas above: Y x represents the annual water yield of each grid cell x; A E T x is the annual actual evapotranspiration of each grid cell x; and P x is the annual precipitation of each grid cell x. Among them, the evapotranspiration component A E T x P x is calculated based on the hydrothermal coupling equilibrium assumption proposed by Budyko, i.e., [40], the ratio of actual evapotranspiration to precipitation. The water yield parameter settings in this study were set with reference [17] to and in combination with relevant studies, as shown in Table 4.
(3)
Soil Retention
Soil retention service belongs to the regulating services in ecosystem services. Soil retention is mainly achieved through soil fixation by plant roots and the interception and buffering effect of vegetation on precipitation. The assessment of soil conservation service focuses on the ecosystem’s ability to prevent soil erosion and maintain soil fertility. Effective soil conservation service can prevent soil loss, maintain soil quality, and enhance productivity. The formula is as follows:
R K L S i = R i × K i × L S i
U S L E i = R i × K i × L S i × C i × P i
S E D R E T i = R K L S i U S L E i + s e d _ e i
s e d _ e i = s e i y 1 i 1 U L S E y z = y + 1 i 1 ( 1 s e z )
In the formulas above: R K L S i refers to the potential soil erosion amount, with the unit of t/grid cell; U S L E i represents the actual soil erosion amount, with the unit of t/grid cell; S E D R E T i denotes the soil retention amount, with the unit of t; s e d _ e i is the total amount of sediments intercepted upstream, with the unit of t; L S i is the slope length and steepness factor; C i is the vegetation cover factor; P i is the soil and water conservation measure factor; s e i is the sediment interception rate; s e z is the sediment interception rate on upstream grid cell z; U S L E i is the amount of sediment generated by upstream grid cell y. The parameter settings of the soil retention module in this study were set with reference to and in combination with relevant studies [17] and the model’s recommended values, as shown in the Table 5.
(4)
Carbon Sequestration
The Carbon Storage Module of the InVEST model divides the carbon storage of ecosystems into four basic carbon pools: the aboveground biomass carbon pool (carbon in all living plant materials above the soil), the belowground biomass carbon pool (carbon in the living root systems of plants), the soil carbon pool (organic carbon distributed in organic soils and mineral soils), and the dead organic carbon pool (carbon in litter, fallen or standing dead trees). According to the classification of land use, the average carbon density of the aboveground carbon pool, belowground carbon pool, soil carbon pool, and dead organic carbon pool for different land use types is calculated and counted, respectively. Then, the area of each land use type is multiplied by its carbon density, and the results are summed up to obtain the total carbon storage of the study area. The calculation formula is as follows:
C t = C a + C b + C s + C d
In the formulas above: In the equation, C t refers to the total carbon storage of the watershed, with the unit of t/hm2; C a refers to the aboveground carbon storage, with the unit of t/hm2; C b refers to the belowground carbon storage, with the unit of t/hm2; C s refers to the soil carbon storage, with the unit of t/hm2; and C d refers to the dead organic carbon storage, with the unit of t/hm2. According to the model user manual, the assumption made by the Carbon Storage Module in the InVEST model is that the carbon density of a specific land use type is regarded as a constant. The carbon density data in this study were obtained from the model manual, as shown in the Table 6 below.

2.3.2. OWA-Based Priority Area Scenario Simulation

(1)
Principle of the OWA Method
The Ordered Weighted Averaging (OWA) method, introduced by Yager [41], is a multi-criteria decision-making approach that assigns flexible weights to indicators according to decision-makers’ risk preferences [42]. Weight assignment occurs in two stages: order weights and criterion weights. By adjusting a risk coefficient, multiple aggregation scenarios can be generated, reflecting different trade-off attitudes. In the context of identifying priority conservation areas, each ecosystem service raster is processed in a GIS environment where the OWA operator aggregates the layers under various risk levels to yield multiple scenarios. Priority areas are selected based on predefined thresholds. The OWA operator is mathematically defined as:
O W A X i j = j n w i S i j   w i 0,1   a n d   i n w i = 1 ,   f o r   i   a n d   j = 1,2 , 3 , , n )  
In the formula, X i j is defined as the set of attribute values at the i -th location on the j -th standardized raster layer. S i j represents the new dataset comprising n ecosystem service raster values derived from descending order sorting of X i j , where w i signifies the ranking weight assigned to the i -th dataset S i j .
(2)
Identification Steps for Priority Areas
① The four ecosystem service indicators were first standardized to the [0, 1] range using range normalization and then ranked in descending order based on mean values.
② For each decision risk coefficient, order weights w i were computed by:
w i = ( i n ) a i 1 n a , i = 1,2 , 3 , n   a n d   a ( 0 , )
The trade-off level was quantified as:
t r a d e o f f = 1 n i n ( w i 1 n ) 2 n 1 , 0     tradeoff     1
In the formulas above: i is the rank order; a is the risk coefficient, reflecting the decision-maker’s perception of uncertainty in indicator values and subjective weight preferences, with a domain of (0, ∞); tradeoff represents the degree of balance among the indicators under different risk levels; w i denotes the order weight assigned to the i -th ecosystem service raster. Setting α = 1 yields equal weights (neutral preference), while α < 1 emphasizes indicators with higher mean values (optimistic attitude), and α > 1 emphasizes lower values (pessimistic attitude). Extreme cases at α = 0.0001 and α = 100,000 represent single-indicator dominance scenarios. For example, when α = 0.0001, weights are concentrated on the highest-value ecosystem services, and ecological priority areas only select “high-value areas for a single service” (high carbon sequestration forestlands in the southern Qilian Mountains). This scenario ignores trade-offs between services, which may lead to the neglect of other services. When α = 100,000, weights are concentrated on the lowest-value services, and priority areas tend to be “safe areas where all services meet or exceed the threshold” (low-disturbance grasslands on the edge of the central oases). This scenario is excessively conservative and may result in the exclusion of high-value ecological areas. Following Gou et al. [43], seven α values were evaluated: 0.0001, 0.1, 0.5, 1, 2, 10, and 100000. GIS-based weighted aggregation was performed under each risk scenario to generate respective spatial priority maps.
③ Priority zones were classified into five categories, with the top two categories selected for each scenario. Final ecological sources were identified through comprehensive consideration of protection efficiency and trade-offs. Protection efficiency E S i for each service was calculated as
E i = E S i E S 0
E S i denotes the mean value of the i -th ecosystem service in the priority area, while E S 0 represents the mean value of the same service throughout the whole study area.

2.4. Ecological Network Construction

2.4.1. Basic Resistance Surface

Resistance surfaces quantify the spatial variation in movement resistance encountered by organisms, reflecting landscape heterogeneity’s impact on species dispersal and energy flow [44], as shown in Table 7. Habitat quality, strongly correlated with species richness, influences both habitat suitability and migration difficulty [45]. In this step, resistance values were determined by integrating land use types and assessing habitat quality to establish the baseline resistance surface. The classification scheme and corresponding resistance values are summarized in Table 2.

2.4.2. Resistance Surface Modification

Ecological sensitivity denotes the extent to which ecosystems react to natural or anthropogenic disturbances, as shown in Table 8. It reflects the probability of ecological issues arising under stress [46]. The Shiyang River Basin, identified as a fragile region in northwest China, faces severe water scarcity and land degradation. Consequently, it is considered highly ecologically sensitive. To account for these conditions, an ecological sensitivity index was employed to adjust the resistance surface. Five factors were selected: land use/cover type, soil erodibility, road buffer zones, NDVI (Normalized Difference Vegetation Index), and elevation. Details of the classification are presented in Table 3. The modified resistance surface was computed using the following formula:
R i = R × S L i S L m e a n
In the formula, R i represents the revised ecological resistance value, R denotes the basic resistance surface, S L i is the ecological sensitivity value corresponding to raster cell i , and S L m e a n is the mean ecological sensitivity across the study area.

2.4.3. Ecological Corridor Delineation and Key Areas Detection

Ecological corridors act as spatial linkages between ecological sources and constitute a crucial element in the construction of the ESP. They enable species migration and energy circulation across landscapes [47]. This research applied the MCR model and circuit theory to extract ecological corridors and identify critical pinch points and barrier sites. The MCR model emphasizes optimal migration paths, while circuit theory simulates multi-path ecological flows, providing a comprehensive view of landscape connectivity. The Linkage Mapper toolkit and Circuitscape software were utilized, with the previously derived resistance surface and ecological source serving as inputs to calculate corridors, pinch points, and barriers.
(1)
Ecological Corridor Extraction
The MCR model operates on the principle that species expend energy while migrating. Through allocating resistance values to various landscape categories, the model computes the minimum cumulative cost required for species dispersal from a source area to any spatial position. The model is expressed as:
M C R = f m i n j = n i = m ( D i j × R i )
where D i j represents the dispersal distance of a species from ecological source i to landscape unit j ; R i is the resistance value of landscape unit i ; MCR denotes the minimum cumulative resistance for species dispersal from the source to a given spatial location; and the function f reflects a direct proportional relationship between MCR and the product D i j × R i , serving as a monotonic increasing function.
(2)
Identification of Key Areas Based on the Circuit Model
Circuit theory combines concepts from physics and ecology, modeling species movement as random walks through a heterogeneous landscape [48]. Landscape elements are conceptualized as nodes and resistors in an electrical circuit, with varying conductance values. Ecological corridors connecting source areas act as pathways through which ‘current’—analogous to species flow—passes. Areas exhibiting high current density indicate likely routes of species movement and are identified as pinch points critical for maintaining connectivity. Conversely, barrier points are areas that obstruct species dispersal; their removal or restoration would significantly enhance connectivity between source areas [49]. This study considers identified pinch points and barrier points as critical elements of the ESP, with their targeted conservation and rehabilitation expected to effectively strengthen ecosystem service resilience [50]. This methodology not only improves landscape connectivity but also furnishes a scientific basis for prioritizing ecological restoration initiatives in vulnerable regions.

2.4.4. Ecological Network Evaluation Based on Space Syntax

This study employs Space Syntax theory, utilizing the spatial design network analysis tool with Euclidean distance as the metric. Three quantitative indicators—Mean Euclidean Distance (MED), Network Quantity Penalized by Distance of Euclidean (NQPDE), and Two Phase Betweenness (TPBt)—are selected to evaluate the structure of the ecological network [51]. With equal influence assumed, these indicators undergo normalization and integration via superposition analysis for evaluating the relative importance of ecological corridors in the overall network.

2.4.5. NQPDE

NQPDE quantifies the degree of spatial dispersion or aggregation of a corridor relative to others. Higher values indicate stronger topological integration and greater accessibility within the network. The formula is:
N Q P D E i = j i 1 d i j
where d i j denotes the Euclidean distance between nodes i and j .

2.4.6. TPBt

Betweenness centrality measures the probability that traffic flows traverse a given corridor within the network. Larger TPBt values suggest greater potential for the corridor to serve as a conduit for energy flow within the ecological network. Its calculation is:
T P B t i = s t σ s t ( i ) σ s t
where σ s t is the total number of shortest paths from node s to node t , and σ s t is the number of shortest paths passing through node i .

2.4.7. MED

MED represents the average shortest distance from a given node to all others, reflecting relative accessibility within the network. It is computed as:
M E D i = 1 n 1 j i d i j
where n denotes the total number of nodes in the network, and d i j represents the Euclidean distance between nodes i and j .

3. Results

3.1. Ecosystem Service Assessment and Multi-Scenario Simulation

3.1.1. Spatial Pattern of Ecosystem Services

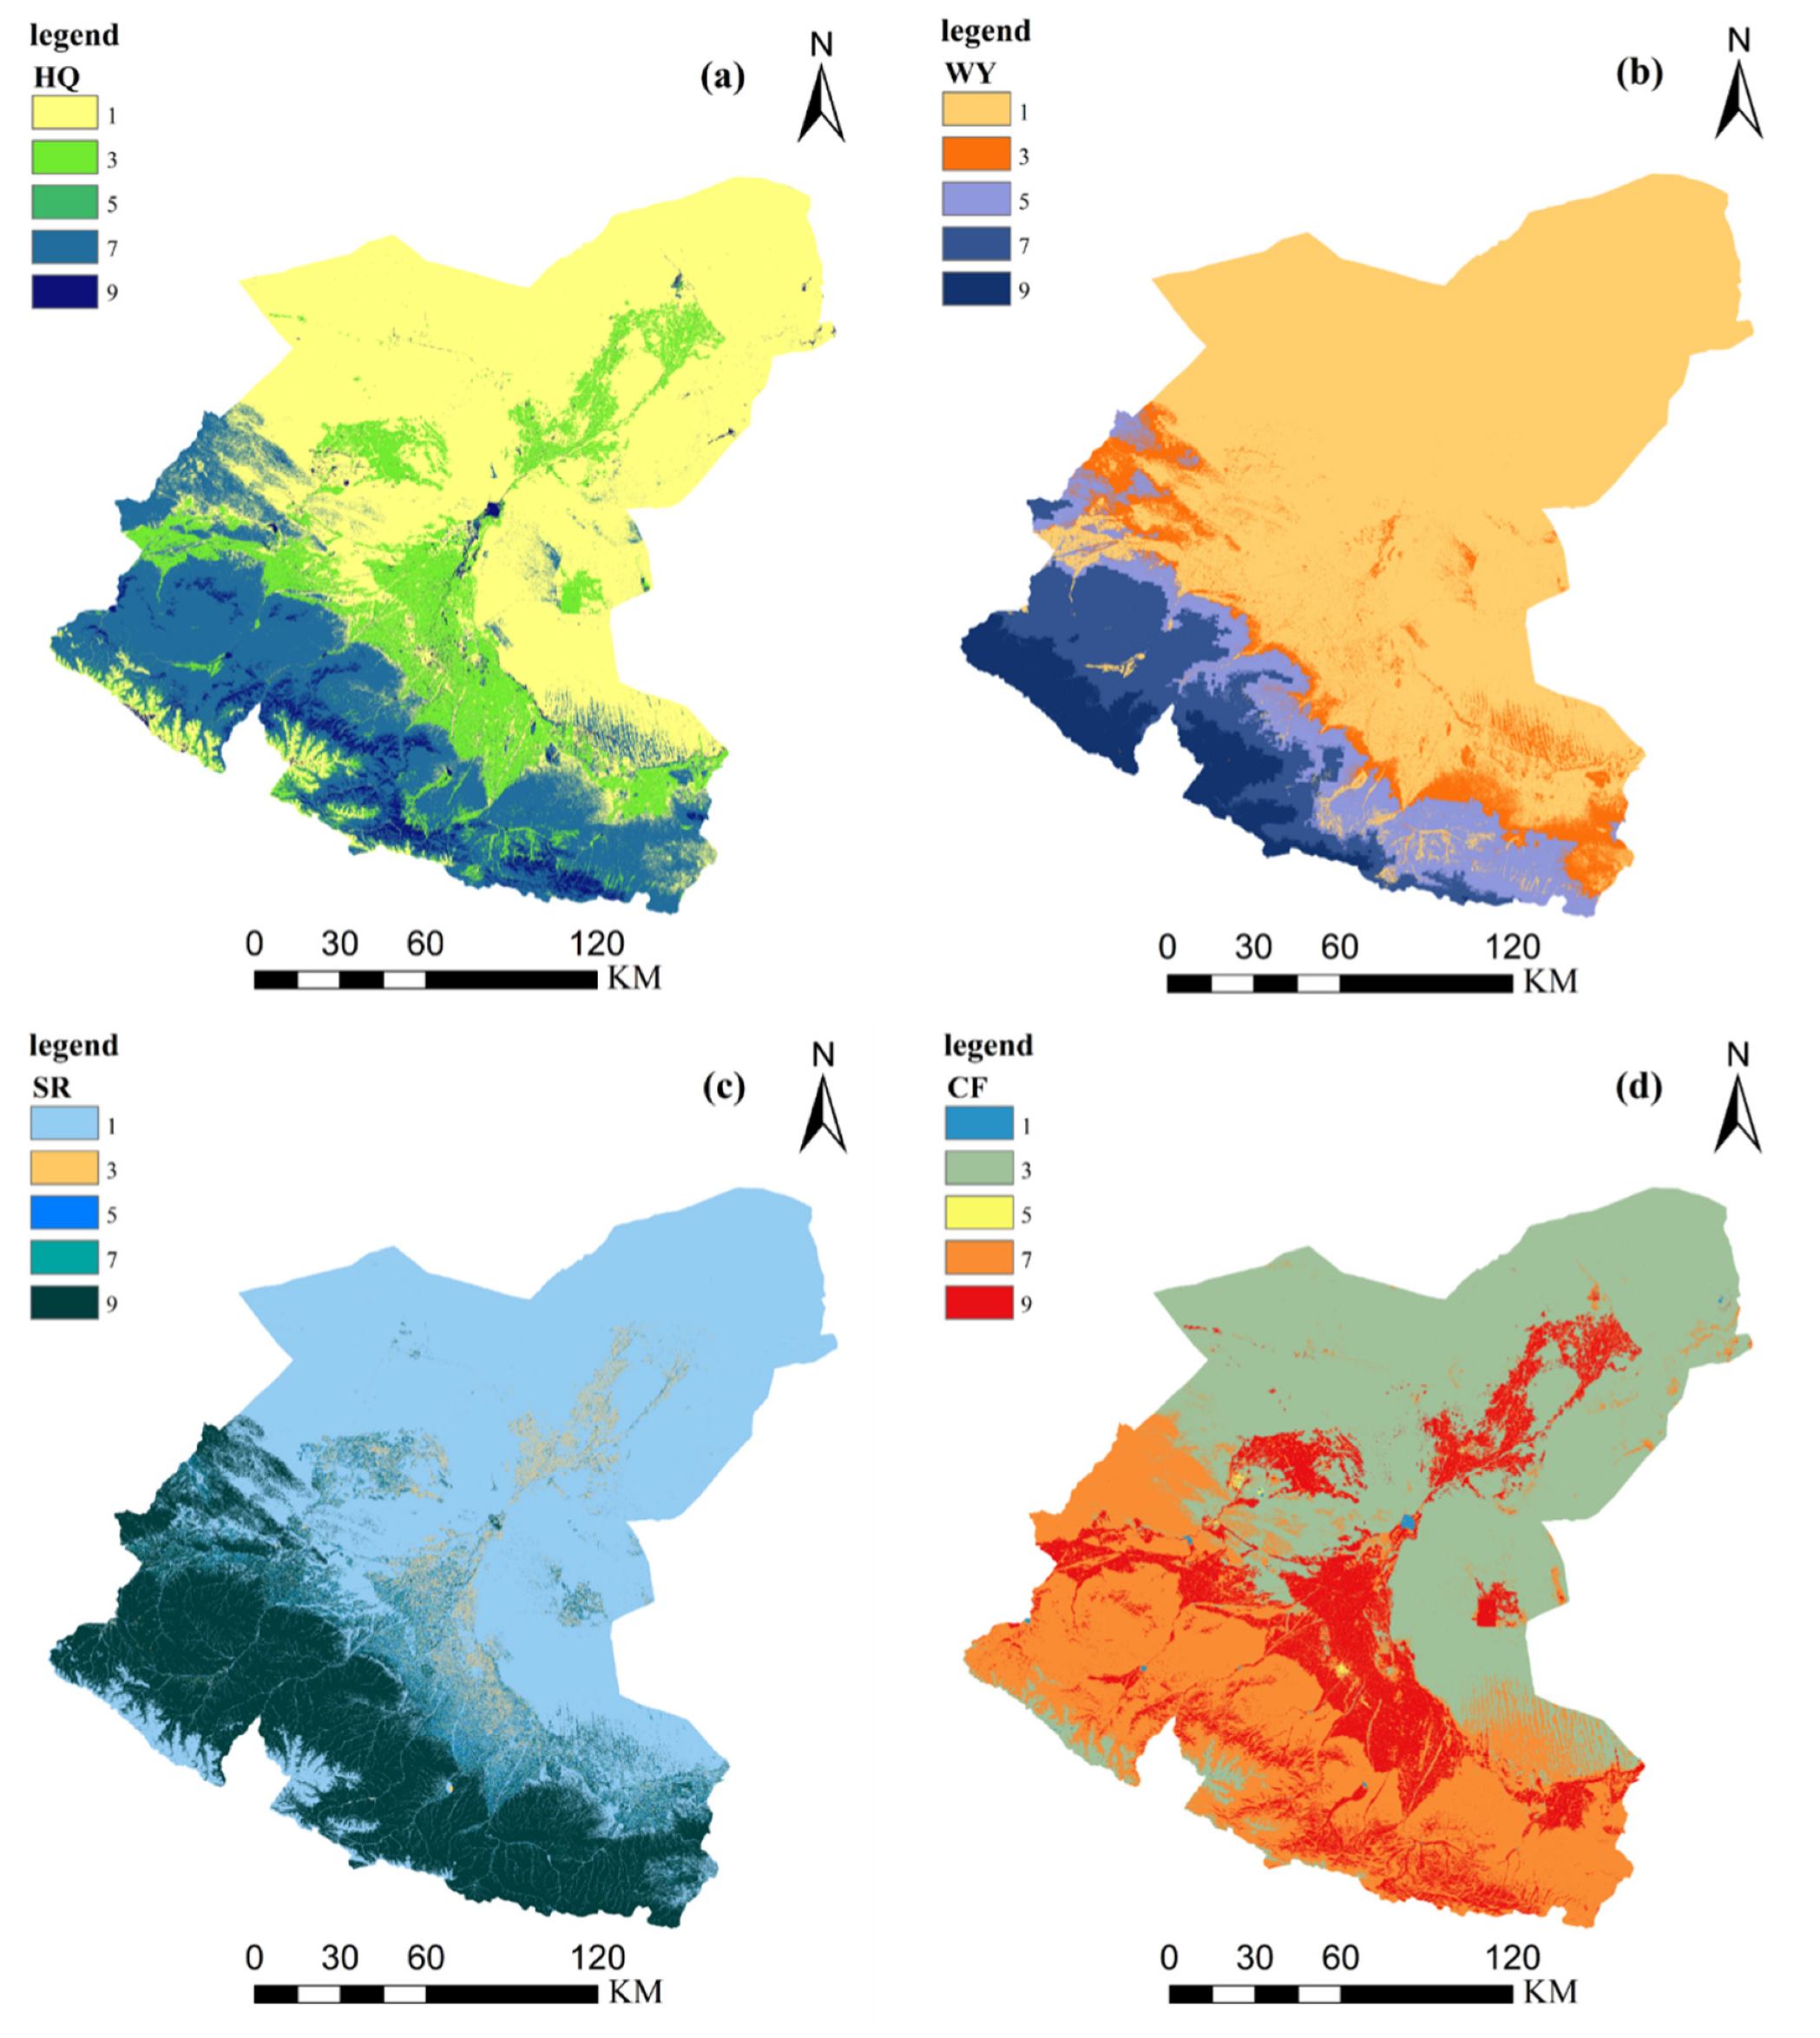
The evaluation outcomes of the four ecosystem services were standardized to a 0–1 scale. The classification scheme was defined as follows: 1 corresponds to “very unimportant”, 3 to “unimportant”, 5 to “moderately important”, 7 to “important”, and 9 to “very important”, as shown in Figure 3 and Table 9.
Overall, the high-value ecosystem service areas in the Shiyang River Basin are mainly concentrated in the southern upstream regions, whereas low-value areas are predominantly distributed in the northern downstream parts. There is a clear spatial gradient of ecosystem service values decreasing from southwest to northeast. Particularly, areas featuring high habitat quality are predominantly situated in Sunan and Tianzhu Counties. These mountainous areas experience relatively low human disturbance, providing favorable habitats for wildlife. Conversely, low habitat quality is chiefly found in Minqin County, characterized by low elevation, arid desert and hilly landscapes, severe water scarcity, and intense human activities, all of which have accelerated oasis desertification. High water yield values are concentrated mainly in the southern parts of Sunan and Tianzhu counties, with limited occurrences in western Yongchang County. Low water yield areas dominate the central and northern basin, indicating significant north–south disparities. Soil retention capacity is highest in the southern regions of Tianzhu, Sunan, Gulang, Wuwei, and western Yongchang. In contrast, the central plain—subject to intense human activity—and the northern desert region display poor soil retention. High carbon sequestration capacity is mainly distributed in Tianzhu County, southwestern Wuwei City, Jinchang City, and central Minqin County, often forming belt-like patterns along river corridors.

3.1.2. Priority Area Scenario Simulation Based on OWA

Using the 2021 ecosystem service data, seven scenarios were generated by assigning varying decision risk coefficients. The corresponding order weights for each scenario were calculated (Table 10), and ecosystem service raster maps were produced accordingly. The spatial distributions under different scenarios are shown in Figure 4. In Scenarios 1 to 3, high-value zones predominantly aggregate in the southwestern sector of the basin, with a gradual expansion of high-value zones towards the northwest. In Scenarios 4 and 5, high-value areas appear more dispersed compared to the earlier scenarios, while the extent of high-value zones in the northwest begins to diminish. Scenarios 6 and 7 display clustered high-value ecosystem service areas, with an increasing contrast between the southwest and northeast regions. The northwest is almost entirely dominated by low-value areas. Scenarios 1 and 7 represent the extremes of decision risk preferences. Overall, ecosystem service distribution shifts from predominantly high-value aggregation in Scenario 1 to low-value aggregation in Scenario 7.

3.1.3. Priority Conservation Areas and Protection Efficiency Under Different Scenarios

Using the natural breaks method, ecosystem service values were classified into five categories. The top two categories in each of the seven scenarios were selected as priority conservation areas. The protection efficiency for each ecosystem service under different scenarios was then calculated. As shown in Table 11, protection efficiency improved overall in Scenarios 1 through 5 (E > 1), while carbon sequestration efficiency declined in Scenarios 6 and 7 (E < 1). Among the scenarios, Scenario 4 yielded the highest protection efficiency for soil retention (E = 2.97) and habitat quality (E = 2.68). Scenario 5 demonstrated the highest protection efficiency for water yield (E = 4.3) and carbon sequestration (E = 1.42). On average, Scenario 5 achieved the highest overall protection efficiency across all ecosystem services, with a mean efficiency value of 2.53. Considering the nature of the Shiyang River Basin as an arid inland basin, water scarcity is the core ecological constraint. The water yield protection efficiency of Scenario 5 (3.27) is significantly higher than that of Scenario 4 (2.73 when considering the average value). Moreover, Scenario 5 achieves the highest overall protection efficiency across all ecosystem services, with an average efficiency value of 2.53. In terms of the trade-off degree, the trade-off value under Scenario 4 represents an ideal state (where the weights of different ecosystem services are equal). Although the trade-off value of Scenario 5 is 0.678, it still remains at a moderately high level. Comprehensively, the ecosystem service conservation areas identified in Scenario 5 should be selected as the priority ecological conservation zones.

3.2. ESP Construction

3.2.1. Ecological Source

Small habitat patches are more vulnerable to landscape fragmentation and edge effects due to their limited internal habitat area, which increases overall ecological resistance [52]. Accordingly, corresponding to previous studies [20,46], patches smaller than 5 km2 were excluded. Eventually, 46 ecological sources were pinpointed, encompassing a total area of 12,336.34 km2, representing approximately 29.7% of the study region. These ecological sources show a primary clustering in the southern part of the basin, demonstrating a contiguous and aggregated spatial distribution. Regarding land use composition, grassland dominates these source areas (76.7%), followed by cultivated land (15.7%) and forest land (7.6%).

3.2.2. Resistance Surface Construction

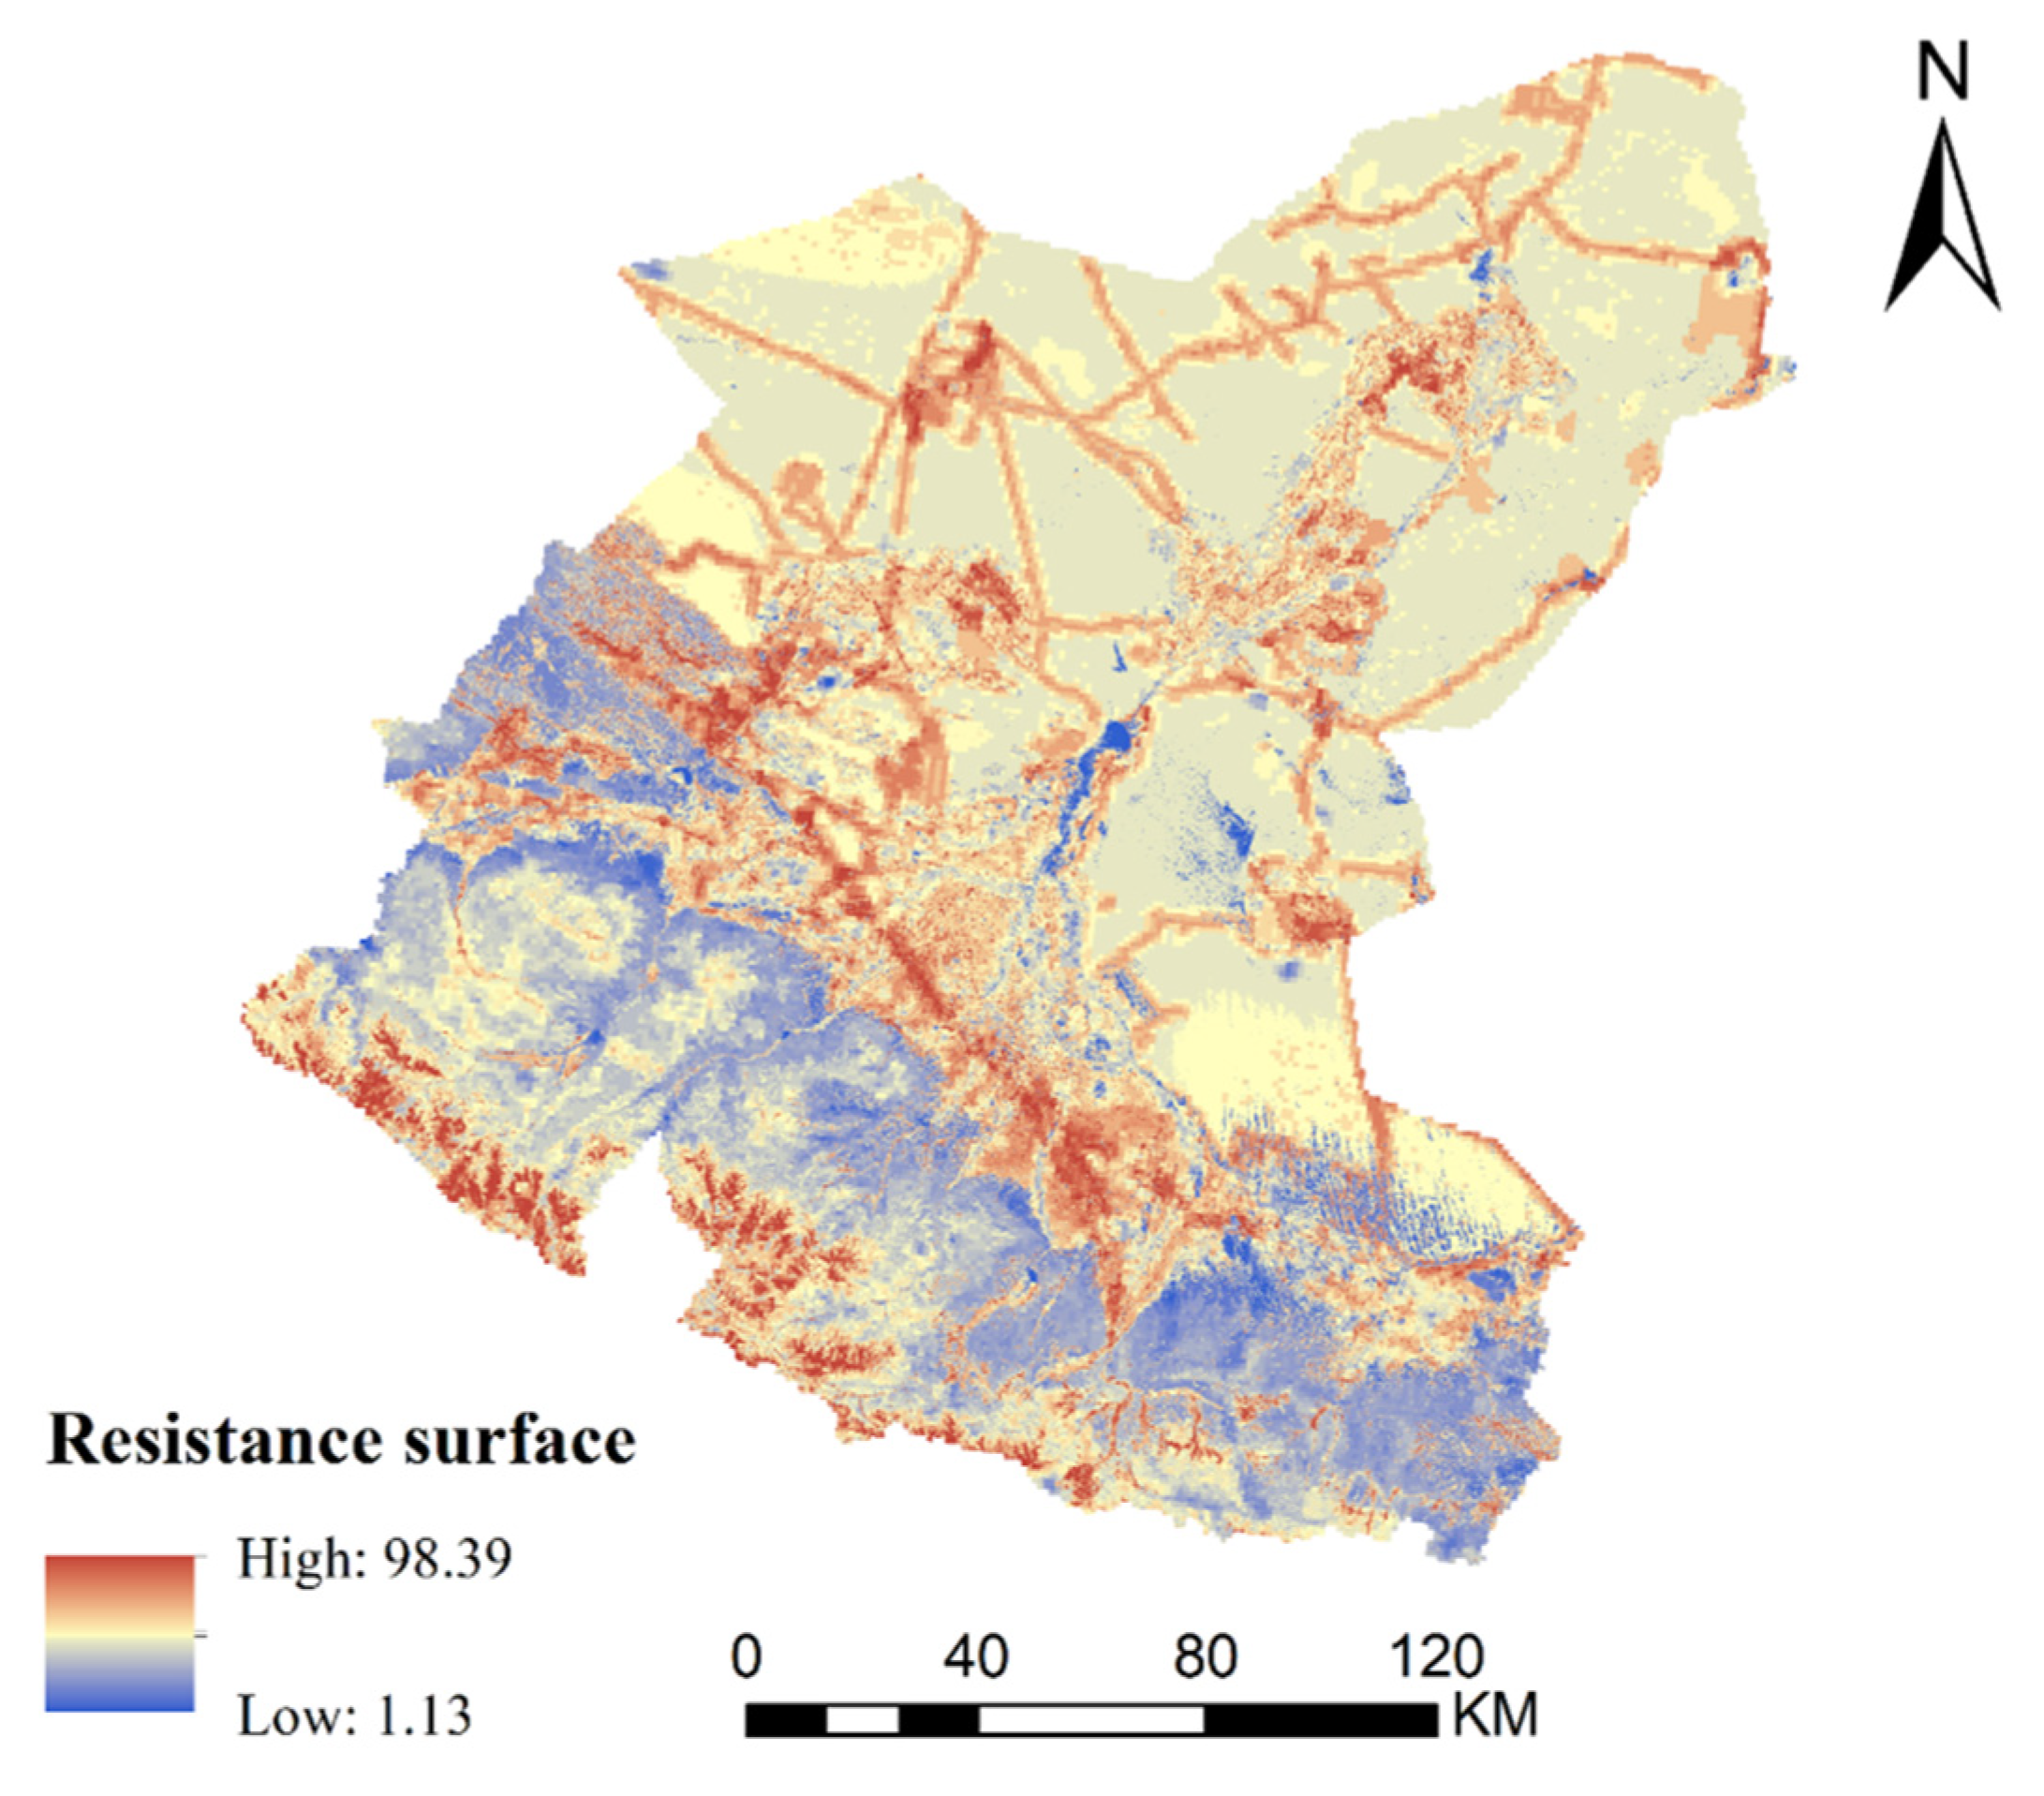
The foundational resistance surface was further refined by incorporating ecological sensitivity, resulting in the final resistance surface. The maximum, minimum, and average resistance values were 98.39, 1.12, and 29.90, respectively. High-resistance zones are primarily located in urban centers with dense populations, along major roads and railways, and in regions dominated by bare land and intensive agriculture. Representative examples include the urban areas of Wuwei City and Yongchang County, the central cultivated lands of Minqin County, and the southern bare land zones of Sunan and Tianzhu Counties. These areas exhibit poor ecological conditions that impede species movement and ecological connectivity. Conversely, low-resistance areas are predominantly distributed in the northern parts of Tianzhu and Sunan Counties, where grasslands prevail, river networks are dense, and ecological conditions are favorable for species dispersal and interaction, as shown in Figure 5.

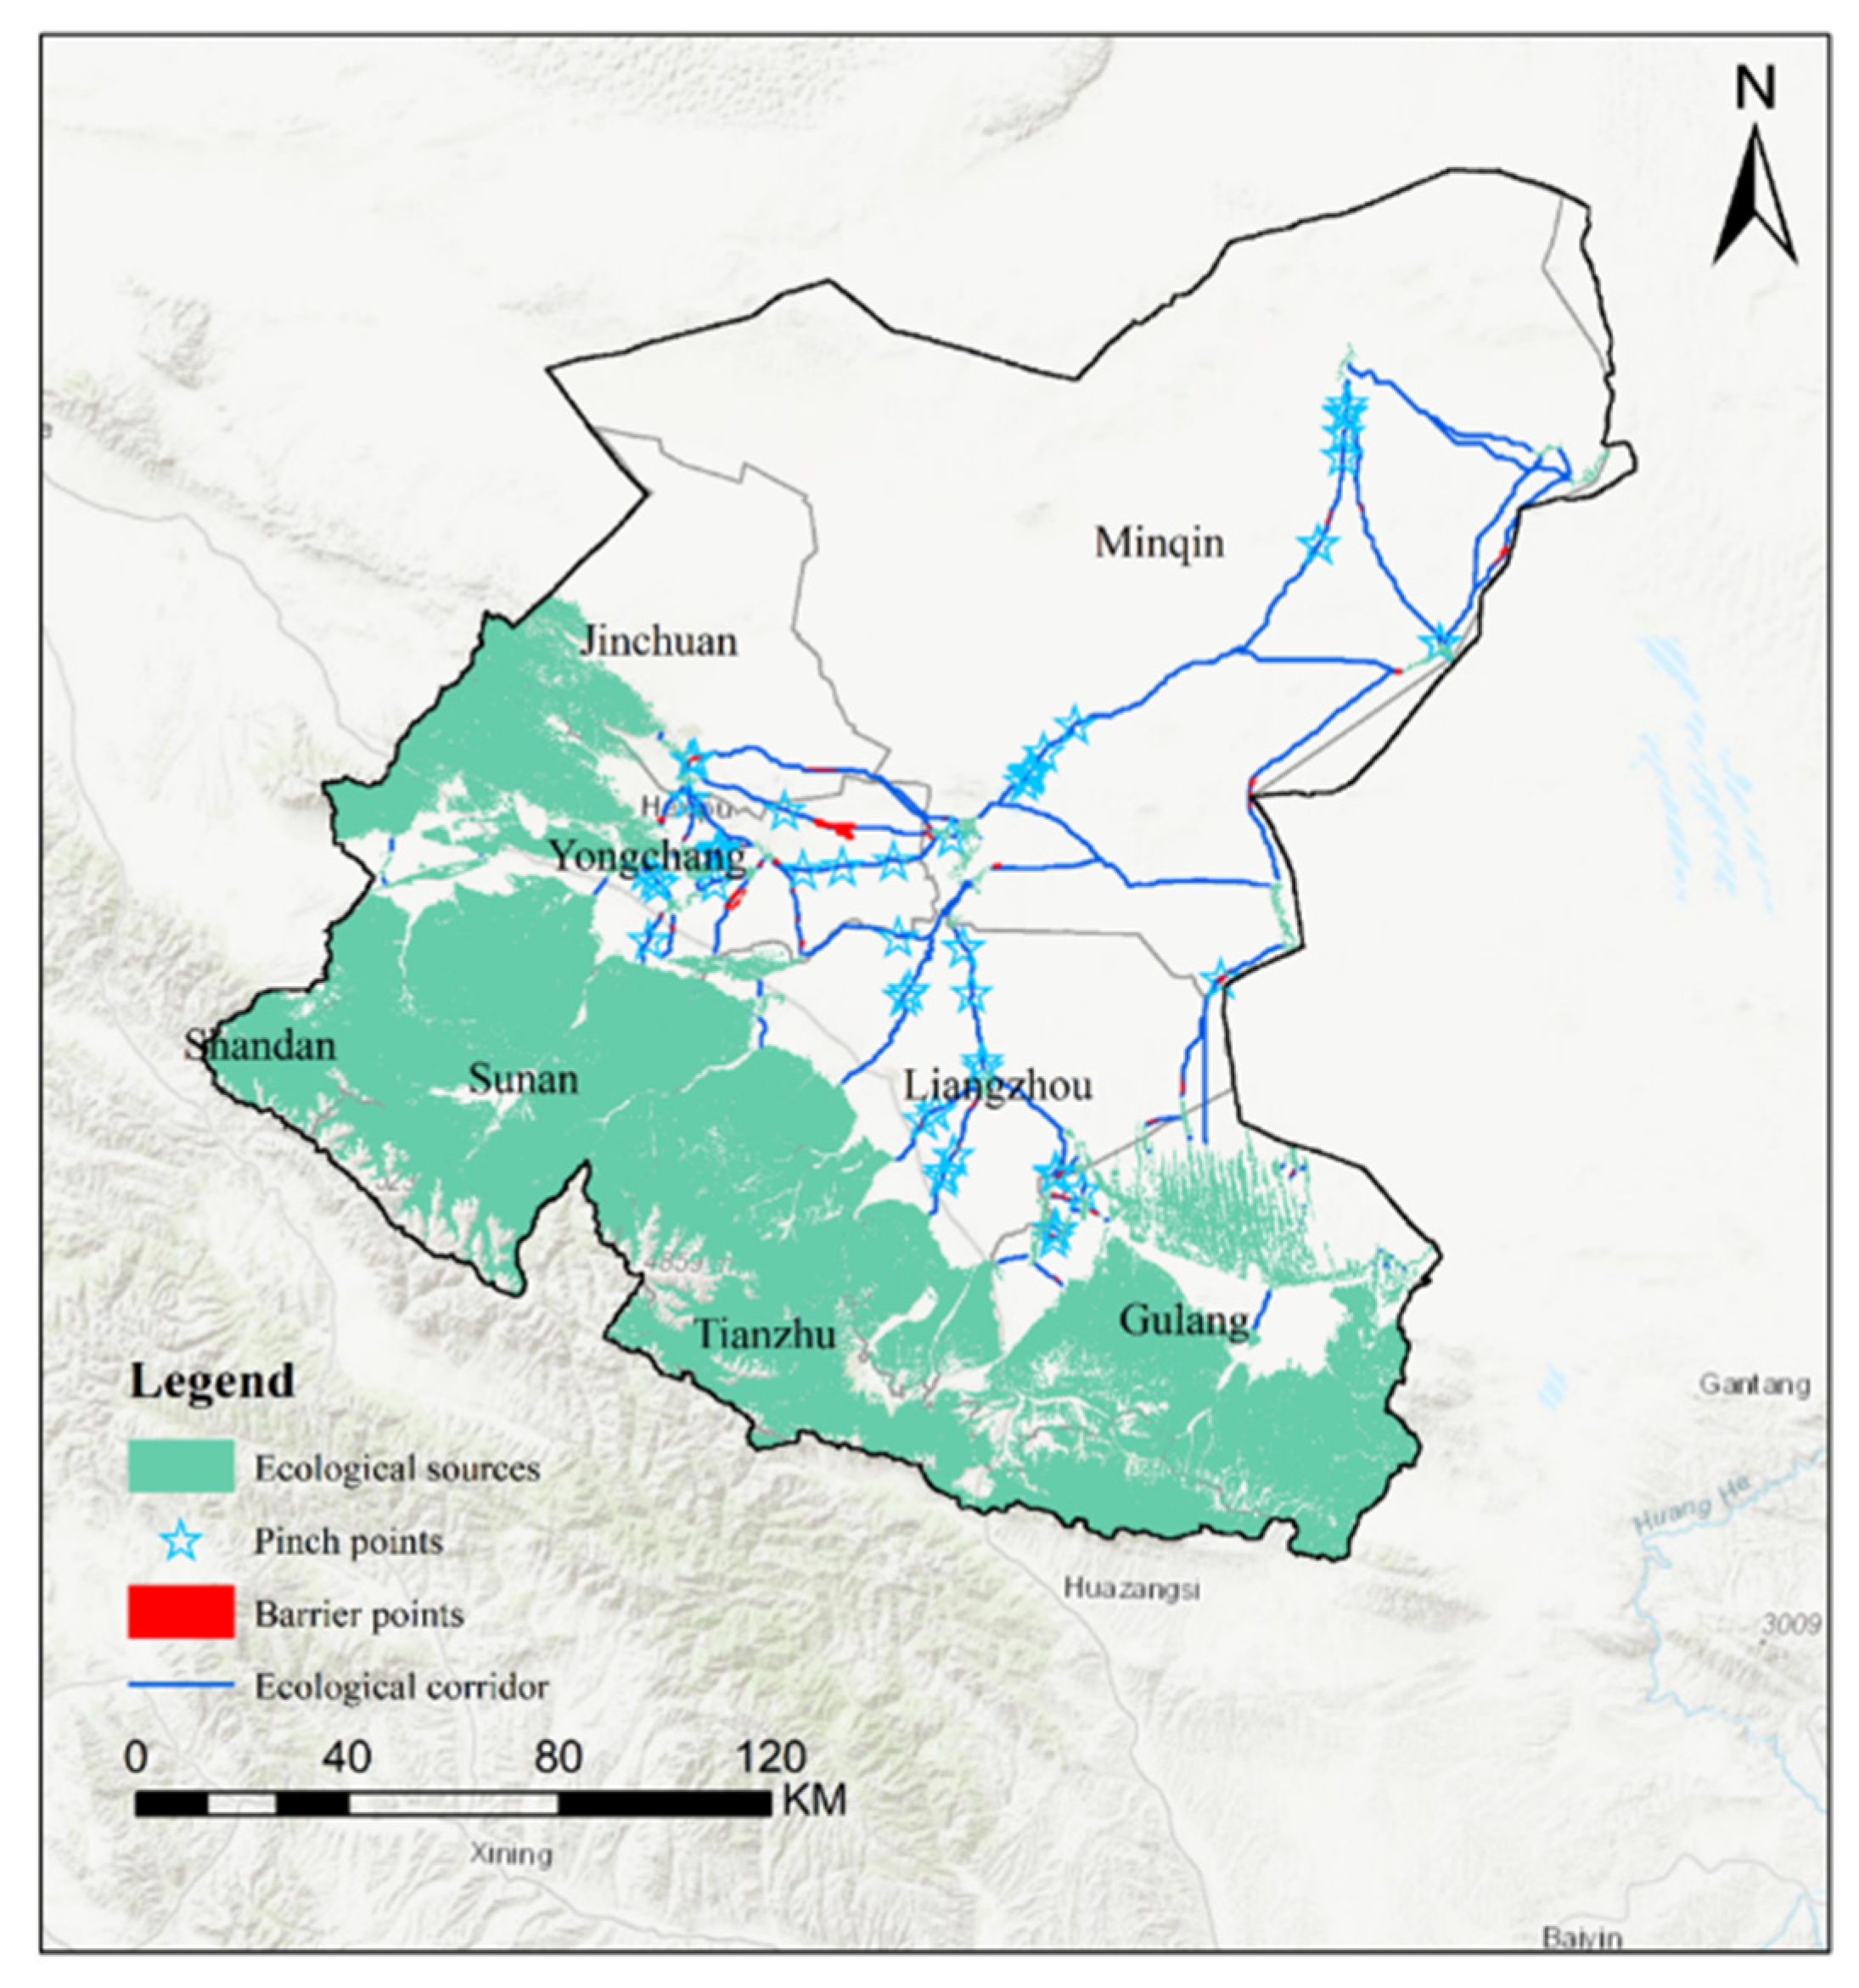
3.2.3. Identification of Ecological Corridors

Linkage Mapper was utilized to analyze regional wildlife habitat connectivity and identify ecological corridors [53]. A total of 94 corridors were detected, as shown in Figure 6. Influenced by the spatial arrangement of ecological sources, these corridors are primarily concentrated in the central and western regions of the study area, generally exhibiting a southwest-to-northeast trend. The northwestern region has high resistance values, leading to a near absence of ecological corridors. Conversely, the northeastern region, with fewer ecological sources spaced farther apart, features longer ecological corridors. The core function of these ecological corridors is to connect the ecological sources in the southern Qilian Mountains (mainly consisting of grasslands and woodlands) with the oases and desert transition zones in the central and northern regions. They provide migration routes for region-specific species that depend on grasslands and woodlands, such as small and medium-sized mammals and migratory birds adapted to arid areas. This ensures the diffusion of species between different habitats and maintains the continuity of ecological flows.

3.2.4. Identification of Critical Areas

In this research, key critical areas encompass ecological pinch points and barrier points. By employing the Pinchpoint Mapper tool, the current density throughout the study region was computed. Pinch points were identified as areas with high current density. The maximum current value was 1; applying the natural breaks method, current values were classified, and the highest class was selected to represent pinch points, yielding 80 identified sites. After overlaying with the current land use map, it was found that the current land use types of ecological pinch points are mainly arable land and grassland, while the current land use in the areas surrounding the ecological pinch points is mostly construction land, as shown in Table 12. Thus, it can be seen that while ecological pinch points undertake important connectivity functions, they often also face strong interference from human activities. Therefore, in the process of protecting the integrity of the ecological network and conducting ecological restoration, priority should be given to the maintenance and management of these nodes. Barriers were identified with the Barrier Mapper tool. After multiple iterations, the maximum barrier value was 59.01. Values were divided into five classes using the natural breaks method, with the highest class representing ecological barriers. A total of 39 barrier areas were recognized, spanning 73.4 square kilometers. Predominantly consisting of bare land and farmland, these barriers are marked by harsh ecological conditions and intensive road networks, significantly impeding species migration and ecological processes.

3.2.5. Spatial Syntax Evaluation of Ecological Network Structure

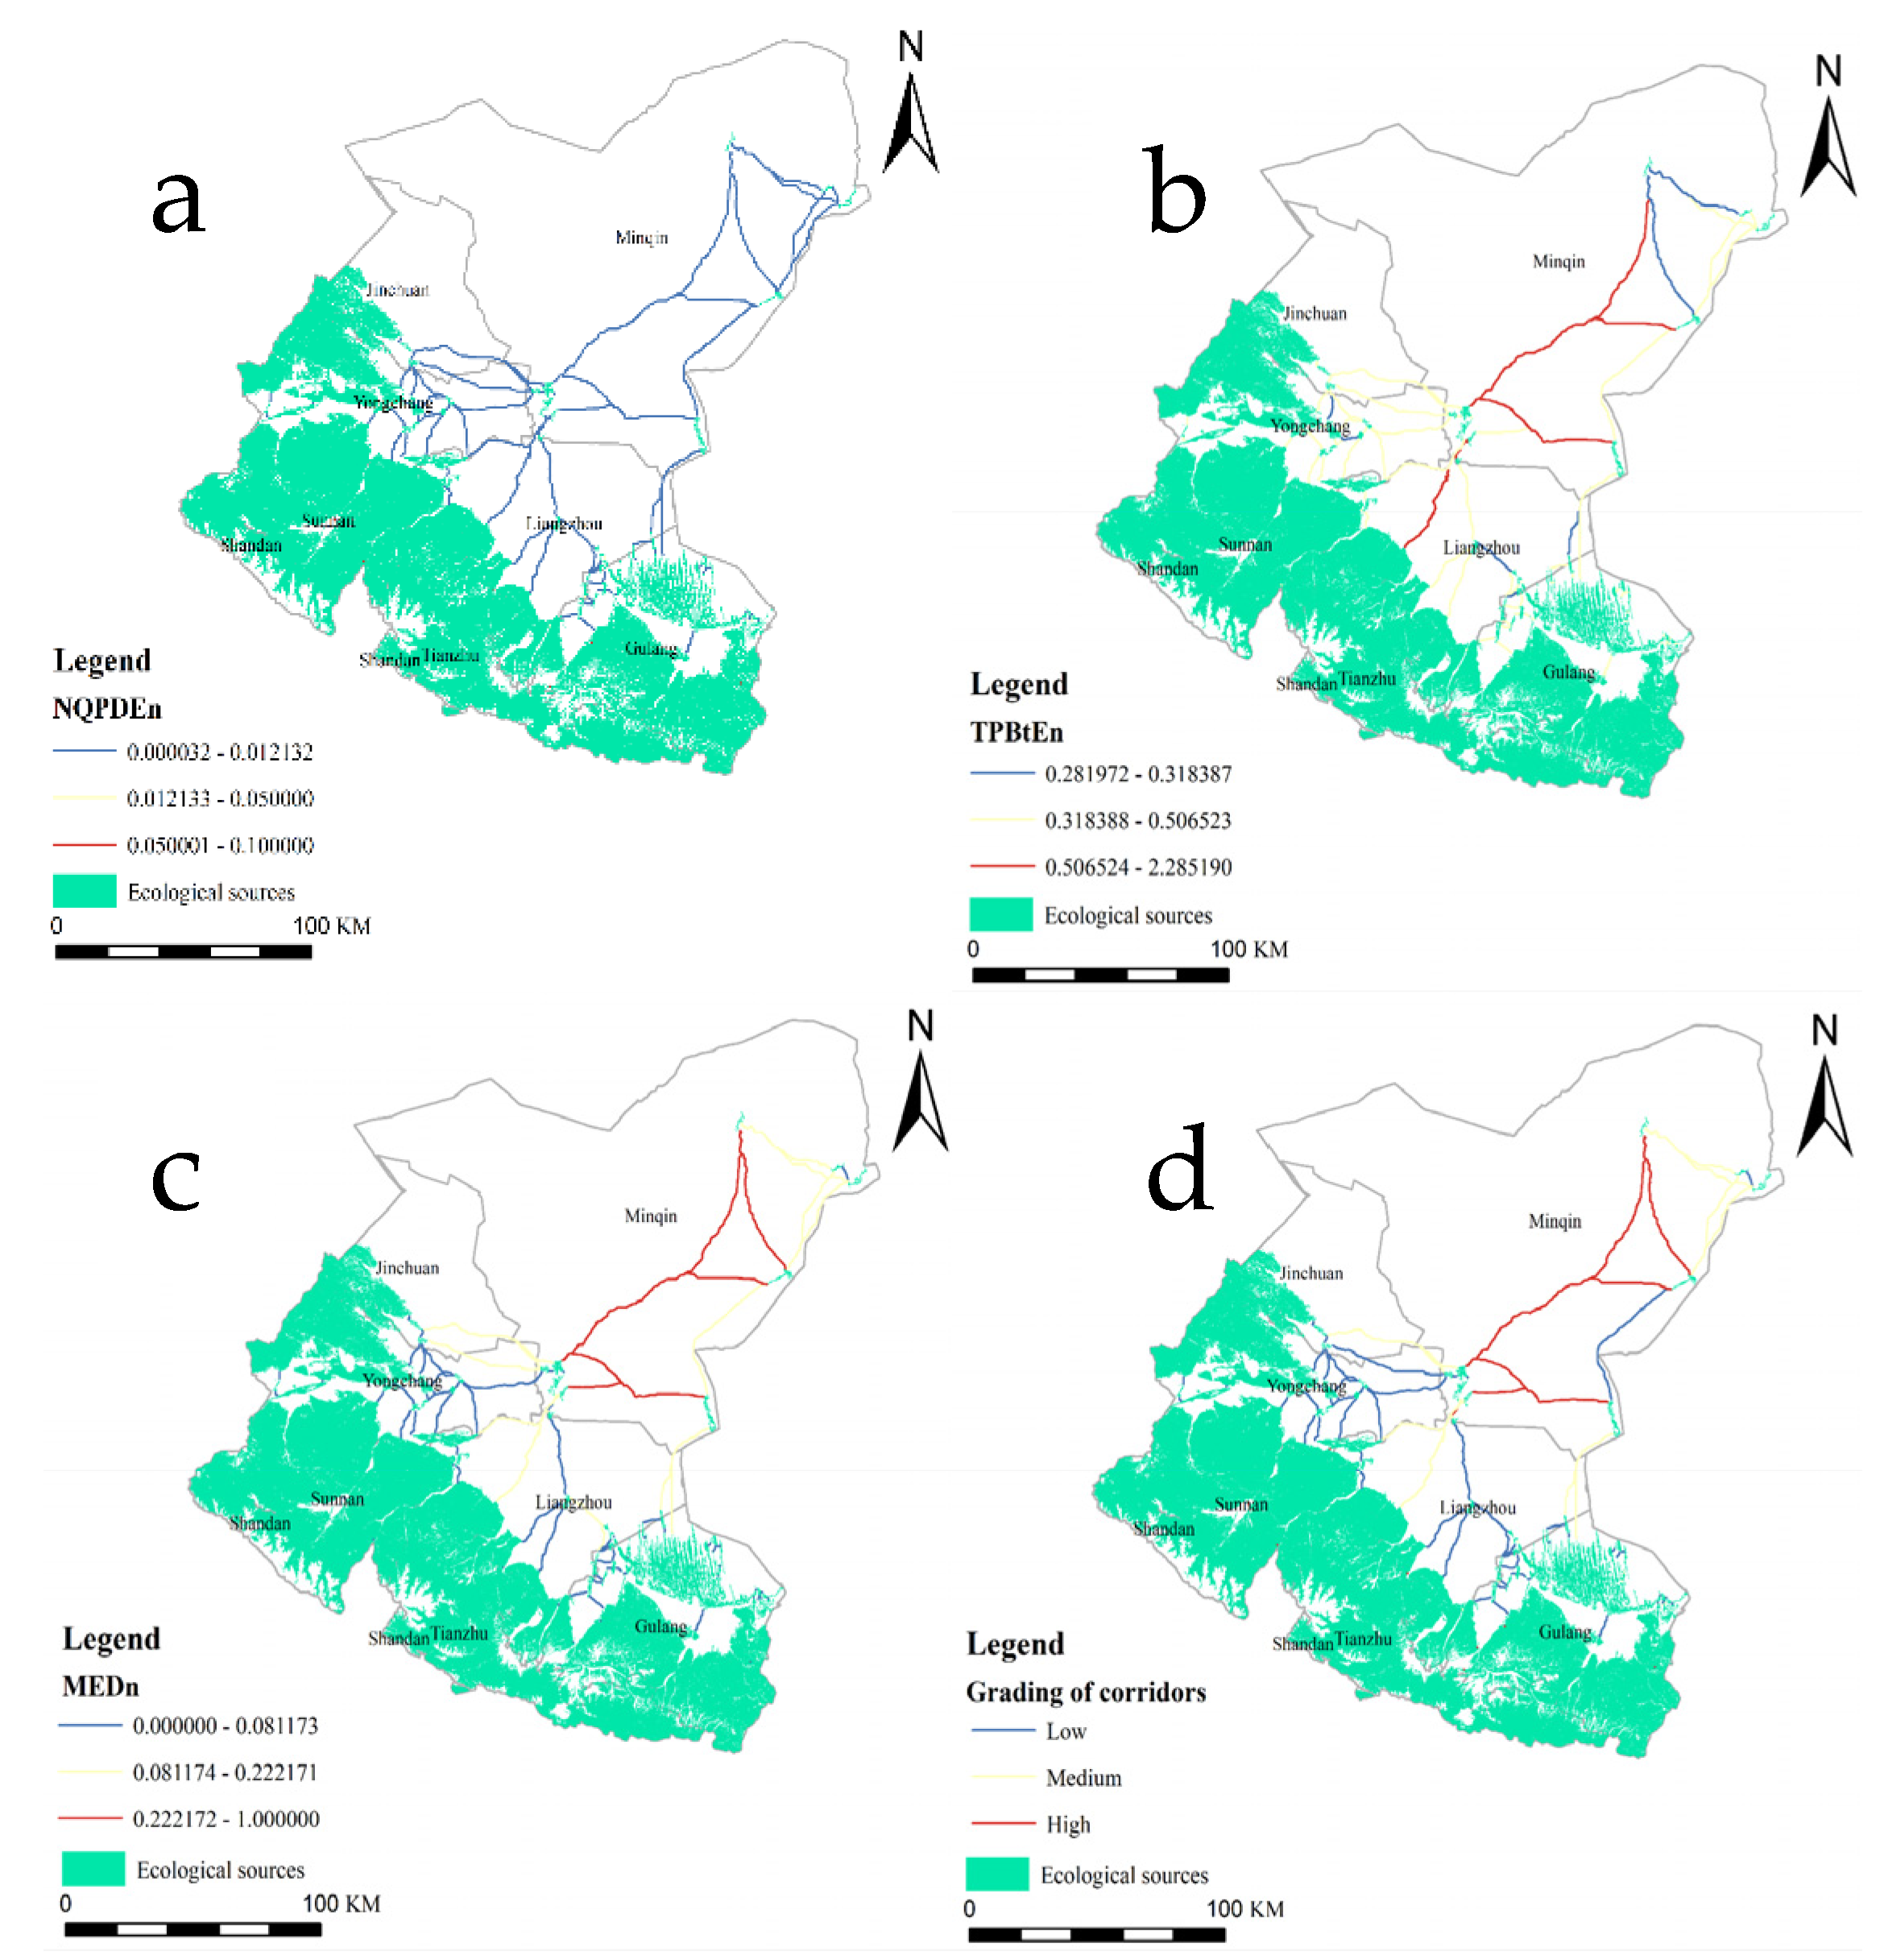
Drawing from the outcomes of the global spatial syntax analysis, the quantitative indicators (Figure 7) illustrate the following patterns: According to the NQPDE (Figure 7a), the overall ecological corridor network exhibits relatively poor connectivity, with most corridors falling into the lowest category. Low-value corridors are almost all the longer ecological corridors connecting Jinchuan, Yongchang, Minqin, and Liangzhou. Their characteristic is that they need to cross large areas of land use types, such as bare land and cultivated land. Particularly in the Minqin area, the concentrated distribution of cultivated land and construction areas, coupled with a large amount of bare land, results in a high risk of “disruption” for the ecological corridors connecting Minqin with other regions. This indicates that the ecological network in most parts of the Shiyang River Basin is in a “fragmented” state and cannot form an effectively connected whole. At the same time, this also means that priority should be given to carrying out corridor “gap-filling” projects (such as vegetation restoration and removal of barriers) in concentrated areas, including Jinchuan, Yongchang, Minqin, and Liangzhou. For TPBt (Figure 7b), corridors featuring high values are predominantly clustered in the southeastern portion of Minqin and the northern sector of Liangzhou. These corridors connect the upstream, midstream, and downstream segments of the Shiyang River Basin, serving a pivotal function in preserving ecosystem stability while enabling species migration and dispersal. High-value areas often overlap with high-quality habitats (such as grasslands and oases), which means that the habitat quality of corridors in these areas—with respect to vegetation cover and water availability—is superior. These corridors can meet the migration needs of species like small and medium-sized mammals and birds, serving as “core corridors” for maintaining regional biodiversity. For these areas, conservation measures should be implemented to strengthen their role in biological migration and energy flow. Analysis of MED (Figure 7c) indicates that eastern Jinchang, northern Liangzhou, and eastern and southern Minqin form a cluster of ecological corridors with high centrality. This suggests that corridors in these areas are closely connected and highly accessible, highlighting the central part of the study area as a pivotal zone within the overall network structure, critical for ecological flow and connectivity. High-value areas often indicate the “hub status” and radiation capacity of corridors within the entire ecological network. High-value areas (e.g., the northern part of Liangzhou) serve as “intersection nodes” of corridors, capable of linking multiple ecological sources (for instance, the northern part of Liangzhou can link 7 ecological sources). If these hubs are damaged, it will lead to the paralysis of the ecological network in large surrounding areas, making them the “top priority for protection”. An intensified analysis of the global characteristics reveals notable differences in the spatial distribution patterns of the three indicators—NQPDE, TPBt, and MED—indicating that the spatial accessibility of ecological corridors does not necessarily correspond with their functional likelihood for species passage.

3.2.6. Ecological Conservation and Restoration Strategy

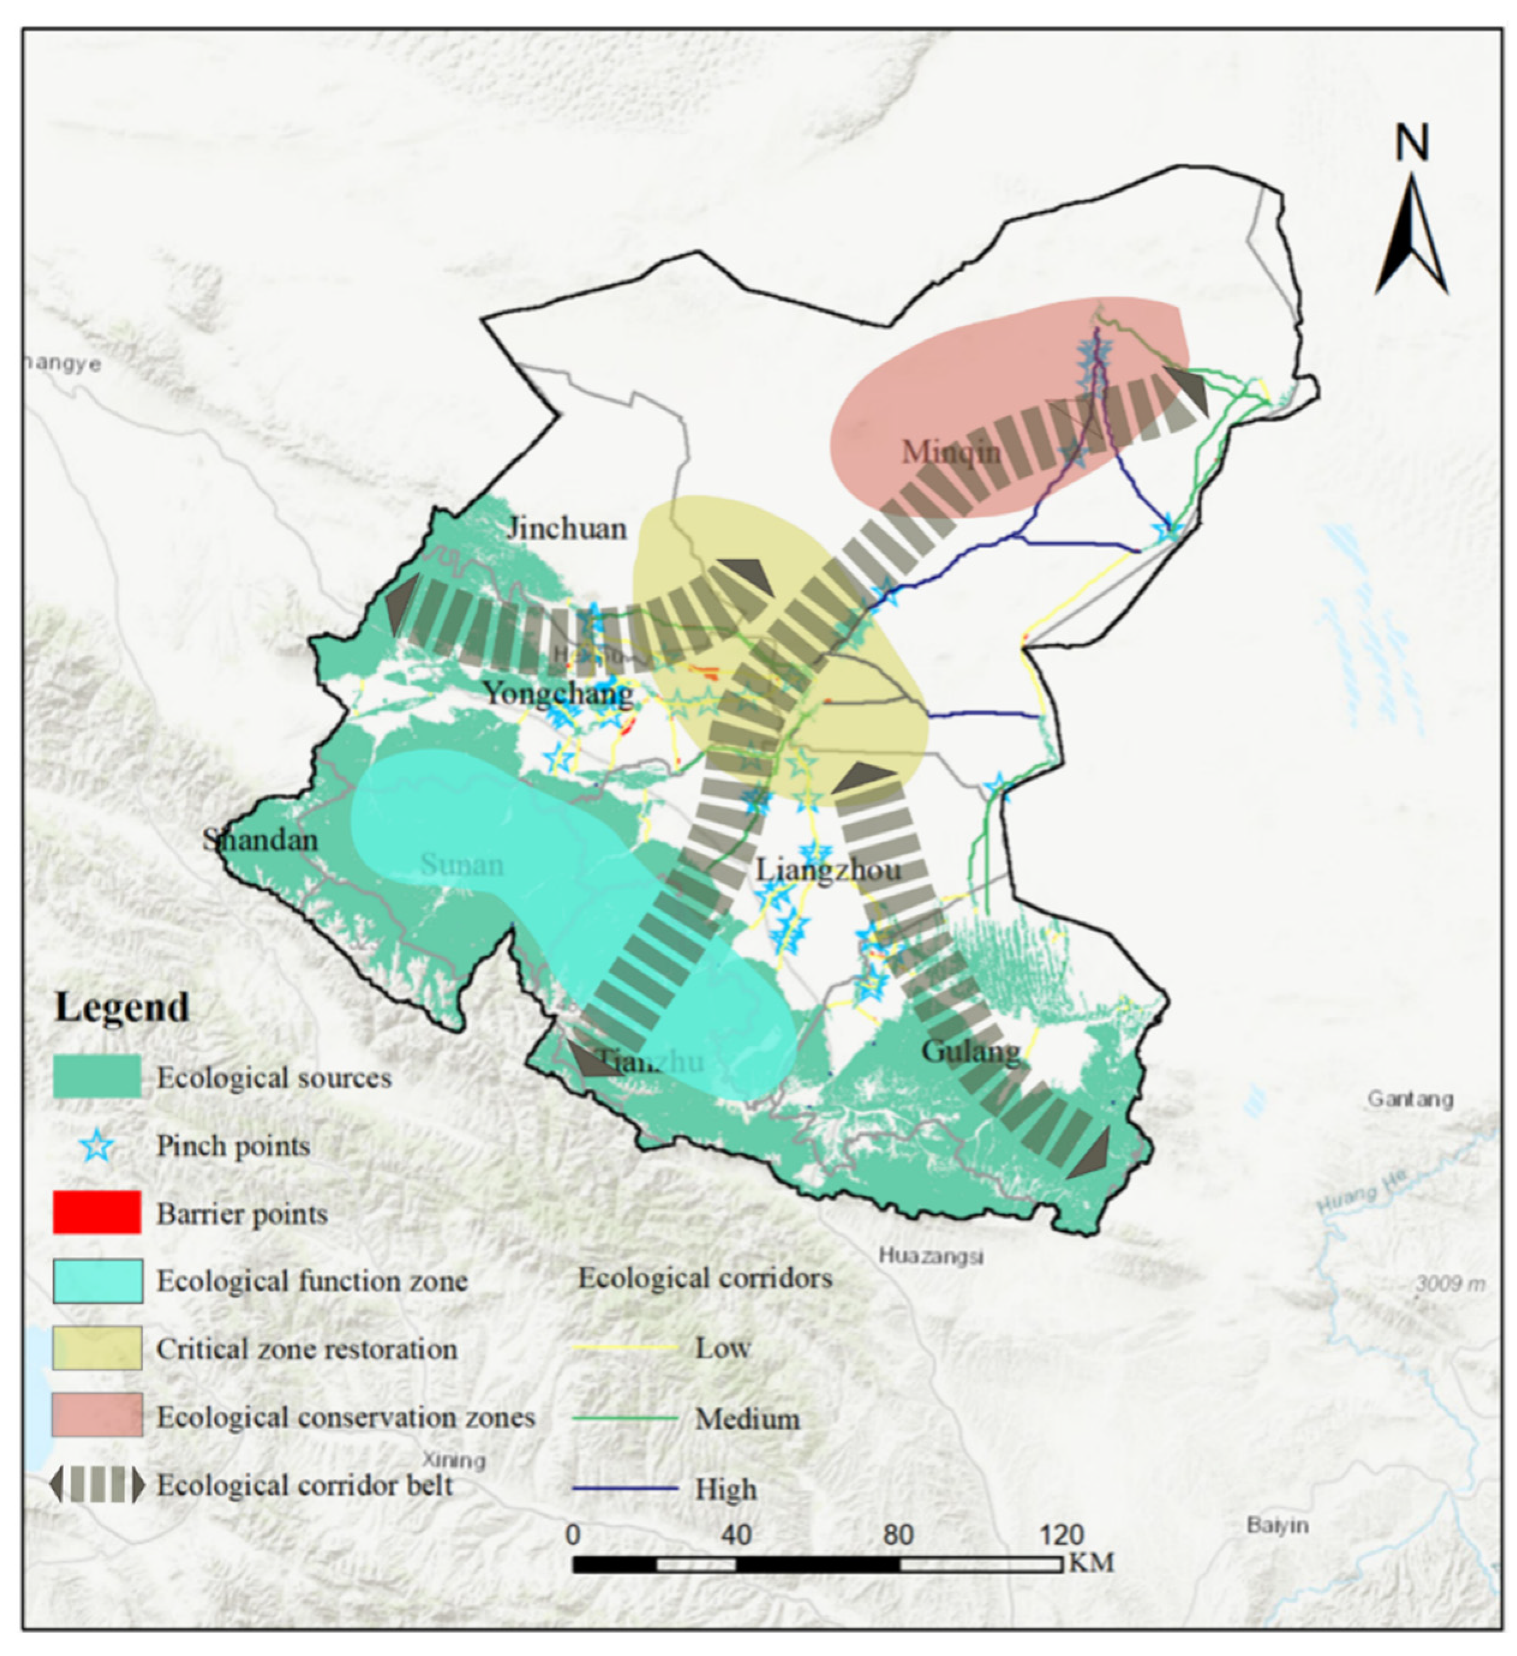
Based on the results of the ESP construction and the geographic attributes of various subregions across the Shiyang River Basin, this study proposes an integrated ecological planning strategy summarized as “Three Zones, Three Corridors, One Belt, and Multiple Points”, as shown in Figure 8.
The “Three Zones” refer to the Southern Ecological Function Zone, Central Ecological Restoration Zone, and Northern Ecological Protection Zone. The southern zone is predominantly situated in the Qilian Mountains, where most ecological sources in the Shiyang River Basin are clustered. As the headwater region of the Shiyang River, this area assumes a critical function in water conservation and supply, serving as a cornerstone for maintaining ecological integrity and supporting economic development across the entire basin. Therefore, this region should be prioritized for continuous ecological monitoring and protection, with strengthened enclosure and conservation measures. The central zone serves as a key ecological restoration area characterized by a dense network of ecological corridors, acting as a bridge between the upstream and downstream regions. Owing to its high population density and intense economic activity, this area is notably affected by human disturbance and harbors numerous pinch points and barrier points. Targeted restoration in the central zone, particularly in these critical areas, can significantly enhance the connectivity and integrity of the ecological network. For instance, Jinchuan District and Yongchang County in the central basin are major non-ferrous metal production bases in China, with convenient transportation, abundant resources, and rapidly developing non-ferrous metallurgy and agricultural processing industries. Liangzhou District is a significant agricultural zone facing increasing ecological pressure from expanding development and irrigation demands, resulting in biodiversity loss and heightened soil erosion risks. To address these challenges, water-saving irrigation upgrades and industrial restructuring are necessary. Furthermore, measures like converting cropland to forest or grassland and building wildlife corridors should be adopted to systematically address ecological issues in the restoration zone [54]. The northern zone, especially the Minqin Basin, bordered by the Tengger and Badain Jaran deserts, is ecologically fragile. Prolonged overdevelopment and exploitation have caused land desertification, salinization, groundwater decline, pollution, and water shortages. Hence, enhanced ecological protection measures such as water-saving irrigation, wastewater and exhaust emission controls, and long-term river and lake restoration are essential [55]. The management of these “Three Zones” should be aligned with existing national and local regulatory frameworks, such as the National Major Function Oriented Zoning and regional territorial spatial plans. The Southern Ecological Function Zone should be incorporated within the ecological protection red line, enforcing the most stringent mandatory conservation regulations. Governance in the Central Ecological Restoration Zone needs to be coordinated with local “urban development boundaries” and “permanent basic farmland” control lines, with its restoration projects prioritized for inclusion in provincial-level integrated conservation and restoration programs for mountains, waters, forests, farmlands, lakes, grasslands, and deserts. The Northern Ecological Protection Zone can be integrated with national key ecological projects like Desertification Combating, seeking support from the central government’s fiscal transfers.
The “Three Corridors” traverse the southern, central, and northern zones and serve as the main pathways for species migration. These corridors connect the “Three Zones” and help form a more stable ecological community. Corridors should be prioritized and optimized based on their ecological significance. During corridor construction, regional ecological characteristics and vegetation needs must be carefully considered. Native drought-resistant and economically valuable species should be prioritized. For example, in the desert zone of southern Minqin, species like Haloxylon ammodendron and Calligonum mongolicum are recommended to control desertification and land degradation. Additionally, buffer zones should be designed considering the surrounding land use and human activity intensity. Wide buffers should be established in urban areas to minimize disturbance, while multifunctional buffers integrating farmland shelterbelt systems can be developed in rural areas to balance ecological protection with agricultural production [56]. The implementation of the “Three Corridors” should transcend the jurisdiction of single administrative departments. It is recommended to explore the establishment of a cross-county/city corridor coordination committee to integrate actions from forestry, natural resources, water resources, and transportation authorities. For funding, beyond relying on special funds for ecological restoration, diverse financing channels such as ecological compensation mechanisms and green credit should be actively explored, encouraging downstream beneficiaries or enterprises to provide horizontal ecological compensation.
The “One Belt” denotes the Northern Qilian Mountain Ecological Protection Belt, situated in the transitional area between the northern Qilian Mountains and the central plains. As an ecologically vulnerable area situated between desert and oasis zones, constructing a protection belt here is critical for preventing sand encroachment. This area is also vital for soil and water conservation.
The “Multiple Points” include 80 pinch points and 39 barrier points, which are key zones along species migration pathways. These represent low-investment, high-impact areas. Targeted protection and restoration at these points can significantly reduce species migration costs and enhance ecological connectivity across regions. For example, in mountainous areas such as Tianzhu, Gulang, and Sunan, slope protection and vegetation restoration projects can effectively reduce soil erosion and improve ecological stability. For the identified “Multiple Points”, it is recommended that local natural resources departments incorporate them into an “Ecological Restoration Project Reserve”, prioritizing implementation based on urgency and potential benefits in a phased approach.

4. Discussion

4.1. Identification of Ecological Source Areas Based on OWA Multi-Attribute Decision-Making

Ecological sources are pivotal for maintaining regional ecological processes and functions. Assessment and identification can be conducted through quantitative metrics associated with ecosystem structure and function [57]. Despite variations in specific assessment indicators due to the study area’s traits, the core goal remains unchanged: pinpointing regions with the greatest integrated conservation value within the study scope [58]. Many existing studies on ecological security pattern (ESP) construction often assume that different ecological processes operate independently, overlooking trade-offs or synergies among them. This simplification reduces the practical effectiveness of the selected source areas. Addressing trade-offs among multiple ecosystem services and constructing an ESP that enhances these services simultaneously has become a key challenge in regional ecological planning [59]. The OWA-based multi-attribute decision-making method facilitates the creation of different weighting scenarios by simulating a spectrum of risk attitudes, thus supporting balanced decision-making among competing services. By calculating protection efficiency and trade-off levels, the scenario with both high efficiency and high trade-off was selected to determine the ecological sources, ensuring that the chosen sources are functionally central and ecologically comprehensive. In the calculation of protection efficiency, the average protection efficiency of Scenario 5 is significantly higher than that of the conventional overlay method in Scenario 4 (where the four ecosystem services are assigned equal weights). This indicates that compared with the conventional overlay method, which merely superimposes ecosystem service layers, the OWA-based method can more balancedly and accurately evaluate the multiple functions and values of ecosystems, thereby identifying ecologically critical source areas that are more relevant to regional ecological security.

4.2. Evaluation of Ecological Network Using Spatial Syntax

Building upon the identification of ecological corridors, this study applied spatial syntax analysis to the ecological network using three key indicators: betweenness centrality, network quantity, and closeness centrality. By incorporating the random-walk features of circuit theory [60], this method allowed for the identification of pinch points and barrier points as pivotal ecological restoration zones. Tailored restoration measures were devised according to the attributes of these key areas to guarantee continuous species movement and the circulation of matter and energy within the network [61,62]. Moreover, the extracted corridors clarified the optimization direction for north–south ecological connectivity. Considering the small size of ecological source areas and sparse corridor distribution in the central and northern basin, this study proposed a comprehensive ecological construction framework summarized as “Three Zones, Three Corridors, One Belt, and Multiple Points”. This framework forms a functional, networked regional ecological spatial structure that aligns well with the Gansu Provincial Territorial Spatial Plan (2021–2035), thereby reinforcing the scientific validity of the results.

4.3. Limitations and Future Directions

The first limitation of this study is that it did not consider the impact of climate change on the watershed’s ecological sources. We failed to incorporate climate change factors into the process of ecological source identification and corridor optimization, which is particularly critical for the watershed in this study—its northern and central parts are dominated by arid and semi-arid ecosystems, where ecological sources (such as fragmented grasslands and riparian zones) are highly sensitive to climate fluctuations. For example, we did not account for the potential degradation of grassland ecological sources caused by rising temperatures and decreasing precipitation in the watershed under future climate scenarios (e.g., the SSP2-4.5 scenario), nor did we assess the risk of corridor disruption due to extreme hydrological events like flash floods induced by climate change. These oversights may lead to an overestimation of the long-term stability of the watershed’s ecological sources and the connectivity of its corridors. In subsequent research, climate change scenarios, socioeconomic projections, and biodiversity monitoring data should be integrated into the dynamic updating of ecological security patterns to maintain their continued relevance and applicability.
Another limitation is the oversimplified treatment of species-specific migration resistance. We used a unified resistance surface (constructed solely based on land use types) to simulate species migration within corridors, ignoring differences in migration resistance among key species in the watershed. This watershed serves as an important habitat for typical species such as Stipa breviflora (a dominant herbaceous species) and Capra ibex (a flagship herbivore): the former is more sensitive to the resistance of farmland boundaries, while the latter is significantly restricted by topographic relief (e.g., areas with slopes exceeding 30°). This uniform resistance setting fails to reflect the species-specific needs, resulting in a gap between the constructed corridors and the actual migration needs of local species.
The third limitation is that when processing data from different sources, the potential scaling effects or loss of detail of higher-resolution datasets were not considered. For instance, when resampling 10 m-resolution land use data to 30 m, “small but important habitat patches” may be omitted. Future studies can further enhance the rigor of the research by supplementing comparative analysis between 10 m and 30 m data and quantifying the impact of scaling effects on the core conclusions.
The fourth limitation is that due to the difficulty in obtaining field-measured data, this study did not validate the used national datasets against field-measured data. Future studies, when conditions permit, should consider seeking more appropriate field-measured data to validate the national datasets, thereby improving credibility.
The fifth limitation is that although the “InVEST → OWA → MCR → Space Syntax” workflow adopted in this study is logically coherent, we recognize that this integrated approach carries inherent uncertainties, and these uncertainties propagate through each successive step. Firstly, the outputs of the InVEST model depend on input data (such as land use classification accuracy) and parameter settings (such as threat factor weights). The uncertainties inherent in this model are passed on as a foundation to subsequent analyses. Secondly, in the OWA analysis, the assignment of criterion weights—based on literature and expert judgment—involves a degree of subjectivity. The uncertainties generated at this stage are directly embedded into the “source” data of the MCR model. At the same time, the primary source of uncertainty in the MCR model lies in the setting of resistance coefficients, which further affects the accuracy of ecological corridor identification. Finally, the Space Syntax analysis is built upon the outputs of all the aforementioned steps. As a result, uncertainties from the preceding stages accumulate and become evident here.
We acknowledge that this study did not conduct a quantitative sensitivity analysis of the propagation of these uncertainties, which represents a limitation of this work. Therefore, we recommend interpreting the final results of this study—the ecological network and key nodes—as a “spatial relative priority” rather than as definitive conclusions. Future research should focus on quantifying this complex uncertainty propagation process through probabilistic simulations or comprehensive parameter sensitivity testing.

5. Conclusions

This study evaluated four typical ecosystem services—habitat quality, water yield, soil retention, and carbon sequestration—in the Shiyang River Basin in 2021. By applying the OWA multi-criteria decision-making method, the priority protection areas for ecosystem services were identified. Through adjusting decision weights, the research achieved a comprehensive balance of multiple ecological functions, providing a scientific basis for targeted conservation planning in arid regions. The study utilized the MCR model to extract ecological corridors, identified pinch points and barrier points through circuit theory, and further constructed the ecological security pattern (ESP) of the study area. Results showed significant spatial differentiation in the distribution of ecosystem services within the basin. A total of 46 ecological source areas (with a total area of 12,336.34 km2), 94 ecological corridors, 80 ecological pinch points, and 39 ecological barrier points were identified as key areas. Drawing on the established ESP and the basin’s specific attributes, a comprehensive ecological construction strategy termed “Three Zones, Three Corridors, One Belt, and Multiple Points” was put forward. This strategy furnishes a functional and networked spatial framework to facilitate regional ecological optimization.

Author Contributions

Y.G.: Conceptualization, Methodology, Software, Formal analysis, Visualization, Writing—original draft. F.Z.: Writing—review & editing, Conceptualization, Project administration, Funding acquisition, Supervision. Q.F.: Conceptualization, Project administration. Y.W.: Methodology, Supervision. G.L.: Project administration, Funding acquisition. Z.S.: Methodology, Project administration. All authors have read and agreed to the published version of the manuscript.

Funding

This work was partially supported by the National Natural Science Funds of China (42371316); Humanities and Social Sciences Foundation of the Ministry of Education (21YJAZH110); The “Belt and Road” Special Scientific Research Project of Shaanxi Normal University (22YDYLZ011); Natural Science Foundation of Shaanxi Province (2018JM4020).

Data Availability Statement

The data that support the findings of this study are available in the respective public repositories at the URLs listed below. No DOIs are assigned, and the reference numbers correspond to platform-specific identifiers (where applicable). These data were derived from the following resources available in the public domain: (1) Land use data—Repository: European Space Agency (ESA) WorldCover dataset: https://esa-worldcover.org/en, accessed on 13 August 2024. (2) Digital Elevation Model (DEM)—Repository: China Geospatial Data Cloud: http://www.gscloud.cn, accessed on 13 August 2024. (3) Evapotranspiration, precipitation, and soil data—Repository: National Tibetan Plateau Data Center: https://data.tpdc.ac.cn/, accessed on 13 August 2024. (4) Normalized Difference Vegetation Index (NDVI) data—Repository: Resource and Environment Science and Data Center: https://www.resdc.cn/, accessed on 15 August 2024. (5) Road network data—Repository: OpenStreetMap (OSM): https://www.openstreetmap.org/, accessed on 23 August 2024.

Conflicts of Interest

The authors declare no conflicts of interest.

References

  1. Jones, K.R.; Venter, O.; Fuller, R.A.; Allan, J.R.; Maxwell, S.L.; Negret, P.J.; Watson, J.E.M. One-third of global protected land is under intense human pressure. Science 2018, 360, 788–791. [Google Scholar] [CrossRef]
  2. Ren, Q.; He, C.; Huang, Q.; Shi, P.; Zhang, D.; Güneralp, B. Impacts of urban expansion on natural habitats in global drylands. Nat. Sustain. 2022, 5, 869–878. [Google Scholar] [CrossRef]
  3. Thanh, T.N.; Ulrike, G.; Frank, N.; Do, M.H.; Paudel, G.P. Security risks from climate change and environmental degradation: Implications for sustainable land use transformation in the Global South. Curr. Opin. Environ. Sustain. 2023, 63, 101322. [Google Scholar] [CrossRef]
  4. Zhao, C.C.; Pan, J.H. Identification and optimization of ecological security pattern in the Gansu section of the Yellow River Basin from a supply-demand perspective. Acta Ecol. Sin. 2022, 42, 6973–6984. [Google Scholar]
  5. Dong, J.; Jiang, H.; Gu, T.; Liu, Y.; Peng, J. Sustainable landscape pattern: A landscape approach to serving spatial planning. Landsc. Ecol. 2022, 37, 31–42. [Google Scholar] [CrossRef]
  6. Dong, J.; Peng, J.; Liu, Y.; Qiu, S.; Han, Y. Integrating spatial continuous wavelet transform and kernel density estimation to identify ecological corridors in megacities. Landsc. Urban Plan. 2020, 199, 103815. [Google Scholar] [CrossRef]
  7. Yu, K.J. Strategic points identification in landscape ecology and the surface model of theoretical geography. Acta Geogr. Sin. 1998, 53, 11–20. [Google Scholar]
  8. Yu, K.J. Landscape ecological security patterns for biodiversity conservation. Acta Ecol. Sin. 1999, 19, 10–17. [Google Scholar]
  9. Peng, J.; Li, H.L.; Liu, Y.X.; Hu, Y.N.; Yang, Y. Identification and optimization strategies of ecological security pattern in Xiong’an New Area. Acta Geogr. Sin. 2018, 73, 701–710. [Google Scholar]
  10. Zhang, Y.; Zheng, H.M.; Lu, H.J. Research progress on urban ecological network analysis. Acta Ecol. Sin. 2017, 37, 4258–4267. [Google Scholar]
  11. Vergnes, A.; Kerbiriou, C.; Clergeau, P. Ecological corridors also operate in an urban matrix: A test case with garden shrews. Urban Ecosyst. 2013, 16, 511–525. [Google Scholar] [CrossRef]
  12. Wang, N.; Zhao, Y. Construction of an ecological security pattern in Jiangnan water network area based on an integrated approach: A case study of Gaochun, Nanjing. Ecol. Indic. 2024, 158, 109719. [Google Scholar] [CrossRef]
  13. Wu, J.S.; Ma, H.K.; Peng, J. Construction of urban ecological security pattern based on “functional nodes–key corridors”: A case study of Shenzhen City. Prog. Geogr. 2018, 37, 1663–1671. [Google Scholar]
  14. Yang, T.R.; Kuang, W.H.; Liu, W.D.; Liu, A.L.; Pan, T. Optimization of ecological spatial structure of Guanzhong urban agglomeration based on ecological security pattern. Geogr. Res. 2017, 36, 441–452. [Google Scholar]
  15. Fu, Q.; Li, B.; Yang, L.L.; Zhang, X.S. Importance assessment of ecosystem services in arid regions of Northwest China: A case study of Altay Prefecture. J. Arid Land Resour. Environ. 2016, 30, 70–75. [Google Scholar]
  16. Li, S.; Xiao, W.; Zhao, Y.; Lv, X. Incorporating ecological risk index in the multi-process MCRE model to optimize the ecological security pattern in a semi-arid area with intensive coal mining: A case study in northern China. J. Clean. Prod. 2020, 247, 119160. [Google Scholar] [CrossRef]
  17. Barbier, E.B.; Koch, E.W.; Silliman, B.R.; Hacker, S.D.; Wolanski, E.; Primavera, J.; Granek, E.F.; Polasky, S.; Aswani, S.; Cramer, L.A.; et al. Coastal ecosystem-based management with nonlinear ecological functions and values. Science 2008, 319, 321–323. [Google Scholar] [CrossRef]
  18. Brauman, K.A.; Daily, G.C.; Duarte, T.K.; Mooney, H.A. The nature and value of ecosystem services: An overview highlighting hydrologic services. Annu. Rev. Environ. Resour. 2007, 32, 67–98. [Google Scholar] [CrossRef]
  19. Rodríguez, J.P.; Beard, T.D., Jr.; Bennett, E.M.; Cumming, G.S.; Cork, S.J.; Agard, J.; Dobson, A.P.; Peterson, G.D. Trade-offs across space, time, and ecosystem services. Ecol. Soc. 2006, 11, 28. [Google Scholar] [CrossRef]
  20. Delgado Tellez, R.; Zhong, E.; Zuhu, Y.; Peña De La Cruz, A. A local spatial decision support system for developing countries based on MCA, fuzzy sets and OWA—Case study of a municipality in Cuba. Geo-Spat. Inf. Sci. 2013, 16, 120–129. [Google Scholar] [CrossRef]
  21. Malczewski, J.; Rinner, C. Exploring multicriteria decision strategies in GIS with linguistic quantifiers: A case study of residential quality evaluation. J. Geogr. Syst. 2005, 7, 249–268. [Google Scholar] [CrossRef]
  22. Zhang, L.; Fu, B.; Lü, Y.; Zeng, Y. Balancing multiple ecosystem services in conservation priority setting. Landsc. Ecol. 2014, 30, 535–546. [Google Scholar] [CrossRef]
  23. Adriaensen, F.; Chardon, J.P.; De Blust, G.; Swinnen, E.; Villalba, S.; Gulinck, H.; Matthysen, E. The application of ‘least-cost’ modelling as a functional landscape model. Landsc. Urban Plan. 2003, 64, 233–247. [Google Scholar] [CrossRef]
  24. Peng, J.; Zhao, S.; Dong, J.; Liu, Y.; Meersmans, J.; Li, H.; Wu, J. Applying ant colony algorithm to identify ecological security patterns in megacities. Environ. Model. Softw. 2019, 117, 214–222. [Google Scholar] [CrossRef]
  25. Wang, Z.L.; Li, Z.G.; Fang, S.M. Construction and optimization of ecological security pattern based on genetic algorithm and graph theory: A case study of Wuhan City. Prog. Geogr. 2022, 42, 1685–1694. [Google Scholar]
  26. Dickson, B.G.; Albano, C.M.; Anantharaman, R.; Beier, P.; Fargione, J.; Graves, T.A.; Gray, M.E.; Hall, K.R.; Lawler, J.J.; Leonard, P.B.; et al. Circuit-theory applications to connectivity science and conservation. Conserv. Biol. 2018, 33, 239–249. [Google Scholar] [CrossRef] [PubMed]
  27. Li, Y.; Zhao, J.; Yuan, J.; Ji, P.; Deng, X.; Yang, Y. Constructing the ecological security pattern of Nujiang Prefecture based on the framework of “importance–sensitivity–connectivity”. Int. J. Environ. Res. Public Health 2022, 19, 10869. [Google Scholar] [CrossRef]
  28. Wang, X.F.; Zhu, M.N.; Zhang, X.R.; Ma, J.H.; Zhou, J.T.; Cheng, T.; Zheng, Y.Y.; Tu, Y.; Yao, W.J.; Ma, J. Construction of ecological security pattern in the Sanjiangyuan region based on the “source-resistance-corridor” model. Acta Ecol. Sin. 2024, 44, 4609–4623. [Google Scholar]
  29. Guo, H.Y.Y.; Liu, J.W.; Chen, C.X. Construction of ecological network of nature reserves in the Lancang River Basin, Yunnan Province. Bull. Soil Water Conserv. 2023, 43, 193–201. [Google Scholar]
  30. Liu, S.Y.; Luo, Y.; Yu, H.; Wang, X.; Li, Z.; Dong, W. Construction and optimization of ecological security pattern in the source regions of the Yangtze and Yellow Rivers in northwestern Sichuan. J. Environ. Eng. Technol. 2023, 13, 1315–1324. [Google Scholar]
  31. Xia, H.H.; Yang, L.S.; Feng, Q.; Su, Y.Q.; Zou, X.Y.; He, W.H. Spatiotemporal variation and driving factors of water yield service supply and demand in the Shiyang River Basin. Chin. J. Desert Res. 2024, 44, 87–99. [Google Scholar]
  32. Chen, J.; Wang, S.; Zou, Y. Construction of an ecological security pattern based on ecosystem sensitivity and the importance of ecological services: A case study of the Guanzhong Plain urban agglomeration, China. Ecol. Indic. 2022, 136, 108688. [Google Scholar] [CrossRef]
  33. Wang, Y.; Pan, J.H. Optimization of ecological security pattern in arid inland river basin based on ecosystem service value reconstruction: A case study of Ganzhou District, Zhangye City. Acta Ecol. Sin. 2019, 39, 3455–3467. [Google Scholar]
  34. Huang, J.C.; Deng, X.Y.; Qi, Y.F.; Wang, P.K. Construction of ecological security pattern in Henan Province based on MSPA, circuit theory and space syntax. Environ. Sci. 2025, 1–22. [Google Scholar] [CrossRef]
  35. Zhu, M.F.; Zhao, K.F.; Shao, Z.; Li, L. Spatio-temporal analysis of carbon sequestration of wetlands in Guangdong–Hong Kong–Macao Greater Bay Area based on the InVEST model. Environ. Sci. 2025, 46, 1964–1973. [Google Scholar] [PubMed]
  36. Bagstad, J.K.; Semmens, J.D.; Winthrop, R. Comparing approaches to spatially explicit ecosystem service modeling: A case study from the San Pedro River Arizona. Ecosyst. Serv. 2013, 5, 540–550. [Google Scholar] [CrossRef]
  37. Fang, Y.; Wang, J.; Huang, L.Y.; Zhai, T.L. Diagnosis and identification of key areas for ecological protection and restoration in territorial spatial ecological security pattern: A case study of Yantai City. J. Nat. Resour. 2020, 35, 190–203. [Google Scholar]
  38. Xue, J.; Li, Z.S.; Chen, X.J.; Zhou, H.L.; Gui, J. Spatio-temporal Changes and Influencing Factors of Ecosystem Service Functions in Hexi Region from 2000 to 2020. Environ. Ecol. 2023, 5, 1–12. [Google Scholar]
  39. Zhao, Y.R.; Zhou, J.J.; Lei, L.; Xiang, J.; Huang, M.; Feng, W.; Zhu, G.; Wei, W.; Wang, J. Identification of driving factors of water yield in the upper reaches of the Shiyang River based on the InVEST model. Chin. J. Ecol. 2019, 38, 3789–3799. [Google Scholar]
  40. Donohue, R.J.; Roderick, M.L.; McVicar, T.R. Incorporating key ecohydrological processes into Budyko’s hydrological model. J. Hydrol. 2012, 436–437, 35–50. [Google Scholar] [CrossRef]
  41. Yager, R.R. Quantifier guided aggregation using OWA operators. Int. J. Intell. Syst. 1998, 11, 49–73. [Google Scholar] [CrossRef]
  42. Nelson, E.; Mendoza, G.; Regetz, J.; Polasky, S.; Tallis, H.; Cameron, D.R.; Chan, K.M.A.; Daily, G.C.; Goldstein, J.; Kareiva, P.M.; et al. Modeling multiple ecosystem services, biodiversity conservation, commodity production, and tradeoffs at landscape scales. Front. Ecol. Environ. 2009, 7, 4–11. [Google Scholar] [CrossRef]
  43. Gou, R.; Su, W.C.; Quan, X.Y.; Huang, X.F. Identification of ecological security pattern in the quiet zone of China’s FAST telescope based on OWA and circuit theory. Acta Ecol. Sin. 2024, 44, 9636–9651. [Google Scholar]
  44. Wang, Y.; Zhang, L.; Song, Y. Study on the construction of the ecological security pattern of the Lancang River Basin (Yunnan section) based on InVEST-MSPA-Circuit Theory. Sustainability 2022, 15, 477. [Google Scholar] [CrossRef]
  45. Geng, J.W.; Yu, K.Y.; Xie, Z.; Yang, W.F.; Liu, J.A. Optimization of green infrastructure network in Fuzhou City based on habitat quality model. J. Southwest For. Univ. Nat. Sci. Ed. 2023, 43, 118–125. [Google Scholar]
  46. Xu, Y.; Liu, R.; Xue, C.; Xia, Z. Ecological sensitivity evaluation and explanatory power analysis of the Giant Panda National Park in China. Ecol. Indic. 2023, 146, 109792. [Google Scholar] [CrossRef]
  47. Peng, J.; Yang, Y.; Liu, Y.; Hu, Y.N.; Du, Y.; Meersmans, J.; Qiu, S. Linking ecosystem services and circuit theory to identify ecological security patterns. Sci. Total Environ. 2018, 644, 781–790. [Google Scholar] [CrossRef]
  48. McRae, B.H.; Beier, P. Circuit theory predicts gene flow in plant and animal populations. Proc. Natl. Acad. Sci. USA 2007, 104, 19885–19890. [Google Scholar] [CrossRef]
  49. Zhao, L.L.; Cao, G.C.; Yan, X.; Su, W.F.; Xian, Q.L. Identification of ecological security pattern based on InVEST model and circuit theory: A case study of Hainan Tibetan Autonomous Prefecture, Qinghai Province. Bull. Soil Water Conserv. 2025, 45, 137–146. [Google Scholar]
  50. Sun, Z.Y.; Wang, S.G.; Chen, B. Construction of ecological security pattern and assessment of ecological resilience based on ecosystem services: A case study of Chang-Zhu-Tan urban agglomeration. Acta Ecol. Sin. 2024, 44, 4650–4661. [Google Scholar]
  51. Zheng, Q.M.; Shen, M.; Zhong, L. Construction of ecological security pattern in Pudacuo National Park. Acta Ecol. Sin. 2021, 41, 874–885. [Google Scholar] [CrossRef]
  52. Han, L.; Wang, Z.; Wei, M.; Wang, M.; Shi, H.; Ruckstuhl, K.; Yang, W.; Alves, J. Small patches play a critical role in the connectivity of the Western Tianshan landscape, Xinjiang, China. Ecol. Indic. 2022, 144, 109542. [Google Scholar] [CrossRef]
  53. Zhou, L.; Li, M.H.; Zhou, Q.G.; Meng, H.B.; Peng, C.H.; Liu, X.W. Construction of ecological security pattern in a mega mountain city based on circuit theory: A case study of the metropolitan area of Chongqing. Res. Soil Water Conserv. 2021, 28, 319–325+334. [Google Scholar]
  54. Li, F.; Zhu, G.; Guo, C. Shiyang River ecosystem problems and countermeasures. Agric. Sci. 2013, 4, 72–78. [Google Scholar] [CrossRef]
  55. Yang, L.; Feng, Q.; Lu, T.; Adamowski, J.F.; Yin, Z.; Hatami, S.; Wen, X. The response of agroecosystem water use efficiency to cropland change in northwest China’s Hexi Corridor. Agric. Water Manag. 2023, 276, 108062. [Google Scholar] [CrossRef]
  56. Sun, Y.W.; Wei, X.M.; Zhang, L.; Bi, W.T. Evaluation of ecological and environmental quality in the Shiyang River Basin. Chin. Rural. Water Hydropower 2007, 119, 113–115. [Google Scholar]
  57. Jin, L.; Xu, Q.; Yi, J.; Zhong, X. Integrating CVOR-GWLR-Circuit model into construction of ecological security pattern in Yunnan Province, China. Environ. Sci. Pollut. Res. 2022, 29, 81520–81545. [Google Scholar] [CrossRef]
  58. Xu, Z.; Peng, J. Ecosystem services-based decision-making: A bridge from science to practice. Environ. Sci. Policy 2022, 135, 6–15. [Google Scholar] [CrossRef]
  59. Pan, J.H.; Li, L. Optimization of ecological security pattern in the Gansu section of the Yellow River Basin using OWA and circuit models. Trans. Chin. Soc. Agric. Eng. 2021, 37, 259–268. [Google Scholar]
  60. Zhang, L.; Peng, J.; Liu, Y.; Wu, J. Coupling ecosystem services supply and human ecological demand to identify landscape ecological security pattern: A case study in Beijing–Tianjin–Hebei region, China. Urban Ecosyst. 2017, 20, 701–714. [Google Scholar] [CrossRef]
  61. Peng, J.; Guo, X.N.; Hu, Y.N.; Liu, Y.X. Construction of mountain ecological security pattern based on geological hazard sensitivity: A case study of Yuxi City, Yunnan Province. Chin. J. Appl. Ecol. 2017, 28, 627–635. [Google Scholar]
  62. Yang, Z.G.; Jiang, Z.Y.; Guo, C.X.; Yang, X.J.; Xu, X.J.; Li, X.; Hu, Z.M.; Zhou, H.Y. Construction of ecological network in Guangzhou City based on morphological spatial pattern analysis and minimum cumulative resistance model. Chin. J. Appl. Ecol. 2018, 29, 3367–3376. [Google Scholar]
Figure 1. Geographical location and land use types of the Shiyang River Basin.
Land 14 02159 g001
Figure 2. Research Roadmap.
Land 14 02159 g002
Figure 3. Spatial pattern of ecosystem services in the Shiyang River Basin: (a) HQ: Habitat Quality, (b) WY: Water Yield, (c) SR: Soil Retention, (d) CF: Carbon Fixation.
Land 14 02159 g003
Figure 4. Spatial distribution of ecosystem services under different OWA scenarios. (ag) represent Scenarios 1 to 7.
Land 14 02159 g004
Figure 5. Resistance Surface of the Shiyang River Basin.
Land 14 02159 g005
Figure 6. ESP in the Shiyang River Basin.
Land 14 02159 g006
Figure 7. Spatial syntax indicators and corridor classification in the study area. (a) NQPDE, (b) TPBt, (c) MED, (d) Grading of corridors.
Land 14 02159 g007
Figure 8. ESP planning of the Shiyang River Basin.
Land 14 02159 g008
Table 1. Overview of research data.
Date TypeData SourcesSpatial
Resolution
Time Resolution
Land UseESA WorldCover10 mAnnual
Elevation (DEM)China Geospatial Data Cloud30 m
PrecipitationNational Tibetan Plateau Data Center1 kmMonthly
EvapotranspirationNational Tibetan Plateau Data Center1 kmMonthly
Soil DataNational Tibetan Plateau Data Center1 kmAnnual
NDVIResource and Environment Science Data Center250 mMonthly
Road NetworkOpenStreetMap-Annual
Table 2. Habitat suitability of each Land Use type and its sensitivity to each threat factor.
Land UseHabitat
Suitability
CroplandBulit-UpBare
Cropland0.30.30.40.4
Tree cover10.70.50.3
Grassland0.90.40.60.4
Water body10.50.90.6
Ice10.50.10.4
wetland0.30.20.20.2
Bare0000
Bulit-up0000
Table 3. Maximum impact distance and weight of each threat factor.
Threat FactorMaximum Impact Distance (km)WeightDecline Type
Cropland0.50.7linear
Bare31exponential
Bulit-up0.80.2linear
Table 4. Biophysical Coefficients for Different Land Use Types.
Land UseEvapotranspiration
Coefficient
Maximum Root Depth (mm)
Cropland0.652000
Tree cover13500
Grassland0.652400
Water body1.11000
Ice0.210
wetland0.61000
Bare0.5500
Bulit-up0.310
Table 5. Biophysical Parameters for Soil Retention.
Land UseCrop Management
Coefficient
Engineering Measures
Coefficient
Cropland0.221
Tree cover0.061
Grassland0.071
Water body01
Ice11
wetland11
Bare11
Bulit-up0.30
Table 6. Carbon Density of Different Land Use Types.
Land UseC AboveC BelowC SoilC Dead
Cropland0.11.59.10
Tree cover0.61.68.40.6
Grassland0.82.215.80.06
Water body0000
Ice0000
wetland0.21.07.00.95
Bare0.01000
Bulit-up0000
Table 7. Grade classification of resistance surface.
Resistance TypesFactorsResistance ValueData Source
Land-use ESA WorldCover
Forest1
Grassland5
Cropland10
Bare Land15
Water Body1
Built-up20
Habitat Quality Generated by the Habitat Quality Module of the InVEST Model
0–0.131
0.13–0.355
0.35–0.5610
0.56–0.7415
0.74–120
Table 8. Ecological Sensitivity Grade Classification.
EvaluationValues
Not SensitiveMildly SensitiveModerately
Sensitive
Highly SensitiveExtremely Sensitive
15101520
Land-useForest,
Water Body
GrasslandCroplandBare LandBuilt-up
NDVI≤0.18(0.18, 0.33](0.33, 0.44](0.44, 0.60]>0.60
Railway buffer (m)>2000(1500, 2000](1000, 1500](500, 1000]≤500
Highway buffer (m)>1500(1000, 1500](500, 1000](100, 500]≤100
Water Body buffer (m)>1000(700, 1000](500, 700](100, 500]≤100
Soil erosionUsing the natural break method to classify into five grades.
Table 9. The average values of each ecosystem service in different districts and counties.
DistrictsHabitat QualityWater YieldSoil RetentionCarbon
Sequestration
Minqin0.120.827.613.0
Jinchuan0.1622.359.817.1
Yongchang0.30102.3223.032.6
Shandan0.35335.1234.510.4
Sunan0.51449.4390.114.1
Liangzhou0.2546.9155.843.2
Tianzhu0.50316.4347.815.9
Gulang0.3386.56225.425.6
Table 10. Order weights.
ScenarioRisk Coefficient a w 1 w 2 w 3 w 4
10.00011.0000.0000.0000.000
20.10.8710.0620.0390.028
30.50.5000.2070.1590.134
410.2500.2500.2500.250
520.0630.1870.3130.437
6100.0000.0010.0550.944
7100,0000.0000.0000.0001.000
Table 11. Ecosystem Service Protection Efficiency by Priority Reserve Systems under Varying Scenarios.
ScenarioProtection EfficiencyMean EfficiencyTrade-Off
Soil
Retention
Habitat QualityWater YieldCarbon
Sequestration
12.672.512.671.262.280
22.942.532.661.262.350.25
32.762.672.81.162.350.68
42.972.682.731.262.411
52.762.613.271.422.530.68
62.422.544.30.502.440.21
72.722.543.400.532.300
Table 12. The number of ecological pinch points and obstacle points in different land use types.
CroplandGrasslandBare
pinch points432027
Barriers22512
Disclaimer/Publisher’s Note: The statements, opinions and data contained in all publications are solely those of the individual author(s) and contributor(s) and not of MDPI and/or the editor(s). MDPI and/or the editor(s) disclaim responsibility for any injury to people or property resulting from any ideas, methods, instructions or products referred to in the content.