Abstract
Ecosystem services play a crucial role in maintaining ecological balance and supporting socio-economic development. However, long-term human activities and climate change have led to severe ecosystem degradation and exacerbated soil erosion on the Loess Plateau. This study takes the Loess Plateau as a case study and using key models such as Integrated Valuation of Ecosystem Services and Tradeoffs (InVEST) to analyze the spatiotemporal variations of five ecosystem services—water yield, habitat quality, windbreak and sand fixation, soil conservation, and net primary productivity (NPP)—from 2000 to 2020. Based on the land use types projected by the Patch-generating Land Use Simulation (PLUS) model for 2025 and 2030 under natural development, ecological protection, and cropland protection scenarios, the study simulates these five ecosystem services and the comprehensive ecosystem service index for the Loess Plateau in 2025 and 2030. Finally, an ecological risk assessment model based on the inverse transformation of ecosystem services is constructed to identify key ecological restoration areas on the Loess Plateau by 2030. The results indicate: (1) From 2000 to 2020, water yield, soil conservation services, and NPP on the Loess Plateau showed a significant increasing trend, The unit area sand fixation capacity displayed a spatial pattern of higher values in the Northwest and lower values in the Southeast, while soil conservation and NPP exhibited the opposite trend, with higher values in the Southeast and lower values in the Northwest. Water yield decreased from the Southeast to the Northwest. During this period, the comprehensive ecosystem service index of the Loess Plateau generally declines, but the balance and synchronicity of ecosystem services improve, with a reduction in regional disparities. (2) Different future scenarios have different effects on the regional pattern of ecosystem services and restoration. Among future scenarios, the ecological protection scenario is most conducive to enhancing comprehensive ecosystem services, reducing the proportion of medium- and high-priority restoration zones. The cropland protection scenario has the lowest proportion of general restoration zones, but local ecological risks increase. The findings of this study can provide a scientific basis for ecological restoration and land-use planning on the Loess Plateau, promoting the long-term stability and sustainable development of ecosystem services.
1. Introduction
Ecosystem services (ES) refer to the various direct or indirect benefits provided by ecosystems to human society through their structure and functions and are an important bridge to realize the quantitative assessment of ecosystem value and promote sustainable development [1]. The ‘Global Biodiversity and Ecosystem Services Assessment Report’ pointed out that the intensification of climate change has led to ecological and environmental problems such as land degradation and degradation of ecosystem services. Ecosystem restoration is one of the effective means to cope with the current severe ecological challenges [2]. Ecological restoration aims to restore the structure, function, and biodiversity of damaged ecosystems and to improve the ecological benefits and service value of these ecosystems [3]. China has always placed ecological civilization construction in an important position [4] and is committed to promoting the development of ecological civilization and safeguarding human well-being [5]. At the same time, China has implemented a number of major ecological restoration projects [6] to reduce the risk of ecological degradation and ensure national ecological security.
The Loess Plateau is one of the typical regions with prominent global ecological and environmental problems. Its unique topography, climate and long-term unreasonable land use make it one of the most serious soil erosion areas in the world [7]. Large-scale soil erosion and vegetation degradation not only lead to the continuous decline of ecosystem service supply capacity in the Loess Plateau but also affect the ecosystem security and socio-economic development of the lower Yellow River Basin [8]. Large-scale soil erosion and vegetation degradation not only lead to the continuous decline of ecosystem service supply capacity in the Loess Plateau but also affect the ecosystem security and socio-economic development of the lower Yellow River Basin [9]. In recent years, the Chinese government has implemented a series of ecological restoration projects. These measures have achieved certain results in improving the regional ecological environment, but they also face the unclear spatial and temporal evolution of ecosystem services. In the future, the changes in ecosystem services in different scenarios are unknown, and the identification of key areas for ecological restoration lacks scientific methods. In some areas, there is a phenomenon of excessive or insufficient restoration, resulting in waste of resources and ecological functions that are not expected. Therefore, scientifically identifying key areas of ecosystem services and formulating targeted ecological restoration strategies are important prerequisites for achieving ecological security in the Loess Plateau [10].
At present, the main methods for identifying key areas of ecological restoration can be divided into three categories [11]: The first method establishes an ecological restoration pattern by analyzing the background of natural resources and combining regional characteristics. The second method uses the index system method to evaluate ecological health [12], ecological security [13], and ecological service function [14]. Key indicators (such as vegetation cover, climate, landscape pattern index, and ecological service function) were selected to delineate ecological restoration areas [15]. The third is based on the theory of the ecological security pattern. By identifying ‘ecological source-resistance surface-ecological corridors, ecological obstacle points and ecological pinch points are identified as key restoration nodes [16]. Among the three methods, the most commonly used are ecological health evaluation, ecological service function evaluation and ecological security pattern method based on an index system. Ecological health assessment is mainly used to measure the structural and functional stability of ecosystems and is an effective means to identify damaged areas [17]. The commonly used Pressure-State-Response (PSR) model has the characteristics of systematization and clear causal logic. It can reveal the relationships among various ecosystem elements and is widely used across many evaluation fields, such as ecological health, risk, and sensitivity [5]. Its advantage is that the method has clear logic and high flexibility [18], but it has high scientific requirements for the selection of indicators. Improper indicators may affect the accuracy of evaluation [19]. Ecological service function evaluation focuses on various direct or indirect benefits provided by ecosystems to human beings and plays a key role in the relationship between ecosystems and social well-being [4]. The InVEST model has the characteristics of high precision, a wide application range and easy data acquisition. It can present multiple ecological service functions and predict future trends at the spatial scale [20]. By analyzing the supply-and-demand relationship of ecological service functions and the coordination and balance of key nodes [21], the contradiction between supply and demand of ecological functions can be avoided, and the construction of a security pattern can be promoted [22]. By identifying the degraded and damaged areas of ecological functions, key restoration targets can be more clearly identified, but the mutual constraints between various ecological service functions and the impact of external disturbances still need to be considered. The ecological security pattern method emphasizes the connectivity of ecosystem structure and process [23]. This method is derived from research on the protection of biological habitats and migration corridors. Tools such as the minimum resistance model and circuit theory are often used to simulate the minimum-cost path of species migration or ecological flow diffusion to determine ecological corridors and key nodes. However, this method cannot fully consider the interference of external factors such as climate change and human activities [24]. In addition, traditional ecological restoration strategies usually lack dynamic simulation of future scenarios, and it is difficult to provide long-term and forward-looking guidance for regional ecological management [25].
Based on this, this study takes the Loess Plateau as the research area and constructs a key-area identification framework for ecological restoration based on multi-model use, multi-scenario simulation, and reverse risk assessment. Firstly, InVEST, RWEQ, RUSLE and CASA models were used to quantitatively analyze the spatial and temporal evolution of five core ecosystem services of water yield, habitat quality, windbreak and sand fixation, soil conservation and NPP from 2000 to 2020, breaking through the limitations of single-service evaluation. Secondly, based on the PLUS model, the land-use patterns under the scenarios of natural development, ecological protection, and cultivated land protection in 2025 and 2030 are predicted. The coupled multi-model is used to simulate changes in service supply capacity under different policy orientations, and a comprehensive service index is constructed to evaluate the co-evolution trend. Finally, a risk assessment model for the reverse transformation of ecosystem services is innovatively proposed to identify high-risk degradation areas in 2030 by quantifying the mutation probability of service functions from high-level to low-level. The research results can provide decision support for ecological risk management and precise restoration in the Loess Plateau.
2. Data and Methods
2.1. Overview of the Study Area
The Loess Plateau is located in the North–Central region of China, with geographical coordinates of 33°43′~41°16′ N, 100°~114°33′ E, spanning seven provinces and regions of Shanxi, Shaanxi, Henan, Inner Mongolia, Ningxia, Gansu and Qinghai, with an area of about 640,000 km2 (Figure 1). The Loess Plateau is connected to the Taihang Mountains in the east, the Qinling Mountains in the South, the Qilian Mountains in the west, and the Inner Mongolia Plateau in the North. It is closely connected to the upper and middle reaches of the Yellow River. It is one of the representative regions in the geographical division of our country. The Loess Plateau is the largest, most widely distributed, and most deeply deposited loess distribution area in the world. The thickness of the loess on the loess Plateau ranges from tens of meters to hundreds of meters, forming a unique natural landscape and landform [26]. It provides an important place for studying the evolution of loess morphology and ecological environment change. The Loess Plateau can be divided into six ecological regions, including the loess plateau gully region, the loess hilly and gully region, the sandy land and agricultural irrigation area, the soil and rock mountainous area, and the river valley plain area [27]. The topography of the Loess Plateau is high in the Northwest and low in the Southeast, and the altitude is mainly distributed between 1000 and 2000 m. The intricately dissected erosional landforms, characterized by countless ravines and gullies, bear witness to the region’s severe historical soil erosion [28]. The geology of the Loess Plateau is formed by the accumulation of Quaternary aeolian loess, which has a loose structure, high porosity, and weak erosion resistance, and is one of the typical representatives of global aeolian sedimentation [29].
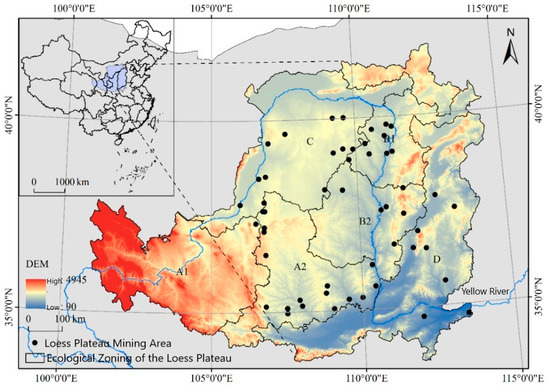
Figure 1.
Ecological Regionalization of the LP. loess sorghum gully subregions, A1, A2; loess hilly and gully subregions, B1, B2; sandy land and agricultural irrigation subregion, C; earth-rock mountain and river valley plain subregion: D.
2.2. Data Source and Preprocessing
The meteorological data of wind speed, precipitation, temperature and other meteorological data used in this study were derived from the China Meteorological Data Network (https://data.cma.cn/), and a total of 137 stations in and around the Loess Plateau were selected, and the Australian National University Spline (ANUSPLIN) interpolation method was used as raster data. The vegetation coverage dataset and snow depth long-time series dataset are derived from the data from the National Tibetan Plateau Data Center (http://data.tpdc.ac.cn), and the snow depth dataset is converted into raster data in ArcGIS 10.8 software, and the snow cover factor is calculated. Land use data, digital elevation model (DEM) data, population density data, and Gross Domestic Product (GDP) data are from the Resource and Environmental Science Data Center (http://www.resdc.cn) of the Chinese Academy of Sciences, and the land use data is reclassified according to the secondary classification, which is divided into the following six categories: cultivated land, forest land, grassland, water area, construction land, and unused land. The slope data are calculated based on DEM data using slope analysis tools in ArcGIS software. The soil data attribute data is derived from the World Soil Database (https://www.fao.org/) with a resolution of 1 km, and the data content includes soil type, physical properties, chemical properties and hydraulic properties. The main data used in this paper include sand content (%), silt content (%), clay content (%), and organic carbon content (%). The zonal data of the Loess Plateau are from the National Earth System Science Data Center (http://www.geodata.cn). The distribution data of major ecological projects in China comes from the ecological network cloud platform of the National Ecological Science Data Center (http://www.nesdc.org.cn). The coordinates of the center point of the coal mining area on the Loess Plateau are based on the research results of Bian Zhengfu et al. [30], and the buffer zone tool was used in ArcGIS software to establish a 20 km buffer zone as a mining area to study the impact of mining on the comprehensive ecosystem services of the Loess Plateau. Livestock density data are derived from the Food and Agriculture Organization of the United Nations (FAO) World Livestock Grid Dataset (https://www.fao.org/home/en/) and are used to quantify grazing intensity. Finally, all raster data were uniformly converted into the Albers projection and resampled to 1 km resolution.
The technical route of this paper mainly includes three stages: data collection, analysis of spatial and temporal changes and influencing factors of ecosystem services, future scenario prediction and key area identification. The technical route is shown in Figure 2.
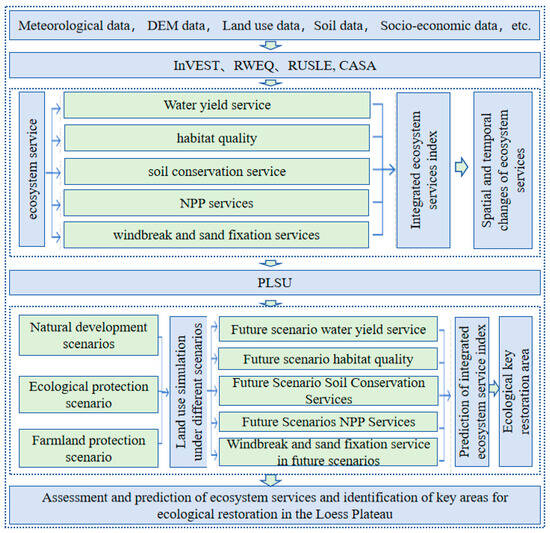
Figure 2.
Technical route.
2.3. Research Method
2.3.1. Ecosystem Service Assessment Method
- (1)
- Water Yield Assessment Method
Water yield is an important hydrological service function of ecosystems, which measures the ability of ecosystems to convert precipitation into surface runoff [31]. In this study, the Water Yield Model in the InVEST model was used for evaluation. Based on climate data, land use data, soil data and other relevant parameters, the model calculates the annual water yield of each raster cell by subtracting the actual evapotranspiration of the previous year and can quantify the water yield distribution of different raster cells.
The specific calculation formula is as follows:
where Y(x) represents the annual water yield of grid x (mm); AET(x) represents the actual evapotranspiration (mm); P(x) denotes precipitation (mm).
- (2)
- Habitat Quality Assessment Method
Habitat quality is an important part of ecosystem services and reflects the status of biodiversity in the region. This study is based on the Habitat Quality module of the InVEST model, which comprehensively evaluates habitat quality and degradation by combining the spatial distribution of land use types and threat factors, and is suitable for complex scenarios of ecosystem degradation on the Loess Plateau [32].
where Qxj is the habitat quality of grid x in land use type j; Hj is the habitat suitability of grid x in land use type J. DIJ represents the degree of habitat degradation of grid x in land use type J; k is a semi-saturation constant; Z is the default parameter of the model.
- (3)
- Wind Erosion Control Service Assessment Method
In this study, the Revised Wind Erosion Equation (RWEQ) model was used as a calculation tool to estimate the amount of windbreak and sand fixation on the Loess Plateau, and the RWEQ model comprehensively considered factors such as climate, vegetation, land use type, and soil texture to characterize the amount of windbreak and sand fixation by the difference between the potential soil wind erosion under the assumption of no vegetation and the actual soil wind erosion under vegetation protection [33].
The formula for calculating the amount of Wind Erosion Control is as follows:
where G is the amount of sand fixation per unit area (kg/m2); QLMAX is the maximum potential transfer of aeolian sand (kg/m). QPMAX is the maximum amount of actual sand transfer (kg/m), SL is the potential wind erosion amount (kg/m2); SP is the actual wind erosion amount (kg/m2); QL is the potential plot length (m); QP is the key plot length (m); WF is the climate factor (kg/m); EF is the soil erosible factor (dimensionless); SCF is the soil crust factor (dimensionless); K′ is the surface roughness factor (dimensionless); C is the vegetation cover factor (dimensionless); Z represents the downwind direction distance (m).
- (4)
- Soil conservation service evaluation method
The Universal Soil Loss Equation (USLE) is a statistical relational model used to associate the amount of soil erosion with its influencing factors (including climate, soil, topography, vegetation cover, and human activities) and can be adjusted according to the local conditions of these factors. The USLE model was first proposed by Wischmeier and Smith [34] and was used to assess the annual soil loss caused by water erosion. Subsequently, Renard et al. [35] revised the USLE model, developing a revision on the general soil erosion equation (RUSLE), and introduced improved methods to calculate other soil erosion factors. This study is based on correcting the general soil loss equation to estimate the soil retention of the Loess Plateau. The specific formula is as follows:
where A is the soil retention amount (t·hm−2·a−1); A1 is the potential soil erosion amount (t·hm−2·a−1); A2 is the actual soil erosion amount (t·hm−2·a−1); R is rainfall erosion Force factor (MJ·mm·hm−2·h−1·a−1); K is the soil eros ability factor (t·h·MJ−1·mm−1); L is the slope length factor; S is the slope factor; C is the vegetation cover factor (immeasurable Class); P is the factor of soil and water conservation measures (dimensionless).
- (5)
- NPP evaluation method
The Carnegie–Ames–Stanford Approach (CASA) model is a net Primary Productivity (NPP) estimation model for vegetation based on light energy utilization [36]. The model is based on data such as precipitation, air temperature, solar radiation, NDVI, etc., and can estimate the productivity of vegetation at different time scales and spatial scales. In this paper, the CASA model improved by Zhu Wenquan et al. [37] is used. The specific calculation formula is as follows
where APAR (x,t) represents the photosynthetic effective radiation absorbed by the vegetation of cell x in month t, and ε (x,t) represents the actual light energy utilization rate of the vegetation of cell x in month t.
- (6)
- Factor time series change trend test method
The Sen + Mann–Kendal trend test is a classical nonparametric statistical method that is widely used for trend changes in time series data [38]. The Sen method was used to analyze the trend of driving factors and comprehensive ecosystem services on the Loess Plateau from 2000 to 2020. The formula for its calculation is found in the references [39].
2.3.2. Ecosystem Service Verification Method
In order to verify the simulation results of the ecosystem service model, this study will use the water production and habitat quality results simulated by the InVEST model and the NPP data simulated by the CASA model to compare with the spatial distribution of global land water production year by year, the historical high-resolution ecological environment quality data set of China, and the net primary productivity data set of China’s MOD17A3H vegetation fitting MATLAB R2022b software is used to pixel–level pair the calculated ecosystem service simulation values with existing product data sets. 137CS tracer technology is a commonly used method to verify the accuracy of the RWEQ model in simulating soil wind erosion [40]. In order to verify the accuracy of the RWEQ model in soil wind erosion simulation on the Loess Plateau, the 137CS tracer technology is commonly used to verify the accuracy of the RWEQ model in soil wind erosion simulation on the Loess Plateau. In this study, by searching in the literature [40,41], 23 sets of 137CS tracer measurement data from different locations and years were collected. Origin 2021 software was used to linearly fit these data with the simulation results of the RWEQ model in this study to verify the accuracy of the windproof and sand-trapping service estimation results. In order to verify the accuracy of the RUSLE model in the soil retention simulation of the Loess Plateau, Origin software is used to linearly fit the results of the RUSLE model with the sand transport volume of the Loess Plateau hydrological site to verify the accuracy of the soil retention estimation results.
2.3.3. Construction Method of Comprehensive Service Indicators for Ecosystem Services
Indicators of integrated ecosystem services at a regional level can reflect the overall status of ecosystem services in the region. In order to comprehensively measure multiple ecosystem services, different types and different units of services are usually placed on the same accounting platform, and the regional comprehensive service indicators are calculated by weighted aggregation and other methods. However, this aggregation may mask the equilibrium of services, leading to the substitution of high-value services for low-value services [42]. For example, when the total value of services in two regions is the same, there may be significant differences in the degree of balance of services within them, and these differences cannot be fully reflected by the aggregate results. To solve this problem, this study took the Loess Plateau as the study area, and selected water yield, habitat quality, windbreak and sand fixation, soil conservation and net primary productivity (NPP) as the main ecosystem service indicators and constructed a comprehensive evaluation method based on equilibrium considerations. Referring to existing studies [43], the discrete coefficient method was used as the core algorithm to evaluate regional ecosystem services based on raster cells. The dispersion coefficient can comprehensively reflect the relative dispersion degree of various ecosystem services, and by quantifying the differences between ecosystem service indicators, the significant shortcomings can be directly reflected in the evaluation results, so as to make up for the shortcomings of the traditional aggregation method. In this paper, the material quality of the five types of ecosystem services on the raster cells is standardized, then the ecosystem service index (ESi) of each raster cell is calculated, and finally the comprehensive index of ecosystem services on the Loess Plateau is calculated by using the dispersion coefficient method based on the ecosystem service index of each raster cell in the region. The specific calculation formula is as follows:
where ESi is the ecosystem service index of the i-th grid cell; xij is the normalized value of the j-type ecosystem service on the i-th raster in the region; xij is the average value of the normalized value of class j ecosystem services on the i-th raster; N is the main types of ecosystem services in the region. The above methods are suitable for the comprehensive assessment of ecosystem services between different research units, between different types of ecosystem services, and over different time periods. When the regional ecosystem services composite index is low, it indicates that the differences between various ecosystem services are smaller, reflecting higher equilibrium and synchronization. On the contrary, there is a greater difference.
2.3.4. Analysis Method of Influencing Factors of Ecosystem Services Comprehensive Service
The partial derivative method can accurately and quantitatively evaluate the impact and relative contribution of human activities and climate change on the integrated ecosystem services and can reflect the spatial impact of various factors on the integrated ecosystem services. Based on the relationship between the comprehensive ecosystem service index (response variable) and climatic factors (limiting variable) on the Loess Plateau, this paper uses the improved constraint line analysis method to reveal the boundary influence of limiting variables on ecosystem services. Firstly, the data of response variables and limiting variables are normalized or standardized, and the data of different dimensions are transformed into dimensionless data to ensure the comparability between variables. Climatic factors selected precipitation and evapotranspiration. Secondly, the time series data is divided into three stages: 2000, 2010, and 2020. The average values of response variables and limiting variables in each stage are calculated, respectively, and divided into 100 quantiles according to the quantile method to ensure the representativeness and uniformity of the data in the boundary extraction process.
2.3.5. PLUS Model Parameter Setting
The selection of driving factors should cover multiple aspects of the natural environment and socio-economic factors to ensure comprehensiveness and accuracy of the simulation results. Based on the principles of data availability, spatial variability and quantifiability, this study selected 12 driving factors reflecting the natural environment and human factors. In ArcGIS, the European distance tool is used to rasterize and normalize the driving factors to construct a complete driving factor system. The driving factors include precipitation, temperature, DEM, slope, GDP, population density, distance from primary road, distance from secondary road, distance from tertiary road, distance from railway, distance from water, and distance from residential areas (Please refer to Appendix B for details). It was found that the social drivers (such as distance from settlements and roads) in the Loess Plateau showed the distribution characteristics of dense in the Southeast and sparse in the Northwest, while the natural driving factors (such as rainfall) showed the distribution characteristics of low in the Northwest and high in the Southeast.
In the LEAS module, this study uses 2000, 2010, and 2020 data to predict land use types in 2025 and 2030 at 5-year and 10-year time steps, respectively, based on 2020 land use data. Firstly, the model is trained using two phases of land-use type conversion samples, and the random forest algorithm is used to evaluate the influence of each driving factor on land-use change. The model parameters are set as follows: the number of decision trees is 20, the sampling rate is 0.01%, and the number of training features is 12. These parameters are used to assess the extent to which each driver affects land-use change. The CARS module simulates the process of land-use expansion and change, especially how land-use change spreads spatially under the action of different driving factors. The parameters are set as follows: the threshold of plaque generation is 0.5, the diffusion coefficient is 0.1, the neighborhood factor is 3, and the number of parallel threads is set to 6 to improve the simulation efficiency and shorten the calculation time.
In the PLUS model, the neighborhood weight is used to describe the degree to which the land use change of a certain land cell is affected by the surrounding environment, and the value range is 0~1. Referring to relevant research, this paper combines the area proportion of land use expansion from 2000 to 2020 and the accuracy and Kappa coefficient of land use simulation in 2020, and adjusts the simulation parameters many times to ensure the best simulation effect, and finally sets the field weights of cultivated land, grassland, forest land, water area, construction land and unused land to 0.42, 0.15, 0.03, 0.01, 0.34 and 0.05. Based on land-use data from 2000, 2005, 2010, and 2020, a linear regression model was used to predict future land-use demand. The transfer matrix represents the transfer rules between various land use types: 1 represents changeable, 0 means cannot be changed, and the corresponding transfer matrix is set according to different development scenarios, see Appendix A for specific settings.
2.3.6. Scenario Mode Construction of the PLUS Model
In the past 30 years, the urbanization rate of the Loess Plateau has increased by about 30%. The landscape structure of agriculture, animal husbandry and forestry in the process of urbanization has undergone complex changes, which have had a complex impact on ecosystems such as soil and water conservation [44]. “National Main Functional Area Plan” [45], “National Ecological Functional Area Zoning” [46], “Loess Plateau Comprehensive Management Plan Outline (2010–2030)” [47] Pointed out that the Loess Plateau is facing the pressure of arable land protection and the contradiction between urbanized land use, How to balance the relationship between urbanization, agricultural land and ecological protection has become the core issue of land use simulation. Combining the orientation of policy planning and the current situation of land use on the Loess Plateau, based on reference to relevant research [48,49], this paper sets up three land use scenarios, as follows:
- (1)
- Natural development scenario: Under the natural development scenario, the trend of changes in land use types on the Loess Plateau from 2000 to 2020 will be maintained, and the water area will be set as a restricted area at the same time. This scenario refers to the land and spatial planning of various places on the Loess Plateau and rationally adjusts the land transfer matrix and domain weights to ensure the scientific and coordinated land development and utilization.
- (2)
- Ecological protection scenario: Take ecological protection as the core goal, strictly abide by the red line of ecological protection, and avoid the conversion of woodland and grassland to other land use types. As a whole, it advocates eco-friendly development and sets up water areas and national ecological protected areas as restricted transformation areas. Increase the area weight of woodland and grassland by 0.01 and reduce the area weight of unused land by 0.02.
- (3)
- Arable land protection scenario: The main goal is to abide by the red line of arable land protection, limit the expansion of construction land, especially the occupation of arable land, and at the same time prevent the transformation of arable land to other land types. The water area is set as a restricted area, and except for construction land, other land types can be converted into arable land. The domain weight of cultivated land was increased by 0.03, and the domain weight of construction land and unused land was reduced by 0.02 and 0.01.
2.3.7. Accuracy Validation of Land Use Simulation
In order to verify the prediction accuracy of the PLUS model, the CARS module was used to predict the land use pattern in 2020 based on the land use data of 2000 and 2010, and the prediction results were compared and analyzed with the actual data, and the FOM coefficient and Kappa coefficient were calculated in the Confusion Matrix and FOM module of the PLUS model to test the reliability. The specific calculation formula is as follows:
where A represents the error region (number of missed cells) that changes in reality and is predicted to be constant; B indicates the correct area (number of hit cells) where the actual change and the prediction is also change; C indicates the error region (number of false hit cells) where the actual change is inconsistent with the predicted change; D represents the error region (number of false alarm cells) that is actually unchanged and predicted to change; P0 is the proportion of the correct simulation results, that is, the overall accuracy of the model; Pc is the proportion of the expected simulation results to be correct; PP is the proportion of the simulation results that are correct in the ideal state.
2.3.8. Identification Method for Ecological Restoration Priority Areas
The purpose of ecological risk assessment is to assess the potential risk of degradation of regional ecosystem services and to provide a scientific basis for ecological restoration and management based on the temporal variation and spatial distribution characteristics of ecosystem services. From the perspective of ecosystem service equilibrium, this study uses the calculated long-term series of ecosystem service comprehensive index to construct an ecological risk assessment EVR (Ecological Value at Risk) model based on the R = P × D model based on changes in ecosystem comprehensive services [50]. The probability of loss of ecosystem services is characterized by the proportion of the area of reverse transformation of various types of ecosystem services, and the amount of risk loss is characterized by the difference in the comprehensive index of ecosystem services per unit of reverse transformation of ecosystem services. The specific calculation formula is as follows:
where P is the reverse conversion rate of ecosystem services, which represents the proportion of the degraded area to the total area of the research area; ΔS represents the area of the reverse transformation area; S represents the total area of the research area; ΔESi represents the difference in the comprehensive index of ecosystem services per unit for the reverse transformation of ecosystem services; n represents the total area of all time points The number of differences. The EVR ecosystem risk value comprehensively reflects the magnitude and scope of degradation in the reverse transformation area.
The EVR is graded using the natural breakpoint method in ArcGIS, and the ecosystem risk value is divided into five levels. Refer to the risk level assessment table in GB/T50326-2006 of the “Construction Project Management Specification” (Please refer to Appendix B for details) [51], and explore the causes of ecological risks [52]. Ecological risk is comprehensively characterized by the probability of ecological risk and the loss of ecological risk. At the same risk level, when the probability of ecological risk to the ecosystem is small, the loss of ecological risk is greater, and vice versa. Therefore, it is necessary to weigh the interaction between the two, take scientific and effective risk control measures to reduce the risks to the ecosystem, and maximize the benefits of ecosystem services. In summary, the ecological risks of level 1 and level 2 risk areas are relatively low, and levels 3, 4, and 5 are initially divided into general restoration areas, medium–excellent restoration areas, and high–excellent restoration areas. This method combines the spatiotemporal changes, spatial equilibrium, and the degree of degradation of the comprehensive ecosystem service index to construct a quantitative evaluation model, which solves the shortcomings of traditional methods in considering the internal relationship and spatiotemporal dynamic characteristics of ecosystem services. Based on the changes in the comprehensive ecosystem service index, the magnitude and distribution characteristics of functional degradation are dynamically reflected, and the spatial scope of degradation is effectively characterized by the reverse conversion rate.
3. Results and Analysis
3.1. Spatiotemporal Variations of Ecosystem Services
3.1.1. Spatiotemporal Variation Characteristics of Water Yield
- (1)
- Temporal variation characteristics
The average annual water yield of the Loess Plateau from 2000 to 2020 was calculated by ArcGIS software, and the average annual water yield of the Loess Plateau in 2000, 2005, 2010, 2015 and 2020 was 202.25 mm, 204.99 mm, 256.99 mm, 224.48 mm and 302.57 mm. Origin was used for linear fitting to plot the temporal trend of annual average water yield on the Loess Plateau from 2000 to 2020. The results show that the water yield on the Loess Plateau from 2000 to 2020 showed an overall upward trend, and the annual average water yield increased at a rate of 4.41 mm. The annual average water yield in 2000 was the lowest, and the annual average water yield in 2020 is the highest (Figure 3).
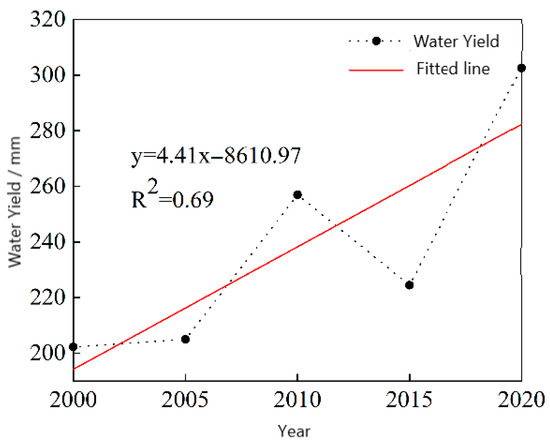
Figure 3.
Temporal variation of water yield on the Loess Plateau from 2000 to 2020.
- (2)
- Spatial variation characteristics
From 2000 to 2020, the spatial distribution pattern of water yield on the Loess Plateau was relatively similar, showing a decreasing trend from Southeast to Northwest, with the areas with high water yield mainly distributed in A1, A2, B1, B2 and D, and the areas with low water yield mainly distributed in C. the spatial variation of water yield on the Loess Plateau mainly showed a slight and non-significant increase in trend (Figure 4f), accounting for 82.93% of the study area, and the slightly significant increase in area was mainly distributed in B2 area, accounting for 19.91% of the study area. Areas with a slight and significant decrease in water yield were mainly distributed at the Northwest end of A1 and the South end of the D zone, accounting for 6.61% of the study area. The unchanged areas were mainly distributed in sub-district C, accounting for 7.04% of the study area.
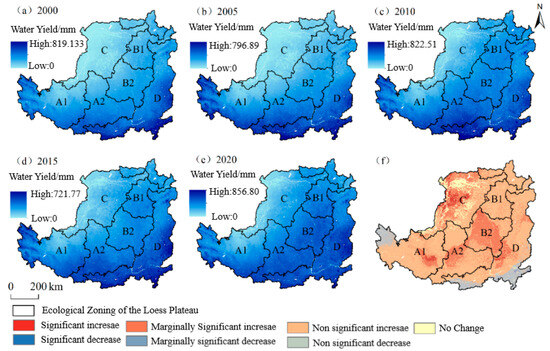
Figure 4.
(a–e) Spatial distribution of water yield on the Loess Plateau from 2000 to 2020; (f) Spatial trend of water yield on the Loess Plateau from 2000 to 2020.
3.1.2. Spatiotemporal Variation Characteristics of Habitat Quality
- (1)
- Temporal variation of habitat quality
The InVEST model was used to calculate the high in situ quality of loess from 2000 to 2020, and the habitat quality was statistically analyzed by ArcGIS software. The results showed that the annual average in situ quality of loess in 2000, 2005, 2010, 2015, and 2020 was 0.558, 0.557, 0.548, 0.546, and 0.542. From 2000 to 2020, the high in situ quality of loess showed an overall decreasing trend, but the range of changes was small. The annual average value of habitat quality was the highest in 2000, and the lowest annual average value of habitat quality per unit area was in 2020, as shown in (Figure 5).
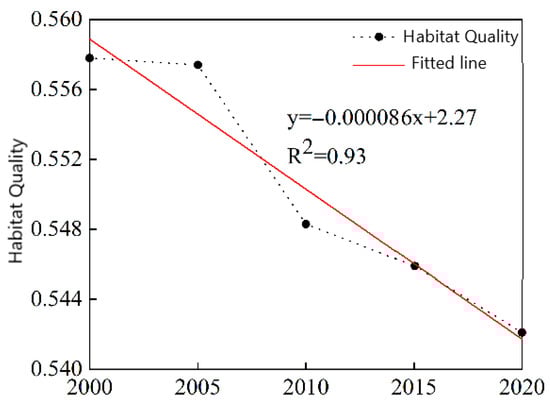
Figure 5.
Temporal variation of habitat quality on the Loess Plateau from 2000 to 2020.
- (2)
- Spatial variation of habitat quality
From 2000 to 2020, the areas with high in situ quality of loess were mainly distributed in the western part of A1 subdivision, the eastern part of A2 subdivision, the Eastern part of A1 subdivision, the Eastern part of B2 subdivision and the central area of subdivision D, while the areas with low habitat quality were mainly distributed in the Northern part of constituency C and subdivision D. From 2000 to 2020, the spatial variation of loess high in situ quality mainly showed no change trend, accounting for 56.28% of the study area, indicating that the overall change of loess high in situ quality from 2000 to 2020 was small, as shown in (Figure 6f). From 2000 to 2020, the area with an increasing trend of loess high in situ quality accounted for 12.06% of the study area, and the overall distribution was relatively uniform. The area with a decreasing trend of habitat quality accounted for 31.66% of the study area, which was mainly distributed in B1, B2 and D.
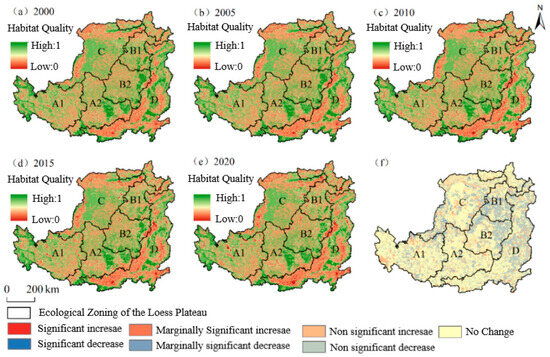
Figure 6.
(a–e) Spatial distribution of habitat quality on the Loess Plateau from 2000 to 2020; (f) Spatial Trend of Habitat Quality on the Loess Plateau from 2000 to 2020.
3.1.3. Spatiotemporal Variation Characteristics of Windbreak and Sand Fixation Services
- (1)
- Temporal variation of windbreak and sand fixation services
The RWEQ model was employed to calculate the sand fixation capacity per unit area in the Loess Plateau from 2000 to 2020, and ArcGIS software was utilized for statistical analysis of the computed results. The results indicate (Figure 7)that the mean annual sand fixation capacity per unit area in the Loess Plateau was 23.47 t·hm−2·a−1, 23.21 t·hm−2·a−1, 23.71 t·hm−2·a−1, 22.71 t·hm−2·a−1, and 24.03 t·hm−2·a−1 in 2000, 2005, 2010, 2015, and 2020. From 2000 to 2020, the sand fixation capacity per unit area exhibited an overall increasing trend (slope = 0.012 t·hm−2·a−1). The lowest mean annual sand fixation capacity occurred in 2015, which may be primarily attributed to significant variations in wind erosion forces. In contrast, 2020 recorded the highest mean annual sand fixation capacity.
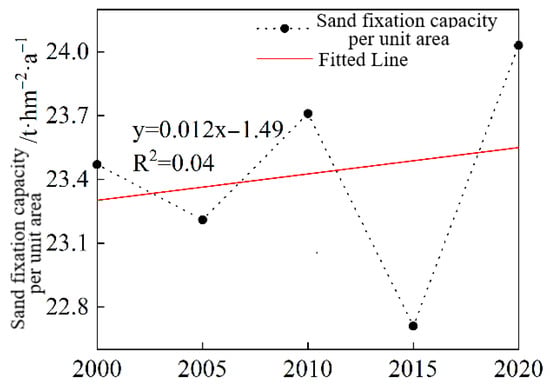
Figure 7.
Temporal variation of sand fixation per unit area on the Loess Plateau from 2000 to 2020.
- (2)
- Spatial variation of windbreak and sand fixation services
From 2000 to 2020, the Loess Plateau exhibited a distinct Northwest–Southeast gradient in sand fixation capacity per unit area, with higher values predominantly clustered in subregions A1, B1, and C, while lower values were mainly concentrated in subregions A2, B2, and D. From 2000 to 2020, the spatial distribution of sand fixation capacity changes in the Loess Plateau (Figure 8f) shows, areas with non-significant increasing trends accounted for 29.55% of the study area, mainly in subregions B1, B2 and C. Areas with marginally and significantly increasing in trends covered 4.74%, primarily at the boundary between subregions C and B2. Areas with non-significant decreasing trends comprised 46.98%, mostly in subregions A1, A2, and D.
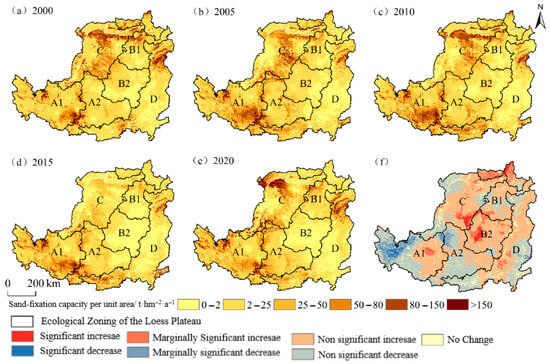
Figure 8.
(a–e) Spatial distribution of sand fixation per unit area on the Loess Plateau from 2000 to 2020; (f) Spatial trend of sand fixation per unit area on the Loess Plateau from 2000 to 2020.
3.1.4. Spatiotemporal Variation Characteristics of Soil Conservation Services
- (1)
- Temporal variation of soil conservation services
The soil conservation capacity in the Loess Plateau was calculated using the Revised Universal Soil Loss Equation (RUSLE) model for the period 2000–2020, followed by statistical analysis of the soil retention data using ArcGIS software. The results indicate (Figure 9) that the Loess Plateau experienced an overall increase in trend in soil conservation capacity from 2000 to 2020, with the mean annual soil retention rate per unit area showing a significant increase of 1.06 t·hm−2·a−1, In 2015, the annual average of soil conservation per unit area was the lowest, which was 102.67 t·hm−2·a−1, and in 2020, the highest annual average soil conservation per unit area was 193.73 t·hm−2·a−1.
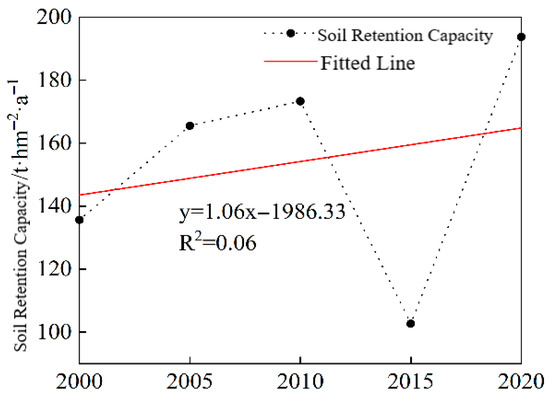
Figure 9.
Temporal variation of soil conservation on the Loess Plateau from 2000 to 2020.
- (2)
- Spatial variation in soil conservation services
From 2000 to 2020, the Loess Plateau exhibited a Southeast-high and Northwest-low spatial pattern in soil conservation capacity. Higher values primarily occurred in Subregions A2, B2, and D, while lower values were concentrated in Subregion C. Analysis of spatiotemporal trends (Figure 10f) revealed marginally significant increases across 76.67% of the study area, significant increases in predominantly in Subregion C covering 0.58% of the total area, and non-significant decreases in mainly in the Southern edge of Subregion D accounting for 18.76%.
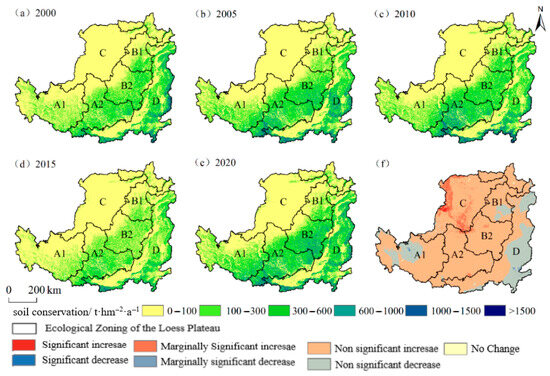
Figure 10.
(a–e) Spatial distribution of soil conservation on the Loess Plateau from 2000 to 2020; (f) Spatial trend of soil conservation on the Loess Plateau from 2000 to 2020.
3.1.5. Spatiotemporal Characteristics of NPP
- (1)
- Temporal variation of NPP
The CASA model was employed to calculate NPP in the Loess Plateau from 2000 to 2020, with subsequent statistical analysis conducted using ArcGIS software. The results (Figure 11) indicate a significant increasing trend in NPP during this period, rising at a mean annual rate of 7.09 gC·m−2·a−1.
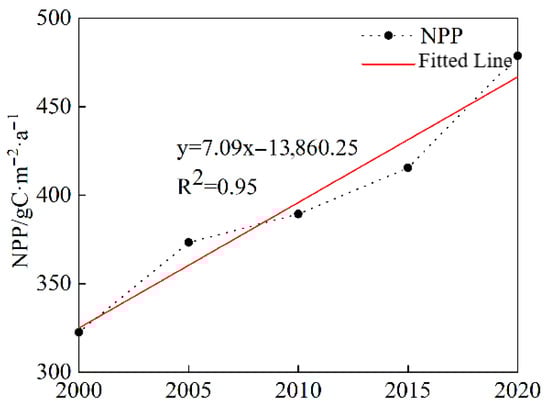
Figure 11.
Temporal variation of NPP on the Loess Plateau from 2000 to 2020.
- (2)
- Spatial variation of NPP
From 2000 to 2020, net primary productivity (NPP) in the Loess Plateau exhibited a spatial pattern characterized by higher values in the Southeast and lower values in the Northwest. Regions with relatively high NPP were primarily distributed in Subregions A1, A2, and D, while lower NPP values were mainly concentrated in Subregion C. From 2000 to 2020, the spatial distribution of NPP trends on the Loess Plateau (Figure 12f) shows an increase in trend of NPP as a whole, accounting for 95.23% of the study area, of which 20.44% showed a significant increasing trend, mainly distributed in A1, A2, B1 and B2. The area showed a slightly significant increase in trend, and the area showed a non-significant increase in trend, which accounted for 45.90%.
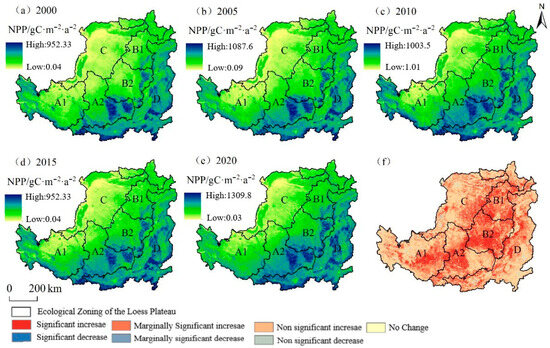
Figure 12.
(a–e) Spatial distribution of NPP on the Loess Plateau from 2000 to 2020; (f) Spatial trend of NPP on the Loess Plateau from 2000 to 2020.
3.2. Validation Results of Ecosystem Services
By fitting the simulation results of water yield, habitat quality and NPP on the Loess Plateau with the spatial distribution dataset of annual terrestrial water yield in the world, the historical high-resolution ecological environment quality dataset in China, and the net primary productivity dataset of MOD17A3H vegetation in China (Figure 13), the R2 of the Loess Plateau are 0.61, 0.79 and 0.77. The results of habitat quality and the NPP results simulated by the CASA model have a high correlation with the existing ecosystem service data products. Due to the low resolution of the water yield verification dataset (the dataset of the spatial distribution of annual global terrestrial water production), although the resolution has been unified, some values may be relatively fixed in a large area, resulting in a linear distribution of data points in the figure, but the overall fitting effect is good. The amount of sediment fixation per unit area and the amount of soil conservation were verified by the 137Cs tracer method and the sediment transport at the hydrological station on the Loess Plateau, respectively, and the R2 was 0.79 and 0.72. The results of the ecosystem services model used in this study have high credibility and can accurately reflect the actual spatial distribution characteristics of ecosystem services to a certain extent.
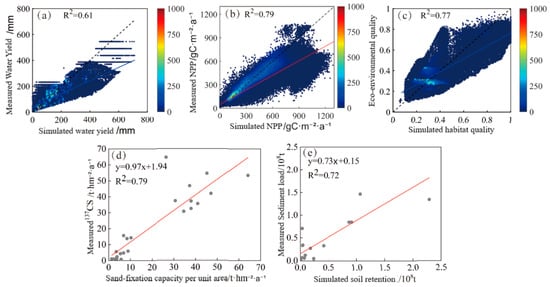
Figure 13.
Validation of ecosystem service simulation results. (a) Validation of water yield simulation results; (b) Validation of NPP simulation results; (c) Validation of habitat quality simulation results; (d) Validation of sand fixation per unit area simulation results. (e) Validation of soil retention simulation results.
3.3. Land Use Simulation Under Different Scenarios Based on the PLUS Model
In order to verify the prediction accuracy of the PLUS model, the CARS module is used to predict the land use pattern in 2020 based on the land use data in 2000 and 2010, and the prediction results are compared with the actual data, and the FOM coefficient and Kappa coefficient are calculated in the PLUS model Confusion Matrix and FoM module to test the reliability. The results show that the Kappa coefficient of the PLUS model is 0.873, the overall accuracy is 0.911, and the FOM coefficient is 0.39, which has good reliability and can better simulate the future land use quantity.
Based on the land use trends of the Loess Plateau from 2010 to 2020 and from 2015 to 2020, the land use types of the Loess Plateau in 2025 and 2030 were predicted, respectively, as shown in (Figure 14). The overall spatial distribution pattern of land use in 2025 and 2030 under different scenarios on the Loess Plateau is similar, and there are obvious changes in some areas (such as sub-district C). From 2025 to 2030, under the natural development scenario, there will be more conversion of unused land to construction land and forest land in Zone C, and forest land will be degraded in some areas, and there will be more areas of unused land and grassland conversion to forest land under the ecological protection scenario, and more areas of unused land and grassland will be converted to cultivated land under the cultivated land protection scenario, and forest land will be degraded in some areas. The area of each land use varies significantly under different scenarios. Table 1 shows the area of land-use types under different scenarios on the Loess Plateau in 2025 and 2030. From 2025 to 2030, the cultivated land area will decrease of 2934 km2 under the natural development scenario, the cultivated land area will decrease of 1847 km2 under the ecological protection scenario, and the cultivated land area will increase of 6882 km2 under the cultivated land protection scenario. The forest area decreased by 783 km2 and 570 km2 under the natural development scenario and cultivated land protection scenario, respectively, while the forest area increased by 2549 km2 under the ecological protection scenario. The area of construction land increased in most cases under the natural development scenario, which was 4849 km2, and the area of construction land increased by 1519 km2 and 575 km2 under the ecological protection scenario and cultivated land protection scenario. Under the ecological protection scenario, the water area increased the most, which was 342 km2. From 2025 to 2030, the area of unused land and grassland on the Loess Plateau will change slightly. In 2025, the cultivated land area under the cultivated land protection scenario is the largest, which is 206,108 km2; the construction land area is the smallest, which is 27,595 km2; and the forest land area and construction land area are the highest, which are 101,502 km2 and 27,819 km2. In 2030, the cultivated land area under the cultivated land protection scenario will still be the largest, at 207,008 km2, and the forest area under the ecological protection scenario will be the highest, at 102,459 km2.
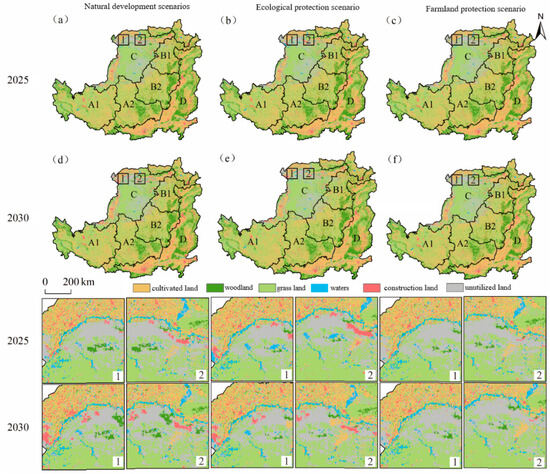
Figure 14.
Land use simulation results under future scenarios in the Loess Plateau for 2025 and 2030. (a–f) It represents the simulation results of land use in 2025 and 2030 under different scenarios.

Table 1.
Statistics of land use types in future scenarios on the Loess Plateau (km2).
3.4. Spatial Distribution Characteristics of Ecosystem Service Prediction Results in the Loess Plateau in 2025 and 2030
3.4.1. The Prediction Results of Water Yield Service in the Loess Plateau in 2025 and 2030
In 2025 and 2030, the average annual water yield under the cultivated land protection scenario is the highest (Figure 15), which is 303.14 mm and 303.28 mm. The water yield under the natural development scenario in 2025 and 2030 is 302.69 mm and 303.41 mm. The water yield under the ecological protection scenario was the lowest, which was 302.75 mm and 302.68 mm.
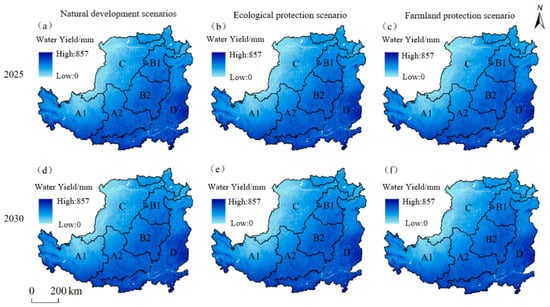
Figure 15.
Spatial distribution of water yield prediction results. (a–f) It indicates the spatial distribution of water yield prediction results in 2025 and 2030 under different scenarios.
3.4.2. Prediction Results of Habitat Quality Service in the Loess Plateau in 2025 and 2030
From 2000 to 2030, the overall change in habitat quality in the Loess Plateau was small, and there was no significant change in most regions, as shown in (Figure 16). The habitat quality under the ecological protection scenario in 2025 and 2030 is the highest, which is 0.5351 and 0.5361, respectively, due to the implementation of ecological restoration projects such as returning farmland to forest and returning farmland to grassland. The habitat quality under the natural development scenario in 2025 and 2030 was 0.5362 and 0.5342. The habitat quality was the lowest in 2025 and 2030, which were 0.5328 and 0.5325.
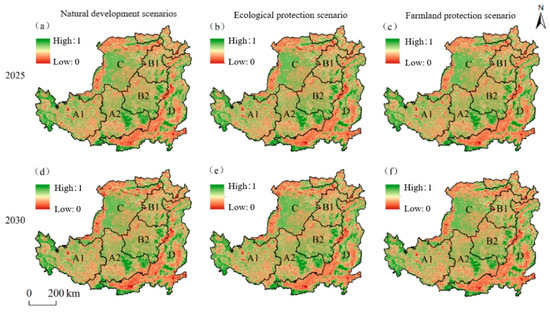
Figure 16.
Spatial distribution of habitat quality prediction results. (a–f) It indicates the spatial distribution of habitat quality prediction results in 2025 and 2030 under different scenarios.
3.4.3. Prediction Results of Windbreak and Sand Fixation Services on the Loess Plateau in 2025 and 2030
Under the ecological protection scenario, the Loess Plateau exhibited the highest mean annual sand fixation capacity per unit area in 2025 and 2030 (Figure 17), reaching 24.21 t·hm−2·a−1 and 24.13 t·hm−2·a−1. These results demonstrate that the implementation of major ecological restoration projects has significantly enhanced the sand-fixing capacity of the ecosystem. Under the scenario of cultivated land protection in 2025 and 2030, the annual average value of sand fixation per unit area is 23.91 t·hm−2·a−1 and 23.77 t·hm−2·a−1. Under the natural development scenarios of 2025 and 2030, the annual average value of sand fixation per unit area is the lowest, which is 24.17 t·hm−2·a−1 and 23.65 t·hm−2·a−1.
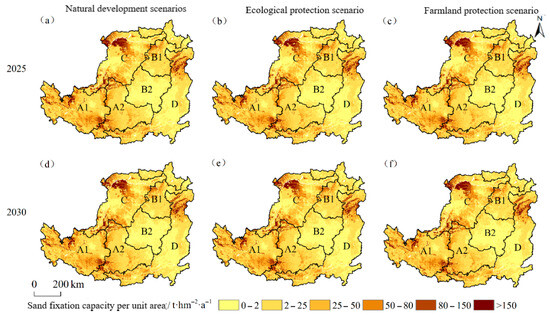
Figure 17.
Spatial distribution of wind and sand fixation prediction results. (a–f) The spatial distribution of the forecast results of windbreak and sand fixation in 2025 and 2030 under different scenarios is expressed.
3.4.4. Prediction Results of Soil Conservation Services on the Loess Plateau in 2025 and 2030
Under the ecological protection scenario of the Loess Plateau in 2025 and 2030 (Figure 18), the soil retention was the highest, which was 194.57 t·hm−2·a−1 and 194.56 t·hm−2·a−1. The amount of soil conservation under the natural development scenario was 194.61 t·hm−2·a−1 and 194.54 t·hm−2·a−1. The amount of soil conservation under the cultivated land protection scenario was the lowest, which was 194.55 t·hm−2·a−1 and 194.56 t·hm−2·a−1.
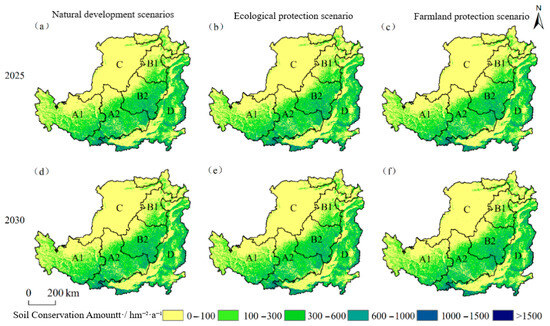
Figure 18.
Spatial distribution of soil conservation prediction results. (a–f) The spatial distribution of soil conservation prediction results in 2025 and 2030 under different scenarios was represented by.
3.4.5. The NPP Prediction Results on the Loess Plateau in 2025 and 2030
In the future scenarios, the highest values are 478.62 gC·m−2·a−1 and 478.95 gC·m−2·a−1 in the ecological protection scenarios in 2025 and 2030 (Figure 19). The NPP in 2025 and 2030 is 478.56 gC·m−2·a−1 and 478.64 gC·m−2·a−1. The NPP is the lowest under the cultivated land protection scenario in 2025 and 2030, which are 478.13 gC·m−2·a−1 and 478.02 gC·m−2·a−1.
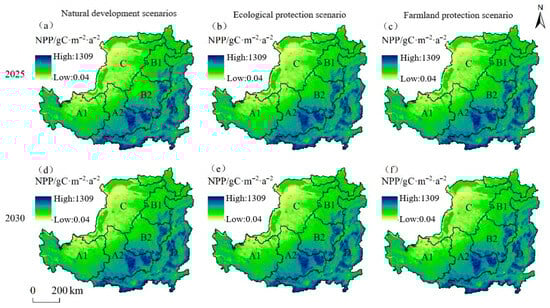
Figure 19.
Spatial distribution of NPP prediction results. (a–f) The spatial distribution of NPP prediction results in 2025 and 2030 under different scenarios is represented by.
3.5. Prediction Results of the Comprehensive Ecosystem Service Index on the Loess Plateau in 2025 and 2030
Under different scenarios in the future, the comprehensive service index under the ecological protection scenario of the Loess Plateau in 2025 and 2030 is the lowest (Figure 20), which is 0.9730 and 0.9729 in 2025 and 2030. The comprehensive service index of the natural development scenario is the highest, which is 0.9736 and 0.9733 in 2025 and 2030. The comprehensive service index of the cultivated land protection scenario in 2025 and 2030 is between the two, which is 0.9734 and 0.9731. Compared with 2025, the comprehensive service index of the future scenario of the Loess Plateau in 2030 is slightly lower, reflecting that the difference between ecosystem service functions is gradually reduced and the balance is further enhanced.
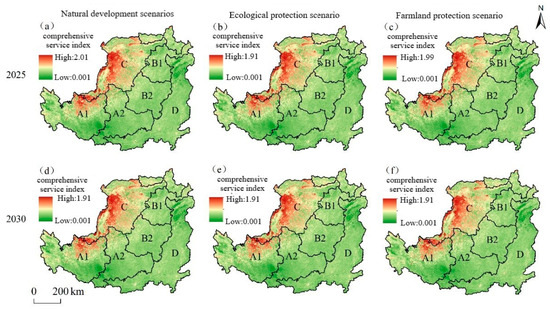
Figure 20.
Spatial distribution of ecosystem comprehensive service index prediction results. (a–f) It indicates the spatial distribution of the predicted results of the ecosystem comprehensive service index in 2025 and 2030 under different scenarios.
3.6. Identification of Ecological Risk Levels and Key Restoration Areas for Ecological Restoration on the Loess Plateau
3.6.1. The Spatial Distribution of Ecological Risk Levels in the Loess Plateau Under Different Scenarios in 2030
The spatial distribution of ecological risk levels in three scenarios of natural development, ecological protection and cultivated land protection has spatial heterogeneity. Among the three scenarios, the first-level and second-level risk areas are dominant, and the regional area accounts for more than 70%. Among them, the first-level and second-level risk areas of the ecological protection scenario account for the highest proportion, which is 70.12%, indicating that ecological protection measures can effectively improve the stability of the ecosystem. Under each scenario, the proportion of the three-level risk area is small, and the regional area accounts for about 19%. Under the ecological protection scenario, the area proportion of level 4 and level 5 risk areas is the lowest, which is 10.67%, while it is slightly higher in the natural development and cultivated land protection scenario, and the area proportion of level 4 and level 5 risk areas is 10.71%. From the spatial distribution of ecological risk levels in the three scenarios of natural development, ecological protection and cultivated land protection, as shown in (Figure 21), the level 4 and level 5 risk areas are mainly distributed in the C zone and the junction of the A2 zone and the C zone, and the level 3 risk areas are mainly distributed in the B1 zone, B2 zone and C zone, as shown in (Table 2).
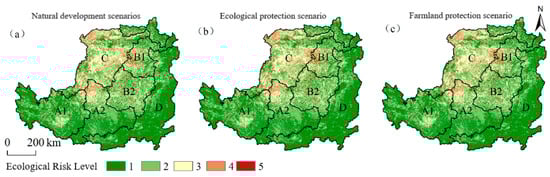
Figure 21.
(a–c) Spatial distribution of ecological risk levels under different scenarios on the Loess Plateau in 2030.
Table 2.
Area proportion of different ecological risk levels in various scenarios on the Loess Plateau in 2030.
3.6.2. Identification and Restoration Strategies of Key Restoration Areas for Ecological Restoration
According to the identification method for key areas of ecological restoration, areas with ecological risk levels 3, 4, and 5 are divided into general restoration areas, medium-optimal restoration areas, and high-optimal restoration areas. The spatial distribution of key areas of ecological restoration under different scenarios is heterogeneous (Figure 22). Under the natural development scenario, the general restoration area accounted for 19.21% of the study area, which was mainly distributed in the center of A1 subdivision, the Northern part of A2 subdivision, B1 subdivision, B2 subdivision and C subdivision. The medium-optimal restoration area accounts for 9.12% of the study area, which is mainly distributed in B1, B2, C, and the junction of C and A2. The area of the high-quality repair area is relatively small, mainly distributed in the C partition and the junction of the C partition and the A2 partition. The ecological protection scenario reduces the scope of high-risk areas, and the areas of high-quality restoration areas and medium-quality restoration areas are reduced. Compared with the ecological protection scenario, the improvement effect of the restoration area under the cultivated land protection scenario is weak. The area proportion of the general restoration area under the cultivated land protection scenario is smaller than that of the natural development scenario and the ecological protection scenario, while the area proportion of the medium-excellent restoration area and the high-excellent restoration area is higher than that of the ecological protection scenario.
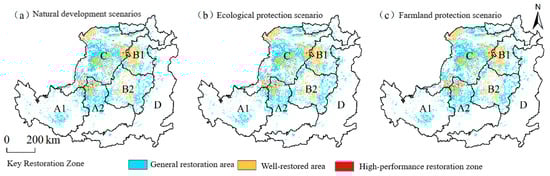
Figure 22.
Spatial distribution of key ecological restoration areas in the Loess Plateau by 2030.
B1, B2, C, and the junction of C and A2 should be the key areas of ecological restoration. Priority should be given to the implementation of ecological restoration projects, such as returning farmland to forest and grassland, comprehensive management of wind and sand sources, and forest protection construction. We should continue to promote ecological restoration projects such as returning farmland to forest and returning farmland to grassland, especially in C-zoning, further expand vegetation coverage, improve the stability of ecosystem service functions, and focus on the synergistic effect of vegetation restoration on soil conservation, windbreak and sand fixation, and habitat quality, so as to ensure the multiple benefits of implementing ecological restoration projects. The cultivated land protection scenario maintains the area proportion of the general restoration area, but it is necessary to be alert to the diffusion trend in the high-risk area. The regional layout of cultivated land expansion should be optimized to avoid excessive reclamation in the ecologically fragile areas (such as the C partition and the junction of the A2 partition and the C partition). In the process of cultivated land expansion, we should promote ecological agriculture and sustainable farming technology, reduce the negative impact of farming on soil and water resources, and ensure the balanced development of cultivated land protection and ecological protection. The ecosystem of the D district is stable, and the transformation of areas with better ecosystem services to ecological risk areas should be prevented.
4. Discussion
4.1. Analysis of Ecosystem Service Function Prediction Results
From 2000 to 2020, the water yield of the Loess Plateau showed an overall upward trend (slope of 4.41 mm), and the spatial pattern was high in the Southeast and low in the Northwest. This is because the precipitation in the Southeast (A1, B1, B2, D) shows a significant increase in trend, the vegetation coverage is high, and the water yield capacity is strong; the Northwest (C zone) is limited by an arid climate and sparse vegetation, and the water yield is low [53]. From 2000 to 2020, the area with no significant change trend of habitat quality on the Loess Plateau accounted for 56.28%. The high-value areas are concentrated in the western part of A1 and the B1 sub-region, which are mostly natural woodlands or protected areas with less human disturbance; the low-value areas (Northern C and D) may be related to vegetation destruction caused by overgrazing or mineral development [54]. The total amount of sand fixation per unit area increased in (the slope was 0.012 t·hm−2·a−1), but the spatial differentiation was significant. The high amount of sand fixation in the Northwest (A1, C) was due to the reduction of wind erosion due to vegetation restoration. The decrease in sand fixation in the Southeast (D district) may be related to the decrease in wind erosivity or local vegetation degradation. The amount of soil conservation increased at a rate of t·hm−2·a−1, and 76.67% of the area showed a slightly significant increase in trend, especially in A2 and B2 partitions. This is directly related to the reduction of soil erosion by vegetation restoration, and the significant increase in sub-district C may be due to desertification control measures [55]. The average annual growth rate of NPP was 7.09 gC·m−2·a−1, and 95.23% of the area showed an increase in trend, which was due to the implementation of ecological restoration projects, and the vegetation coverage was significantly improved.
The areas with poor ecosystem services are mainly distributed in Zone C, which is due to the large differences in ecosystem service functions in Zone C, such as poor water yield, soil conservation services, and NPP, resulting in large differences among various ecosystem services, poor balance and synchronization, and a high comprehensive ecosystem service index [56]. From 2000 to 2020, the comprehensive ecosystem service index of the Loess Plateau mainly showed a decrease in trend, mainly distributed in A1, A2, B1, B2 and C. The areas with no significant increase in the ecosystem services index accounted for 20.35% of the study area, which were mainly distributed in Zone D, indicating that the comprehensive ecosystem services in Zone D showed a downward trend. This is due to the fact that A1, A2, B1, B2 and C belong to the key implementation areas of major ecological projects, while the number of major ecological projects in D is small, or no major ecological projects are implemented.
In the future, the change trend of ecosystem services under different scenarios will be different, and the ecosystem services under the ecological protection scenario will be the best. This is due to the fact that ecological protection scenarios can effectively improve the balance of ecosystem services and reduce regional differences in ecosystem services, especially in windbreak and sand fixation, soil conservation and NPP. The cultivated land protection scenario improved the water yield service while ensuring food security, but the sand fixation capacity and NPP were weak, and the ecological risk of soil loss increased. Under the natural development scenario, the rapid expansion of construction land and the lack of coordinated management of ecosystem services have aggravated the pressure on the ecosystem, The results of the study on the aggravation of ecosystem problems caused by human activities are consistent with those of Zhai et al. [57] Among the key restoration areas on the Loess Plateau, the general restoration areas are the main areas under the three development scenarios, accounting for more than 19% of the area. The medium–excellent restoration area and high-quality restoration area are mainly distributed in the B1 district, the B2 area, the C area, and the junction of the C and A2 division.
4.2. Recommendations for Ecological Restoration
Based on the results of ecological risk assessment and the distribution characteristics of key restoration areas in the Loess Plateau, combined with the influencing factors of integrated ecosystem services, the following ecological restoration strategies are proposed:
The high-quality repair area is mainly concentrated in the C partition and at the junction area between the A2 partition and the C partition. Due to the poor natural conditions in these areas, the degradation of ecosystem service functions is obvious and should be the focus of restoration. Priority should be given to the implementation of ecological restoration projects such as slope vegetation restoration, returning farmland to forests and grasslands, and soil and water conservation. At the same time, land reclamation and pollution control in mining areas should be promoted to restore damaged ecological functions. By optimizing collaborative governance measures, habitat quality and soil conservation capacity were further improved. The ecological function of the medium–excellent restoration areas (such as B1, B2, and C partitions) is obviously degraded, but the restoration potential is large. These areas should focus on optimizing the functions of windbreak, sand fixation, and water production, and improving the ability of wind erosion resistance and water use efficiency by building a farmland shelter forest, transforming slope land, and strengthening water resources management [58]. At the same time, rotational grazing and grazing prohibition systems are implemented in medium- and high-intensity grazing areas to restore grassland vegetation, and ecological animal husbandry models are promoted to optimize grassland utilization and prevent further degradation. The general restoration areas (such as A1, A2, B1, B2, C) should promote low-intensity agriculture and eco-friendly land management by regulating land-use change and encouraging the conversion of marginally cultivated land to grassland or ecological forest land. In the A1 and B2 sub-regions, where precipitation increases significantly, flood control and soil and water conservation projects are implemented to reduce the risk of soil erosion. In areas with reduced precipitation, drought-resistant planting and water-saving technologies should be promoted to enhance the resilience of ecosystems [59].
Climate change has a significant impact on the regional ecological environment. Vegetation coverage has increased in areas with an increase in precipitation, while vegetation restoration in arid areas is more difficult [60]. Therefore, when formulating restoration strategies, it is necessary to fully consider the influence of climate factors, optimize vegetation allocation and soil and water conservation measures, and ensure the long-term effectiveness of ecological restoration measures.
The ecological protection scenario has a significant effect on reducing the proportion of high-risk areas and improving the local sensitive areas. We should continue to promote ecological restoration projects, such as returning farmland to forest and returning farmland to grassland, especially in the C district, to further expand vegetation cover and improve the stability and service functions of the ecosystem [61]. At the same time, we focus on the synergistic effect of vegetation restoration on soil conservation, windbreak and sand fixation, and habitat quality to ensure the multiple benefits of restoration measures. Although the cultivated land protection scenario maintains a high proportion of low-risk areas, it is necessary to be alert to the diffusion trend of high-risk areas [62]. The regional distribution of cultivated land expansion should be optimized to avoid excessive reclamation in ecologically fragile areas (such as C and B1). Promote ecological agriculture and sustainable farming techniques while expanding cultivated land, reducing negative impacts on soil and water resources, and ensuring a balance between cultivated land protection and ecological protection [63]. In addition, the ecological protection of D sub-area should be strengthened to prevent the conversion of areas with better ecosystem services to medium-risk areas.
Through multi-level and multi-dimensional ecological restoration strategies, it can effectively improve the ecosystem service function of the Loess Plateau, reduce ecological risks, promote the sustainable development of the regional ecological environment [64], provide a guarantee for regional ecological security and sustainable development, and provide a reference for the restoration of other degraded ecosystems in the country
4.3. Research Deficiencies and Prospects
Based on land-use change under different scenarios, this study predicted and analyzed future ecosystem services in the Loess Plateau. The limitation of this study is that the combined effects of climate change have not been fully considered. However, in order to further improve the scientificity and accuracy of the research, the future research focus will include the following two aspects: First, combined with the meteorological prediction model, the key meteorological factors such as precipitation and temperature under different scenarios are predicted to predict ecosystem services more comprehensively [65]; Second, strengthen the field verification of key repair areas, and verify the prediction results through field observation data, so as to ensure the reliability and practicability of the research conclusions.
5. Conclusions
In this study, a variety of key models, such as InVEST, were used to estimate key ecosystem services such as water yield, habitat quality, windbreak and sand fixation, soil conservation, and net primary productivity (NPP). Combined with the Sen + Mann–Kendall trend test and partial derivative method, the spatial and temporal variation characteristics of these five ecosystem services in the Loess Plateau from 2000 to 2020 were analyzed. The PLUS model was used to simulate and predict the future trends of ecosystem services under different land-use patterns in 2025 and 2030 under different scenarios. Finally, based on the ecological risk assessment model, the key ecological restoration areas of the Loess Plateau in 2030 were identified. The study draws the following main conclusions:
From 2000 to 2020, the overall ecosystem services of the Loess Plateau showed a significant increasing trend. The area proportions of water yield, soil conservation service and NPP showed an increase in trend of 86.20%, 81.14%, and 95.38%. The sand-fixing amount per unit area showed the distribution characteristics of high in the Northwest and low in the Southeast. The soil retention and NPP showed the distribution characteristics of low in the Northwest and high in the Southeast, and the water yield decreased from the Southeast to the Northwest. From 2000 to 2020, the comprehensive service index of the ecosystem in the mining area of the Loess Plateau showed a decreasing trend, indicating that the overall balance and synchronization of the ecosystem services in the Loess Plateau were significantly improved, and the differences between different service functions were gradually reduced. Due to the poor natural background conditions, the comprehensive ecosystem service index of the C sub-region is the highest, and the comprehensive ecosystem service is poor. From 2000 to 2020, the comprehensive ecosystem service of the C sub-region showed a rapid recovery trend, reflecting the simultaneous improvement of ecosystem services in the C sub-region.
In the future, the change trend of ecosystem services under different scenarios is different, and the ecosystem services under the ecological protection scenario are the best. The ecological protection scenario can effectively improve the balance of ecosystem services and reduce regional differences in ecosystem service functions, especially in windbreak and sand fixation, soil conservation and NPP. The cultivated land protection scenario also improves water yield services while ensuring food security, but its sand fixation capacity and NPP are weak, and the ecological risk of soil loss increases. In the future, on the basis of ensuring food security, we should promote the coordinated promotion of ecological protection and agricultural development through rational planning of land use.
Under the natural development scenario, the construction land expands rapidly, and the lack of coordinated management of ecosystem services aggravates the pressure on the ecosystem. Under the natural development scenario, the land-use planning should be optimized, the construction land expansion should be reasonably controlled, the pressure on the ecosystem caused by over-exploitation should be avoided, and strict protection policies should be implemented in key ecological areas.
In the key restoration areas of the Loess Plateau, the general restoration areas are the main areas under the three development scenarios, accounting for more than 19% of the total area. The medium–excellent and high–excellent restoration areas are mainly distributed in B1, B2, and C, as well as at the junction of C and A2. The ecological restoration should give priority to the key areas. At the same time, the ecological protection of the D district should be strengthened to avoid the expansion of ecological degradation. The ecological protection scenario can significantly improve the ecosystem service capacity and reduce the proportion of high-quality restoration areas and medium-quality restoration areas. In the future, we should continue to strengthen the ecological protection measures of the Loess Plateau, and give priority to ecological restoration strategies, such as returning farmland to forest, returning grazing to grassland, and comprehensive management of wind and sand sources, so as to improve the ecosystem service capacity of the Loess Plateau.
Author Contributions
Conceptualization: Y.L. (Ying Liu), X.C. and Y.L. (Yong Li); Methodology: Y.L. (Ying Liu) and K.F.; Software: H.W.; Writing—original draft: Y.L. (Ying Liu), H.W., K.F. and X.C.; Formal Analysis: H.W. and K.F.; Visualization: H.W.; Writing—review & editing: Y.L. (Ying Liu); Funding acquisition: Y.L. (Ying Liu) and X.C.; Data curation: Y.L. (Ying Liu) and H.W.; Resources: H.W.; Investigation: H.W.; Supervision: Y.L. (Yong Li). All authors have read and agreed to the published version of the manuscript.
Funding
This project was supported by the State Key Laboratory for Safe Mining of Deep Coal Resources and Environment Protection (NO. 2025YB019); The National Natural Science Foundation of China (52204181); Opening Foundation of Anhui Province Engineering Research Center of Water and Soil Resources Comprehensive Utilization and Ecological Protection in High Groundwater Mining Area (2024-WSREPMA-01), and the Project entrusted by Ping ’an Coal Mining Engineering Technology Research Institute Co., Ltd. (HNKY-PGJS-2023-228).
Data Availability Statement
Data will be made available on request.
Conflicts of Interest
Authors Ying Liu, Haitao Wu, Kaixuan Fan and Xiaoyang Chen were employed by the company Huainan Mining (Group) Co., Ltd., author Yong Li was employed by the company Anhui Huayin Electromechanical Co., Ltd. The remaining authors declare that the research was conducted in the absence of any commercial or financial relationships that could be construed as a potential conflict of interest.
Appendix A. Transfer Matrix Parameter Settings
Table A1 The transfer matrix represents the transfer rules between various land use types, 1 represents changeable, 0 means cannot be changed, and the corresponding transfer matrix is set according to different development scenarios.
Table A1.
Land Use Transition Matrix.
Table A1.
Land Use Transition Matrix.
| Scenario | Cultivated Land | Woodland | Grass Land | Waters | Construction Land | Unutilized Land | |
|---|---|---|---|---|---|---|---|
| Natural development scenarios | cultivated land | 1 | 1 | 1 | 1 | 1 | 1 |
| woodland | 1 | 1 | 0 | 0 | 0 | 1 | |
| grass land | 1 | 1 | 1 | 1 | 1 | 1 | |
| waters | 0 | 0 | 1 | 1 | 1 | 1 | |
| construction land | 0 | 1 | 1 | 1 | 1 | 1 | |
| unutilized land | 1 | 1 | 1 | 1 | 1 | 1 | |
| Ecological protection scenario | cultivated land | 1 | 1 | 1 | 0 | 0 | 0 |
| woodland | 0 | 1 | 0 | 0 | 0 | 0 | |
| grass land | 0 | 1 | 1 | 0 | 0 | 0 | |
| waters | 0 | 0 | 0 | 1 | 0 | 0 | |
| construction land | 0 | 0 | 0 | 0 | 1 | 0 | |
| unutilized land | 1 | 1 | 1 | 1 | 1 | 1 | |
| Farmland protection scenario | cultivated land | 1 | 0 | 0 | 0 | 0 | 0 |
| woodland | 1 | 1 | 1 | 0 | 0 | 1 | |
| grass land | 1 | 1 | 1 | 1 | 1 | 1 | |
| waters | 1 | 0 | 1 | 1 | 0 | 1 | |
| construction land | 0 | 0 | 0 | 0 | 1 | 0 | |
| unutilized land | 1 | 1 | 1 | 1 | 1 | 1 |
Appendix B. Risk Level Assessment Form
Table A2 Refer to the risk level assessment table in GB/T50326-2006 of the “Construction Project Management Specification” (Table A2), and explore the causes of ecological risks.
Table A2.
Ecological wind level relationship matrix based on ecosystem.
Table A2.
Ecological wind level relationship matrix based on ecosystem.
| Risk Level | Light Loss | Moderate Loss | Severe Loss |
|---|---|---|---|
| Considerable | 3 | 4 | 5 |
| moderate | 2 | 3 | 4 |
| Minor | 1 | 2 | 3 |
Appendix C. Selection of Driving Factors
As shown in Figure A1, based on the principles of data availability, spatial variability and quantifiability, this study selected 12 driving factors reflecting the natural environment and human factors. In ArcGIS, the European distance tool is used to rasterize and normalize the driving factors to construct a complete driving factor system. The driving factors include precipitation, temperature, DEM, slope, GDP, population density, distance from primary road, distance from secondary road, distance from tertiary road, distance from railway, distance from water, and distance from residential areas (Please refer to Appendix B for details).

Figure A1.
Driving factors of land use change.
References
- Boerema, A.; Rebelo, A.J.; Bodi, M.B.; Esler, K.J.; Meire, P. Are ecosystem services adequately quantified? J. Appl. Ecol. 2017, 54, 358–370. [Google Scholar] [CrossRef]
- Lu, P.J.; Wei, Y.F.; Tong, X.H.; Yao, S.; Su, P.Z.; Liu, X.; Huang, T.W.; Qin, W.T. Study on identification of key areas for ecological restoration of territorial space: Taking Xi’an City as an example. J. Environ. Eng. Technol. 2024, 14, 1877–1891. [Google Scholar] [CrossRef]
- Chen, Y.Q.; Paul, W.; Peter, B.; R. Quentin, G.; Michael, V. Valuing and accounting for water-related ecosystem services for water pricing and management: An Australian case study. Ecosyst. Serv. 2025, 70, 101771. [Google Scholar] [CrossRef]
- Wang, X.H.; He, J.; Mou, X.J.; Zhu, Z.X.; Chai, H.X.; Liu, G.H.; Rao, S.; Zhang, X. 20 Years of Ecological Protection and Restoration in China: Review and Prospect. Chin. J. Environ. Manag. 2021, 13, 85–92. [Google Scholar] [CrossRef]
- Li, Z.Y.; Wei, W.; Zhou, L.; Liu, C.F.; Guo, Z.H.; Pang, S.F.; Zhang, J. Spatio-temporal evolution characteristics of terrestrial ecological sensitivity in China. Acta Geogr. Sin. 2022, 77, 150–163. [Google Scholar] [CrossRef]
- Zhao, Y.Q.; Zhao, P.Y.; Xu, Z.H.; Li, Z.G. Contribution of climate change and human activity to vegetation recovery in Shanxi Province from 2002 to 2022. Chin. J. Appl. Ecol. 2025, 36, 219–226. [Google Scholar] [CrossRef]
- Tian, Y.Q.; Wang, B.; Wang, J.F.; Bai, J. Influence of typical herbaceous root characteristics on soil shear properties in loess hilly regions. Res. Soil Water Conserv. 2024, 31, 153–159. [Google Scholar] [CrossRef]
- Wang, H.X.; Lan, J.Q.; Huang, L.T.; Jiao, X.Y.; Zhao, K.A.; Guo, W.X. Longitudinal path analysis of ecosystem water yield effects and its driving forces in the upper Yangtze River basin. Ecol. Indic. 2025, 172, 113273. [Google Scholar] [CrossRef]
- Wang, X.H.; Zhang, X.; Mou, X.J.; Zhu, Z.X. Discussion on the planning of land spatial ecological restoration. Environ. Prot. 2019, 47, 36–38. [Google Scholar] [CrossRef]
- Peng, J.; Lv, D.N.; Dong, J.Q.; Liu, Y.X.; Li, B. Processes coupling and spatial integration: Characterizing ecological restoration of territorial space in view of landscape ecology. J. Nat. Resour. 2020, 35, 3–13. [Google Scholar] [CrossRef]
- Wei, W.; Zhang, Q.Y.; Bo, L.M. Research on “Human-oriented” Decision-making of Territorial Ecological Restoration:Take Quangang District, Quanzhou City as an Example. China Land Sci. 2021, 35, 17–26. [Google Scholar] [CrossRef]
- Lu, Y.S.; Han, R.; Shi, Y.; Guo, L. Ecosystem health assessment of Qiandongnan Miao and Dong Autonomous Prefecture. Acta Ecol. Sin. 2021, 41, 5557–5569. [Google Scholar] [CrossRef]
- Lv, T.; Kong, A.N.; Wang, L. Evaluation of Regional Ecological Security and Obstacle Diagnosis of Ecological Civilization Demonstration Area Based on PSR Model. Res. Soil Water Conserv. 2021, 28, 343–350. [Google Scholar] [CrossRef]
- Yang, N.T.; Xu, W.; You, Z.X. Strategies and Practice of Ecological Restoration Planning for National Land and Space in the New Era, Shenyang. Planners 2020, 36, 34–38+45. [Google Scholar]
- Meister, L.; Marques, M.C. Analysis of spatiotemporal changes in ecosystem services distribution in the southern part of the Atlantic Forest in Brazil. Ecosyst. Serv. 2025, 76, 101781. [Google Scholar] [CrossRef]
- Fang, Y.; Wang, J.; Huang, L.Y.; Zhai, T.L. Determining and identifying key areas of ecosystem preservation and restoration for territorial spatial planning based on ecological security patterns: A case study of Yantai city. J. Nat. Resour. 2020, 35, 190–203. [Google Scholar] [CrossRef]
- Chen, D.L.; Hu, W.B.; Lu, X.H.; Li, Y.Y. Exploring the Influencing Mechanism of Newly-added Urban Construction Land Expansion:A Configuration Analysis Based on PSR Framework. China Land Sci. 2022, 36, 85–93. [Google Scholar] [CrossRef]
- Niu, Y.H.; Jiao, S.; Cao, T.T.; Xia, B.L.; Feng, Y.J. Urban Multi-hazard Risk Assessment and Planning Response Based on PSR Model. Urban Dev. Stud. 2022, 29, 39–48. [Google Scholar] [CrossRef]
- Zhang, X.Y.; Yu, H.; Zhang, X.; Zhou, K. Comprehensive evaluation of land ecological security in the Sanjiangyuan National Park based on multi-source data. Acta Ecol. Sin. 2022, 42, 5665–5676. [Google Scholar] [CrossRef]
- Xiao, Y.; Zhou, X.; Jiang, X.; Zhang, J.; Li, H.G. Research on ecological security maintenance of Guiyang City based on evaluation of ecosystem service functionx. Ecol. Sci. 2020, 39, 244–251. [Google Scholar] [CrossRef]
- William, S.H.; Jeppe, A.K. A framework to identify and value ecosystem services and disservices with supply and demand. Environ. Chall. 2025, 20, 10136. [Google Scholar] [CrossRef]
- Rong, Y.J.; Yan, Y.; Wang, C.X.; Zhang, W.; Zhu, J.Y.; Lu, H.T.; Zheng, T.C. Construction and optimization of ecological network in Xiong′an New Area based on the supply and demand of ecosystem services. Acta Ecol. Sin. 2020, 40, 7197–7206. [Google Scholar]
- Peng, J.; Zhao, H.J.; Liu, Y.X.; Wu, J.S. Research progress and prospect on regional ecological security pattern construction. Geogr. Res. 2017, 36, 407–419. [Google Scholar]
- Liu, J.H.; Yang, S.; Lv, Y.Q. Identification and diagnosis of critical areas for ecological rehabilitation based on eco-security patterns and ecological vulnerability assessment—A case study over Wenshang County. China Environ. Sci. 2022, 42, 3343–3352. [Google Scholar] [CrossRef]
- Guo, C.Q.; Xu, X.B.; Shu, Q. A review on the assessment methods of supply and demand of ecosystem services. Chin. J. Ecol. 2020, 39, 2086–2096. [Google Scholar] [CrossRef]
- Tu, W.Z.; Zhao, W.W.; Liu, Y.; Zhang, Z.J. Ecological restoration zoning on the Loess Plateau based on the supply and demand of ecosystem services. Acta Ecol. Sin. 2024, 44, 9695–9707. [Google Scholar]
- Liu, B.; Han, Q.G.; Zhang, J.L.; Peng, S.Z. Spatial-temporal Patterns and Factors of Soil Moisture in the Middle Reaches of the Yellow River under Changing Environments. J. Soil Water Conserv. 2025, 39, 73–83. [Google Scholar] [CrossRef]
- Zhang, J.G.; Li, J.J.; Yu, H.B. Dynamic changes and distribution characteristics of soil and water loss in Loess Plateau area of Yellow River Basin. J. Soil Water Conserv. 2025, 32, 110–116. [Google Scholar] [CrossRef]
- Yang, T.Z.; Yue, D.P.; Zhao, J.B.; Wang, X.N.; Liu, Y.T.; Liu, R. Characteristics of geochemical weathering of L3 and S3 loess-paleosol section in the Hengshan area, Shanxi province. Prog. Geogr. 2023, 42, 364–379. [Google Scholar] [CrossRef]
- Bian, Z.F.; Yu, H.H.; Lei, S.G.; Yin, D.Y.; Zhu, G.Q.; Mu, S.G.; Yang, D.G. Strategic consideration of exploitation on coal resources and its ecological restoration in the Yellow River Basin, China. J. China Coal Soc. 2021, 46, 1378–1391. [Google Scholar] [CrossRef]
- Wang, D.M.; Yin, X.J.; Wang, J.J. Spatiotemporal evolution and driving forces of ecosystem health in the Manas River Basin. Geogr. Res. 2025, 44, 515–537. [Google Scholar] [CrossRef]
- Wen, X.; Wang, J.J.; Han, X.J. Scale effects of ecosystem service trade-offs/synergies in the Loess Plateau of northern Shaanxi based on geographical regions. Res. Soil Water Conserv. 2025, 32, 305–315. [Google Scholar] [CrossRef]
- Wang, C.; Tang, C.J.; Fu, B.J.; Lv, Y.H.; Xiao, S.S.; Wang, J. Determining critical thresholds of ecological restoration based on ecosystem service index: A case study in the Pingjiang catchment in southern China. J. Environ. Manag. 2022, 303, 114220. [Google Scholar] [CrossRef] [PubMed]
- Wischmeier, W. Predicting Rainfall-Erosion Losses from Cropland East of the Rocky Mountains, Guide for Selection of Practices for Soil and Water Conservation; United States Government Printing Office: Washington, DC, USA, 1965.
- Renard, K.G. Predicting Soil Erosion by Water: A Guide to Conservation Planning with the Revised Universal Soil Loss Equation (RUSLE); US Department of Agriculture, Agricultural Research Service: Washington, DC, USA, 1997. [Google Scholar]
- Zhang, W.B.; Xie, Y.; Liu, B.Y. Rainfall Erosivity Estimation Using Daily Rainfall Amounts. Geogr. Sci. 2002, 22, 705–711. [Google Scholar]
- Zhu, W.Q.; Pan, Y.Z.; Zhang, J.S. Estimation of net primary productivity of Chinese terrestrial vegetation based on remote sensing. Chin. J. Plant Ecol. 2007, 31, 413–424. [Google Scholar] [CrossRef]
- Mehmet, B. Trends and variability in global ocean heat content time series data for the period 2005–2035. J. Atmos. Sol. -Terr. Phys. 2025, 274, 106586. [Google Scholar] [CrossRef]
- Fan, K.X.; Liu, Y.; Zhang, X.Y.; Chen, X.Y.; Li, Y.; Zhou, Y.Z.; Shen, W.J.; Tao, H.L.; Gong, C.G.; Lei, S.G. Assessing the relative contribution of climate change and human activity factors to spatiotemporal distributions of sand fixation service in the Loess Plateau. GIScience Remote Sens. 2024, 62, 2444630. [Google Scholar] [CrossRef]
- Wei, X.H.; Wu, X.D.; Wang, D.; Wu, T.H. Spatiotemporal variations and driving factors for potential wind erosion on the Mongolian Plateau. Sci. Total Environ. 2023, 862, 160829. [Google Scholar] [CrossRef] [PubMed]
- Zhang, G.; Azorin-Molina, C.; Shi, P.; Lin, D.; Guijarro, J.A.; Kong, F.; Chen, D. Impact of near-surface wind speed variability on wind erosion in the eastern agro-pastoral transitional zone of Northern China, 1982–2016. Agric. For. Meteorol. 2019, 271, 102–115. [Google Scholar] [CrossRef]
- Beverley, C.; Aung, K.T.; Harpinder, S. Sabine DittmannIntegrating Cultural Ecosystem Services valuation into coastal wetlands restoration: A case study from South Australia. Environ. Sci. Policy 2021, 116, 220–229. [Google Scholar] [CrossRef]
- Zhang, L.J.; Chen, G.P.; Lin, Y.L.; Zhao, J.S.; Liu, F.G.; Peng, S.F. Simulating multiple scenarios of carbon stocks for driving mechanisms using MOP-PLUS-InVest model. Trans. Chin. Soc. Agric. Eng. 2024, 40, 223–233. [Google Scholar] [CrossRef]
- Fu, B.J.; Wang, S.; Liu, Y.; Liu, J.B.; Liang, W.; Miao, C.Y. Hydrogeomorphic ecosystem responses to natural and anthropogenic changes in the Loess Plateau of Chin. Annu. Rev. Earth Planet. Sci. 2017, 45, 223–243. [Google Scholar] [CrossRef]
- The State Council, National Plan for Major Functional Zones. 2010. Available online: https://www.gov.cn/zwgk/ (accessed on 15 August 2025).
- Ministry of Environmental Protection. National Ecological Function Zoning (Ministry of Environmental Protection. National Ecological Function Zoning. Available online: https://www.mee.gov.cn/gkml/hbb/bgg/201511/t20151126317777.htm (accessed on 28 August 2025).
- National Development and Reform Commission. Comprehensive Management Plan Outline for the Loess Plateau Region (2010–2030). Available online: https://www.ndrc.gov.cn (accessed on 18 August 2025).
- Mao, S.L.; Shangguan, Z.P. Characteristics and Causes of Land Use/Vegetation Coverage of the Loess Plateau in the Past 20 Years. Res. Soil Water Conserv. 2022, 29, 213–219. [Google Scholar] [CrossRef]
- Niu, L.A.; Shao, Q.Q.; Ning, J.; Yang, X.Q.; Liu, S.C.; Liu, H.B.; Zhang, X.Y.; Huang, H.B. Evaluation on the degree and potential of ecological restoration in Loess Plateau. J. Nat. Resour. 2023, 38, 779–794. [Google Scholar] [CrossRef]
- Yang, Z.F.; Yan, Q.; Yang, W. Assessing and classifying plant-related ecological risk under water management scenarios in China’s Yellow River Delta Wetlands. J. Environ. Manag. 2013, 130, 276–287. [Google Scholar] [CrossRef]
- GB/T50326-2006; Construction Project Management Specification. Ministry of Construction of the People’s Republic of China: Beijing, China, 2017.
- Pan, X.; Shi, P.J.; Wu, N. Ecological risk assessment and identification of priority areas for management and control based on the perspective of ecosystem services equilibrium: A case study of Lanzhou. Acta Sci. Circumstantiae 2020, 40, 724–733. [Google Scholar] [CrossRef]
- Yang, D.; Wang, X.F. Contribution of climatic change and human activities to changes in net primary productivity in the Loess Plateau. Arid Zone Res. 2022, 39, 584–593. [Google Scholar] [CrossRef]
- Qiu, H.H.; Bai, Y.C.; Han, H.R.; Zhang, J.Y.; Cheng, X.Q. Ecosystem service supply and demand relationship and spatial identification of driving threshold in Loess Plateau of China. Ecol. Eng. 2025, 212, 107534. [Google Scholar] [CrossRef]
- Liu, Y.X.; Lv, Y.H.; Fu, B.J.; Harris, P.; Wu, L.H. Quantifying the spatio-temporal drivers of planned vegetation restoration on ecosystem services at a regional scale. Sci. Total Environ. 2019, 650, 1029–1040. [Google Scholar] [CrossRef]
- Zhang, K.; Lv, Y.H.; Fu, B.J.; Yin, L.C.; Yu, D.D. The effects of vegetation coverage changes on ecosystem service and their threshold in the Loess Plateau. Acat Geogr. Sin. 2020, 75, 949–960. [Google Scholar] [CrossRef]
- Zhai, J.J.; Wang, L.; Liu, Y.; Wang, C.Y.; Mao, X.G. Assessing the effects of China’s Three-North Shelter Forest Program over 40 years. Sci. Total Environ. 2023, 857, 159354. [Google Scholar] [CrossRef]
- Chen, W.; Chi, B. Ecosystem services trade-offs and synergies in China, 2000–2015. Int. J. Environ. Sci. Technol. 2022, 20, 3221–3236. [Google Scholar] [CrossRef]
- Xu, Y.K.; Zhao, Z.Y.; Wang, H.Y.; Liu, Z.; Yan, Y.; Liu, J.T.; Ning, Q.S.; Zhao, Y.; Lv, Y.H.; Ding, X.W.; et al. Research progress on ecological conservation and restoration technologies and models with comprehensive benefit evaluation in the Loess Plateau. Acta Ecol. Sin. 2025, 45, 1–14. [Google Scholar] [CrossRef]
- Li, K.X.; Hu, H.; Zhao, H.M. Evolution analysis of regional social-ecological systems based on adaptive cycle theory and Pressure-State-Response framework. Acta Ecol. Sin. 2022, 42, 10164–10179. [Google Scholar] [CrossRef]
- Wan, G.Y.; Yang, L.P.; Wang, M.; Li, K.Y.; Yang, J.J.; Yao, J.Q. Spatio-temporal Monitoring and Driving Factor Analysis of Eco-environment Quality in the Loess Plateau of Northern Shaanxi. Environ. Sci. 2025, 46, 4522–4533. [Google Scholar] [CrossRef]
- Wu, X.; Liu, S.L.; Zhao, S.; Hou, X.Y.; Xu, J.W.; Dong, S.K.; Liu, G.H. Quantification and driving force analysis of ecosystem services supply, demand and balance in China. Sci. Total Environ. 2019, 652, 1375–1386. [Google Scholar] [CrossRef]
- Cui, F.Q.; Tang, H.P.; Zhang, Q.; Wang, B.J.; Dai, L.W. Integrating ecosystem services supply and demand into optimized management at different scales: A case study in Hulunbuir, China. Ecosyst. Serv. 2019, 39, 100984. [Google Scholar] [CrossRef]
- Xia, G.Z.; Lv, G.H.; Yang, J.J. Ecological Risk Assessment of the Aksu River Basin Based on Ecological Service Value. Land 2025, 14, 2092. [Google Scholar] [CrossRef]
- Lin, T.W.; Gao, J.E.; Long, S.B.; Dou, S.H.; Zhang, H.C.; Li, X.H. Regulation of Different Standard Extreme Rainfall Erosion in Loess Hilly and Gully Region. Res. Soil Water Conserv. 2019, 26, 114–119,132. [Google Scholar] [CrossRef]
Disclaimer/Publisher’s Note: The statements, opinions and data contained in all publications are solely those of the individual author(s) and contributor(s) and not of MDPI and/or the editor(s). MDPI and/or the editor(s) disclaim responsibility for any injury to people or property resulting from any ideas, methods, instructions or products referred to in the content. |
© 2025 by the authors. Licensee MDPI, Basel, Switzerland. This article is an open access article distributed under the terms and conditions of the Creative Commons Attribution (CC BY) license (https://creativecommons.org/licenses/by/4.0/).