Article

Projected Soil Erosion Risk Under Shared Socioeconomic Pathways: A Case Study with RUSLE Modelling in Sakarya, Türkiye

Department of Geography, Faculty of Humanities and Social Sciences, Sakarya University, Serdivan 54050, Sakarya, Türkiye
*
Author to whom correspondence should be addressed.
Land 2025, 14(11), 2153; https://doi.org/10.3390/land14112153
Submission received: 15 September 2025 / Revised: 14 October 2025 / Accepted: 20 October 2025 / Published: 29 October 2025

Abstract

Türkiye is one of the most vulnerable countries in the Mediterranean Basin; the assessment of changes in soil erosion driven by both climate variability and anthropogenic factors is of great importance. This study aims to examine the current state and potential future changes in soil erosion in Sakarya Province, situated in the eastern part of the Mediterranean Basin, by employing the GIS-based RUSLE (Revised Universal Soil Loss Equation) model. Considering the impact of climate change on precipitation regimes, rainfall projections for the 2061–2080 period under the high-emission SSP5-8.5 scenario were evaluated. The analysis revealed that the current average annual soil loss in Sakarya is 2.9 t/ha, with the highest erosion risk occurring on steep slopes, bare surfaces, and agricultural lands. By 2080, under the SSP5-8.5 scenario, the annual average soil loss is projected to be 2.6 t/ha, while slight and very slight erosion levels are expected to increase. These results provide important insights for identifying current risk areas and critical zones for conservation, as well as for projecting future erosion scenarios, thus contributing to sustainable land management policies at the watershed scale. The study suggests that strategies to reduce erosion risk in Sakarya should particularly focus on land management practices such as slope stabilization, afforestation, land cover improvement, and terracing. These approaches are crucial for mitigating land degradation (SDG 15.3) and ensuring sustainable agricultural production (SDG 2.4) within the framework of the Sustainable Development Goals.

1. Introduction

In recent decades, hydrological systems in river basins have undergone significant changes due to variations in climate and human activities. Climate change has led to an increase in frequency, intensity, and amount of heavy rainfall events on a global scale, significantly affecting soil erosion in many river basins. Climate model projections indicate that this increase will continue in the coming decades. Extreme rainfall causes soil erosion through detachment of soil particles due to high rainfall intensity. Borrelli et al. (2020), using the GIS-based RUSLE model and SSP scenarios, identified a trend of increasing global erosion [1]. Soil erosion is the process of soil being eroded and transported from its location by water, wind, and/or tillage. The loss of the topsoil, which is the most fertile part of the soil, poses a serious threat, particularly in terms of agricultural productivity [2,3]. Therefore, erosion is considered not only an environmental issue but also a socioeconomic problem. While annual global soil erosion caused by water is around 20–30 billion tons [4,5,6], it is reported that approximately 642 million tons of soil are transported to seas and lakes each year in Türkiye [7,8,9,10,11].
The Mediterranean Basin is a highly vulnerable region to erosion due to its steep terrain, sparse and fragile vegetation cover, and weak soil profiles. In this region, the occurrence of long drought periods immediately following heavy rainfall events further intensifies erosion processes [12].
The erosion process varies depending on land use, soil type, and topographic structure. However, the main determinants of this process are precipitation and wind, which are directly influenced by climate. Water erosion, in particular, increases under conditions of high rainfall intensity accompanied by surface runoff. Variables such as the amount, frequency, intensity, and seasonality of precipitation directly affect the severity of erosion, depending on whether surface runoff increases or decreases.
The changes occurring in the climate system over each passing decade lead to significant alterations in natural environmental conditions, modify the rates of Earth surface processes [13], and consequently reshape the fundamental mechanisms affecting soil erosion [14,15].
Although many factors determine the amount of precipitation in a region, atmospheric oscillations—particularly the North Atlantic Oscillation (NAO) and the Arctic Oscillation (AO)—are among the most important parameters influencing annual precipitation amounts in Türkiye, as in much of the Mediterranean region [16]. Changes in the amount and characteristics of precipitation (intensity, magnitude, seasonality) also redefine erosion processes in these areas. An increase in precipitation that exceeds the soil’s infiltration capacity generates more surface runoff, which, in turn, intensifies erosion. Moreover, not only an increase in total precipitation but also irregularities in intra-seasonal distribution, along with the growing frequency of sudden and short-term convective storms, exert an additional amplifying effect on erosion processes.
Climate projections indicate that, in addition to increased rainfall intensity and total precipitation, rising wind speeds will also impact erosion [17,18]. In recent years, studies have increasingly focused on modeling future erosion conditions using climate projection data [19,20,21,22].
For example, Teng et al. [19] estimated that erosion on the Tibetan Plateau will increase by 14% to 41% by 2050. Patriche [21], in a study conducted in Romania using the RUSLE model, stated that erosion will increase significantly, particularly in rugged terrains. Another study carried out in the Haouz Plain of Morocco projected that by 2040, erosion will rise from 3.53 t/ha to 4.41 t/ha under the RCP 2.6 scenario, and to 5.31 t/ha under the RCP8.5 scenario [22].
Similarly, Panagos et al. [23] predict an erosion increase of 13–22.5% in the EU and the UK by 2050, noting that the main driver is the erosive power of rainfall, while land use has a positive effect of around 3%. Another study, using 19 different climate models, reported that erosion potential is expected to increase on 80–85% of the world’s land surface, with an estimated rise of 26.2–28.8% by 2050 and 27–34.3% by 2070 [24]. In another study, Pinson and AuBuchon (2023) stated that, under the SSP8.5 scenario, erosion in New Mexico is projected to reach 5.5–7.5 t/ha/year by the end of the 21st century [25].
Climate change simulations for the 21st century in Great Britain indicate an increase in intense rainfall events, which could lead to widespread soil loss by increasing the likelihood of surface runoff [26].
The results of some erosion studies for the Mediterranean Basin are as follows: Samarinas et al. (2024) reported that 6% of agricultural lands in the Imathia region of northern Greece are at an erosion risk greater than 11 t/ha/year [27], while Sifi et al. (2024), using RUSLE and fuzzy logic in Tunisia, demonstrated significant declines in agricultural productivity [28]. Terranova et al. (2009) indicated that implementing appropriate measures could reduce erosion by more than 50% in the Calabria region of Italy [29].
Various studies have also been applied on this research in Türkiye. Gezici et al. (2025) predict that future erosion risk in the Oltu Basin in northeastern Türkiye will increase, particularly in high-risk areas [30]. Demir and Dursun (2024) reported that, following the Manavgat fire, erosion calculated using RUSLE in the region increased by 0.10 t/ha/year [31].
In Türkiye, the average annual water erosion rate of 8.24 t/ha is likely to increase in the future due to various factors, such as the rise in extreme precipitation events associated with climate change and land degradation [7]. In recent years, alongside the increase in heatwaves [32], a rise in forest fires has been observed in Sakarya, the study area, due to human activities, which has also led to degradation of land cover. During fieldwork conducted in August 2025 to observe the effects of the forest fires that occurred in July 2025, it was anticipated that areas heavily affected by the fires could experience soil degradation along with deforestation.
In this context, the objectives of the study are as follows: (a) to determine the current state of soil erosion in Sakarya, one of the most fertile agricultural regions of Türkiye, and (b) to develop future erosion risk models using precipitation data for the 2061–2080 period under the SSP5-8.5 climate scenario, by applying the R factor—the most dynamic variable within the RUSLE model—in order to estimate areas likely to be at risk of erosion in the future.

Characteristics of the Study Area

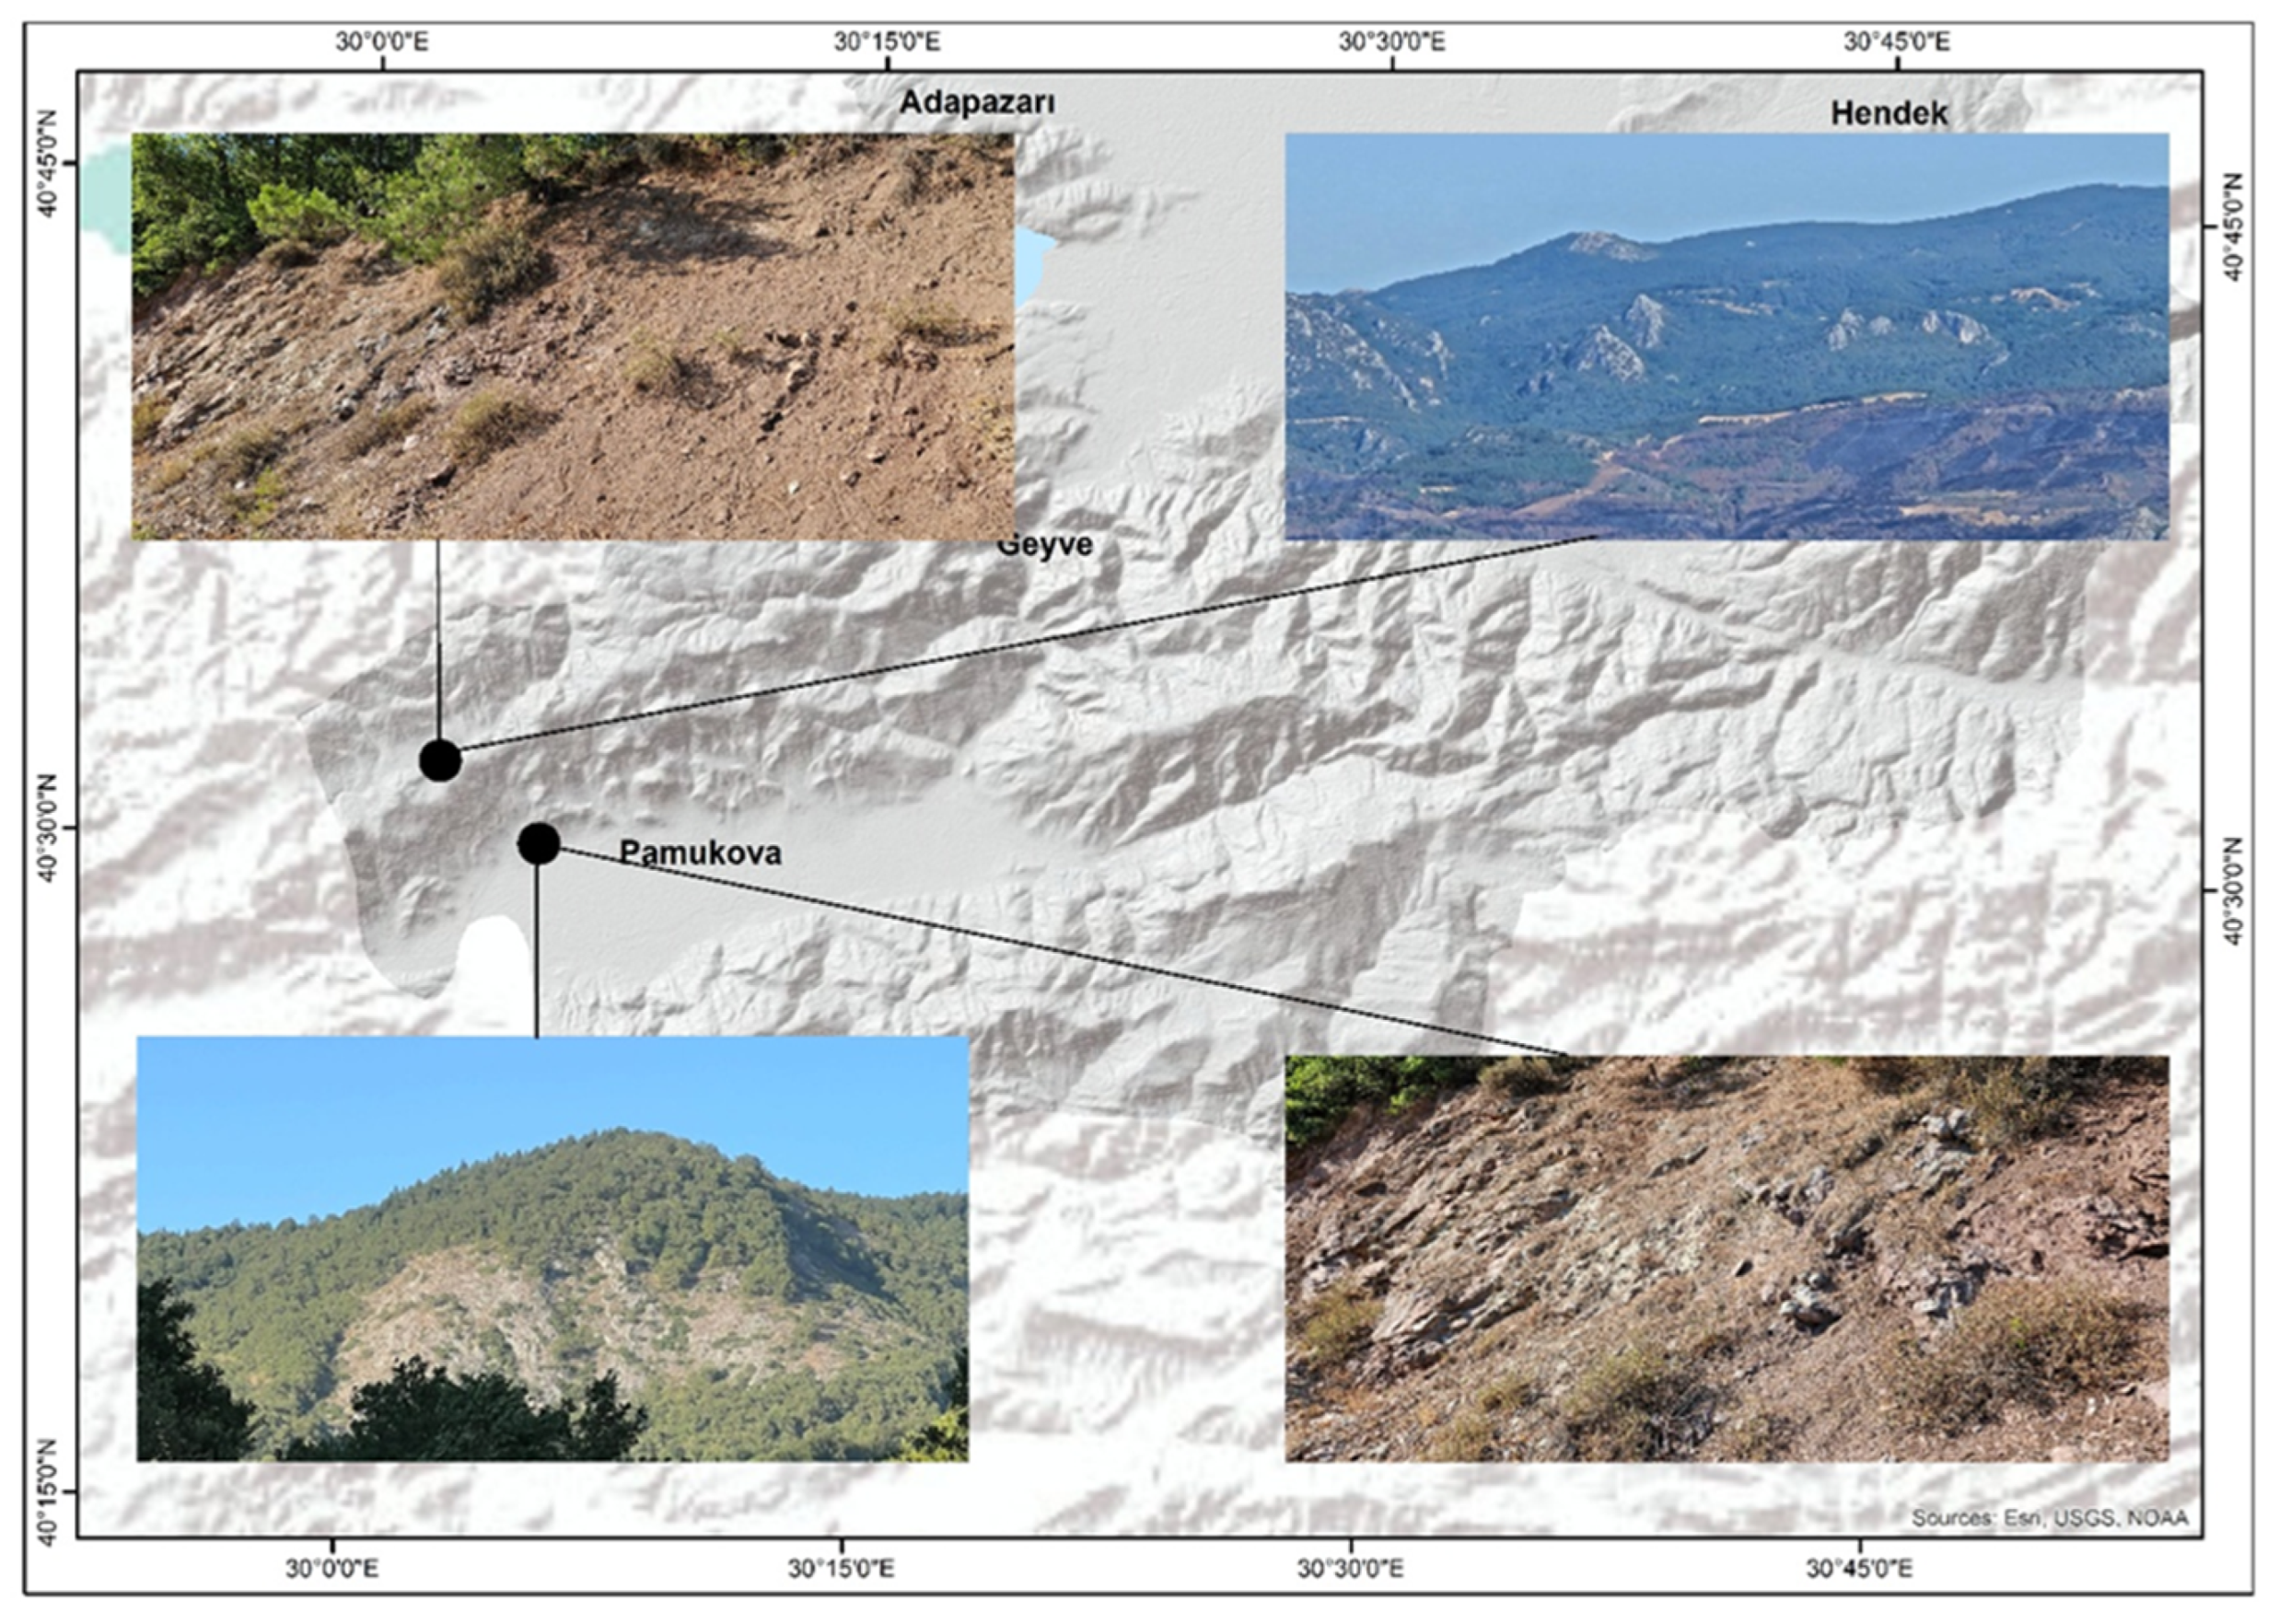
Sakarya, which constitutes the study area, is located in the eastern part of the Mediterranean Basin, in the north-northwest of Türkiye, between 40°17′–41°13′ N latitudes and 29°57′–31°05′ E longitudes (Figure 1). Bordered by the Black Sea to the north, elevation values increase toward the south due to the influence of the Samanlı Mountains and their extensions, resulting in diverse topography. According to the Köppen climate classification, the region exhibits a transitional climate, characterized by Cfa (humid subtropical) conditions in the north and Csa (hot-summer Mediterranean) conditions in the south, with varying precipitation regimes influenced by different climatic conditions. The mean annual temperature of Sakarya is 14.4 °C, and the average annual precipitation is 844.4 mm [33]. The main soil type distributed across the province is calcareous-free brown forest soil.
In addition to its geographic location, the topographic variability causes Sakarya not to exhibit uniform climate conditions. In regions adjacent to the Black Sea, high humidity and characteristics close to the Black Sea climate are observed, whereas in the south, particularly south of the Geyve Strait, the effects of the Mediterranean climate become more pronounced. This climatic variability also leads to significant differences in vegetation cover. Broad-leaved forests dominate in areas with high precipitation, coniferous species are found in higher elevations, and steppe formations occur sporadically in plains and interior regions [34].
Due to its favorable geographical conditions, the population of Sakarya has been steadily increasing. Residential areas, industrial facilities, and agricultural activities are distributed in specific parts of the province. In the districts with the highest population density—Adapazarı, Serdivan, Akyazı, and Hendek—population growth continues, and intensive industrial and agricultural activities are being carried out. With the expansion of urbanization, land-use changes and the degradation of vegetation have the potential to further increase the risk of erosion in these areas [35].

2. Materials and Methods

In this study, precipitation data, soil data, digital elevation model (DEM) data, and satellite imagery were used to assess soil erosion risk under climate change conditions.
Historical precipitation data for the reference period 1990–2000 were obtained from the WorldClim 2.1 database. Future climate projections were derived from the Coupled Model Intercomparison Project Phase 6 (CMIP6), which provides statistically downscaled data. Using raster-format rainfall data with a spatial resolution of approximately 1 km (30 arc sec), rainfall erosivity factor (R) maps for the study watershed were generated based on future climate conditions. These maps were prepared according to the SSP5-8.5 scenario, representing a high-emission pathway for the 2061–2080 period, and were integrated as key input parameters into the RUSLE model.
Two general circulation models (GCMs) that are considered to provide the most reliable results for Türkiye were used in the climate projections [30,36,37,38]: MPI-ESM1-2-HR and HadGEM3-GC31-LL. The outputs of these models were downscaled and bias-corrected based on the historical WorldClim 2.1 data.
For the determination of soil properties, the 1:25,000-scale Major Soil Groups map prepared by the Ministry of Environment, Urbanization, and Climate Change of the Republic of Türkiye was used. From these data, a K-factor map representing the susceptibility of soils to erosion was derived.
The LS factor, representing slope length and steepness, was calculated using a 30 m resolution Shuttle Radar Topography Mission (SRTM) digital elevation model. Flow direction and flow accumulation analyses were conducted to evaluate the topographic contributions in detail.
For the determination of land cover and land use classes, Sentinel-2 satellite imagery dated 16 August 2024 with a 10 m resolution [39] was used. A C-factor map was derived from the obtained data.
Since there are no engineering practices or conservation measures to reduce erosion in the study area, the P factor, representing management practices, was assumed to be constant at “1” [40].

2.1. Revised Universal Soil Loss Equation (RUSLE) Model

In this study, the Revised Universal Soil Loss Equation (RUSLE) model was used to quantitatively assess soil erosion under climate change scenarios. RUSLE is an improved version of the original USLE [41] model and is an empirical model widely used to estimate soil loss, particularly under varying land conditions and across large areas [42,43].
The model is based on the multiplication of five primary factors:
A = R × K × LS × C × P
Here,
  • A: average annual soil loss (t/ha·year);
  • R: rainfall erosivity factor (MJ·mm/ha·h·year);
  • K: soil erodibility factor (t·h/MJ·mm);
  • LS: slope length and steepness factor (dimensionless);
  • C: cover management factor (dimensionless);
  • P: conservation of support-practice factor (dimensionless),
The other factors—K, LS, C, and P—were assumed to be constant based on current baseline data, as no future projections were available for these variables.
Each factor of the model was generated as a separate layer in a GIS environment, and these layers were multiplied to calculate the average annual soil loss for each pixel.
For determining the soil susceptibility classes to erosion, the classification proposed by Bergsma et al. (1996) [44] was adopted, taking into account the ecological conditions of the study area and classifications from other studies with similar ecological characteristics. This classification is defined as follows: 0–5 very low, 5–12 low, 12–35 moderate, 35–60 high, 60–150 severe, and >150 very severe erosion susceptibility.

2.1.1. Rainfall Erosivity Factor (R)

The rainfall erosivity factor (R) is an important parameter that quantitatively represents the impact of precipitation on soil erosion [45]. In general, higher precipitation increases erosivity [46]. In this study, the R factor was calculated using different methods for both the current and future periods.
The R factor was predicted using the Modified Fournier Index (MFI) according to the following equation [47]:
R = 4.17 × MFI − 152
In this study, the R factor was calculated separately for both the current (1990–2000) and future (2061–2080) periods. The precipitation data used in the calculations were obtained from the WorldClim 2.1 global climate database, which has an approximate spatial resolution of 1 km [48]. This dataset includes both long-term historical and future climate projections.
Future projections are based on two general circulation models (GCMs) under the high-emission SSP5-8.5 scenario: MPI-ESM1-2-HR and HadGEM3-GC31-LL. The CMIP6-based climate projections used were bias-corrected relative to historical data by WorldClim 2.1 and provided in a statistically downscaled format [49].
Monthly and annual mean precipitation data used in the calculation of the R factor were masked according to the boundaries of Sakarya Province to create area-specific average precipitation series. From these series, long-term mean R factor values were calculated for both the current and future periods, allowing for the analysis of potential precipitation-driven changes in erosion under a high-emission scenario.
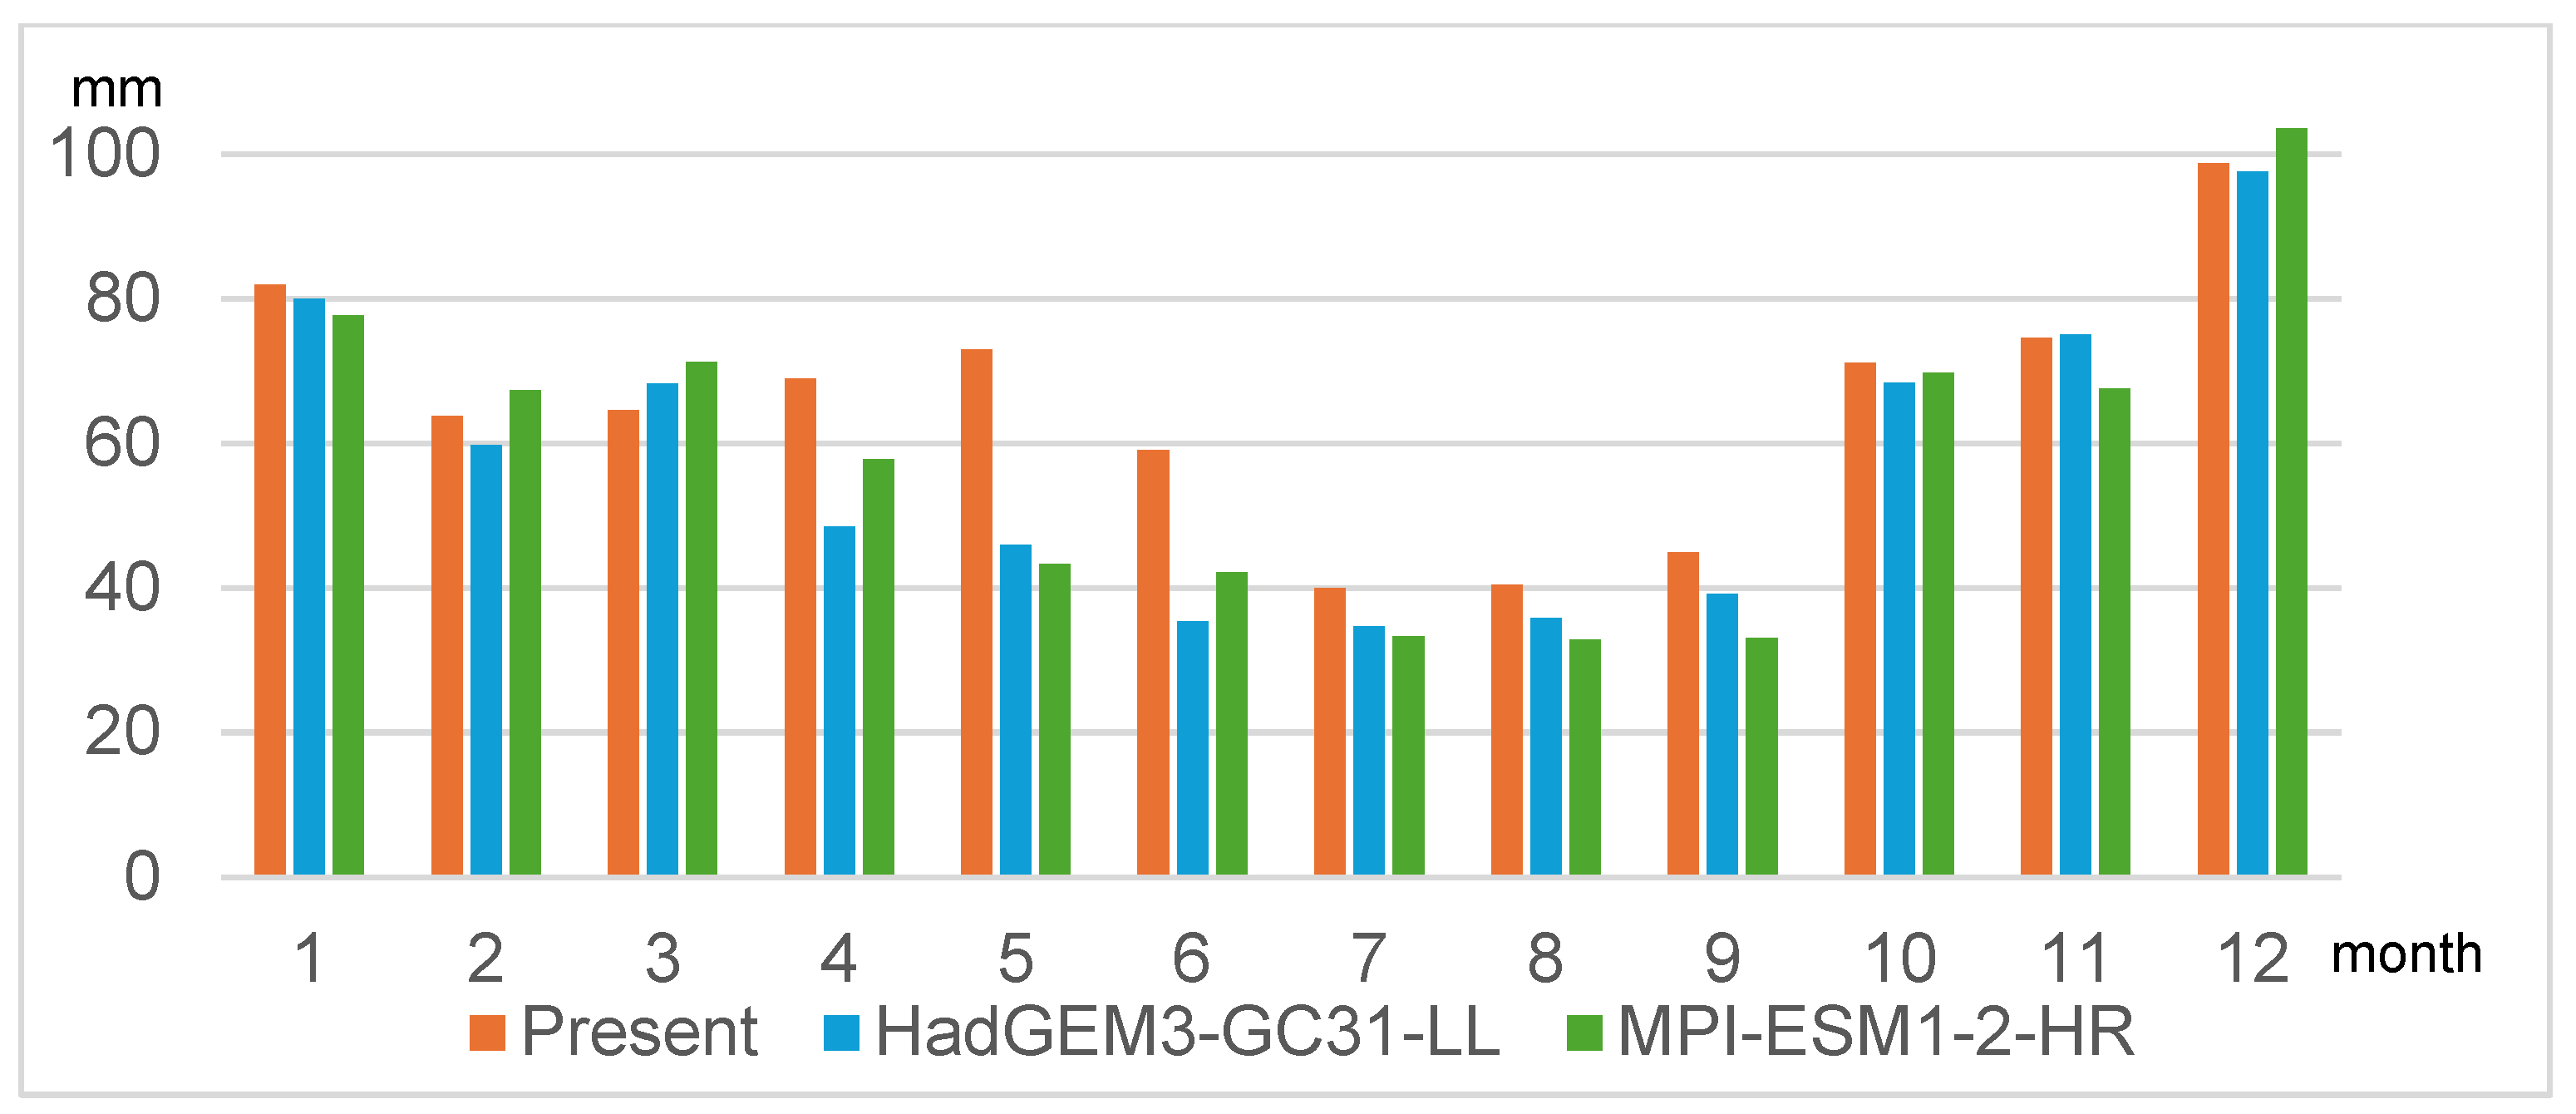
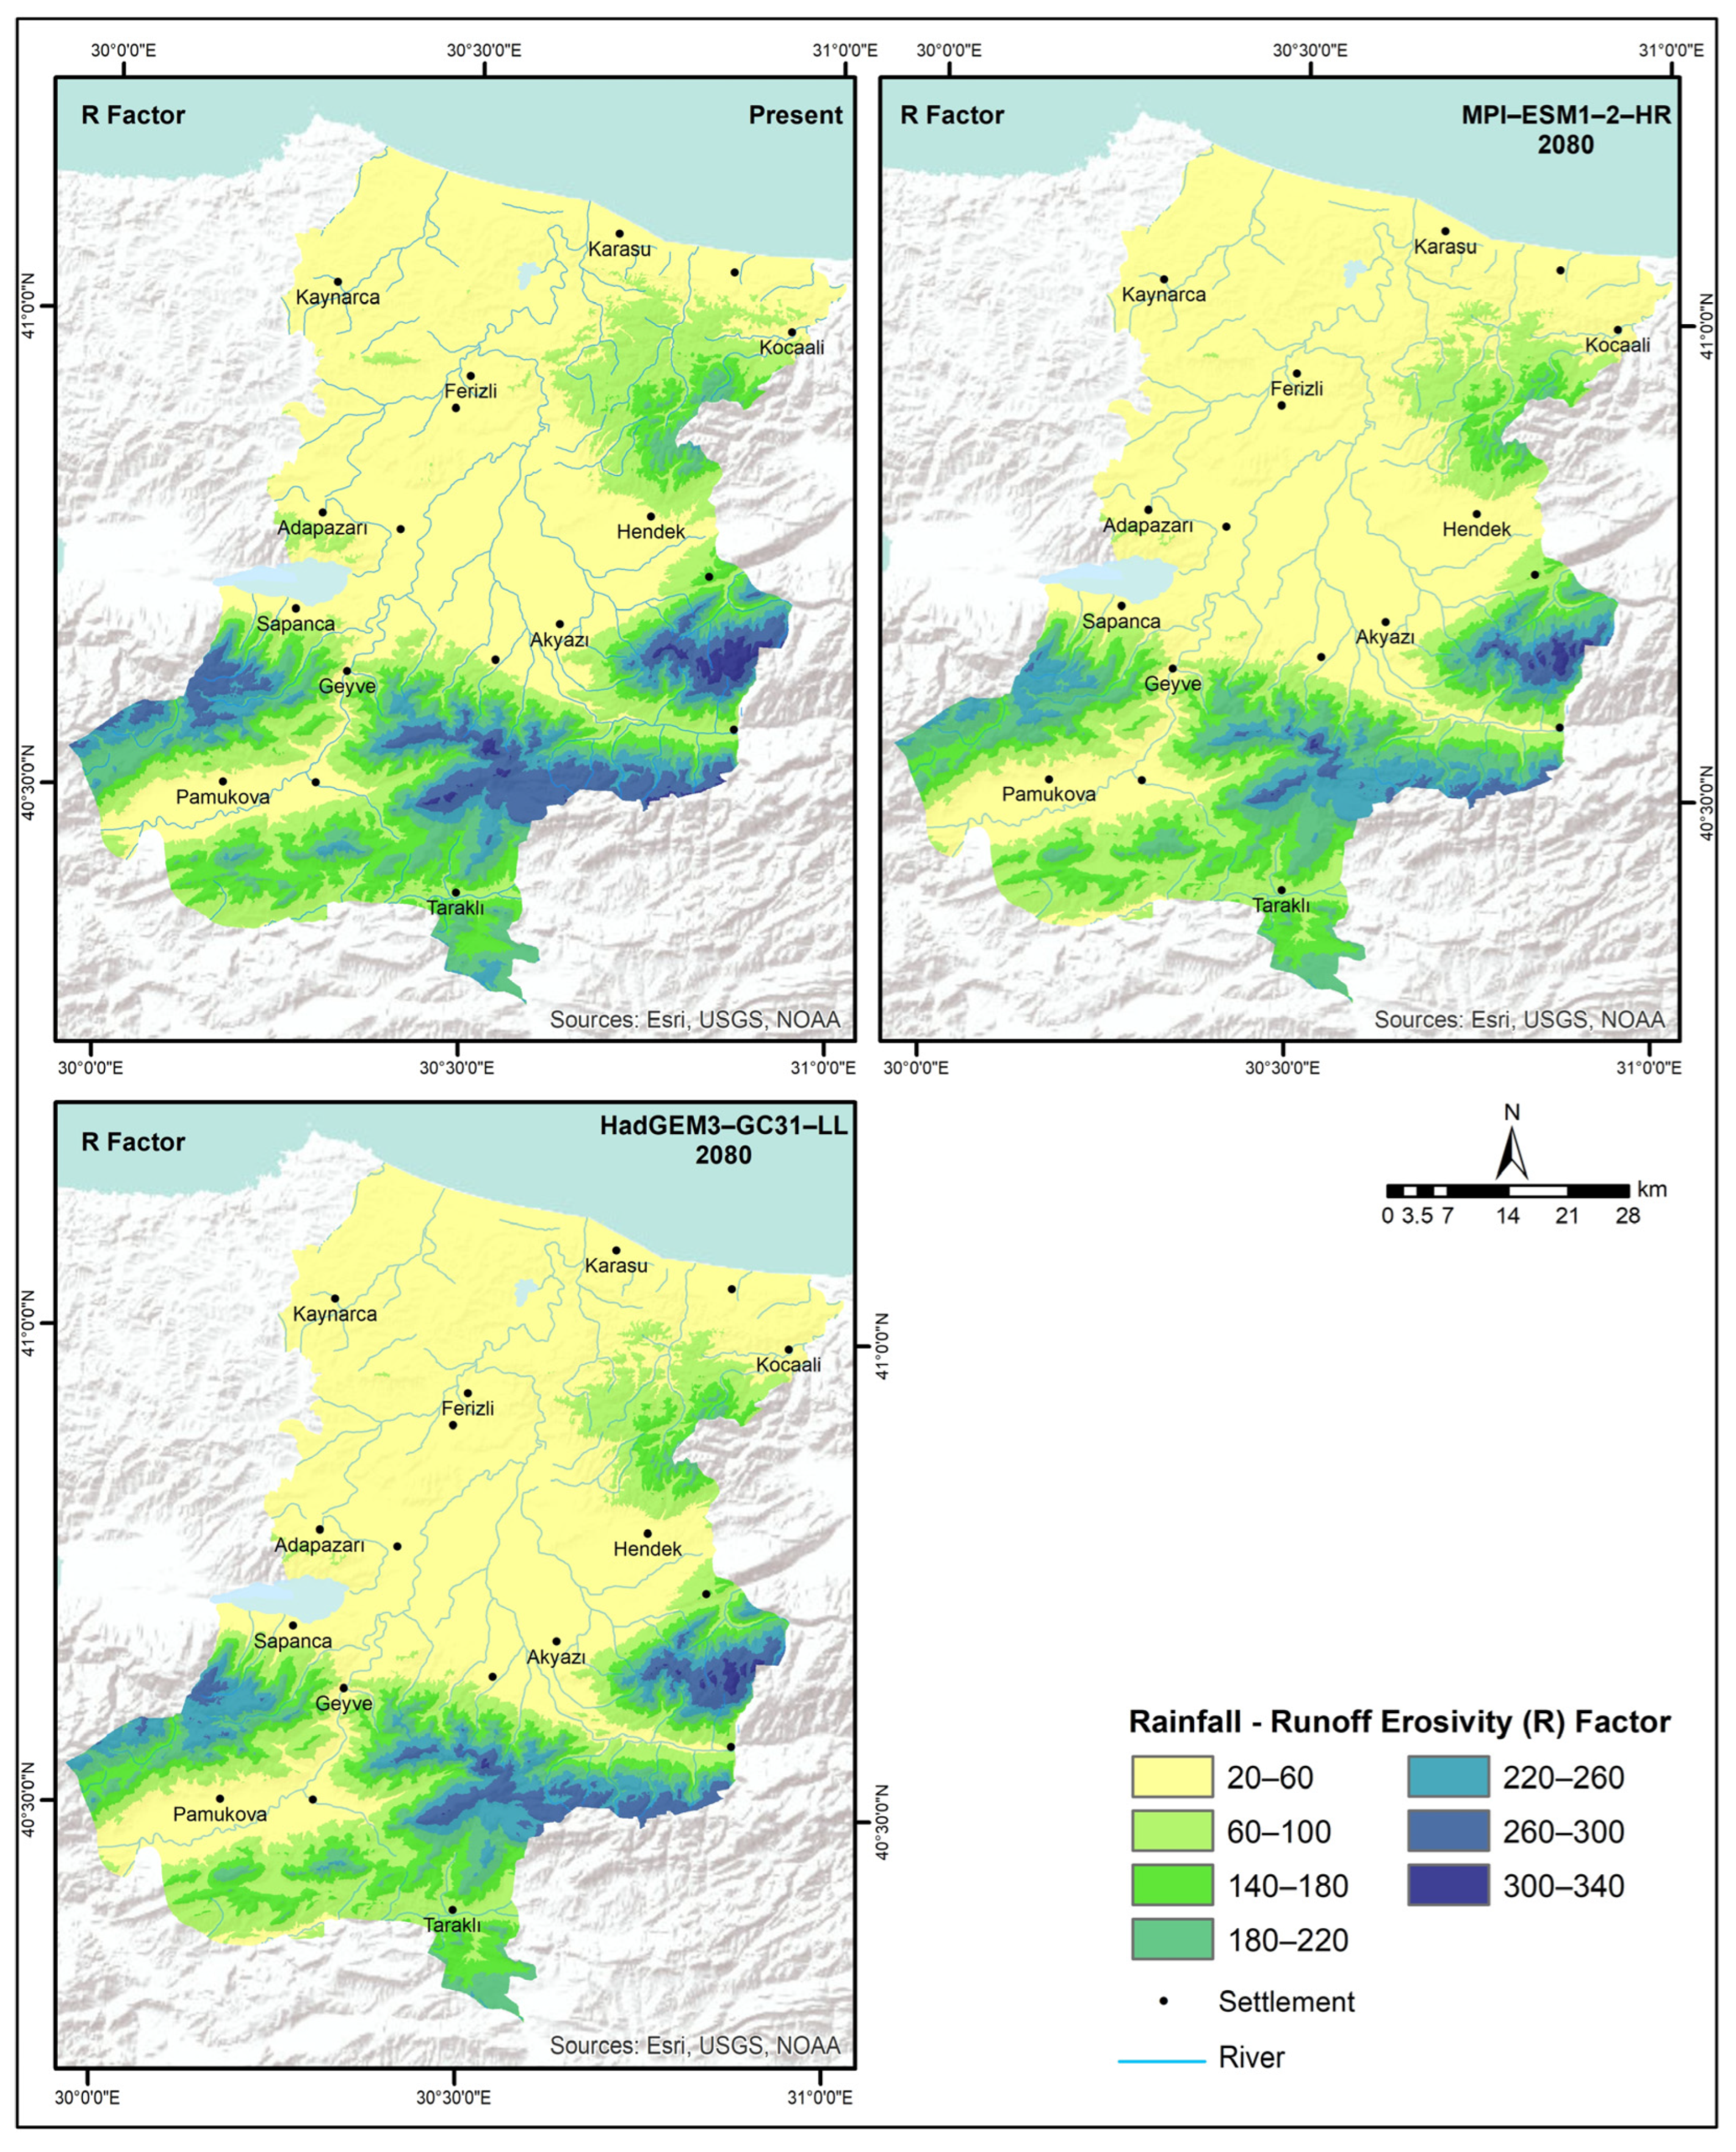
In this process, only erosive rainfall events were considered, annual total erosion potential values were derived, and long-term averages were calculated to determine the R factor through the Modified Fournier Index (MFI) representing the study area. The MFI is an index that accounts for both the amount and distribution of precipitation and is widely used in the literature for estimating erosion potential. The R–MFI relationship determined for the current period was applied to future MFI values to obtain R factor projections, and the impacts of climate change on precipitation-driven erosion potential were analyzed comparatively (Table 1 and Table 2, Figure 2 and Figure 3).

2.1.2. Soil Erodibility Factor (K)

The soil erodibility factor (K) is a parameter that quantitatively represents the susceptibility of soil to detachment and transport caused by raindrop impact and surface runoff, depending on its physical properties. In the RUSLE model, this factor is calculated based on key soil characteristics such as soil texture (proportions of clay, silt, and sand), organic matter content, soil structure, and permeability [41,43,50,51]. The K value ranges from 0 to 1, with values closer to 1 indicating higher susceptibility of the soil to erosion [52].
In this study, the K factor was calculated using the 1:25,000-scale digital soil map of Sakarya Province provided by the Ministry of Agriculture and Forestry of Türkiye as the base data. The map is organized according to the classification of major soil groups, and each soil unit was assigned erodibility coefficients defined in the RUSLE literature. K values for each unit parcel, based on major soil groups, were determined using soil data (Table 3) [53].
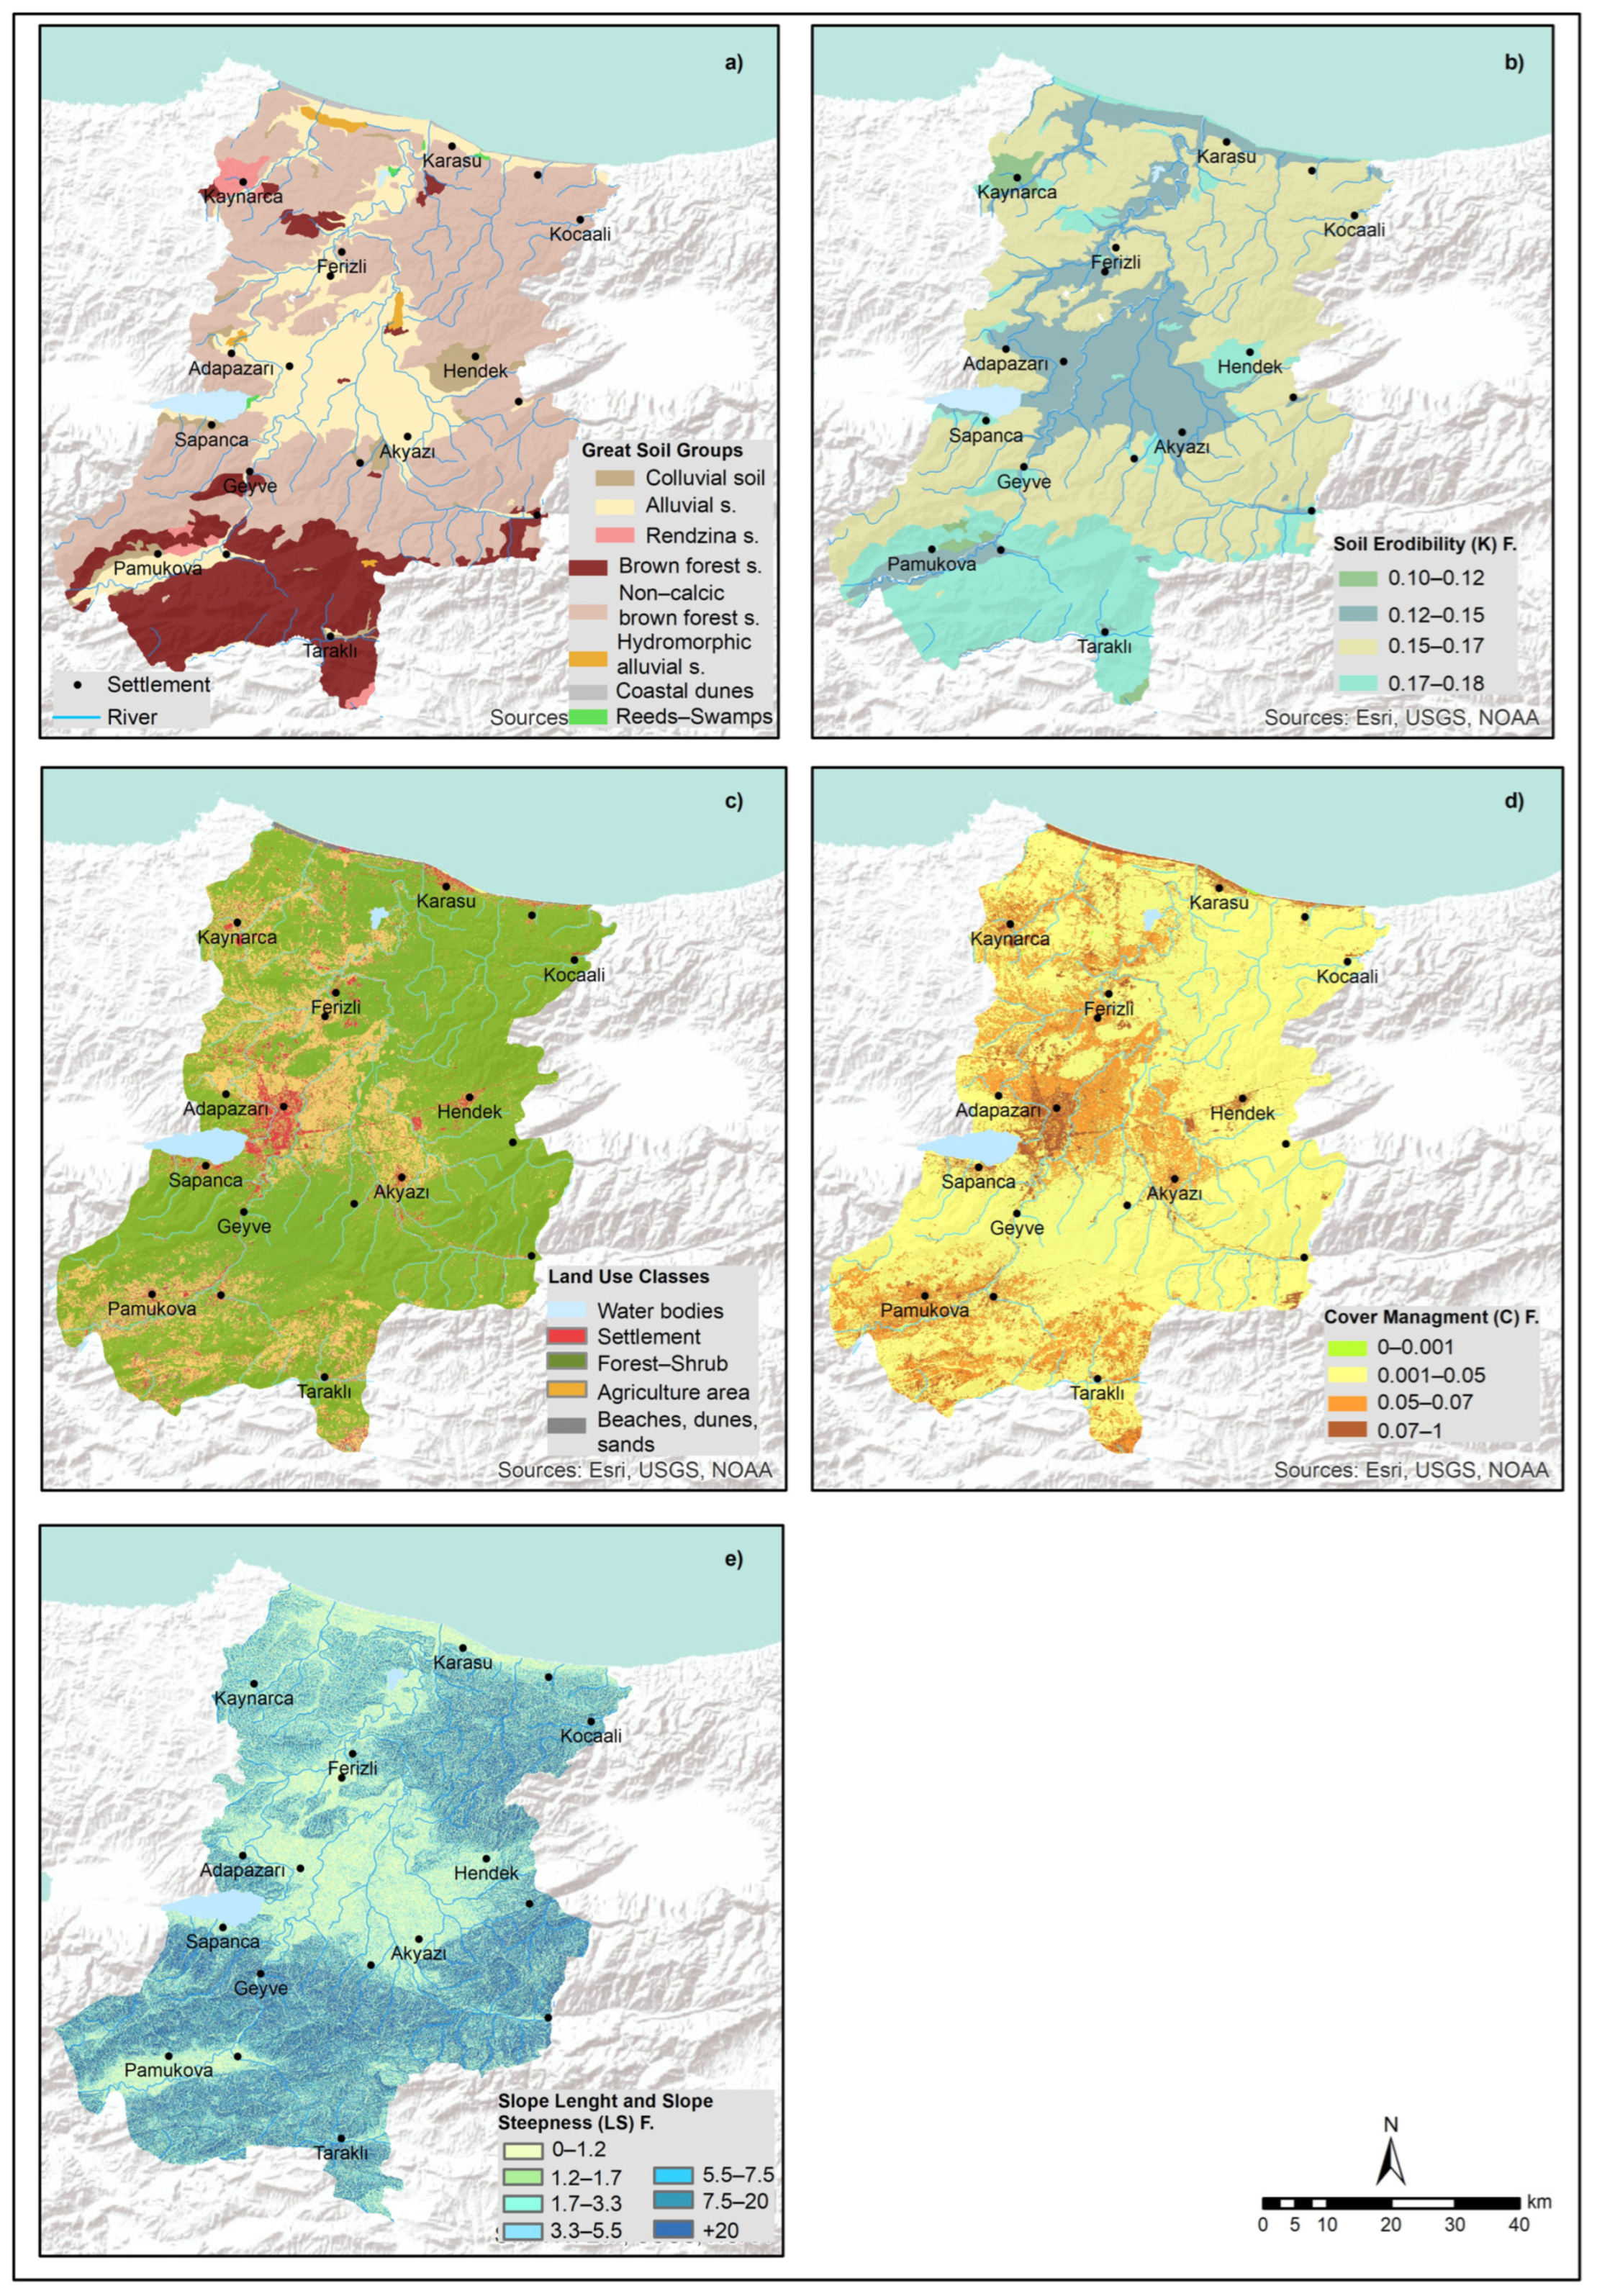
These classes were analyzed in a Geographic Information System (GIS) environment and converted into a raster-format K-factor map (Figure 4). This map was integrated with the other components of the RUSLE model and used to estimate annual soil loss across the study area. This approach provides an important basis for assessing the spatial distribution of soil susceptibility to erosion at a regional scale.

2.1.3. Slope Length and Steepness Factor (LS)

The LS factor, obtained by multiplying the slope length (L) and steepness (S) components, is an important parameter that quantitatively represents the influence of topography on soil erosion. This factor reflects the energy potential of surface runoff and plays a critical role in determining water-induced soil transport. The LS value is defined as “1” for a reference surface with a length of 22.13 m and a slope of 9%; as slope length and steepness increase, the erosion potential rises in a nonlinear manner [53].
In the literature, it is emphasized that slope steepness has a more decisive effect on erosion compared to slope length. Steep slopes increase surface flow velocity, reduce surface stability, and facilitate the detachment of soil particles [30,54,55,56]. In contrast, slope length promotes the accumulation of surface runoff, thereby enhancing the transport process.
In this study, the LS factor was calculated using Shuttle Radar Topography Mission (SRTM) digital elevation model (DEM) data with a spatial resolution of 30 m. DEM-based analyses were conducted in the ArcGIS Pro environment, including the Fill, Flow Direction, and Flow Accumulation processes. Subsequently, a slope map was generated, and LS values were calculated on a pixel-by-pixel basis using the topographic formulations proposed by Mitasova et al. (1996) [57] and Desmet & Govers (1996) [58]:
LS = Pow((fac) × resolution/22.1, 0.6) × Pow(Sin((solpe) × 0.01745)/0.09, 1.3)
This method is widely used in the literature to model the effect of topography on erosion with high accuracy. The resulting LS raster data were integrated with the other factors of the RUSLE model and used to estimate the average annual soil loss for each pixel (Table 4, Figure 4).
In this study, LS factor values were divided into seven classes: 0–1.2 (very low), 0.12–1.7 (slightly low), 1.7–3.3 (low), 3.3–5.5 (moderate), 5.5–7.7 (moderate high), 7.7–20 (high) and >20 (very high) [30,59].

2.1.4. Cover Management Factor (C)

The C factor is a parameter that quantitatively represents the protective effect of vegetation against erosion. Vegetation cover on the soil surface reduces surface runoff by preventing raindrops from directly striking the soil and significantly limits the detachment of soil particles. Therefore, the density and health of vegetation play a fundamental role in determining the C factor, which is one of the most critical components in erosion modeling [6].
In this study, the C factor was calculated using Sentinel-2 satellite imagery dated 16 August 2024. Sentinel-2, with its 10 m spatial resolution and multispectral configuration, provides the capability to analyze land cover with high accuracy. For this purpose, land cover classification for the C factor was performed in the ArcGIS Pro environment using a supervised classification method based on the Sentinel-2 imagery. As a result of the classification, the study area was divided into five main classes: water bodies, forest–shrub, beaches-dunes-sands, agriculture areas, and settlement. To assign C factor values [60] to the generated land cover map, the raster-format land cover data were converted into vector format and the corresponding C factor values were integrated (Figure 4).

2.1.5. Conservation of Support-Practice Factor (P)

The P factor is a dimensionless parameter representing the effectiveness of soil and water conservation measures applied in the field, playing a significant role in erosion by altering the direction and intensity of surface runoff. This factor reflects the difference between soil loss occurring along the slope and the soil loss under conservation measures implemented in the same area [43,61].
P factor values range between 0 and 1. Values close to 1 indicate that no protective measures have been applied in the area, and potential soil loss is at its maximum, whereas lower values reflect a reduction in erosion due to implemented physical or agricultural conservation practices [62,63]. Such measures include contour plowing, terracing, strip cropping, cover crop use, and water-retention structures [41].
However, to reliably determine the P factor, detailed field observations and data on local agricultural practices are required. In many studies, when such data are unavailable, it is assumed that the area lacks conservation practices, and P is taken as 1 [64,65,66].
Similarly, in this study, the P factor was fixed at a value of 1, as no physical or agricultural soil conservation practices were present in the study area. This approach allows the model to provide a realistic scenario without overestimation.

3. Results

Evaluation of RUSLE Model Parameters

In this study, the RUSLE (Revised Universal Soil Loss Equation) model was used to determine the spatial distribution of soil erosion. Within the model, the five primary factors—R (rainfall erosivity), K (soil erodibility), LS (slope length and steepness), C (cover management), and P (conservation of support-practice) were analyzed and mapped in a Geographic Information System (GIS) environment.
In the first phase of the study, a method was developed for calculating the R factor by considering topographic elevations ranging from 0 to 1800 m. While modelling the precipitation variation with elevation, the Scheiber formula was applied [67], and monthly mean precipitation data obtained from the WorldClim database were spatially distributed using interpolation methods. Maps indicated that precipitation increases with elevation, and this increase plays a decisive role in the R factor. The results show that R values rise with both elevation and slope, demonstrating that erosion risk in the Sakarya is directly related to topographic characteristics (Table 1, Figure 3).
The annual mean precipitation amounts obtained for the study area are 781.2 mm for the present period, 699.6 mm for approximately 2080 according to the MPI-ESM1-2-HR model, and 688.6 mm according to the HadGEM3-GC31-LL model (Table 2, Figure 2). Examining the R values obtained for the 2061–2080 period from the MPI-ESM1-2-HR and HadGEM3-GC31-LL models, it is evident that decreases in precipitation projections also affect the R factor. Based on SSP scenarios for the study area, precipitation is projected to decrease by 11.8% according to the MPI-ESM1-2-HR model and by 10.4% according to the HadGEM3-GC31-LL model. In precipitation projection studies for Türkiye, under the RCP8.5 scenario for the 2016–2099 period, the annual total precipitation anomaly is expected to range on average from +3% to −12%. The mean change in precipitation anomaly is projected to range between +5% and −1% in the first half of the century, and between +1% and −18% in the second half [68]. Analyses based on SSP scenarios for the 2070–2100 period indicate that annual total precipitation in Türkiye is expected to decrease by approximately 12–15% under the SSP2-4.5 scenario and by approximately 15–20% under the SSP5-8.5 scenario by the end of the century [69].
To determine soil erodibility factor (K) values, a map of the major soil groups in the study area was first created. In the Sakarya, different major soil groups have developed depending on pedogenetic factors such as climate, parent material, biological activity, topography, and time. These groups include calcareous brown forest soils and brown forest soils within the zonal soils; alluvial and colluvial soils within the azonal soils; and rendzinas within the intrazonal class. Additionally, coastal dunes, as well as reeds and swamp areas, are present in the region (Figure 4).
In terms of area, the most widespread soil type is calcareous-free brown forest soils, covering 2654 km2. This is followed by brown forest soils (987 km2), alluvial soils (878 km2), colluvial soils (130 km2), rendzinas (0.02 km2), coastal dunes (0.4 km2), and reeds/swamp areas (0.1 km2) [70,71,72,73] (Table 3).
According to the K factor values, moderately erodible soils are widespread in the study area [74,75]. Areas with high K factor values generally coincide with sloped agricultural lands (Figure 4). In particular, in calcareous brown forest soils, the leaching of plant nutrients due to high rainfall reduces soil fertility and increases erosion risk if these areas are converted to agricultural use.
To calculate the slope length and steepness factor (LS), a slope class map of the study area was first created (Figure 4). The average LS value in the study area is 16.2. Approximately 45.7% of the area falls within the very low LS category, 17% within the high category, and 20.8% within the very high category (Figure 4). The lowest slope values are concentrated around the Adapazarı and Pamukova plains. The analysis shows that high LS values generally correspond to steep and mountainous areas [76]. Conversely, flat and gently sloping areas are represented by lower LS values, and the erosion risk in these regions is also lower (Table 4). Field observations support this finding, indicating a markedly higher erosion susceptibility in steep areas.
A map of C factor values was also generated based on land cover maps produced using Sentinel-2 imagery. C factor values range from 0 to 1, with values closer to 0 representing well-protected areas (Figure 4).
After evaluating all parameters, the annual potential soil loss (A) in the study area was calculated using the RUSLE (Revised Universal Soil Loss Equation) model. In this calculation process, the model’s five primary components (R, K, LS, C, P) were analyzed in raster format. Based on the obtained data, a soil erosion susceptibility map reflecting the spatial distribution was produced using the Raster Calculator tool in ArcGIS Pro. To classify the erosion susceptibility levels of land units, threshold values proposed by Bergsma et al. (1996) [44] were used (0–5 very low, 5–12 low, 12–35 moderate, 35–60 high, 60–150 severe, and >150 very severe). This classification was deemed appropriate considering both the ecological and topographic characteristics of the study area and the findings of previous studies conducted in regions with similar environmental conditions.
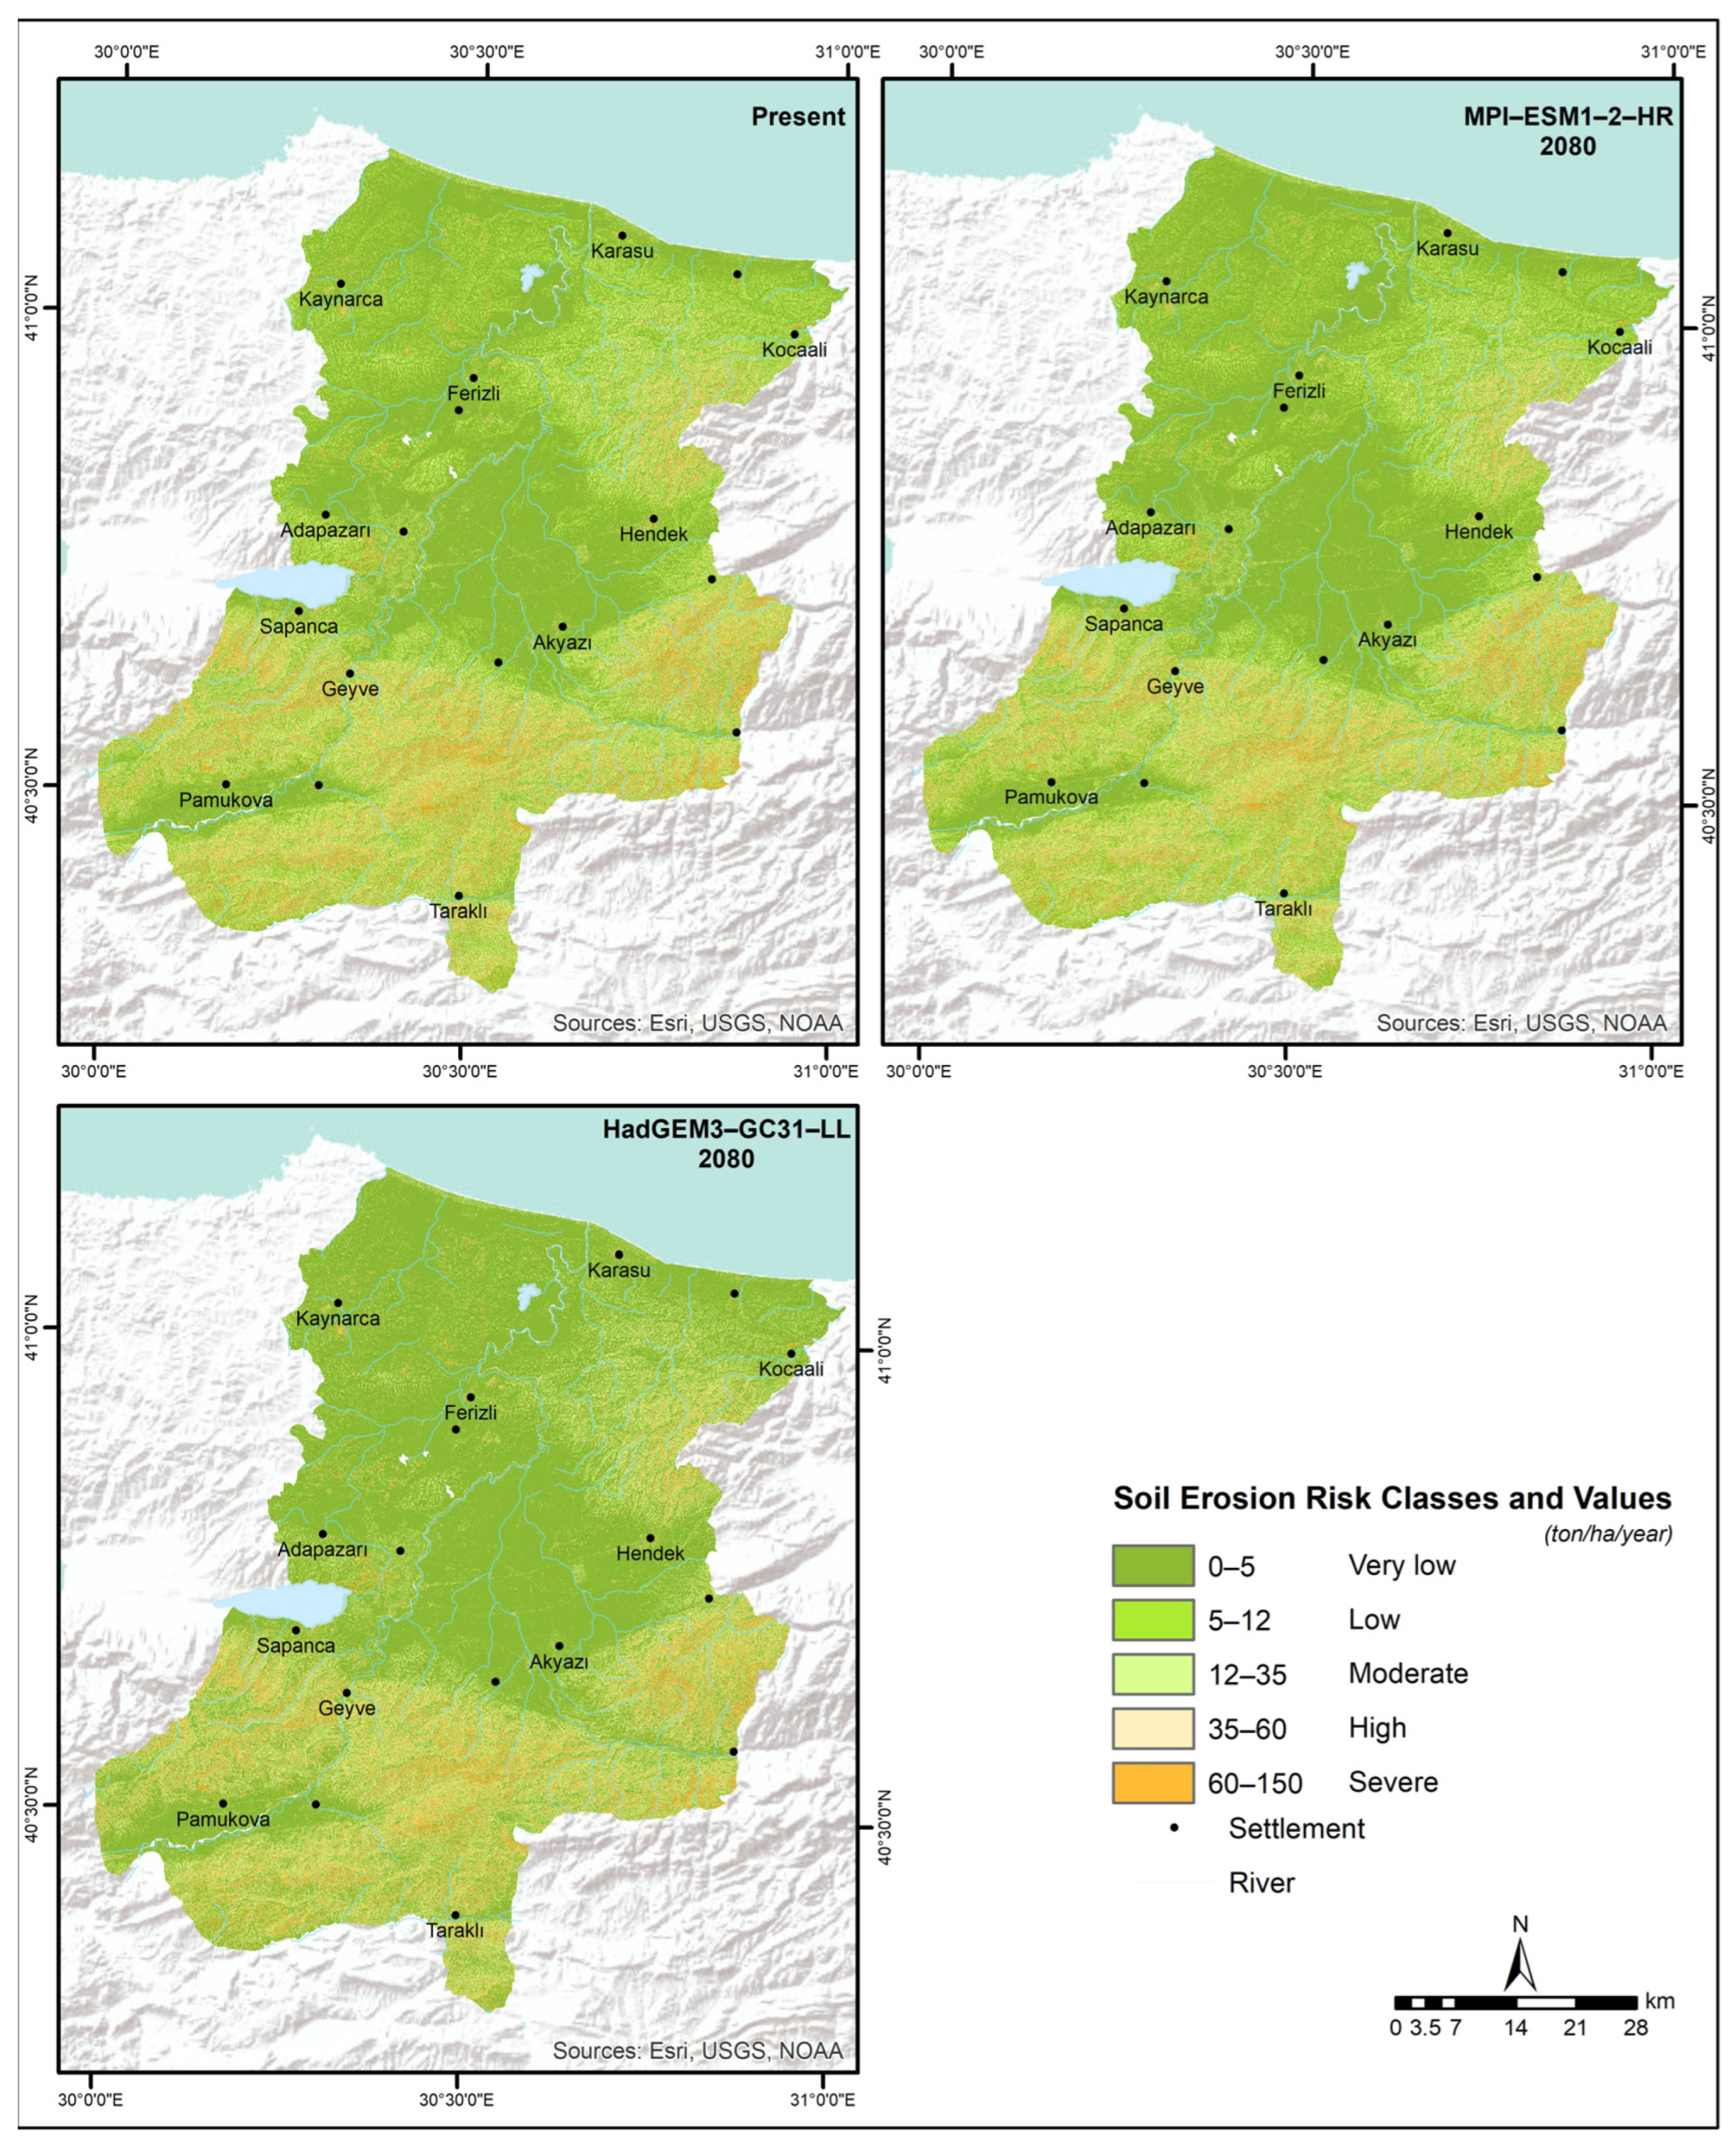
The current annual average soil loss in the study area is 2.9 t/ha/year. According to the present scenario, 58.9% of the study area falls into the very low erosion susceptibility class, 9.9% into the very severe class, 15.2% into the moderate class, 6.3% into the severe class, and 9.9% into the low class (Table 5, Figure 5). Areas most susceptible to severe erosion are generally concentrated on steep mountain slopes, bare surfaces, and sloped agricultural lands. These areas include Elmacık Mountain, Oflak and Çam Mountains in the northern part of the study area, and the extensions of the Samanlı Mountains to the south. On the other hand, areas where agricultural conservation practices are implemented, as well as urban regions, generally fall into the low or very low erosion susceptibility classes, representing zones with maintained soil stability. Field observations conducted in August 2025 west of the Geyve Strait, one of the areas with the most severe erosion in Sakarya, also confirmed that the observed erosion conditions correspond with the results obtained from this study (Figure 6 and Figure 7). The findings obtained from this study were also compared with those of previous studies conducted on erosion in this area [7,70] and similar results were obtained.
Under the SSP5-8.5 climate scenario for 2080, the MPI-ESM1-2-HR model projects an annual average soil loss of 2.5 t/ha/year, while the HadGEM3-GC31-LL model projects 2.6 t/ha/year. According to the MPI-ESM1-2-HR model, 60.8% of the study area will fall into the very low, 8.4% into the severe, 14.8% into the moderate, 5.7% into the high, and 10.3% into the low erosion susceptibility classes. Similarly, the HadGEM3-GC31-LL model predicts a distribution of 59.8% very low, 8.9% severe, 15.1% moderate, 5.9% high, and 10.3% low susceptibility classes.

4. Discussion

The spatial distribution of erosion is shaped by the combined effects of factors such as topographic slope and length (LS), soil properties (K), cover management factor (C), and rainfall erosivity factor (R) [77,78]. Within the scope of this study, changes in the R factor under current and future climate conditions were determined according to the SSP5-8.5 climate scenario, reflecting rainfall variability. The analysis of climate models indicates that the observed change in precipitation is approximately 10%, which is lower than the changes projected for Türkiye as a whole. This has been reflected in the rainfall erosivity factor and the RUSLE model outcomes. Other parameters in the RUSLE model also affect erosion risk, among which rainfall variability—being the most dynamic factor—was specifically modeled in this study. According to the results, under current conditions, the erosion risk in the Sakarya is below the national average [7], and in the future scenario, the erosion risk is projected to remain very low.
Other significant components increasing erosion risk have been identified as the LS factor and the C factor (degradation of land cover). In particular, in areas with steep and long slopes, the weakening of vegetation leads to an increase in both the volume and velocity of surface runoff, which accelerates soil loss [78]. Approximately 40% of the study area falls into the high LS class, causing potential soil losses to be concentrated especially in mountainous areas. The obtained spatial distribution confirms the strong correlation between LS and the erosion risk maps.
From the perspective of the C factor, the reduction in vegetation emerges as another decisive element in erosion risk. Fires, overgrazing, agricultural activities, and droughts associated with climate change reduce vegetation density, leaving the soil surface unprotected against raindrop impact [23,79]. The study area, located within the Mediterranean climate zone, is highly sensitive to vegetation loss due to increasing temperatures, irregular rainfall patterns, and prolonged dry periods [80,81,82,83,84]. Other RUSLE applications in Türkiye [30] similarly indicate that erosion intensifies in areas where LS and C factors are high.
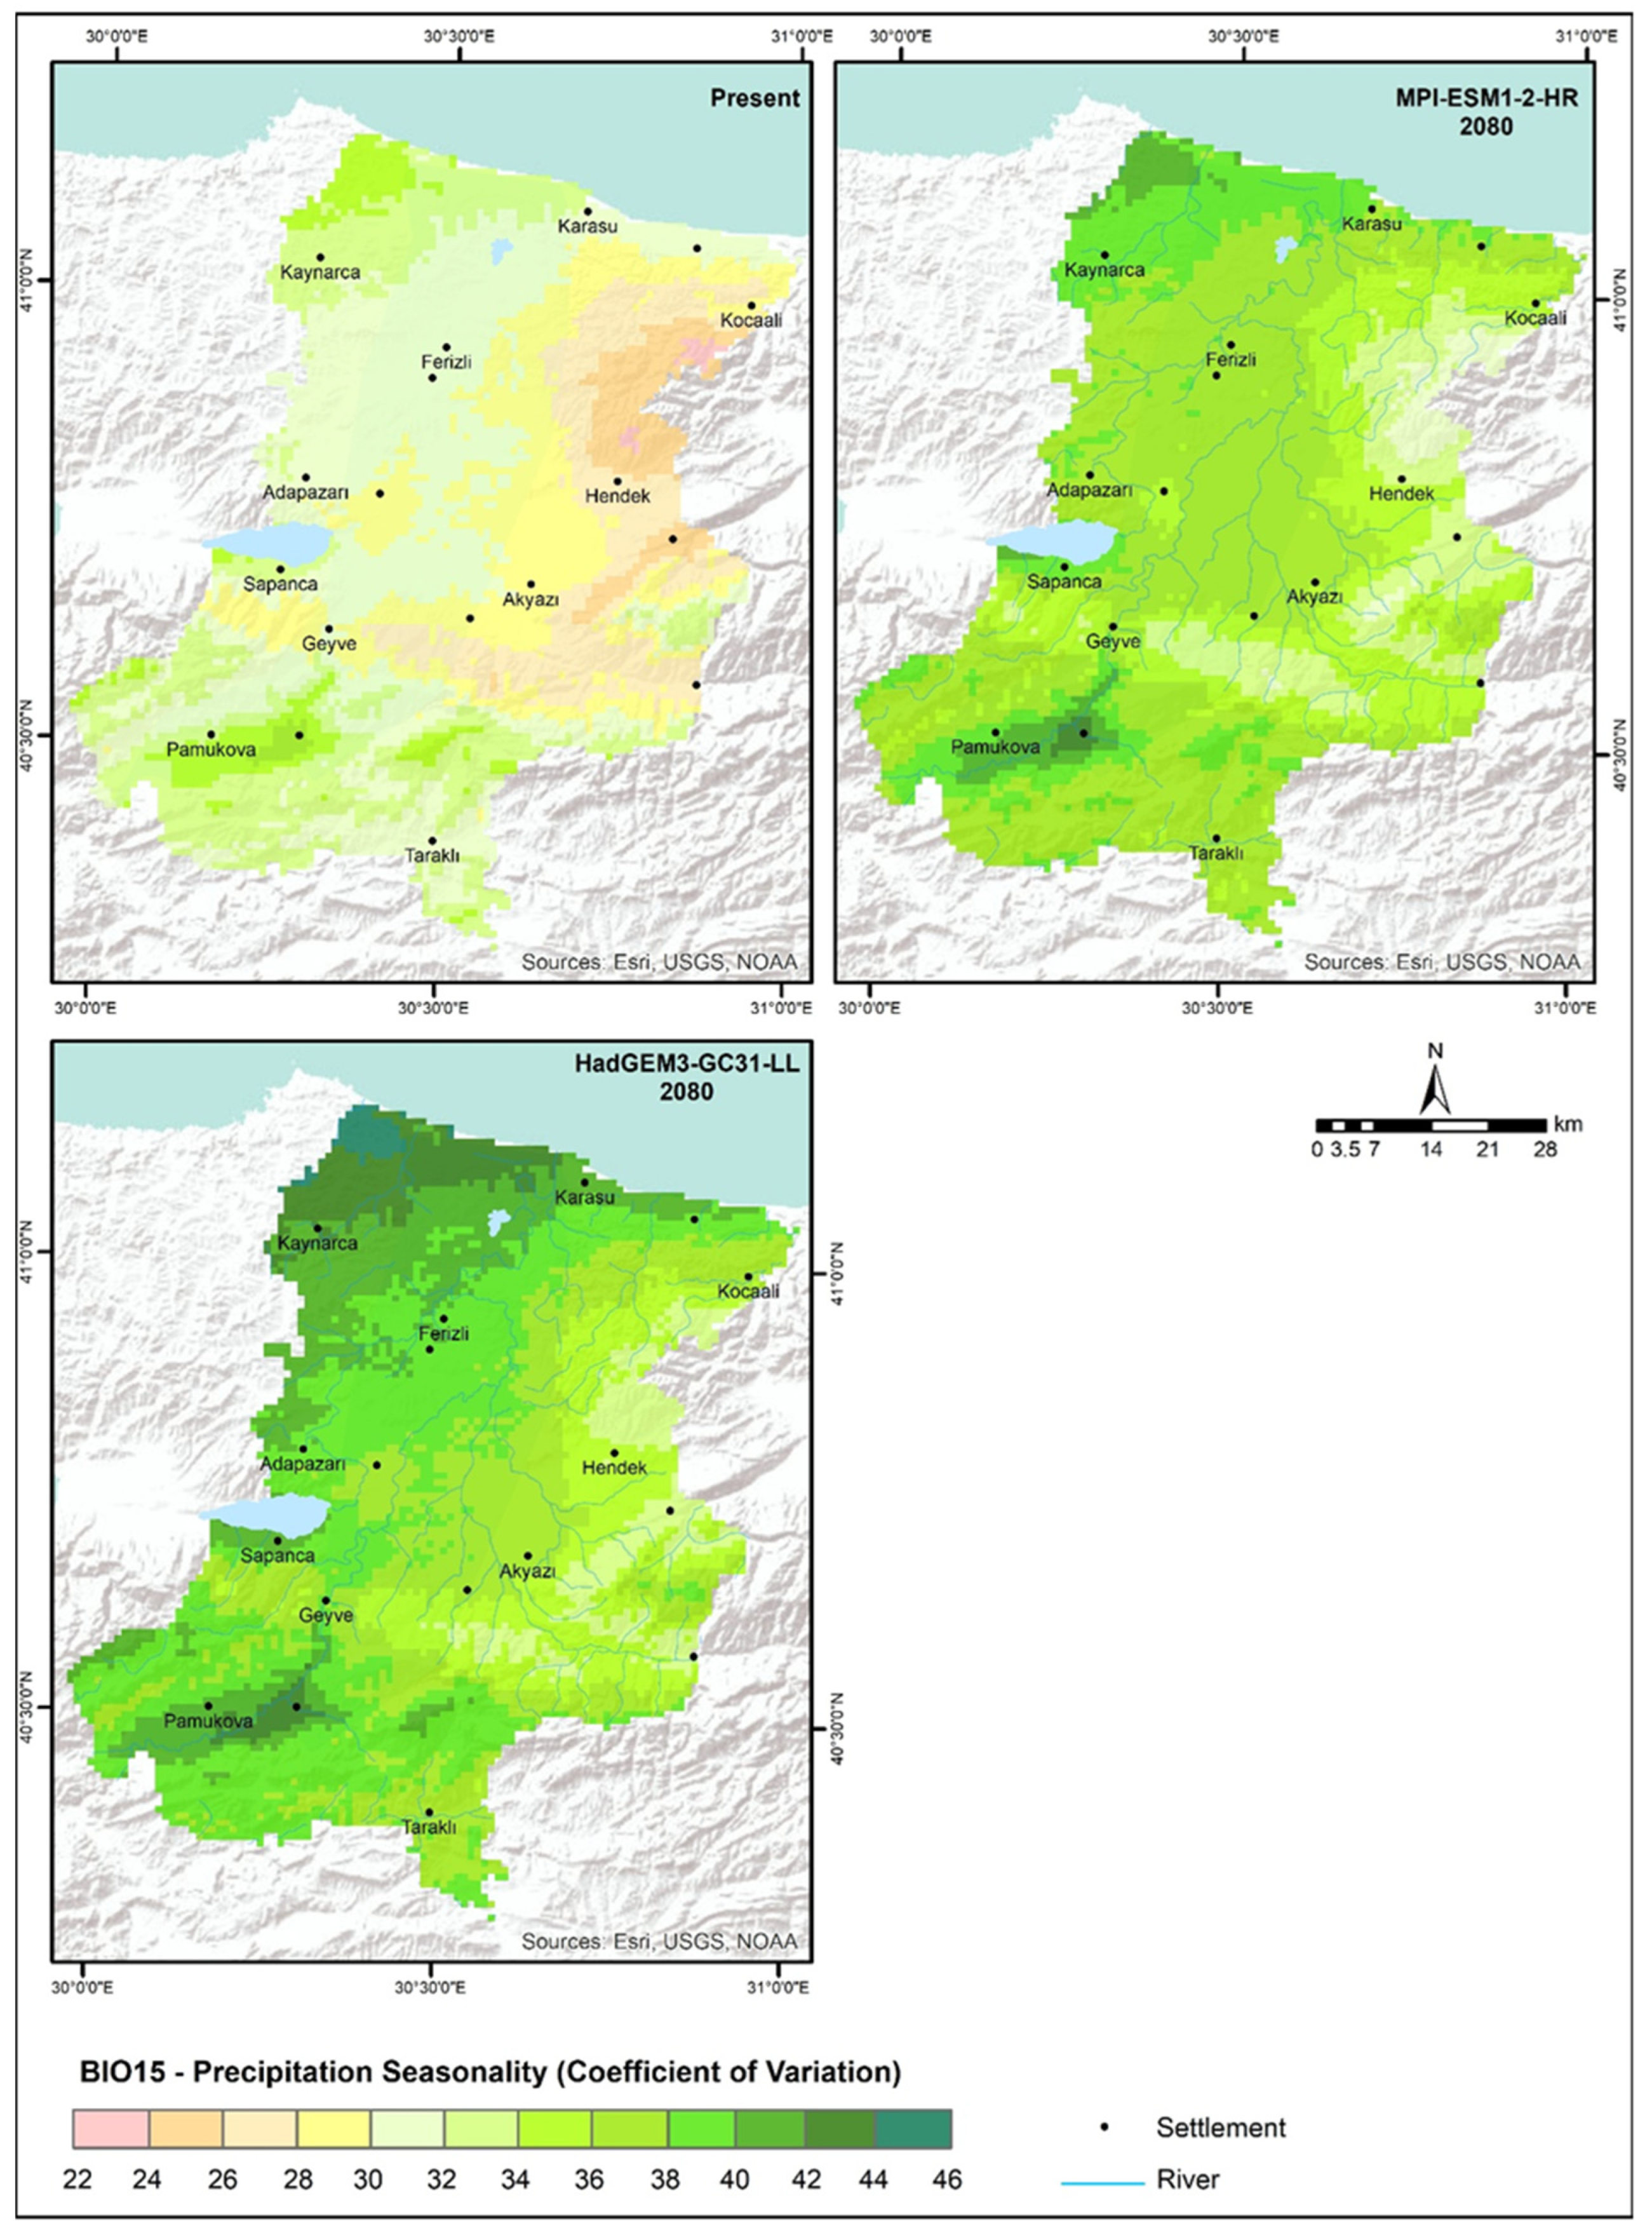
In particular, over the last decade, extreme precipitation events have increased in Türkiye, and changes in rainfall regime zones have been identified. Globally and in Türkiye, expected irregularities in rainfall and the increase in extreme precipitation do not significantly alter the annual total rainfall but do affect rainfall intensity and seasonal distribution [85]. To examine the impacts of these changes within the study area, a precipitation seasonality (BIO15) analysis was conducted. The results indicate that the annual distribution of precipitation varies spatially across the study area. Future projections suggest that, with increased variation in both models, significant changes in seasonal precipitation distribution are likely compared to the present (Figure 8). Climate projections indicate that areas currently at high erosion risk, particularly steep and vegetation-poor zones, will continue to be vulnerable. However, the absence of a significant reduction in forest cover, the minimal short-term change expected in the LS factor, and a projected slight decrease in average rainfall limit the likelihood of a substantial increase in erosion risk across the study area. As highlighted in similar studies [86,87], the preservation of forest cover and the stability of topographic features play a crucial role in mitigating erosion risk.
Understanding future changes in soil erosion is particularly important for watershed-scale land management, water infrastructure, and soil conservation measures. The results obtained from RUSLE, a model that evaluates soil erosion, soil loss, and land management, are directly related to the United Nations Sustainable Development Goals (SDGs), specifically target 15.3 “Combat desertification, restore degraded land and soil, achieve land degradation neutrality” and target 2.4 “Ensure sustainable food production systems and implement resilient agricultural practices.” Consequently, strategies to reduce erosion risk in the study area should focus on the LS and C factors, prioritizing measures such as slope management, afforestation, cover crops, and terracing. This approach is critical for mitigating the impacts of future climate change and minimizing soil loss.

5. Conclusions

In this study, the SSP5-8.5 scenario, as defined in the IPCC’s Sixth Assessment Report (AR6), was applied to assess changes in the rainfall erosivity factor (R) and to develop a future-oriented soil erosion risk model using the RUSLE approach. Results obtained from two different climate models revealed a decreasing trend in summer and annual precipitation, which was directly reflected in the reduction of erosion susceptibility values. However, the increase in temperature and the associated changes in evapotranspiration derived from the models may adversely affect vegetation cover, thereby potentially increasing soil erosion risk indirectly.
The results of the study indicate that areas with very severe erosion risk are concentrated in steep slopes and regions lacking vegetation cover, whereas areas with low and very low erosion susceptibility are generally flat agricultural lands and settlement zones. In these regions, the combination of low slope and low rainfall results in lower RUSLE factor values. Field observations confirm that deforestation significantly amplifies erosion.
At present, the main drivers of erosion include deforestation, overgrazing, industrialization, urbanization, and improper agricultural practices. In addition to these anthropogenic pressures, climate change alters rainfall patterns, further increasing erosion risk. Future erosion maps based on climate projections indicate that the risk will persist, particularly remaining concentrated in steep, bare areas.
In this context, conservation measures such as slope management, afforestation, cover crops, terracing, and water retention structures are critical for reducing risk in areas with high erosion susceptibility. The planning and implementation of sustainable land management strategies are essential for long-term erosion control.
The results indicate that although local variations in the R factor may occur in the future, no significant overall increase is expected across the study area. This suggests that while the spatial distribution of erosion may shift in certain areas, the overall magnitude of erosion is unlikely to rise markedly. Both literature and field data confirm that vegetation degradation, changes in rainfall patterns, and increasing topographic slope are key determinants of erosion risk.
Future research should focus on developing integrated modeling tools that incorporate land cover change, extreme precipitation and other climatic and environmental factors, enabling a more comprehensive assessment of future erosion dynamics.
These findings not only help identify current risk zones and critical areas for conservation measures but also provide valuable insights for anticipating future potential erosion scenarios, thereby supporting the development of sustainable land management policies at the watershed scale.
In the context of climate change adaptation and sustainable development goals, there is a clear need to develop regional, targeted, and science-based strategies to protect areas under high erosion risk. This also necessitates the integration of soil conservation policies with agricultural, forestry, and water management practices, including the following:
  • Preparing regional-scale risk maps to prioritize the protection of the most vulnerable areas;
  • Promoting soil and water conservation practices (terracing, afforestation, cover crops, minimum tillage);
  • Developing collaborative plans among local authorities, farmers, and scientists;
  • Designing strategies that consider the socio-economic dimension (farmers’ livelihoods, rural development);
  • Monitoring and reporting targets in alignment with SDG 2 (Zero Hunger) and SDG 15 (Life on Land), which is of critical importance.
Thus, both land degradation neutrality and the enhancement of climate change adaptation capacity can be achieved.

Author Contributions

Conceptualization, B.U.; Methodology, D.E.K.; Software, D.E.K.; Investigation, A.A.D.; Resources, A.A.D.; Writing—original draft, B.U.; Writing—review & editing, A.A.D. and D.E.K.; Visualization, D.E.K.; Supervision, B.U.; Project administration, B.U. All authors have read and agreed to the published version of the manuscript.

Funding

This research received no external funding.

Data Availability Statement

The datasets generated during and/or analysed during the current study are available from the authors on reasonable request.

Acknowledgments

We would like to thank the Scientific and Technological Research Council of Türkiye (TUBITAK, ARDEB 1001 Project No: 223O064).

Conflicts of Interest

The authors declare no conflicts of interest.

References

  1. Borrelli, P.; Robinson, D.A.; Panagos, P.; Lugato, E.; Yang, J.E.; Alewell, C.; Wuepper, D.; Montanarella, L.; Ballabio, C. Land use and climate change impacts on global soil erosion by water (2015–2070). Proc. Natl. Acad. Sci. USA 2020, 117, 21994–22001. [Google Scholar] [CrossRef] [PubMed]
  2. Atalay, İ. Vegetation. In The Soils of Turkey; Kapur, S., Akça, E., Günal, H., Eds.; World Soils Book Series; Springer: Cham, Switzerland, 2018. [Google Scholar] [CrossRef]
  3. FAO. Soil Erosion: The Greatest Challenge for Sustainable Soil Management; Food and Agriculture Organization of the United Nations: Rome, Italy, 2019; p. 104. [Google Scholar]
  4. FAO. Global soil status, processes and trends. In Status of The World’s Soil Resources (SWSR); Main Report of the Food and Agriculture Organization of the United Nations; FAO: New York, NY, USA, 2015. [Google Scholar]
  5. Dissanayake, D.; Morimoto, T.; Ranagalage, M. Accessing the Soil Erosion Rate Based on RUSLE Model for Sustainable Land Use Management: A Case Study of the Kotmale Watershed, Sri Lanka. Model. Earth Syst. Environ. 2019, 5, 291–306. [Google Scholar] [CrossRef]
  6. Ustaoğlu, B.; Ikiel, C.; Atalay Dutucu, A.; Koç, D.E. Erosion Susceptibility Analysis in Datça and Bozburun Peninsulas, Turkey. Iran. J. Sci. Technol. Trans. A Sci. 2021, 45, 557–570. [Google Scholar] [CrossRef]
  7. Erpul, G.; Şahin, S.; İnce, K.; Küçümen, A.; Akdağ, M.A.; Demirtaş, İ.; Çetin, E. Türkiye Su Erozyonu Atlası; Çölleşme Ve Erozyonla Mücadele Genel Müdürlüğü Yayınları: Ankara, Turkey, 2018. [Google Scholar]
  8. Cürebal, İ.; Efe, R.; Soykan, A.; Sönmez, S. Üç boyutlu modelleme kullanılarak siltasyon miktarının ölçülmesi: Çaygören Barajı örneği. In Proceedings of the III Jeomorfoloji Sempozyumu Bildiriler Kitabı Içinde, Hatay, Turkey, 4–6 October 2012; pp. 729–738. [Google Scholar]
  9. Pınar, M.Ö.; Şahin, S.; Madenoğlu, S.; Erpul, G. Derinöz Baraj Havzasında Şiddetli Erozyon Alanlarının Belirlenmesi ve Rezervuar Sediment Yükünün Hesaplanması. Su Kaynakları 2020, 5, 24–33. [Google Scholar]
  10. Fıçıcı, M.; Soykan, A. MPSİAC & RUSLE Yöntemleriyle Karşılaştırmalı Erozyon Analizi: Madra Barajı Havzası. Jeomorfol. Araştırmalar Derg. 2022, 8, 28–47. [Google Scholar]
  11. Atalay Dutucu, A.; Mutlu, Y.E. Yuvacık Barajı Havzası’nda Erozyon Risk Analizi. Ege Coğrafya Derg. 2022, 31, 289–303. [Google Scholar] [CrossRef]
  12. Echogdali, F.Z.; Boutaleb, S.; Taia, S.; Ouchchen, M.; Id-Belqas, M.; Kpan, R.B.; Abioui, M.; Aswathi, J.; Sajinkumar, K.S. Assessment of soil erosion risk in a semi-arid climate watershed using SWAT model: Case of Tata basin, South-East of Morocco. Appl. Water Sci. 2022, 12, 137. [Google Scholar] [CrossRef]
  13. Korup, O.; Görüm, T.; Hayakawa, Y. Without power? Landslide inventories in the face of climate change. Earth Surf. Process. Landf. 2012, 37, 92–99. [Google Scholar]
  14. Anderson, K.; Fawcett, D.; Cugulliere, A.; Benford, S.; Jones, D.; Leng, R. Vegetation expansion in the subnival Hindu Kush Himalaya. Glob. Change Biol. 2020, 26, 1608–1625. [Google Scholar]
  15. Atesoglu, A.; Ayyildiz, E.; Karakaya, I.; Bulut, F.S.; Serengil, Y. Land cover and drought risk assessment in Türkiye’s mountain regions using neutrosophic decision support system. Environ. Monit. Assess. 2024, 196, 1046. [Google Scholar] [CrossRef] [PubMed]
  16. Aydin, F.; Erlat, E.; Türkeş, M. Impact of climate variability on the surface of Lake Tuz (Turkey), 1985–2016. Reg. Environ. Chang. 2020, 20, 68. [Google Scholar] [CrossRef]
  17. Hoffmann, M.T.; Rounsevell, M.; Sehgal, J.; Varally, G. Land degradation and desertification. In Climate Change 1995, Impacts, Adaptations and Mitigation of Climate Change: Scientific-Technical Analyses; Watson, R.T., Zinyowera, M.C., Moss, R.H., Eds.; Contributing of WG II to the Second Assessment Report of the Intergovernmental Panel on Climate Change (IPCC); Cambridge University Press: New York, NY, USA, 1996; pp. 171–189. [Google Scholar]
  18. Türkeş, M. Kuraklık, çölleşme ve birleşmiş milletler çölleşme ile savaşım sözleşmesi’nin ayrıntılı bir çözümlemesi. Marmara Üniversitesi Avrupa Araştırmaları Enstitüsü Avrupa Araştırmaları Derg. 2012, 20, 7–55. [Google Scholar]
  19. Teng, H.; Liang, Z.; Chen, S.; Liu, Y.; Rossel, R.A.V.; Chappell, A.; Yu, W.; Shi, Z. Current and future assessments of soil erosion by water on the Tibetan Plateau based on RUSLE and CMIP5 climate models. Sci. Total Environ. 2018, 635, 673–686. [Google Scholar] [CrossRef]
  20. Panagos, P.; Lugato, E.; Ballabio, C.; Biavetti, I.; Montanarella, L.; Borrelli, P. Soil Erosion in Europe: From Policy Developments to Models, Indicators and New Research Challenges. In Global Degradation of Soil and Water Resources: Regional Assessment and Strategies; Springer Nature: Singapore, 2022; pp. 319–333. [Google Scholar]
  21. Patriche, C.V. Applying RUSLE for soil erosion estimation in Romania under current and future climate scenarios. Geoderma Reg. 2023, 34, e00687. [Google Scholar] [CrossRef]
  22. Bammou, Y.; Benzougagh, B.; Bensaid, A.; Igmoullan, B.; Al-Quraishi, A.M.F. Mapping of current and future soil erosion risk in a semi-arid context (haouz plain-Marrakech) based on CMIP6 climate models, the analytical hierarchy process (AHP) and RUSLE. Model. Earth Syst. Environ. 2024, 10, 1501–1514. [Google Scholar] [CrossRef]
  23. Panagos, P.; Ballabio, C.; Himics, M.; Scarpa, S.; Matthews, F.; Bogonos, M.; Borrelli, P. Projections of soil loss by water erosion in Europe by 2050. Environ. Sci. Policy 2021, 124, 380–392. [Google Scholar] [CrossRef]
  24. Panagos, P.; Borrelli, P.; Matthews, F.; Liakos, L.; Bezak, N.; Diodato, N.; Ballabio, C. Global rainfall erosivity projections for 2050 and 2070. J. Hydrol. 2022, 610, 127865. [Google Scholar] [CrossRef]
  25. Pinson, A.O.; AuBuchon, J.S. A new method for calculating C factor when projecting future soil loss using the Revised Universal soil loss equation (RUSLE) in semi-arid environments. Catena 2023, 26, 107067. [Google Scholar] [CrossRef]
  26. Ciampalini, R.; Kendon, E.J.; Constantine, J.A.; Schindewolf, M.; Hall, I.R. Soil erosion in a British watershed under climate change as predicted using convection-permitting regional climate projections. Geosciences 2023, 13, 261. [Google Scholar] [CrossRef]
  27. Samarinas, N.; Tsakiridis, N.L.; Kalopesa, E.; Zalidis, G.C. Soil loss estimation by water erosion in agricultural areas introducing artificial intelligence geospatial layers into the RUSLE model. Land 2024, 13, 174. [Google Scholar] [CrossRef]
  28. Sifi, S.; Aydi, A.; Bouamrane, A.; Zaghdoudi, S.; Gasmi, M. Appraisal of soil erosion risk in northeastern Tunisia using geospatial data and integrated approach of RUSLE model and GIS. J. Earth Syst. Sci. 2024, 133, 67. [Google Scholar] [CrossRef]
  29. Terranova, O.; Antronico, L.; Coscarelli, R.; Iaquinta, P. Soil erosion risk scenarios in the Mediterranean environment using RUSLE and GIS: An application model for Calabria (southern Italy). Geomorphology 2009, 112, 228–245. [Google Scholar] [CrossRef]
  30. Gezici, K.; Şengül, S.; Kesgin, E. Assessment of soil erosion risk in the mountainous region of northeastern Türkiye based on the RUSLE model and CMIP6 climate projections. Environ. Earth Sci. 2025, 84, 167. [Google Scholar] [CrossRef]
  31. Demir, S.; Dursun, İ. Assessment of pre-and post-fire erosion using the RUSLE equation in a watershed affected by the forest fire on Google Earth Engine: The study of Manavgat River Basin. Nat. Hazards 2024, 120, 2499–2527. [Google Scholar] [CrossRef]
  32. Gezer, D.; İkiel, C.; Atalay Dutucu, A.; Öğütlü, A.; Aydın, A.; Tunalı Çokluk, S.; Ustaoğlu, B. İklim Değişikliğine Uyum Sürecinde Sıcak Hava Dalgalarının Zamansal ve Mekansal Analizi Sakarya İli Örneği. Presented at the TMMOB 8. Coğrafi Bilgi Sistemleri Kongresi (Uzamsal Zekâ ile Kolektif Bilinç), Ankara, Türkiye, 20–22 November 2024. [Google Scholar]
  33. Ustaoğlu, B. Sakarya’nın iklim özellikleri. In Sakarya’nın Fiziki, Beseri ve Iktisadi Cografya Özellikleri; Sakarya Universitesi Yayını: Sakarya, Turkey, 2018; pp. 163–218. [Google Scholar]
  34. Ikiel, C.; Dutucu, A.A.; Ustaoglu, B.; Kilic, D.E. Land use and land cover (LULC) classification using Spot-5 image in the Adapazari Plain and its surroundings, Turkey. Tojsat 2012, 2, 37–42. [Google Scholar]
  35. Döker, M.F.; Kaçmaz, M.; İkiel, C. Sakarya’da Nüfusun Gelişimi ve Dağılışı; Yeni Anadolu Yayıncılık: Çankaya, Turkey, 2018. [Google Scholar]
  36. Ayva, C.; Dutucu, A.A.; Ustaoğlu, B. İklim Değişikliğinin Su Kaynaklarina Etkisi Ve Uyum Önerileri: Kirazdere Havzasi Örneği. Firat Univ. J. Soc. Sci. 2022, 33, 47–64. [Google Scholar]
  37. Yilmaz, O.Y.; Akkemik, Ü.; Dogan, Ö.H.; Yilmaz, H.; Sevgi, O.; Sevgi, E. The missing part of the past, current, and future distribution model of Quercus ilex L.: The eastern edge. Iforest-Biogeosciences For. 2024, 17, 90. [Google Scholar] [CrossRef]
  38. Arslan, E.S.; Örücü, Ö.K.; Gülcü, S.; Dirlik, S.; Hoşgör, E. Prediction of the shift of the distribution of Pinus brutia Ten. Under future climate model. New For. 2025, 56, 25. [Google Scholar] [CrossRef]
  39. Sentinelhub by Planet Labs. Available online: https://www.sentinel-hub.com (accessed on 20 April 2025).
  40. Tağil, Ş. Tuzla Çayı Havzasında (Biga Yarımadası) CBS-Tabanlı RUSLE Modeli Kullanarak Arazi Degradasyonu Risk Değerlendirmesi. Ekoloji Derg. 2007, 16, 11–20. [Google Scholar]
  41. Wischmeier, W.H.; Smith, D.D. Predicting Rainfall Erosion Losses: A Guide to Conservation Planning; Department of Agriculture, Science and Education Administration: Washington, DC, USA, 1978. [Google Scholar]
  42. Hagras, A. Estimating water erosion in the EL-Mador Valley Basin, South-West Matrouh City, Egypt, using revised universal soil loss equation (RUSLE) model through GIS. Environ. Earth Sci. 2023, 82, 47. [Google Scholar] [CrossRef]
  43. Renard, K.G.; Foster, G.R.; Weesies, G.A.; McCool, D.K.; Yoder, D.C. Predicting soil erosion by water: A guide to conservation planning with the Revised Universal Soil Loss Equation (RUSLE). In USDA Agriculture Handbook; National Agricultural Statistics Services: Washington, DC, USA, 1997; p. 703. [Google Scholar]
  44. Bergsma, E.; Charman, P.; Gibbons, F.; Hurni, H.; Moldenhauer, W.C.; Panichapong, S. Terminology for Soil Erosion and Conservation; International Society of Soil Science: Wageningen, The Netherlands, 1996. [Google Scholar]
  45. Woldegebrael, S.M.; Romano, N.; Pumo, D.; Deidda, R.; Ippolito, M.; Cannarozzo, M.; Langousis, A.; Serafeim, A.V.; Manfreda, S.; Nasta, P. Empirical approaches to estimate rainfall erosivity from coarse temporal resolution precipitation data in the Mediterranean region. Sci. Total Environ. 2025, 996, 180122. [Google Scholar] [CrossRef] [PubMed]
  46. Yıldırım, C.; Schildgen, T.F.; Echtler, H.; Melnick, D.; Strecker, M.R. Late Neogene and active orogenic uplift in the Central Pontides associated with the North Anatolian Fault: Implications for the northern margin of the Central Anatolian Plateau, Turkey. Tectonics 2011, 30. [Google Scholar] [CrossRef]
  47. Arnoldous, H.M.J. An Approximation of the Rainfall Factor in the USLE. In Assessment of Erosion; De Boodt, M., Gabriels, D., Eds.; Wiley: Chichester, UK, 1980; pp. 127–132. [Google Scholar]
  48. WorldClim. Available online: https://www.worldclim.org/data/index.html (accessed on 20 April 2025).
  49. Fick, S.E.; Hijmans, R.J. WorldClim 2: New 1km spatial resolution climate surfaces for global land areas. Int. J. Climatol. 2017, 37, 4302–4315. [Google Scholar] [CrossRef]
  50. Durak, M.; Cürebal, İ. Rusle (3d) modeli kullanılarak toprak erozyonu tahmini; Atikhisar Barajı Havzası örneği (Çanakkale). Memba Su Bilim. Derg. 2025, 11, 138–152. [Google Scholar] [CrossRef]
  51. Behera, M.; Sena, D.R.; Mandal, U.; Kashyap, P.S.; Dash, S.S. Integrated GIS-based RUSLE approach for quantification of potential soil erosion under future change scenarios. Envion. Monit. Assess. 2020, 192, 733. [Google Scholar] [CrossRef]
  52. Gelagay, H.S.; Minale, A.S. Soil loss estimation using GIS and Remote sensing techniques: A case of Koga watershed, Northwestern Ethiopia. Int. Soil Water Conserv. Res. 2016, 4, 126–136. [Google Scholar] [CrossRef]
  53. Özden, Ş.; Özden, M. Türkiye Toprak Erozyon Tahmin Modeli. In TURTEM, Başbakanlık Türkiye Köy Hizmetleri Genel Müdürlüğü; Toprak ve Gübre Araştırma Enstitüsü Müdürlüğü Yayınları: Ankara, Turkey, 1997. [Google Scholar]
  54. Ghosal, K.; Das Bhattacharya, S. A review of RUSLE model. J. Indian Soc. Remote Sens. 2020, 48, 689–707. [Google Scholar] [CrossRef]
  55. Ganasri, B.P.; Ramesh, H. Assessment of soil erosion by RUSLE model using remote sensing and GIS-A case study of Nethravathi basin. Geosci. Front. 2016, 7, 953–961. [Google Scholar] [CrossRef]
  56. Farhan, Y.; Nawaiseh, S. Spatial assessment of soil erosion risk using RUSLE and GIS techniques. Environ. Earth Sci. 2015, 74, 4649–4669. [Google Scholar] [CrossRef]
  57. Mitasova, H.; Hofieka, J.; Zlocha, M.; Iverson, L.R. Modeling Topographic Potential for Erosion and Deposition Using GIS. Int. J. Geogr. Inf. Syst. 1996, 10, 629–641. [Google Scholar] [CrossRef]
  58. Desmet, P.J.J.; Govers, G. Topographically Complex Landscape Units. J. Soil Water Conserv. 1996, 51, 427–433. [Google Scholar] [CrossRef]
  59. Ruthes, J.M.; Tomazoni, J.C.; Guimarães, E.; Gomes, T.C. Use of geographic information system in determining the topographic factor of the Catorze river basin Southwest, P.R. Braz. J. Phys. Geogr. 2012, 5, 1099–1109. [Google Scholar] [CrossRef]
  60. Panagos, P.; Borrelli, P.; Meusburger, C.; Alewell, C.; Lugato, E.; Montanarella, L. Estimating the soil erosion cover management factor at European scale. Land Use Policy 2015, 48, 38–50. [Google Scholar] [CrossRef]
  61. Morgan, R.P.C. Soil Erosion and Conservation, 3rd ed.; Blackwell Publishing: Oxford, UK, 2005. [Google Scholar]
  62. Erkal, T. Çobanlar Havzası′nda (Afyonkarahisar) Toprak Erozyonunun Değerlendirilmesi. J. Acad. Soc. Sci. Stud. 2012, 5, 543–562. [Google Scholar] [CrossRef]
  63. Shiferaw, B.; Holden, S.T.; Quimo, S. Conservation practices and their impact on land productivity in Sub-Saharn Africa. Soil Tillage Res. 2020, 198, 104551. [Google Scholar] [CrossRef]
  64. Biswas, S.S.; Pani, P. Estimation of soil erosion using RUSLE and GIS techniques: A case study of Barakar River basin, Jharkhand, India. Model. Earth Syst. Environ. 2015, 1, 42. [Google Scholar] [CrossRef]
  65. Hurni, H.; Herweg, K.; Portner, B.; Liniger, H. Soil and water conservation in a changing world: Lessons learned from the WOCAT SLM database. Land Degrad. Dev. 2015, 26, 604–612. [Google Scholar] [CrossRef]
  66. Bork, H.R.; Hensel, S. Soil erosion and conservation in Europe: Past and present research trends. Catena 2020, 194, 104739. [Google Scholar] [CrossRef]
  67. Ustaoğlu, B. Matlab’da İklim Veri Analiz ve Uygulamaları; Anka Matbaa: İstanbul, Turkey, 2012. [Google Scholar]
  68. MGM. Available online: https://www.mgm.gov.tr/iklim/iklimdegisikligi.aspx?s=projeksiyonlar (accessed on 25 April 2025).
  69. Bağçaci, S.Ç.; Yucel, I.; Duzenli, E.; Yilmaz, M.T. Intercomparison of the expected change in the temperature and the precipitation retrieved from CMIP6 and CMIP5 climate projections: A Mediterranean hot spot case, Turkey. Atmos. Res. 2021, 256, 105576. [Google Scholar] [CrossRef]
  70. Ustaoğlu, B.; Koç, D.E. Sakarya′nın toprak özellikleri. In Sakarya’nın Fiziki, Beseri ve İktisadi Cografya Özellikleri; Sakarya Universitesi: Yayını, Sakarya, Turkey, 2018; pp. 263–286. [Google Scholar]
  71. T.C. Başbakanlık Köy Hizmetleri Genel Müdürlüğü. Sakarya İli Arazi Varlığı; Bakanlık Yayınları: Ankara, Turkey, 1995. [Google Scholar]
  72. T.C. Köy İşleri Bakanlığı Topraksu Genel Müdürlüğü. Sakarya İli Toprak Envanter Raporu; Bakanlık Yayınları: Ankara, Turkey, 1972. [Google Scholar]
  73. T.C. Gıda Tarım ve Hayvancılık Bakanlığı. Sakarya’nın Sayısal Toprak Verileri; Bakanlık Yayınları: Ankara, Turkey, 2004. [Google Scholar]
  74. Cebel, H.; Akgül, S.; Doğan, O.; Elbaşı, F. Türkiye büyük toprak gruplarının erozyona duyarlılık “K” faktörleri. Toprak Su Derg. 2013, 2, 30–45. [Google Scholar]
  75. Doğan, O.; Cebel, H.; Akgül, S.; Küçükçakar, N. Türkiye Büyük Toprak Grupları (K) Faktörleri, Köy Hizmetleri APK Dairesi Başkanlığı Toprak ve Su Kaynakları Araştırma Şube Müdürlüğü Yayın No:111, Rehber No: 17, Ankara. Toprak Su Derg. 2000, 2, 30–45. [Google Scholar]
  76. Turoglu, H.; Aykut, T. Ergene Nehri Havzası için hidromorfometrik analizlerle taşkın duyarlılık değerlendirmesi. Jeomorfol. Araştırmalar Dergis 2019, 2, 1–15. Available online: https://dergipark.org.tr/tr/download/article-file/685038 (accessed on 1 May 2025).
  77. Stefanidis, S.; Alexandridis, V.; Chatzichristaki, C.; Stefanidis, P. Assessing soil loss by water erosion in a typical Mediterranean ecosystem of northern Greece under current and future rainfall erosivity. Water 2021, 13, 2002. [Google Scholar] [CrossRef]
  78. Panagos, P.; Borrelli, P.; Meusburger, K. A new European slope length and steepness factor (LS-Factor) for modeling soil erosion by water. Geosciences 2015, 5, 117–126. [Google Scholar] [CrossRef]
  79. Fernández, G.; Merchán, L.; Sánchez, J.Á. Spatial Representation of Soil Erosion and Vegetation Affected by a Forest Fire in the Sierra de Francia (Spain) Using RUSLE and NDVI. Land 2025, 14, 793. [Google Scholar] [CrossRef]
  80. IPCC. Climate Change 2021: The Physical Science Basis. In Contribution of Working Group I to the Sixth Assessment Report of the Intergovernmental Panel on Climate Change; Cambridge University Press: Cambridge, UK, 2021. [Google Scholar] [CrossRef]
  81. Morán-Ordóñez, A.; Duane, A.; Gil-Tena, A.; De Cáceres, M.; Aquilué, N.; Guerra, C.A.; Geijzendorffer, I.R.; Fortin, M.J.; Brotons, L. Future impact of climate extremes in the Mediterranean: Soil erosion projections when fire and extreme rainfall meet. Land Degrad. Dev. 2020, 31, 3040–3054. [Google Scholar] [CrossRef]
  82. Xiong, M.; Leng, G. Global soil water erosion responses to climate and land use changes. Catena 2024, 241, 108043. [Google Scholar] [CrossRef]
  83. Ustaoğlu, B.; Tunçat, K.A.; Koç, D.E. Impacts of climate change on precipitation and temperature climatology in türkiye from present to future perspective. In Urban Commons, Future Smart Cities and Sustainability; Springer International Publishing: Cham, Switzerland, 2023; pp. 403–426. [Google Scholar]
  84. Koç, D.E.; Dutucu, A.A.; Ustaoğlu, B. İklim Değişikliğine Uyum Kapsamında Sürdürülebilir Su Kaynakları Yönetimi İçin Sapanca Gölü Havzası′nda Kuraklık Risk Analizi. In Kuramdan Uygulamaya Ekonomi ve Sosyal Bilimlerde Akademik Araştırmalar-I; Hiper Yayın: Singapore, 2022; pp. 125–141. [Google Scholar]
  85. Ustaoğlu, B.; Mutar, Ş. İklim Değişikliği Kapsamında Sürdürülebilir Su Yönetimi Açısından Türkiye’deki Ekstrem Yağışların Analizi. Yeni Türkiye Derg. 2025, 31, 235–247. [Google Scholar]
  86. Günlü, A.; Sivrikaya, F.; Ünal, H.E. Prediction of Land Use and Land Cover Changes from 2018 to 2042 Using CA-Markov: A Case Study from Türkiye. Kastamonu Univ. J. For. Fac. 2025, 25, 34–52. [Google Scholar] [CrossRef]
  87. Kalayci Kadak, M.; Ozturk, S.; Mert, A. Predicting climate-based changes of landscape structure for Turkiye via global climate change scenarios: A case study in Bartin river basin with time series analysis for 2050. Nat. Hazards 2024, 120, 13289–13307. [Google Scholar] [CrossRef]
Figure 1. Location map of the study area.
Land 14 02153 g001
Figure 2. Monthly average precipitation changes in the study area according to present and 2080 climate scenarios.
Land 14 02153 g002
Figure 3. Rainfall and runoff erosivity factor in the research area.
Land 14 02153 g003
Figure 4. Great soil groups: (a) soil erodibility factor (K); (b) land use classes; (c) Cover Management; (C) factor; (d) Slope Length and Slope Steepness (LS) Factor; (e) maps in the research area.
Land 14 02153 g004
Figure 5. Distribution of Erosion Risk Classes in the research area.
Land 14 02153 g005
Figure 6. Erosion susceptibility map in the research area.
Land 14 02153 g006
Figure 7. Erosion in Pamukova and its surroundings.
Land 14 02153 g007
Figure 8. Seasonal distribution of precipitation (BIO15) in the study area under current and 2080 climate scenarios (MPI-ESM1-2-HR and HadGEM3-GC31-LL).
Land 14 02153 g008
Table 1. Erosivity factor according to elevation level (m).
Elevation (m)PresentMPI-ESM1-2-HR
2061–2080
HadGEM3-GC31-LL
2061–2080
PresentMPI-ESM1-2-HR
2061–2080
HadGEM3-GC31-LL
2061–2080
MFIR Factor Values
0–10056.952.854.685.568.175.9
100–20061.056.558.2102.583.490.9
200–30069.364.265.9137.1115.7122.7
300–40073.668.269.8154.8132.4139.2
400–50077.872.373.9172.5149.4156.0
500–60082.176.477.9190.4166.6173.0
600–70086.480.682.1208.4184.0190.3
700–80090.884.886.3226.4201.5207.7
800–90095.189.090.5244.6219.2225.3
900–100099.593.394.7262.7237.0243.0
1000–1100103.897.699.0281.0254.9260.7
1200–1300108.2101.9103.3299.3272.8278.6
1300–1400112.6106.2107.6317.6290.9296.6
1400–1500117.0110.5111.9335.9309.0314.6
1500–1600121.4111.8113.2354.3314.4319.9
Table 2. Monthly average precipitation values (mm) for the study area according to current and 2080 climate scenarios.
Month123456789101112Total
Present82.063.864.669.073.059.040.040.444.971.174.698.8781.2
HadGEM3
GC31-LL
80.059.868.348.545.935.434.735.839.268.475.097.6688.6
MPI-ESM1-2-HR77.767.371.257.843.342.233.332.833.069.867.6103.6699.6
Table 3. Soil erodibility factor (K) according to the great soil groups in the research area.
Great Soil GroupsAreaK Factor Values
km2%
Colluvial soil1302.80.18
Brown forest s.87818.80.18
Rendzina s.10.020.12
Alluvial s.96420.60.15
Non-calcic brown forest s.265456.70.17
Hydromorphic alluvial s.320.70.15
Coastal dunes190.40.18
Reeds-Swamps40.10.15
Table 4. LS factor classification and spatial distribution in the research area.
LS Factor ValueLS Factor ClassesArea (%)
0–1.2Very low45.7
1.2–1.7Slightly low1.6
1.7–3.3Low4.9
3.3–5.5Moderate5.7
5.5–7.7Moderate high4.3
7.7–20High17.0
+20Very high20.8
Table 5. Soil erosion susceptibility classes in the research area.
ClassSoil Loss (t/ha/yr)Present (%)MPI-ESM1-2-HR
SSP85 2061–2080 (%)
HadGEM3-GC31-LL
SSP85 2061–2080 (%)
Very low0–558.960.859.8
Low5–129.910.310.3
Moderate12–3515.214.815.1
High35–606.35.75.9
Severe60–1509.88.48.9
Total 100.0100.0100.0
Disclaimer/Publisher’s Note: The statements, opinions and data contained in all publications are solely those of the individual author(s) and contributor(s) and not of MDPI and/or the editor(s). MDPI and/or the editor(s) disclaim responsibility for any injury to people or property resulting from any ideas, methods, instructions or products referred to in the content.