Article

Satellite-Based Innovative Agroclimatic Classification Under Reduced Water Availability: Identification of Optimal Productivity Zones

by
Ioannis Faraslis
1,*,
Nicolas R. Dalezios
2,
Marios Spiliotopoulos
2,
Georgios A. Tziatzios
2,
Stavros Sakellariou
1,
Nicholas Dercas
3,
Konstantina Giannousa
2,
Gilles Belaud
4,
Kevin Daudin
4,
Maria do Rosário Cameira
5,
Paula Paredes
5 and
João Rolim
5
1
Department of Environmental Sciences, University of Thessaly, 41500 Larissa, Greece
2
Department of Civil Engineering, School of Engineering, University of Thessaly, 38221 Volos, Greece
3
Department of Natural Resources Management and Agricultural Engineering, Agricultural University of Athens, Iera Odos 75, 11855 Athens, Greece
4
UMR G-Eau, Montpellier SupAgro, University of Montpellier, 2 Place Pierre Viala, 34060 Montpellier, France
5
LEAF—Linking Landscape, Environment, Agriculture and Food—Research Center, Associated Laboratory TERRA, Instituto Superior de Agronomia, Universidade de Lisboa, Tapada da Ajuda, 1349-017 Lisbon, Portugal
*
Author to whom correspondence should be addressed.
Land 2025, 14(11), 2147; https://doi.org/10.3390/land14112147
Submission received: 5 September 2025 / Revised: 17 October 2025 / Accepted: 21 October 2025 / Published: 28 October 2025

Abstract

Climate and climate variability conditions determine crop suitability and the agricultural potential within a climatic region. Specifically, meteorological parameters, such as precipitation and temperature, are the primary factors determining which crops can successfully grow in a particular climatic region. The objective of agroclimatic classification and zoning is to identify optimal agricultural productivity zones based on efficient use of natural resources. This study aims to develop and present an agroclimatic classification and zoning methodology using Geographic Information Systems (GIS) and advanced remote sensing data and techniques. The agroclimatic methodology is implemented in three steps: First, Water-limited Growth Environment (WLGE) zones are developed to assess water availability based on drought and aridity indices. Second, soil and land use features are evaluated alongside water adequacy to develop the non-crop specific agroclimatic zoning. Third, crop parameters are integrated with the non-crop specific agroclimatic zones to classify areas into specific crop suitability zones. The methodology is implemented in three study regions: Évora-Portalegre in Portugal, Crau in France, and Thessaly in Greece. The study reveals that inadequate rainfall in semi-arid regions constrains the viability of irrigated crops. Nonetheless, the findings show promising potential compared to existing cropping patterns in all regions. Moreover, the use of high-resolution spatial and temporal remotely sensed data via web platforms enables up-to-date and field-level agroclimatic zoning.

1. Introduction

Agriculture highly depends on climate conditions and is adversely affected by anthropogenic climate change. Specifically, agricultural production as an industry and sector of the economy is the most vulnerable sector to weather and climate variability and changes [1,2,3,4,5]. Moreover, agricultural production risks and food security could become an issue in vulnerable agroecosystems, such as the Mediterranean basin. Due to climate change, there is increasing yield fluctuation, and the food supply is at increasing risk. As a result, the farming systems sector in the Mediterranean is currently faced with the challenge of finding the way that leads to a sustainable and resilient future.
The 21st century has been characterized by increased climate variability. Moreover, climate change is almost totally attributed to anthropogenic causes. Agriculture in the Mediterranean basin is considered vulnerable mainly due to three factors, which are the impacts of climate change: first, the mean global temperature is steadily increasing and has already reached approximately +1.5 °C; second, there is reduction in the precipitation amount of at least 20%; third, long-term projections of climate change research indicate that the frequency and intensity of extreme events, such as floods, droughts, or heat waves, are expected to increase during the 21st century in arid and semi-arid zones [6,7,8,9]. It is worth mentioning some additional components of climate change impacts on agriculture [10,11,12]: fluctuations in the quantity and quality of productivity; changes in agricultural practices, such as water use, fertilizers, herbicides, or insecticides; changes in the environmental level, such as soil erosion and drainage, nitrogen leaching, or the reduction in crop diversity; changes in land use in terms of the loss of cultivated lands, land speculation, land renunciation, and hydraulic amenities. Furthermore, farmers in the Mediterranean basin are more vulnerable to climate change than those in Northern Europe. Specifically, the impacts of climate change are worse due to several factors: they may be closer to the margin of tolerance; there might be a lack of economic structure; there is coastal vulnerability; there might be poorer nutrition and health infrastructure. In addition, there is reduced adaptation capacity due to limited technology availability, education and know-how, and financial and institutional capacity. There is, thus, a need to identify suitable zones for sustainable agriculture based on water limitations in vulnerable agroecosystems [13], such as the Mediterranean basin, and to identify those productivity zones based on microclimatic and soil features.
Recently, the FAO (Food and Agriculture Organization) of the United Nations (UN) conducted emblematic research and developed Agro-Ecological Zones (AEZ) to support sustainable agriculture at different scales including modeling at different scales, medium-scale zones, national-scale, and regional-scale zones, leading agricultural systems to be more productive and less vulnerable [14,15,16]. In this framework, several agroclimatic zoning approaches have been developed based on FAO’s AEZ methodology to produce optimal productivity zones (high, medium, low) [14,15]. The AEZ methodology, along with supporting computational tools, can be used for application at global, regional, national, and sub-national levels. Several research studies have applied agroclimatic zones to identify sustainable agricultural productivity zones in different climatic conditions [17,18]. There are many climatic and agroclimatic classifications, which focus on delineating the moisture conditions of crops [19,20,21,22]. The complexity of these studies depends on the number of employed variables, features, or indices, where the prevailing pattern is a combination of climatic and soil features, as well as crop parameters at topo-climate or field scale [23,24,25,26].
Nevertheless, there is an exponential increase in the use of remote sensing data and methods in agroclimatic zoning methodology, mainly due to the recent advancements in the reliability and accuracy of the remote sensing products [27]. Thus, at the present time, remote sensing tools constitute a basic component for the estimation and mapping of environmental variables and features [28,29]. Specifically, new Earth Observation (EO) systems offer better resolution in space and time of remote sensing data for vegetation indices and environmental parameters [23,30,31]. The combination of these indices can be used to define areas suitable for sustainable agriculture under limited water availability, which are called water limited growth environment (WLGE) zones [25,32,33,34,35]. Moreover, service platforms, such as the Google Earth Engine (GEE), provide a robust framework for data analysis by supporting a wide array of remote sensing datasets and advanced algorithms [31,36,37,38]. The GEE platform encompasses an extensive repository of satellite imagery—including Landat, Sentinel, and MODIS—alongside climate datasets, such as precipitation, temperature, and humidity, as well as digital elevation models.
The objective of this paper is to identify high-resolution suitable zones for sustainable agriculture under limited water availability using GIS and remote sensing data and techniques and to identify those productivity zones (high, medium, low) based on microclimatic, geomorphological, vegetation, and soil features, in semi-arid to sub-humid environments. To achieve this objective, the agroclimatic classification methodology follows three distinct stages, namely the hydroclimatic classification (stage 1), the non-crop specific agroclimatic zoning (stage 2), and the crop-specific agroclimatic zoning (stage 3), leading to sustainable productivity zones. The paper capitalizes on the new Earth Observation (EO) datasets and methodological approaches provided by the GEE platform. The adopted methodology is applied in three study areas in the Mediterranean basin, namely the Thessaly region in Greece, the Crau area in southern France, and regions of Évora-Portalegre in southern Portugal. The paper is organized as follows: Section 2 describes the methodological framework of agroclimatic classification and zoning, which includes the three stages to be followed; Section 3 delineates the study areas and the database for each stage; Section 4 describes the application of the methodology to the case studies; and Section 5 and Section 6 provide a presentation of the results followed by a comprehensive discussion.

2. Agroclimatic Zoning Methodology

The current research work focuses on assessing high-resolution earth observation datasets using advanced downscaling technics and applying sophisticated platforms, such as GEE. The methodology uses remote sensing and GIS approaches to process time-series of data related to climate and vegetation. Furthermore, soil, topographic, and specific crop parameters are used to generate maps that delineate sustainable crop-specific productivity zones (high, medium, low).
The proposed methodology consists of three stages (steps): (a) Hydroclimatic zoning. The first step considers water adequacy by analyzing the relationship between vegetation health (vegetation health index-VHI) and climate conditions (aridity index-AI), which collectively determine WLGE zones. (b) Non-crop-specific agroclimatic zoning. The second step evaluates the suitability of natural resources for agricultural use. Soil types, land use—land cover features, altitude, slope and water availability are assessed to create general agricultural suitability zones. (c) Crop-specific agroclimatic zoning. The final step determines optimal agricultural zones for specific crops based on agricultural and agrometeorological parameters, such as growing degree days (GDD), net radiation (Rn), and spring precipitation. As a final product, productivity agroclimatic zoning is produced, combining the suitability of the regions studied for general agricultural production and the indicators obtained for the different crops separately.
The following flow-chart illustrates the three-step proposed methodology (Figure 1).
The implementation of the proposed methodology is conducted across three study areas, which exhibit diverse climatic conditions, topographic features, and agriculture systems. These three study areas are (a) Regions Évora-Portalegre in Portugal, (b) Region of Thessaly in Greece, and (c) Area of Crau in France (see Section 3 for description).
Advanced processing techniques
For processing extensive Earth Observation (EO) datasets, covering over twenty years, the GEE web platform is employed as the primary tool. Large amounts of EO data spanning 20 years (or more) can be efficiently processed through GEE, while requiring minimal coding effort and downloading only the results. Additionally, advanced downscaling techniques are applied to enhance the spatial resolution of the Earth observation data. The Classification and Regression Tree (CART) machine learning algorithm is employed to process the data, creating products at higher resolution. The main goal of the downscaling methodology is to generate a uniform dataset with a relatively high spatial resolution (30 × 30 m pixel size). To ensure product accuracy within this framework, it is necessary to set up the relationships between low-resolution variables (precipitation, evapotranspiration) and high-resolution environmental parameters and land surface characteristics (vegetation indices, digital elevation model). These high-resolution environmental indicators are used to convert EO data into a finer spatial resolution [39,40,41].
The three-step agroclimatic classification methodology is detailed in the subsequent sections.

2.1. Hydroclimatic Zoning

The initial step of the agroclimatic classification process concerns the identification of WLGE zones. These zones are derived by combining two key indices: the Vegetation Health Index (VHI) and the Aridity Index (AI). The first, VHI, reflects the overall vegetation condition by combining moisture and thermal stress factors and is characterized as the agricultural drought index. It is particularly useful for detecting vegetation stress, especially when no specific crop is under evaluation. The second, AI, assesses whether the rainfall is sufficient to meet crop water requirements. By integrating these indices, WLGE zones are established to delineate areas suitable for sustainable crop production based on water availability constraints.

2.1.1. Vegetation Health Index (VHI)

One of the most widely used satellite-based indices for drought monitoring, particularly for assessing agricultural drought based on climate conditions, such as moisture and temperature, is the VHI. Vegetation stress is typically indicated by low Normalized Difference Vegetation Index (NDVI) values and a high Land Surface Temperature (LST). Two indices, the Vegetation Condition Index (VCI) and the Thermal Condition Index (TCI), are used for the calculation of the VHI [42,43].
The VCI is an NDVI-based index. It is derived from long-term satellite data (e.g., MODIS, Landsat), which measures vegetation stress. NDVI is calculated using the formula:
N D V I = N I R R N I R + R ,
where NIR and R represent near infrared and red reflectance, respectively. NDVI values range from −1 to 1, providing quantitative measurements of vegetation health and density. Water bodies register negative values, while barren areas with little to no vegetation, register near zero values. Dense vegetation cover is characterized by higher positive values greater than 0.6.
The VCI is calculated as [44]
V C I i = N D V I i N D V I m i n N D V I m a x N D V I m i n × 100 ,
where NDVImax and NDVImin represent the maximum and the minimum pixel values, respectively, throughout the entire study period, while NDVIi represents the value for each pixel of the ith image from the total series of images (details in Section 3.2 below).
The TCI is derived from thermal infrared (TIR) data and assesses the vegetation stress caused by high temperatures. Temperature variations exert a direct impact on vegetation health, particularly when accompanied by limited moisture availability. The TCI is calculated as [45]
T C I i = L S T m a x L S T i L S T m a x L S T m i n × 100 ,
where LSTₘₐₓ and LSTₘᵢₙ represent the highest and lowest LST values for the pixel during the study period, respectively, while LSTᵢ is the Land Surface Temperature (LST) of each pixel of the ith image from the total series of images (details in Section 3.2 below).
Both VCI and TCI values range from 0 to 100, where lower values indicate severe stress conditions, and higher values indicate healthy vegetation. The VHI is calculated as
V H I = a V C I + ( 1 a ) T C I ,
where “a” is a coefficient determining the contribution of the two indices (VCI and TCI) to the VHI. The “a” coefficient typically is set to 0.5, since the temperature and water availability play an equally significant role in vegetation health [43]. VHI values range from 0 (severe vegetation stress) to 100 (very favorable conditions). The VHI is categorized into five classes as outlined in the corresponding classification table [34] (Table 1).

2.1.2. Aridity Index (AI)

The second index used in creating WLGE zones is the Aridity Index [46]. This climatic index quantifies the relationship between precipitation and potential evapotranspiration in each region. It assesses both drought susceptibility and water availability for crop growth, expressed by the following equation [47]:
A I = P P E T ,
where P represents the mean annual precipitation, and PET denotes the mean annual potential evapotranspiration of the available time-series of data. Based on AI values, regions are categorized into seven distinct classes, ranging from hyper-arid to very humid, based on the FAO framework [46,48,49] (Table 2).

2.1.3. Hydroclimatic WLGE Zones

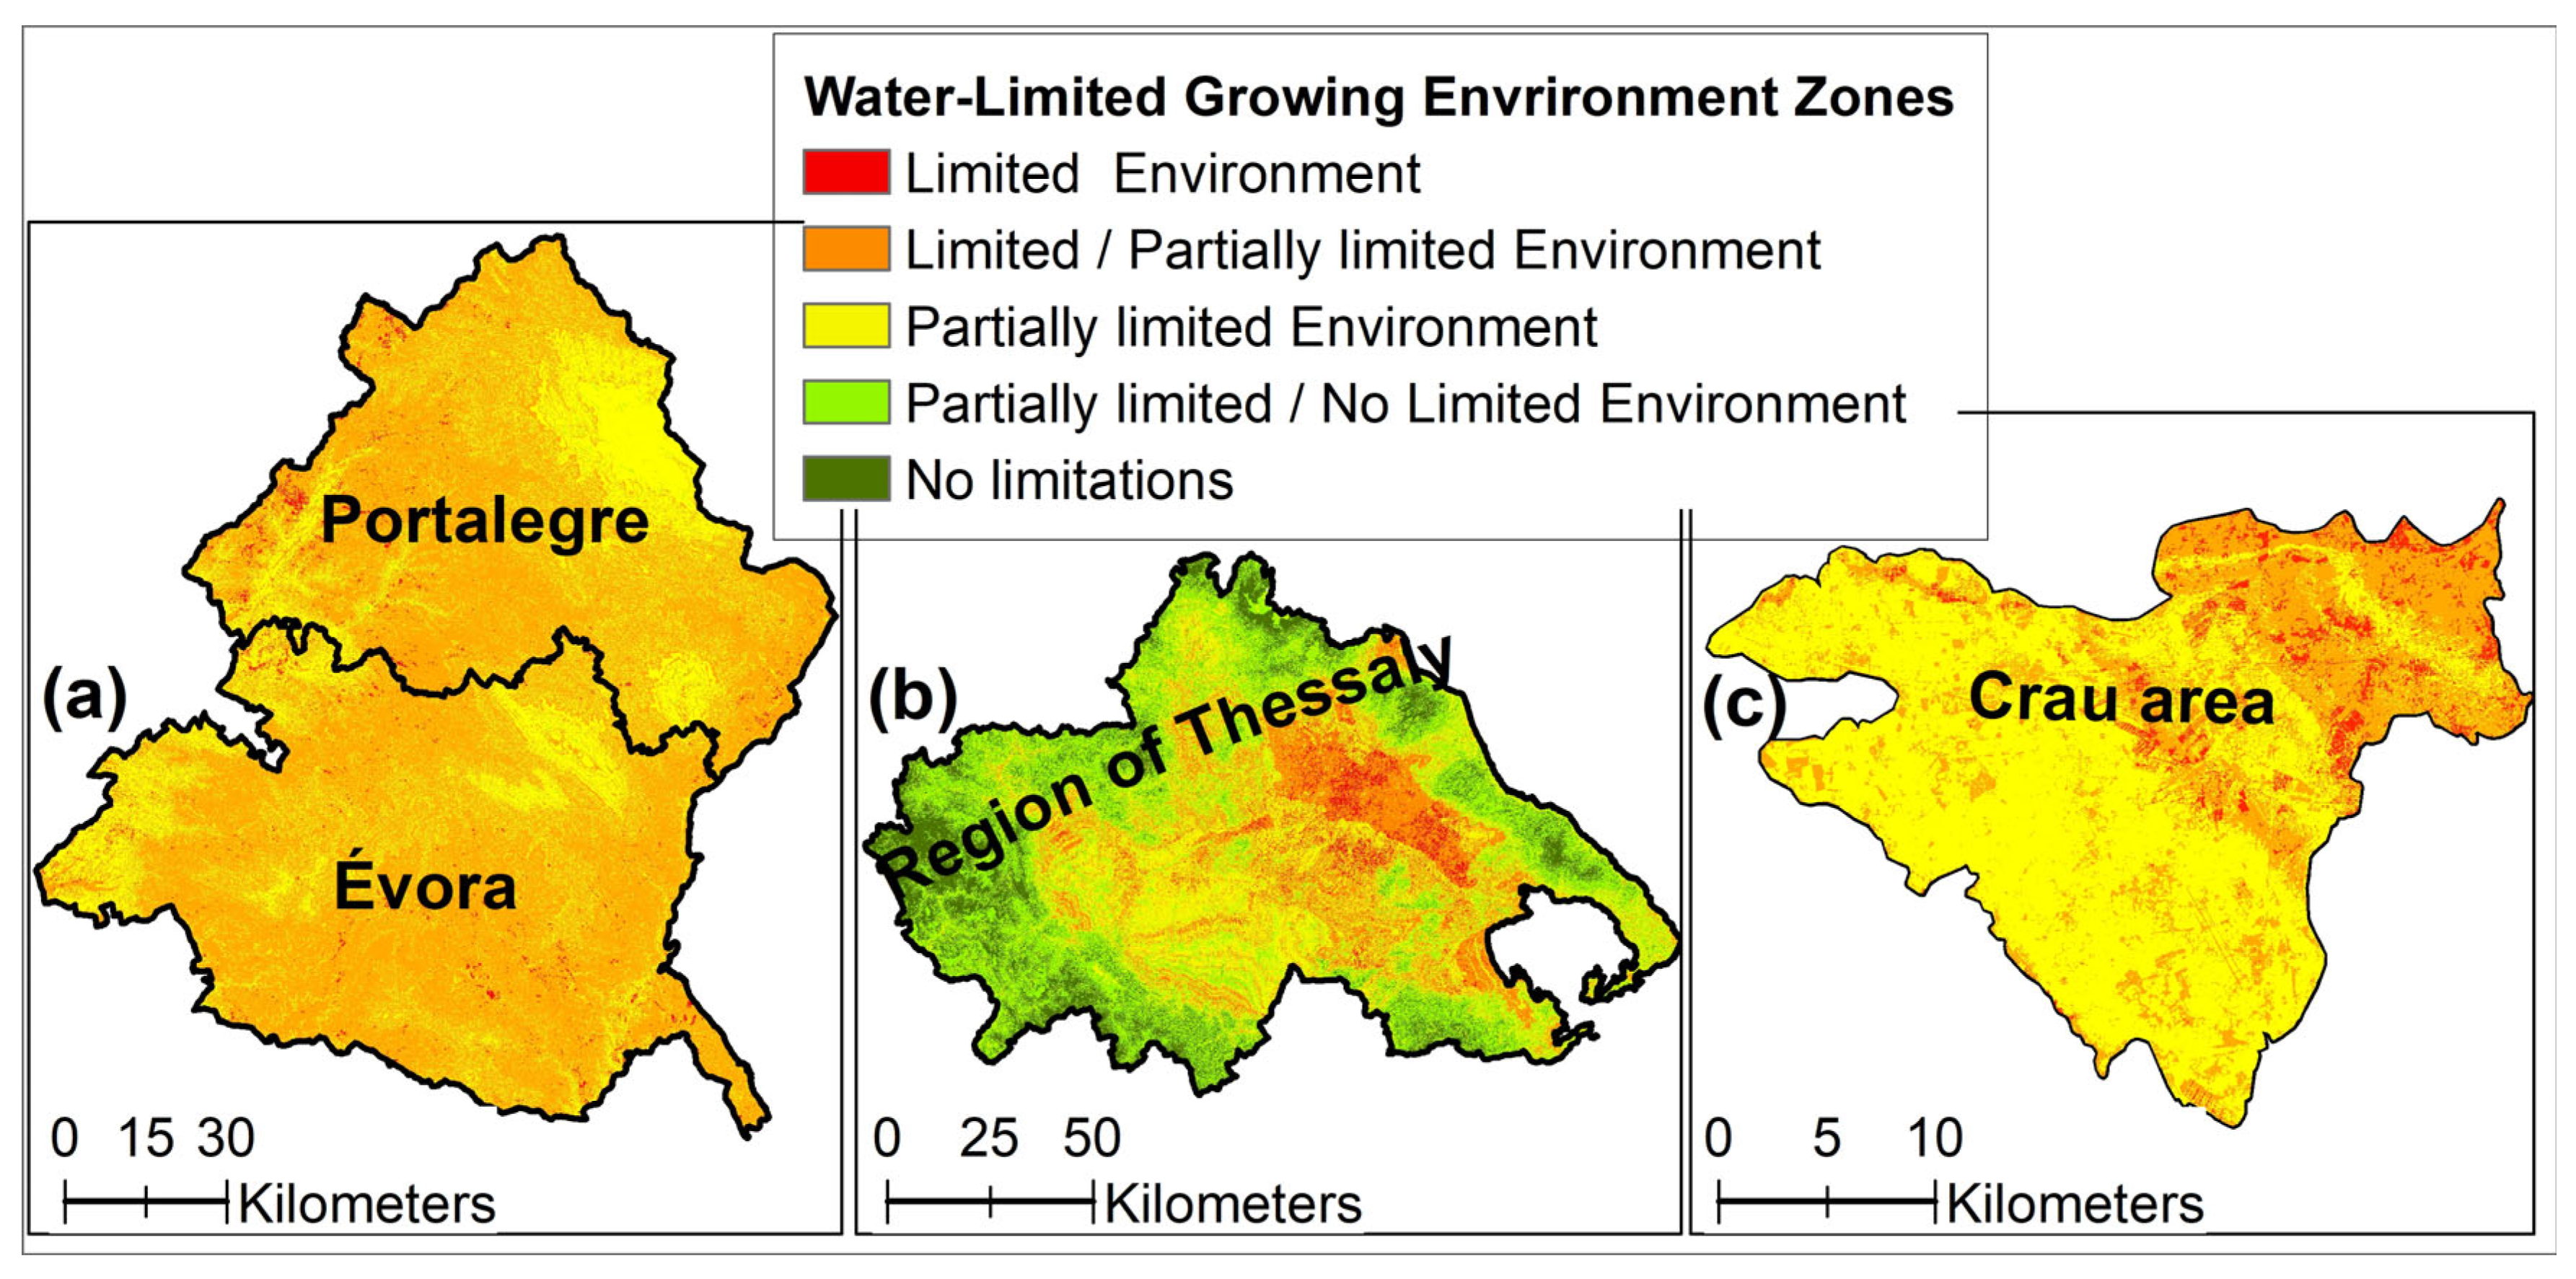
The WLGE zones are calculated by combining both VHI and AI indices. These WLGE zones, are categorized into five classes (Table 3): no limitations, partially limited/no limitations environment, partially limited environment, limited/partially limited environment, and limited environment [18]. WLGE zones represent microclimatic features of the available water resources, which are very significant for vulnerable agroecosystems, such as the Mediterranean region.

2.2. Non-Crop-Specific Agroclimatic Zoning

2.2.1. Multi-Criteria Decision-Making (MCDM) Approach

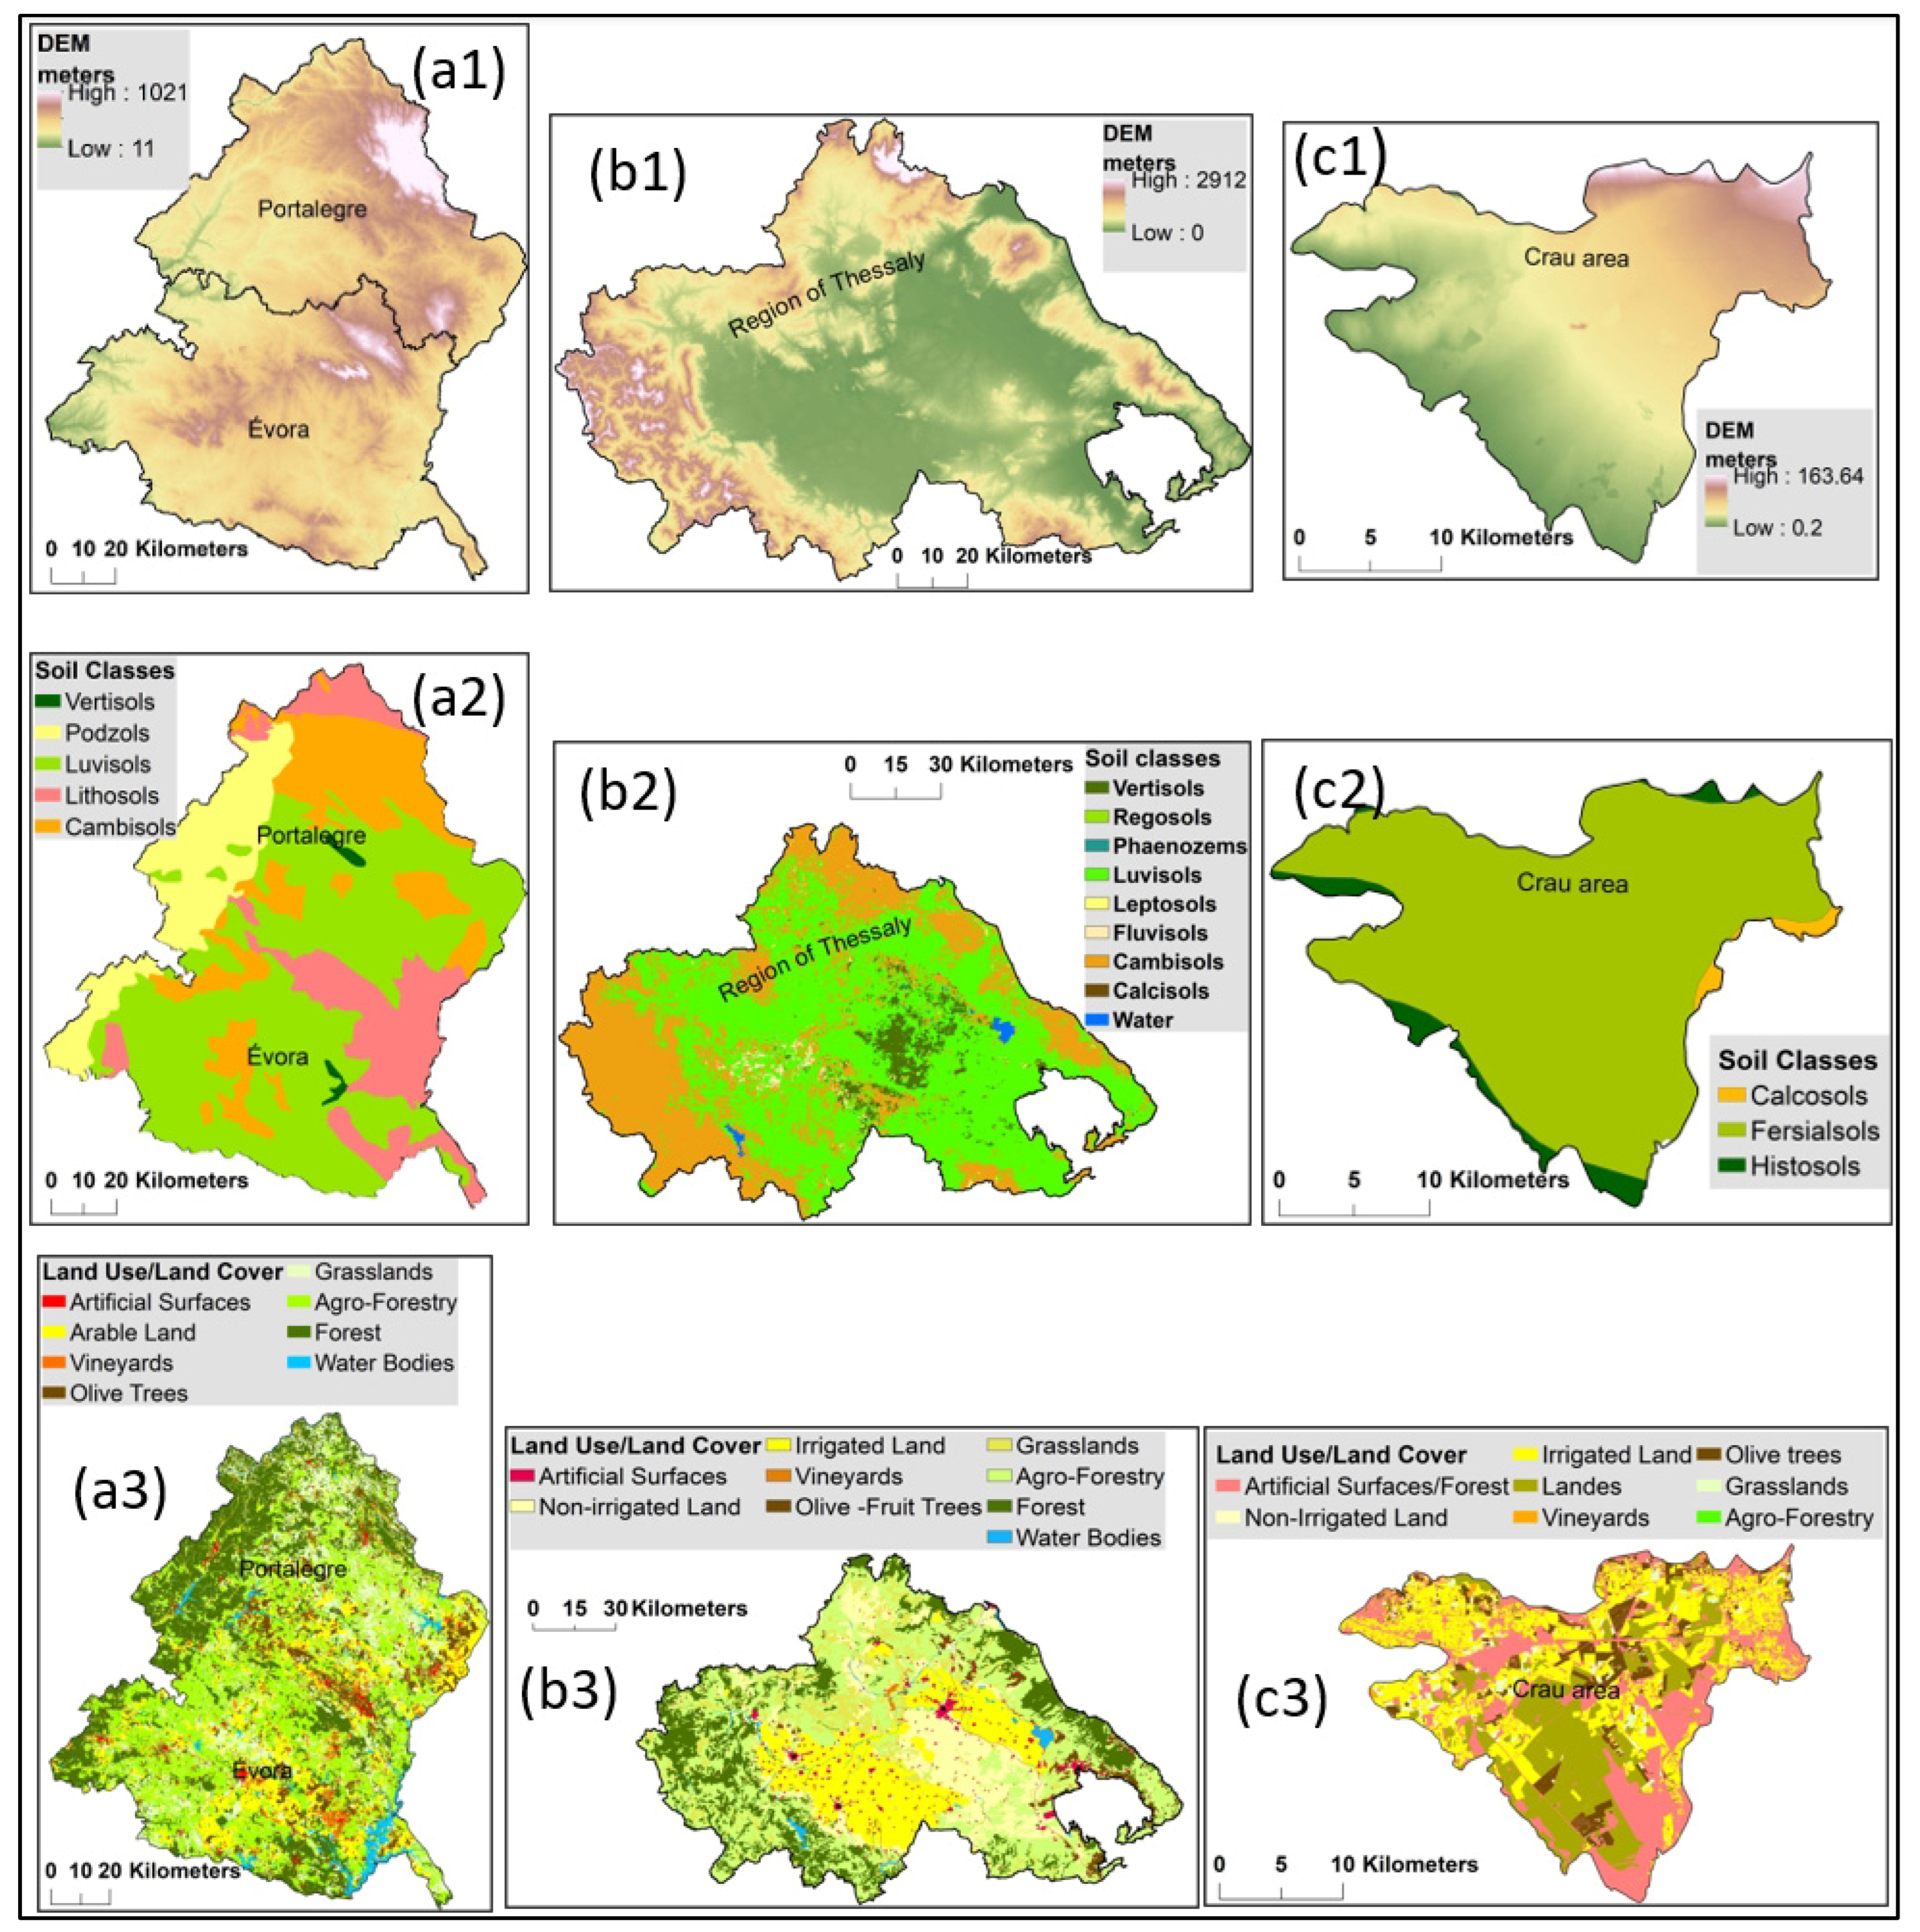
The second step is to identify sustainable production zones to characterize the non-crop specific agroclimatic zones in terms of water efficiency, fertility (appropriate or not for agricultural use), desertification vulnerability and altitude restrictions. A GIS-based MCDM approach is applied by integrating WLGE zones, Digital Elevation Model (DEM), slope, soil map, and land use/land cover data [18].
According to the behavior of each criterion with respect to agricultural land suitability, different ratings are given in different classes with a range from 0 to 10, which indicates a more suitable agricultural zone.
The unique characteristics of each study area define, for each criterion, the land suitability for agricultural use. Moreover, to attain reliable results, expert opinions and the relevant bibliography should be taken into consideration.
The variables according to agricultural land suitability are classified into one of the five qualitative categories: highly suitable, fair suitable, moderately suitable, marginally suitable, and not suitable. The final suitability map is classified based on the FAO Land suitability classification for rainfed agriculture [50]. The suitability classification scheme for agriculture in presented in the following table (Table 4).
In the following table, the Agricultural Land Suitability ratings, for each one of the criteria, for the region of Thessaly, Greece, is listed as an example. This classification scheme may vary from region to region (Table 5).
The MCDM approach evaluates and assigns weights to each criterion based on their relative significance concerning the optimal growth conditions for crops. To evaluate the weight of each criterion, the widely accepted analytical hierarchy process (AHP) method is applied, in three steps [51].
-
Step 1: selecting suitable criteria;
-
Step 2: conducting pairwise comparison of criteria;
-
Step 3: validating the results.
The consistency ratio tool is applied for testing the degree of cohesion among criteria, which should be lower than 0.10.

2.2.2. Non-Crop-Specific Model

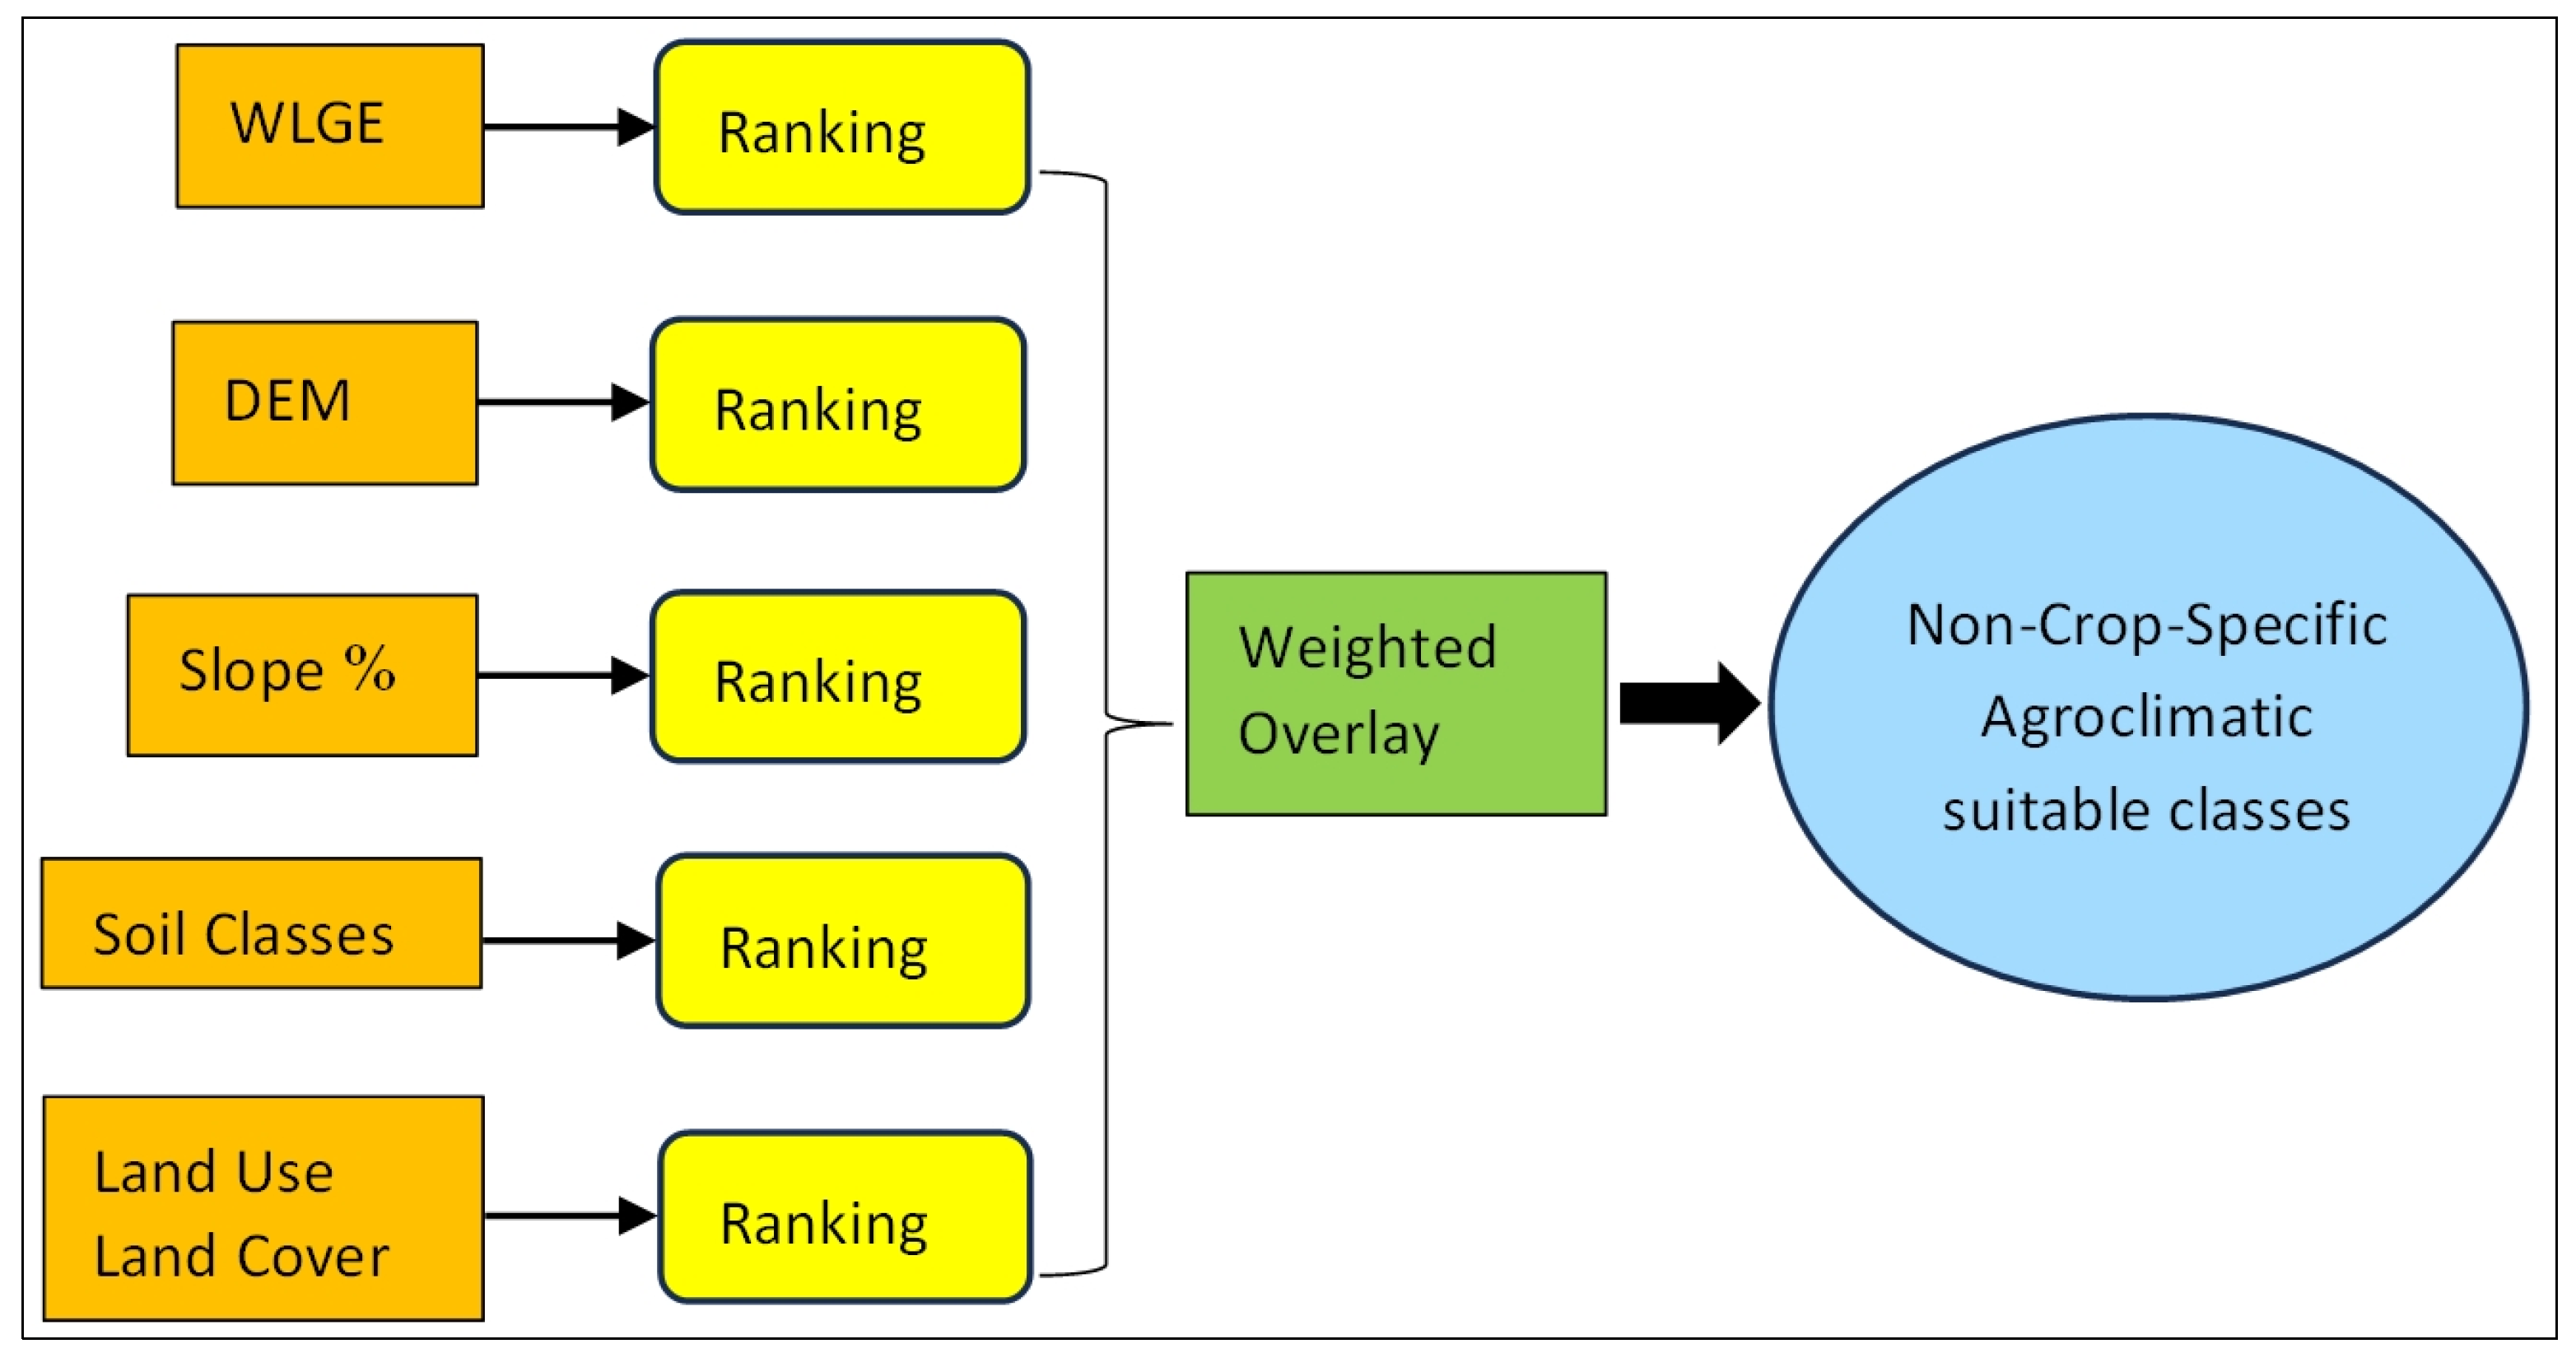
With regard to the construction of the GIS multi-criteria model, a geospatial database is created using GIS software (ArcGIS 10.8). The ranking and derived weights (from AHP methodology) of the criteria (WLGE, soil types, DEM, slopes, and land use/land cover) are incorporated into the model (Figure 2). Finally, the weighted overlay approach is implemented to derive the five non-crop-specific agroclimatic suitable classes: highly suitable, fair suitable, moderate suitable, marginally suitable, not suitable.

2.3. Crop-Specific Agroclimatic Zoning

Crop-specific agroclimatic zoning indicates suitability zones for each crop or group of crops (e.g., irrigated, non-irrigated crops). In this regard, three basic key parameters for each crop growth are considered: (a) growing degree days (GDD) (b) net radiation, and (c) the amount of spring precipitation. A description of the data sources used in this study is given later in Section 3.2.

2.3.1. Growing Degree Days

The GDDs are used to assess crop development. It is a weather-based indicator by measuring the accumulated heat units during the crop lifetime. The GDD is measured using the maximum–minimum daily temperature and the base temperature. The base temperature is selected in accordance with the specific characteristics of the study area and the crop under consideration. If the temperature surpasses the base temperature, crop growth will occur. The GDD is calculated by the following equation (°C d) [52].
G D D = 1 n δ i ( T m e a n T b a s e )
where
n = growing season.
Tmean > Tbase then δi = 1, when Tmean < Tbase then δi = 0.
Tmean is the daily mean temperatures.
Tbase is the base threshold temperature for the specific crop (see Section 4.3).
For each study area, the heat accumulation (GDD) is calculated over the basic crops. During the crop lifetime (e.g., November–June) the degree-day sum per pixel per year is estimated; then, the final product is the median value of the annual GDD for a period of more than twenty years (2001–2022).

2.3.2. Net Radiation (Rn)

Solar radiation is required for crop biomass production. The Rn indicates the available radiant energy at the Earth’s surface. Net radiation flux (Rn) is employed in models for agricultural crop planning and management and yield assessment. For the computation of Rn, a radiation balance equation of outgoing and incoming radiant fluxes is considered [53,54]:
Rn = (1 − α)RS↓ + RL↓ − RL↑ − (1 − εo)RL↓,
where
RS↓ and RL↓, are the incoming shortwave and longwave radiation (W/m2), respectively,
RL↑: is the outgoing longwave radiation (W/m2),
α, εo: are the land surface reflectance albedo and the surface emissivity (dimensionless), respectively.
The relative Earth–Sun distance and the solar zenith angle are employed for the RS↓ calculation. Additionally, albedo α (reflection coefficient) is calculated from satellite data [55]. The outgoing longwave radiation (RL↑) is estimated by using the surface temperature and the Steffan–Boltzmann equation; then, the surface emissivity (εo) is considered. The incoming longwave radiation (RL↓) is calculated from the atmospheric conditions.
All these above-mentioned variables are computed using satellite data. Finally, the Rn median values for a period of more than twenty years are calculated [56,57] (see Section 3.2.3).

2.3.3. Spring Precipitation

The amount of precipitation in spring is a key factor for plant growth, especially for winter cultivations. Estimating sufficient rainfall for 20 days, namely the last 10 days of April and first 10 days of May, is also considered [32,58,59]. To achieve this, the median cumulative amount of precipitation is calculated by employing long period earth observation data.

2.3.4. Crop-Specific Agroclimatic Map

According to the crop types (irrigated, non-irrigated arable crops) the basic crop parameters, the GDD and Rn, are classified into three zones: highly suitable, fair suitable and moderate suitable. Next, for the non-irrigated crops (cereal) the 20-day spring precipitation is classified in three classes: sufficient, marginally sufficient and insufficient rain for annual crops. Following that, for each type of crop, the above-mentioned parameters are combined with non-crop-specific agroclimatic zoning creating the five suitable crop zones map: highly suitable, fair suitable, moderate suitable, marginally suitable, not suitable.
All the types of crops under investigation are combined, using a GIS-based multi-criteria analysis (MCA), to detect zones from most suitable to less suitable for each one. The final product is a crop-specific agroclimatic map divided into three productivity classes: (a) high productivity characterized by highly to fair suitable classes classification standards according to FAO classification standards, (b) medium productivity, corresponding to moderately suitable classes as defined by FAO, and (c) low productivity, comprising marginally suitable classes as defined by FAO.

3. Study Areas and Databases

For the implementation of the above presented methodology, three study areas in southern Europe are considered: (a) the Thessaly region, Greece, (b) the Évora and Portalegre regions, South Portugal, and (c) the Crau region, South France. These areas are characterized by semi-arid to sub-humid climate with industrialized agriculture.

3.1. Description of Study Areas

3.1.1. Greek Study Area

The Thessaly region is situated in central Greece (Figure 3), occupying approximately 13,700 Km2 (continental part of the region). The agricultural plain is in the center, covering about 50% of the region, whereas the rest consists of mountainous and semi-mountainous areas.
The altitude ranges from 0 to 2900 m. Thessaly experiences a continental climate characterized by cold winters and hot summers. Notably, during July and August, the maximum temperature over the plains frequently exceeds 40 °C. The annual precipitation varies significantly across the region, ranging from approximately 400 mm in the central plain areas to over 1800 mm in the mountainous zones. In semi-mountainous areas, at elevations of 400–800 m, livestock crops (oats, vetch, Italian ray-grass, forage pea) and woody crops (olive groves, vineyards) predominate. In addition, agriculture in the plain area is considered intense, producing 14% of Greece’s agricultural products in its 410,000 hectares cropland. Approximately 55% of the agricultural land is irrigated. Thessaly is characterized by alluvial soils of the river basins and is an agriculturally significant region, particularly for the cultivation of annual crops, such as wheat, cotton, and cereals, as well as tree crops including almond, olive, pistachio, and vineyard. The region is also notable for producing many PDO (protected designation of origin) products, encompassing local cheeses, wines, and spirits. The croplands receive large amounts of fertilizers influencing both the productivity and resilience. Moreover, during the summer period, high temperatures result in excessive water exploitation [60]. These conditions inversely impact both the natural vegetation and agriculture, resulting in soil degradation and substantial reductions in crop yields. Therefore, the climatic characteristics and intensive agriculture significantly affect farmers’ economic viability.

3.1.2. Portuguese Study Area

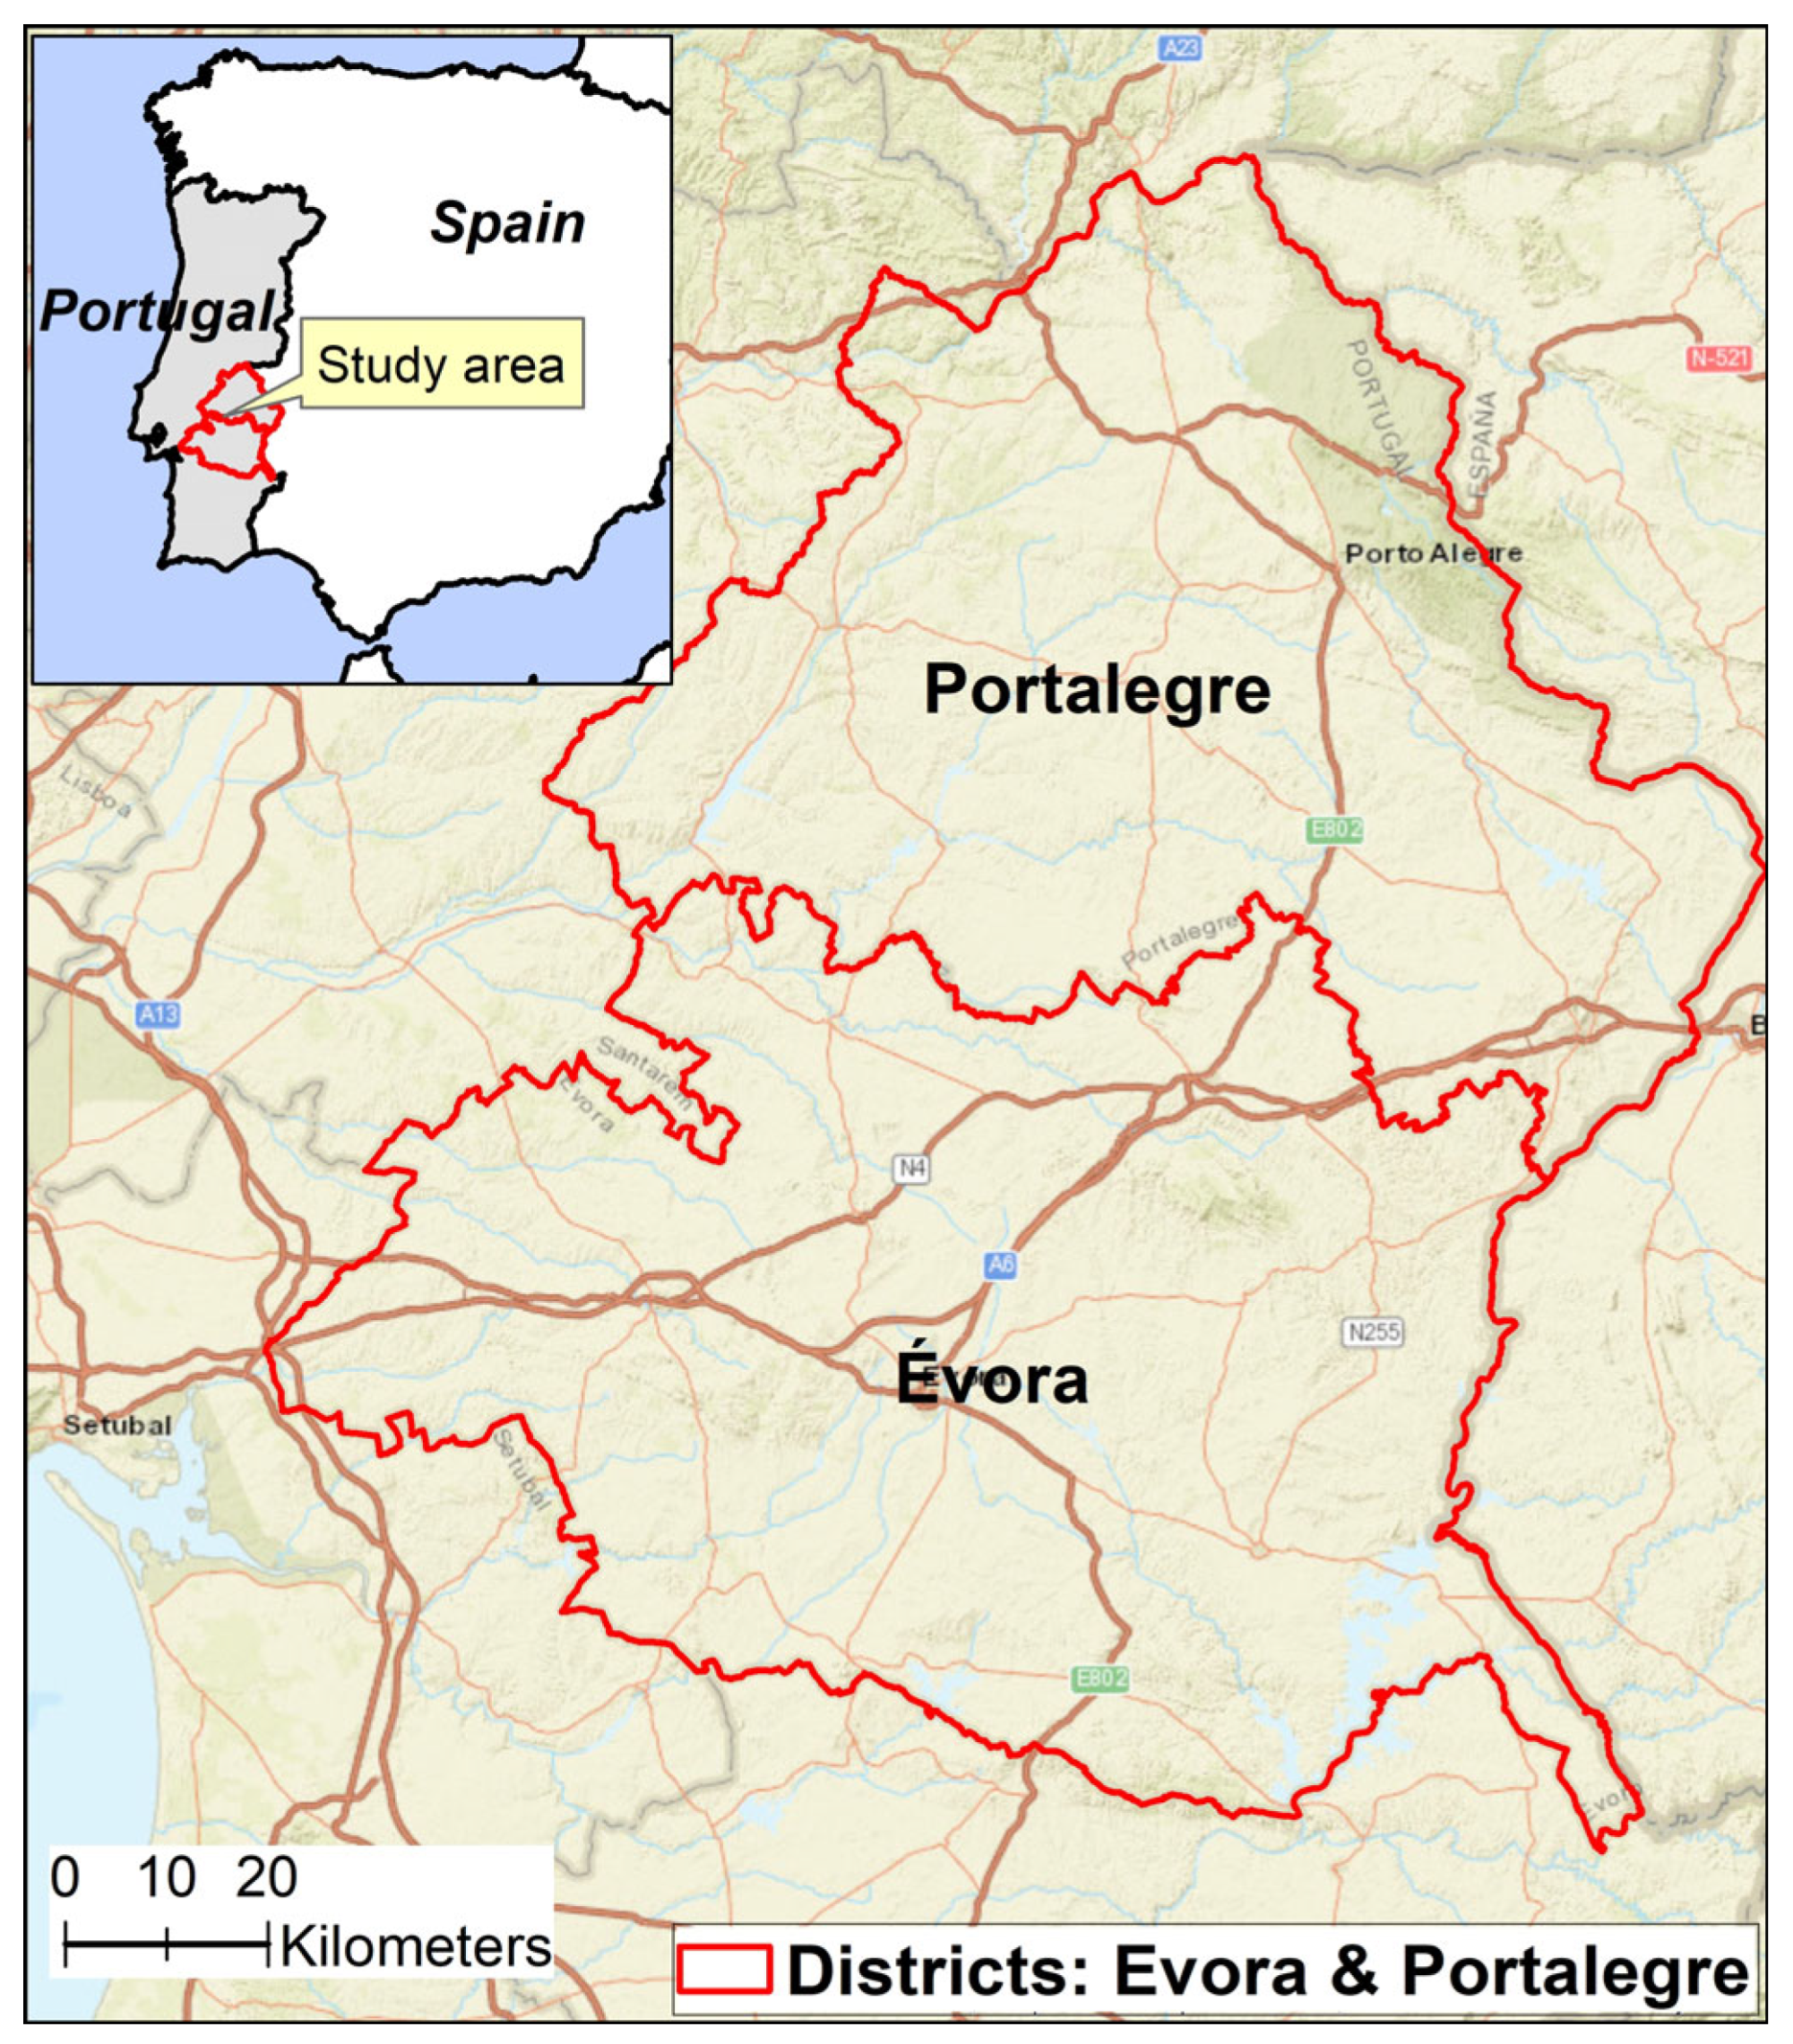
The study region, located in Southern Portugal, comprises the districts of Évora and Portalegre, which correspond to the NUT III regions of Central Alentejo and Upper Alentejo, respectively (Figure 4).
Both districts have a Mediterranean climate, classified as Csa, temperate climate with hot and dry summers, according to the Köppen–Geiger climate classification [61,62]. For Évora, the average annual temperature for the period 1981–2010 is 16.2 °C, and the average annual precipitation is 586.8 mm. For Portalegre, the average annual temperature over the same period is 15.7 °C, with an average annual precipitation of 833.1 mm [62]. The predominant soil types in both districts are luvisols and cambissols [63]. The Évora district covers a total area of 7393 km2 and had 153,475 inhabitants in 2023. The topography has extensive flat areas, with elevation ranging between 200 m and 400 m. The Portalegre district has a total area of 6065 km2 and recorded a population of 104,081 inhabitants in 2023 [64]. Upper Alentejo (Portalegre) is characterized by plains with uniform topography, although areas of low elevation can also. The exceptions are the São Mamede (1025 m a.s.l.) and Marvão (865 m a.s.l.) mountains. In Alentejo, tertiary economic activities are predominant, although primary sector activities, particularly agriculture, remain relatively significant. Since the inauguration of the Alqueva reservoir in 2002, the largest artificial reservoir in Europe, irrigated agriculture has become increasingly important. By 2016, irrigated crops covered a substantial area (216,781 ha) in the Alentejo region (NUTS II), with drip irrigation, center-pivot systems, and solid-set sprinklers being the most commonly used irrigation. According to RGA2019 [65], the main agricultural production systems in the Alentejo region (NUT II) are fodder crops (occupying 36.8% of the agricultural area), grain cereals, including maize (20.0%), olive groves (16.0%), nuts, particularly almond (9.7%), temporary meadows (10.3%), vineyards (7.4%), and vegetable crops, especially tomato (4.4%). The agroforestry system based on cork and holm oak trees, is also widespread and characteristic of the Alentejo region.

3.1.3. French Study Area

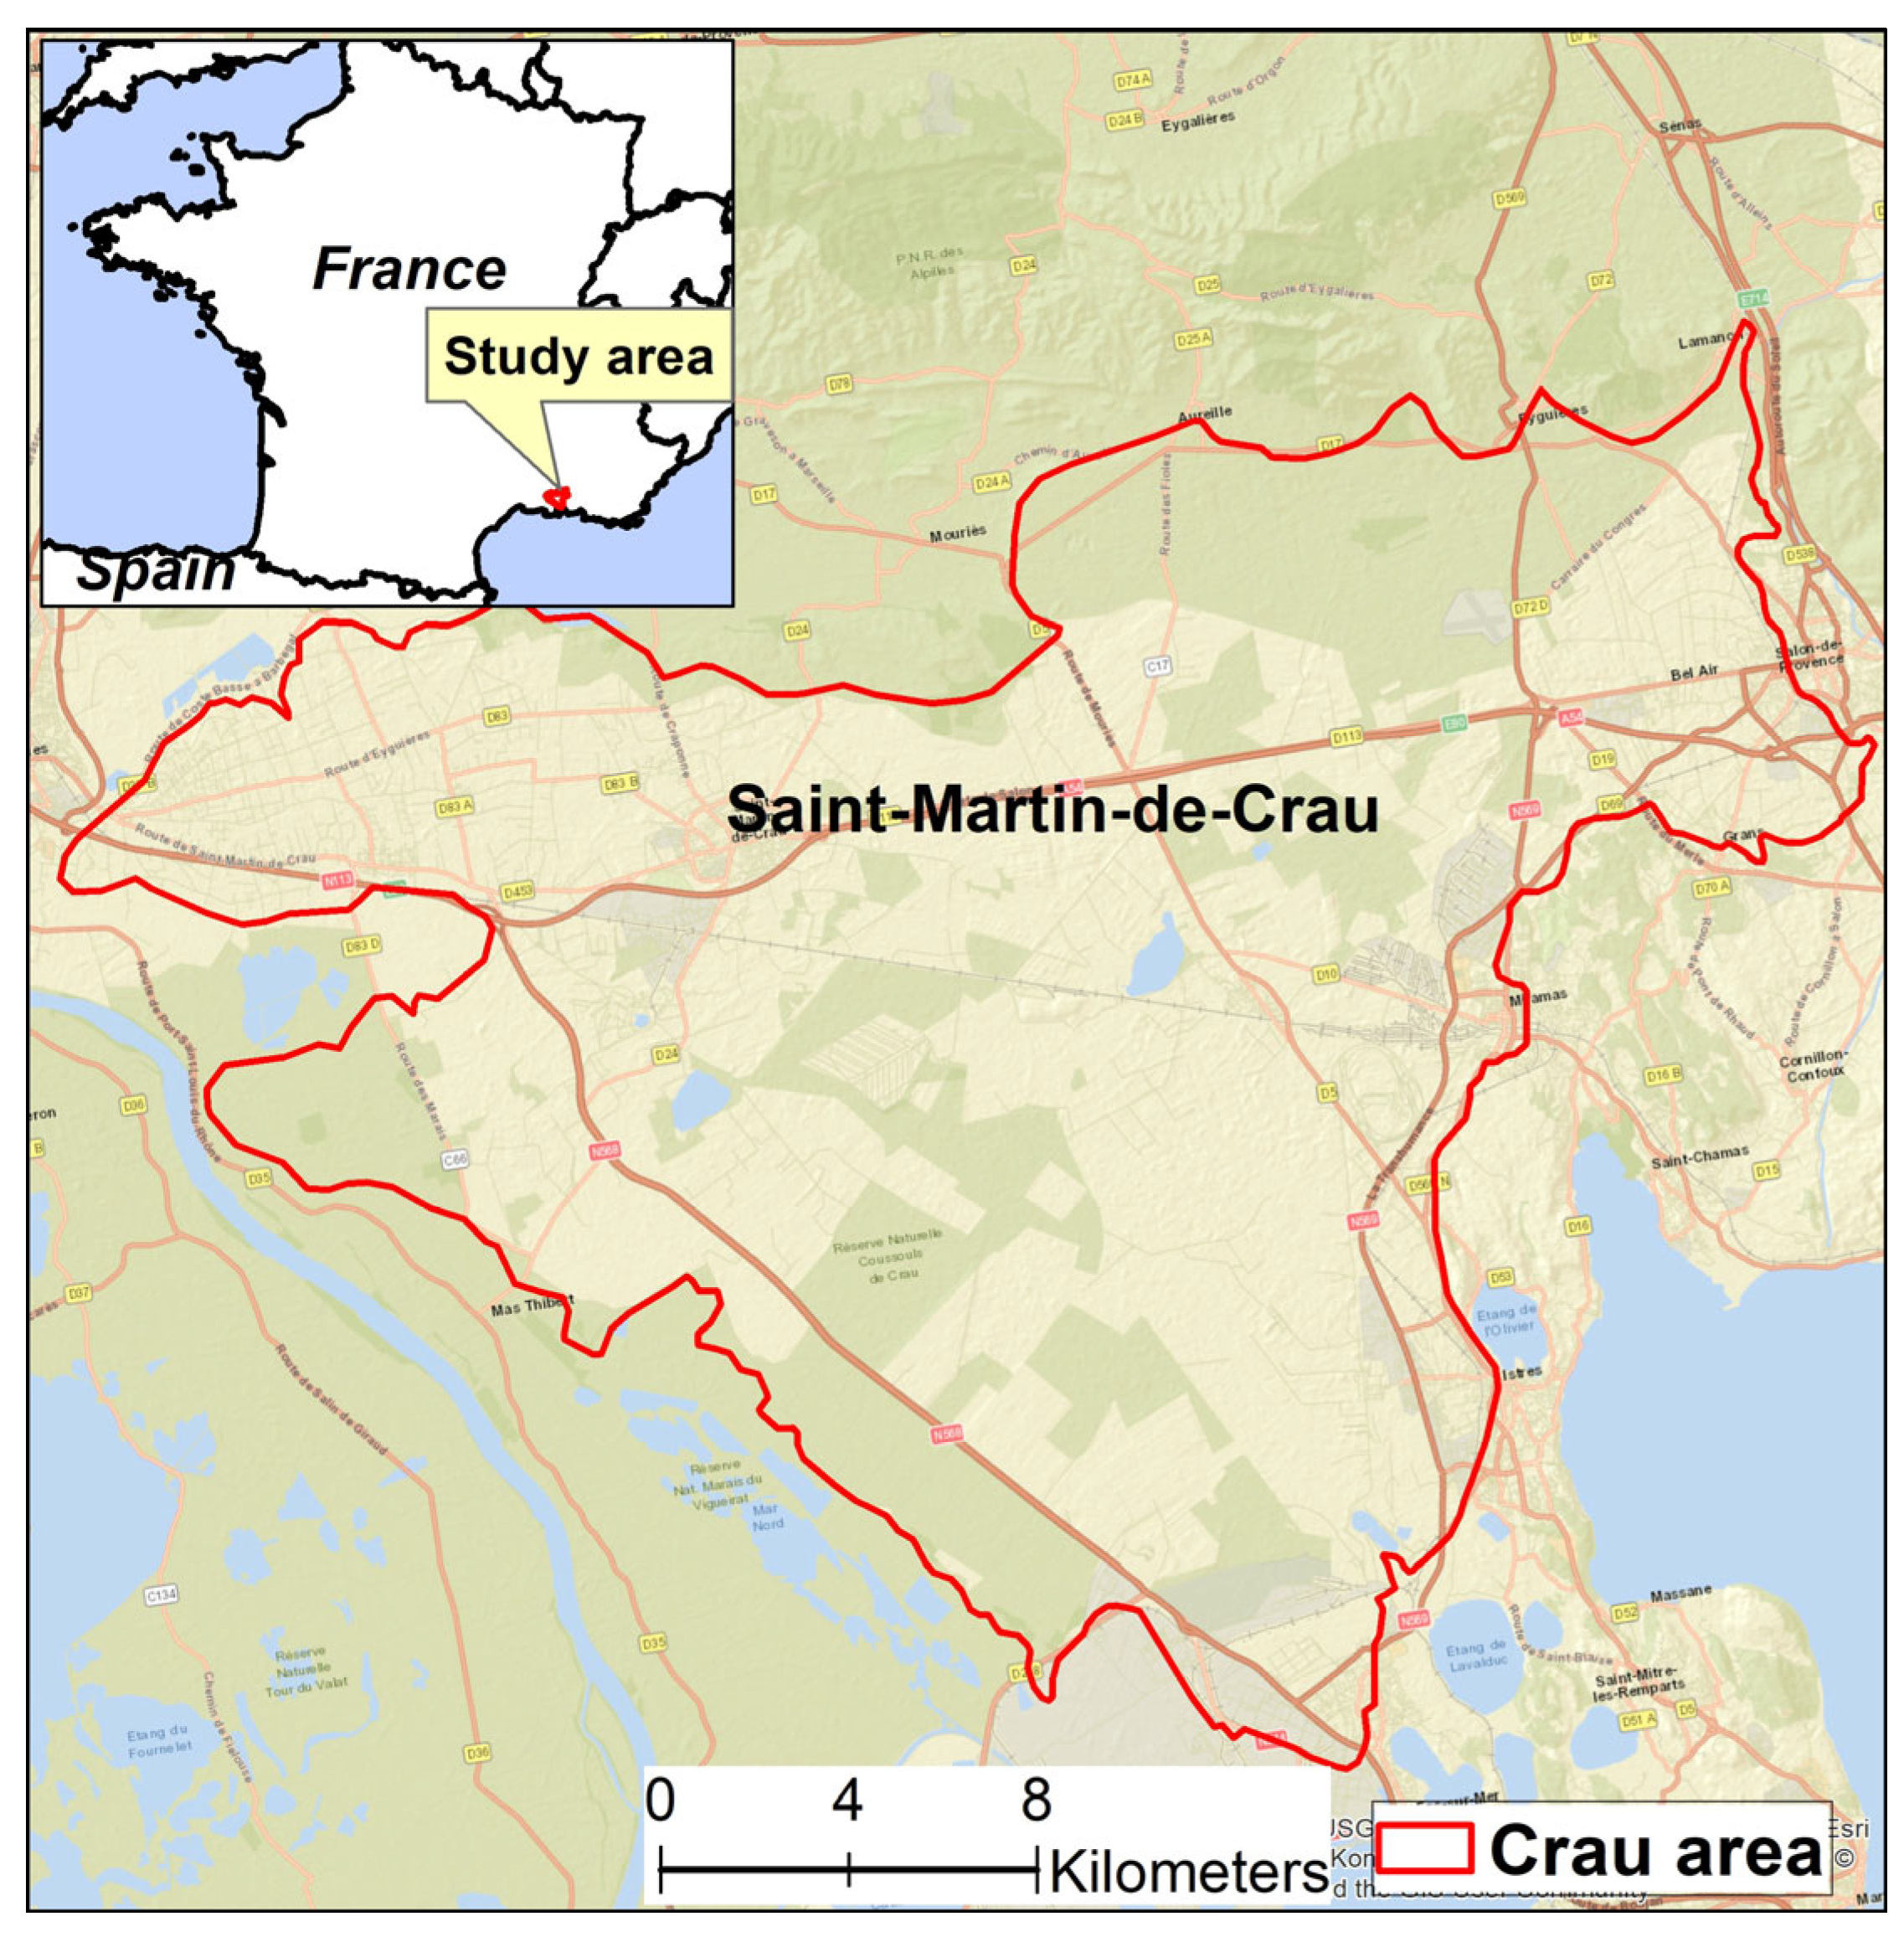
The Crau area used to be the Durance delta, until an earthquake changed the course of the river, which flows now to the Rhône. It is defined as the area above the Crau Aquifer covering an estimated area of 543 km2 (Figure 5). The area is almost flat with a small slope from the north-east edge (100 m) to southwest (sea level). There is now no natural river in the area. The area closest to the sea is subject to saline water intrusion.
The mean annual rainfall amount was around 540 mm during the last decade (2014–2023), which is around 70 mm less than during the previous 20 years. Summers are usually dry (very few significant events in July and August), while a major part of the rainfall occurs in fall. The years 2022 and 2023 were particularly dry with less than 400 mm per year. The average potential evapotranspiration was 1160 mm (average 202 mm in July).
The natural soils are mainly stony fersiallitic [66], with a limited water storage capacity (less than 50 mm) and a low agricultural potential. The natural landscape is a remarkable semi-arid scrub, still covering a third of the area thanks to protection programs.
Since the end of the 17th century, an open-channel network brings water from Durance River, as well as loamy sediments spread over the plots irrigated by gravity. A network of canals also drains the water back to the Rhone or to wetlands in the lower areas. Some plots irrigated for centuries may have received a layer up to 60 cm of loamy silt and have now a higher potential for agriculture (storage capacity 100 to 150 mm). Nowadays, gravity irrigation is mostly applied to hay, which is by far the dominant crop, covering around 15,000 ha. Orchards (mostly Prunus, then olive trees) are the second major cropping system, with around 1500 ha. Unlike hay fields, those are mostly drip-irrigated with water pumped from the table. The conversion of hay fields into orchards is therefore a major issue for the sustainability of the water table, since gravity irrigation contributes to the recharge (up to 15,000 m3/ha/year, around 70% of the annual recharge), while orchards contribute to its depletion (around 5000 m3/ha). The recharge and the piezometry are essential for the different water use, among which includes domestic water for around 300,000 inhabitants and the supply of industrial activities linked with the Fos-sur-Mer harbor. Therefore, pumping rights for agriculture are managed collectively, with restrictions imposed by water availability. Surface water is allocated to water user associations managing the irrigation infrastructures. While the water rights (31 m3/s) are normally adapted to the gravity irrigation practices, strong restrictions may be applied, such as in 2022, when the resource was exceptionally low in the upper basin (little snow during previous winter, very low volume stored in the upstream dam). Such situations are expected to be more frequent in the future [67].

3.2. Dataset and Preprocessing

3.2.1. Hydroclimatic Zoning Database

The two WLGE components, namely VHI and AI are derived from long-term satellite data processed in GEE platform. Firstly, the VHI and its VCI and TCI sub-indices are derived from long-term Landsat-8 multispectral satellite data (30 m spatial resolution). For each one of the three study areas the median VHI value is calculated per pixel, for a period from 2013 to 2022 (10 years). The amount of processed Landsat images, for Greece, France, and Portugal, are 1194, 572, and 1104, respectively.
Secondly, the AI, is calculated using EO data for a period of 2001 to 2022:
-
The median rainfall is derived by pentad CHIRPS (Climate Hazards Group InfraRed Precipitation with Station) data for the period 2001–2022. CHIRPS integrates satellite and in situ precipitation data, with a spatial resolution about 5 Km [68]. Although this rainfall product provides data from 1981 to present, the previous specific period is employed to achieve temporal compatibility with precipitation MODIS data. Then, 1584 CHIRPS pentad data points were processed for each study area (4752 images in total, for the period under consideration). There is consistency between the CHIRPS data and ground precipitation data based on a comparison between Larissa (Greece) station precipitation data and the corresponding CHIRPS pixel values.
-
The median potential evapotranspiration (PET) is derived from MODIS data (MOD16A2) for a time range of 2001 to 2022. The MOD16A2 product provides 8-day composite dataset PET layer at a 500 m spatial resolution (https://doi.org/10.5067/MODIS/MOD16A2.006). In each study area, in Greece, France, Portugal, 1010 data points were processed (3030 images in total).

3.2.2. Non-Crop-Specific Agroclimatic Zoning Database

The three main types of geospatial data, which have been employed at the second phase of agroclimatic zoning are listed below:
-
The topographic surface. The digital elevation model (DEM) is available globally, at 30 m spatial resolution by the U.S. Geological Survey [69].
-
Soil dataset. For the Greek study area, the soil types are derived from the International Soil Reference and Information Centre (ISRIC) at a spatial resolution of 250 m [70]. For the other two study areas, the soil maps are provided by the national databases.
-
Land use/land cover (LU/LC). For the Greek study areas, the Corine Land Cover product (2018) was applied. It can be downloaded for free from the Copernicus Land Monitoring Service [71]. For the Portugal study area, LU/LC maps are provided by local institutions. For the France study area, the agricultural land use is provided by the EU land parcel identification system, completed with the land use provided by the THEIA program.

3.2.3. Crop-Specific Agroclimatic Zoning Database

The crop specific parameters, including GDD, Rn, and spring precipitation, are estimated employing Earth Observation data in the GEE platform:
-
The median GDD over 22 years is calculated based on the MODIS product. Specifically, the average 8-day land surface temperature dataset at a 1 Km spatial resolution (MOD11A2 V6) is processed for the period 2001–2022. For the three study areas, the median GDD for each crop and growing period are considered. For instance, for the winter crop, wheat, 462 8-day MOD11A2 data points are considered for each one of the three study areas, for the period January to 15 June (1386 images in total). Likewise, for the irrigated crop maize, 505 8-day MOD11A2 data points for Thessaly and Évora-Portalegre regions are analyzed (1010 in total) during the growing period from April to September. For the hay crop in Crau area, the GDD product is derived from 242 8-day MOD11A2 data points for the period March to May.
-
For each crop growing season, the median net radiation is calculated by processing 10 years of Landsat-8 satellite data (2013–2022). Regarding the non-irrigated annual crops (wheat), the net radiation calculations are performed in the three study areas of Thessaly, Évora-Portalegre, and Crau, using Landsat data with 505, 469, and 232 images, respectively. Furthermore, for the maize irrigated crops in Thessaly and Évora-Portalegre regions, 648 and 571 Landsat images are considered respectively. Finally, for the hay crop, the net radiation is derived from 120 Landsat data points.
-
The 41-year CHIRPS pentad precipitation data (period 1981–2022) is employed to calculate the median 20-day spring cumulative precipitation. For each one of the three study areas, 176 datasets, through the GEE platform, are processed.

3.2.4. Coordinate Systems

For the processing, analysis, and visualization of the data different official geodetic reference systems have been employed corresponding to each of the three study areas: (a) the Hellenic Geodetic Reference System 1987 (HGRS87) for Greece, (b) the Réseau Géodésique Français 1993 (RGF93) for France, and (c) ETRS89/Portugal TM06 for Portugal.

3.2.5. Downscaling Data

As already stated in Section 2, downscaling techniques are employed to generate a uniform dataset with a spatial resolution of 30 m. The following example demonstrates the methodological procedures implemented in Google Earth Engine for the downscaling of GDDs, which are derived from the MODIS land surface temperature (LST) dataset (MOD11A2 V6.1). The MODIS product delivers an average 8-day LST with spatial resolution of 1200 × 1200 km. The downscaling of GDD is carried out utilizing the CART machine learning algorithm, where elevation data are employed as the predictive variable using the following steps:
-
Load and preprocess data. Import the GDD image collection alongside high-resolution elevation data (ALOS DSM: Global 30 m v4.1, approximately 30 m horizontal resolution).
-
Generate training dataset. Extract paired pixel values from GDD and ALOS DSM datasets. In total, 1000 pixels are sampled.
-
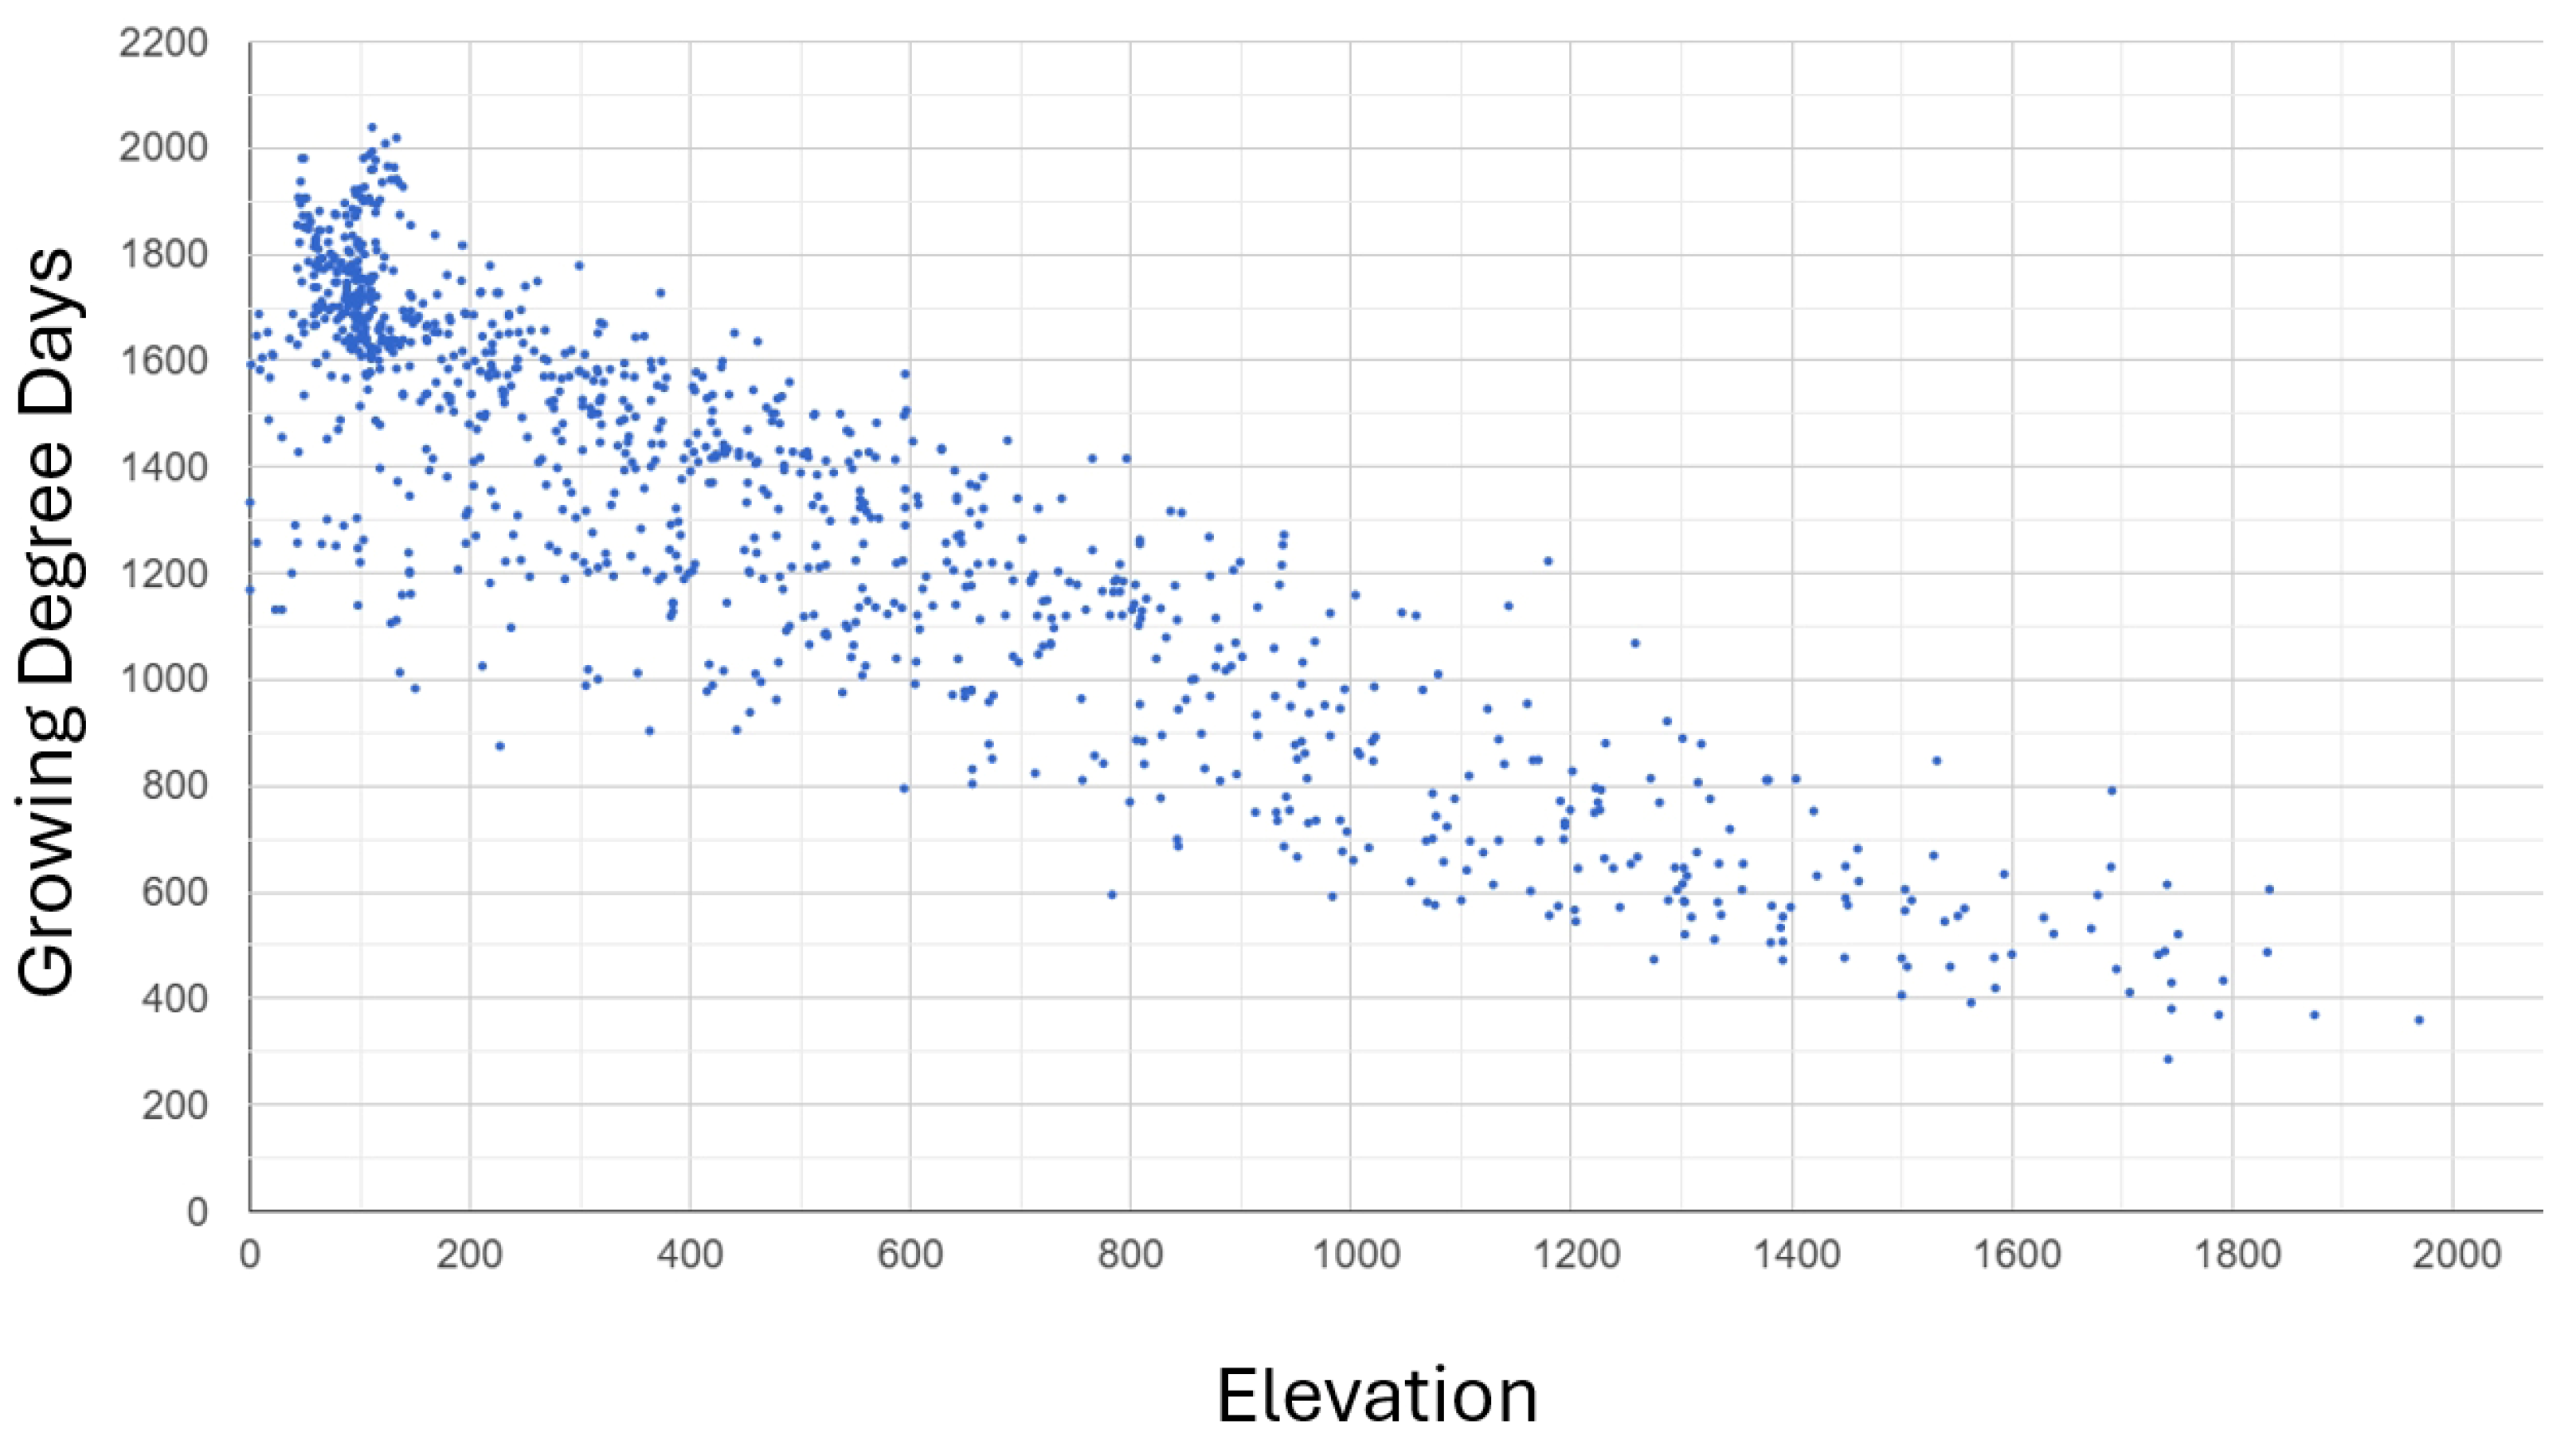
Create a chart regression to assess the correlation between the two variables. This approach is effective, as it visually demonstrates the strength and nature of the relationship between the elevation and GDD (Figure 6), where the Pearson correlation value between GDD and Elevation is −0.89, which indicates a very strong negative linear relationship.
-
Train the model. Utilize the extracted samples to train the CART regression model predicting the GDD from elevation.
-
Apply model for downscaling. Employ the trained model across the 30 m elevation data to generate a GDD dataset at 30 m resolution.
-
Validate results. The evaluation of the final downscaled product is performed using LST data obtained from local meteorological stations.

4. Implementation of the Agroclimatic Zoning Methodology

In three study areas, namely the Évora-Portalegre districts (Portugal), the Thessaly region (Greece), and the Crau region (France), the agroclimatic zones are created through three methodological steps, as described in Section 2, and are listed below.

4.1. Implementation of Hydroclimatic Classification

I.
Vegetation Health Index (VHI)
Initially, the median VHI map for each one of the three study areas and for the 10-year period is created. As listed below, the two classes “No Drought” and “Mild Drought” prevail in the three study areas (Figure 7). Moreover, the “Moderate drought” class exists at the east part of the Thessaly plain.
II.
Aridity Index (AI)
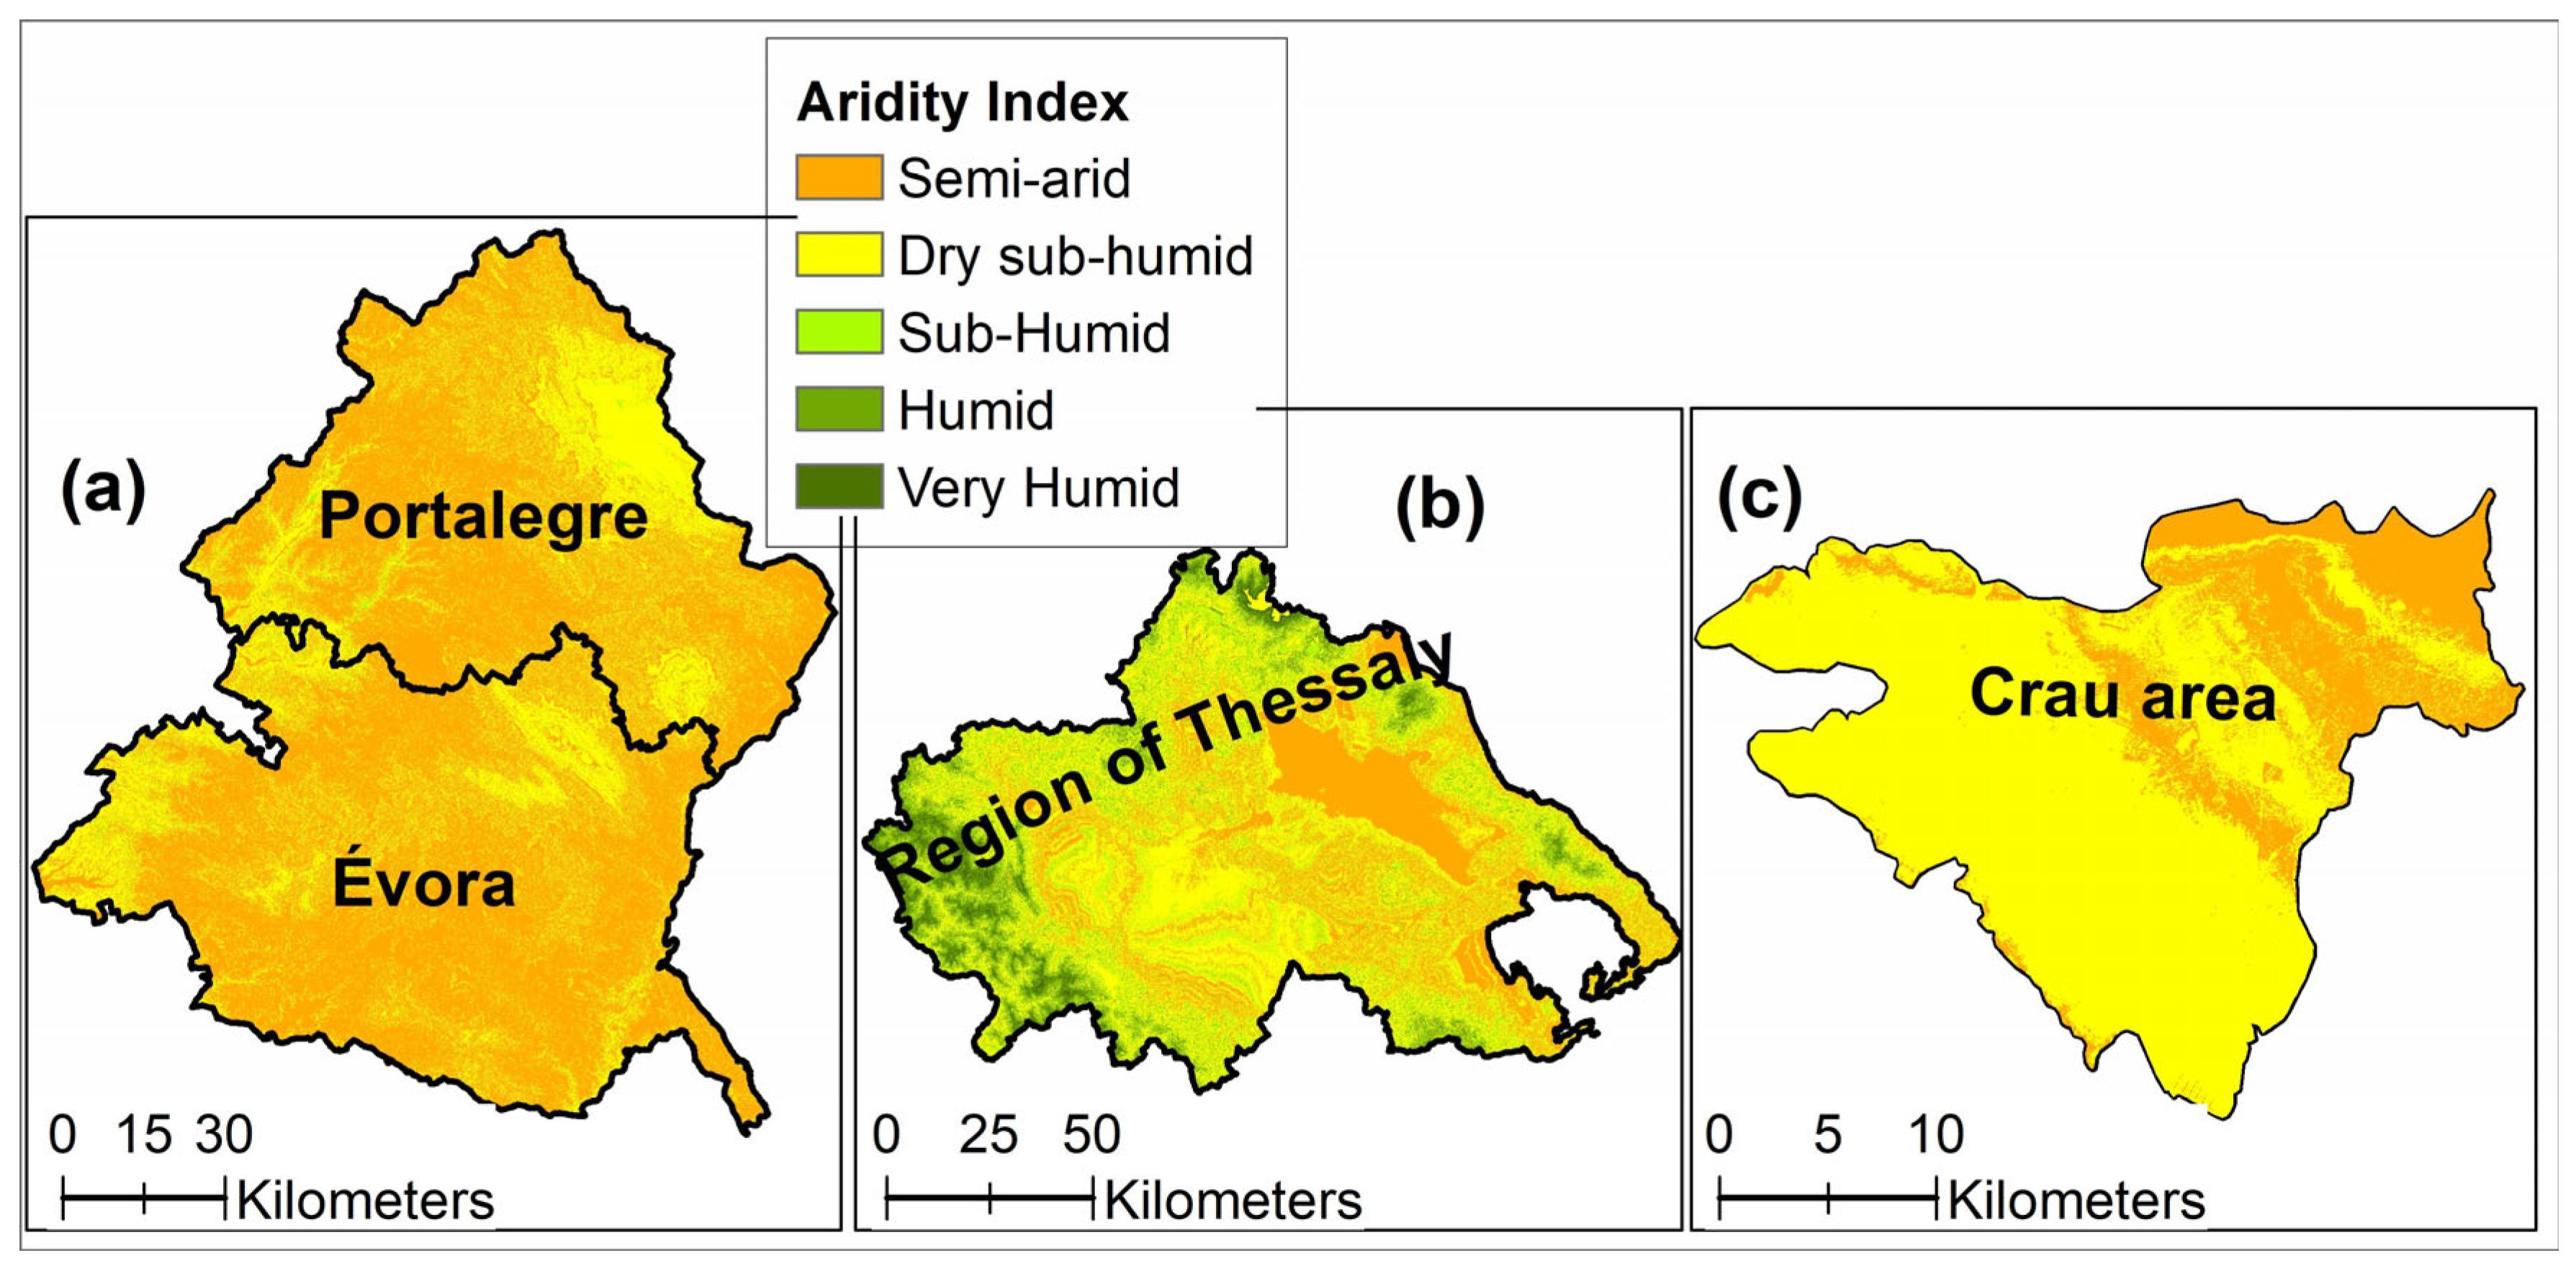
Next, the median AI map for each one of the three study areas and for the 22-year period is created. To achieve a 30 m spatial resolution, a downsampling resampling method is employed. As listed below, the semi-arid class prevails in the Evora-Portalegre districts of Portugal and in the eastern part of the Thessaly Plain in Greece. In contrast, a small northern portion of Crau area is classified as semi-arid (Figure 8).
III.
Water-Limited Growth Environment (WLGE) Zones
Lastly, the WLGE thematic map is created. The WLGE zones for the three study areas are presented in the following Figure 8. In the Portugal and France study areas, the “limited/partially limited” and “partially limited” zones are prevalent. In contrast the “limited” and “limited/partially limited” zones predominate in flat regions, while ‘no limitations’ zones apply in mountainous areas in the Greek case study (Figure 9).

4.2. Non-Crop-Specific Agroclimatic Zoning

In this step, the agriculture suitability is achieved by considering the following variables (Figure 10): DEM (also slope map), soil, land use/land cover, and the WLGE zone produced in previous stage. The developed multi-criteria model is tested for the sensitivity among different classes. A ranking is applied, ranging from 10 (highly suitable) to 1 (not suitable), based on the agricultural suitability criteria. As outlined in Section 2.2.1, in this study, the GIS multi-criteria model is founded on the Analytical Hierarchy Process (AHP) methodology, as originally proposed by Saaty [51]. To construct the pairwise comparison matrix, variable weights were assigned based on the bibliography [32]. The final weights assigned to each variable, as well as to each of the study regions, are presented in Table 6 below. For the three study areas, the weights assigned to each variable are nearly identical. This finding is explained by the fact that the three regions are situated within the Mediterranean Basin, thereby sharing similar climatic features. Minor differences are observed in the DEM and Slope variables due to the distinct topographic characteristics of each region.
Ultimately, non-crop-specific agroclimatic zoning maps were developed in the three study areas.

4.3. Crop-Specific Agroclimatic Zoning

Firstly, for each of the three study areas, the winter cereals (winter wheat) are considered, due to their significant contribution to food security in the agriculture sector, for identifying suitability zones. Next, the study focuses on the dominant irrigated annual crops, in three regions, namely, maize for Portugal and Greece and hay for France (Table 7).
Subsequently, crop parameters, including the GDD, Rn, and cumulative precipitation for the period of April to May, are estimated for each study area.
I.
Growing Degree Days (GDD)
Initially, the base temperature and the optimum accumulated GDD, for crops under investigation, during the growing season, are identified from the literature and the local authorities [72,73] (Table 8). The hay crop (Crau, France) is harvested in four periods. The first harvest is scheduled for the end of May and is characterized as superior quality (rich in seeds). It is considered suitable for horse feed and for fattening cows. Consequently, the optimum accumulated GDD for the first harvest is calculated [74,75,76].
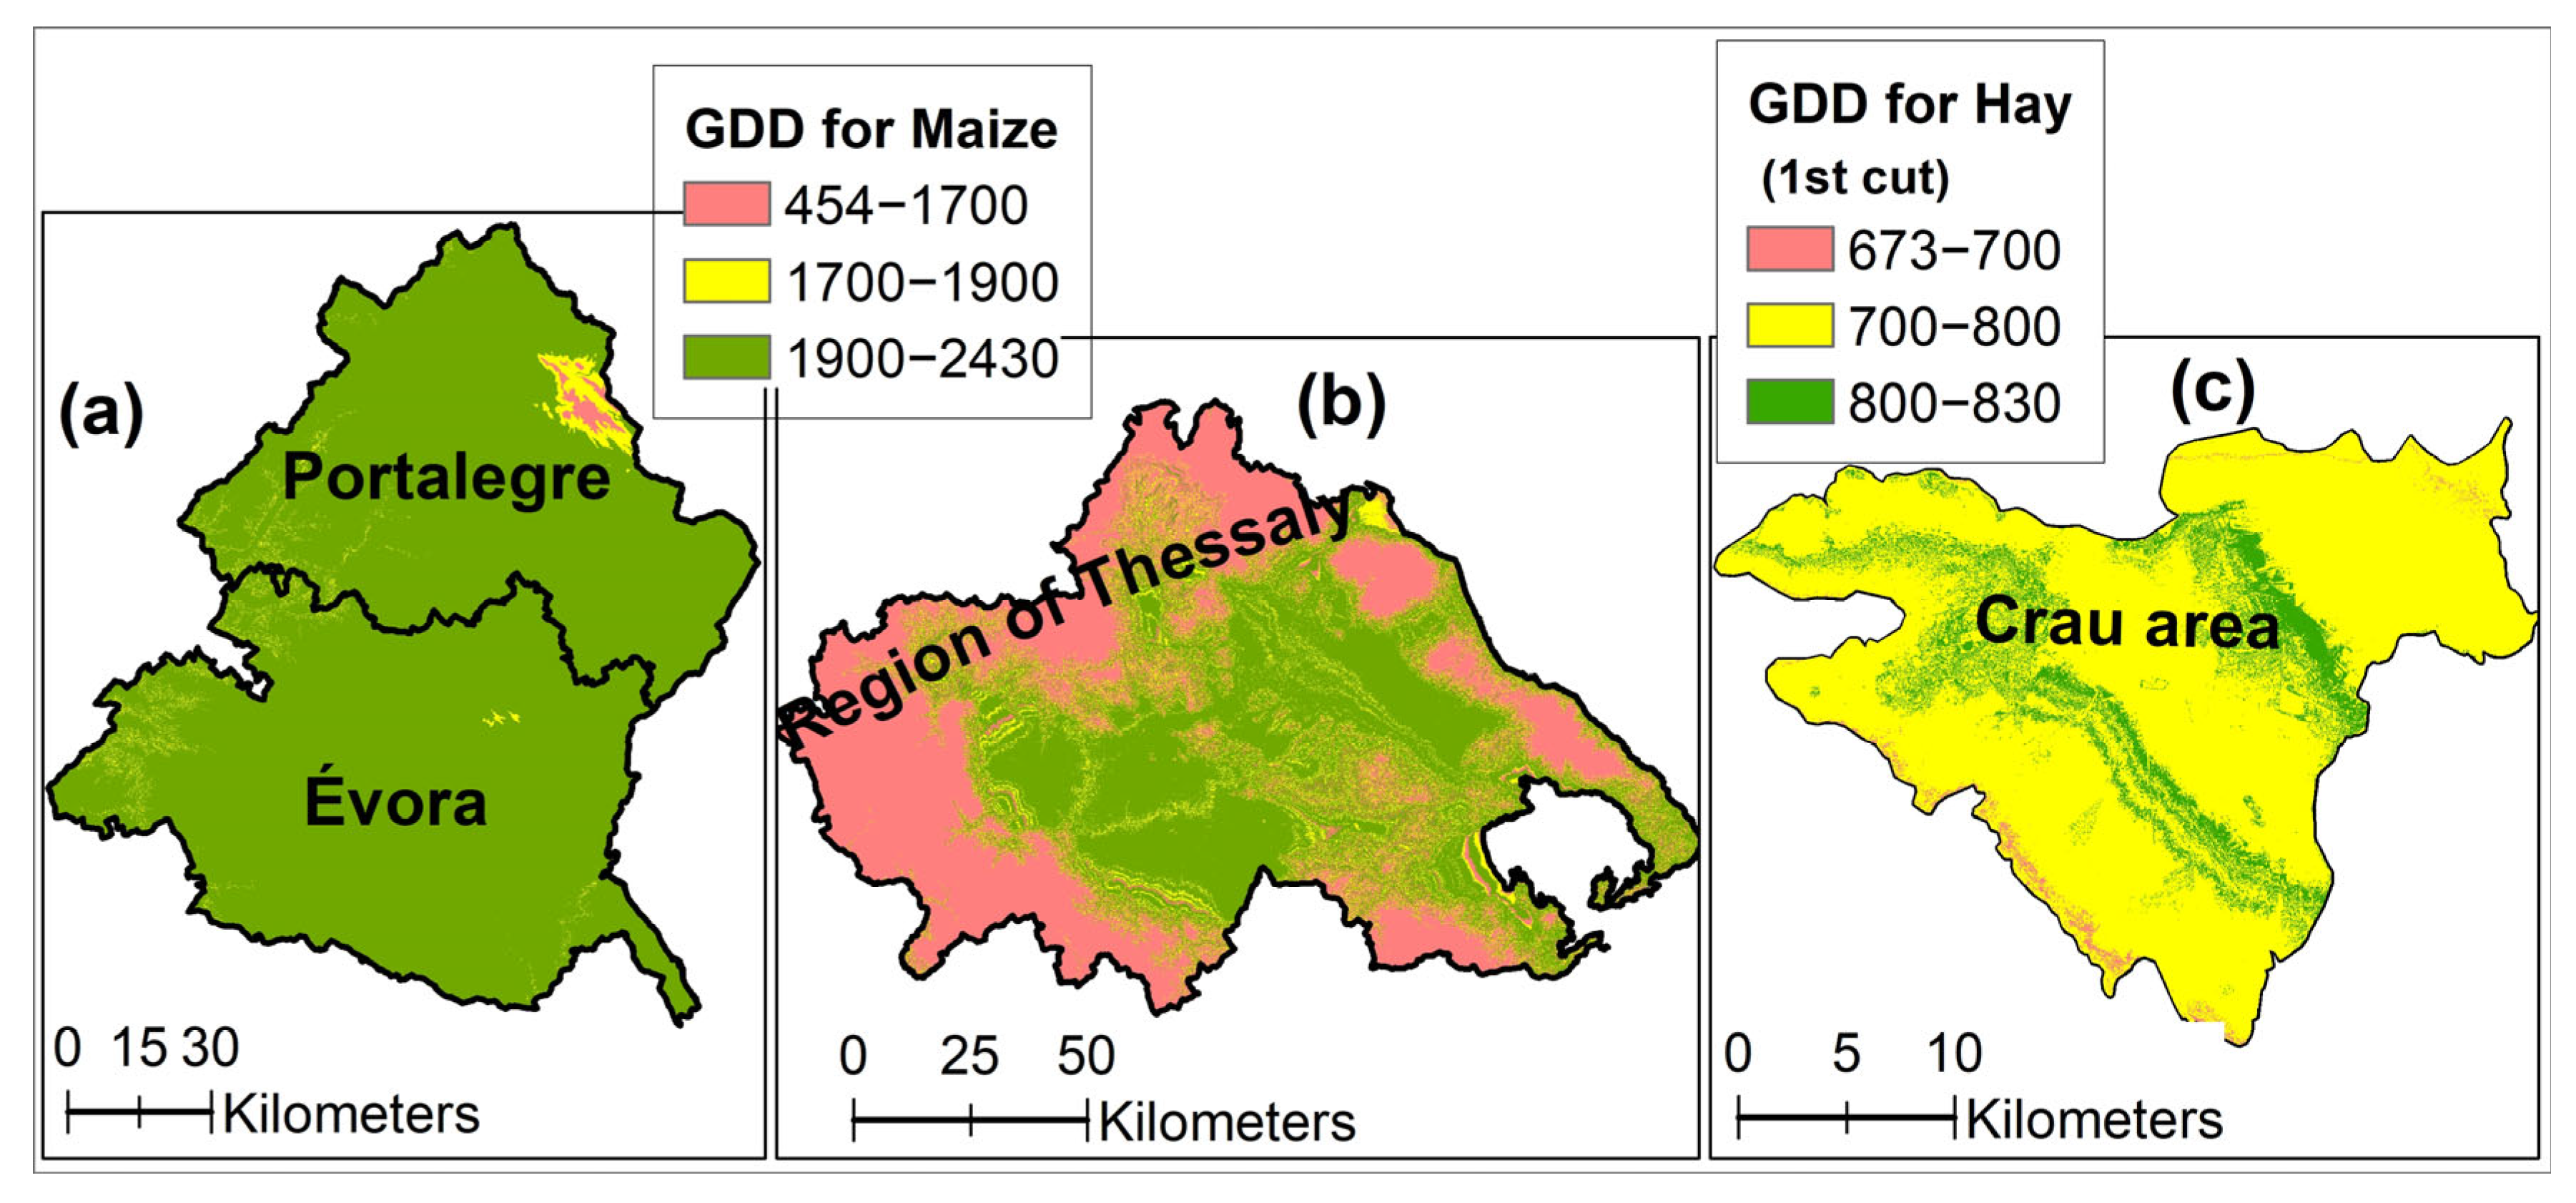
Next, the calculation of GDD using the 8-day LST MODIS product at 1 Km spatial resolution is performed. MODIS data are downscaled by applying Machine Learning techniques available in Google Earth Engine. The final products are 30 m pixel size maps for the three study areas (Figure 11 and Figure 12).
II.
Net Radiation
Firstly, the median net radiation maps, for the wheat crop in the three study areas, are calculated with a spatial resolution of 30 m. (Figure 13).
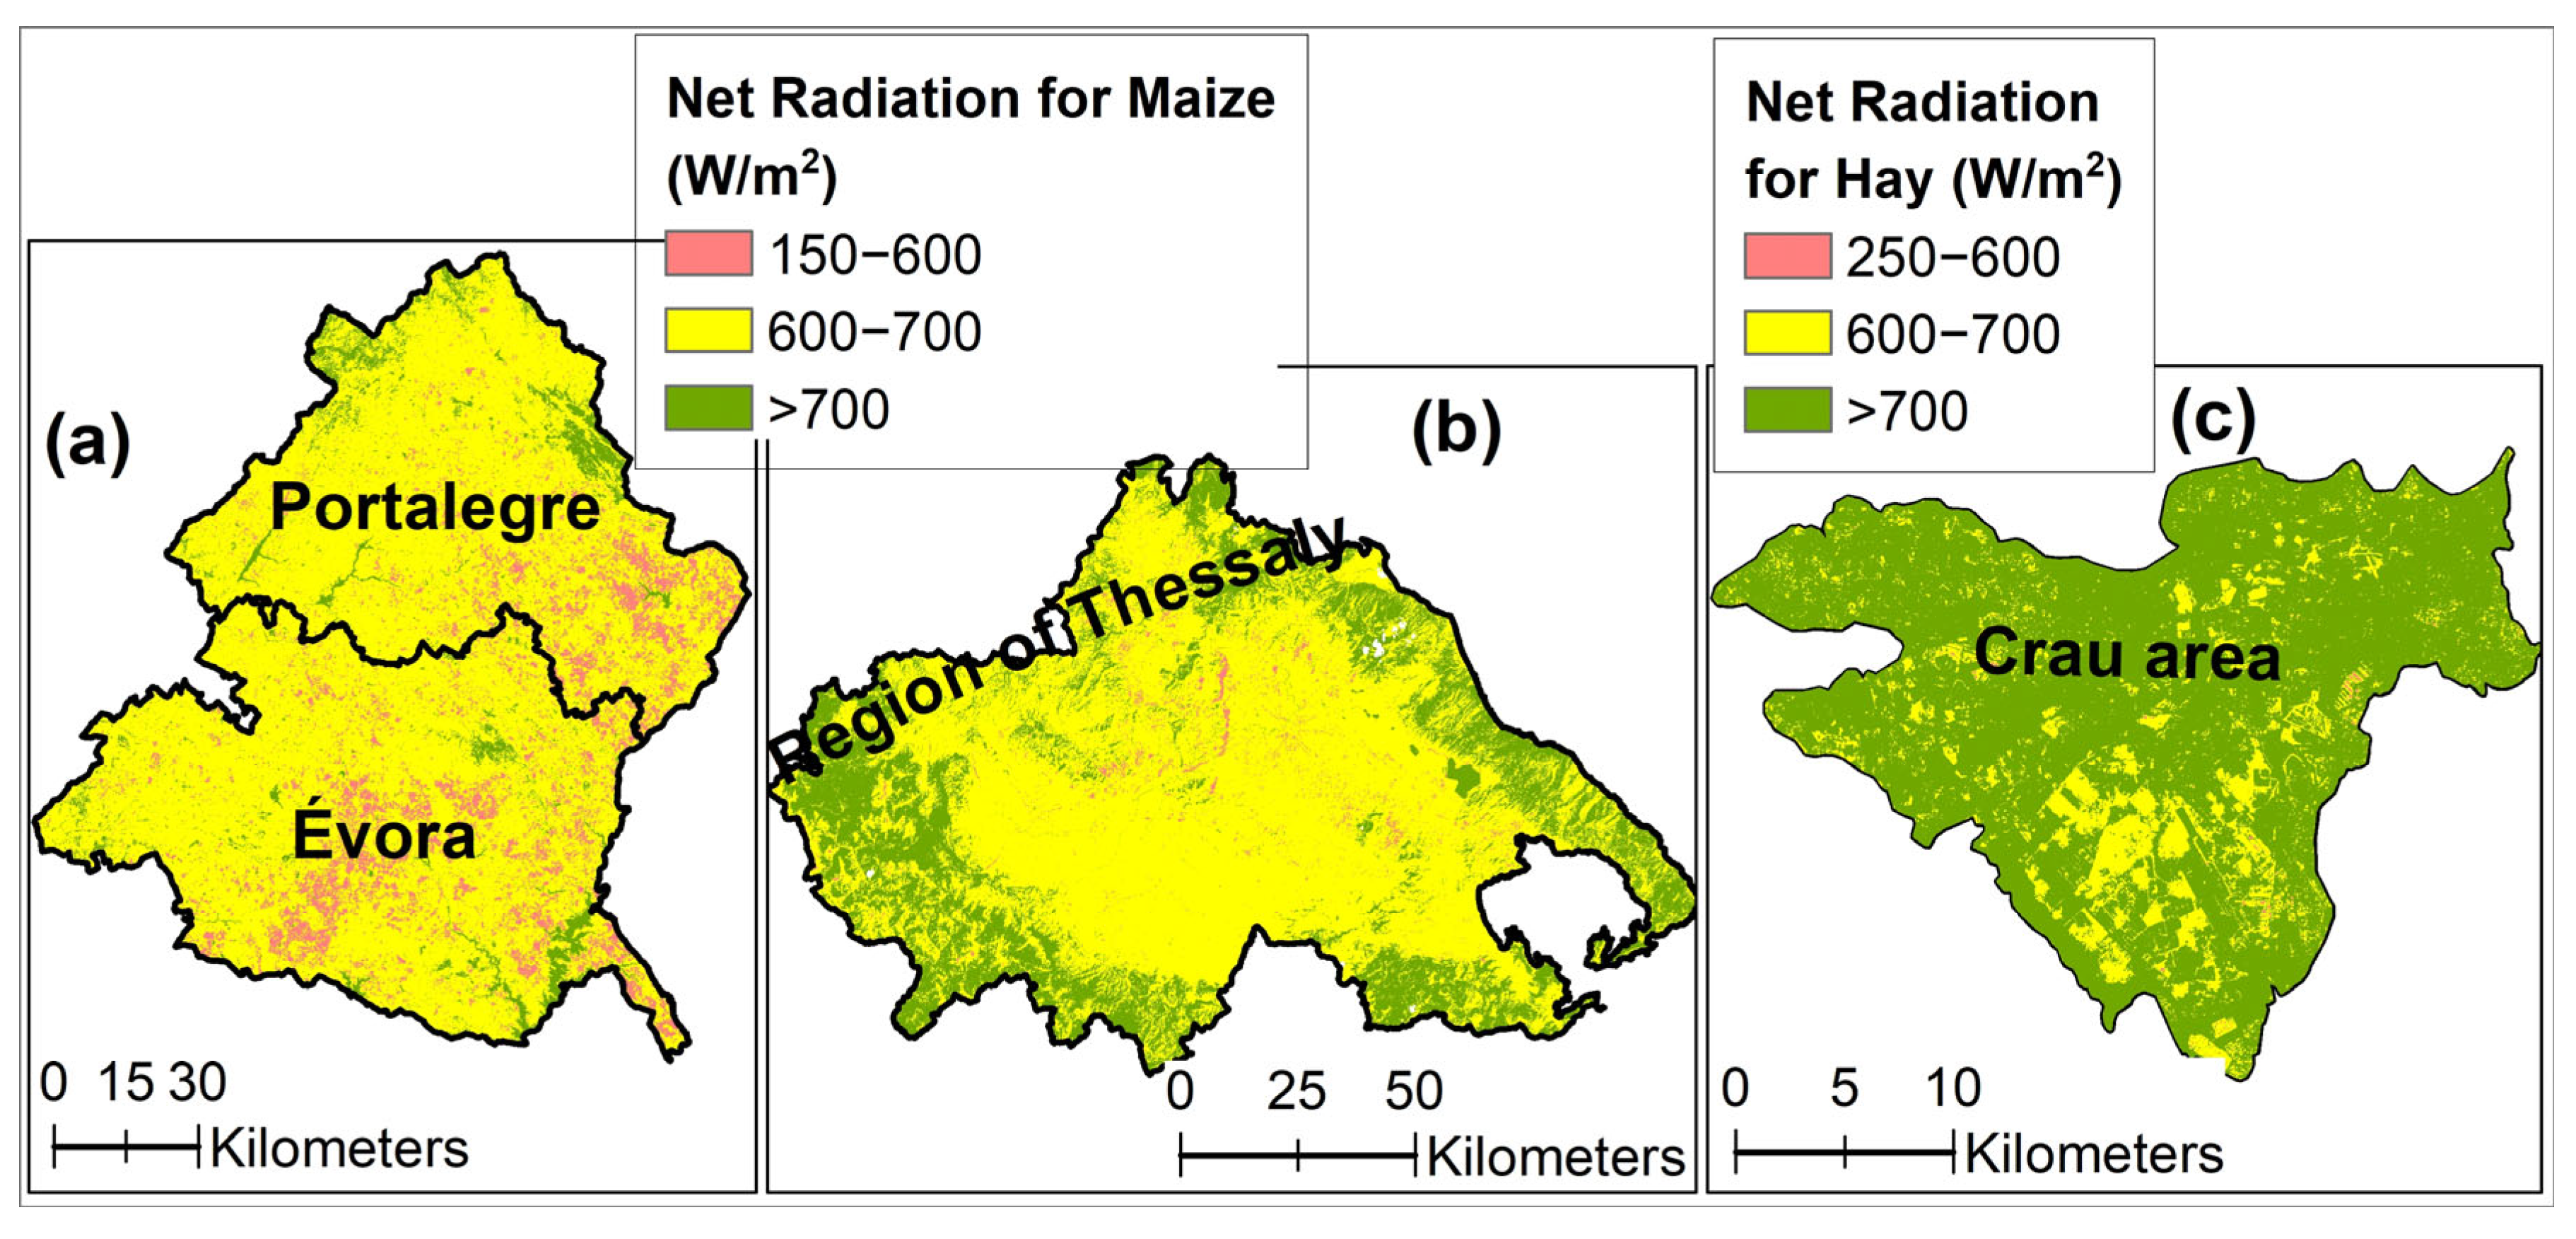
Then, the median net radiation maps for the maize crop in Portugal and Greece study areas are calculated. Finally, the median net radiation map for the Hay in France study area is computed. All the products have a spatial resolution of 30 m. (Figure 14).
III.
Amount of Spring Precipitation
The 20-day median cumulative precipitation amount for the period April to May is calculated, using 41 years CHIRPS data for each of the three study areas (Figure 15).
For the 20-day period, from late April to early May, a precipitation threshold of 20 mm is used as sufficient rainfall for the three study areas. This threshold has been previously determined based on the prevailing climate conditions [32,58,59].
Finally, for non-irrigated (wheat) and irrigated cultivations (maize, hay), a GIS-based multi-criteria analysis model is implemented by applying the specific crop parameters (GDD, Rn, spring precipitation) and the non-crop-specific agroclimatic zoning suitability classes.
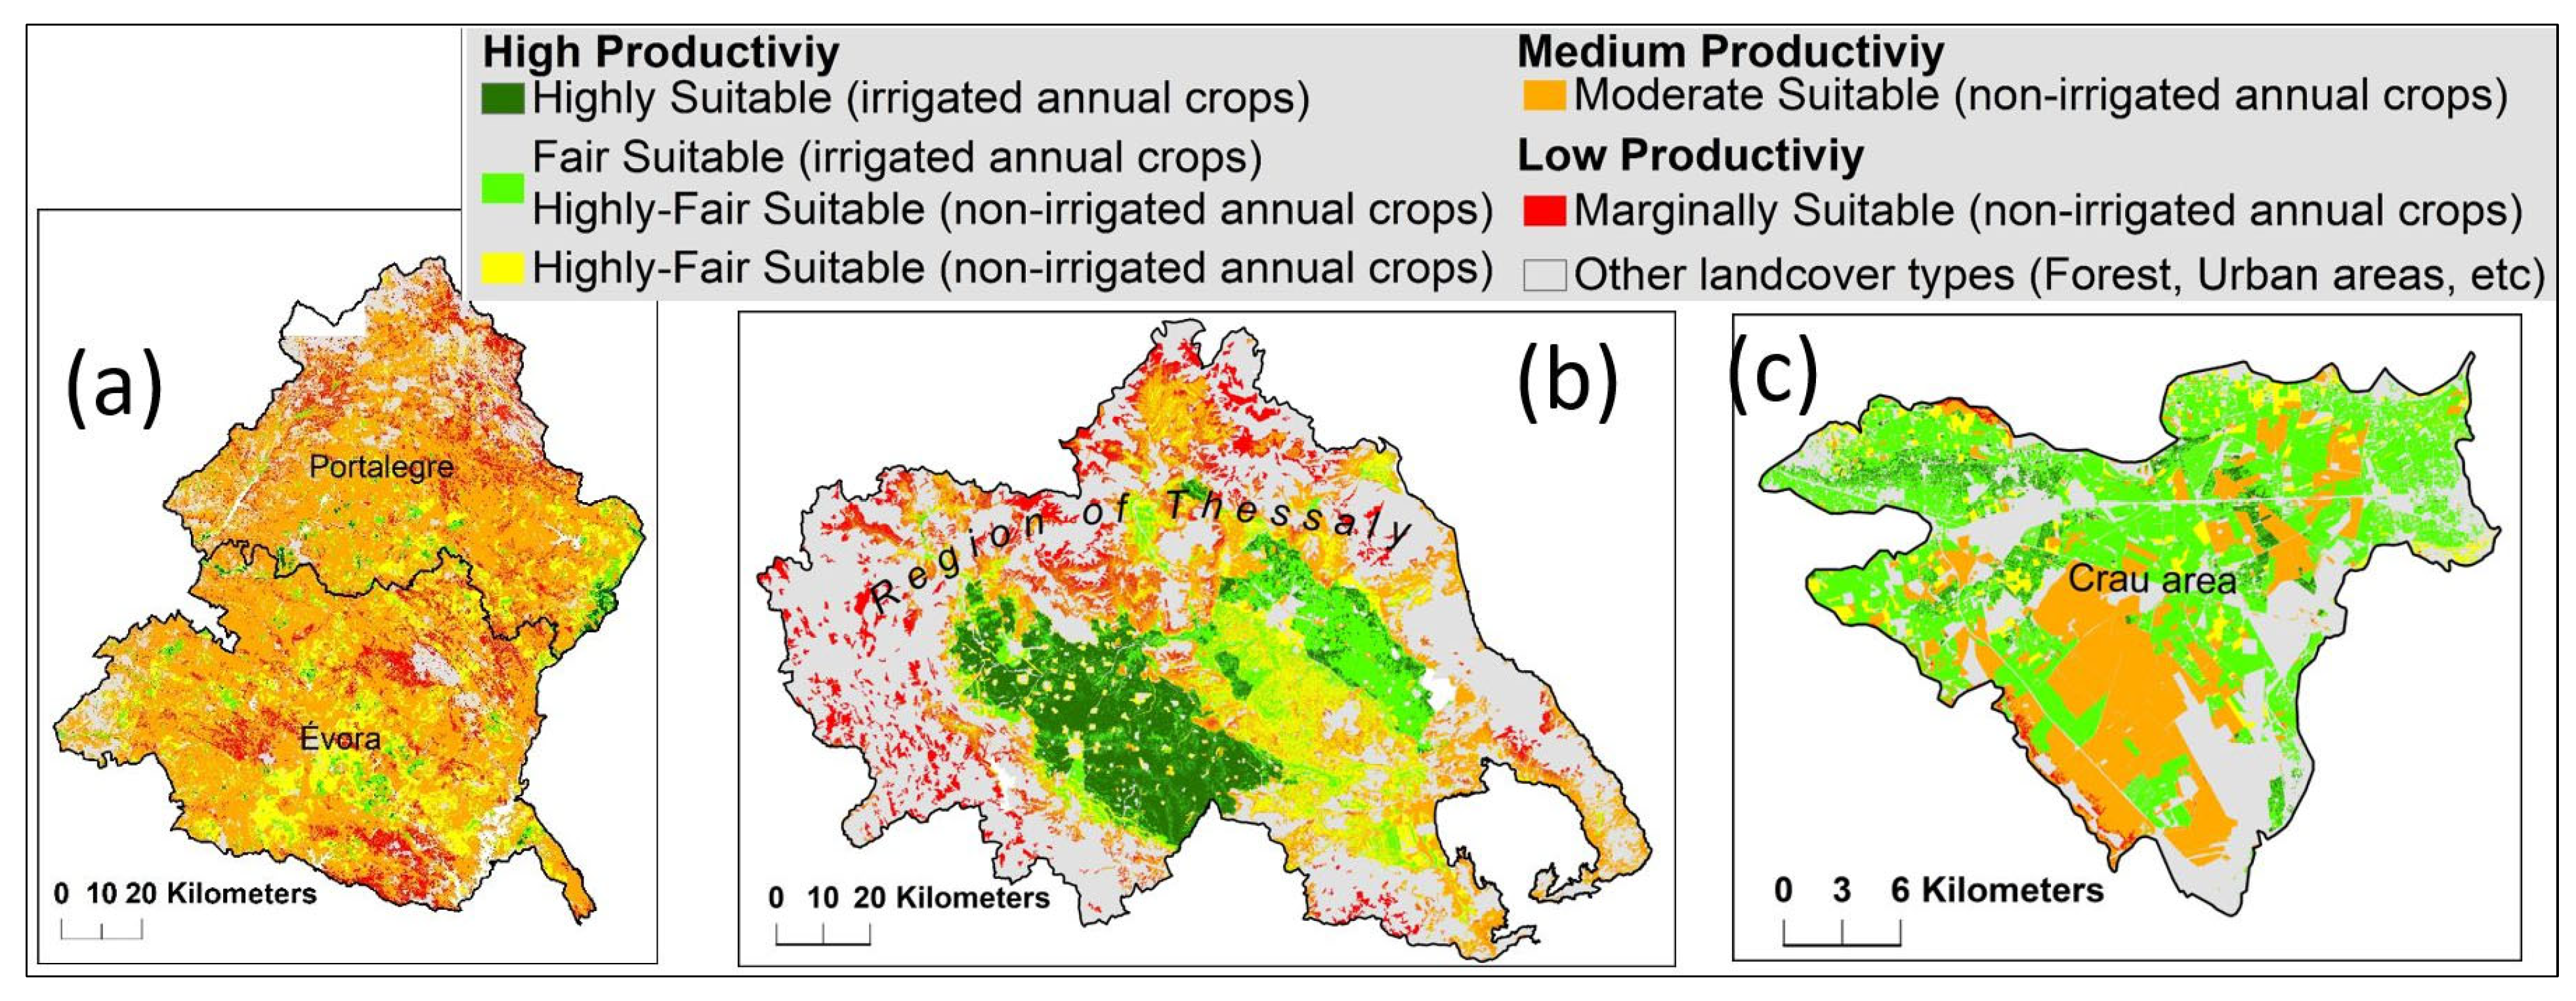
Productivity agroclimatic zoning. This final step involves combining the two crops under investigation, in each of the three study areas, with the aim of optimizing the productivity under current climate and landform conditions. Within this framework three productivity zones (High, Medium, Low) are delineated, for each study area. These zones integrate the suitability classes of both irrigated and non-irrigated crops under consideration.

5. Results

5.1. Implementation of Non-Crop-Specific Agroclimatic Zoning

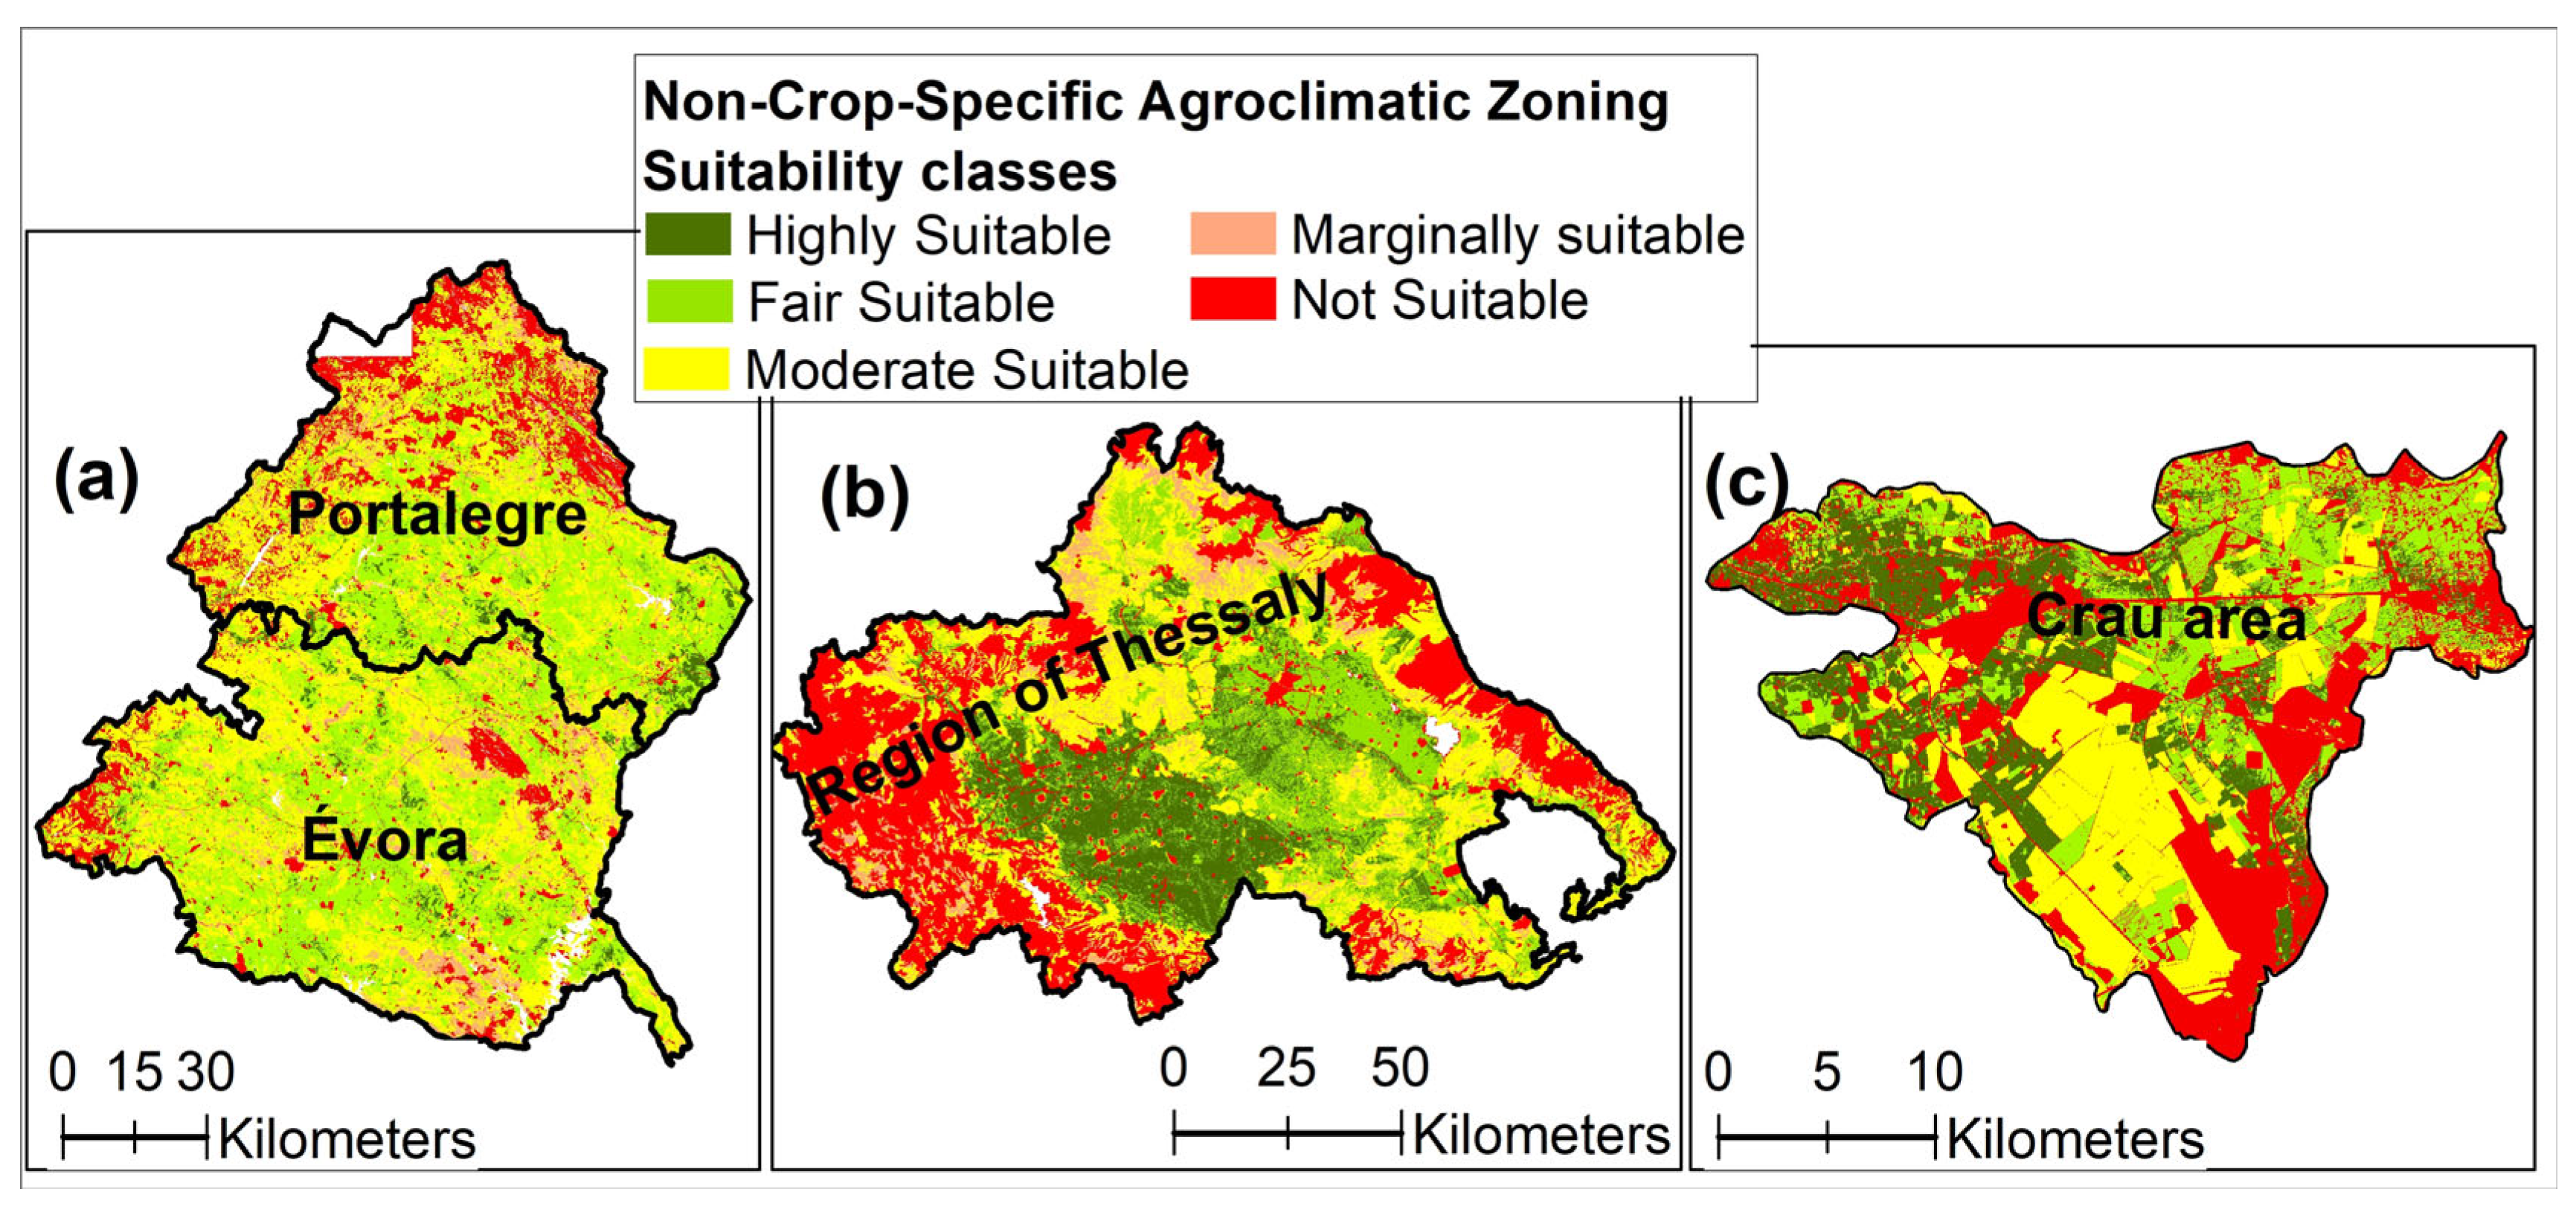
The maps of non-crop-specific agroclimatic zones, for each of the study areas, are created. Each non-crop-specific map contains five agricultural suitability zones, as illustrated in the following image (Figure 16).
Additionally, to compute the area and percentage of each class and study area, statistical analysis is employed (Table 9). Furthermore, for better evaluation and validation of the suitability zones, complementary research is conducted with colleagues in each of the study areas.
In the regions of Évora-Portalegre (Portugal), the most advantageous agricultural suitability zones (highly and fair, meaning high productivity zones), account for approximately the 39% of the total area. In these zones, the primary agricultural products are annual crops, i.e., wheat and maize and woody crops including olive groves, almonds, and vineyards. In the third class (moderate suitable zones, 38%), which occupies 38% of the study area, meadows and agroforestry systems (oak trees) are dominant.
In the Thessaly region (Greece), the most advantageous agricultural suitability zones (highly and fair) account for approximately the 33% of the total area. In these zones, the predominant agriculture are annual crops, including both non-irrigated (durum wheat) and irrigated crops (cotton, maize, etc.). In the third class (moderate zones, 30%), livestock products and woody crops are predominant.
In the Crau area (France), more than the half (52%) of the total area is classified in the first two best agriculture suitability zones (highly and fair). In these zones, the annual irrigated crops, hay, predominate. The third class (moderate zones, 24%) is located on non-irrigated lands.

5.2. Implementation of Crop-Specific Agroclimatic Zoning

5.2.1. Wheat Agroclimatic Zoning

For wheat (non-irrigated crop), the analysis indicates that the parameters GDD and Rn, are, in general, not limiting factors, especially in low altitude areas. Of the three study areas, only the Thessaly region exhibits significant fluctuations in GDD values due to its varied topography. The plain areas assign GDD values of more than 1950 °C, which is suitable for wheat development throughout the growing season. In contrast, at higher altitudes (above 500 m) the GDD values decrease significantly, making the cultivation of wheat unsustainable (Figure 10b1). For the two other case studies, Évora-Portalegre and Crau, most of their areas exhibit optimal GDD values for wheat cultivation (Figure 10a,c).
For the 20-day cumulative precipitation in spring, the analysis highlighted the water deficit in the Thessaly plain. Specifically, the eastern portion of the plain receives less than 25 mm during the critical 20-day period, which is essential for wheat growth and high-yield production (Figure 14b). In contrast, the two other areas, Évora-Portalegre and Crau, indicate enough precipitation (greater than 25 mm) for optimal wheat production during the same period (20-days in April–May) (Figure 14a,c).
In relation to sustainable wheat crop production, the study areas are classified into five distinct crop-specific agroclimatic zones (Figure 17).
For each one of the five wheat suitability zones, the acreage and percentage are calculated (Table 10). The first two zones (Highly and Fair Suitable) are considered the most appropriate for sustainable wheat production (high productivity zones), based on agricultural parameters and adequate water availability. For the Évora and Portalegre regions (Portugal), the two suitability zones are primarily situated in the southern and eastern areas, covering 220,000 hectares (16%). For the Thessaly region (Greece), the best two suitability zones are located at the lowest elevations (Thessaly plain), covering 400,000 hectares, which represents 29% of the total area. Lastly, in the Crau area (France), the two suitable zones cover approximately 24,000 hectares, representing 43% of the study area. Moreover, the next two zones (moderate and marginally suitable, meaning medium and low productivity) comprise substantial portions of the three study areas, accounting for 66% of the Évora and Portalegre regions, 22% of the Thessaly region, and 23% of the Crau area, respectively.

5.2.2. Maize—Hay Agroclimatic Zoning

For the maize and hay (irrigated crops) cultivation, neither topography (altitude, slope) nor GDD constitute limiting factors for the two study areas, namely in Portugal and in France. In contrast, in the Thessaly region (Greece), the plain areas are suitable for growing maize at altitudes that do not exceed 300 to 400 m. In addition, for these cultivations, the water availability during specific time periods is the most prominent factor characterizing each zone.
In relation to sustainable maize and hay crop productions, the study areas are classified into five distinct crop-specific agroclimatic zones (Figure 18).
For each one of the five maize and hay suitability zones, the acreage and percentage are calculated (Table 11). Regarding maize cultivation, the most appropriate zones (highly and fair Suitable, meaning high productivity zones) in the Évora and Portalegre regions are in the southern and eastern areas, covering 50,029 hectares (3.7%). In contrast, maize cultivation in the Thessaly region covers 222,352 hectares (16.23%) along the west–east portion of the plain. Regarding the hay cultivation (first cut), the most appropriate zones (highly and fair suitable) in Crau area are situated predominantly in the northern and northwestern regions. These two zones account for 39% of the total area, representing 21,298 hectares. Moreover, the next two zones (moderate and marginally suitable, meaning medium and low productivity zones) account for substantial areas in the Évora and Portalegre regions (21.5%) and smaller portions in the Thessaly region (0.37%). Finally, in the Crau area, the moderate and marginal suitability zones for hay account for 26% of the total area.

5.2.3. Productivity Agroclimatic Zoning

The three productivity zones, for each of the study areas are illustrated in the following figure (Figure 19).
For every one of these productivity zones, the acreage and the percentage for the maize, wheat, and hay crops are calculated (Table 12). The high productivity zones represent the most suitable areas for cultivations under study, promoting the sustainable use of natural resources and thereby providing greater revenue to farmers. In Portugal and Greece, these study areas account for 16.7% and 29.6%, respectively, of the overall total areas. Specifically, the irrigated crop (maize) can be cultivated on 8395 hectares in the Évora and Portalegre regions and on 142,134 hectares in the region of Thessaly, with no significant limitations related to natural resources. Regarding hay production in the Crau area, high productivity zones cover 1580 hectares. In contrast, several irrigated agricultural zones experience water shortages despite their productivity. This includes 119,171 hectares in Greece, 41,621 hectares in Portugal, and 19,718 in France. For wheat (non-irrigated crop), the high productivity zones cover 174,537 hectares in Portugal, 139,794 hectares in Greece, and 2341 in France, respectively.
The medium productivity zones constitute significant portions of the three study areas and experience moderate to severe water availability limitations, restricting cultivation to non-irrigated crops. In the study areas of Portugal, Greece, and France, these zones cover 55.6% 15.4%, and 23.3 of the total area, respectively.
Finally, low productivity zones face significant constraints due to limited water availability and poor soil fertility. In the study regions of Portugal, Greece, and France, these zones account for 10%, 7.7%, and 0.5% of the total area, respectively.

6. Discussion

The results and mapping of the three-step agroclimatic classification and zoning methodology in the three selected areas seem very satisfactory and promising. In the comparison between the stage-2 and stage-3 agroclimatic mapping, some useful inferences can be drawn. Specifically, in the stage-2 agroclimatic zoning, the first two suitable classes of the high productivity zone cover more than 30% of the total area, in the three study areas (reaching approximately 50% in the Crau area). This is expected in the analysis of the non-crop specific zones; however, this is not an indication that there is an abundance of natural resources, in particular water supply, especially for rainfed crops. Moreover, the size of the area covered in the non-irrigated crop-specific agroclimatic zone (for wheat) is smaller than the non-crop-specific, as expected, of the order of 5% in Greece, 9% in France, and reaching 20% in Portugal. However, in all three areas, and especially in Évora-Portalegre area, the medium agroclimatic productivity zones cover significant portions of the region, which are cultivated by winter crops (cereals, etc.). Nevertheless, the adequacy of natural resources (water, soil) must be considered for farming viability.
Concerning the irrigated crops, the first two suitability classes of high productivity agroclimatic zones show consistently lower values compared to non-irrigated crops in all three study areas. In the Évora-Portalegre area, 3.7% of the land belongs to the two highest suitability classes, while roughly 18% is classified as a moderate suitability zone (Table 10). This type of analysis and, specifically, stage 1 of the agroclimatic zoning methodology, i.e., the microclimate features of the available water resources, indicates the dependence on irrigated crops from the available soil moisture in the route zone, including the amount of precipitation during specific periods. For previous studies in Thessaly [58,59], it is assessed that at least 20 mm of rain are required for the 20-day period in April and May. In the Thessaly region, approximately 20% of the area belongs to the best two suitability zones (Table 10). While the eastern part of the plane achieves higher productivity (per hectare), the western part is classified as more suitable for development. This is explained because the eastern plain, over the past decades, has experienced severe water depletion during the critical maize development period, specifically July and August. In the Crau area, approximately 40% of irrigated hay crop is classified into the two highest suitability classes, primarily located in the northern and northwestern parts of the region (Table 10). The inter-basin feeds extensive open-channel networks, which irrigate this area. Climate change is altering upstream precipitation patterns, while simultaneously increasing water consumption through various human-made activities including industries and drinking water supplies for 300,000 residents. This dual pressure on the water resources results in restrictions and underscores the importance of sustainable water management practices.
Globally, water consumption across all human activities requires optimization. In particular, the agriculture sector is responsible for an estimated 70% of freshwater consumption [77]. Given its substantial water requirements, there is an urgent need to develop more sustainable agricultural systems. The development of agroclimatic zones serves as a response to this issue.
According to the literature, methodological frameworks for agroclimatic zoning have been established; however, there are limitations, which could be mentioned, such as the access to accurate soil databases and the determination of water availability for irrigated crops, namely stage 1 of the agroclimatic zoning methodology. For instance, in France, this includes the suitability of irrigated crops by the existence of infrastructure and the access to groundwater. In such cases, additional indices could be considered [16,78]. For individual crops, e.g., wheat, it may be advisable to adopt a single base temperature. However, it is worth checking whether the above average temperatures affect the Tsum in different regions. Moreover, it is worth examining whether the phenological circle for wheat differs between regions. The proposed methodology offers dual benefits. Primarily, it enables the creation of maps with precise agriculture suitability zones at high spatial resolution (30 m pixel size). Advanced machine learning downscaling interpolation techniques enable accurate crop assessment at farm level. Secondly, cloud-based geospatial platforms, like Google Earth Engine (GEE), allow for rapid global agroclimatic zone mapping, enabling the efficient tracking of changes while mitigating climate change impacts.
Technological advancements are expected to dramatically improve the temporal resolution and provide high precision agroclimatic classification. Specifically, new earth observation satellites, such as the third-generation METEOSAT series and the upcoming Sentinel missions (Sentinel-1D, Sentinel Biomass), will provide reliable data.
Concerning the three-step methodology, it can be optimized particularly through automated improvements that will enhance speed during the crop-specific stage creation. The development of a decision support system, accessible to local stakeholders, is one of the planned future research initiatives. This tool could analyze the given natural resources (water availability, soil type, costs, etc.) to determine optimal crop selection for specific farming areas. Finally, it will ultimately lead to enhancing farming systems’ sustainability.

7. Summary and Conclusions

A three-step agroclimatic classification and zoning methodology has been developed and implemented in three selected distinct agricultural areas in the Mediterranean region, leading to the optimal utilization of natural resources and sustainable crop productivity. First, in step one, hydroclimatic zones were developed based on micro-climatic features over the past 25 years related to limited water availability. According to this, the AI and an index of agricultural drought, namely the VHI, were combined to classify the study areas based on water availability. This classification scheme leads to WLGE zones, which is the outcome of step one. Next, the landform features, the soil types, and the WLGE zones were analyzed together to classify the study areas into agricultural suitability zones, known as non-crop-specific agroclimatic zones. The third and final step incorporates crop growing parameters, including spring precipitation (twenty-day period between 20 April and 10 May), GDD, and Rn, along with the non-crop-specific zones calculated in the previous step two. The three study areas are finally classified into distinct productivity zones (high, medium, low) for crop selection suitable for sustainable agriculture, specifically considering three main crop types, such as non-irrigated winter wheat, irrigated maize, and hay. The first two classes, namely highly and fair suitable zones, are characterized as high-productivity zones for sustainable crop production.
The agroclimatic zones provide valuable insights to farmers, in determining which crops are better in terms of the sustainable use of natural resources (water, soil, energy, etc.). The high resolution and rapid delineation of agroclimatic zones, across nearly the entire globe, enables integration into decision support system (DSS), thereby facilitating sustainable rural management and agriculture viability.

Author Contributions

N.R.D.: Conceptualization, Supervision, Methodology, Funding acquisition, Writing—review and editing. I.F.: Project administration, Methodology, Data curation, Validation, Writing—original draft. G.A.T.: Resources, Formal analysis, Software. M.S.: Methodology, Validation. S.S.: Resources, Formal analysis, Software. N.D.: Supervision, Validation. K.G.: Resources, Data curation. G.B.: Supervision, Resources, Validation. K.D.: Data curation, Validation. M.d.R.C.: Supervision, Resources, Validation. P.P.: Supervision, Resources, Validation. J.R.: Data curation, Validation. All authors have read and agreed to the published version of the manuscript.

Funding

This research was funded by the PRIMA foundation (Partnership for Research and Innovation in the Mediterranean Area), which funded HubIS (Open innovation Hub for irrigation system in Mediterranean agriculture), grant number: 2019-SECTION2-17. Moreover, the research was partially funded by national Greek funds through the Μ16-387 project (M16ΣYN2-00387), titled “Agroclimatic Classification of Thessaly for better agricultural production and restructuring crops.”. Similarly the Portuguese state partially funded.

Data Availability Statement

All data and results are openly available upon contact with the corresponding author Faraslis Ioannis via email at faraslis@uth.gr.

Acknowledgments

The authors would like to thank: (a) the PRIMA foundation (Partnership for Research and Innovation in the Mediterranean Area), which funded the HubIS (Open innovation Hub for irrigation system in Mediterranean agriculture) scientific project, (b) The Hellenic ministry of agriculture for the award provided to partially fund this research project and (c) The FCT – Fundação para a Ciência e Tecnologia, I.P. through the projects reference UID/04129/2025 (LEAF-Linking Landscape Environment, Agriculture and Food, Research Unit) and the LA/P/0092/2020 (Associate Laboratory TERRA).

Conflicts of Interest

The authors declare that they have no known competing financial interests or personal relationships that could have appeared to influence the work reported in this paper.

Abbreviations

The following abbreviations are used in this manuscript:
AEZAgroecological Zoning
AIAridity Index
EOEarth Observation
FAOFood and Agriculture Organization
GDDGrowing Degree Days
GEEGoogle Earth Engine
GISGeographic Information System
LSTLand Surface Temperature
NDVINormalized Difference Vegetation Index
RnNet Radiation
VCIVegetation Condition Index
VHIVegetation Health Index
WLGEWater-Limited Growth Environment

References

  1. Pereira, L.S. Water, agriculture, and food: Challenges and issues. Water Resour. Manag. 2017, 31, 2985–2999. [Google Scholar] [CrossRef]
  2. IPCC. Managing the Risks of Extreme Events and Disasters to Advance Climate Change Adaptation. A Special Report of Working Groups I and II of the Intergovernmental Panel on Climate Change; Field, C.B., Barros, V., Stocker, T.F., Qin, D., Dokken, D.J., Ebi, K.L., Mastrandrea, M.D., Mach, K.J., Plattner, G.-K., Allen, S.K., et al., Eds.; Cambridge University Press: Cambridge, UK; New York, NY, USA, 2012. [Google Scholar]
  3. Flato, G.; Marotzke, J.; Abiodun, B.; Braconnot, P.; Chou, S.C.; Collins, W.; Cox, P.; Driouech, F.; Emori, S.; Eyring, V.; et al. Evaluation of Climate Models. In Climate Change 2013: The Physical Science Basis. Contribution of Working Group I to the Fifth Assessment Report of the Intergovernmental Panel on Climate Change; Stocker, T.F., Qin, D., Plattner, G.-K., Tignor, M., Allen, S.K., Boschung, J., Nauels, A., Xia, Y., Bex, V., Midgley, P.M., Eds.; Cambridge University Press: Cambridge, UK; New York, NY, USA, 2013; Available online: https://elib.dlr.de/95697/ (accessed on 20 July 2024).
  4. Senapati, N.; Stratonovitch, P.; Paul, M.J.; Semenov, M.A. Drought tolerance during reproductive development is important for increasing wheat yield potential under climate change in Europe. J. Exp. Bot. 2018, 70, 2549–2560. [Google Scholar] [CrossRef]
  5. Cammarano, D.; Ceccarelli, S.; Grando, S.; Romagosa, I.; Benbelkacem, A.; Akar, T.; AlYassin, A.; Pecchioni, N.; Francia, E.; Ronga, D. The impact of climate change on barley yield in the Mediterranean basin. Eur. J. Agron. 2019, 106, 1–11. [Google Scholar] [CrossRef]
  6. Van Leeuwen, C.; Friant, P.; Choné, X.; Tregoat, O.; Koundouras, S.; Dubourdieu, D. Influence of climate, soil, and cultivar on terroir. Am. J. Enol. Vitic. 2004, 55, 207–217. [Google Scholar] [CrossRef]
  7. Santos, J.A.; Malheiro, A.C.; Karremann, M.K.; Pinto, J.G. Statistical modelling of grapevine yield in the Port Wine region under present and future climate conditions. Int. J. Biometeorol. 2011, 55, 119–131. [Google Scholar] [CrossRef]
  8. Soares, D.; Paredes, P.; Paço, T.A.; Rolim, J. Projected Bioclimatic Changes in Portugal: Assessing Maize Future Suitability. Agronomy 2025, 15, 592. [Google Scholar] [CrossRef]
  9. Vicente-Serrano, S.M.; Peña-Angulo, D.; Beguería, S.; Domínguez-Castro, F.; Tomás-Burguera, M.; Noguera, I.; Gimeno-Sotelo, L.; El Kenawy, A. Global drought trends and future projections. Philos. Trans. R. Soc. A 2022, 380, 20210285. [Google Scholar] [CrossRef]
  10. Mavi, H.S.; Tupper, G.J. Agrometeorology: Principles and Applications of Climate Studies in Agriculture, 1st ed.; Food Products Press: New York, NY, USA, 2004; p. 381. Available online: https://yangiasr.uz/files/books/2025-05-16-11-10-51_9b75ae2215390fc9970073e3d27b38ba.pdf (accessed on 1 August 2024).
  11. Wall, E.; Barry, S. Climate Change Adaptation in Light of Sustainable Agriculture. J. Sustain. Agric. 2005, 27, 113–123. [Google Scholar] [CrossRef]
  12. Fletcher, J.A.; Hurlbert, M.; Hage, S.; Sauchyn, D. Agricultural Producers’ Views of Climate Change in the Canadian Prairies: Implications for Adaptation and Environmental Practices. Soc. Nat. Resour. 2021, 34, 331–351. [Google Scholar] [CrossRef]
  13. Tow, P.G. Factors in the development and classification of dryland farming systems. In Dryland Farming: A Systems Approach: An Analysis of Dryland Agriculture in Australia; Squire, V., Tow, P., Eds.; Publisher University Press: Sydney, Australia, 1991; pp. 12–17. [Google Scholar]
  14. FAO. Agro Ecological Zoning: Guidelines; Soils Bulletin No. 73; Food and Agriculture Organization of the United Nations: Rome, Italy, 1996; Available online: https://wgbis.ces.iisc.ac.in/energy/HC270799/LM/SUSLUP/FAO/SB73AEZ.PDF (accessed on 5 August 2024).
  15. Fischer, G.; Nachtergaele, F.; Prieler, S.; Teixeira, E.; Toth, G.; Velthuizen, H.; Verelst, L.; Wiberg, D. Global Agro-Ecological Zones (GAEZ v3.0)—Model Documentation; Food and Agriculture Organization of the United Nations: Rome, Italy, 2012; Available online: https://www.gaez.iiasa.ac.at/docs/GAEZ_Model_Documentation.pdf (accessed on 10 August 2024).
  16. Fischer, G.; Nachtergaele, F.O.; Van Velthuizen, H.T.; Chiozza, F.; Franceschini, G.; Henry, M.; Muchoney, D.; Tramberend, S. Global Agro-Ecological Zones v4—Model Documentation; Food and Agriculture Organization of the United Nations: Rome, Italy, 2021; Available online: https://openknowledge.fao.org/items/039f7ec9-98af-49e1-8d24-850122c69bef (accessed on 10 August 2024).
  17. Malheiro, A.; Santos, J.; Fraga, H.; Pinto, J. Climate change scenarios applied to viticultural zoning in Europe. Clim. Res. 2010, 43, 163–177. [Google Scholar] [CrossRef]
  18. Tsiros, E.; Domenikiotis, C.; Dalezios, R.N. Sustainable production zoning for agroclimatic classification using GIS and remote sensing. Időjárás 2009, 113, 55–68. [Google Scholar]
  19. Adnan, S.; Ullah, K.; Gao, S.; Khosa, A.H.; Wang, Z. Shifting of agro-climatic zones, their drought vulnerability, and precipitation and temperature trends in Pakistan. Int. J. Climatol. 2017, 37, 529–543. [Google Scholar] [CrossRef]
  20. Falasca, S.L.; Fresno, M.D.; Waldman, C. Developing an agro-climatic zoning model to determine potential growing areas for Camelina sativa in Argentina. QScience Connect 2014, 2014, 1–11. [Google Scholar] [CrossRef]
  21. Moeletsi, E.M.; Walker, S. A simple agroclimatic index to delineate suitable growing areas for rainfed maize production in the Free State Province of South Africa. Agric. For. Meteorol. 2012, 162–163, 63–70. [Google Scholar] [CrossRef]
  22. Araya, A.; Keesstra, S.D.; Stroosnijder, L.A. New agro-climatic classification for crop suitability zoning in northern semi-arid Ethiopia. Agric. For. Meteorol. 2010, 150, 1057–1064. [Google Scholar] [CrossRef]
  23. Dalezios, N.; Dercas, R.N.; Blanta, A.; Faraslis, I. Remote Sensing in Water Balance Modelling for Evapotranspiration at a Rural Watershed in Central Greece. Int. J. Sustain. Agric. Manag. Inform. 2019, 4, 306–337. [Google Scholar] [CrossRef]
  24. Reddy, S.I. Agroclimatic classification of the semi-arid topics. I. A method for the computation classification variables. Agr. Meteorol. 1983, 30, 185–200. [Google Scholar] [CrossRef]
  25. Badini, O.; Stocle, C.O.; Franz, E.H. Application of crop simulation modeling and GIS to agroclimatic assessment in Burkina. Faso. Agric. Ecosyst. Environ. 1997, 64, 233–244. [Google Scholar] [CrossRef]
  26. Kogan, F.N. Operational space technology for global vegetation assessment. Bull. Am. Meteorol. Soc. 2001, 82, 1949–1964. [Google Scholar] [CrossRef]
  27. Thenkabail, P.S.; Gamage, M.S.D.N.; Smakhtin, V.U. The Use of Remote Sensing Data for Drought Assessment and Monitoring in Southwest Asia, Research Report No. 85; International Water Management Institute: Colombo, Sri Lanka, 2004; pp. 1–34. Available online: https://www.unisdr.org/files/1871_VL102138.pdf (accessed on 5 September 2024).
  28. Dalezios, R.N. Remote Sensing Applications in Environmental and Earth System Science; Taylor & Francis, CRC Group: Boca Raton, FL, USA, 2021; p. 388. ISBN 978-1-138-05456-1. [Google Scholar] [CrossRef]
  29. Dayal, D.; Pandey, A.; Gupta, K.P.; Himanshu, L.S. Multi-criteria evaluation of satellite-based precipitation estimates over agro-climatic zones of India. Atmos. Res. 2023, 292, 106879. [Google Scholar] [CrossRef]
  30. Niemeyer, S. New drought indices. In Drought Management: Scientific and Technological Innovations; Options Méditerranéennes: Série A. Séminaires Méditerranéens, n. 80; López-Francos, A., Ed.; CIHEAM: Zaragoza, Spain, 2008; pp. 267–274. Available online: http://om.ciheam.org/om/pdf/a80/00800451.pdf (accessed on 15 September 2024).
  31. Gorelick, N.; Hancher, M.; Dixon, M.; Ilyushchenko, S.; Thau, D.; Moore, R. Google Earth Engine: Planetary-scale geospatial analysis for everyone. Remote Sens. Environ. 2017, 202, 18–27. [Google Scholar] [CrossRef]
  32. Faraslis, I.; Dalezios, N.R.; Alpanakis, N.; Tziatzios, G.A.; Spiliotopoulos, M.; Sakellariou, S.; Sidiropoulos, P.; Dercas, N.; Domínguez, A.; Martínez-López, J.A.; et al. Remotely Sensed Agroclimatic Classification and Zoning in Water-Limited Mediterranean Areas towards Sustainable Agriculture. Remote Sens. 2023, 15, 5720. [Google Scholar] [CrossRef]
  33. Patel, Ν.R.; Umesh, K.M.; Pande, L.M. Agro-ecological Zoning System-A Remote Sensing and GIS Perspective. J. Agrometeorol. 2000, 2, 1–13. [Google Scholar] [CrossRef]
  34. Kogan, F.N. World droughts in the new millennium from AVHRR-based vegetation health indices. Eos Trans. Am. Geophys. Union. 2002, 83, 557–563. [Google Scholar] [CrossRef]
  35. Masitoh, F.; Rusydi, N.A. Vegetation Health Index (VHI) analysis during drought season in Brantas Watershed. IOP Conf. Ser. Earth Environ. Sci. 2019, 389, 012033. [Google Scholar] [CrossRef]
  36. Brown, T. Design Thinking. Harv. Bus. Rev. 2008, 86, 84–92. [Google Scholar]
  37. McVicar, T.R.; Jupp, D.L.B. The current and potential operational uses of remote sensing to aid decisions on drought exceptional circumstances in Australia. A review. Agric. Syst. 1998, 57, 399–468. [Google Scholar] [CrossRef]
  38. European Space Agency (ESA). 2024. Available online: https://www.esa.int/ (accessed on 26 July 2024).
  39. Ke, Y.; Im, J.; Park, S.; Gong, H. Downscaling of MODIS One Kilometer Evapotranspiration Using Landsat-8 Data and Machine Learning Approaches. Remote Sens. 2016, 8, 215. [Google Scholar] [CrossRef]
  40. Elnashar, A.; Zeng, H.; Wu, B.; Zhang, N.; Tian, F.; Zhang, M.; Zhu, W.; Yan, N.; Chen, Z.; Sun, Z.; et al. Downscaling TRMM Monthly Precipitation Using Google Earth Engine and Google Cloud Computing. Remote Sens. 2020, 12, 3860. [Google Scholar] [CrossRef]
  41. Karbalaye Ghorbanpour, A.; Hessels, T.; Moghim, S.; Afshar, A. Comparison and assessment of spatial downscaling methods for enhancing the accuracy of satellite-based precipitation over Lake Urmia Basin. J. Hydrol. 2021, 596, 126055. [Google Scholar] [CrossRef]
  42. Zuhro, A.; Tambunan, M.; Marko, K. Application of vegetation health index (VHI) to identify distribution of agricultural drought in Indramayu Regency, West Java Province. IOP Conf. Ser. Earth Environ. Sci. 2020, 500, 012047. [Google Scholar] [CrossRef]
  43. Zeng, J.; Zhang, R.; Qu, Y.; Bento, A.V.; Zhou, T.; Lin, Y.; Wu, X.; Qi, J.; Shui, W.; Wang, Q. Improving the drought monitoring capability of VHI at the global scale via ensemble indices for various vegetation types from 2001 to 2018. Weather Clim. Extrem. 2022, 35, 100412. [Google Scholar] [CrossRef]
  44. Kogan, F.N. Remote sensing of weather impacts on vegetation in non-homogeneous areas. Int. J. Remote Sens. 1990, 11, 1405–1419. [Google Scholar] [CrossRef]
  45. Bento, V.A.; Trigo, I.F.; Gouveia, C.M.; DaCamara, C.C. Contribution of Land Surface Temperature (TCI) to Vegetation Health Index: A Comparative Study Using Clear Sky and All-Weather Climate Data Records. Remote Sens. 2018, 10, 1324. [Google Scholar] [CrossRef]
  46. Middleton, N.; Thomas, D. World Atlas of Desertification; Arnold: London, UK; New York, NY, USA; Sydney, Australia; Auckland, New Zealand, 1997; p. 182. Available online: https://wedocs.unep.org/handle/20.500.11822/30300 (accessed on 1 August 2024)ISBN 0340691662.
  47. Kimura, R.; Moriyama, M. Recent Trends of Annual Aridity Indices and Classification of Arid Regions with Satellite-Based Aridity Indices. Remote Sens. Earth Syst. Sci. 2019, 2, 88–95. [Google Scholar] [CrossRef]
  48. FAO. Forest Resources Assessment 1990. Tropical Countries, Forestry Paper 112; Food and Agriculture Organization of the United Nations (FAO): Rome, Italy, 1993; Available online: https://www.fao.org/4/t0830e/t0830e00.htm (accessed on 10 August 2024).
  49. Ashaolu, E.D.; Iroye, K.A. Rainfall and potential evapotranspiration patterns and their effects on climatic water balance in the Western Lithoral Hydrological Zone of Nigeria. Ruhuna J. Sci. 2018, 9, 92–116. [Google Scholar] [CrossRef]
  50. FAO. Guidelines: Land Evaluation for Irrigated Agriculture—FAO Soils Bulletin 55; Food and Agriculture Organization of the United Nations (FAO): Rome, Italy, 1985; Available online: https://www.fao.org/4/x5648e/x5648e00.htm#Contents (accessed on 1 March 2024).
  51. Saaty, T.L. A scaling method for priorities in hierarchical structure. J. Math. Psychol. 1977, 15, 234–281. [Google Scholar] [CrossRef]
  52. McMaster, S.; Wilhelm, G. Growing degree-days: One equation, two interpretations. Agric. For. Meteorol. 1997, 87, 291–300. [Google Scholar] [CrossRef]
  53. Kustas, W.P.; Daughtry, C.S.T. Estimation of the soil heat flux/net radiation ratio from multispectral data. Agric. For. Meteorol. 1990, 49, 205–223. [Google Scholar] [CrossRef]
  54. Sadeghi, M.; Ebtehaj, A.; Guala, M.; Wang, J. Physical connection of sensible and ground heat flux. J. Hydrol. 2021, 602, 126687. [Google Scholar] [CrossRef]
  55. Tasumi, M.; Allen, R.G.; Trezza, R. At-surface reflectance and albedo from satellite for operational calculation of land surface energy balance. J. Hydrol. Eng. 2008, 13, 51–63. [Google Scholar] [CrossRef]
  56. Bastiaanssen, W.G.M.; Menenti, M.; Feddes, R.A.; Holtslag, A.A.M. A remote sensing surface energy balance algorithm for land (SEBAL): 1. Formulation. J. Hydrol. 1998, 212–213, 198–212. [Google Scholar] [CrossRef]
  57. Allen, R.G.; Tasumi, M.; Trezza, R. Satellite-based energy balance for mapping evapotranspiration with internalized calibration (METRIC)-Model. J. Irrig. Drain. Eng. 2017, 133, 380–394. [Google Scholar] [CrossRef]
  58. Dalezios, N.R.; Stamatopoulou, I. The Significance of Meteorological Indices in the Phenology of Maize in Central Greece. In Proceedings of the International Symposium on Applied Agrometeorology-Agroclimatology, Volos, Greece, 24–26 April 1996; Dalezios, N.R., Tzortzios, S., Eds.; University of Thessaly: Volos, Greece, 1996; pp. 411–417. [Google Scholar]
  59. Bampzelis, D.; Domenikiotis, C.; Dalezios, N.R. Phenological and Agrometeorological Indices Related to Wheat Production in Central Greece. In Proceedings of the International Conference on Information Systems in Sustainable Agriculture, Agroenvironment and Food Technology, Volos, Greece, 20–23 September 2006; Dalezios, N.R., Tzortzios, G., Eds.; HAICTA and EC: Volos, Greece, 2006; pp. 795–802. [Google Scholar]
  60. Mylopoulos, N.; Kolokytha, E.; Loukas, A.; Mylopoulos, Y. Agricultural and water resources development in Thessaly, Greece in the framework of new European Union policies. Int. J. River Basin Manag. 2009, 7, 73–89. [Google Scholar] [CrossRef]
  61. Beck., H.E.; Zimmermann., N.E.; McVicar., T.; Vergopolan., N.; Berg., A.; Wood., E.F. Present and future Köppen-Geiger climate classification maps at 1-km resolution. Sci. Data 2018, 5, 180214. [Google Scholar] [CrossRef]
  62. IPMA. Climate Normals—1981–2010. 2024. Available online: https://www.ipma.pt/pt/oclima/normais.clima/1981-2010/#562 (accessed on 5 July 2024).
  63. WRB; Food and Agriculture Organization of the United Nations, International Union of Soil Sciences. World Reference Base for Soil Resources 2014. International Soil Classification System for Naming Soils and Creating Legends for Soil Maps-Update 2015; World Soil Resources Reports No. 106; Food and Agriculture Organization: Rome, Italy, 2015; Available online: https://openknowledge.fao.org/server/api/core/bitstreams/bcdecec7-f45f-4dc5-beb1-97022d29fab4/content (accessed on 5 November 2024).
  64. Instituto Nacional de Estatística (INE). Database. Lisboa, Portugal: Instituto Nacional de Estatística. 2024. Available online: https://www.ine.pt/ (accessed on 5 July 2024).
  65. Instituto Nacional de Estatística (INE). Recenseamento Agrícola 2019, Plataforma de Divulgação Resultados Finais; Instituto Nacional de Estatística: Lisboa, Portugal, 2024; Available online: https://www.ine.pt/scripts/db_ra_2019.html (accessed on 10 July 2024).
  66. INRAE. Base de Données Géographique des Sols de France à 1/1 000 000. 2018. Available online: https://entrepot.recherche.data.gouv.fr/dataset.xhtml?persistentId=doi:10.15454/BPN57S (accessed on 5 November 2024).
  67. Marson, P.; Corre, L.; Soubeyroux, J.M.; Sauquet, E.; Robin, Y.; Vrac, M.; Dubois, C. Explore2–Rapport de Synthèse sur les Projections Climatiques Régionalisées. Technical Report, Meteo France, INRAE, Institut Pierre-Simon Laplace. 2024. Available online: https://hal.inrae.fr/hal-04443633v1 (accessed on 1 November 2024).
  68. Funk, C.; Peterson, P.; Landsfeld, M.; Pedreros, D.; Verdin, J.; Shukla, S.; Husak, G.; Rowland, J.; Harrison, L.; Hoell, A.; et al. The climate hazards infrared precipitation with stations—A new environmental record for monitoring extremes. Sci. Data 2015, 2, 150066. [Google Scholar] [CrossRef]
  69. U.S. Geological Survey. Shuttle Radar Topography Mission (SRTM). 2024. Available online: https://earthexplorer.usgs.gov/ (accessed on 10 June 2024).
  70. Batjes, N.H. ISRIC-WISE Harmonized Global Soil Profile Dataset (Ver. 3.1). Report2008/02, ISRIC—World Soil Information, Wageningen (with Dataset). 2008. Available online: https://www.researchgate.net/publication/37790384_ISRIC-WISE_Harmonized_Global_Soil_Profile_Dataset_Ver_31 (accessed on 5 July 2024).
  71. Copernicus Land Monitoring Service. CORINE Land Cover 2018. European Environment Agency (EEA). 2018. Available online: https://land.copernicus.eu/pan-european/corine-land-cover/clc2018 (accessed on 15 July 2024).
  72. Matzarakis, A.; Dafinka, I.; Balafoutis, C.; Makrogiannis, T. Climatology of growing degree days in Greece. Clim. Res. 2007, 34, 233–240. [Google Scholar] [CrossRef]
  73. FAO. Annexes, AquaCrop Version 7.1. Reference Manual; Food and Agriculture Organization of the United Nations: Rome, Italy, 2023; Available online: https://openknowledge.fao.org/server/api/core/bitstreams/1479f444-c112-4faa-b3dc-bc73b0637332/content (accessed on 5 August 2024).
  74. Gihan, M.; Trolard, F.; Bourrié, G.; Gillon, M.; Tronc, D.; Charron, F.A. Long-Term Data Sequence (1960–2013) to Analyse the Sustainability of Hay Quality in Irrigated Permanent Grasslands Under Climate Change. Am. J. Agric. For. 2016, 4, 140–151. [Google Scholar] [CrossRef]
  75. Breazeale, D.; Kettle, R.; Munk, G. Using Growing Degree Days for Alfalfa Production. Fact Sheet 99-71. University of Nevada, Cooperative Extension. Available online: https://www.haytalk.com/attachments/uofn-growth-degree-days-pdf.31362/ (accessed on 1 July 2024).
  76. Merot, A.; Bergez, J.E.; Wallach, D.; Duru, M. Adaptation of a functional model of grassland to simulate the behaviour of irrigated grasslands under a Mediterranean climate: The Crau case. Eur. J. Agron. 2008, 29, 163–174. [Google Scholar] [CrossRef]
  77. Ingrao, C.; Strippoli, R.; Lagioia, G.; Huisingh, D. Water scarcity in agriculture: An overview of causes, impacts and approaches for reducing the risks. Heliyon 2023, 9, e18507. [Google Scholar] [CrossRef]
  78. Bandyopadhyay, S.; Jaiswal, R.K.; Hegde, V.S.; Jayaraman, V. Assessment of land suitability potentials for agriculture using a remote sensing and GIS based approach. Int. J. Remote Sens. 2009, 30, 879–895. [Google Scholar] [CrossRef]
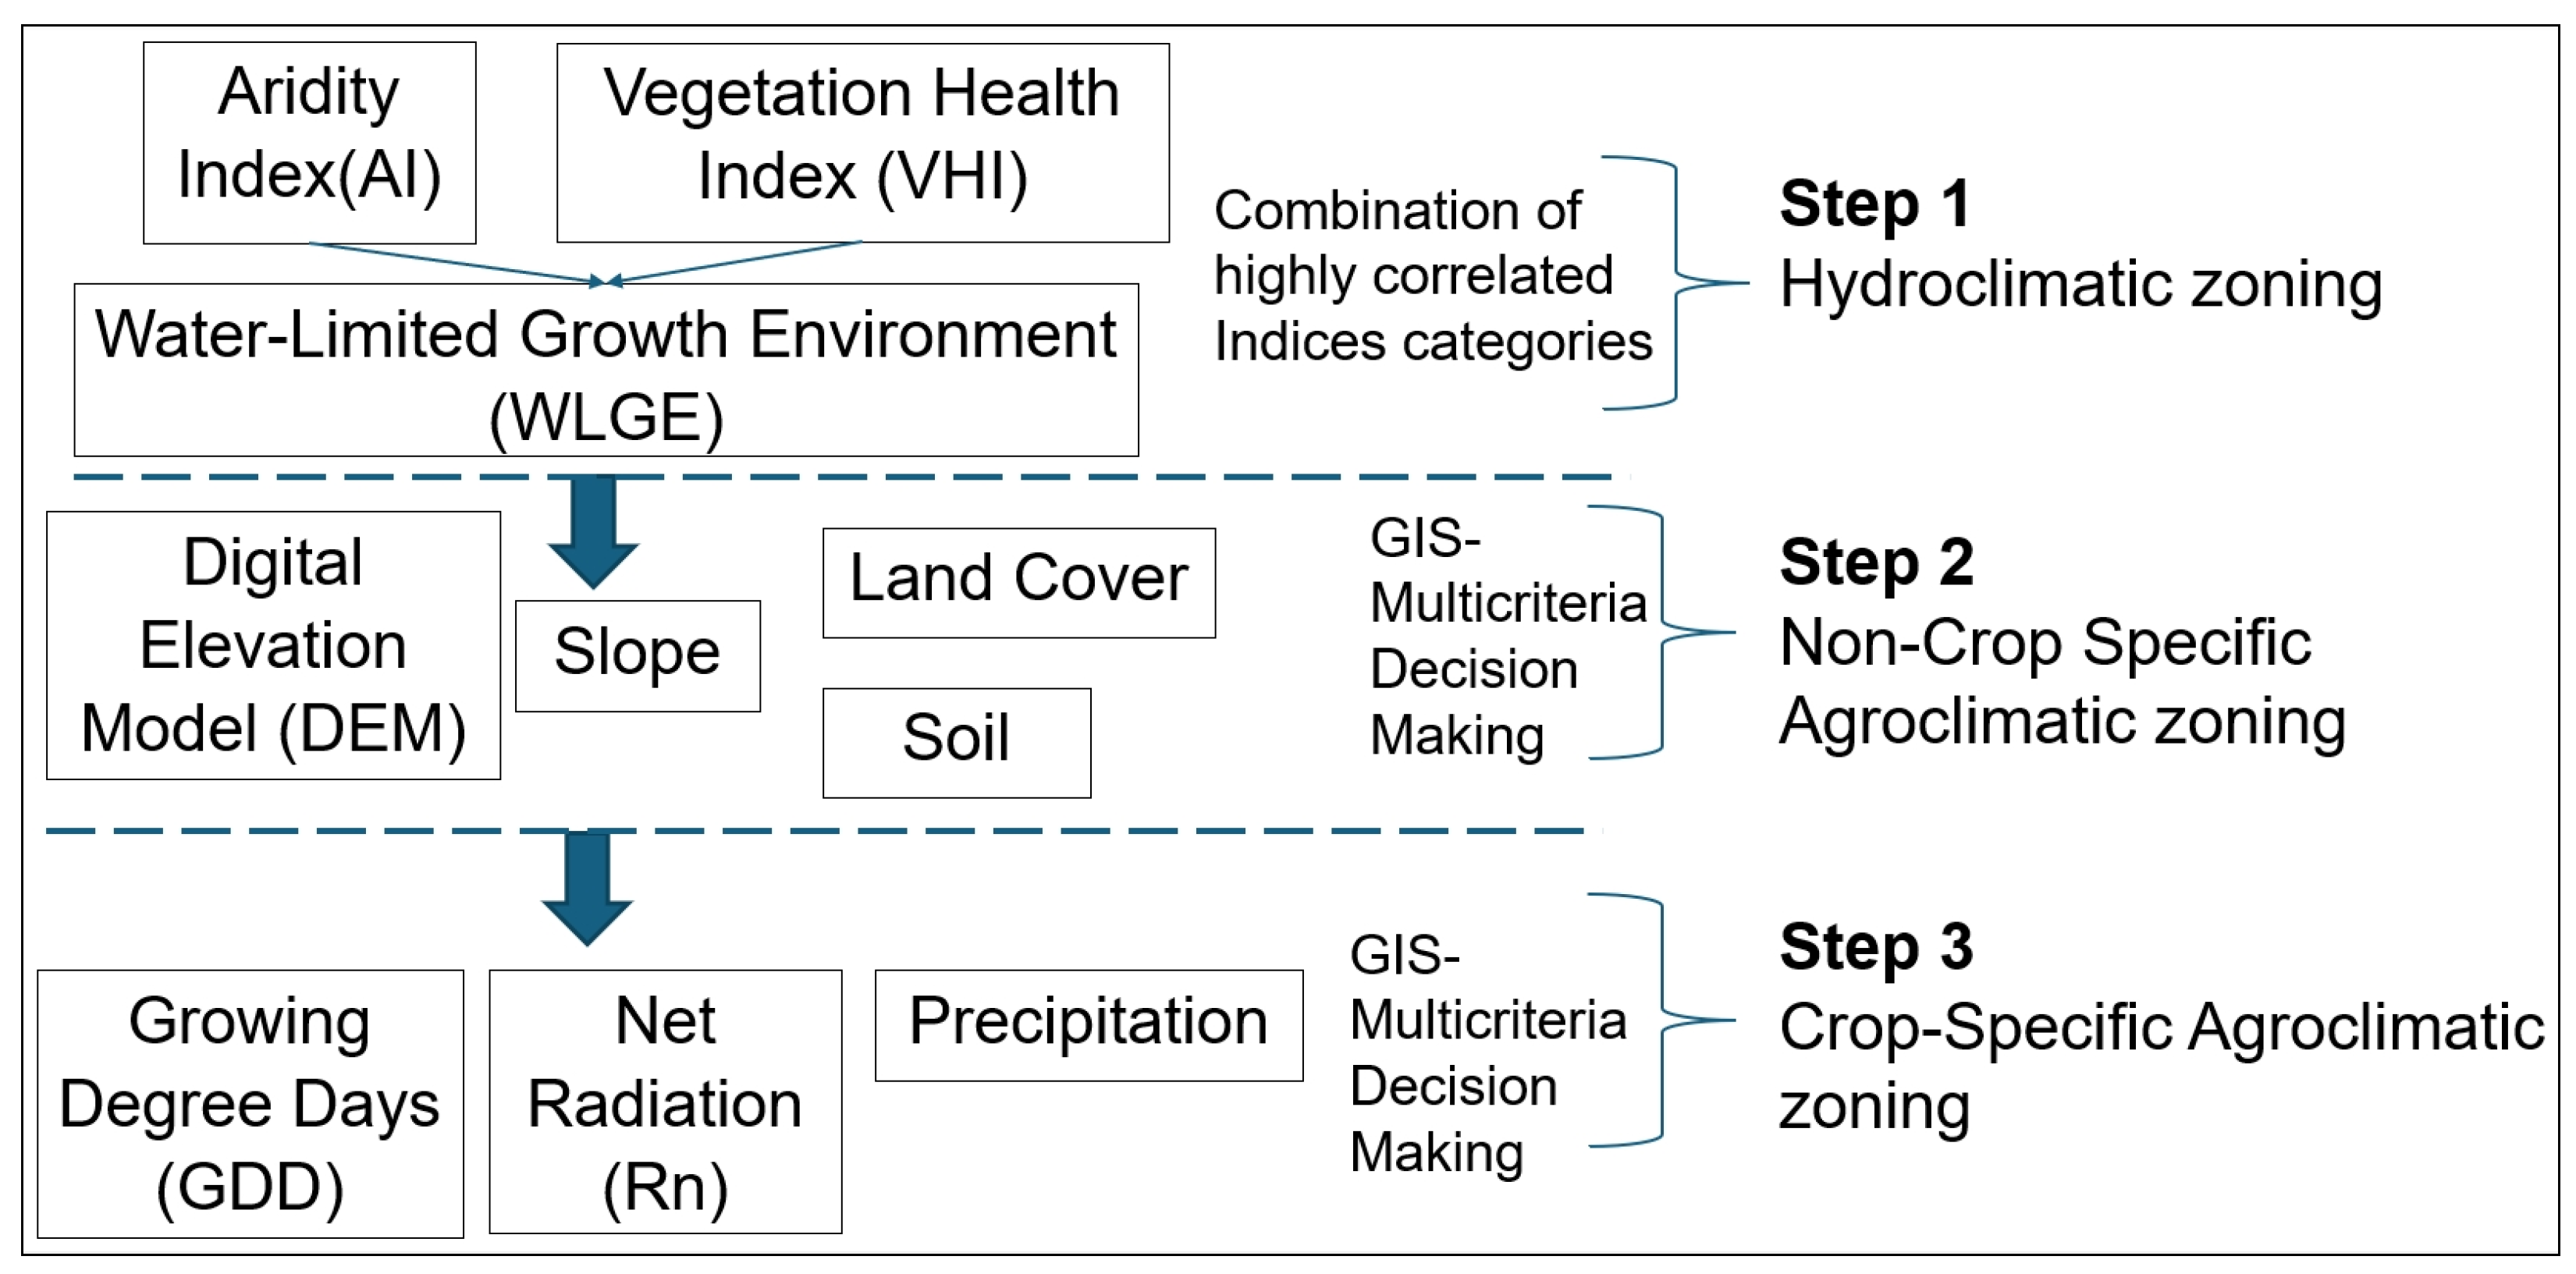
Figure 1. The three-step methodology for agroclimatic zoning.
Land 14 02147 g001
Figure 2. Multi-criteria decision-making model for non-crop specific agroclimatic classes (Orange color indicates the criteria, and yellow indicates the ranking of each one).
Land 14 02147 g002
Figure 3. Study area: region of Thessaly in Greece.
Land 14 02147 g003
Figure 4. Study area: Évora-Portalegre in Portugal.
Land 14 02147 g004
Figure 5. Study area: Crau area in France.
Land 14 02147 g005
Figure 6. Correlation between GDD and elevation (meters) datasets.
Land 14 02147 g006
Figure 7. Agricultural drought classes of median VHI: (a) Portugal, (b) Greece, and (c) France study areas.
Land 14 02147 g007
Figure 8. Aridity Index classes in the (a) Portugal, (b) Greece, and (c) France study areas.
Land 14 02147 g008
Figure 9. WLGE classes in the (a) Portugal, (b) Greece, and (c) France study areas.
Land 14 02147 g009
Figure 10. Spatial variables for the non-crop-specific zoning in the (a1a3) Portugal, (b1b3) Greece, and (c1c3) France study areas.
Land 14 02147 g010
Figure 11. GDD for wheat calculated using the MODIS 8-day composite data, scaled down to a 30 m spatial resolution in the (a) Portugal, (b) Greece, and (c) France study areas.
Land 14 02147 g011
Figure 12. GDD derived from the MODIS 8-day downscaling product (30 m pixel size) for two crops: (1) maize: (a) Portugal and (b) Greece and (2) hay, the first cut in the (c) France study area.
Land 14 02147 g012
Figure 13. Net radiation maps for wheat in the (a) Portugal, (b) Greece, and (c) France study areas.
Land 14 02147 g013
Figure 14. Net radiation maps for maize in (a) Portugal and (b) Greece and for hay (first cut) in (c) France.
Land 14 02147 g014
Figure 15. From 20 April to 10 May (20 days) cumulative precipitation (mm) in the (a) Portugal, (b) Greece, and (c) France study areas.
Land 14 02147 g015
Figure 16. Non-crop-specific agroclimatic zoning for the (a) Portugal, (b) Greece, and (c) France study areas.
Land 14 02147 g016
Figure 17. Crop-specific agroclimatic zoning for wheat cultivation in three study areas: (a) Portugal, (b) Greece, and (c) France.
Land 14 02147 g017
Figure 18. Crop-specific agroclimatic zoning for maize cultivation in two study areas: (a) Portugal and (b) Greece and for hay in (c) France.
Land 14 02147 g018
Figure 19. Three productivity zones are established for each one of the study areas: (a) Portugal, (b) Greece, and (c) France.
Land 14 02147 g019
Table 1. Drought severity classes for VHI.
Severity ClassesValues
Extreme0–10
Severe10–20
Moderate20–30
Mild30–40
No drought>40
Table 2. Climate classification scheme for Aridity Index.
ClassesThreshold Values
Very HumidAΙ ≥ 1.5
Humid1.0 ≤ AΙ < 1.5
Sub-Humid0.65 ≤ AI < 1.0
Dry Sub-Humid0.5 ≤ AI < 0.65
Semi-Arid0.2 ≤ AI < 0.5
Arid0.05 ≤ AI < 0.2
Hyper-AridAI < 0.05
Table 3. Hydroclimatic WLGE classes.
Vegetation Health IndexAridity IndexWLGE Classes
Extreme droughtHyper-AridLimited environment
Severe droughtAridLimited/Partially limited environment
Moderate droughtSemi-Arid/Dry Sub-HumidPartially limited environment
Mild droughtSub-HumidPartially limited/No limitations environment
No droughtHumid/Very HumidNo limitations
Table 4. Land suitability classification agriculture.
Suitability ClassesSuitability Classes (FAO)Code (FAO)Description of FAO Agricultural Suitability Classes
Highly SuitableHighly SuitableS1no or non-significant limitations
Fair SuitableModerately SuitableS2mmoderate limitations, due to water deficiency, which reduce productivity
Moderate SuitableModerately SuitableS2moderately severe constraints that diminish productivity or benefits or that necessitate increased input requirements
Marginally suitableMarginalN1significant limitations exist overall, rendering the current land use only marginally justifiable
Not suitablePermanently not suitableN2limitations of such magnitude that they entirely preclude any possibility of the intended use
Table 5. Evaluation and suitability categories for each agricultural suitability criterion.
CriteriaClassesRatingsAgricultural Land Suitability
Digital elevation model (DEM) in meters0–20010Highly Suitable
200–3009Fair Suitable
300–4007Moderate Suitable
400–6005
600–8003Marginally Suitable
>8000Not Suitable
Slope %0–2 (Nearly level)10Highly
2–8 (Gently sloping)9Fair Suitable
8–16 (Moderately sloping)7Moderate Suitable
16–30 (Strongly sloping)5
30–45 (Steep)3Marginally Suitable
>45 (Very steep)0Not Suitable
Soil mapFluvisols10Highly Suitable
Cambisols9Fair Suitable
Luvisols9
Calcisols5Moderate Suitable
Regosols5
Kastanozems3Marginally suitable
Leptosols0Not suitable
Land use/
Land cover
Annual crops10Highly Suitable
Arboriculture9Fair Suitable
Grasslands3Marginally Suitable
Human-made areas/Forests/Water bodies, etc.0Not Suitable
WLGE zoningNo limitations10Highly Suitable
Partially limited/No limitations9Fair Suitable
Partially limited7Moderate Suitable
Limited/Partially limited5
Limited environment3Marginally Suitable
Table 6. The weighted overlay of each variable for the MCD model in each study area.
VariablesWeight %
GreecePortugalFrance
WLGE303040
Land Use/Land Cover202020
Soil Types202020
DEM151010
Slope152010
Table 7. Winter and irrigated crops in the study areas.
Study AreasCrop Type
Portugal (Évora and Portalegre)Winter wheat—Maize
Greece (Thessaly)Winter wheat—Maize
France (Crau)Winter wheat—Hay
Table 8. The optimal range GDD required for crop development.
Study AreaCrop TypeTbase (°C)Tsum °C-dGrowing Season
PortugalWinter wheat02105January–15 June
Maize101800April–September
GreeceWinter wheat42105January–15 June
Maize101800April–September
FranceWinter wheat02105January–15 June
Hay5.6700March–May
Table 9. Non-crop-specific acreage zones in the three study areas.
Non-Crop-Specific Agroclimatic Zones Évora-Portalegre in Portugal Thessaly Region in Greece Crau Area in France
Acreage (Ha)%Acreage (Ha)%Acreage (Ha)%
Highly Suitable35,7002.7205,62515.015,14627.9
Fair Suitable486,30836.1250,57218.313,18424.3
Moderate Suitable514,20438.2405,95029.612,82023.6
Marginally Suitable76,2805.788,6486.5210.0
Not Suitable233,30817.3419,20530.613,12924.2
Total1,345,8001001,370,00010054,300100
Table 10. The land area and proportion of suitability zones for sustainable wheat cultivation in the three study areas.
Wheat Crop-Specific Agroclimatic Zones Évora-Portalegre in Portugal Thessaly Region in Greece Crau Area in France
Acreage (Ha)%Acreage (Ha)%Acreage (Ha)%
Highly Suitable44,1023.28126,9809.2710,33719.04
Fair Suitable175,89613.07274,12020.0113,30324.5
Moderate Suitable756,18456.19210,62915.3712,65223.30
Marginally Suitable136,31010.13105,4267.72690.50
Not Suitable233,30817.33652,84547.6517,73932.66
Total1,345,8001001,370,00010054,300100
Table 11. The acreage and proportional distribution of suitability zones for sustainable production of maize and hay crops across the three study regions.
Crop-Specific Agroclimatic Zones Évora-Portalegre in Portugal Thessaly Region in Greece Crau Area in France
Acreage (Ha) Maize%Acreage (Ha) Maize%Acreage (Ha) Hay (1st Cut)%
Highly Suitable83960.62144,14810.5215802.91
Fair Suitable41,6333.0978,2045.7119,71836.31
Moderate Suitable243,54018.1037140.2714832.73
Marginally Suitable47,1633.5013880.1012,77923.53
Not Suitable1,005,06874.691,142,54683.4018,74034.52
Total1,345,8001001,370,00010054,300100
Table 12. The extent and proportional representation of productivity zones for the cultivation of maize, wheat, and hay crops within the three study regions.
Productivity Agroclimatic Zones Évora-Portalegre in Portugal Thessaly Region in Greece Crau Area in France
Acreage (Ha)%Acreage (Ha)%Acreage (Ha)%
High Productivity
Highly Suitable (irrigated annual crops)83940.6144,14810.515802.9
Fair Suitable (irrigated annual crops)
Highly–Fair suitable (non-irrigated annual crops)
41,6213.178,2045.719,71836.3
Highly–Fair suitable (non-irrigated annual crops)174,53713.0178,83113.023414.3
Medium Productivity
Moderate Suitable (non-irrigated annual crops)748,72655.6210,54515.412,65223.3
Low Productivity
Marginally Suitable non-irrigated annual crops)134,86110.0105,4277.72690.5
Not Suitable237,66117.7652,84547.717,74032.7
Total1,345,8001001,370,00010054,300100
Disclaimer/Publisher’s Note: The statements, opinions and data contained in all publications are solely those of the individual author(s) and contributor(s) and not of MDPI and/or the editor(s). MDPI and/or the editor(s) disclaim responsibility for any injury to people or property resulting from any ideas, methods, instructions or products referred to in the content.