Abstract
Under the national “dual-carbon goal” and the pressing demand for sustainable development, eco-city construction and carbon reduction have become critical issues on China’s urban development agenda, closely aligned with the United Nations Sustainable Development Goals (SDGs). However, most studies focus on regional assessments, lacking national-scale evaluations and spatial heterogeneity analysis of obstacles. This study analyzes 280 Chinese cities using a multi-level evaluation system. Analytic hierarchy process (AHP) and entropy weight methods determine index weights, while the comprehensive evaluation method assesses ecological levels. The obstacle diagnosis model identifies key obstacle factors, and geographically weighted regression (GWR) analyzes spatial heterogeneity, computing carbon intensity to explore relationships with eco-cities development. The findings reveal that (1) the ecological level of Chinese cities exhibits a regional pattern of “high in the east, low in the west”; (2) the primary index-level obstacle factors include total per capita water resources, per capita green space area, college full-time faculty per 10,000 people, the proportion of tertiary industries in gross domestic product (GDP), and college students per 10,000 people; at the element level, the main obstacles are environmental bases, social services, economic potential, and innovative capacity; (3) the GWR model reveals that eastern regions should increase water resources, central regions expand green space, and western and northeastern regions enhance innovative capacity and social services to foster balanced development; and (4) carbon intensity follows a “low in the east, high in the west” pattern, with eco-cities scores significantly negatively correlated with carbon intensity (r = −0.235, p < 0.01). This study provides the first comprehensive national-scale evaluation of eco-cities development, providing reference for the construction of eco-cities.
1. Introduction
Global urbanization is one of the most significant transformations experienced by human society in the modern era [1]. UN-Habitat’s 2020 World Cities Report projects that by 2030, over 60.4% of the world’s population will live in urban areas. Approximately 75% of global energy production and consumption is concentrated in metropolitan regions [2]. With the rapid development of the global economy and technology, human activities have increasingly impacted the ecological environment, leading to the overexploitation of environmental resources and causing an imbalance in ecosystems [3,4,5]. In particular, urban ecosystems have faced unprecedented challenges under the accelerated urbanization process, including biodiversity loss, the urban heat island effect, and the continuous rise in carbon emissions [6,7,8]. Striking a balance between city development and ecological conservation has become a critical issue that demands urgent solutions worldwide. To address these city ecological challenges, constructing an eco-city has emerged as a key strategy [9,10]. The goal of an eco-city is not only to relieve present environmental pressures by enhancing resource utilization efficiency and raising environmental standards but also to integrate social, economic, and ecological goals, thereby advancing sustainable development. Furthermore, the development of eco-cities is closely linked to the United Nations Sustainable Development Goals (SDGs), particularly in the areas of climate action (SDG 13), sustainable cities and communities (SDG 11), and responsible consumption and production (SDG 12) [11]. With the growing global consensus on carbon neutrality targets, eco-cities also play a crucial role in achieving low-carbon transitions and reducing carbon emissions [12,13].
The concept of eco-cities dates back to Ebenezer Howard’s 19th-century “garden city” theory, which reflected the regional ecologism [14]. In 1971, UNESCO’s “Ecologically Integrated Study of Human Settlements” further advanced this idea [15]. Early research focused on conserving natural landscapes and ecosystems [16,17] but later shifted to human ecosystem sustainability. For instance, Tsolakis and Anthopoulos [18] used system dynamics to assess eco-cities’ sustainability, while Meng et al. analyzed ecological and economic development using the relative development coefficient [9]. As the eco-cities theory evolves, studies increasingly focus on evaluation systems, offering scientific frameworks for construction and management [18].
Current research on eco-cities primarily focuses on three aspects. First, researchers have explored the fundamental attributes of eco-cities and established corresponding index systems. For example, some studies have constructed eco-city index systems encompassing economic, natural, and social dimensions from the perspective of city complex ecosystems and their subsystems [19]. Some researchers have also proposed a comprehensive evaluation system from the structural perspective of city ecosystems, based on the three dimensions of structure, function, and degree of coordination [20]. Hu et al. used three Asian cities as case studies to illustrate the impacts of eco-city development approaches in different countries using the 3Es framework (i.e., Efficiency, Economy, and Effectiveness) and identified four transformational prerequisites for eco-city development in Asia [10]. However, a literature review revealed that a comprehensive evaluation system for eco-cities at the national scale is still lacking. For example, Tan et al. constructed an evaluation framework for ecological livability in Zhuzhou City. However, the selected indicators mainly reflected local characteristics, which restricts their transferability to other urban settings [21].
Second, researchers have focused on determining index weights, a key factor in evaluation reliability. Weighting methods fall into three categories: subjective, objective, and weight-learning. Subjective methods, such as the analytic hierarchy process (AHP) [22] and the Delphi method [23], utilize expert knowledge but are prone to subjective bias. Objective methods, including the entropy method [24], variation coefficient method [25], and fuzzy evaluation method [26], derive weights from data properties, ensuring objectivity but potentially introducing bias with low-quality or uneven data. Advances in AI have enabled weight-learning approaches, where genetic algorithms [27] and random forests [28] dynamically adjust weights for greater flexibility. However, these methods require large, high-quality datasets for training. Zhao et al. applied machine learning models such as Random Forest and XGBoost to determine indicator weights in urban suitability analysis, emphasizing the reliance on high-quality, large-scale spatial data and the complexity of ranking/model selection [29].
Third, from the perspective of evaluation methods, researchers have investigated how to advance eco-city construction, with key approaches including multi-criteria decision models, machine learning, and coupled coordination evaluation [6,30,31]. Multi-criteria decision-making models, such as technique for order preference by similarity to an ideal solution (TOPSIS) and AHP, effectively integrate multi-dimensional indicators and are widely used [32]. For example, Xu et al. utilized AHP to develop a “Happy River Index” evaluation model to evaluate six major rivers in Shaoxing City [33]. Meanwhile, machine learning methods, including random forests and support vector machines, have gained traction for handling large-scale, nonlinear data. Zhang et al. used a random forest-based “ecological-productive-living space” framework to analyze ecological environment quality [34]. Additionally, the coupled coordination evaluation model has played an essential role in assessing complex systems’ interaction and coordinated development. Yang et al. used this model with a geographic information system (GIS) to evaluate Chongqing’s development, proposing four sustainable models: eco-industry, culture–tourism fusion, industry–city fusion, and living service [35]. Li et al. conducted a micro-scale evaluation of habitability in the Sino-Singapore Tianjin Eco-city based on multi-source data, demonstrating that significant spatial heterogeneity exists even within a single eco-city [36].
Despite significant progress in eco-cities research in the past, several issues and limitations remain in current studies: (1) Existing index systems have been designed for specific regions, making it difficult to meet the needs of eco-cities construction in a globalized context; (2) current methods for determining weights are limited, with subjective weighting methods being prone to human bias, objective weighting methods requiring high-quality data, and weight-learning methods being computationally complex and inefficient in dynamic contexts; and (3) while existing evaluation methods have excelled in integrating multidimensional data and assessing coordination among systems, most methods have focused on macro-level analysis and have struggled to address local heterogeneity.
As the world’s second-largest economy, China strives to achieve sustainable development while maintaining economic growth. However, several issues arising from the industrialization process continue to pose significant challenges to China’s economic and environmental health. Annual financial losses in China from environmental contamination have reached approximately 10% of its GDP, according to World Bank estimates [37]. The situation negatively affects economic growth and threatens social stability and public health. Therefore, promoting eco-cities’ construction is crucial for China to realize its sustainable development targets.
Based on this, this study focuses on 280 cities in China, aiming to examine the ecological level of Chinese cities in the context of sustainable development and to explore the obstacles to advancement. The study seeks to address three key aims: (1) To construct a comprehensive index system covering multiple levels, including economic, environmental, and social, and to combine the advantages of subjective and objective weighting methods, thereby proposing a comprehensive eco-cities evaluation framework to assess the ecological development levels of Chinese cities. (2) Based on the obstacle diagnosis model, this study aims to quantitatively analyze the main obstacle factors of city ecological levels to provide development directions for improving the level of China’s eco-cities. (3) Based on the geographically weighted regression (GWR) model, this study introduces spatial location effects into index weights, dynamically adapts to regional characteristics, and provides regionalized development suggestions for co-cities development.
This paper integrates diverse data sources and methodologies to assess the ecological level of Chinese cities and analyze influencing factors and spatial characteristics. First, the eco-cities evaluation index system is established by reviewing frameworks, selecting evaluation methods, and identifying indicators. Second, AHP and entropy weight methods determine index weights, and the TOPSIS model quantifies ecological levels of each city. The obstacle diagnosis model identifies key obstacle factors hindering the improvement of eco-cities level, and their impacts are analyzed. To explore the spatial characteristics of eco-cities, the GWR model reveals their spatial heterogeneity. Additionally, the study examines the link between eco-cities development and carbon intensity, analyzing its impact and potential mechanisms.
2. Study Area and Data
2.1. Study Area
As one of the fastest-growing countries in the world, China’s urbanization level has increased significantly in recent decades. The degree of urbanization in China has grown from 10.6% in 1949 to 66.2% in 2023. There are significant differences in China’s geographic regions and economic development. Eastern, central, and western areas have different development characteristics, and these differences are not only reflected in the economy, but also in the carrying capacity of ecosystems and the focus of eco-city construction. The ecological construction of cities in the economically developed regions in the east focuses on low-carbon transition and innovative city development, the central region focuses on ecological restoration and optimization of soil and water resources, and the western region emphasizes resource protection and ecological obstacle functions [38]. Based on this, a total of 280 representative cities were selected for analysis, each with a population exceeding 500,000 and a gross domestic product (GDP) of more than 20 billion yuan (Figure 1). Cities of this scale generally possess more comprehensive statistical data, relatively complete ecological management systems, and greater comparability in socioeconomic development. While this selection inevitably excludes smaller and county-level cities, it provides a more robust framework for evaluating eco-city development. Moreover, these 280 cities were typical cities in China and provided sufficient samples for assessing China’s eco-cities level.
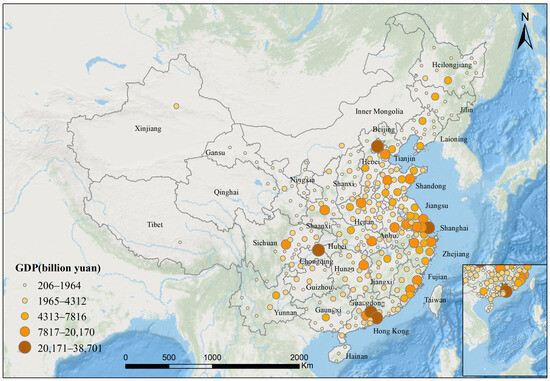
Figure 1.
Location of study cities.
2.2. Data Source
2.2.1. Social Statistics
Due to data availability, the study collected data from 2020. The data were sourced from the China Statistical Yearbook, China Environmental Statistical Yearbook, China Energy Statistical Yearbook, China Water Resources Statistical Yearbook, provincial and municipal statistical yearbooks, and ecological environment reports of individual cities. Some index data were obtained through secondary calculations, while gaps in the data were filled through linear interpolation or by referencing values from adjacent years [39].
2.2.2. Carbon Emission Data
The carbon emission data used in this study were obtained from the Earth Big Data Science Data Center, https://data.casearth.cn/ accessed on 5 December 2024, specifically the 2011–2020 China Mainland Surface Carbon Emissions Dataset [40]. As this dataset does not include carbon emission data for Lhasa, the subsequent analysis of the relationship between eco-cities scores and carbon intensity excludes this city.
3. Methods
The key steps of the methodological framework applied in this paper are shown in Figure 2.
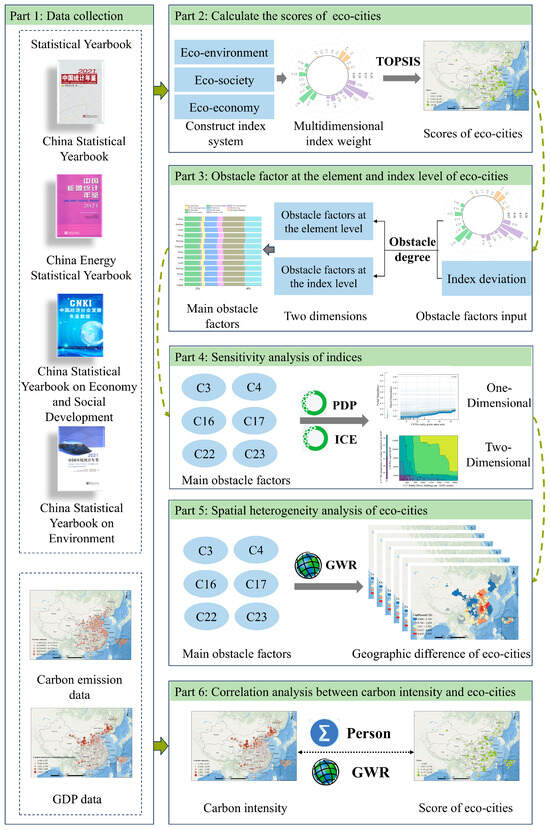
Figure 2.
The study workflow shows key steps in the evaluation of eco-cities.
3.1. Construction of the Index System
The concept of eco-cities emphasizes the construction of a composite ecosystem characterized by a high degree of synergy among nature, society, and economy [41]. The construction of an index system is crucial for achieving a comprehensive and objective evaluation of the eco-cities’ development level. The selection of evaluation indicators in this study was guided by the Indicators for Ecological Civilization Construction Demonstration Areas (Municipalities) released by China in 2024. By incorporating relevant research findings [6,18,42], an evaluation index system containing three layers of dimension-element-index is constructed (Table 1). The dimension layer consists of eco-environment, eco-society, and eco-economy. The element layer includes 11 indicators, such as environmental bases, infrastructure, and economic bases, ensuring the coverage of core aspects of eco-cities evaluation. The index layer consists of 24 indicators, including the total per capita water resources, college full-time faculty per 10,000 people, and per capita GDP, to assess eco-cities’ development levels quantitatively.

Table 1.
Eco-cities evaluation index system of 280 cities in China.
The eco-environment dimension considered the impact of city development on ecology through four aspects: city layout, environmental bases, pollution, and governance. City layout emphasized the balance between land use and ecosystems, with rational planning being a prerequisite for sustainability. Environmental bases, measured by indicators like water resources and green space per capita, reflected eco-environmental quality and sustainable development potential. Environmental contamination used industrial waste discharge as the primary metric, highlighting the pressures industrial activities placed on ecosystems. Environmental management assessed the treatment rate of industrial waste, showcasing the city’s capacity to address environmental challenges. These elements underscored the ecological environment’s role in eco-cities development and sustainability [18].
The eco-society dimension was reflected through indicators assessing infrastructure development and ecological awareness. Per capita road area and public transport vehicles per 10,000 persons indicated transportation adequacy and green commuting. Average wage per employee and full-time university teachers per 10,000 persons indicated social fairness and cultural development, reflecting a city’s ecological societal capacity.
The eco-economy dimension assessed the city’s economic development quality. Per capita GDP reflected economic vitality, while the proportion of tertiary industries in GDP reflected industrial structure and innovation potential. The proportion of education expenditure assessed the city’s support for innovation [18]. These indicators provided a key reference for evaluating eco-economic development.
3.2. Eco-Cities Evaluation
Evaluating eco-cities’ levels requires assigning index weights, making the selection of the weighting method crucial [43]. Common evaluation methods included subjective and objective weighting, and using either method alone might be too subjective or too objective. Therefore, we used a comprehensive weighting method that combined both.
The entropy weighting method objectively assigned reliable weights by accurately reflecting the indicators’ discriminative ability [44]. This method determined weights by measuring the information entropy of indicators, capturing their differences and uncertainties. First, a judgment matrix was constructed, forming pairwise comparison matrices for each level of indicators. The judgment matrix , is expressed as follows:
In Equation (1), denotes the importance of relative to .
Second, the indicators are normalized, with the calculation for positive indicators as follows:
Negative indicators are calculated as follows:
The normalization matrix is then obtained . and are the original and normalized scores, respectively, for the i-th indicator in the j-th city, and and denote the maximum and minimum values, respectively.
Then, the information entropy of each indicator is calculated,
where n is the number of cities, , , satisfy .
Finally, objective weights for the indicators were determined,
The AHP, a subjective weighting tool, quantified the influence of components across levels, making it suitable for multi-objective and multi-criteria system evaluations [44]. Emphasizing qualitative analysis, it relied on the evaluator’s understanding of the problem. First, the indicators are normalized.
Next, a consistency test is performed and the consistency index is calculated as follows:
where is the maximum eigenvalue of the judgment matrix, and n is the order of the judgment matrix.
where RI is the average random consistency index. When is less than 0.1, the judgment matrix is considered to meet the consistency requirement. Finally, after passing the consistency test, the maximum eigenvector corresponding to is derived, and the weights of the indicators are obtained through normalization.
Therefore, a combination of subjective and objective weights was used for the index weights [45]. This combination effectively reduced subjective bias and thus produces fairer results. The weights determined by entropy weighting and hierarchical analysis are and , respectively. The calculation of the combined weights integrating the subjective and objective weights of the n criteria is expressed as follows:
After determining weights, the TOPSIS method was applied for multi-objective decision analysis. Using the normalized data matrix, TOPSIS identified the best and worst reference points and calculated the distance of each alternative to these two benchmarks. This method avoided data distribution and sample size limitations, evaluating strengths and weaknesses based on proximity to the optimal program [46]. This study combined entropy weighting and AHP to determine index weights and evaluate eco-city levels, and then calculated the level of the eco-cities of each evaluation object. First, the weighted normalized decision matrix is constructed,
Next, determine the positive ideal solution and the negative ideal solution ,
Then, the distance from the index value to and is calculated for each evaluated object,
Finally, the proximity of each evaluation object to the ideal solution is calculated,
3.3. Construction of Obstacle Diagnosis Model
Eco-cities evaluation aimed to judge the ecological level of cities. To enhance eco-city development, this study employs an obstacle diagnosis model to identify key constraints and to provide a targeted decision-making basis for the development of different eco-cities [47]. The formula for the diagnostic model of the disorder was as follows:
In Equation (15), denotes the degree of obstacles in the ith city at the j-th index, representing the relative contribution of each indicator to the total obstacle effect; , denotes the contribution of obstacles; , denotes the deviation of the index from the development goal. A higher indicates that the corresponding indicator exerts a greater hindering effect on eco-city development. When > 10%, the indicator is considered a major obstacle [48]. This allows the relative obstacle degree of each indicator to be compared across cities, thus identifying key constraints that most hinder eco-city progress.
The arithmetic mean of the obstacle levels for each city type is the average obstacle level:
where n is the number of cities, the average barrier index reflects the overall contribution of each indicator to ecological constraints across different city types, serving to identify key obstacle factors.
3.4. K-Means Clustering Method
After calculating the obstacle degree, the K-Means clustering method was applied to classify cities according to their obstacle characteristics. K-Means is a distance-based unsupervised clustering algorithm that partitions objects into several groups to maximize within-cluster similarity and minimize between-cluster dissimilarity. The algorithm iteratively assigns cities to clusters and updates cluster centers until convergence [49]. The mathematical expressions and detailed iterative procedures are provided in Appendix B.1.
3.5. Partial Dependence Plot and Individual Conditional Expectation
To examine how obstacle factors influence the ecological development of cities, sensitivity analysis was conducted using PDP and ICE. PDP illustrates the global average marginal effect of an indicator, while ICE captures heterogeneous effects at the individual city level. Together, they reveal both general and city-specific influences [50]. Detailed mathematical formulations of the PDP and ICE functions are provided in Appendix B.2.
3.6. Geographically Weighted Regression Model
This study applied the GWR model to analyze the spatial correlation between eco-cities levels and obstacle factors, providing a basis for the development of regionalized eco-cities strategies. Extending ordinary least squares regression, GWR integrates geospatial information and estimates localized regression parameters via weighted least squares [51], effectively capturing variable relationship spatial heterogeneity. The GWR is formulated as:
where is the eco-cities score of city i, is the intercept term, is the regression coefficient of the independent variable k in city i, is the latitude and longitude coordinates of city i, is the value of independent variable k in city i, and is the residuals of city i. The golden search method is used to compute the neighborhood, a continuous Gaussian kernel function to compute the spatial weight coefficients, and the double dichotomy method for local weighting.
To address potential multicollinearity among the variables, OLS regression analysis was applied to examine the variance inflation factor (VIF) of the selected indicators. In addition, Moran’s I was employed to test the spatial autocorrelation of the residuals, ensuring the appropriateness of using the GWR model for further analysis [12].
4. Result and Analysis
4.1. Result of the Calculation of Index Weights
Index weights were derived using the entropy method and AHP (Figure 3). The indicators with relatively larger weights included: college students per 10,000 people (0.198) > college full-time faculty per 10,000 people (0.136) > the proportion of tertiary industries in GDP (0.096) > total per capita water resources (0.075) > per capita green space area (0.072) > public library holdings per 10,000 people (0.007). These indicators exerted a pronounced effect on the sustainable development of eco-cities.
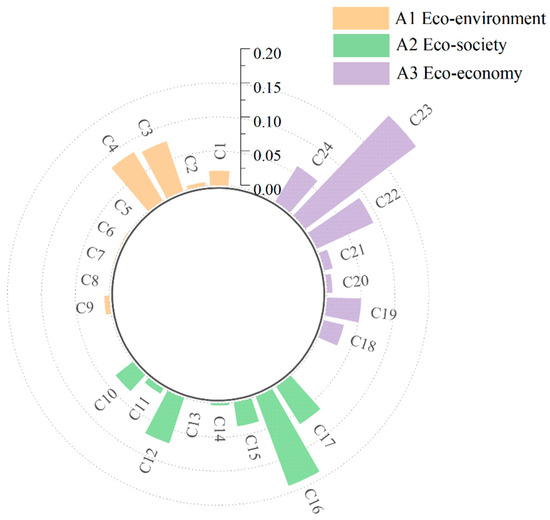
Figure 3.
Multidimensional eco-cities evaluation index weights.
4.2. Evaluation of the Ecological Level of Chinese Cities
This study measured and ranked the levels of eco-cities based on spatial patterns. Based on Formulas (1)–(14), weights were determined using the entropy and AHP. Eco-cities’ level scores for 280 Chinese cities were calculated with the TOPSIS model (Figure A1).
Spatial visualization effectively captured spatial disparities in eco-cities levels, revealing regional imbalance in ecological civilization and highlighting potential areas for development focus. The ecological levels of Chinese cities exhibited a characteristic ‘higher in the east, lower in the west’ pattern (Figure 4). This disparity was closely related to regional economic development and natural resources [47]. According to the boxplot, eco-cities scores decrease in the following order: eastern cities, northeastern cities, central cities, and western cities. High-level eco-cities were mainly concentrated in provincial capitals and eastern coastal areas with developed technology and economy. These cities were economically advanced and had strong advantages in the construction of eco-cities. Medium-level eco-cities were mostly distributed across the northeastern and central parts of the country, with favorable resource conditions and gradually improving economic development. Low-level eco-cities were primarily found in economically underdeveloped areas, particularly in the northwest regions such as Gansu and Qinghai, where many cities had scores below 0.050.
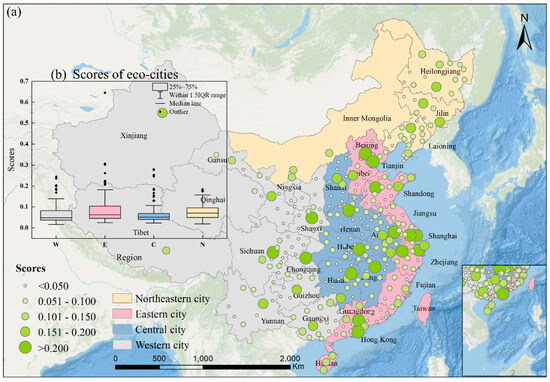
Figure 4.
Ecological level of Chinese cities (a) and regional distribution of eco-city scores (b). (In sub-figure b, the box plots show the distribution of eco-city scores across four major regions: W (Western), E (Eastern), C (Central), and N (Northeastern). The box shows the interquartile range (IQR), with the middle line marking the median, whiskers stretching to 1.5 times the IQR, and dots showing outliers.).
4.3. Diagnosis of Eco-Cities Level Obstacle Factors
4.3.1. Obstacle Factors at the Index Level
Based on the obstacle diagnosis model, analysis of the average obstacle degree revealed that the most common obstacle factors included C23 (with an average obstacle degree of 19.4%), C22 (19%), C16 (13%), C4 (7.1%), and C3 (9.8%) (Figure 5a). The combined degree of the top five obstacle factors was generally over 60%, indicating that these factors had the most significant impact among the 24 basic indicators.

Figure 5.
Major obstacle factors affecting the ecological level of different types of cities in China ((a–d) represent the average obstacle degree values for the index levels of different types of cities).
To explore ecological development differences, the K-Means clustering method based on obstacle degree was employed to determine city types. We tested values of K from 2 to 9 to decide the optimal number of clusters, and assessed clustering quality using the silhouette coefficient and the elbow method [52]. Both indicators indicated that K = 3 was the optimal solution. Therefore, the K-Means clustering method based on obstacle degree ultimately identified three types of cities. These types were then analyzed to characterize cities with different obstacle patterns (Figure 6) and classified into Class I, Class II, and Class III (Figure 7). The study found that the eco-cities level was closely related to the city scale. Class I cities served as regional economic, population, and geographical centers. Some were highly developed, while others were advancing rapidly with support from national policies. Many of these cities grew within established economic clusters or through initiatives such as the “Western Development” strategy. Class II cities were generally medium-sized or less developed, often with distinctive regional economies. Some relied on traditional industries or natural resources, while others transitioned toward high-tech and service sectors. Several of these cities also evolved into regional economic or transportation hubs, benefiting from their positions within transport networks. Class III cities consisted mainly of small- and medium-sized urban areas largely dependent on traditional industries. Nevertheless, some developed around ports and transportation hubs, leveraging their logistical advantages.
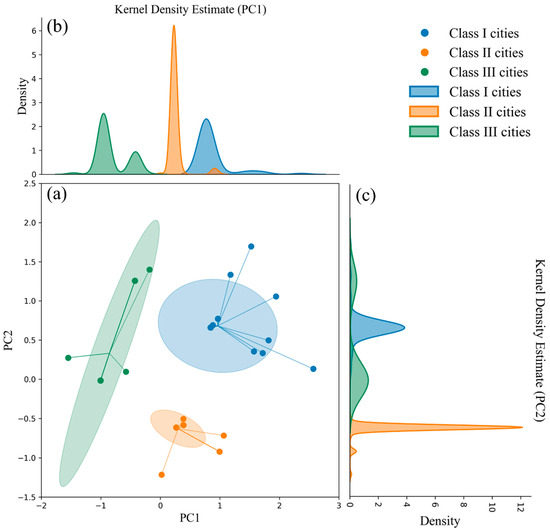
Figure 6.
K-Means clustering of obstacles to city development ((a) scatterplot of multidimensional data clustering of obstacles to city development, the ellipse is a 95% confidence interval. (b) PC1 kernel density map obtained after dimensionality reduction by principal component analysis (PCA). (c) PC2 kernel density map obtained after dimensionality reduction by means of PCA).
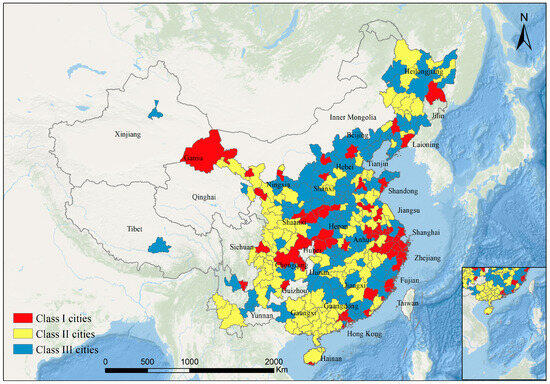
Figure 7.
Geospatial map of city clustering results by K-Means clustering based on city obstacle degrees.
To clarify the main obstacle factors, this study presents average obstacle degrees by city type (Figure 5 and Figure 8) and individual city obstacle degrees (Appendix A, Figure A2 and Figure A3). Class I cities had lower average obstacle degrees than the national average (Figure 5b and Figure A2a), indicating fewer development challenges. Mostly provincial capitals or directly governed municipalities (e.g., Beijing, Shanghai, Chengdu), these cities benefited from strong educational resources and infrastructure. Thus, they had a foundation for talent attraction, economic optimization, and educational resource accumulation, enhancing economic potential and sustainability. However, despite their advantages, Class I cities ranked among the top five in terms of obstacle factors related to C3 (total per capita water resources) and C4 (per capita green space area), both of which exceeded the national average. This suggested that, with population growth, the demand for water resources and green spaces was rising, and the existing environmental bases were insufficient to meet the needs of residents.
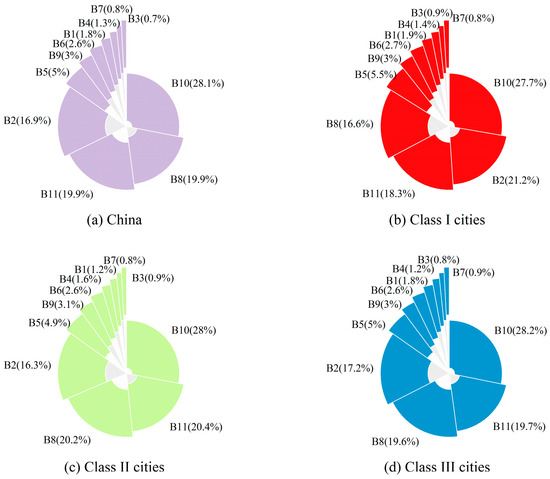
Figure 8.
Degree of obstacles at the factor level in different types of cities in China ((a–d) represent the average obstacle degree values for the element levels of different types of cities).
In contrast, Class II cities faced significant challenges linked to factors such as C23 (college students per 10,000 people), C22 (proportion of tertiary industries in GDP), C16 (number of college full-time faculty per 10,000 people), C3 (total per capita water resources), and C17 (public library holdings per 10,000 people) (Figure 5c and Figure A2b). These cities had fewer college students and higher education faculty than Class I cities and remained reliant on secondary industries, with a low tertiary sector share in GDP. This limited the pace of economic transformation and the development of industries such as services and technological innovation. Additionally, many Class II cities, such as Shijiazhuang and Jinzhong, faced water shortages, restricting agriculture, industry, and quality of life, thereby negatively impacting the growth of eco-cities.
Class III cities, which are generally smaller in size and have less economic power, faced similar challenges to Class II cities in terms of inadequate higher education resources, water scarcity, and insufficient cultural infrastructure (e.g., C17) (Figure 5d and Figure A2c). For Class III cities, the availability of green space was also a crucial factor in city development, as it directly impacted the livability and sustainability of these cities.
4.3.2. Obstacle Factors at the Element Level
Based on relevant studies, factors with an obstacle degree greater than 10% were considered key obstacle factors [48]. Major element-level factors to the development of eco-cities were B2 (environmental bases), B8 (social services), B10 (economic potential), and B11 (innovative capacity) (Figure 8a).
The average obstacle degree indicates that Chinese cities’ economic potential exceeds environmental bases and social services, with economic development as the primary growth driver. However, this also highlights the developmental gaps in other areas, especially in the eco-environment and eco-society. For the eco-environment, cities should enhance ecological construction and environmental quality. Regarding an eco-society, cities should improve infrastructure and social services to support the development of eco-cities.
The K-Means clustering results (Figure 8b) showed that Class I cities, with higher ecological development, were mainly influenced by factors B10, B2, and B11. For instance, cities like Zhengzhou and Hangzhou exhibited relatively low obstacles in B8, with these factors ranked only 4th (Figure A3a). This could be attributed to the strong economic bases of Class I cities, which attract talent and provide more access to higher education resources. Consequently, eco-city development in Class I cities should focus on strengthening the environmental bases and innovation capacity. Regarding social fairness, Class I cities, such as Shanghai and Nanjing, faced higher obstacles compared to Class II and III cities, with rising unemployment exacerbating inequality. Furthermore, the construction of eco-cities requires a balanced approach that integrates economic, social, and environmental considerations, avoiding a disproportionate emphasis on any one area of development. In contrast, Class II and Class III cities, which have lower ecological development and underdeveloped economies, faced challenges in B10, B11, B8, and B2 (Figure 8c,d and Figure A3b,c). The limitations in these cities’ economic potential and social service provision hindered their ability to advance their ecological development. However, these two types of cities showed lower obstacles in the environmental bases than Class I cities, indicating that they can utilize environmental strengths to enhance eco-cities development.
4.4. Sensitivity Analysis of Indicators
Sensitivity analysis does not require analyzing all factors in the study but focuses on the key uncertainty factors that may have a significant impact on the evaluation system, concentrating on the main factors [53]. To explore the specific impact of obstacle factors on eco-cities development, and based on the previous analysis of various city obstacle factors, this study conducted a scenario simulation for six indicators: C3 (total per capita water resources), C4 (per capita green space area), C16 (college full-time faculty per 10,000 people), C17 (public library holdings per 10,000 people), C22 (the proportion of tertiary industries in GDP), and C23 (college students per 10,000 people). A random forest model was used to simulate eco-cities scores, and sensitivity analysis was conducted using PDP and ICE [54].
For C3, C4, and C23, the model’s predicted values show an upward trend as the data for these indicators increase (Figure 9a,b,f). This suggests that an increase in green spaces and water resources contributes to a better living environment, thus enhancing residents’ quality of life. Green spaces provide recreational areas, improve air quality, and mitigate city heat island effects, all of which have positive impacts on public health. Similarly, a higher number of college students is often associated with innovation, technological development, and economic growth. More college students indicate higher levels of education and stronger innovation capabilities, which in turn drive the development of eco-cities.
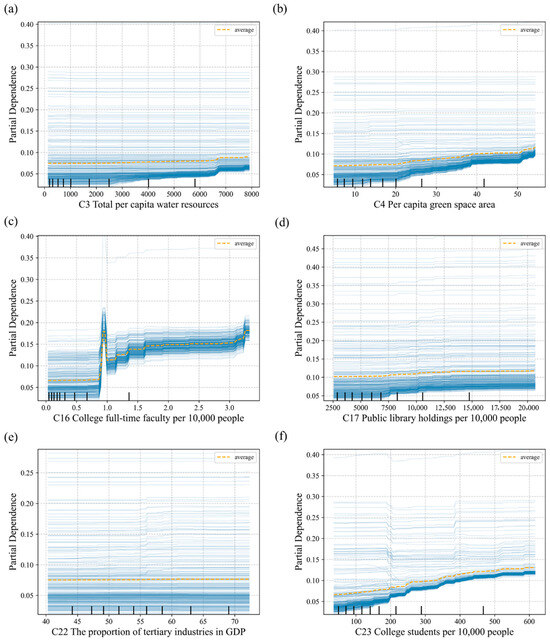
Figure 9.
Key indicators PDP and ICE (The PDP illustrates the average effect of a specific feature on the target variable by averaging the values of all other features. This is represented by the orange dashed line in the plot. The ICE shows how the predicted values for a particular sample change as a feature varies. This is depicted by the blue solid line in the plot. (a–f) are the PDP and ICE analyses of C3, C4, C16, C17, C22, and C23 respectively.).
As illustrated in Figure 9c, when C16 increases from 0 to approximately 1, the model’s predicted value rises gradually. However, after reaching a peak, the predicted value begins to decline as the number of teachers continues to increase. This pattern suggests a “saturation effect” in the relationship between the number of full-time college teachers and the eco-cities evaluation [55]. Initially, when the number of teachers is low, an increase in the teaching staff enhances educational quality, thereby contributing positively to the model’s predictions. However, once the number of teachers surpasses a certain threshold, further increases do not lead to a significant improvement in educational quality. This phenomenon can be attributed to limitations in factors such as the allocation of educational resources and management efficiency, which prevent additional teachers from further enhancing social service levels. Thus, a more rational and efficient allocation of teaching resources emerges as a crucial strategy for advancing the ecological development of cities.
For C17 and C22, the trends observed are relatively stable (Figure 9d,e). The individual conditional expectation curves for public library collections per 10,000 persons are generally flat, though some curves show an upward trend as the number of books increases. This suggests that, within a certain range, increasing library collections can contribute to the development of sustainable eco-cities. In contrast, as the proportion of tertiary industries in GDP rises, the individual conditional expectation curves exhibit variability. In particular, in cities where the share of tertiary industries exceeds 60%, the predicted outcomes exhibit a rising pattern. This indicates that a higher proportion of the tertiary sector plays a positive role in enhancing eco-cities’ scores, especially when the sector’s share is particularly high. However, since PDP and ICE analyses primarily focus on the marginal effect of a single feature on the target variable, they emphasize the direct impact of variable changes on the outcome. While the proportion of the tertiary sector is a key factor in the obstacle degree analysis, its effect on eco-cities development is not linear and may be moderated by other factors. Therefore, a singular linear change (such as increasing or decreasing the proportion of the tertiary sector) has a less noticeable impact on the eco-cities level compared to other factors.
To understand the interactions between indicators, this study analyzed the interactive effects between 24 indicators. The results showed that, apart from the interactions between the proportion of tertiary industries in GDP, fixed asset investment assets per capita, per capita GDP, and public library holdings per 10,000 people, the relationships between other indicators were relatively independent, with minimal mutual influence (Figure 10). This suggests that most indicators play an independent role in eco-cities evaluation, with only a few indicators exhibiting significant interaction effects. As shown in Figure 10a, there is a positive correlation between the proportion of tertiary industries in GDP and per capita retail sales of social consumer goods. An increase in the share of the tertiary sector typically signifies the expansion of services, which creates more consumption opportunities, thereby driving the growth of per capita retail sales. In essence, the development of the service industry provides residents with more opportunities for consumption, which in turn enhances the overall consumption capacity of society and promotes the improvement of eco-cities levels. Similarly, the positive relationship between per capita GDP and the number of books in public libraries per 10,000 persons reflects the role of economic development in promoting public cultural and educational services (Figure 10b). In more economically developed regions, both government and social investments in libraries tend to be higher, leading to an increase in both the collection size and service levels of public libraries. The positive interaction between these factors collectively enhances the city’s ecological level.
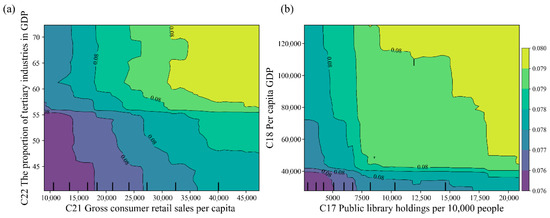
Figure 10.
Two-dimensional partial dependence plot of major obstacle factors. ((a,b) represent the two-dimensional influence analysis among C21, C22, and C17, C18).
5. Discussion
5.1. Spatial Heterogeneity in Eco-Cities
This study used the GWR model to analyze the spatial correlation between eco-cities levels and their obstacle factors, providing a basis for formulating regional and differentiated ecological optimization strategies. The GWR model accounts for spatial non-stationarity induced by geographical location changes, assigning weights to each sample and providing a corresponding regression equation for each sample city. To address multicollinearity, OLS regression was conducted for six indices (C3, C4, C16, C17, C22, C23), all with VIFs below 7.5. Moran’s I showed residuals were spatially random, supporting the use of the GWR model.
After model computation, the spatial distribution of the regression coefficients for each indicator (C3, C4, C16, C17, C22, and C23) was obtained (Figure 11). The regression coefficients for each indicator showed varying positive and negative values, where the magnitude of the coefficient indicated the degree of influence the indicator had on eco-cities scores, and the sign of the coefficient indicated the direction of the influence.
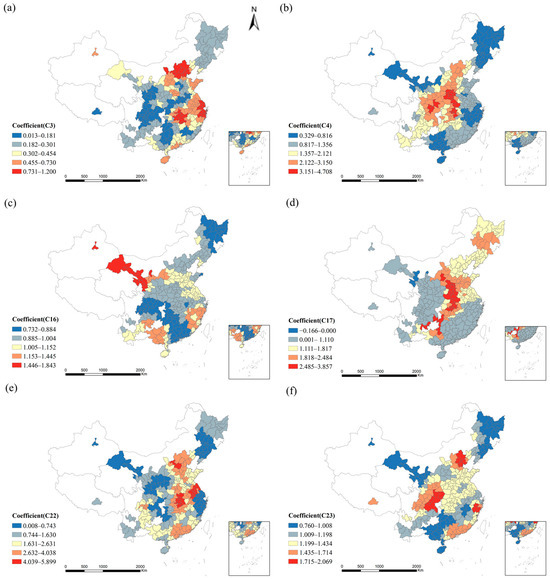
Figure 11.
Spatial distribution of coefficients: ((a–f) Coefficient of the main obstacle factors and eco-cities scores).
Per capita water resource coefficients were highest mainly in eastern coastal and certain central regions, implying that water resources were a key driver of regional development (Figure 11a). Regarding green space, the per capita garden and green space area coefficient varied from 0.329 to 4.709. Central regions demonstrated a particular reliance on green space. These areas, which have undergone rapid development in recent years, saw green space expansion contribute directly to residents’ quality of life. This improvement subsequently helped raise their overall eco-city levels. In contrast, the economically developed southeastern regions showed a relatively lower contribution from green space to eco-city development. One likely explanation is that these areas already possess ample green resources and high living standards. As a result, the marginal impact of environmental bases on further eco-city improvement may have begun to saturate (Figure 11b).
Similarly, the number of full-time college teachers had a more substantial contribution to eco-cities development in the economically advanced eastern regions, reflecting a greater demand for highly skilled talent. However, the highest coefficients for this indicator were found in the western regions, where educational resources were relatively scarce. This highlighted the significant role that higher education resources played in driving eco-cities development in these underdeveloped areas. The increasing dependence on educational resources in the western regions underscored the crucial role that persons with abilities played in their development. By investing more in higher education, these areas could stimulate economic growth and innovation, narrowing the development gap with eastern regions and fostering improvements in eco-cities levels (Figure 11c).
In terms of public library collections, significant positive effects were observed across central and northeastern China, reflecting the beneficial role of cultural resources in city development. Conversely, in the western regions, the coefficients were relatively low, or even negative, indicating that local residents’ utilization of library resources was limited or that there was a lower demand for such resources (Figure 11d). The coefficient for the proportion of GDP from the tertiary sector was higher in the southeastern coastal regions, where the service sector played a significant role in driving eco-cities scores (Figure 11e).
Finally, the spatial distribution of college students revealed a pronounced regional variation, with city clusters in the Beijing–Tianjin–Hebei, Yangtze River Delta, Chengdu–Chongqing, and Pearl River Delta exhibiting a stronger impact on eco-cities development due to their higher education levels. These regions had a high demand for highly educated people, which was essential for their continued growth. In contrast, the western and northeastern regions, which were less developed, showed lower coefficients for college student numbers, suggesting that these areas were producing more graduates than they could absorb. Therefore, encouraging university graduates to work in these less developed regions could help enhance local innovative capability and promote the development of eco-cities in the western and northeastern regions (Figure 11f).
5.2. Eco-Cities and Carbon Intensity
As an ideal and sustainable city development model, the development goals of eco-cities encompass environmental protection, efficient resource use, and sustainable utilization. Carbon intensity (carbon emissions per unit of GDP) directly reflected the degree of dependence of a city’s economic development on carbon emissions. This indicator could serve as a reference for assessing the environmental impact of the city’s economic activities [56]. In the development of eco-cities, promoting environmental protection, efficient resource utilization, and sustainable development are key objectives. Carbon intensity, as an important indicator of the relationship between carbon emissions and economic activities, is crucial for assessing whether eco-cities can achieve their low-carbon goals. Therefore, this study will discuss the relationship between eco-city development and carbon intensity in this section.
According to Figure 12, the carbon intensity of 280 cities in China presented a spatial pattern of “lower in the east, higher in the west.” Regions with carbon intensity greater than 2.54 ten thousand tons per billion yuan were mainly concentrated in the northern and northwestern areas, such as Inner Mongolia, Shanxi, and Ningxia. These regions relied on traditional energy industries such as coal, making them typical resource-based economies, which led to high carbon emission intensity [57]. In contrast, the carbon intensity in the eastern coastal regions was generally lower, especially in economically developed areas such as the Yangtze River Delta and Pearl River Delta economic zones. These regions featured more diversified industrial structures, with significant shares of the service sector and high-tech industries [58]. It also indicated that in the construction of eco-cities, different regions required targeted carbon reduction measures to promote an overall decrease in national carbon intensity, thereby fostering the development of higher-level eco-cities.
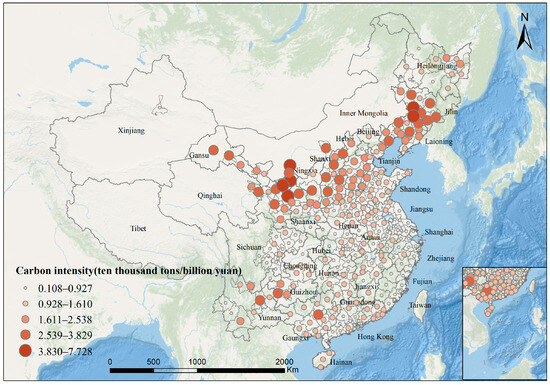
Figure 12.
Carbon intensity distribution of 280 cities in 2020.
The correlation between eco-cities scores and carbon intensity, derived from the partial Pearson correlation coefficient [59], was r = −0.235 (p < 0.01). This indicated a downward trend in carbon intensity as eco-cities scores increased. The negative correlation revealed the positive impact of eco-cities development on carbon reduction. Lower carbon intensity implied less carbon dioxide emission per unit of GDP production, and cities with higher eco-cities scores tended to invest more in green environmental protection and ecological improvement. These cities often adopted cleaner energy sources and achieved higher resource utilization efficiency, which helped reduce carbon intensity. For instance, promoting the development of low-carbon services and high-tech manufacturing industries could reduce reliance on high-carbon industries. By expanding the use of clean energy (such as solar and wind power) and enhancing resource utilization efficiency, cities could reduce carbon emissions while maintaining economic growth, thus achieving a win-win situation in both economic and environmental benefits, leading to more efficient eco-cities development.
To further explore the regional differences, this study conducted a GWR analysis of eco-cities scores and carbon intensity (Figure 13). The results showed a significant negative coefficient in the Yangtze River Delta and its surrounding areas (r = −0.436~−0.161). These regions exhibited advanced economic development, with higher energy efficiency and more mature green industries compared to traditional industrial areas. Significant progress has been made in low-carbon development, green technology application, and the utilization of renewable energy, leading to higher eco-cities scores. The central and southern regions (such as Hunan and Hubei) showed a weaker coefficient, where carbon intensity was at a moderate level nationwide. These areas have been strengthening eco-cities development by reducing carbon intensity to improve their eco-cities scores. The coefficient was even weaker in the northwest and northeast, regions dominated by traditional industries, energy, and mineral resource extraction, which had high carbon emissions. Due to a heavy industrial structure, carbon emissions primarily came from sectors such as coal and steel. Moreover, these regions faced significant environmental pressure due to over-industrialization and delayed pollution control. Therefore, they needed to accelerate low-carbon development and improve the ecological environment to raise their eco-cities scores. From these findings, it became evident that reducing carbon intensity could be a key strategy for enhancing eco-cities scores.
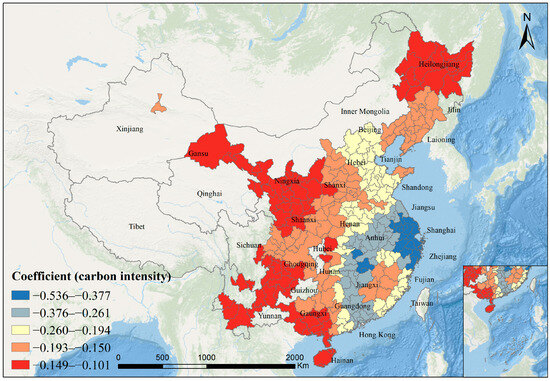
Figure 13.
Spatial distribution coefficient of eco-cities scores and carbon intensity.
5.3. Temporal Trends of Carbon Intensity
From 2011 to 2020, China’s carbon intensity declined steadily from 2.18 to 1.39 ten thousand tons per billion yuan, a reduction of about 36% (Figure 14). This trend reflects the effects of national energy-saving and emission-reduction policies, as well as the gradual optimization of the industrial structure. When comparing different types of cities, clear differences appear. Class I cities with a higher level of eco-cities development show the largest decline, with carbon intensity dropping from 1.49 to 0.81 ten thousand tons per billion yuan, a decrease of 45%. These cities generally have a higher share of the tertiary sector, strong technological innovation, and effective environmental management, which together accelerate the transition toward low-carbon development. Class II cities also achieved significant reductions, but their progress was slower, reflecting a continued reliance on traditional industries. Class III cities, dominated by resource and energy-intensive sectors, maintained the highest level of carbon intensity during this period, decreasing from 2.57 to 1.62 ten thousand tons per billion yuan. Although they also reduced carbon intensity by 37%, their improvement was relatively limited compared with Class I cities. The results suggest that cities with higher ecological development levels tend to have lower carbon intensity and show greater dynamic improvements over time.
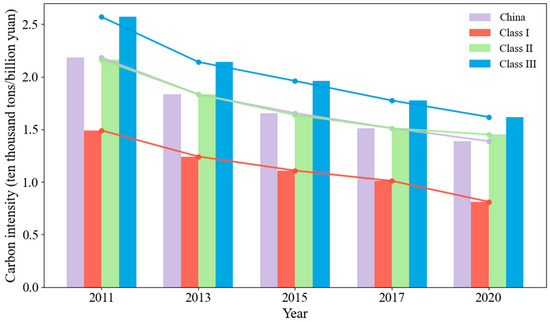
Figure 14.
Changes in carbon intensity of eco-cities from 2011 to 2020.
Although the current results indicate a relationship between eco-cities development and carbon intensity, it is important to recognize data limitations. Carbon intensity data are available for the past decade, but comparable eco-cities scores are not consistent for the same period. Therefore, this study only analyzes changes in carbon intensity, and the link with eco-city development is inferred rather than directly measured. As a result, the conclusion about the dynamic relationship between eco-cities development and carbon reduction should be regarded as tentative and may differ from the actual situation. Future research should combine dynamic eco-cities scores with carbon intensity data to examine this relationship more rigorously.
5.4. Comparison with Other Studies
Through a literature review, this study was identified as the first to conduct a national-scale evaluation of eco-cities. By incorporating sensitivity analysis and spatial heterogeneity analysis, it provided an in-depth exploration of the development trends of eco-cities. This research filled the gap in the scale of eco-cities evaluation, particularly in the sensitivity analysis section. The study focused on analyzing the specific impact of obstacle factors on eco-cities scores, employing advanced analytical methods such as PDP and ICE analysis. These methods visually demonstrated the mechanisms and intensity of the effects of changes in obstacle factors on eco-cities scores, thereby revealing the key bottlenecks in eco-cities development. Through the combined application of these methods, this study offered more precise decision-making support for policymakers and laid a foundation for future research in related fields. Additionally, the spatial heterogeneity analysis explored the regional differences in eco-cities construction, further revealing the regional characteristics and spatial distribution patterns of eco-cities development.
This study, consistent with previous research, adopted a multi-dimensional approach to construct an eco-cities evaluation index system, aiming to comprehensively capture the complexity and diversity of eco-cities development [19,47]. We employed a combination of AHP and the entropy method to derive indicator weights, which could address potential biases that could have arisen from relying solely on either method. Among the 24 indicators, the proportion of GDP from the tertiary sector emerged as the most influential factor in determining eco-cities scores, aligning with the findings of Yang, Zeng, and Yang [34]. This suggests that the tertiary sector’s contribution to GDP played a critical role in eco-cities development, both at the national level and within specific regional contexts. In addition, the number of full-time college teachers, the number of university students, and the per capita garden and green space area were also identified as significant factors influencing eco-cities development, which supported the conclusions of Chen, Zhu, Lu, Zhou, and Ma [6]. These findings indicated that educational resources and the availability of green spaces were key drivers of eco-cities development across various scales.
However, from a national perspective, total per capita water resources was also found to be a major influencing factor on eco-cities development, which differs from the findings of Chen, Zhu, Lu, Zhou, and Ma [6]. Their study, which focused on the Yellow River Basin, emphasized regional characteristics, while our research adopted a nationwide perspective on eco-cities evaluation in China. As a result, the differences in spatial focus and scale contributed to the observed discrepancies in the conclusions.
5.5. Policy Suggestions
Overall, Chinese cities show marked regional disparities in ecological levels, following a spatial gradient of “higher in the east and lower in the west.” To achieve sustainable eco-cities development in China, it is crucial to develop region-specific policies based on the obstacles to ecological development in different cities. For Class I cities, which generally have higher levels of ecological development, it is recommended to strengthen environmental bases, increase the area of garden and green spaces, and enhance the rational use of water resources to improve the per capita water availability. At the same time, innovative capacity has been further boosted by promoting high-tech industries and increasing investment in scientific research. For Class II cities, policy efforts should focus on improving higher education resources and accessibility. Measures such as strengthening faculty recruitment and retention and optimizing the allocation of educational resources across regions could more effectively address the obstacle factors associated with innovative capacity and social services. Additionally, increasing support for the tertiary sector and optimizing the industrial structure is key to promoting the transformation of traditional industries. Increasing library collections will enhance social service levels, while utilizing the advantages of environmental bases to further develop ecological cities. For class III cities, it is also necessary to increase support for the tertiary sector to increase the economic potential of the eco-cities, and to strengthen the environmental bases, so as to realize the coordinated development of the economy and the environment in order to enhance the level of eco-cities.
From the analysis of the indicators, per capita green space area and total per capita water resources are significant factors influencing the development of eco-cities in China. Therefore, it is essential to optimize urban land use planning, increase the per capita garden and green space area, and enhance the ecological functions of urban green space systems. At the same time, efforts should be made to strengthen the rational utilization and protection of water resources, reduce water wastage, and ensure the sustainable supply of water. In response to water scarcity in some cities, it is recommended to promote the concept of “sponge cities” [60], construct rainwater harvesting systems, and build wastewater treatment and reuse facilities to alleviate water shortages and improve the efficiency of water resource utilization.
The number of full-time college teachers and the number of university students significantly influence the ecological level of cities, underscoring the critical role of education in fostering a city innovative capacity. However, the “saturation effect” associated with the number of full-time college teachers suggests that simply increasing the quantity of teachers may no longer be sufficient to further advance ecological urbanization. To address this, it is recommended to optimize the distribution of teaching resources and enhance the contribution of faculty members to the development of ecological cities. Additionally, the proportion of GDP generated by the tertiary sector is a crucial obstacle to improving the ecological level of cities in China. To overcome this challenge, governments should promote the transition from primary and secondary industries to the tertiary sector, thereby strengthening urban economic potential and driving the advancement of ecological urbanization.
While this study offers valuable insights into the spatial heterogeneity and obstacle factors of eco-city development, it has certain limitations in terms of sample representativeness. Since the sample in this study primarily covers prefecture-level cities and larger urban areas, these cities exhibit a high degree of consistency in terms of ecological management systems, levels of economic development, and data availability. Consequently, the research findings primarily reflect the characteristics of ecological city development at the medium-to-large city level. Their relevance to smaller cities and county-level cities is limited, as previous studies suggest that eco-city levels in these areas are more strongly influenced by factors such as land policies, fiscal capacity, and population mobility [61,62,63]. Therefore, the applicability of the present findings to smaller or county-level cities may be constrained.
6. Conclusions
By integrating data from 280 cities in China, this study employed a combination of AHP and the entropy weight method to determine the weights of indicators, and used the TOPSIS model to evaluate the ecological levels of cities. The study also identified the primary obstacle factors affecting the enhancement of eco-cities levels through the obstacle diagnosis model, conducted sensitivity analysis on the indicators, and analyzed spatial heterogeneity based on the GWR model. The key findings of the study are as follows:
- (1)
- From the perspective of spatial pattern evolution, the study revealed the regional disparities in the ecological levels of Chinese cities, with a general pattern of “high in the east, low in the west”. High-level eco-cities were concentrated in the developed coastal regions and provincial capitals, medium-level eco-cities were mainly concentrated in the northeast and central regions, and low-level eco-cities were mainly found in the central and western regions.
- (2)
- At the index level, the key obstacles to eco-cities in China included total per capita water resources, per capita green space area, college full-time faculty per 10,000 people, the proportion of tertiary industries in GDP, and college students per 10,000 people. Moreover, the number of full-time college teachers exhibited a “saturation effect” on eco-cities development. At the element level, the primary obstacles to eco-cities construction were related to environmental bases, social services, economic potential, and innovative capacity. K-means clustering analysis revealed that the obstacle degree for Class I cities was generally lower than that of Class II and Class III cities, reflecting the current imbalanced development of eco-cities across China.
- (3)
- The GWR model revealed the spatial heterogeneity of factors influencing eco-cities. The model results indicated that, in the eastern and central regions, total water resources per capita and garden green space area had a greater effect on ecological development. In contrast, the western and northeastern region’s eco-cities development was more constrained by the availability of higher education resources and the level of social services. Therefore, to enhance the ecological urbanization level in the eastern region, efforts should focus on increasing water resources. In the central region, expanding garden green space should be prioritized, while the western and northeastern regions should focus on strengthening innovative capacity and improving social services to drive overall regional development.
- (4)
- The carbon intensity of Chinese cities exhibited a spatial pattern of “low in the east, high in the west”, with a correlation coefficient of r = −0.235 (p < 0.01) with eco-cities scores. This indicates that cities with higher ecological scores tend to have more efficient resource utilization, leading to lower carbon intensity. Therefore, cities with high carbon intensity should focus on adjusting their industrial structure, promoting clean energy, and enhancing low-carbon technology to achieve a low-carbon transformation. Meanwhile, the construction of eco-cities should prioritize balancing the simultaneous advancement of environmental sustainability and a low-carbon economy to achieve a higher level of sustainable eco-cities development.
As statistical data improves, future research will introduce data in the time dimension, combined with dynamic change analysis models, to explore the long-term evolutionary trends of China’s eco-cities and their driving mechanisms. Additionally, various machine learning algorithms can be integrated to optimize the identification and quantification of obstacle factors, thereby improving the accuracy and applicability of the evaluation system. This would allow for the exploration of the universality and uniqueness of China’s experience, providing theoretical insights and policy recommendations for global eco-cities development.
Author Contributions
Conceptualization, Y.W., D.F. and S.D.; data curation, Y.W., D.F. and L.G.; formal analysis, Y.W., D.F., Y.C. and S.D.; funding acquisition, S.D. and W.S.; investigation, Y.W., D.F. and C.L.; methodology, Y.W., D.F., Y.C., S.D., W.S. and L.G.; resources, Y.C.; software, Y.W.; validation, Y.C., W.S. and C.L.; visualization, Y.W. and D.F.; writing—original draft, Y.W.; writing—review and editing, D.F. and S.D. All authors have read and agreed to the published version of the manuscript.
Funding
This work was supported by the National Natural Science Foundation of China [42201512, 42271435]; the Beijing Natural Science Foundation [L251006, L241048]; the Major Science and Technology Projects of Ordos [ZD20232304]; and the Fundamental Research Funds for the Central Universities [2025ZKPYDC03].
Data Availability Statement
The original contributions presented in this study are included in the article. Further inquiries can be directed to the corresponding author.
Conflicts of Interest
The authors declare no conflicts of interest.
Appendix A

Figure A1.
Ranking and scores of 280 eco-cities in China.


Figure A2.
Degree of obstacles at the factor level in different types of cities in China ((a–c) are obstacle factors at the index Level for cities of Class I, Class II, and Class III respectively. C1 per capita living space; C2 Green coverage ratio within built-up area; C3 Total per capita water resources; C4 Per capita green space area; C5 Units of industrial wastewater discharged in built-up area; C6 Sulfur dioxide emissions from industrial sources in built-up area; C7 Units of industrial dust emissions in built-up area; C8 Effluent treatment rate; C9 Integrated utilization rate of industrial solid waste; C10 Per capita road area; C11 Medical beds per 10,000 people; C12 Public transportation vehicles per 10,000 people; C13 Household waste treatment rate; C14 Jobless rate; C15 Average wage per employee; C16 College full-time faculty per 10,000 people; C17 Public library holdings per 10,000 people; C18 Per capita GDP; C19 Revenue per capita; C20 Fixed asset investment assets per capita; C21 Fixed asset investment assets per capita; C22 The proportion of tertiary industries in GDP; C23 College students per 10,000 people; C24 The proportion of education, science, and technology expenditures in local government spending).


Figure A3.
Degree of obstacles at the element level in different types of cities in China. ((a–c) are obstacle factors at the element Level for cities of Class I, Class II, and Class III respectively).
Appendix B
Appendix B.1. K-Means Clustering Method
K-Means is a distance-based unsupervised clustering algorithm widely used to partition research objects into several groups according to their similarity. The core idea is to iteratively minimize the within-cluster sum of squares, so that the similarity within each cluster is maximized while the dissimilarity between clusters is maximized. The main steps are as follows:
First, after calculating the obstacle degree, the obstacle characteristics of each city were taken as input variables for clustering.
Second, the number of clusters K was pre-defined, and K cities were randomly selected as the initial cluster centers.
Third, the Euclidean distance between each city and the cluster centers was calculated, and each city was assigned to the nearest cluster:
where denotes a city, is the center of cluster j, and m is the number of obstacle indicators.
Fourth, the cluster centers were updated by recalculating the mean value of all cities assigned to each cluster:
where is the number of cities in cluster .
Appendix B.2. Partial Dependence Plot and Individual Conditional Expectation
PDP describes the average marginal effect of a feature on the prediction by integrating out the influence of all other features.
First, for a feature of interest , the partial dependence function is defined as:
where is the prediction function of the model, denotes the feature of interest, and represents the other features for sample i.
Second, the function was plotted to visualize how the average prediction changes with different values of .
ICE describes the individual-level effect of a feature on the prediction by keeping other features fixed for each sample.
First, for a given sample i, the ICE curve is expressed as:
Second, ICE curves were generated for all samples, showing the heterogeneity of feature effects across individuals.
Finally, by combining PDP and ICE, both the global average trend and individual variation of the feature effect were illustrated.
References
- Korhonen, J.; Snäkin, J.-P. Quantifying the relationship of resilience and eco-efficiency in complex adaptive energy systems. Ecol. Econ. 2015, 120, 83–92. [Google Scholar] [CrossRef]
- Un-Habitat. World Cities Report 2020: The Value of Sustainable Urbanization; UN: Nairobi, Kenya, 2020.
- Ripple, W.J.; Wolf, C.; Newsome, T.M.; Barnard, P.; Moomaw, W.R. World scientists’ warning of a climate emergency. BioScience 2020, 70, 8–100. [Google Scholar] [CrossRef]
- Lin, Z. Ecological urbanism in East Asia: A comparative assessment of two eco-cities in Japan and China. Landsc. Urban Plan. 2018, 179, 90–102. [Google Scholar] [CrossRef]
- Du, S.; Zhang, X.; Lei, Y.; Huang, X.; Tu, W.; Liu, B.; Meng, Q.; Du, S. Mapping urban functional zones with remote sensing and geospatial big data: A systematic review. GIScience Remote Sens. 2024, 61, 2404900. [Google Scholar] [CrossRef]
- Chen, Y.; Zhu, M.; Lu, J.; Zhou, Q.; Ma, W. Evaluation of ecological city and analysis of obstacle factors under the background of high-quality development: Taking cities in the Yellow River Basin as examples. Ecol. Indic. 2020, 118, 106771. [Google Scholar] [CrossRef]
- Han, L. Relationship between urbanization and urban air quality: An insight on fine particulate dynamics in China. Prog. Geogr. 2018, 37, 1011–1021. [Google Scholar]
- Du, S.; Zheng, M.; Guo, L.; Wu, Y.; Li, Z.; Liu, P. Urban building function classification based on multisource geospatial data: A two-stage method combining unsupervised and supervised algorithms. Earth Sci. Inform. 2024, 17, 1179–1201. [Google Scholar] [CrossRef]
- Meng, F.; Guo, J.; Guo, Z.; Lee, J.C.; Liu, G.; Wang, N. Urban ecological transition: The practice of ecological civilization construction in China. Sci. Total Environ. 2021, 755, 142633. [Google Scholar] [CrossRef]
- Hu, M.-C.; Wadin, J.L.; Lo, H.-C.; Huang, J.-Y. Transformation toward an eco-city: Lessons from three Asian cities. J. Clean. Prod. 2016, 123, 77–87. [Google Scholar] [CrossRef]
- Sachs, J.D.; Schmidt-Traub, G.; Mazzucato, M.; Messner, D.; Nakicenovic, N.; Rockström, J. Six Transformations to achieve the Sustainable Development Goals. Nat. Sustain. 2019, 2, 805–814. [Google Scholar] [CrossRef]
- Lan, T.; Shao, G.; Xu, Z.; Tang, L.; Dong, H. Considerable role of urban functional form in low-carbon city development. J. Clean. Prod. 2023, 392, 136256. [Google Scholar] [CrossRef]
- Zhang, X.; Xu, X.; Pan, S.; Mo, Y.; Dong, C. Exploring the impact of low-carbon city pilot policy on urban ecological welfare performance: A quasi-natural experiment in 282 Chinese cities. Urban Clim. 2024, 58, 102216. [Google Scholar] [CrossRef]
- Howard, E. Tomorrow: A Peaceful Path to Real Reform; Swan Sonnenschein; Routledge: London, UK, 1898. [Google Scholar]
- Li, Z. How to Build Eco-City in China. Nat. Ecol. Conserv. 2002, 27–29. [Google Scholar] [CrossRef]
- Kaushal, S.S.; Belt, K.T. The urban watershed continuum: Evolving spatial and temporal dimensions. Urban Ecosyst. 2012, 15, 409–435. [Google Scholar] [CrossRef]
- Vergnes, A.; Le Viol, I.; Clergeau, P. Green corridors in urban landscapes affect the arthropod communities of domestic gardens. Biol. Conserv. 2012, 145, 171–178. [Google Scholar] [CrossRef]
- Xu, L.; Yao, S.; Chen, S.; Xu, Y. Evaluation of Eco-city Under the Concept of High-quality Development:A Case Study of the Yangtze River Delta Urban Agglomeration. Sci. Geogr. Sin. 2019, 39, 1228–1237. [Google Scholar] [CrossRef]
- Wang, J.; Wei, X.; Guo, Q. A three-dimensional evaluation model for regional carrying capacity of ecological environment to social economic development: Model development and a case study in China. Ecol. Indic. 2018, 89, 348–355. [Google Scholar] [CrossRef]
- Cao, L.; Hao, S.; Chen, N. Building and Evaluation of the Rural Ecological Environment Index System. Res. Soil Water Conserv. 2010, 17, 238–240+244. [Google Scholar] [CrossRef]
- Tan, S. Research on evaluation of ecological livable city based on residents’ satisfaction—Take Zhuzhou as an example. Eco Cities 2022, 3, 1–12. [Google Scholar] [CrossRef]
- Al-Harbi, K.M.A.-S. Application of the AHP in project management. Int. J. Proj. Manag. 2001, 19, 19–27. [Google Scholar] [CrossRef]
- Kwong, C.K.; Ip, W.; Chan, J. Combining scoring method and fuzzy expert systems approach to supplier assessment: A case study. Integr. Manuf. Syst. 2002, 13, 512–519. [Google Scholar] [CrossRef]
- Zou, Z.-H.; Yi, Y.; Sun, J.-N. Entropy method for determination of weight of evaluating indicators in fuzzy synthetic evaluation for water quality assessment. J. Environ. Sci. 2006, 18, 1020–1023. [Google Scholar] [CrossRef]
- Vu, T.T.H.; Tian, G.; Khan, N.; Zada, M.; Zhang, B.; Nguyen, T.V. Evaluating the international competitiveness of Vietnam wood processing industry by combining the variation coefficient and the entropy method. Forests 2019, 10, 901. [Google Scholar] [CrossRef]
- Han, B.; Liu, H.; Wang, R. Urban ecological security assessment for cities in the Beijing–Tianjin–Hebei metropolitan region based on fuzzy and entropy methods. Ecol. Model. 2015, 318, 217–225. [Google Scholar] [CrossRef]
- Ericsson, M.; Resende, M.G.C.; Pardalos, P.M. A genetic algorithm for the weight setting problem in OSPF routing. J. Comb. Optim. 2002, 6, 299–333. [Google Scholar] [CrossRef]
- Belgiu, M.; Drăguţ, L. Random forest in remote sensing: A review of applications and future directions. ISPRS J. Photogramm. Remote Sens. 2016, 114, 24–31. [Google Scholar] [CrossRef]
- Zhao, L.Q.; van Duynhoven, A.; Dragićević, S. Machine Learning for Criteria Weighting in GIS-Based Multi-Criteria Evaluation: A Case Study of Urban Suitability Analysis. Land 2024, 13, 1288. [Google Scholar] [CrossRef]
- Hu, P. Evaluation algorithm of coastal city ecological civilization development level based on improved BP neural network. J. Environ. Manag. 2022, 321, 116039. [Google Scholar] [CrossRef] [PubMed]
- Xie, Y.; Dai, W.; Xiang, S.; Deng, H.; Wang, Z.; Li, Y.; Wang, Z.; Zhou, M.; Gao, M. Supply and demand of ecosystem services and their interaction with urbanization: The case of Chengdu-Chongqing urban agglomeration. Urban Clim. 2024, 55, 101978. [Google Scholar] [CrossRef]
- Carli, R.; Dotoli, M.; Pellegrino, R. Multi-criteria decision-making for sustainable metropolitan cities assessment. J. Environ. Manag. 2018, 226, 46–61. [Google Scholar] [CrossRef] [PubMed]
- Xu, D.; Zhu, D.; Deng, Y.; Sun, Q.; Ma, J.; Liu, F. Evaluation and empirical study of Happy River on the basis of AHP: A case study of Shaoxing City (Zhejiang, China). Mar. Freshw. Res. 2023, 74, 838–850. [Google Scholar] [CrossRef]
- Zhang, S.; Liu, S.; Zhong, Q.; Zhu, K.; Fu, H. Assessing Eco-Environmental Effects and Its Impacts Mechanisms in the Mountainous City: Insights from Ecological–Production–Living Spaces Using Machine Learning Models in Chongqing. Land 2024, 13, 1196. [Google Scholar] [CrossRef]
- Yang, C.; Zeng, W.; Yang, X. Coupling coordination evaluation and sustainable development pattern of geo-ecological environment and urbanization in Chongqing municipality, China. Sustain. Cities Soc. 2020, 61, 102271. [Google Scholar] [CrossRef]
- Yao, X.-J.; Zheng, W.; Wang, D.-C.; An, M.; Wang, X.-Y.; Chen, W.; Wang, W.; Chi, T.-H. Micro-scale habitability evaluation of Sino-Singapore Tianjin Eco-city based on multi-source data. Ying Yong Sheng Tai Xue Bao J. Appl. Ecol. 2022, 33, 2493–2500. [Google Scholar] [CrossRef]
- Liang, Z.; Zhang, M.; Mao, Q.; Yu, B.; Ma, B. Improvement of eco-efficiency in China: A comparison of mandatory and hybrid environmental policy instruments. Int. J. Environ. Res. Public Health 2018, 15, 1473. [Google Scholar] [CrossRef] [PubMed]
- Zhong, L.; Li, X.; Law, R.; Sun, S. Developing Sustainable Urbanization Index: Case of China. Sustainability 2020, 12, 4585. [Google Scholar] [CrossRef]
- Zhu, J.; Lu, X. Mechanism of impact and spatial effects of digital economy in enhancing tourism economic resilience. Prog. Geogr. 2024, 43, 2004–2020. [Google Scholar] [CrossRef]
- Miao, L.; Tang, S.; Li, X.; Yu, D.; Deng, Y.; Hang, T.; Yang, H.; Liang, Y.; Kwan, M.-P.; Huang, L. Estimating the CO2 emissions of Chinese cities from 2011 to 2020 based on SPNN-GNNWR. Environ. Res. 2023, 218, 115060. [Google Scholar] [CrossRef]
- Zhang, W.; Wang, Y.; Wei, R. Spatiotemporal evolution and mechanism about high-quality development convergence clubs of cities within urban agglomerations. Acta Geogr. Sin. 2023, 78, 3109–3128. [Google Scholar] [CrossRef]
- Hu, X.; Ma, C.; Huang, P.; Guo, X. Ecological vulnerability assessment based on AHP-PSR method and analysis of its single parameter sensitivity and spatial autocorrelation for ecological protection–A case of Weifang City, China. Ecol. Indic. 2021, 125, 107464. [Google Scholar] [CrossRef]
- Liu, Z.; Xie, Q.; Dai, L.; Wang, H.; Deng, L.; Wang, C.; Zhang, Y.; Zhou, X.; Yang, C.; Xiang, C. Research on comprehensive evaluation method of distribution network based on AHP-entropy weighting method. Front. Energy Res. 2022, 10, 975462. [Google Scholar] [CrossRef]
- Na, W.; Zhao, Z. The comprehensive evaluation method of low-carbon campus based on analytic hierarchy process and weights of entropy. Environ. Dev. Sustain. 2021, 23, 9308–9319. [Google Scholar] [CrossRef]
- Chen, C.-H. A novel multi-criteria decision-making model for building material supplier selection based on entropy-AHP weighted TOPSIS. Entropy 2020, 22, 259. [Google Scholar] [CrossRef]
- Wątróbski, J.; Bączkiewicz, A.; Ziemba, E.; Sałabun, W. Sustainable cities and communities assessment using the DARIA-TOPSIS method. Sustain. Cities Soc. 2022, 83, 103926. [Google Scholar] [CrossRef]
- Zhao, R.; Fang, C.; Liu, J.; Zhang, L. The evaluation and obstacle analysis of urban resilience from the multidimensional perspective in Chinese cities. Sustain. Cities Soc. 2022, 86, 104160. [Google Scholar] [CrossRef]
- Zhou, S.; Zhang, M.; Wang, S.; Sun, M. Assessment of vulnerability in natural-social system in Hexi, Gansu. Resour. Sci. 2018, 40, 452–462. [Google Scholar]
- Sinaga, K.P.; Yang, M.-S. Unsupervised K-means clustering algorithm. IEEE Access 2020, 8, 80716–80727. [Google Scholar] [CrossRef]
- Goldstein, A.; Kapelner, A.; Bleich, J.; Pitkin, E. Peeking inside the black box: Visualizing statistical learning with plots of individual conditional expectation. J. Comput. Graph. Stat. 2015, 24, 44–65. [Google Scholar] [CrossRef]
- Brunsdon, C.; Fotheringham, A.S.; Charlton, M.E. Geographically weighted regression: A method for exploring spatial nonstationarity. Geogr. Anal. 1996, 28, 281–298. [Google Scholar] [CrossRef]
- Saputra, D.M.; Saputra, D.; Oswari, L.D. Effect of distance metrics in determining k-value in k-means clustering using elbow and silhouette method. In Proceedings of the Sriwijaya International Conference on Information Technology and Its Applications (SICONIAN 2019), Palembang, South Sumatra, Indonesia, 16 November 2019; pp. 341–346. [Google Scholar]
- Borgonovo, E.; Plischke, E. Sensitivity analysis: A review of recent advances. Eur. J. Oper. Res. 2016, 248, 869–887. [Google Scholar] [CrossRef]
- Molnar, C. Interpretable Machine Learning; Lulu Press, Inc.: Durham, UK, 2020. [Google Scholar]
- Rao, A.S. Saturation effects in nonlinear absorption, refraction, and frequency conversion: A review. Optik 2022, 267, 169638. [Google Scholar] [CrossRef]
- Wang, S.; Psaraftis, H.N.; Qi, J. Paradox of international maritime organization’s carbon intensity indicator. Commun. Transp. Res. 2021, 1, 100005. [Google Scholar] [CrossRef]
- Wang, H.; Liu, P. Spatial correlation network of renewable energy consumption and its influencing factors: Evidence from 31 Chinese provinces. Renew. Energy 2023, 217, 119173. [Google Scholar] [CrossRef]
- Wang, S.; Ma, Y. Influencing factors and regional discrepancies of the efficiency of carbon dioxide emissions in Jiangsu, China. Ecol. Indic. 2018, 90, 460–468. [Google Scholar] [CrossRef]
- Huang, X.; Wang, Y. Investigating the effects of 3D urban morphology on the surface urban heat island effect in urban functional zones by using high-resolution remote sensing data: A case study of Wuhan, Central China. ISPRS J. Photogramm. Remote Sens. 2019, 152, 119–131. [Google Scholar] [CrossRef]
- Guan, X.; Wang, J.; Xiao, F. Sponge city strategy and application of pavement materials in sponge city. J. Clean. Prod. 2021, 303, 127022. [Google Scholar] [CrossRef]
- Gong, X.; Zhang, X.; Tao, J.; Li, H.; Zhang, Y. An evaluation of the development performance of small county towns and its influencing factors: A case study of small towns in Jiangyin City in the Yangtze River Delta, China. Land 2022, 11, 1059. [Google Scholar] [CrossRef]
- Li, J.; Liu, S.; Peng, B.; Ye, H.; Zhang, Z. Identification and Optimization of County-Level Ecological Spaces under the Dual-Carbon Target: A Case Study of Shaanxi Province, China. Remote Sens. 2023, 15, 4009. [Google Scholar] [CrossRef]
- Zhong, M.; Liu, Q.; Hu, X. Understanding the county-level relationship between population change and ecological environment quality dynamic in China, 2000–2020. Front. Environ. Sci. 2025, 13, 1513998. [Google Scholar] [CrossRef]
Disclaimer/Publisher’s Note: The statements, opinions and data contained in all publications are solely those of the individual author(s) and contributor(s) and not of MDPI and/or the editor(s). MDPI and/or the editor(s) disclaim responsibility for any injury to people or property resulting from any ideas, methods, instructions or products referred to in the content. |
© 2025 by the authors. Licensee MDPI, Basel, Switzerland. This article is an open access article distributed under the terms and conditions of the Creative Commons Attribution (CC BY) license (https://creativecommons.org/licenses/by/4.0/).