2.1. Geographical and Geological Outline
This subsection summarizes the geographic, climatic, and geological controls underlying the selection of factors for susceptibility mapping and subsequent overlap with gas/water networks. There is a strong link between the landscape features and the intense soil sealing and population density that affect the area, underlining the importance of developing a reliable methodology to assess the network’s risk.
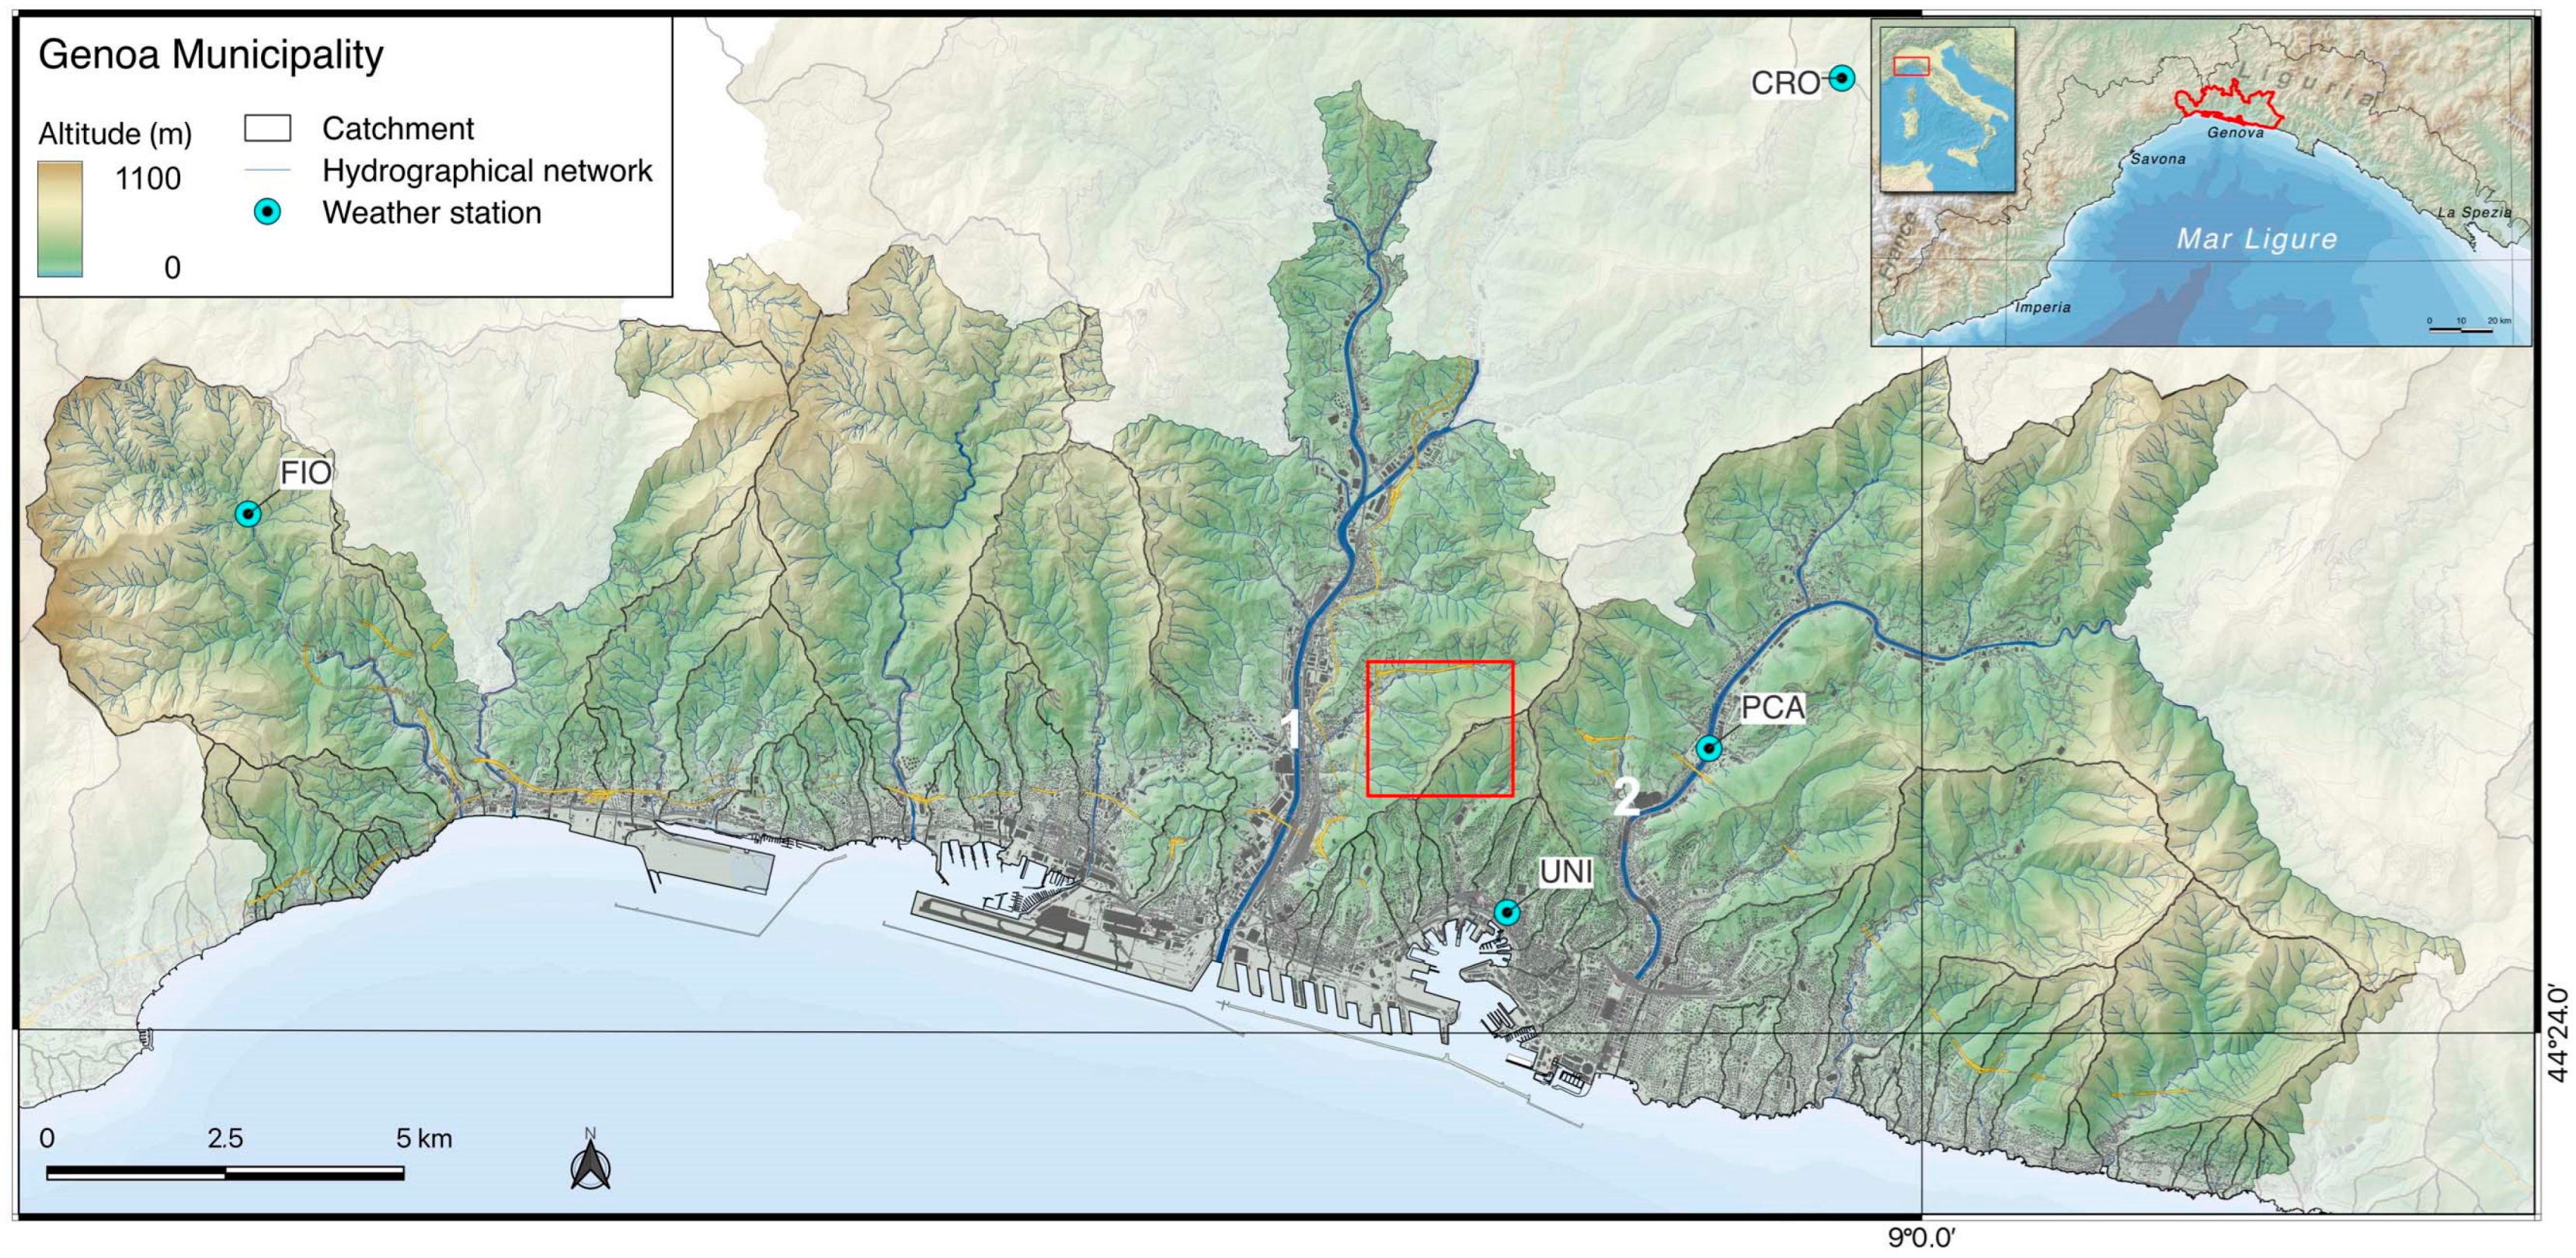
Genoa is a coastal city and the capital of the Liguria region. It is located in the north-western Italian macro-region (
Figure 1) and extends over approximately 240 km
2, mostly distributed along a coastal strip stretching for 30 km from east to west (
Figure 1). Subordinately, the city also extends along the two main drainage axes orthogonal to the coastline, the Bisagno and Polcevera streams (
Figure 1), which limit the morphological amphitheater on which the historic city center has been built [
46].
The resident population of Genoa is about 560,000 [
48], but in the 1970s, when the industrial sector (especially related to the port) was at its peak, it reached 800,000 [
49]. In that condition, urban planning had already foreseen a city of 1 million inhabitants. The population density is the highest in the central municipal area, particularly in the final stretch of the alluvial plain of the Bisagno stream, in the historical amphitheater behind the port area, and near the mouth of the Polcevera stream. The population reaches 25,000 inhabitants/km
2 in Marassi (Lower Bisagno Valley), east of the amphitheater, in an area of high flood hazard, and west of Sampierdarena district.
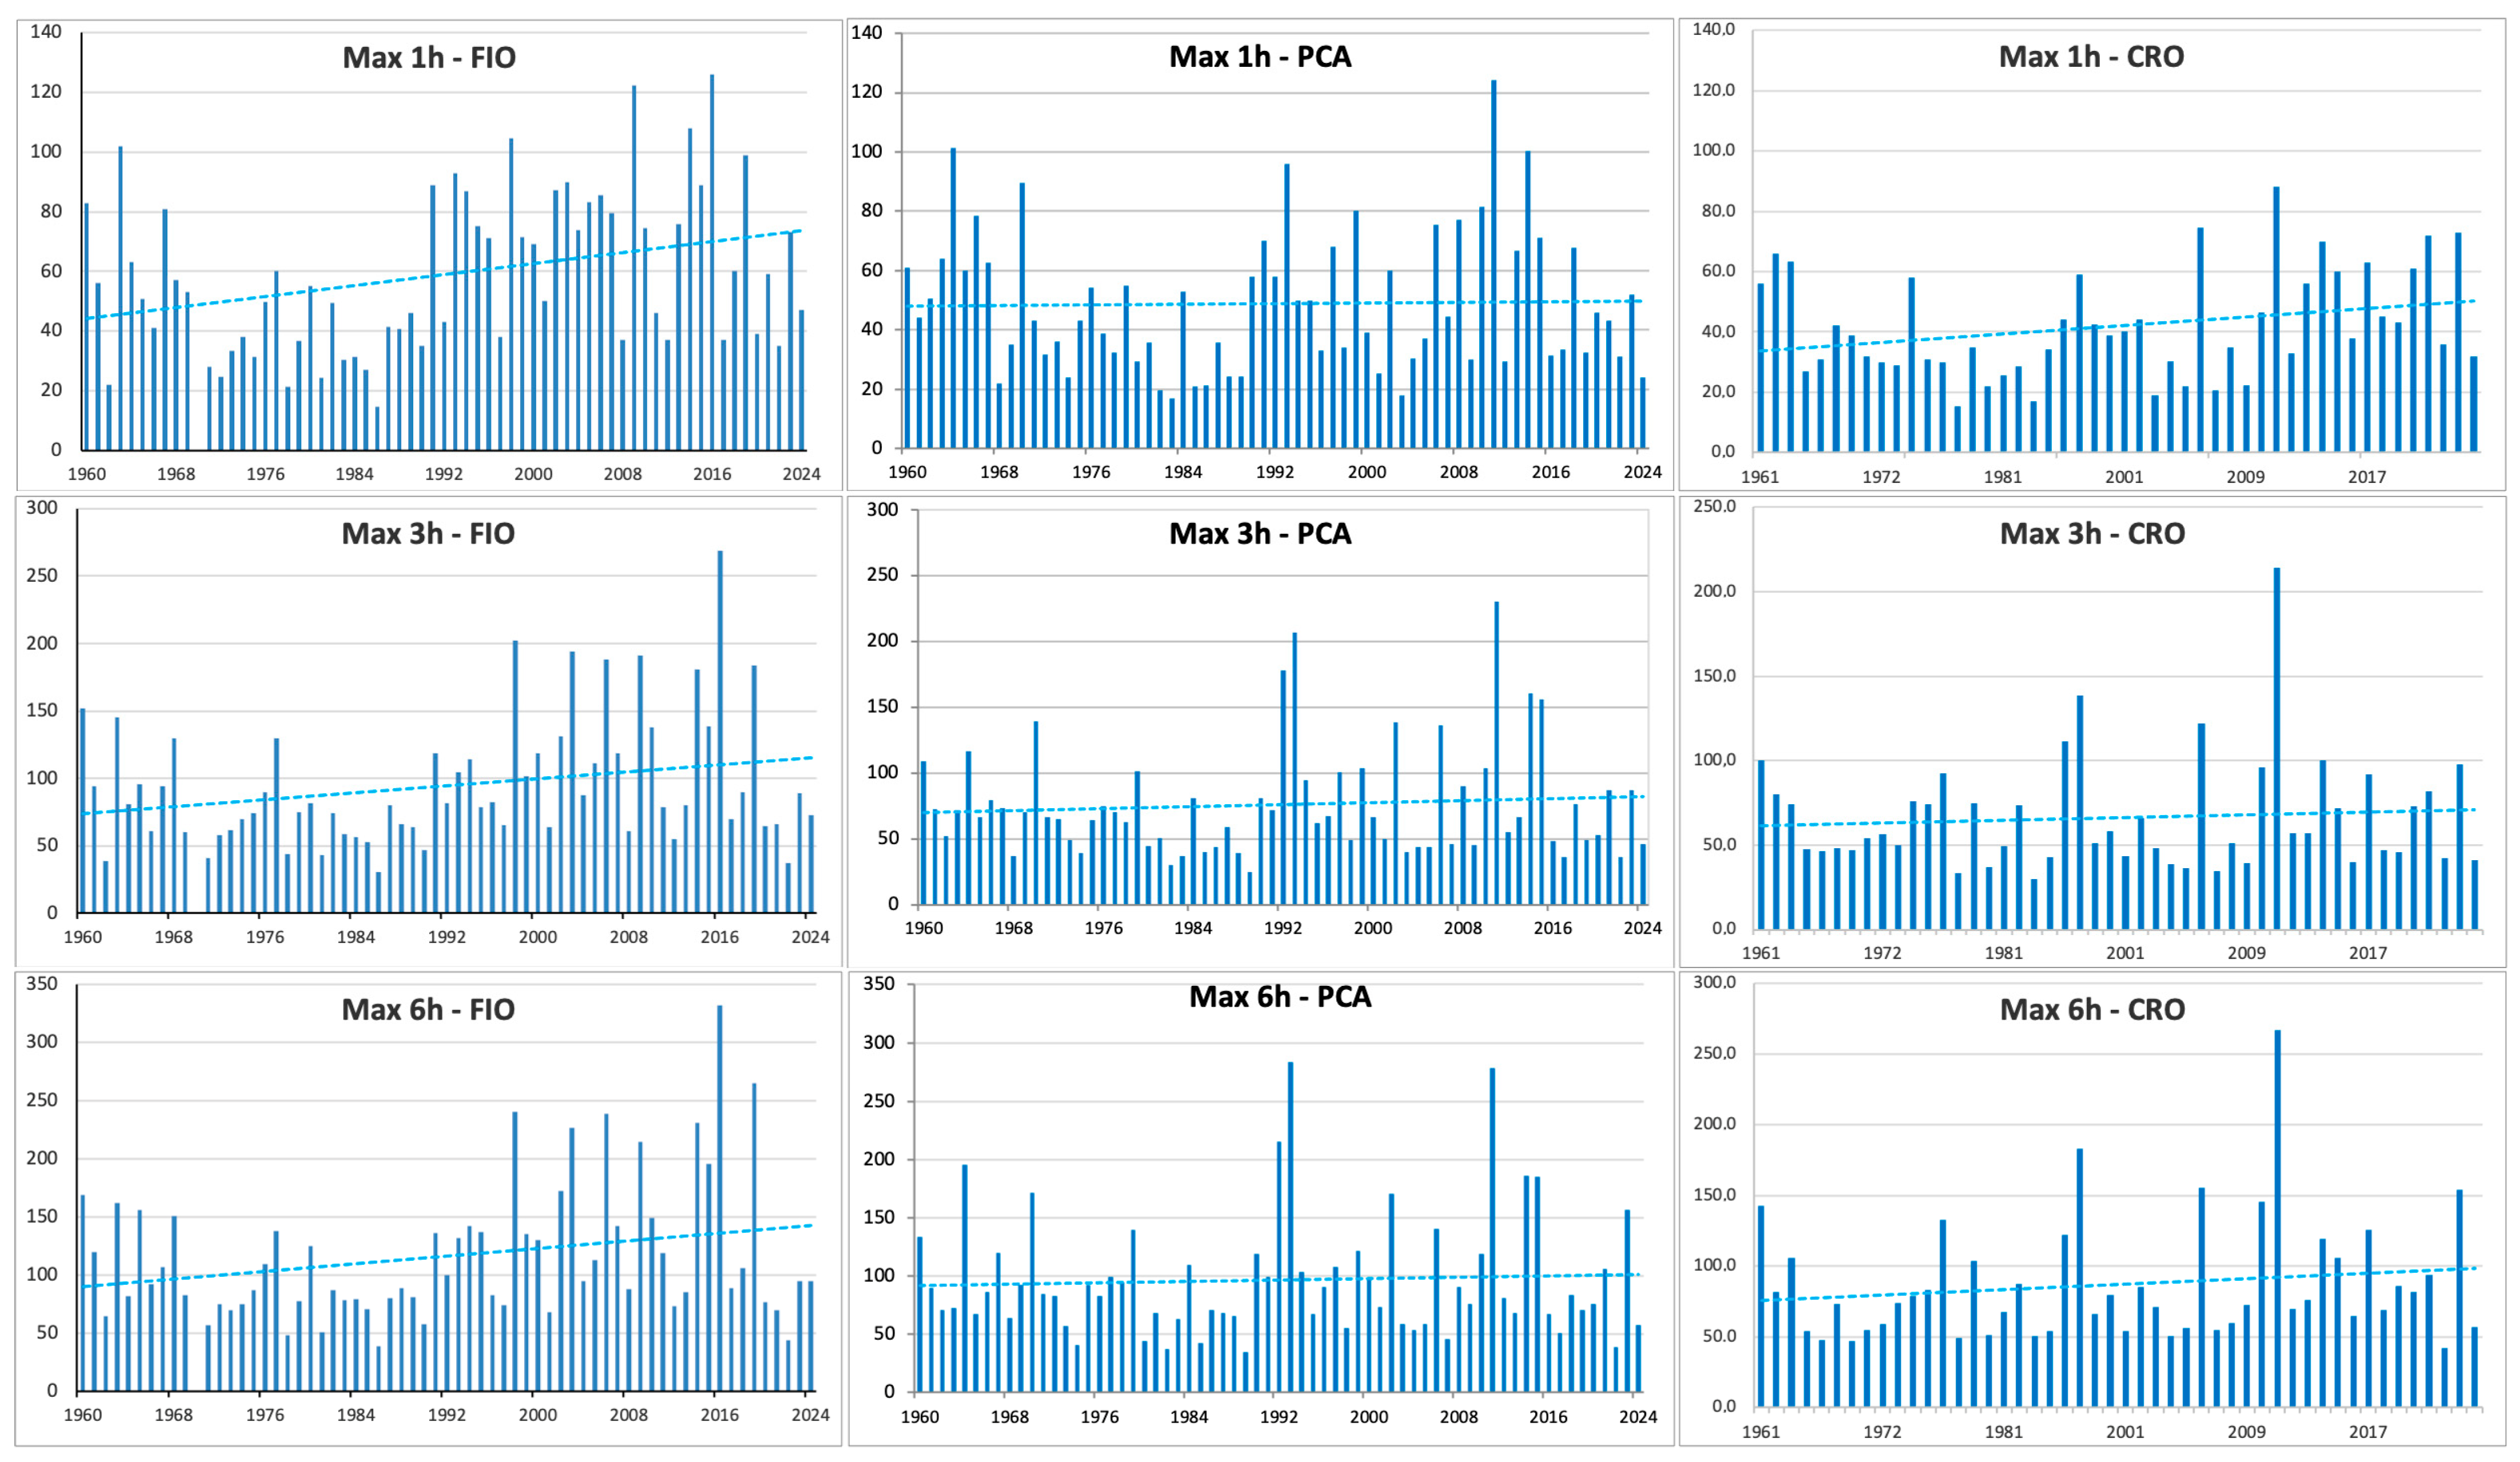
The physical–geographical features of Genoa are peculiar both in terms of meteorological–climatic aspects and landscape. Due to its location at the northern apex of the Western Mediterranean, in the late summer–autumn period, there is frequent depression over the Gulf of Genoa, bringing intense and high-intensity rainfall, and the metropolitan city of Genoa has rainfall records at a Mediterranean scale. The highest values have been exceeded during major flooding events: on 7–8 October 1970 (948 mm/24 h), 4 November 2011 (181 mm/h), and 4 October 2021 (883.8 mm/24 h, 740.6/12 h, 496 mm/6 h, and 377.8 mm/3 h).
This last event, which was particularly intense, affected the hinterland to the west of the city but avoided the municipal territory, triggering diffuse shallow landslides [
50]. During this event, the maximum values recorded over 12, 6, and 3 h exceeded the previous maximums that were measured during 1970 and 2011. The peculiarities of the ground effects and the landscape features of the study area suggested the causal factors used in the present research.
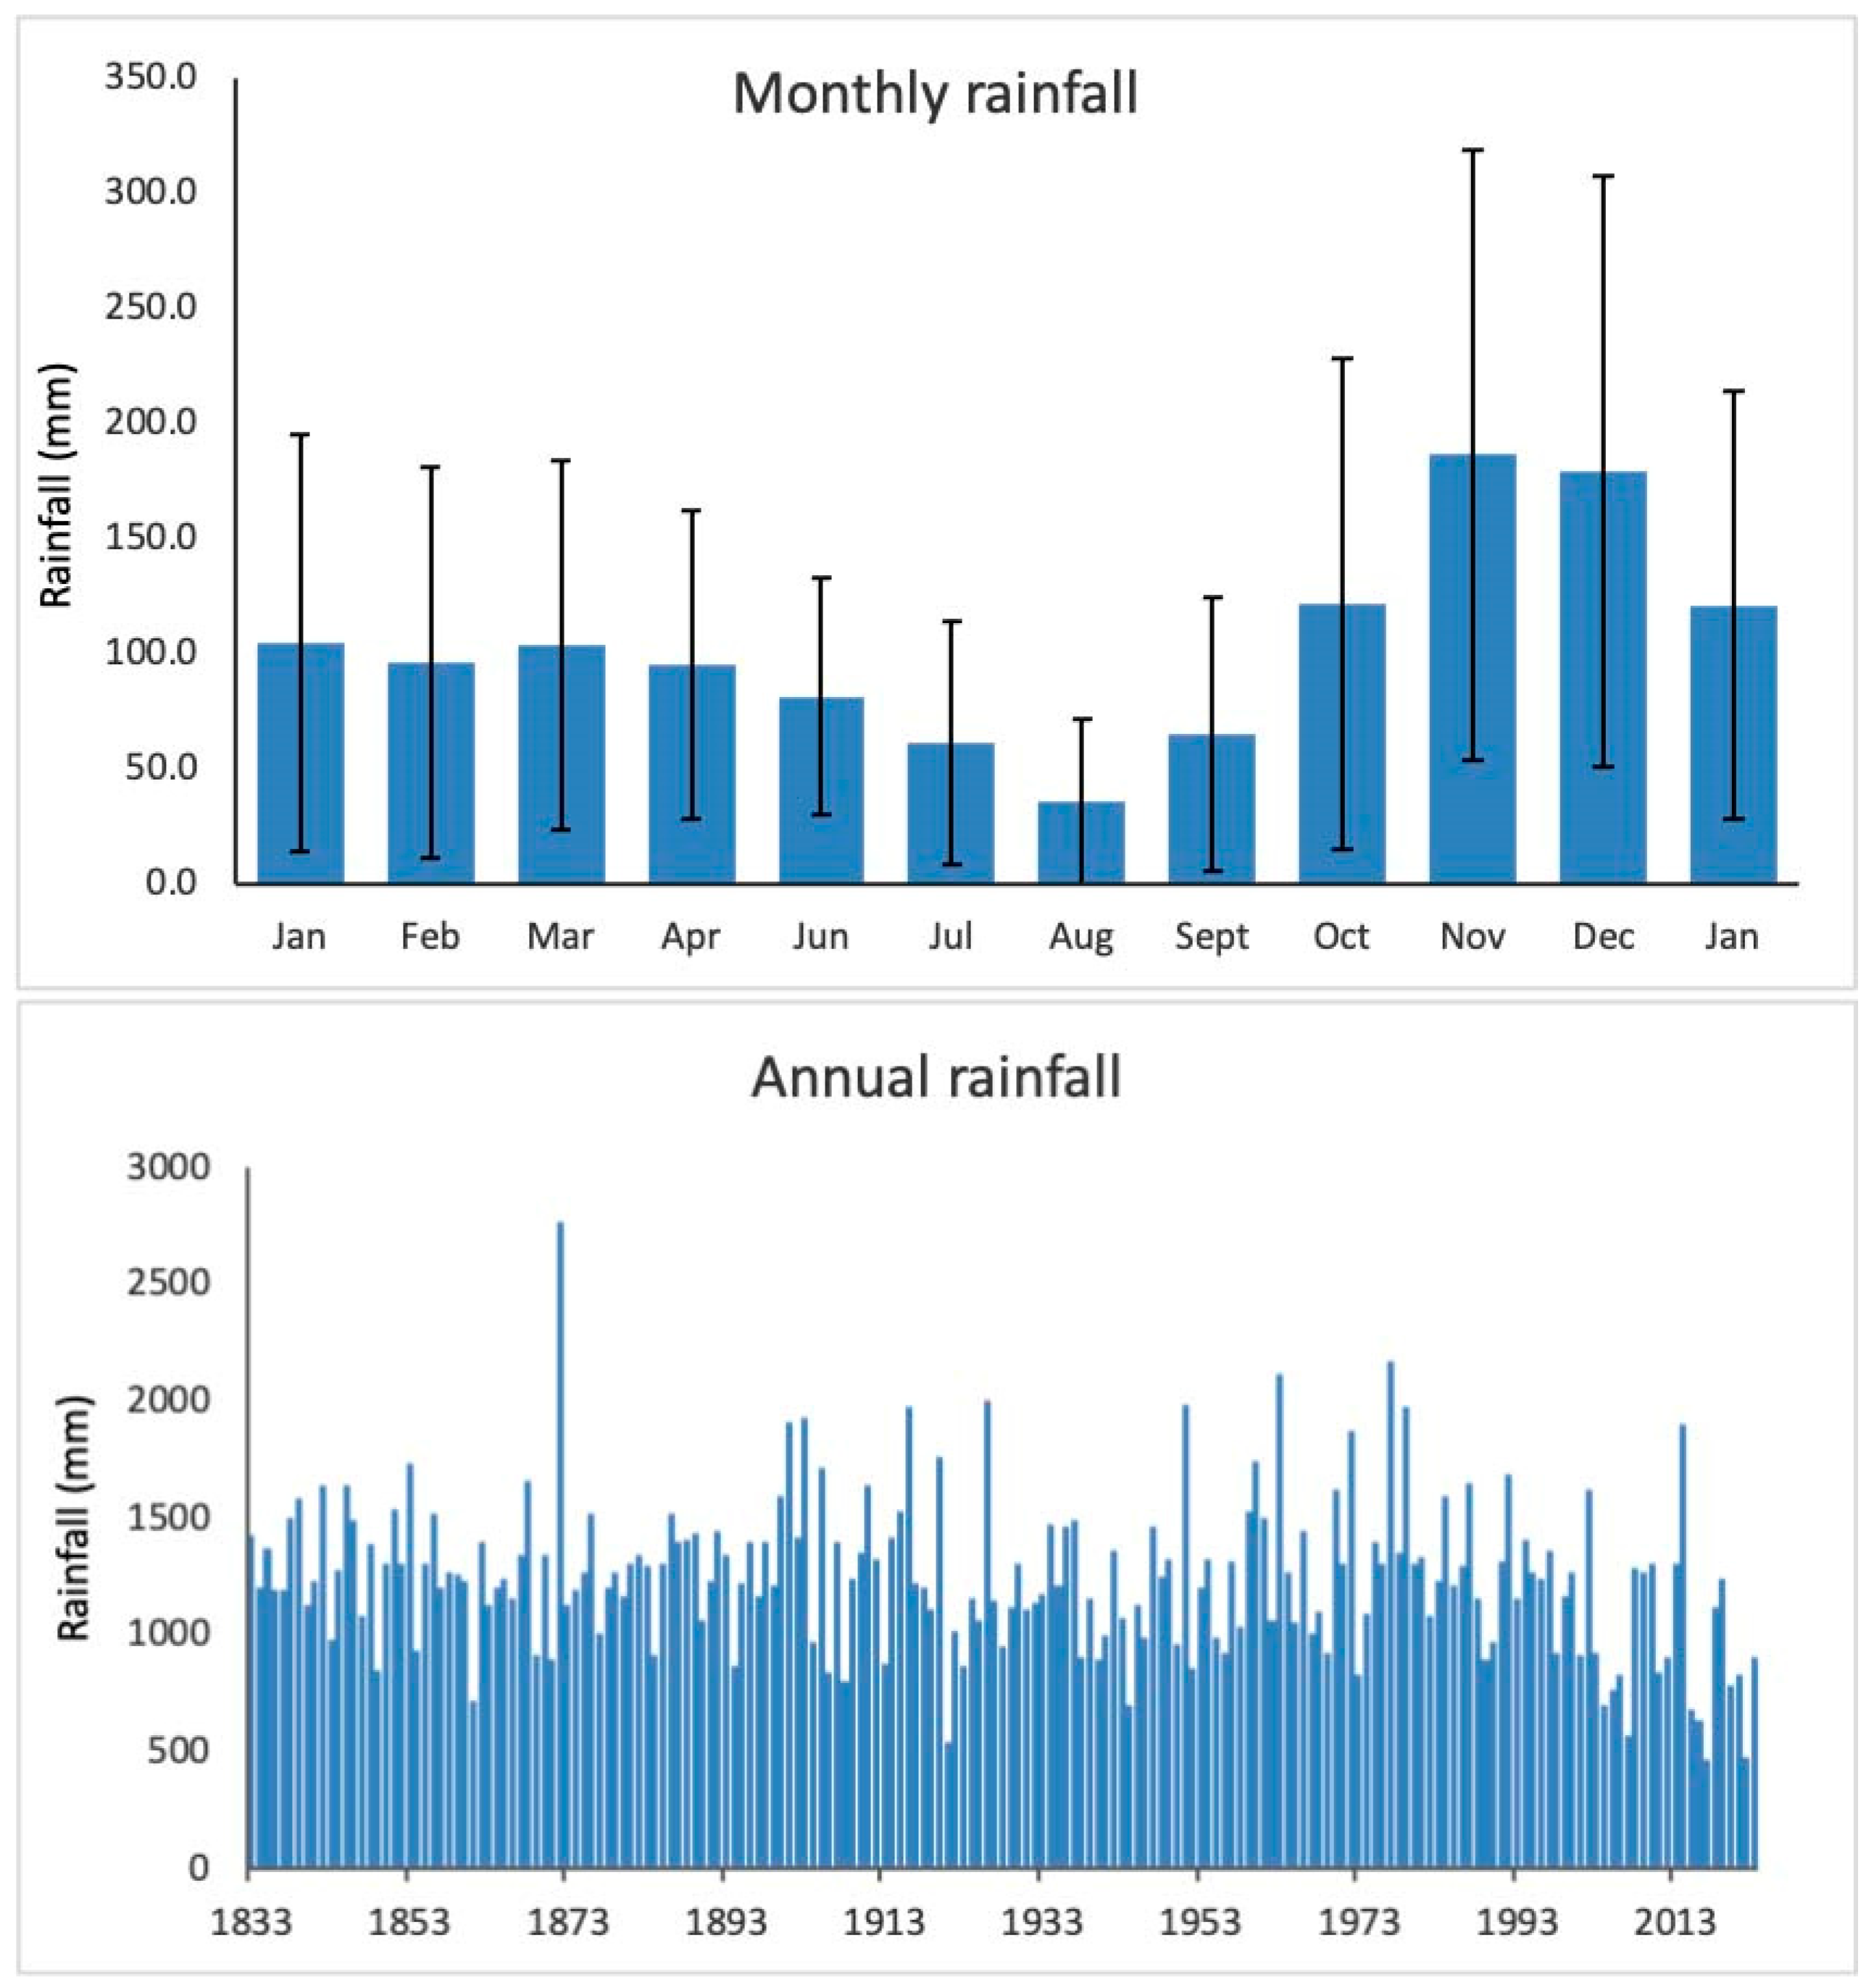
The average annual rainfall is 1250 mm in the city center and varies significantly with altitude.
Figure 2 shows the average monthly values recorded at the Genoa University station, which has been operating since 1833. The higher values of annual rainfall correspond to some catastrophic events that occurred in the past, while higher monthly values mainly occurred in the fall and, secondarily, in the spring.
Climate change in Genoa is demonstrated by an increase in the average annual air temperature and a decrease in the number of rainy days, resulting in an increase in the intensity of rainfall, leading to more frequent floods and landslides [
51,
52]. Moreover, proxies related to extreme rain events show a statistically significant increase over 1979–2019 [
53].
The area includes a large number of small catchment basins, mainly oriented perpendicular to the coastline. Not all of the watersheds belong entirely to the Municipality of Genoa: both those in the upper Bisagno basin and the upper Polcevera are part of other municipalities.
Based on the distance of the watershed from the coastline and the nature of the rock masses, slope gradients are generally high, especially in the eastern and western sectors of the municipal area, where values above 50% prevail. The morphometric and elevation features of the basins (
Figure 1) represent one of the most significant landslide factors, which results in a widespread hazard: during heavy rainfall, the reduced time of concentration, which may be even less than 30’, causes flash floods in the small floodplain. The result is a high risk due to intense urbanization.
During flood events, often a flash flood, shallow landslides are triggered, along with, depending on the morphological features of the territory, debris mudflows. These quickly moving masses cause a significant hazard for directly exposed elements, such as buildings and infrastructure, and an indirect hazard related to the saturation of the culverts, which are diffusively present in the urban area. The effects on the ground can be very serious and include a loss of life as well as substantial economic damage.
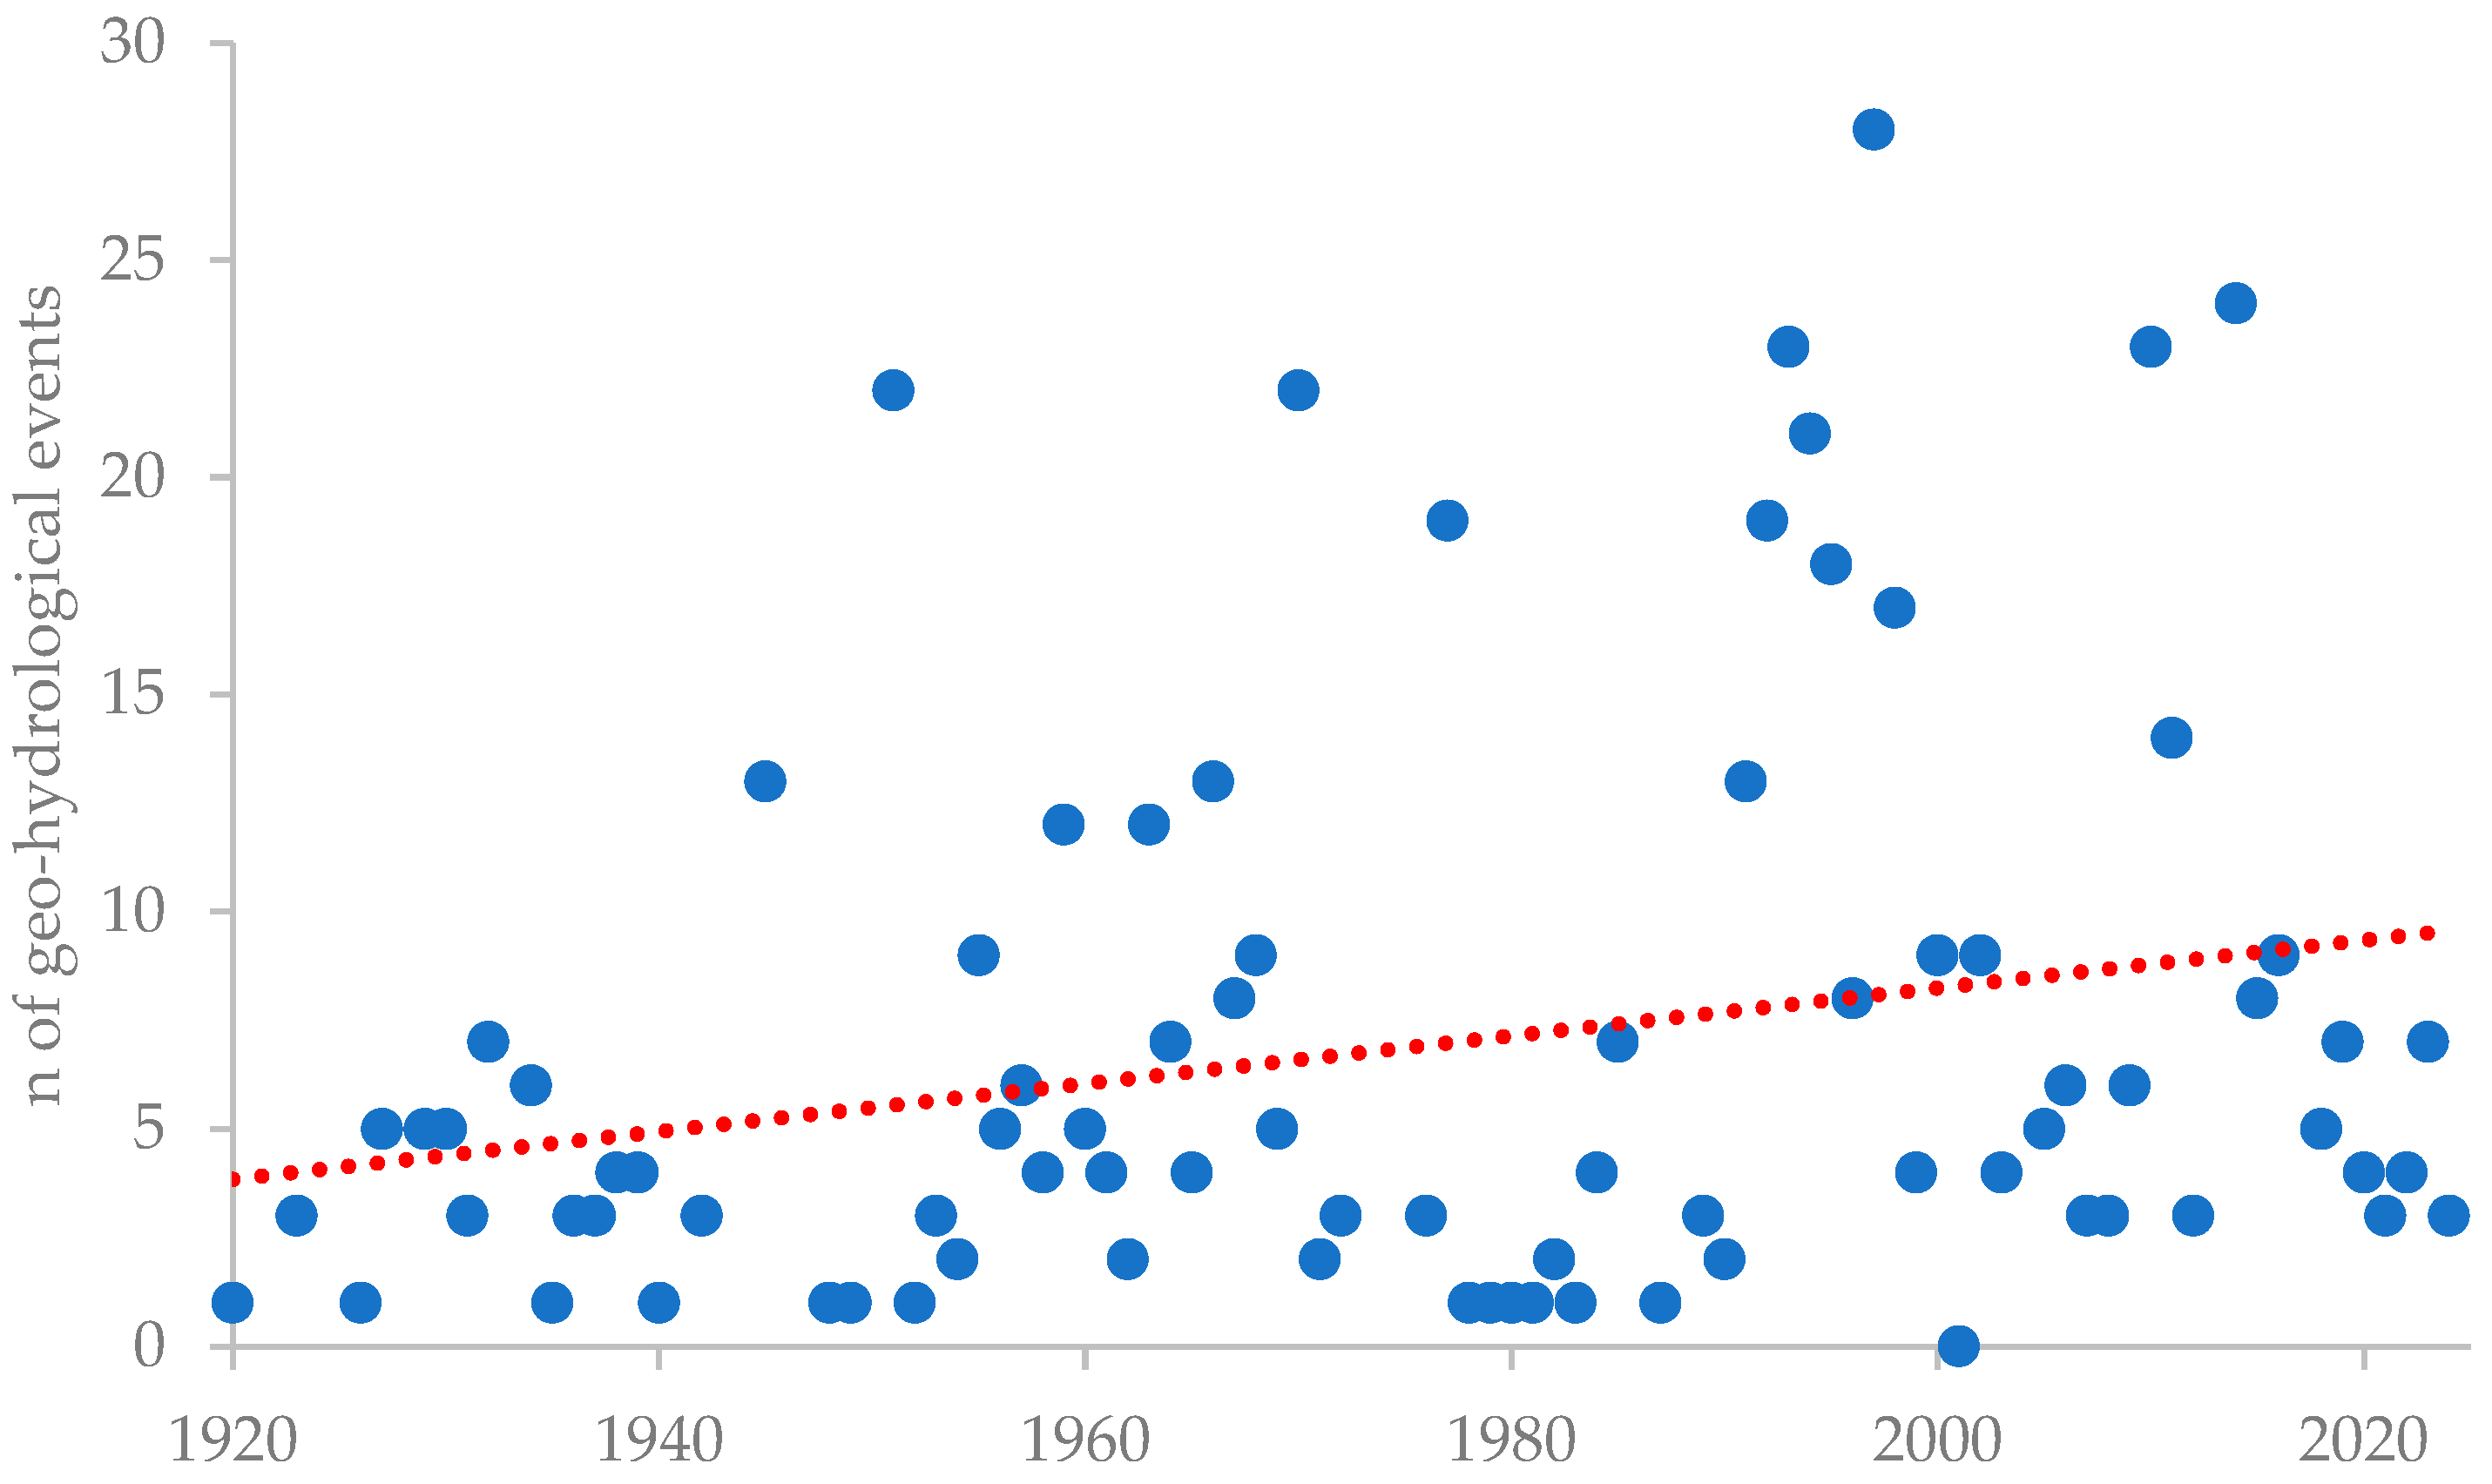
Table 1 and
Figure 3 show the geo-hydrological hazard events that have characterized the Genoese territory over the last 100 years based on the properly updated AVI project database [
54].
The city of Genoa’s geologic features contribute substantially to slope instability, inducing a natural hazard:
Figure 4 schematically shows the rock masses located in the Genoa area, predominantly sedimentary in the East (limestone–marly flysch), and ophiolitic in the West (serpentinites and calcareous schist). The central sector is particularly complex and characterized by argillitic and siltitic flysch, basalts, and dolomites [
55]. In the present study, we focused on shallow landslides, which involve soil over the rock substratum. The lithology and the morphometry of the study area are considered crucial factors: in particular, slope steepness is related to the lithology and tectonic deformation that occurred after the Alpine and Apennine orogenic events. Simultaneously, lithology affects the development of different soil types, which may trigger a shallow landslide. The altitude ranges from sea level to 1183 m asl, with a mean value of 279 m asl, while the mean slope gradient is 45.6%. The morphology is related to the hydrographical networks, which are characterized by good hierarchical development with many first-order Strahler
sensu streams and with a prevailing north–south and east–west orientation due to ductile deformations that affected the rocks. These features affect the running water concentration.
The geological history of rock formations is an additional element causing slope instability and triggering landslides characterized by different kinematic processes. Many phases of ductile and brittle deformation affect the rocks, which slightly differ in strength and deformability; consequently, the various deformation patterns influence the rocks in terms of weathering resistance and geotechnical behavior.
2.2. Research Methods
The susceptibility assessment of shallow landslides in the Municipality of Genoa was conducted by employing a semi-quantitative approach, which means combining a quantitative and a qualitative method according to previous research in a nearby territory [
19,
47,
50]. This approach was partially modified, including a quantitative component to evaluate the causative factors. The workflow is as follows: (i) shallow landslide inventory extraction from national databases and random subdivision in 80% and 20% subsets; (ii) the selection of seven causal factors related to the area features, as described in
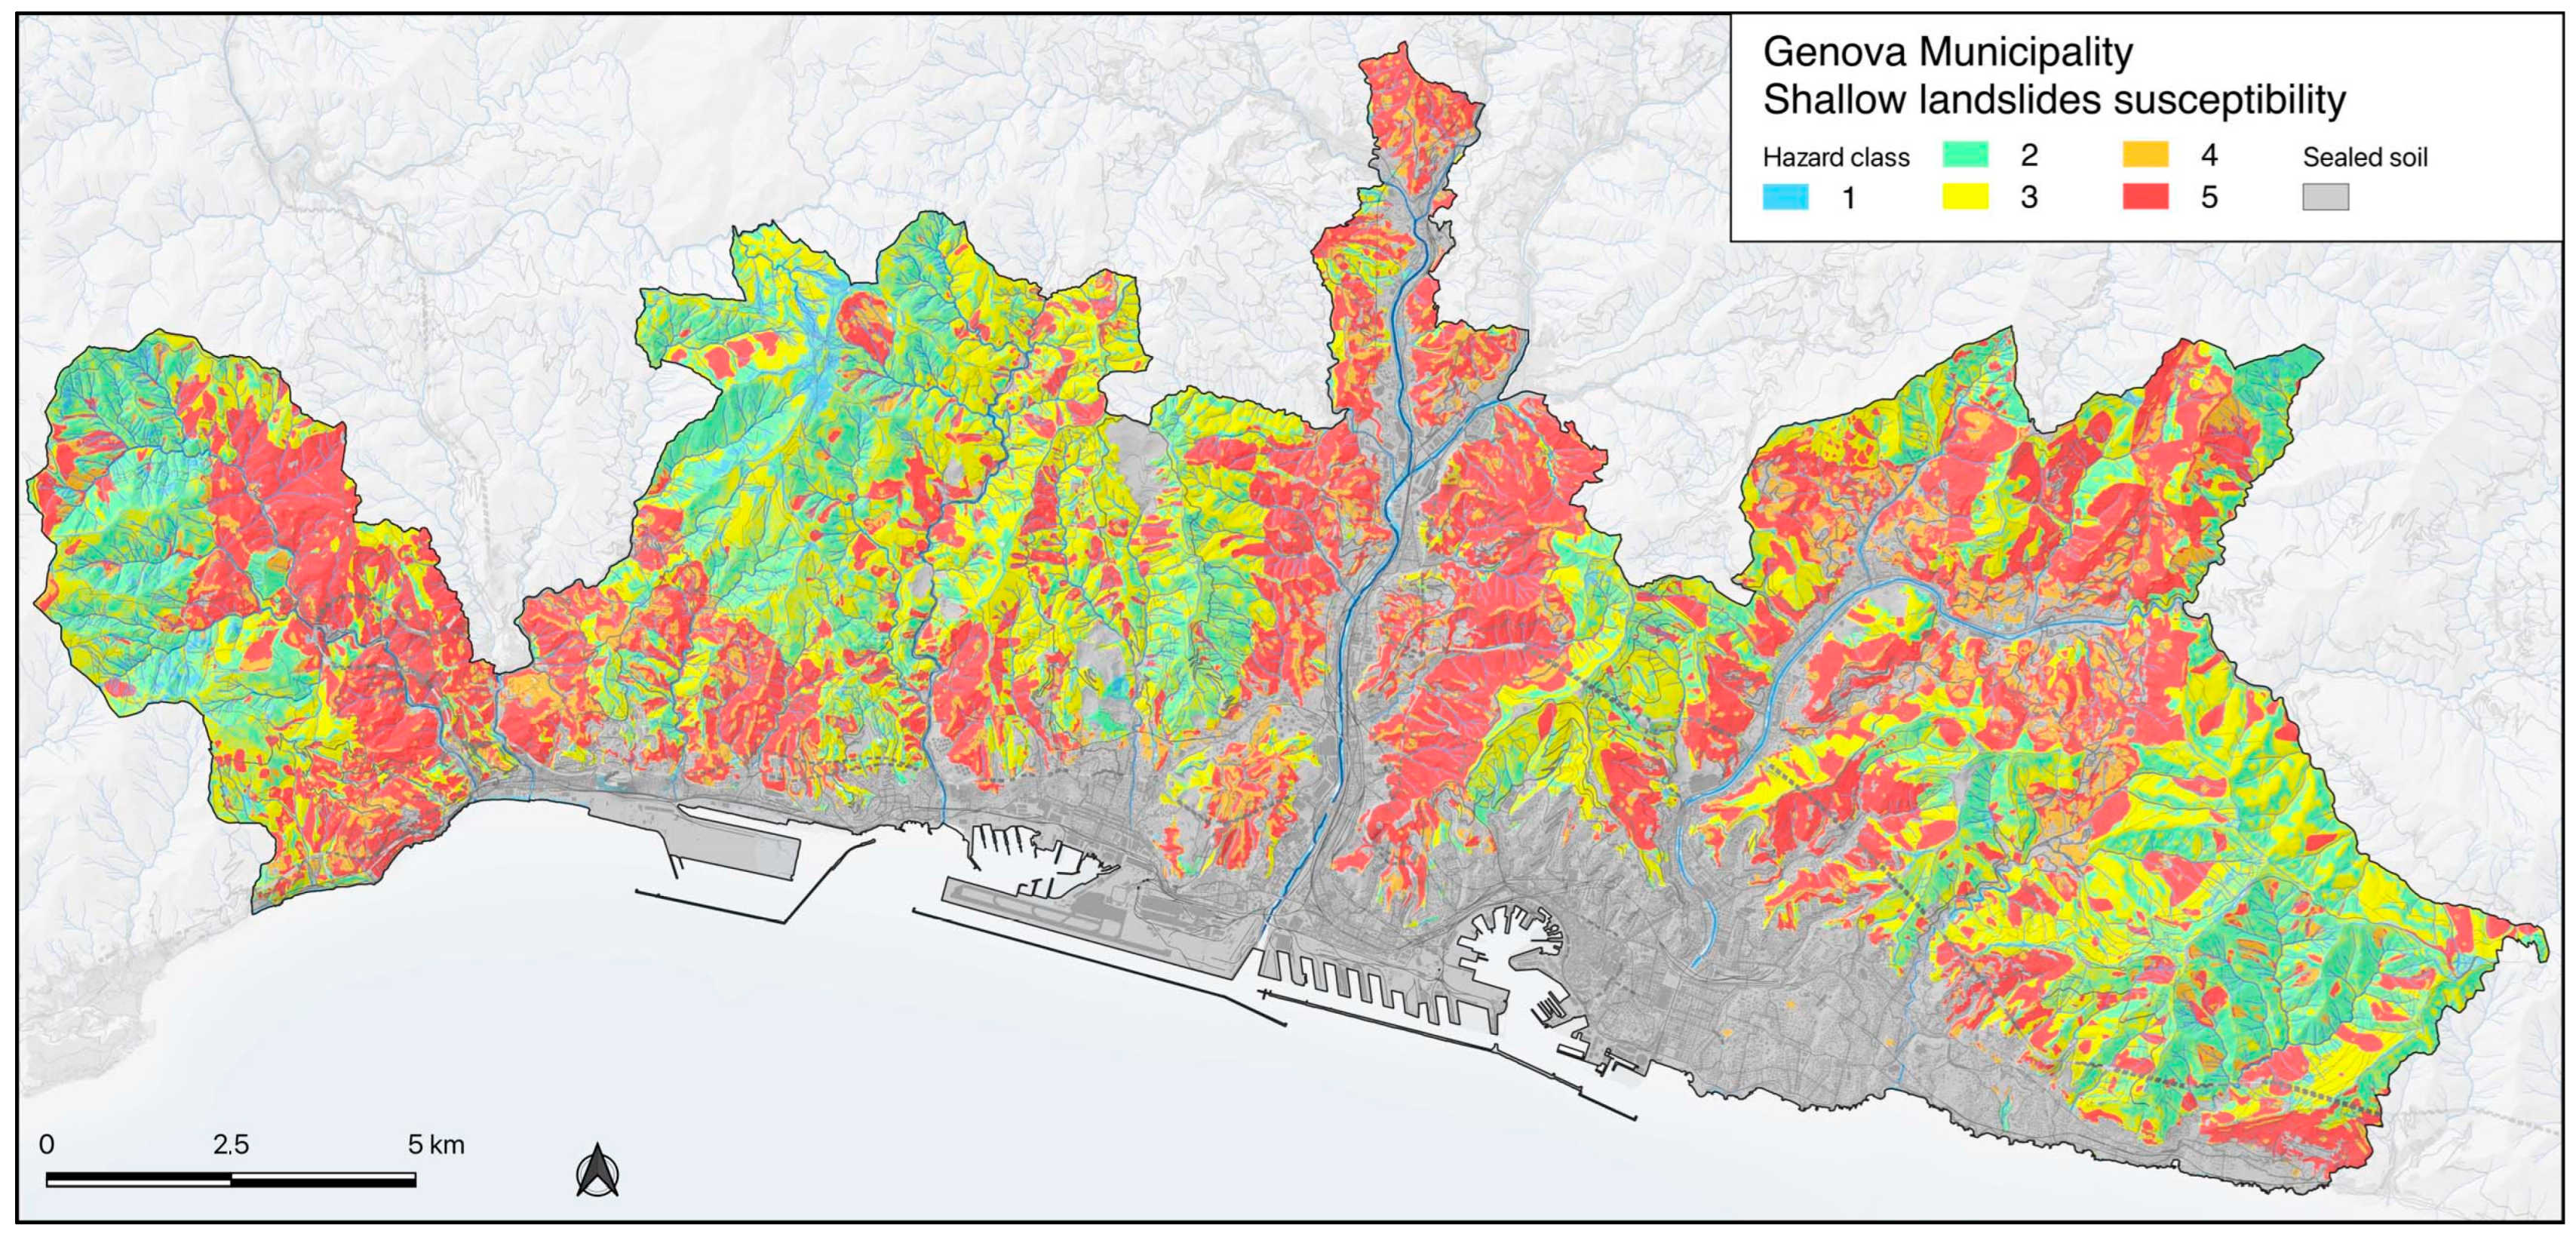
Section 2.1; (iii) statistics of the phenomena per causal factor to be used as weights for every factor; (iv) weighting process for every causal factor; (v) application of AHP methodology using five experts’ evaluation of the causal factors, to be used as factor weights; (vi) weighting process and linear sum of the seven factors; (vii) normalization of the result and subdivision into five susceptibility classes.
The method, schematized in
Figure 5, is based on identifying a set of descriptive parameters of the area as factors triggering shallow landslides, followed by a related descriptive statistical evaluation. The identification of factors follows the area features described in
Section 2.1 and the numerous triggering events of shallow landslides that have been observed in the last twenty years. Then, the results of the descriptive statistics for every factor are assigned as weights to the different classes into which every causing factor has been divided; every factor is consequently reclassified [
56,
57].
Then, the seven factors are weighted and linearly summed, and the result is normalized. These weights are identified by applying the AHP heuristic method (Analytic Hierarchy Process) [
58,
59,
60,
61,
62] by combining subjective evaluations of five experts [
61,
62]. This methodology is a modified version of the one already proposed and tested in the Mediterranean environment [
19,
47] in previous research. The AHP is a semi-quantitative multi-criteria decision support technique used to compare heterogeneous physical quantities, and it is widely applied in natural hazard management [
63,
64,
65,
66,
67,
68] and landslide susceptibility analysis [
8,
9,
19,
63,
64,
65,
66,
67,
68]. Further, the susceptibility analysis results are applied to the risk assessment of the gas and water distribution pipelines in the Municipality of Genoa, which is shown in
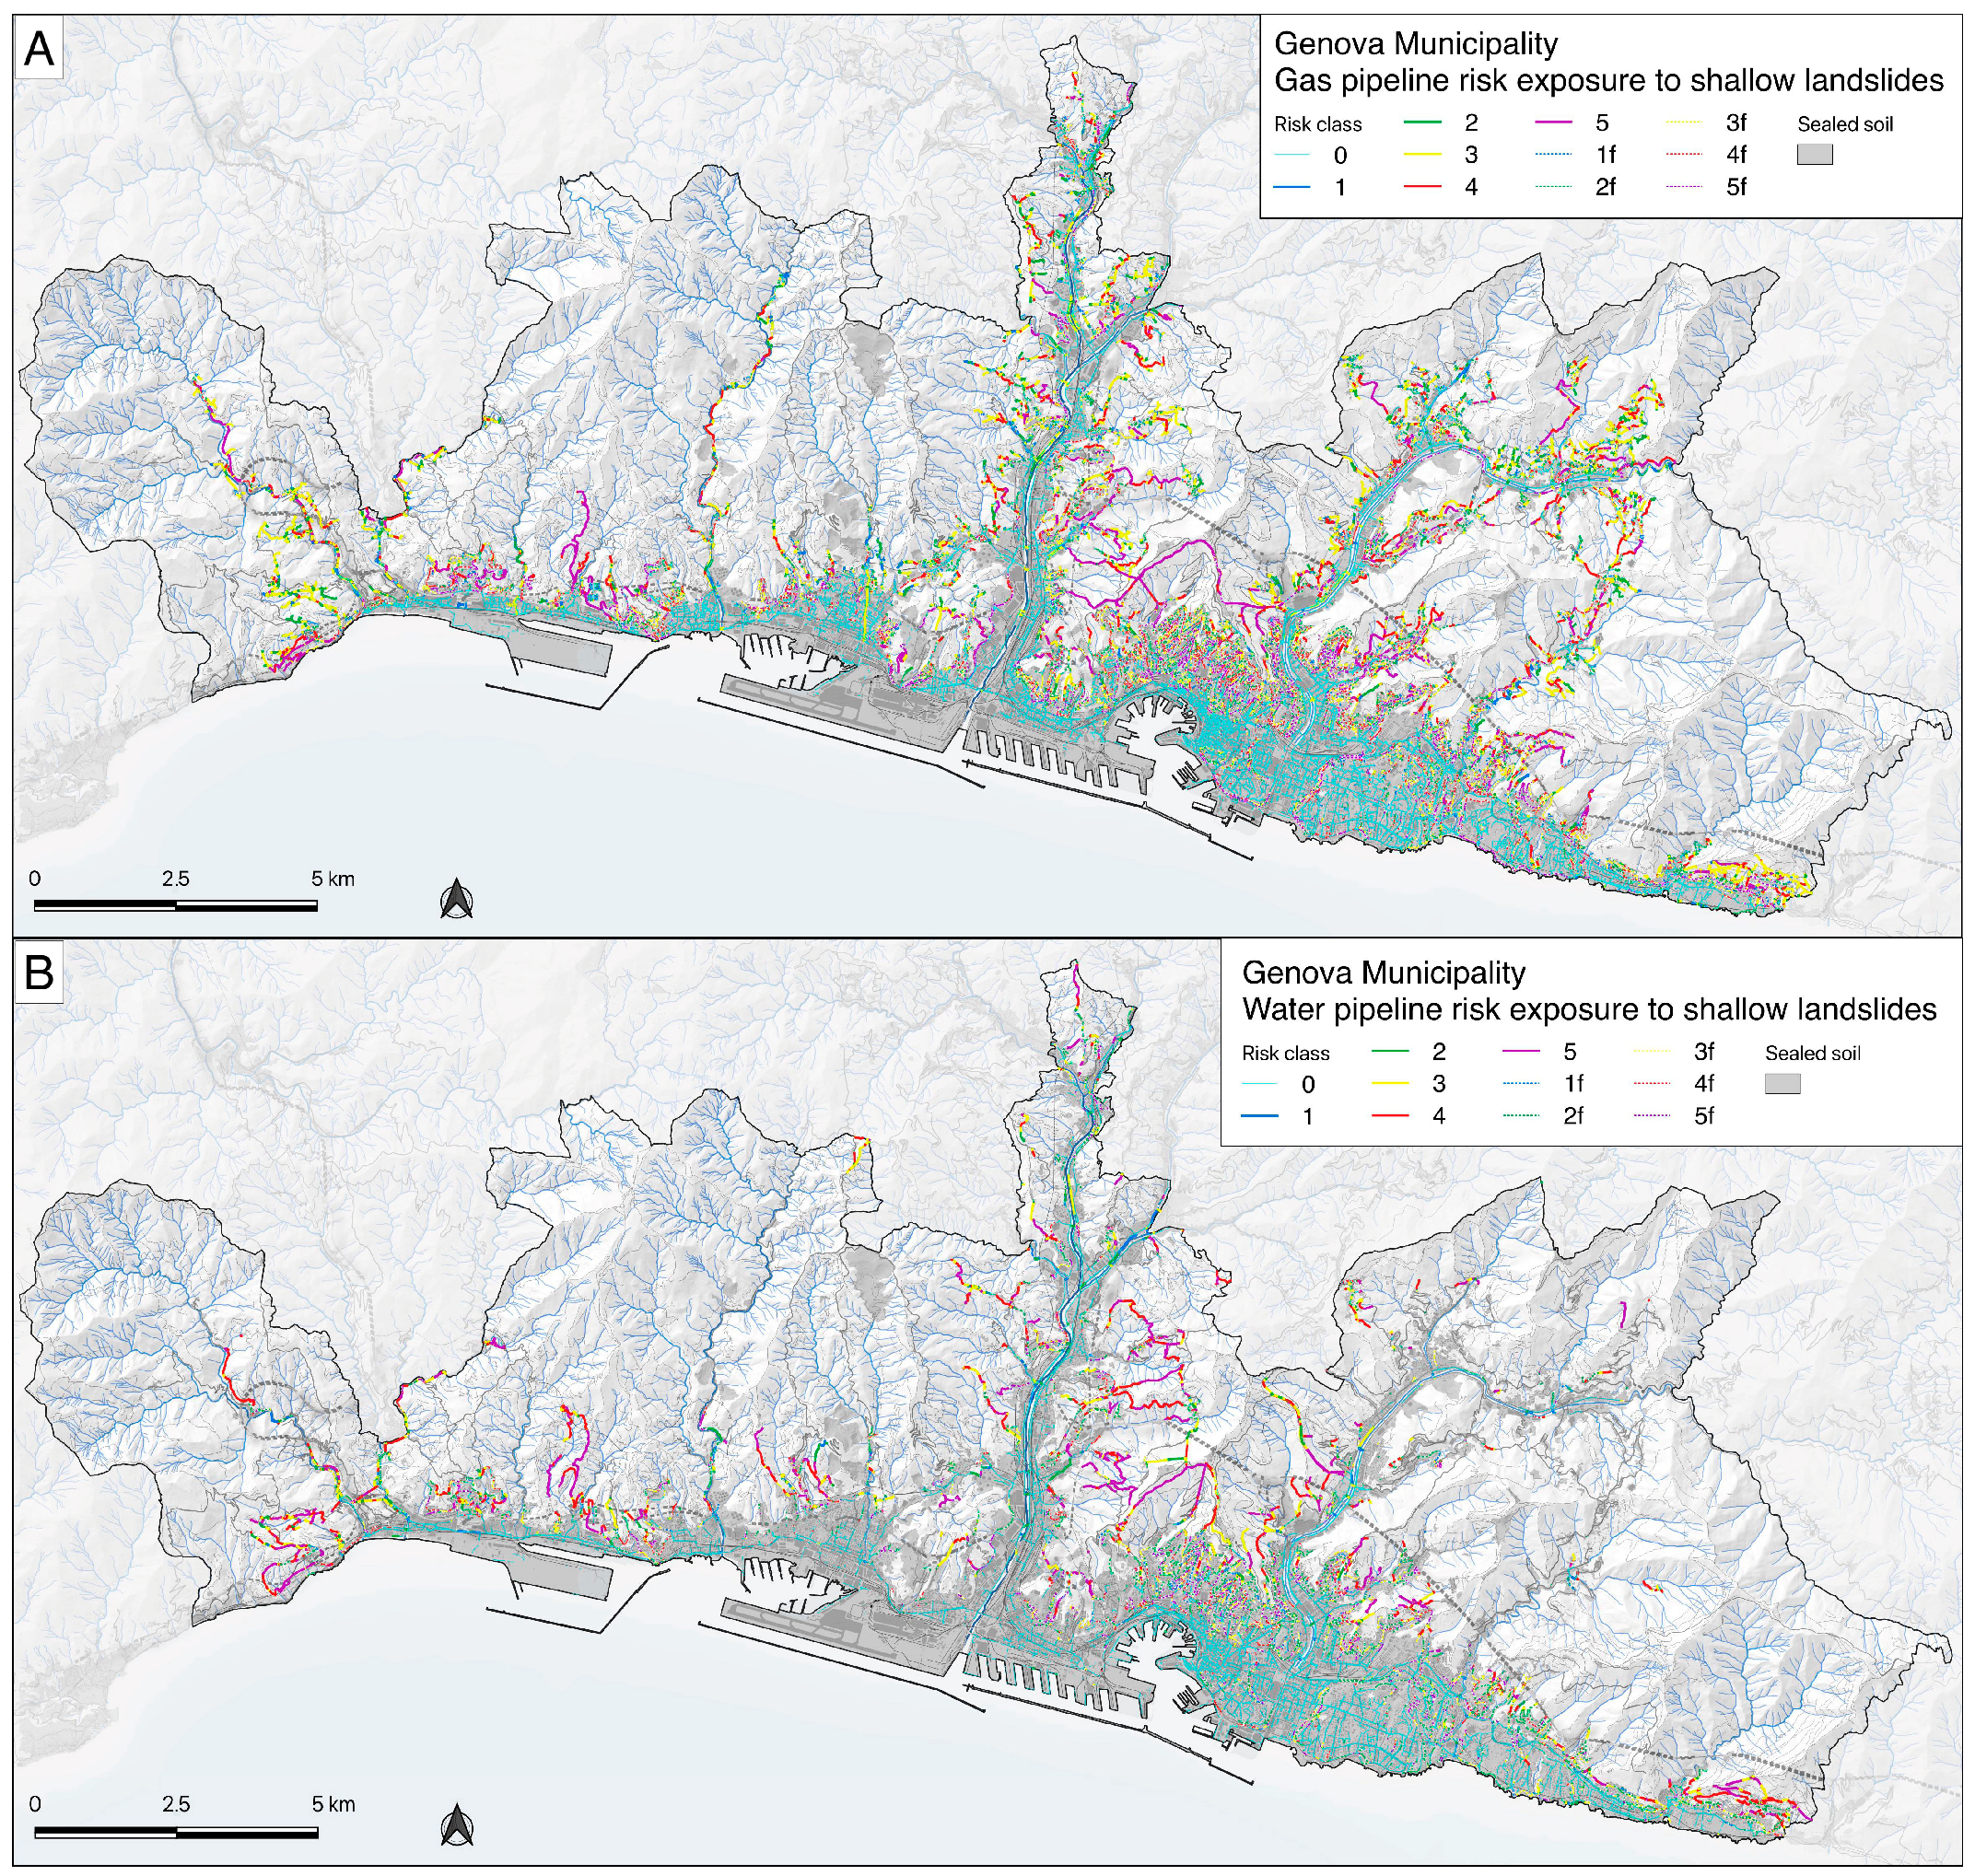
Figure 5.
The reference database used is the inventory of landslide phenomena in Italy from the IFFI project, integrated with data collected through the Copernicus system after the most recent intense events and from data acquired by the governing authority of the basin plans involving the municipal area [
54]. The combination of these geodatabases resulted in a total of 485 fast-developing shallow landslides that occurred in the municipal area. The inventory was used for statistical weighting and validation.
The case history of such phenomena in Liguria and beyond is expansive and has increased since the year 2000 [
46]: the events that occurred in Western Liguria in 2000; the hundreds of shallow landslides triggered during the flash flood that affected the Cinque Terre/Vara Valley in 2011; the events of October/November 2014 in Genoa Province; and the landslide that in Leivi, in the hinterland 50 km east from Genoa, claimed two lives; the 2016 Lavina di Rezzo (Imperia) debris flow; and the 2019 landslides in Cava Lupara (Genoa), Cenova di Rezzo (Imperia), and Madonna del Monte (Savona) that caused the collapse of the viaduct along the A6 highway.
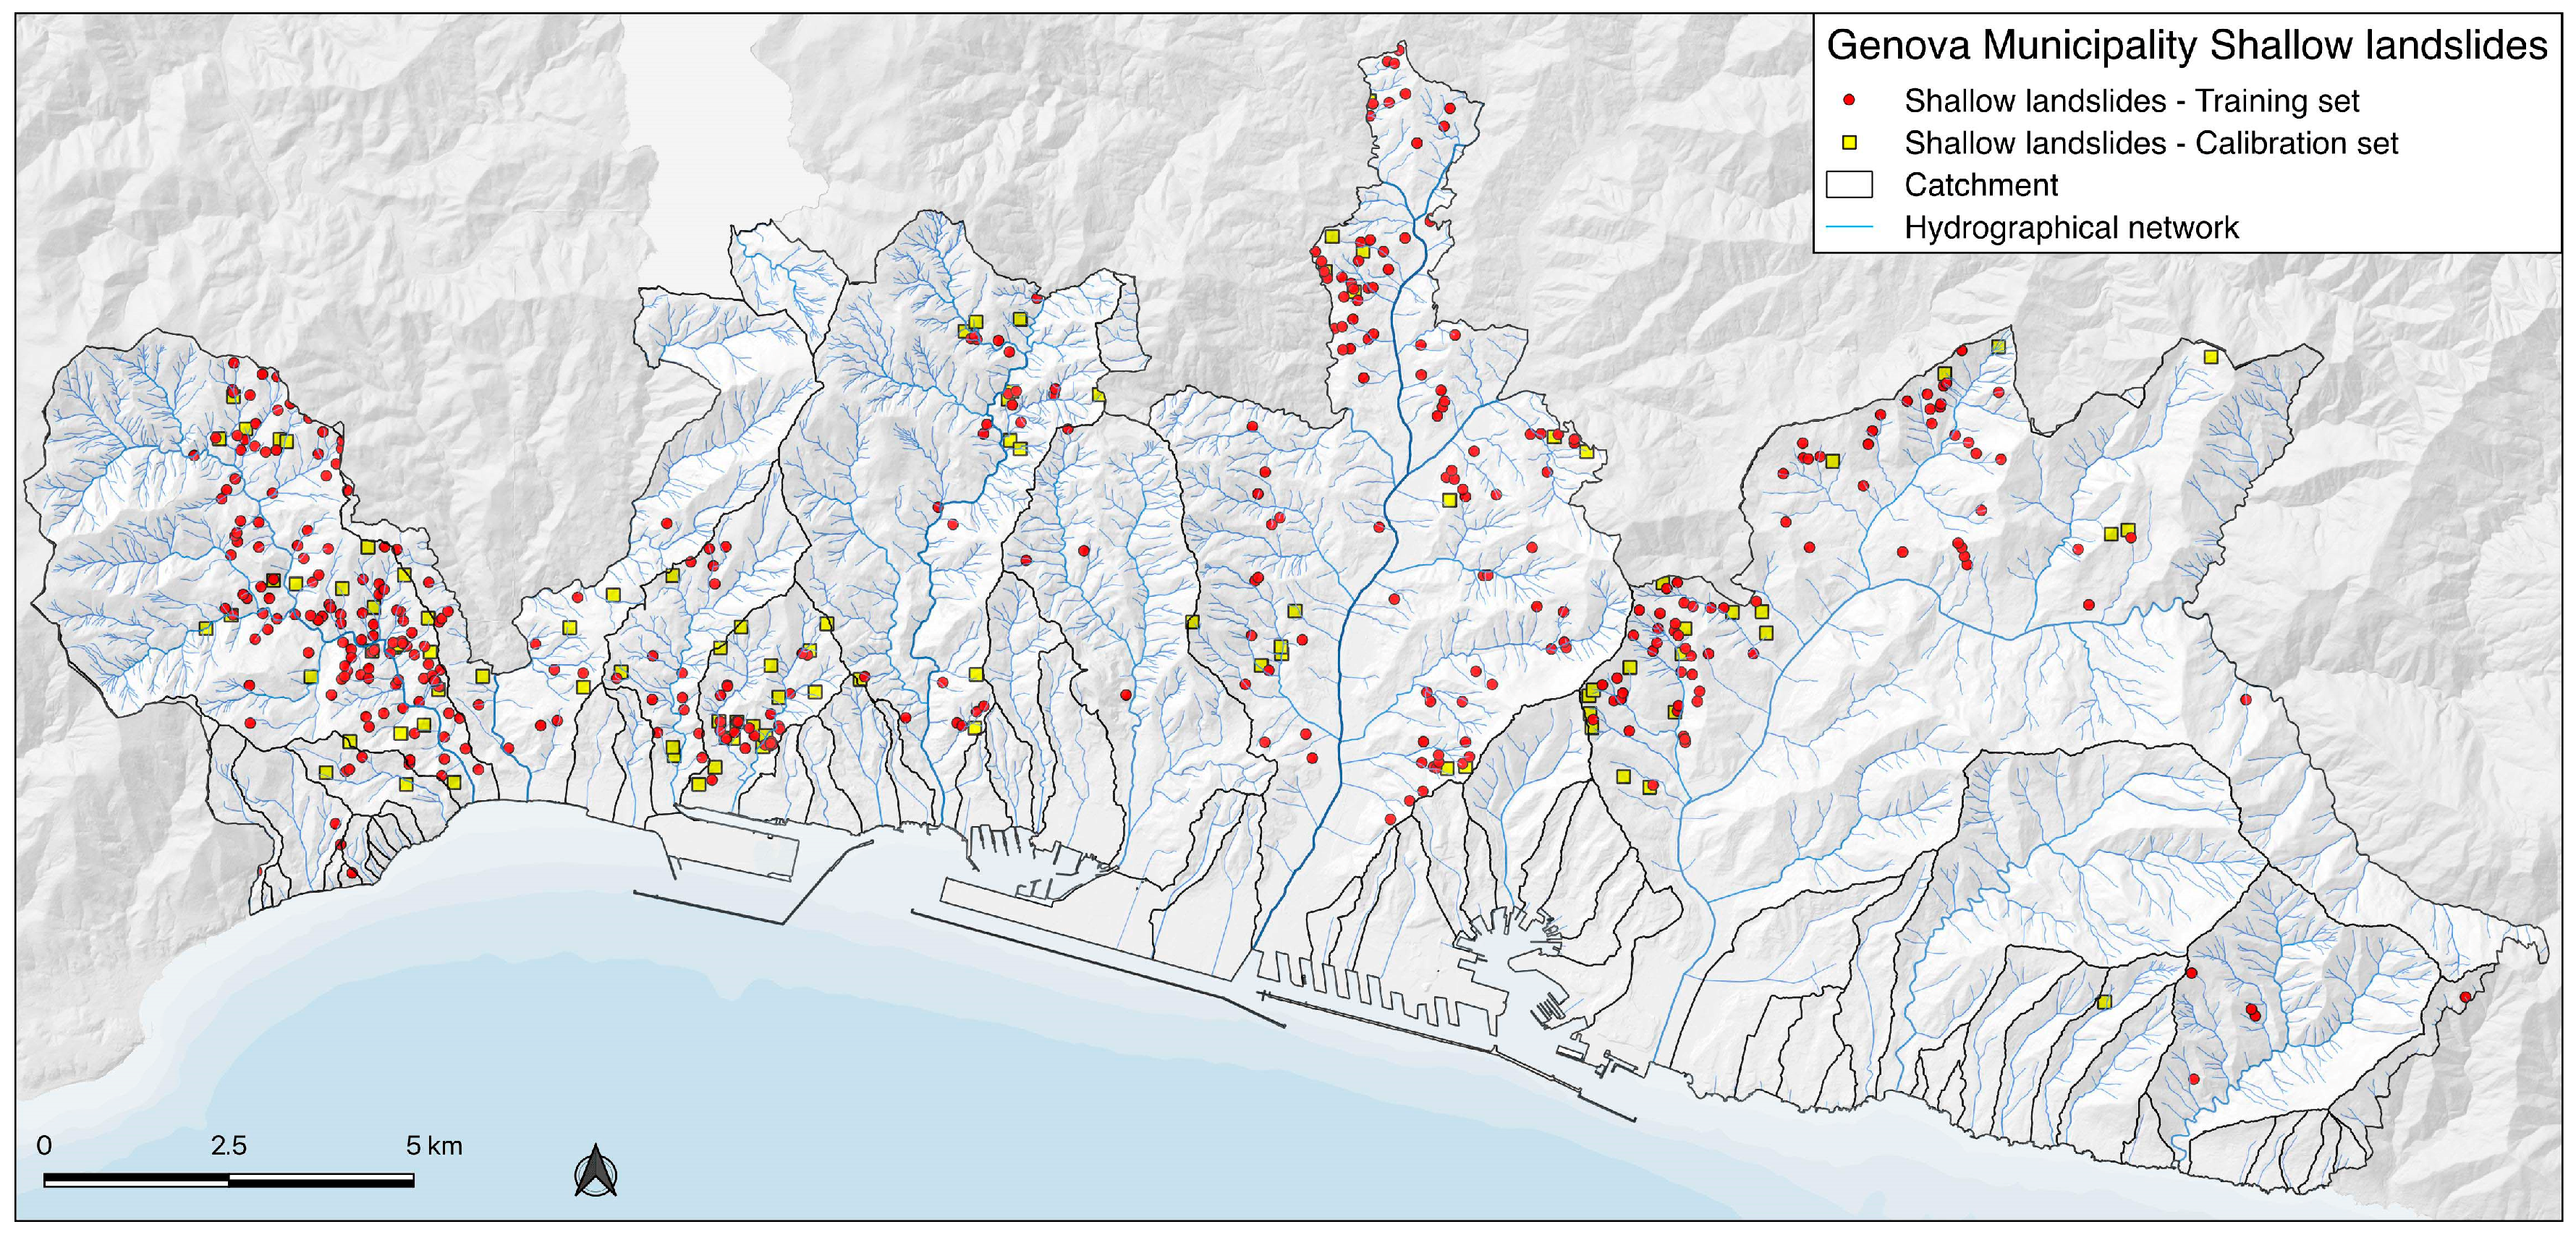
The set of census events at the municipal scale was divided via random extraction into two subsets: a training set of 388 phenomena accounting for 80 percent of the total and a calibration set of 97 phenomena accounting for the remaining 20 percent (
Figure 6).
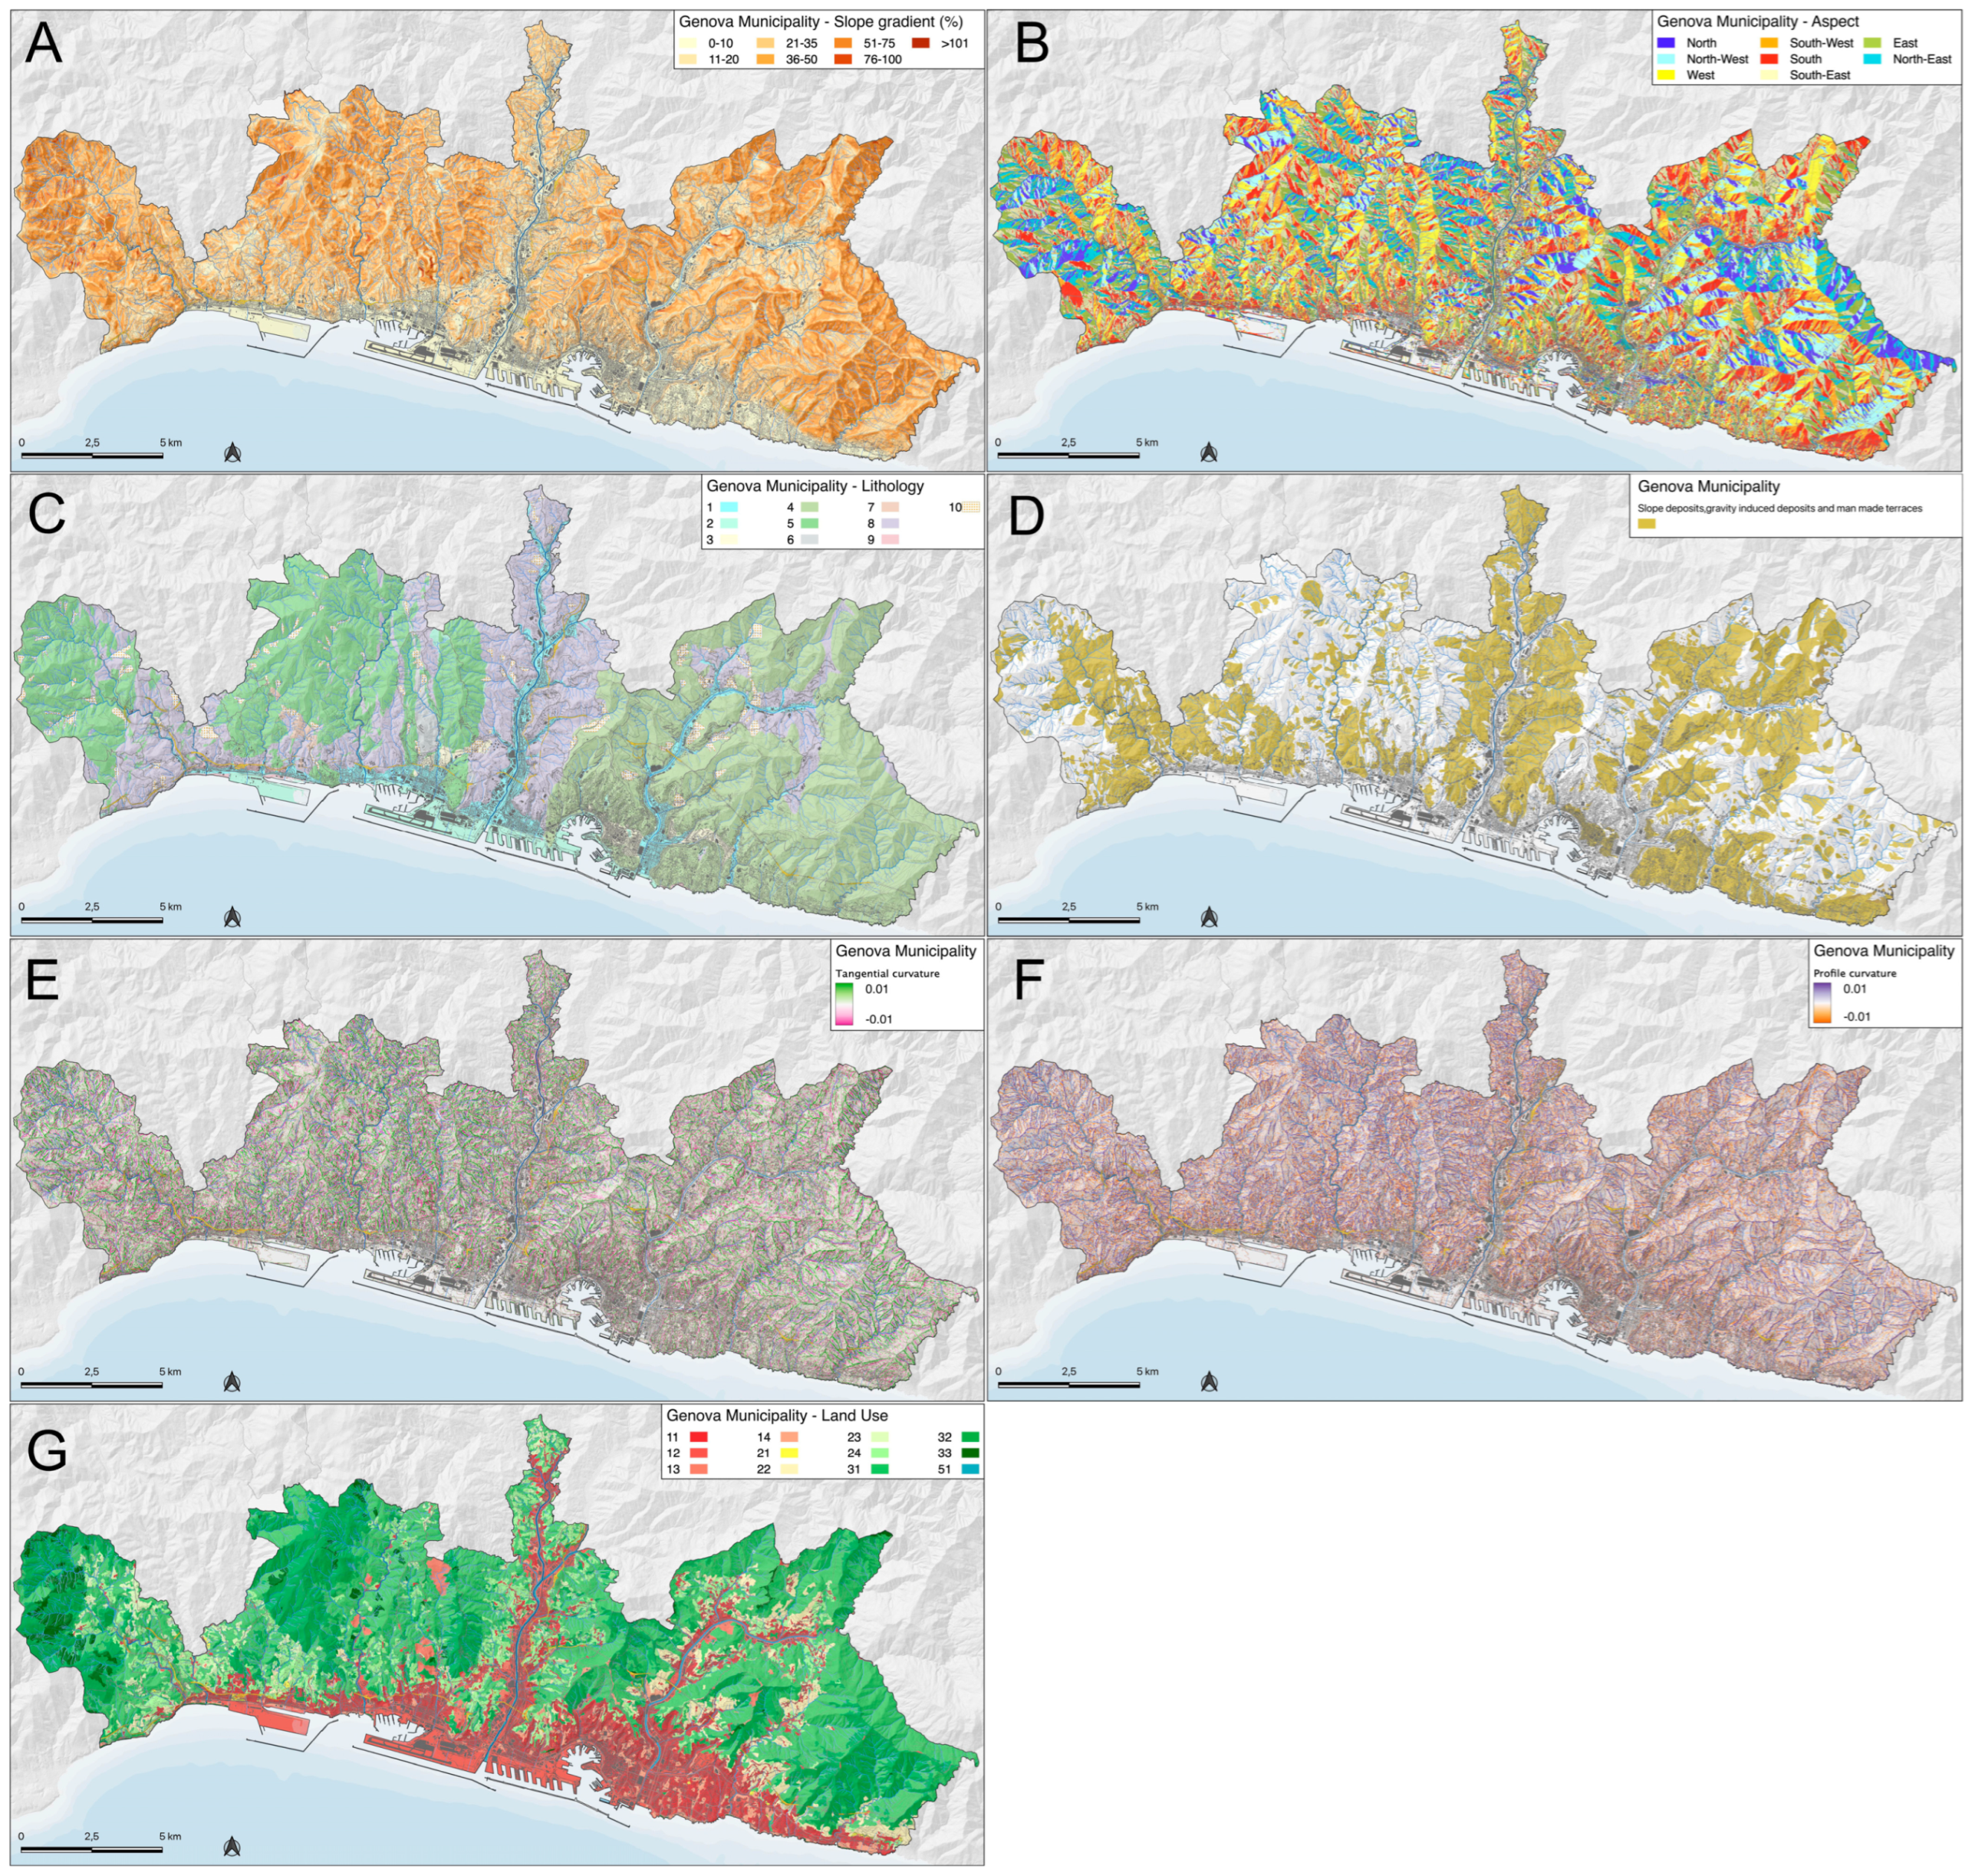
The first set was used to obtain the descriptive statistics of phenomena with respect to the seven causative factors (
Figure 7): slope gradient, slope aspect, lithology, land use, planar curvature and tangential surface curvature, and presence of slope debris cover.
These data, whose characteristics are summarized in
Table 2, were partly obtained from the available data of regional databases at a scale of 1:10,000, and partly obtained by the application of processing algorithms to the 5 m mesh DTM created by the Region of Liguria. Debris covers are also considered to play a significant role in terms of the probability of triggering shallow landslides. Therefore, based on evidences of recent phenomena in the area, the slope cover factor was included in the analysis of shallow landslide susceptibility: these geomorphological data were obtained by combining the informative layer included in the geological map made by the Municipality of Genoa with original field surveys and remote sensing analysis, which enabled more detailed recognition and mapping of the anthropogenic terraces widely spread in the Ligurian territory.
The presence of anthropogenic terraces is often crucial in triggering the phenomena that affected the region over the past 20 years. They were identified through a dedicated analysis according to the methods identified in the same morpho-climatic environment [
69,
70,
71] in other research. The analysis was completed using the DTM obtained from the ALS survey acquired by the Municipality of Genoa in 2018 with a 1 m resolution. The analysis is based on the computation of the SVF—Sky View Factor (SAGA GIS algorithm), whose reliability and accuracy were deemed satisfactory for the purposes at hand [
72]. The high resolution of the ALS DTM was crucial to perfectly identify the terraces’ presence, but in the final combination of factors, the deposit layer was resampled to 5 m, according to the other layers’ resolution.
The causal factors were examined according to the extensive bibliography available, which enables the evaluation of both geological–morphological–morphometric characteristics and anthropogenic influence through land use. Descriptive statistics, which are presented in the Results section, made it possible to objectively assign different weights to the relevant classes into which each factor was divided. The causing factors are as follows:
Lithology: This drives the soil type, evolution, and the presence of debris after weathering effects, along with geotechnical features. The study area includes flysch and ophiolitic rocks, conglomerate, cherts, carbonate, and shale rocks.
Aspect: This drives weathering effects on the rock mass. Moreover, the high-intensity rainfalls are mainly related to winds from the south.
Slope gradient: This influences soil/debris stability along the slopes. The study area is largely defined by high values.
Land use: in the study area, there is quite a significant spatial variability, with many small villages and related infrastructure along the slopes.
Slope deposits: apart from natural deposits, the area is characterized by a diffuse presence of man-made terraces, which often play the role of source areas for shallow landslides.
Tangential curvature: morphometry drives the running water concentration and general stability of the slope.
Profile curvature: morphometry drives the running water concentration and general stability of the slope.
The AHP technique was applied to obtain the seven factors’ weights after five experts’ evaluation, and according to the methodology conducted in previous research [
19,
47]; the weights of factors are shown in
Table 3.
In
Appendix A, the pairwise matrix is shown. It is created from the five experts’ factor evaluation. In order to assess the reliability of the evaluation, the consistency ratio
C.R. and AHP consensus indicator
S* were computed according to the method described in [
19]. The computed indicator figures are as follows:
A C.R. value smaller than 10% is considered to be acceptable, indicating the consistency of the matrix, while the S* value indicates high agreement between the participants.
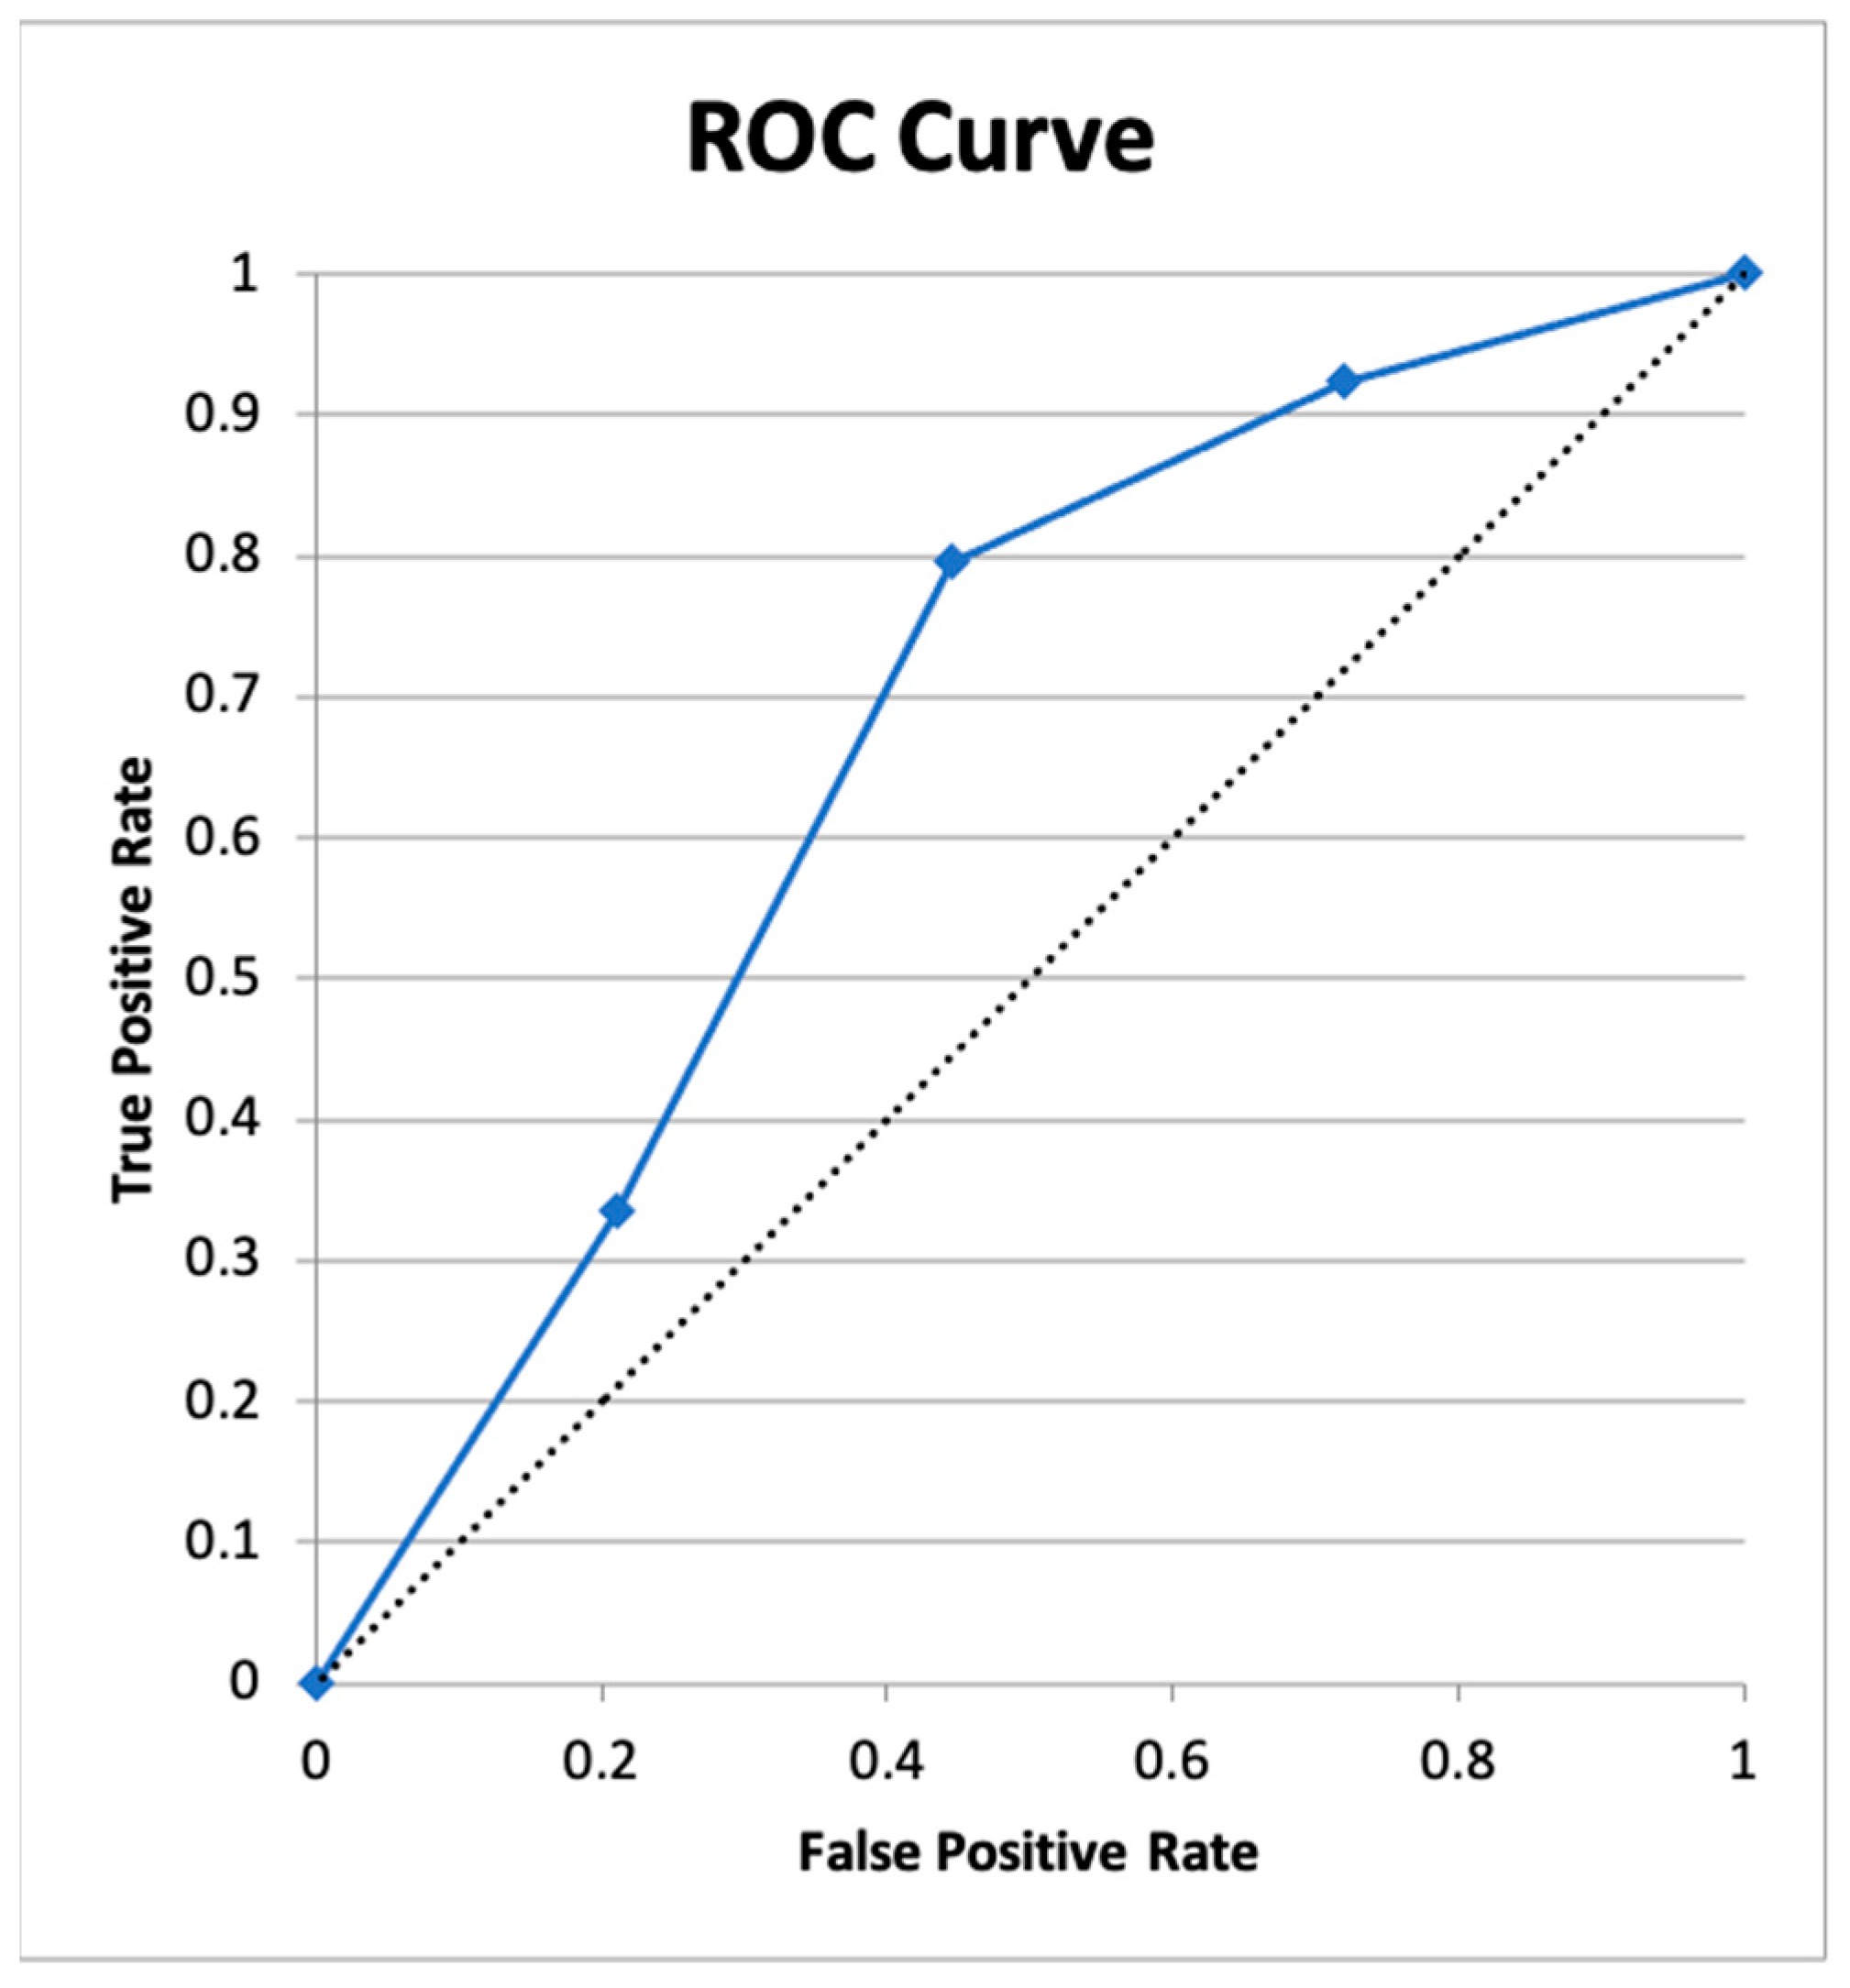
In order to quantitatively assess the predictive accuracy of the susceptibility map that arises from the calculation process, the Receiver Operating Characteristic curve (ROC) and the Area Under Curve (AUC) indicators were computed [
73,
74,
75]. Finally, the reliability of the result was subsequently verified via the calibration process, i.e., by checking the susceptibility classes corresponding to the 97 landslides in the calibration set.
A risk assessment of the water and gas distribution networks was conducted by evaluating the vulnerability of the two through the local diameter of the pipes and then calculating the related risk [
76,
77,
78]. No further data, like burial depth, pipeline material, or age, are available at this stage. This assessment is to be considered an early-stage evaluation of vulnerability. Since further data should be available in the future, a more precise vulnerability evaluation could be implemented in a future calculation.
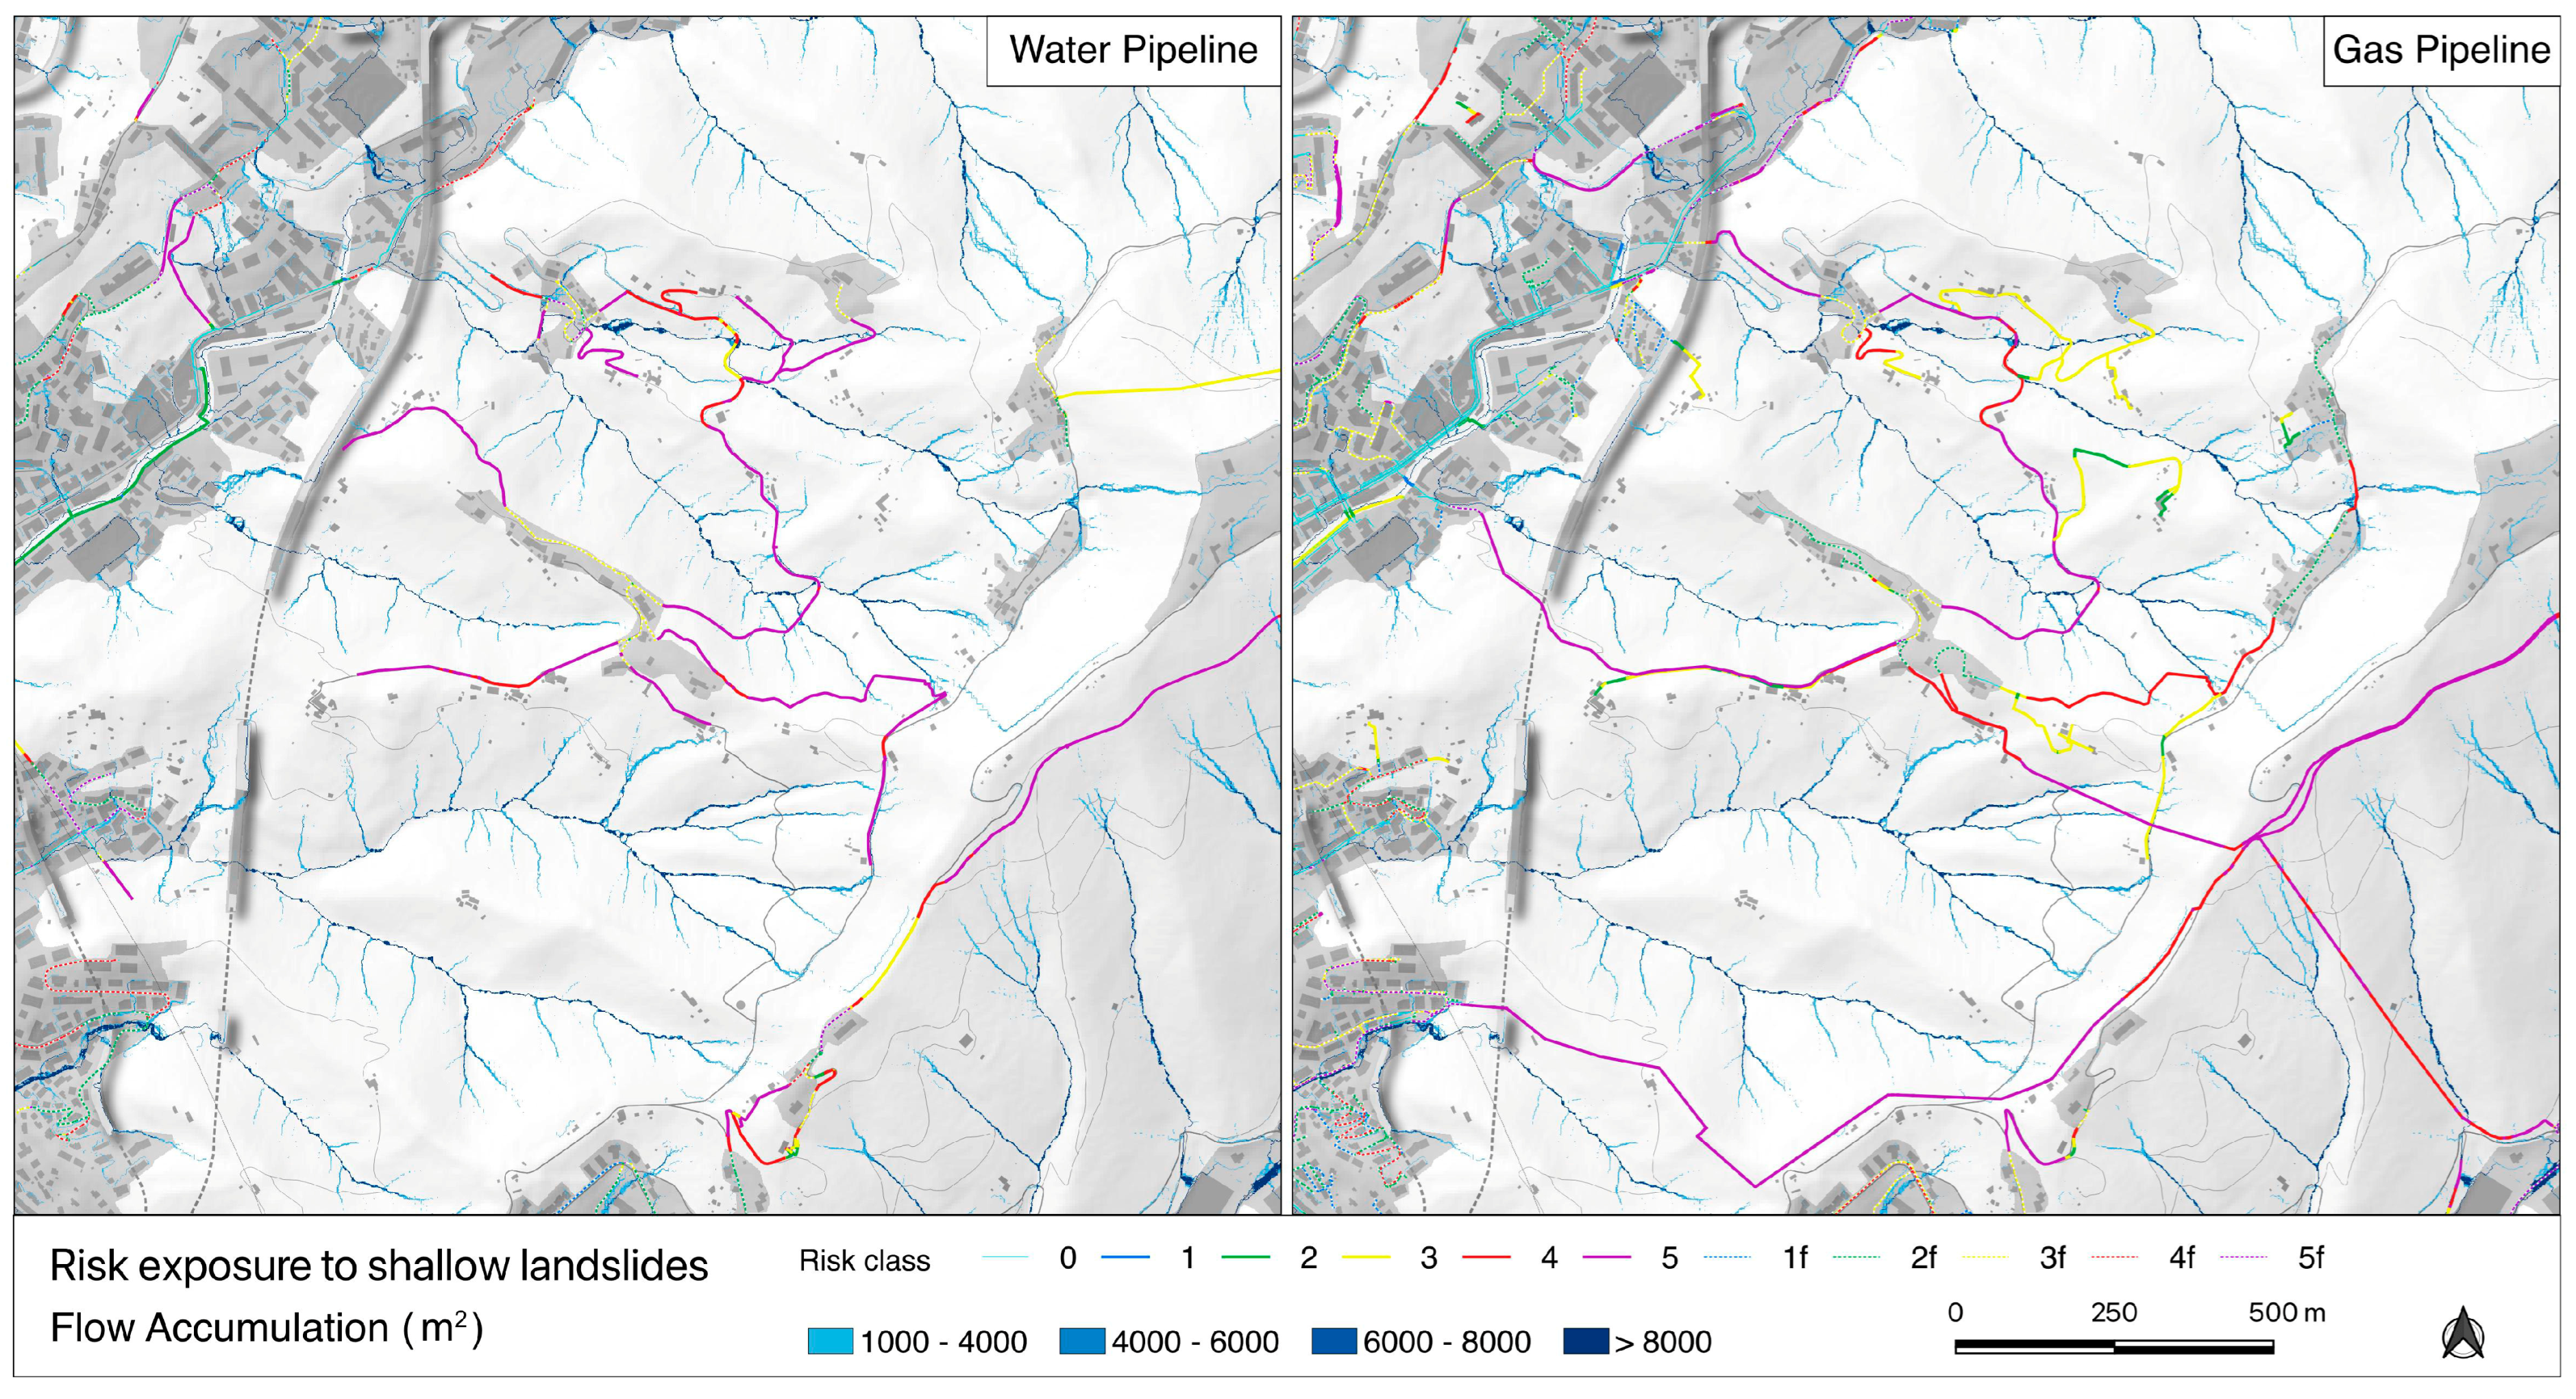
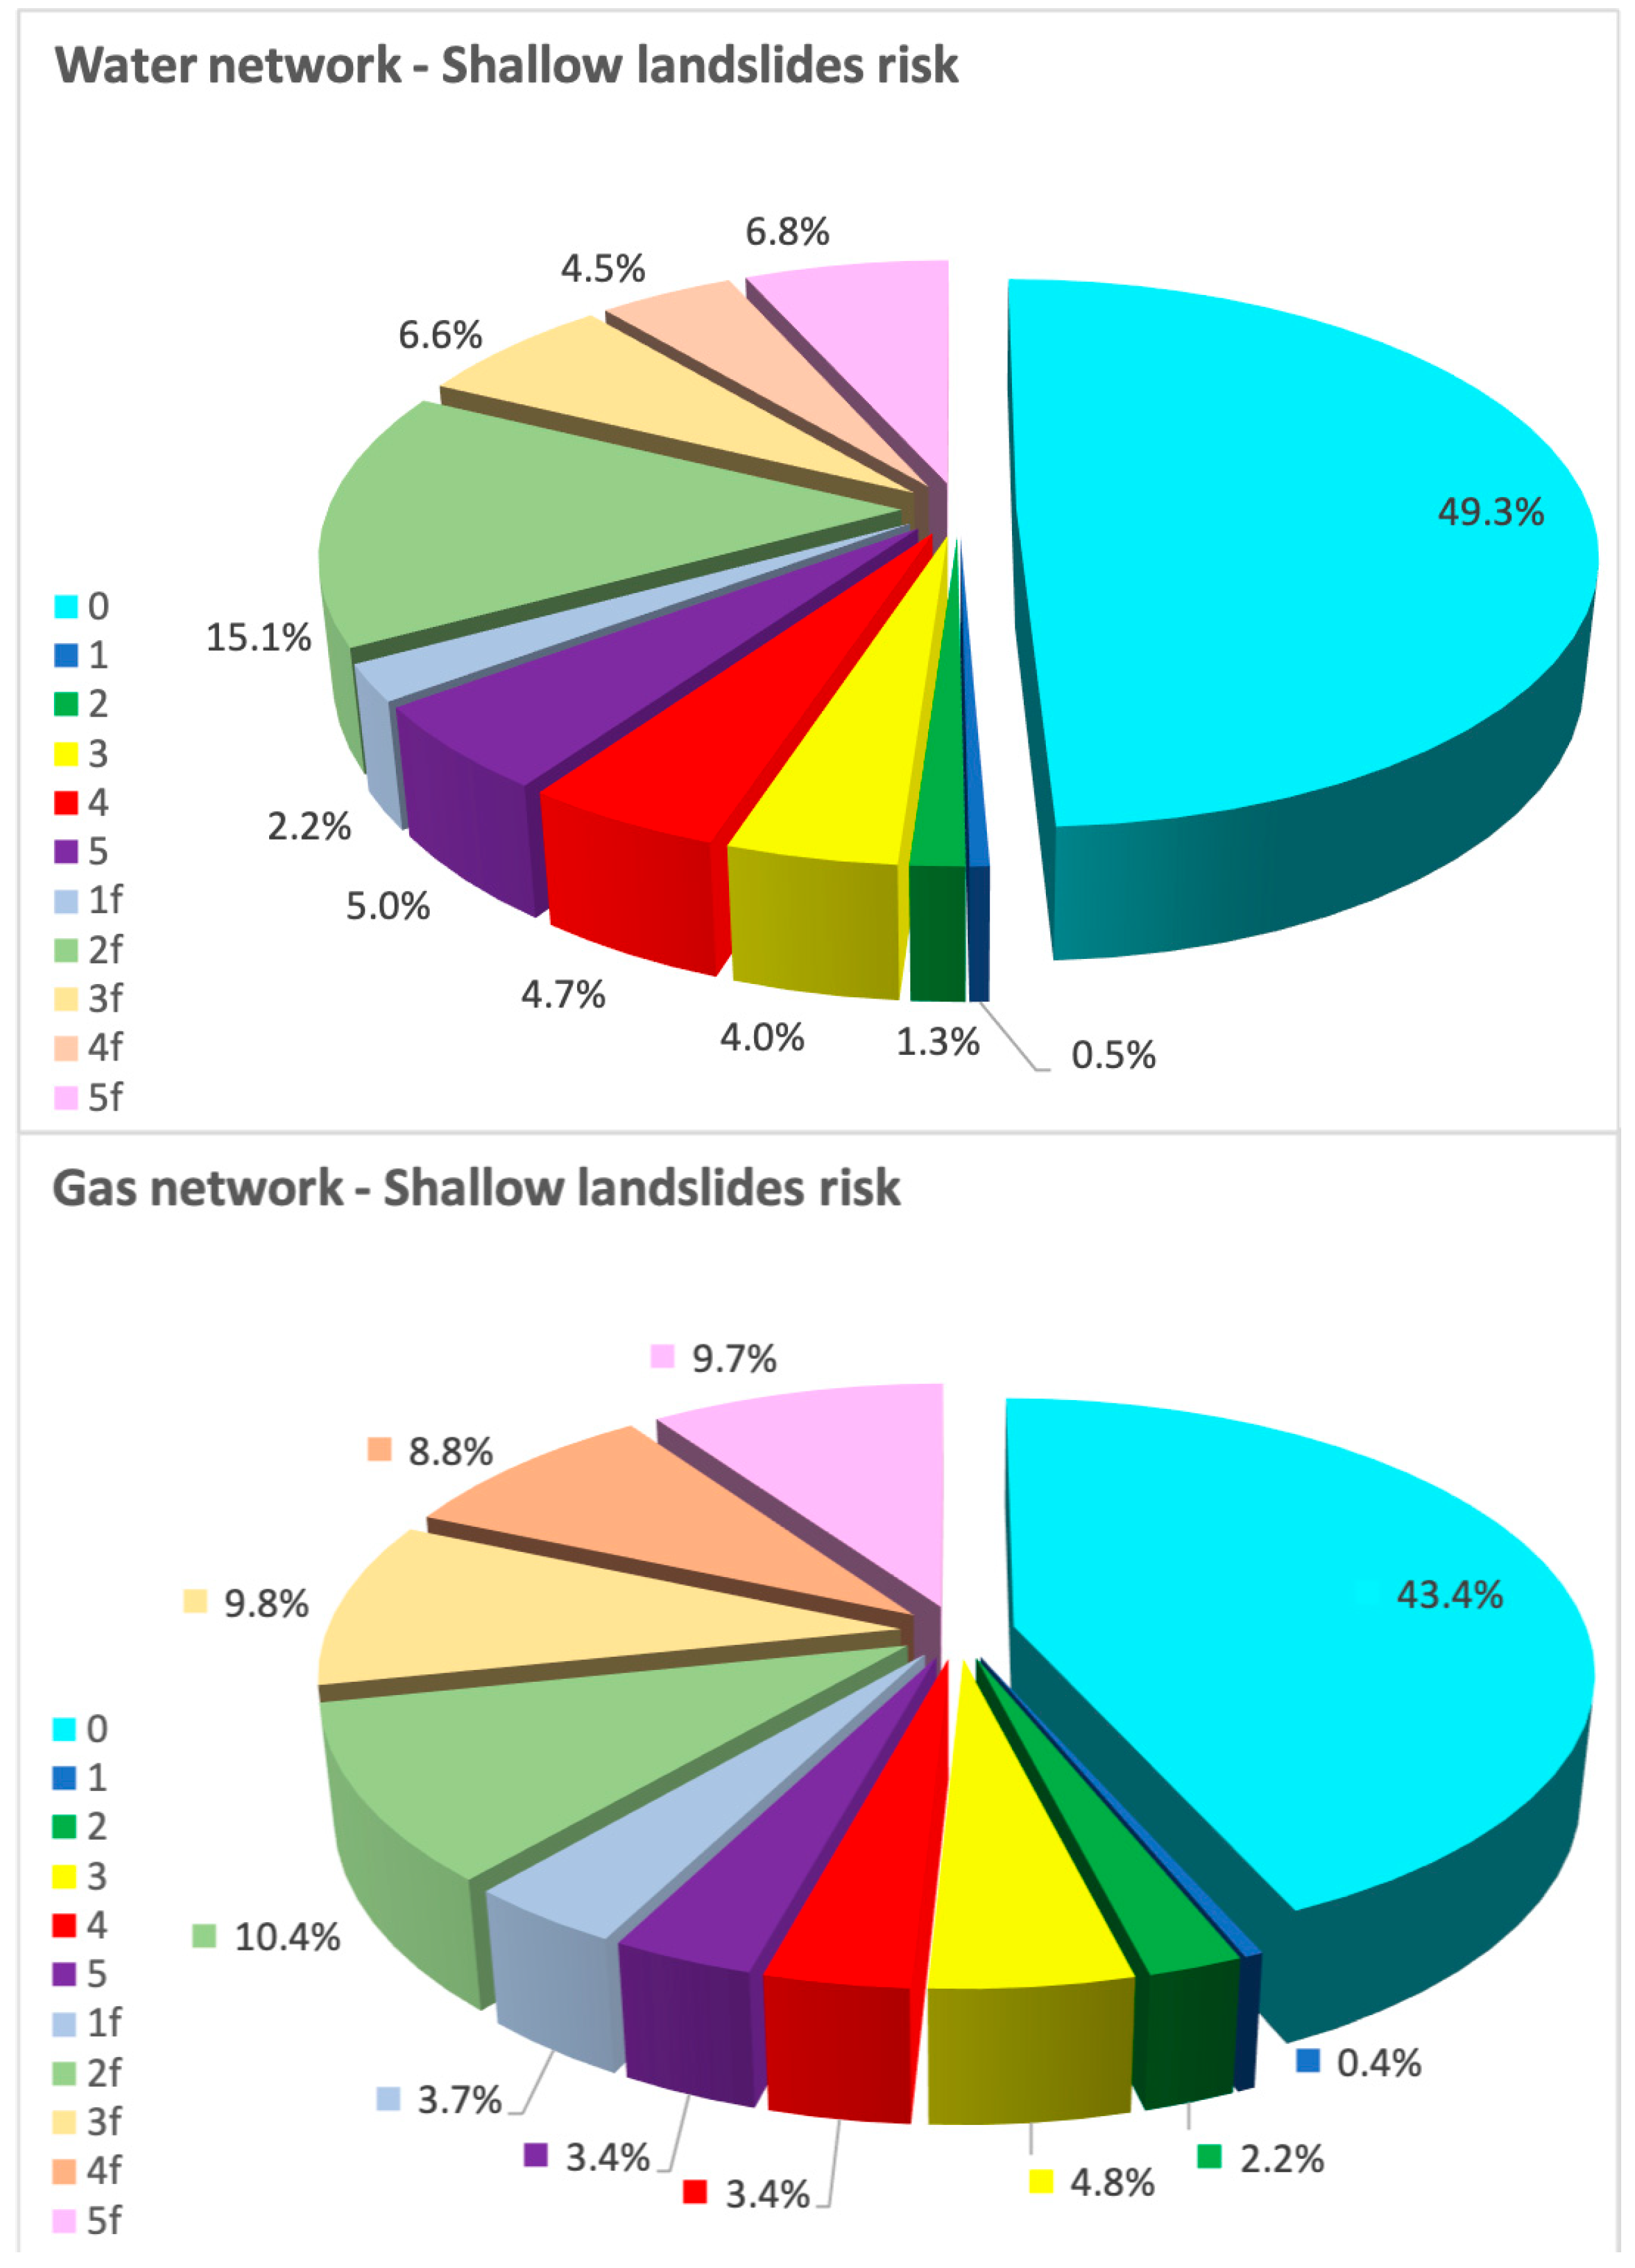
Table 4 identifies the five vulnerability classes defined according to the pipe’s diameters, which range from 10 to 900 mm for the water network and from 15 to 800 mm for the gas network. Then, the five risk classes were determined by combining the vulnerability classes with the hazard classes identified in the susceptibility computation: figures in the risk matrix were obtained after the product of the hazard score and the vulnerability score. Finally, the results were conservatively classified into the five risk classes according to the risk matrices in
Figure 8.
In sealed urban soil areas, where the shallow landslide hazard is absent (class 0), in order to highlight the potential presence of risk factors caused by falls or wall collapses, pipe risk was defined as follows: (i) where the slope gradient is under 5°, the hazard is considered to be absent, and the associated risk is zero; (ii) in areas steeper than 5°, the fall hazard is considered as belonging to only one class, and the associated risk is obtained considering the vulnerability identified in
Table 4. This evaluation has to be considered preliminary and can be improved in future research.
