Article

Measuring Urban–Peripheral Disparities in Fresh Food Access: Spatial Equity Analysis of Wet Markets in Shanghai

Department of Architecture and Civil Engineering, City University of Hong Kong, 83 Tat Chee Avenue, Kowloon Tong, Hong Kong SAR, China
*
Author to whom correspondence should be addressed.
Land 2025, 14(11), 2107; https://doi.org/10.3390/land14112107
Submission received: 18 September 2025 / Revised: 20 October 2025 / Accepted: 21 October 2025 / Published: 23 October 2025
(This article belongs to the Section Land Planning and Landscape Architecture)

Abstract

Wet markets serve as critical infrastructure for access to fresh food for urban residents in China, playing a vital role in daily life and public well-being. However, their accessibility is often shaped by disparities between urban cores and rapidly expanding peripheral districts, raising concerns over spatial equity in the urban food environment. This study investigates these disparities in Shanghai by comparing wet market accessibility in Putuo district (urban core) and Minhang district (periphery). Accessibility is measured using the Gaussian-enhanced two-step floating catchment area (2SFCA) method, incorporating travel time data from the Baidu Map API for multiple transportation modes. The Gini coefficient is further employed to evaluate the equity of accessibility distribution. The results reveal a notable disparity: residents in the periphery (Minhang) experience a higher average level of accessibility, but their access is distributed significantly less equitably compared to those in the traditional urban core (Putuo). These findings underscore a critical trade-off between development efficiency and spatial equity, highlighting the need for targeted planning strategies and policies to address spatial inequalities in fresh food access in rapidly transforming cities.

1. Introduction

Urban food system is one of the core public service systems for maintaining a decent quality of life for urban residents. In recent years, it has attracted increasing academic attention worldwide. However, notable challenges remain, including fragmented urban food governance and a lack of contextual evidence. Investment in physical food facilities has been argued to be one solution for fostering urban food system transformation [1]. In China, wet markets remain the primary source of daily fresh food for residents, surpassing supermarkets or street vendors in prevalence [2,3]. Wet markets are therefore a key component of the urban food system. It is defined as a “partially open commercial complex with vending stalls organized in rows, often with slippery floors and narrow aisles along which independent vendors primarily sell wet items such as meat, poultry, seafood, vegetables, and fruits” [4].
Over the past decades, many Chinese cities have implemented policies aimed at ensuring convenient and equitable access to essential public services, including wet markets. For example, Shanghai introduced China’s first 15 min life circle plan in 2016 and wet market is explicitly included [5]. More recently, the municipal government released the 2025 Shanghai Standard Wet Market Renewal and Upgrade Plan [6]. These initiatives underscore the irreplaceable role of wet markets in Chinese urban food system, particularly in Shanghai. However, as in rapidly urbanizing metropolises, the distribution of public facilities often becomes uneven, resulting in limited food access for certain communities.
There has been substantial existing literature regarding food markets and spatial equity of public facility accessibility. Existing studies on wet markets often focus on consumer preferences [7,8,9], or the transformation of traditional markets within modern urban contexts [10,11]. Few studies have analyzed the spatial distribution of wet markets at the city scale. Furthermore, accessibility studies tend to concentrate on other public facilities such as parks, green spaces, and medical facilities [12,13,14], while food facilities such as wet markets are often overlooked. Methodologically, reliance on Euclidean distance remains common, despite its limitations in capturing variations in travel time across different transportation modes and the distance decay effect on travel behavior [15].
In rapidly urbanizing contexts, the spatial distribution of wet markets plays an important role in shaping urban equity, public health, and community resilience. However, disparities in accessibility remain insufficiently understood, particularly in fast-growing urban agglomerations. Taking Shanghai, China, as a representative case study, this study aims to examine the spatial equity of wet market distribution between peripheral and urban core districts. The methodological framework and findings are designed to offer insights applicable to fast-growing cities facing similar urban dynamics. By framing wet markets as both essential public amenities and socio-cultural infrastructures, the research seeks to advance theoretical understanding of spatial equity in urban service provision. The insights generated are intended to inform evidence-based planning and governance strategies, enabling policymakers to design more inclusive, adaptable, and sustainable urban food systems that respond effectively to the challenges of rapid urban transformation.
Although a growing body of research has examined public facility accessibility, most studies on wet markets either focus on consumer preferences or provide context-specific planning suggestions, with limited attention to spatial equity, especially from an urban–peripheral comparative perspective. There remains a lack of comprehensive evaluations of spatial equity in wet market accessibility. This research aims to fill these gaps by applying a Gaussian-modified 2SFCA method combined with equity measures to assess wet market accessibility in Shanghai. Specifically, the research questions include: (1) quantify residents’ accessibility to wet markets, and (2) compare the spatial equity of accessibility in peripheral districts and the traditional urban core. In doing so, the study contributes empirical evidence to inform planning and policy interventions aimed at reducing spatial inequalities in rapidly urbanizing contexts. This research helps contribute to UN Sustainable Development Goal 10 Reduced Inequality and Goal 11 Sustainable Cities and Communities from the perspective of reducing urban food access inequality and increasing the resilience of urban food system.
The rest of this paper is structured as follows. Section 2 reviews existing literature of wet markets, public facility accessibility, and equity. Section 3 explains the study area, data and methods. Section 4 presents the study results. Section 5 discusses policy implications and limitations. Section 6 concludes the study.

2. Literature Review

2.1. Roles of Wet Markets in Urban Food Systems

Wet markets were the main urban food outlets across the world, yet they have diminished in many countries in recent decades. In developing countries, wet markets’ primary position in urban residents’ food shopping is threatened by the rapid diffusion of supermarkets. For example, in Thailand, Gorton et al. [16] developed a customer-centric model and argued that supermarkets outperform wet markets on all retailing attributes such as quality, variety and price. In Ghana, Anku and Ahorbo [17] called for affirmative policies for wet markets as they foresaw the conflicts between wet markets and recently surged supermarkets would soon happen. Although the transformation of food retailing system leads to new food access problems during this process, informal food retailing channels like wet market are still important. In Sub-Saharan Africa, informal food markets remain central to urban food access, but supermarket expansion raises concerns about accessibility disparities, as seen in Cape Town, Kisumu, and Kitwe where policy-driven supermarketization may erode informal systems and worsen inequalities for low-income households [18]. Battersby & Crush [19] discovered that in African cities, food access disparities manifest in poor urban neighborhoods with high food insecurity and low dietary diversity, reliant on multiple market and non-market sources but with various household accessibility due to poverty and inconsistent informal economies.
In contrast, in highly urbanized Western contexts, modern retailing and supermarkets have dominated urban food source. Food desert challenges are often highlighted through formal retail systems, yet findings show that measures beyond spatial accessibility are key to target the food issues, revealing divergent urban food dynamics. In the US, physical food access disparities show little causal impact on health outcomes, with diet quality gaps driven more by demand-side preferences than supply-side limitations [20]. In the UK, predictors of limited food access include younger age groups, larger households, low income, unemployment, ethnic minorities (e.g., Asian and African British), and deprivation, underscoring the need for targeted interventions beyond physical proximity [21]. Similarly in the UK, Janatabadi et al. [22] found social and spatial inequalities in food access arise from a compound of store and online access limitations, with 23% of the population (13.8 million) in priority areas facing urban-rural divides and barriers for carless, black, or deprived residents. Nevertheless, in these contexts, wet markets often transform from an essential facility in the urban food system to a place of interest, and manifest their cultural and social functions. In Portugal, wet markets are transformed into destinations of food tourism, selling commercial-orientated food for tourists instead of local residents [23]. In Kuala Lumpur, the Central Market, established in 1888 as a wet market, is now preserved as cultural heritage [24]. Famous UK traditional markets, such as London’s Borough Market and Kirkgate Market in Leeds, now emphasize artisanal and find foods to attract affluent middle-class customers, hoping that the markets will become global tourist attractions and “people’s holiday experiences” [10]. Wet market disappearance is sometimes the side effect of regional economic development. In Singapore, “the government-sanctioned property redevelopment and a rising high-end consumption-driven economy” often force the long-existing wet markets to close, transforming them into social spaces rather than food retail hubs [11].
Chinese wet markets face similar challenges by supermarkets in the urbanization process. Supermarkets are found to have differentiated advantages such as quality, variety and environment [25]. Nevertheless, wet markets remain embedded in the everyday spatial practices of urban population in China. Empirical studies suggest that over 60% of Chinese urban consumers continue to rely on wet markets for their daily supply of fresh produce, such as vegetables and fruits [9]. A 2015 survey in Nanjing discovered that 70% of households visited wet markets five times a week, compared to only 17% of households for supermarkets at the same frequency [3]. Similarly, Zhong et al. [4] conducted a consumer survey in Sanya city in 2017 and reported that 77% of the respondents considered wet markets their primary fresh food channel. The perceived freshness of products, reinforced through sensory engagement (touch, smell, hearing, and taste), aligns with traditional Chinese food consumption habits. Additional advantages of wet markets over supermarkets include lower price [9] and physical proximity [7]. Nevertheless, some scholars argue that wet markets and supermarkets are complements: residents tend to buy processed and packaged food in supermarkets while preferring wet markets for fresh food [8].The rise of online-to-offline (O2O) food delivery services in recent years has the potential to compete with wet markets, but Li and Wang [26] confirmed that in Shanghai people living in a neighborhood with local wet markets are less likely to choose O2O services.

2.2. Spatial Accessibility: Concepts and Methods

Accessibility has been an effective perspective to evaluate public facility distribution and offer planning suggestions. Farrington [27] discusses the conceptual underpinnings of accessibility and its relationship to sustainability and globalization, noting its adoption as a policy tool by the UK government. Accessibility is increasingly associated with social inclusion and care for disadvantaged people, and thus become a crucial measure for improving social equality [28]. Panagiotopoulos and Kaliampakos [29] examined geographical accessibility across Greece, finding that remote areas, often islands, lack basic facilities and may benefit from tourism-driven development.
In China, there are some practical planning studies particularly focusing on improving the locations of wet markets in cities in China. Zhou and Li [30] surveyed the wet markets in the Yuhong District of Shenyang and made a detailed plan for relocation, expansion, and removal of the existing wet markets. Sun et al. [31] used the least-cost path method to critique the spatial distribution of wet markets in Tianjin’s central urban district. These studies, however, tend to be context-specific and lack broader academic generalization. Moreover, wet markets in China are underrepresented in the accessibility studies, while more attention is paid to urban public facilities like parks [32], medical facilities [13], or multiple types of facilities together [14]. Similar trend exists in the western context, where parks and hospitals receive most attention. For example, Nicholls [12] applied the GIS technique to assess the accessibility of public parks in Bryan, Texas, and analyzed their accessibility equity. In the US, Hare and Barcus [33] studied the geographical accessibility to heart-related hospital services in Kentucky. Nevertheless, recently, attention on food infrastructure is rising. For example, Jin and Lu [34] examined the accessibility to food outlets in Texas, Austin, differentiating the core/peripheral areas and healthy/unhealthy food stores. Li and Jim [35] examined the healthy food environment of residential neighborhoods and activity space, respectively, in Ohio, Cincinnati. Ng et al. [36] shifted focus to the accessibility of grocery stores around the transit nodes on people’s commuting trajectory in Stockholm, challenging the assumption that shopping occurs primarily near home.
Although wet markets are rarely the primary focus, methodological approaches from other public facility accessibility studies remain relevant. Quantitative methods, often supported by software tools, dominate spatial accessibility research. The two-step floating catchment area (2SFCA) method, introduced by Radke and Mu [37], is widely used for incorporating supply, demand, and travel cost into accessibility metrics [38]. Gu et al. [39] use the 2SFCA method to construct accessibility index values from street districts and towns to country parks in Shanghai. Ashik et al. [40] also use the 2SFCA method to measure accessibility to urban facilities in Dhaka City Corporation area in Bangladesh. The quantitative methods applied in these studies for measuring spatial accessibility to various public facilities underpin the research design of this study.
A key limitation of the basic 2SFCA method is its neglect of distance decay within catchment areas [15]. Enhanced versions address this shortcoming by incorporating decay functions. Luo and Qi [15] used weighted travel time zones for healthcare accessibility in Illinois. Cheng et al. [38] applied a kernel density-based 2SFCA for hospitals in Shenzhen. Ashik et al. [40] used a Gaussian function to model rapid decline in travel willingness beyond a threshold. Jin and Lu [34] integrated the Huff model in the 2SFCA equations to account for people’s food outlet selection considering both multi-mode travel cost and the food outlet capacity. Based on Gaussian function and Huff model, 3SFCA method is developed to account for the competition effect of the facilities located within the same travel catchment area [41]. Further refinements include Tahmasbi et al. [42], who derived impedance functions from real trip data in Isfahan. These improvements to the original 2SFCA method remedy the drawbacks of the initial accessibility analysis model and push forward academic research in this field.

2.3. Spatial Equity: Concepts and Methods

Spatial accessibility studies often assume that uniform accessibility implies equity, yet this overlooks socioeconomic and demographic heterogeneity. Litman [43] introduced the concept of vertical spatial equity, referring to the spatial accessibility equality according to the population scale. Ashik et al. [40] incorporated age, ethnicity, and income to compute social-need indices in Dhaka. Similarly, Tahmasbi et al. [42] evaluated equity based on income levels in Isfahan. Moreover, compensatory access to other facility types may offset local deficiencies, highlighting the need for integrated multi-facility analyses, as demonstrated in both Ashik et al. [40] and Tahmasbi et al. [42].
Various quantitative techniques assess whether measured accessibility implies equity. Jin et al. [44] used Z-score normalization to evaluate the alignment between population distribution and medical resource accessibility in Shenzhen, confirming better access in the city center. Cheng et al. [38] applied spatial autocorrelation to analyze inequality in hospital access in Shenzhen. Ashik et al. [40] used Spearman correlation, hot-spot analysis, and overlay techniques in GIS to identify significant inequalities in Dhaka. The Gini coefficient and Lorenz curve borrowed from economics have been widely used. Tahmasbi et al. [42] applied the Gini coefficient to identify whether accessibility inequality exists regarding retail shops in Isfahan city. Jang et al. [45] used Gini coefficient to compare equity between bus and subway services in Seoul, finding greater inequality in subway access. Combined 2SFCA and Gini coefficient approaches have been used to evaluate green space access in Wuhan [46] and urban vitality access across housing price tiers [47].

3. Materials and Methods

3.1. Research Framework

To examine spatial disparities in fresh food access between Shanghai’s urban core and periphery, this study employs an integrated framework (Figure 1). Residential, wet market, and travel time data are combined to measure accessibility using the Gaussian-enhanced two-step floating catchment area (2SFCA) method across walking, cycling, and public transport. Composite scores are then evaluated for equity using the coefficient of variation (CoV) and Gini coefficient, followed by spatial and relational analyses to derive policy implications.

3.2. Study Area

Shanghai, as one of the most densely populated and rapidly developing metropolises in China, provides a representative case for examining the spatial distribution of wet markets in the context of rapid urbanization. Long-established districts generally have relatively mature service systems, while newly urbanized or peripheral areas may face the challenge of ensuring adequate provision of daily services such as fresh food markets while accommodating fast population growth and urban expansion. These contrasting dynamics make Shanghai an ideal case to explore the spatial equity of wet market accessibility in urban cores and peripherals.
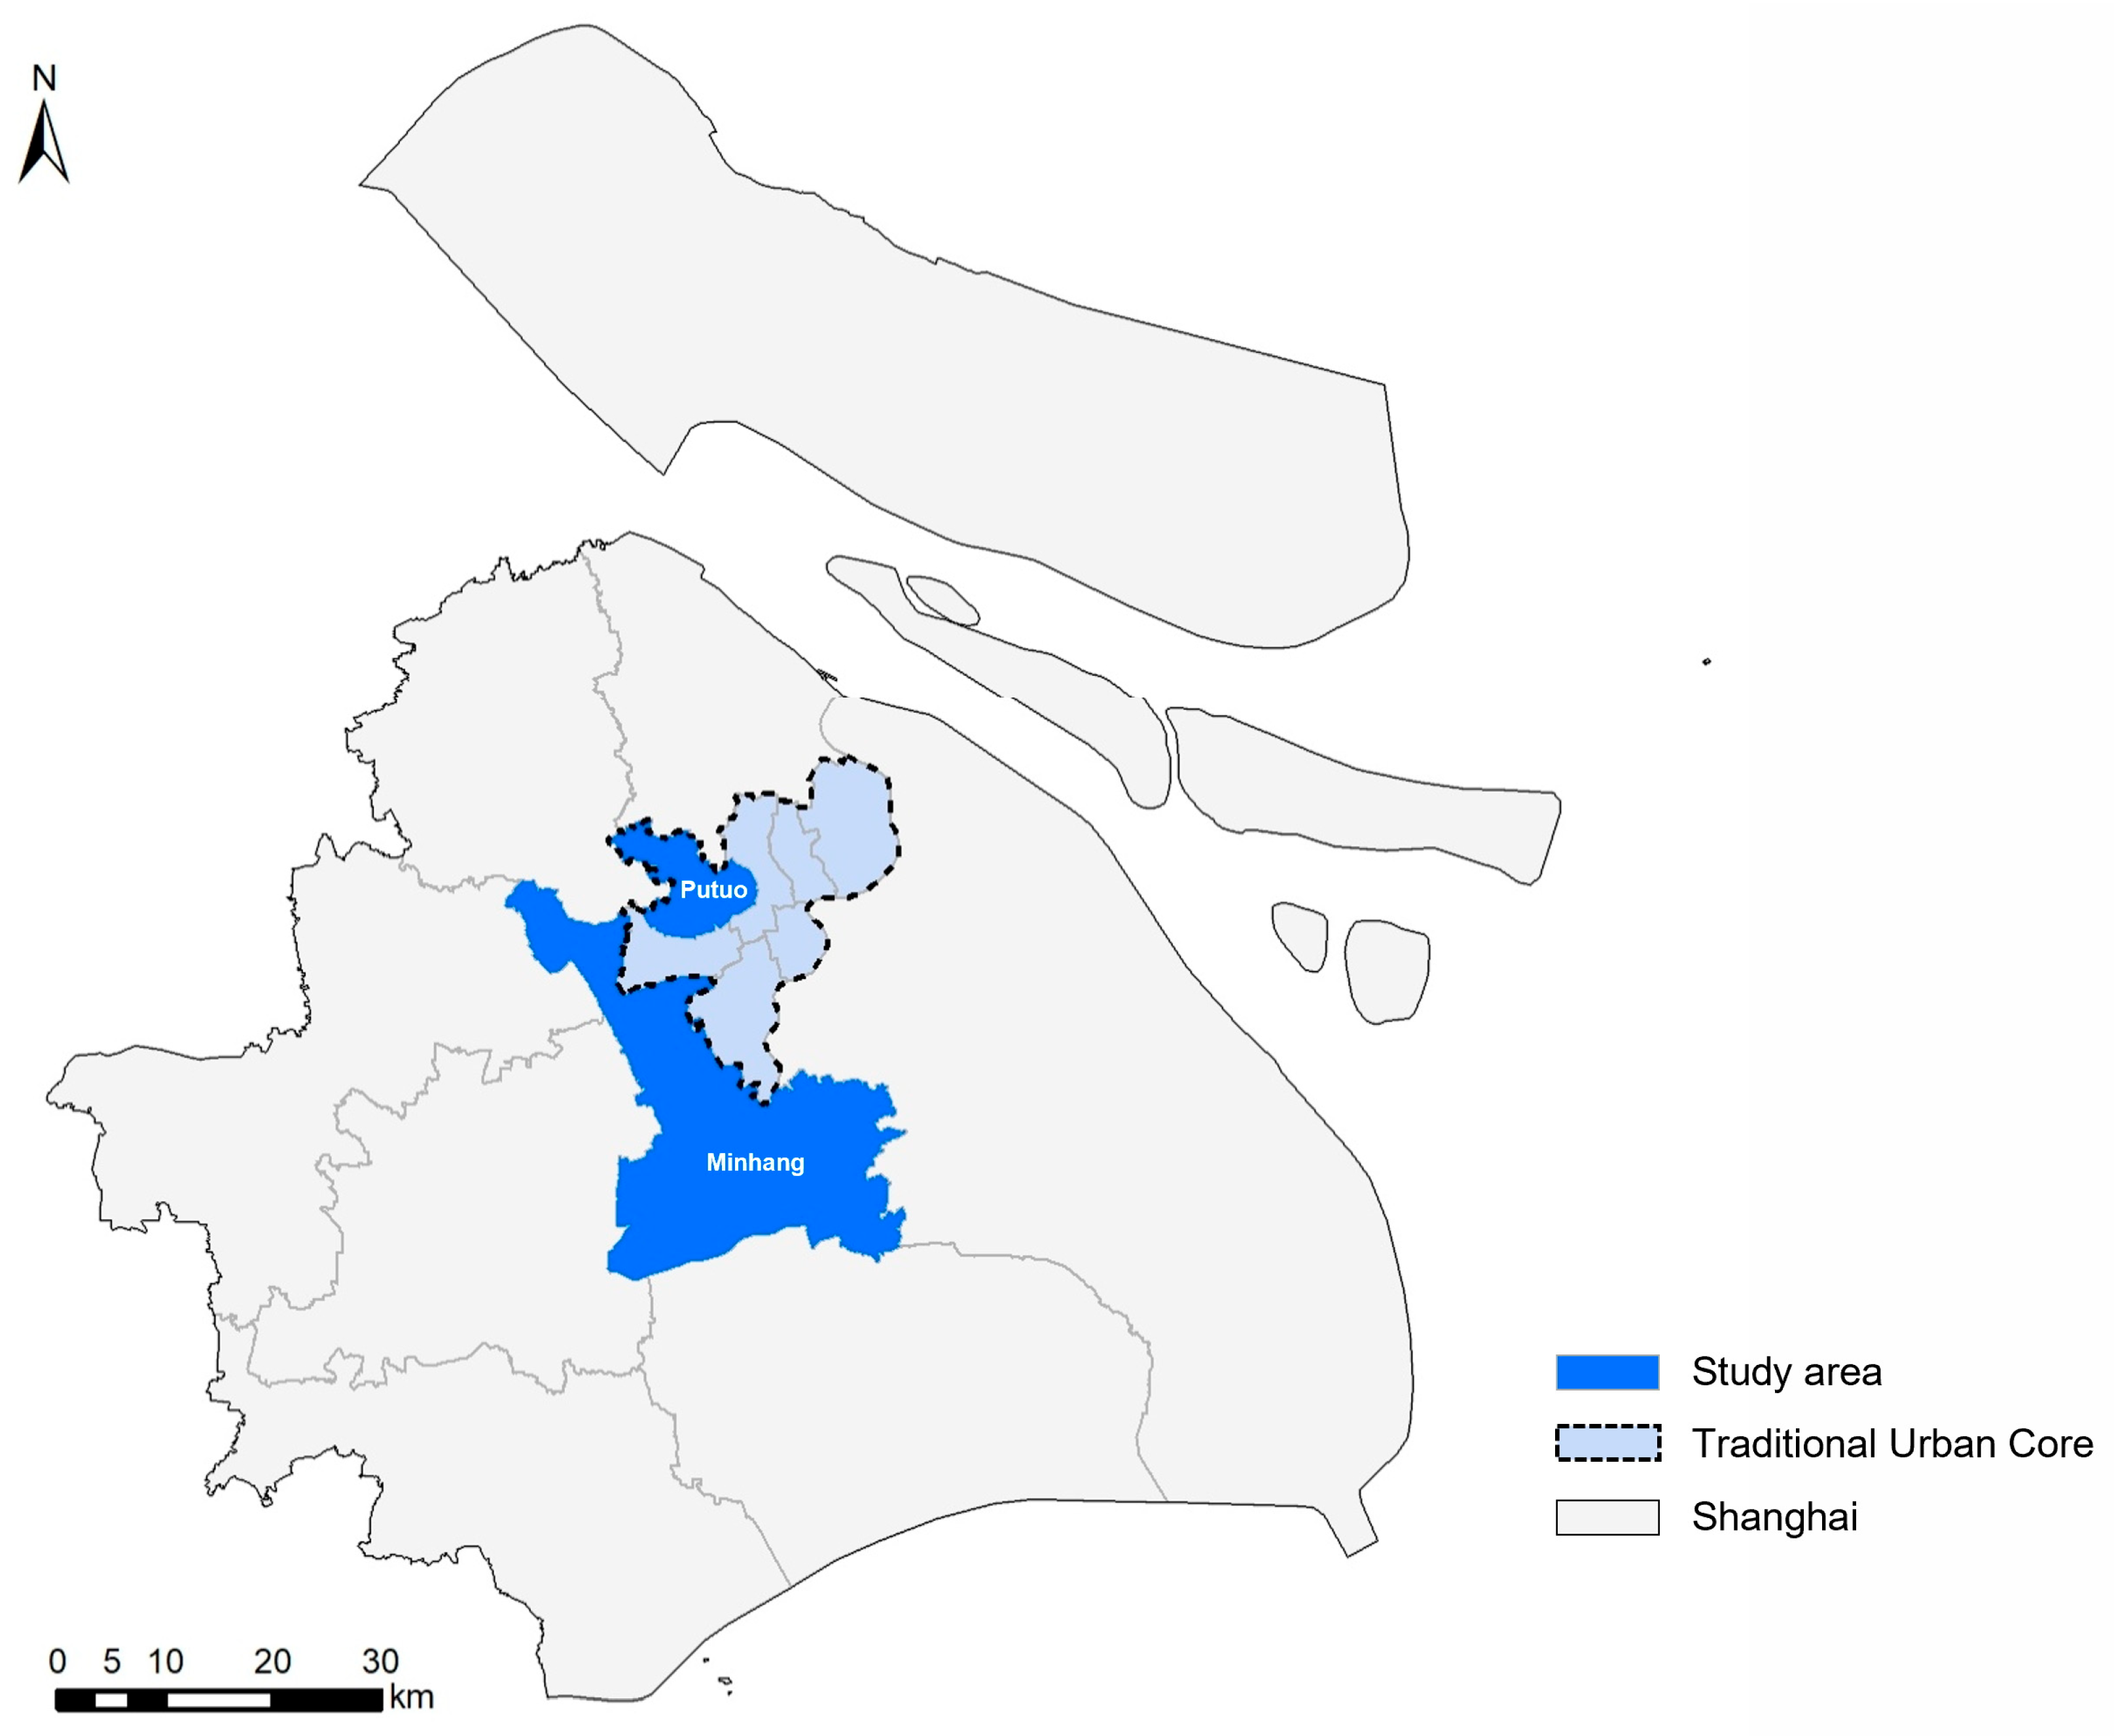
This study focuses on two representative districts: Putuo (urban core) and Minhang (periphery) (Figure 2). Putuo District is one of seven traditional central districts of Shanghai. It covers 54.83 km2 with a permanent population of 1.24 million in 2023, of which 71.02% are local residents [48]. Putuo is characterized by compact urban form and stable, long-established residential communities. In contrast, Minhang District represents the urban periphery. It spans 370.75 km2 and had 2.72 million permanent residents in 2023, of which only 55.44% are local residents [48]. With a larger area and higher proportion of migrant population, Minhang reflects the dynamics of rapid suburban growth and demographic change.

3.3. Data Source

(1) Wet market data. Information on standardized wet markets were collected from the Shanghai Public Data Open Platform (https://data.sh.gov.cn/ accessed on 20 October 2025), including names, addresses, subdistricts, and operational areas. Only Minhang and Putuo districts have these official wet market data. For markets without official records of operational areas, estimates were derived from building polygons identified in Baidu Map bird’s-eye imagery.
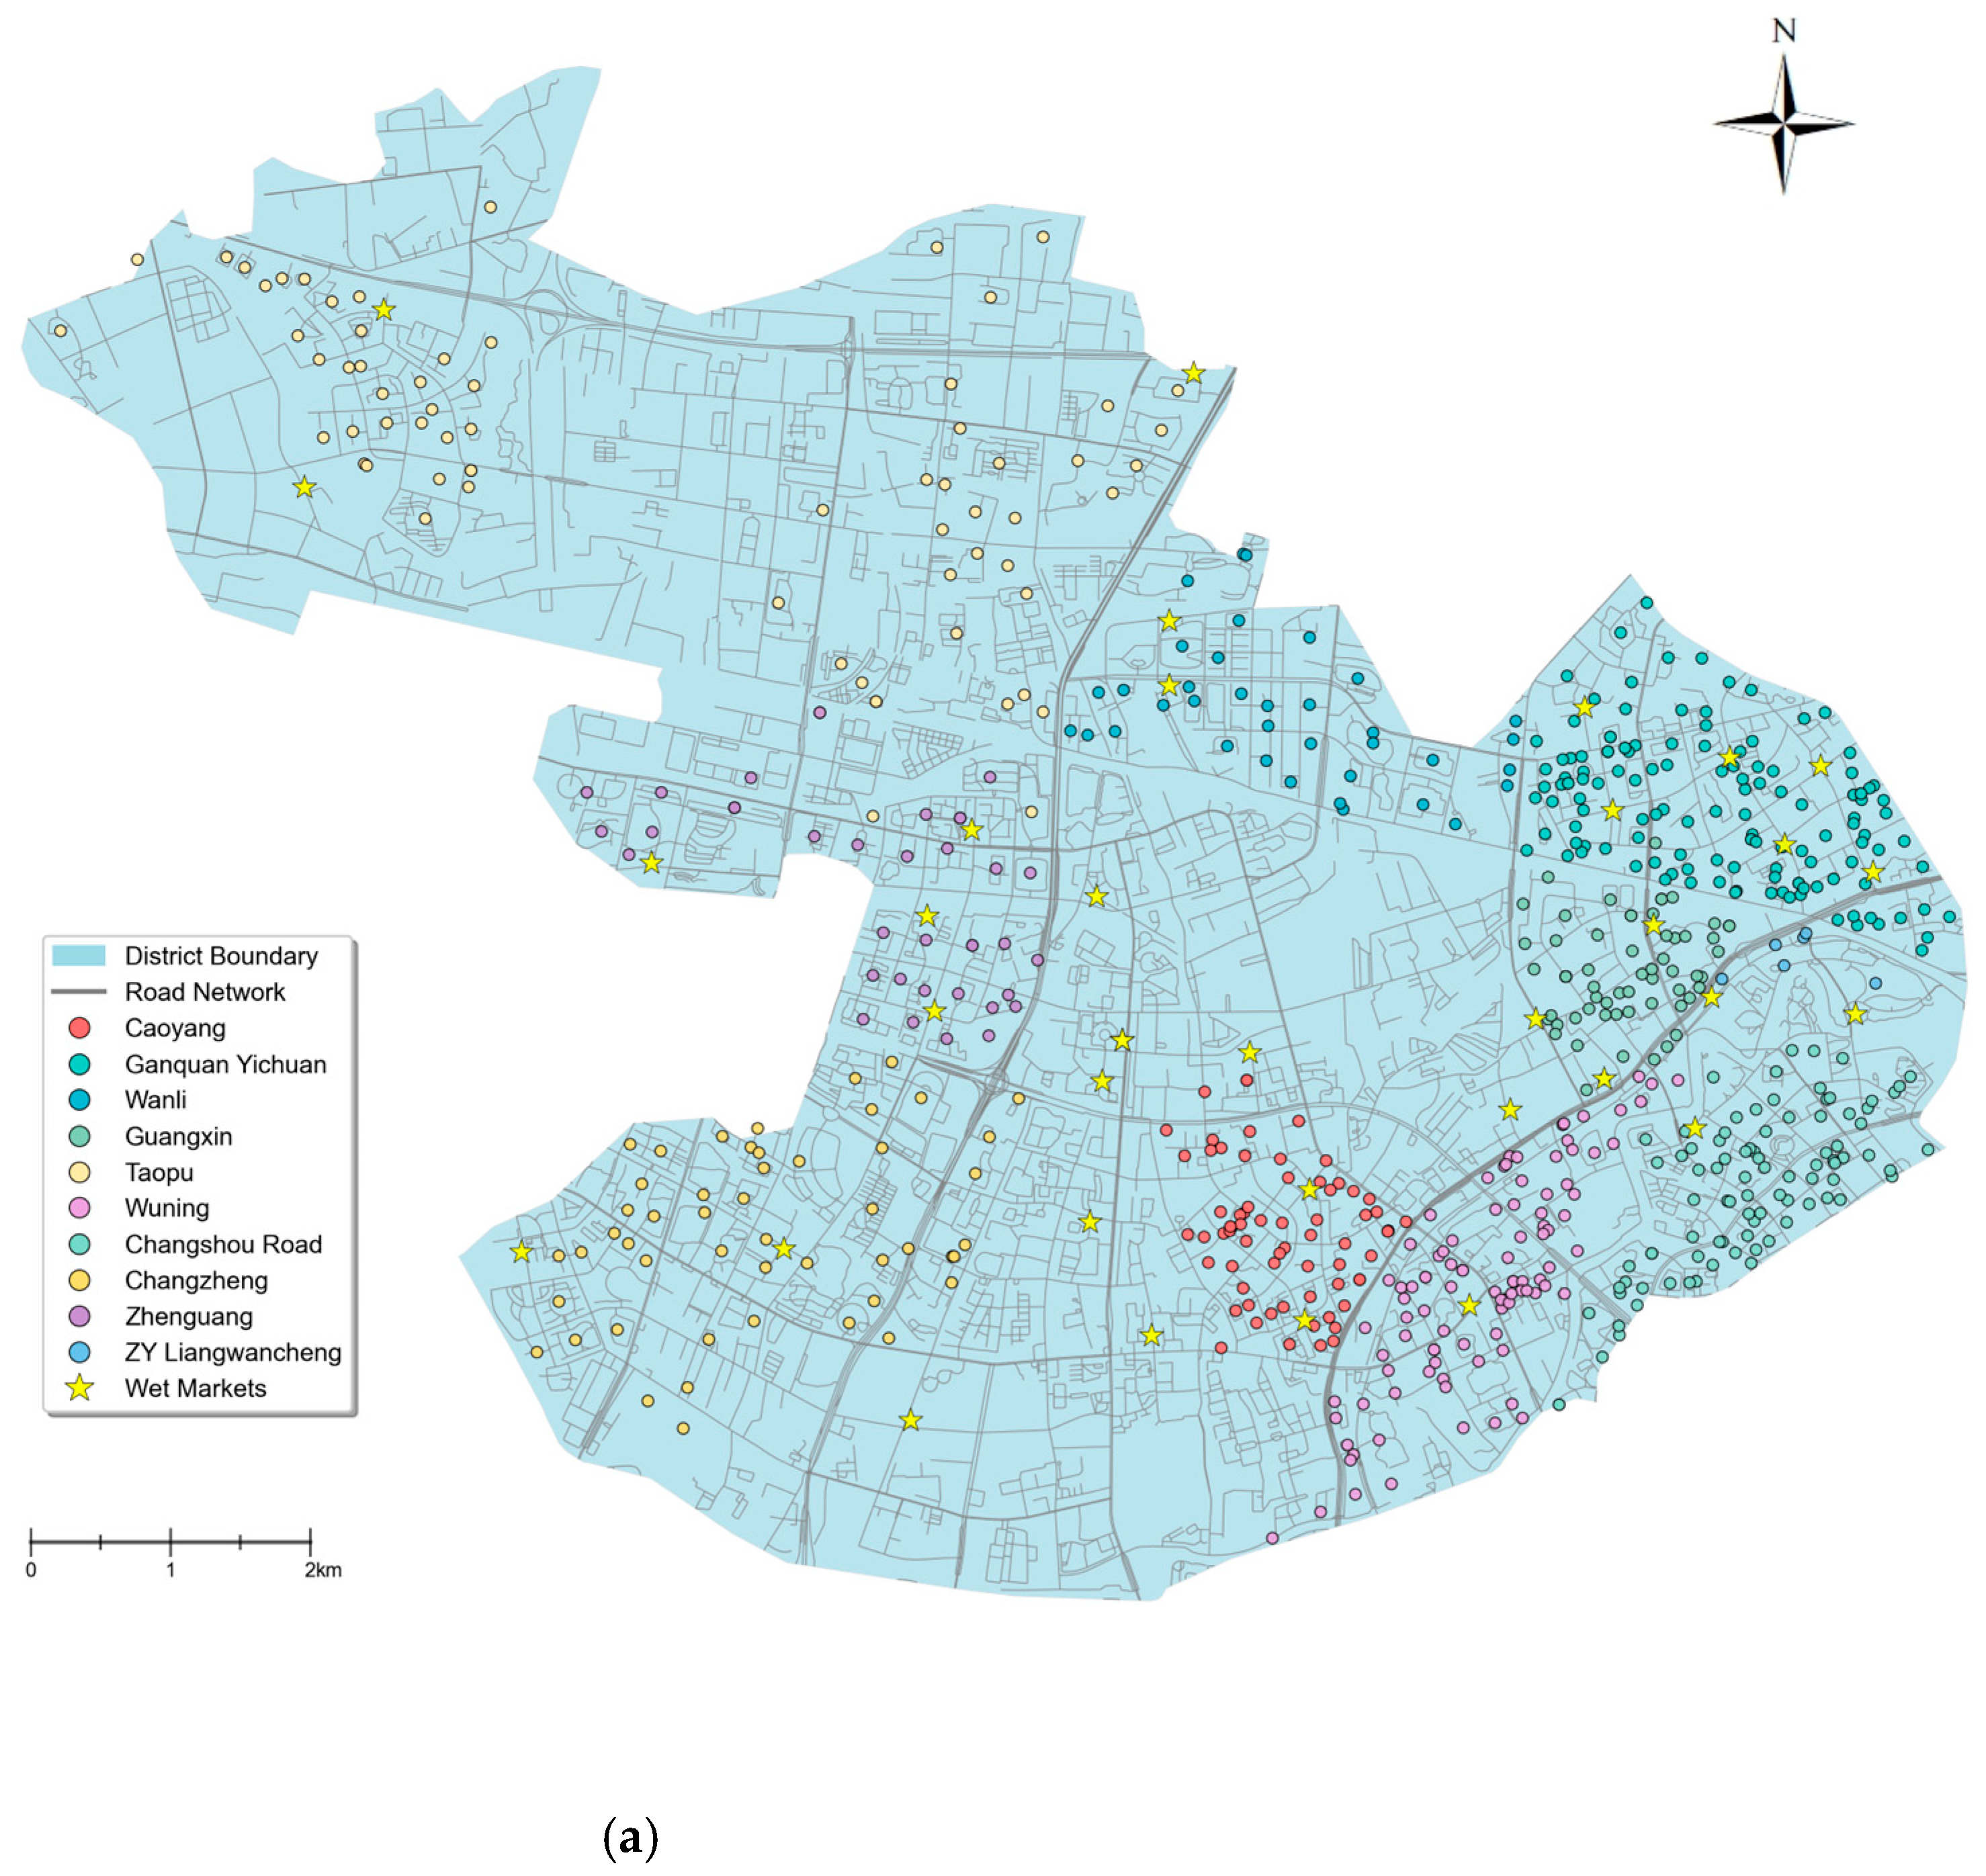
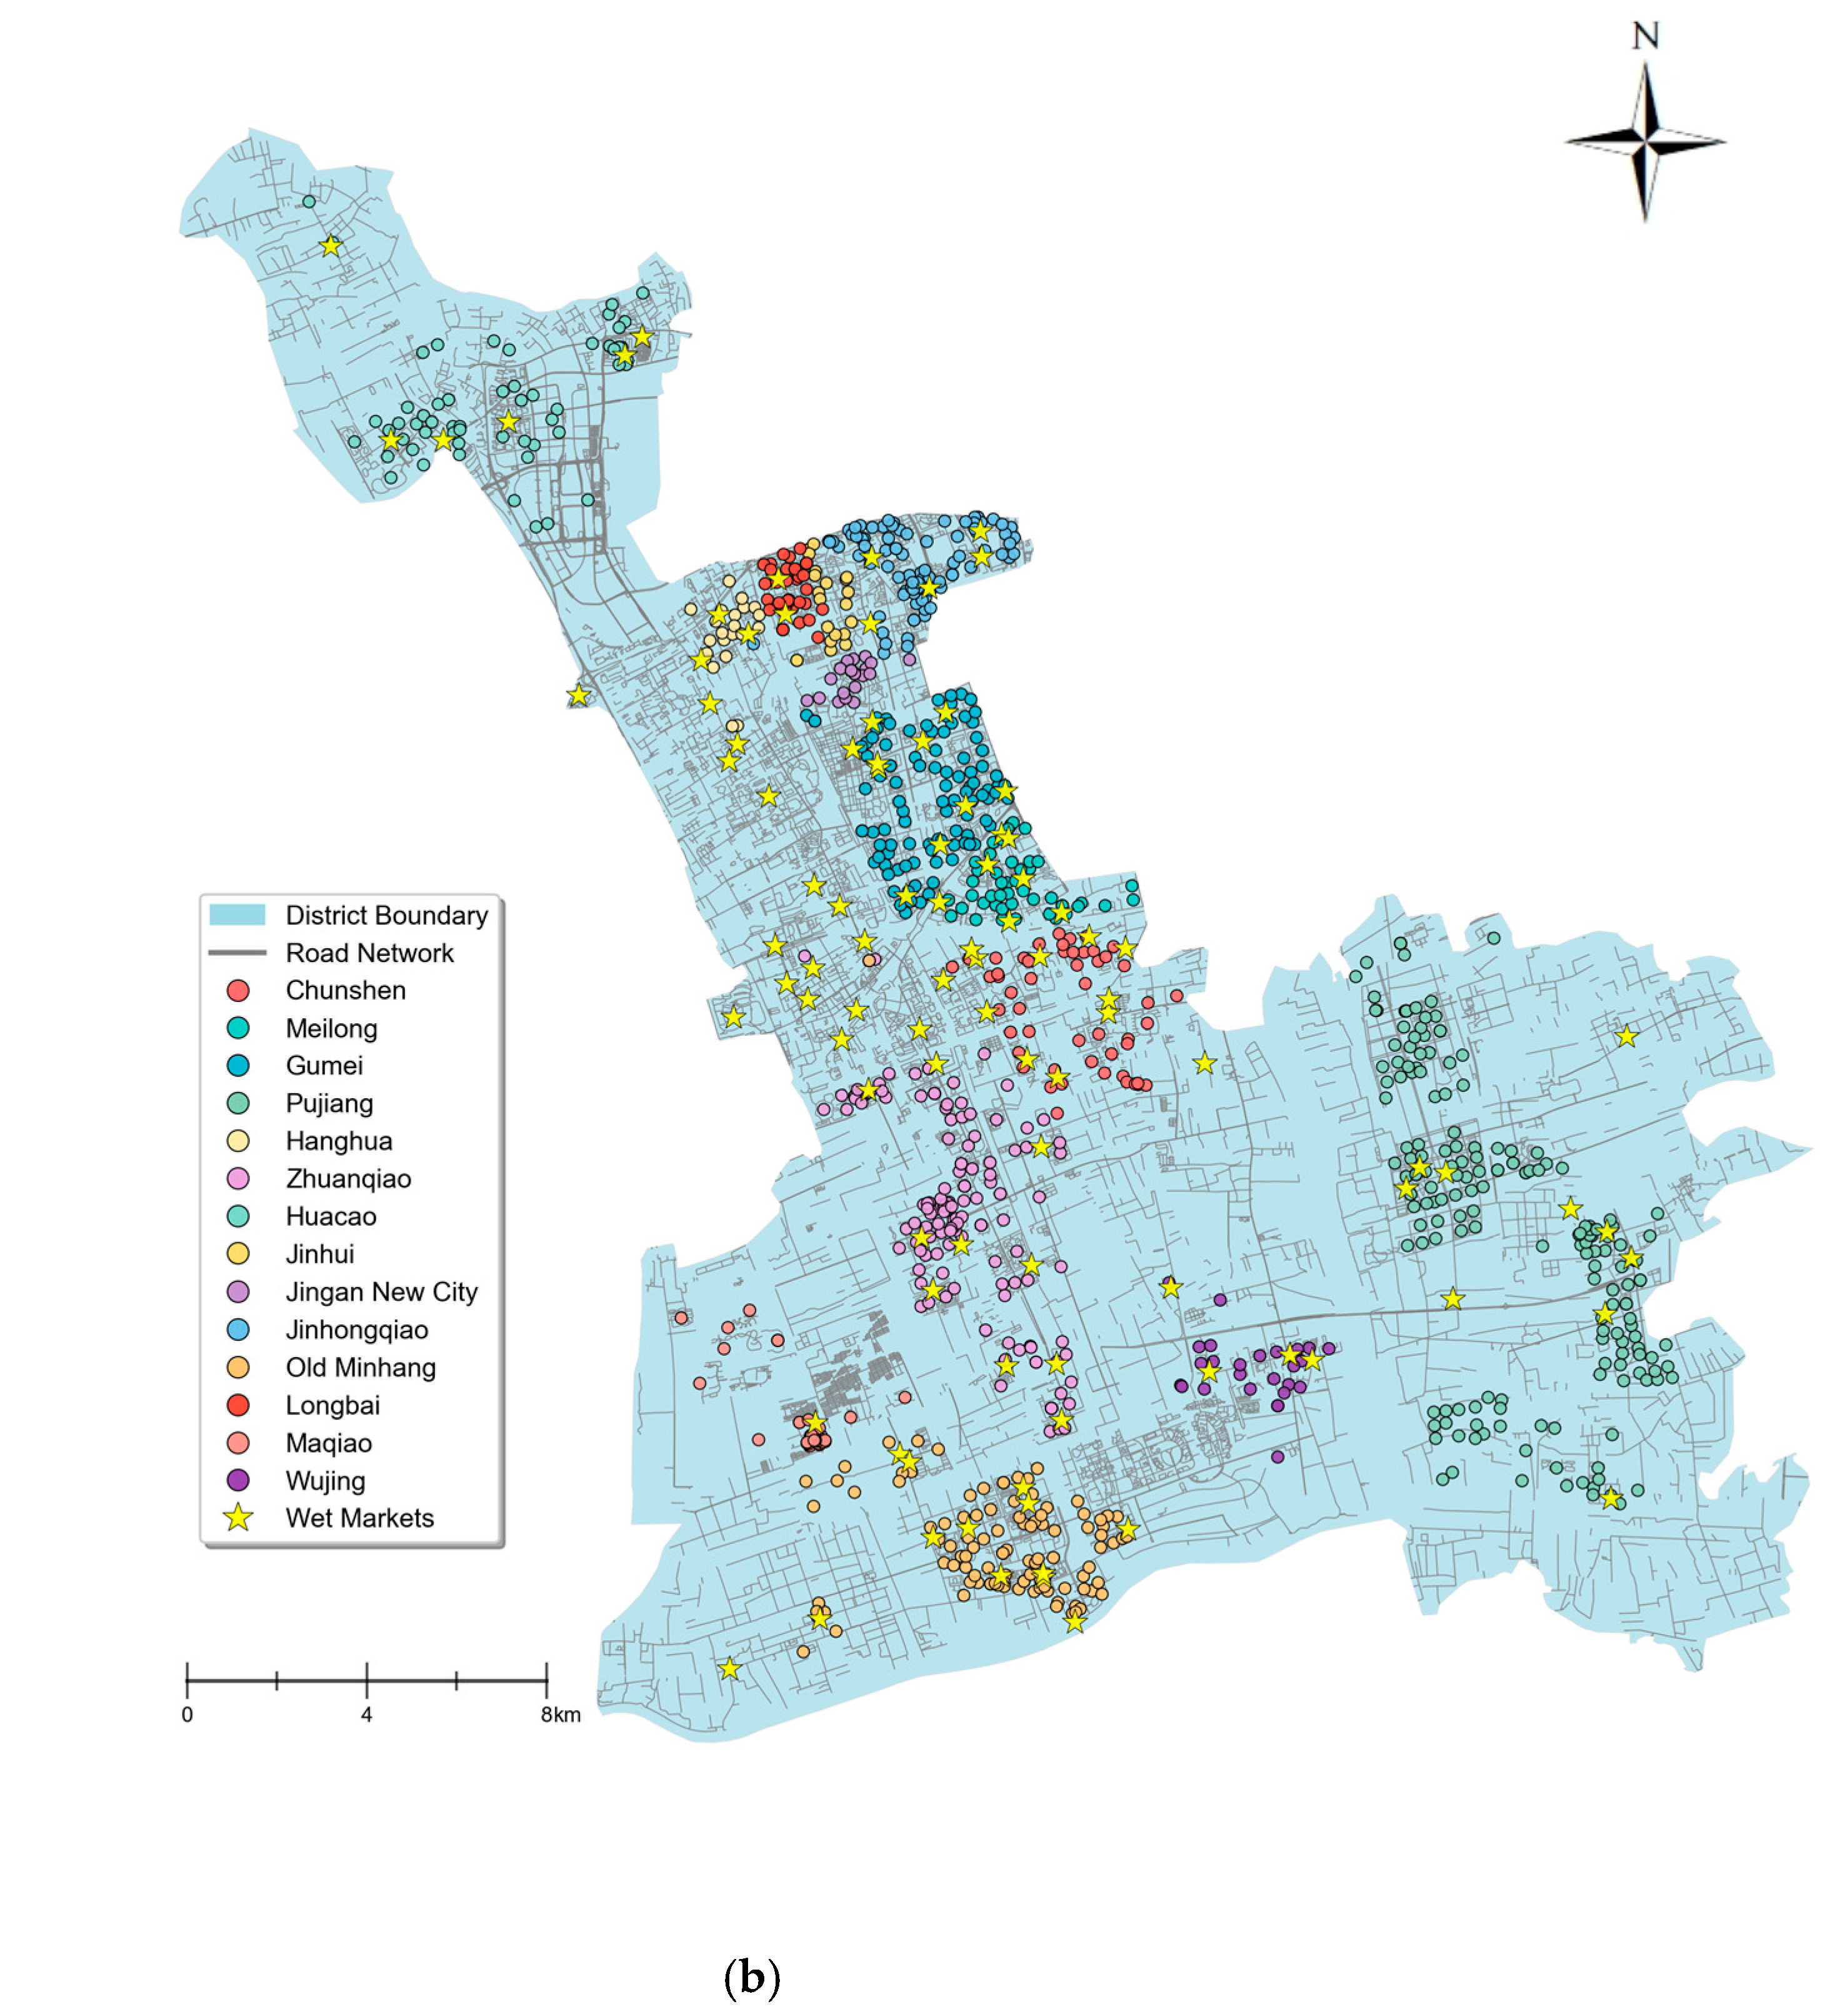
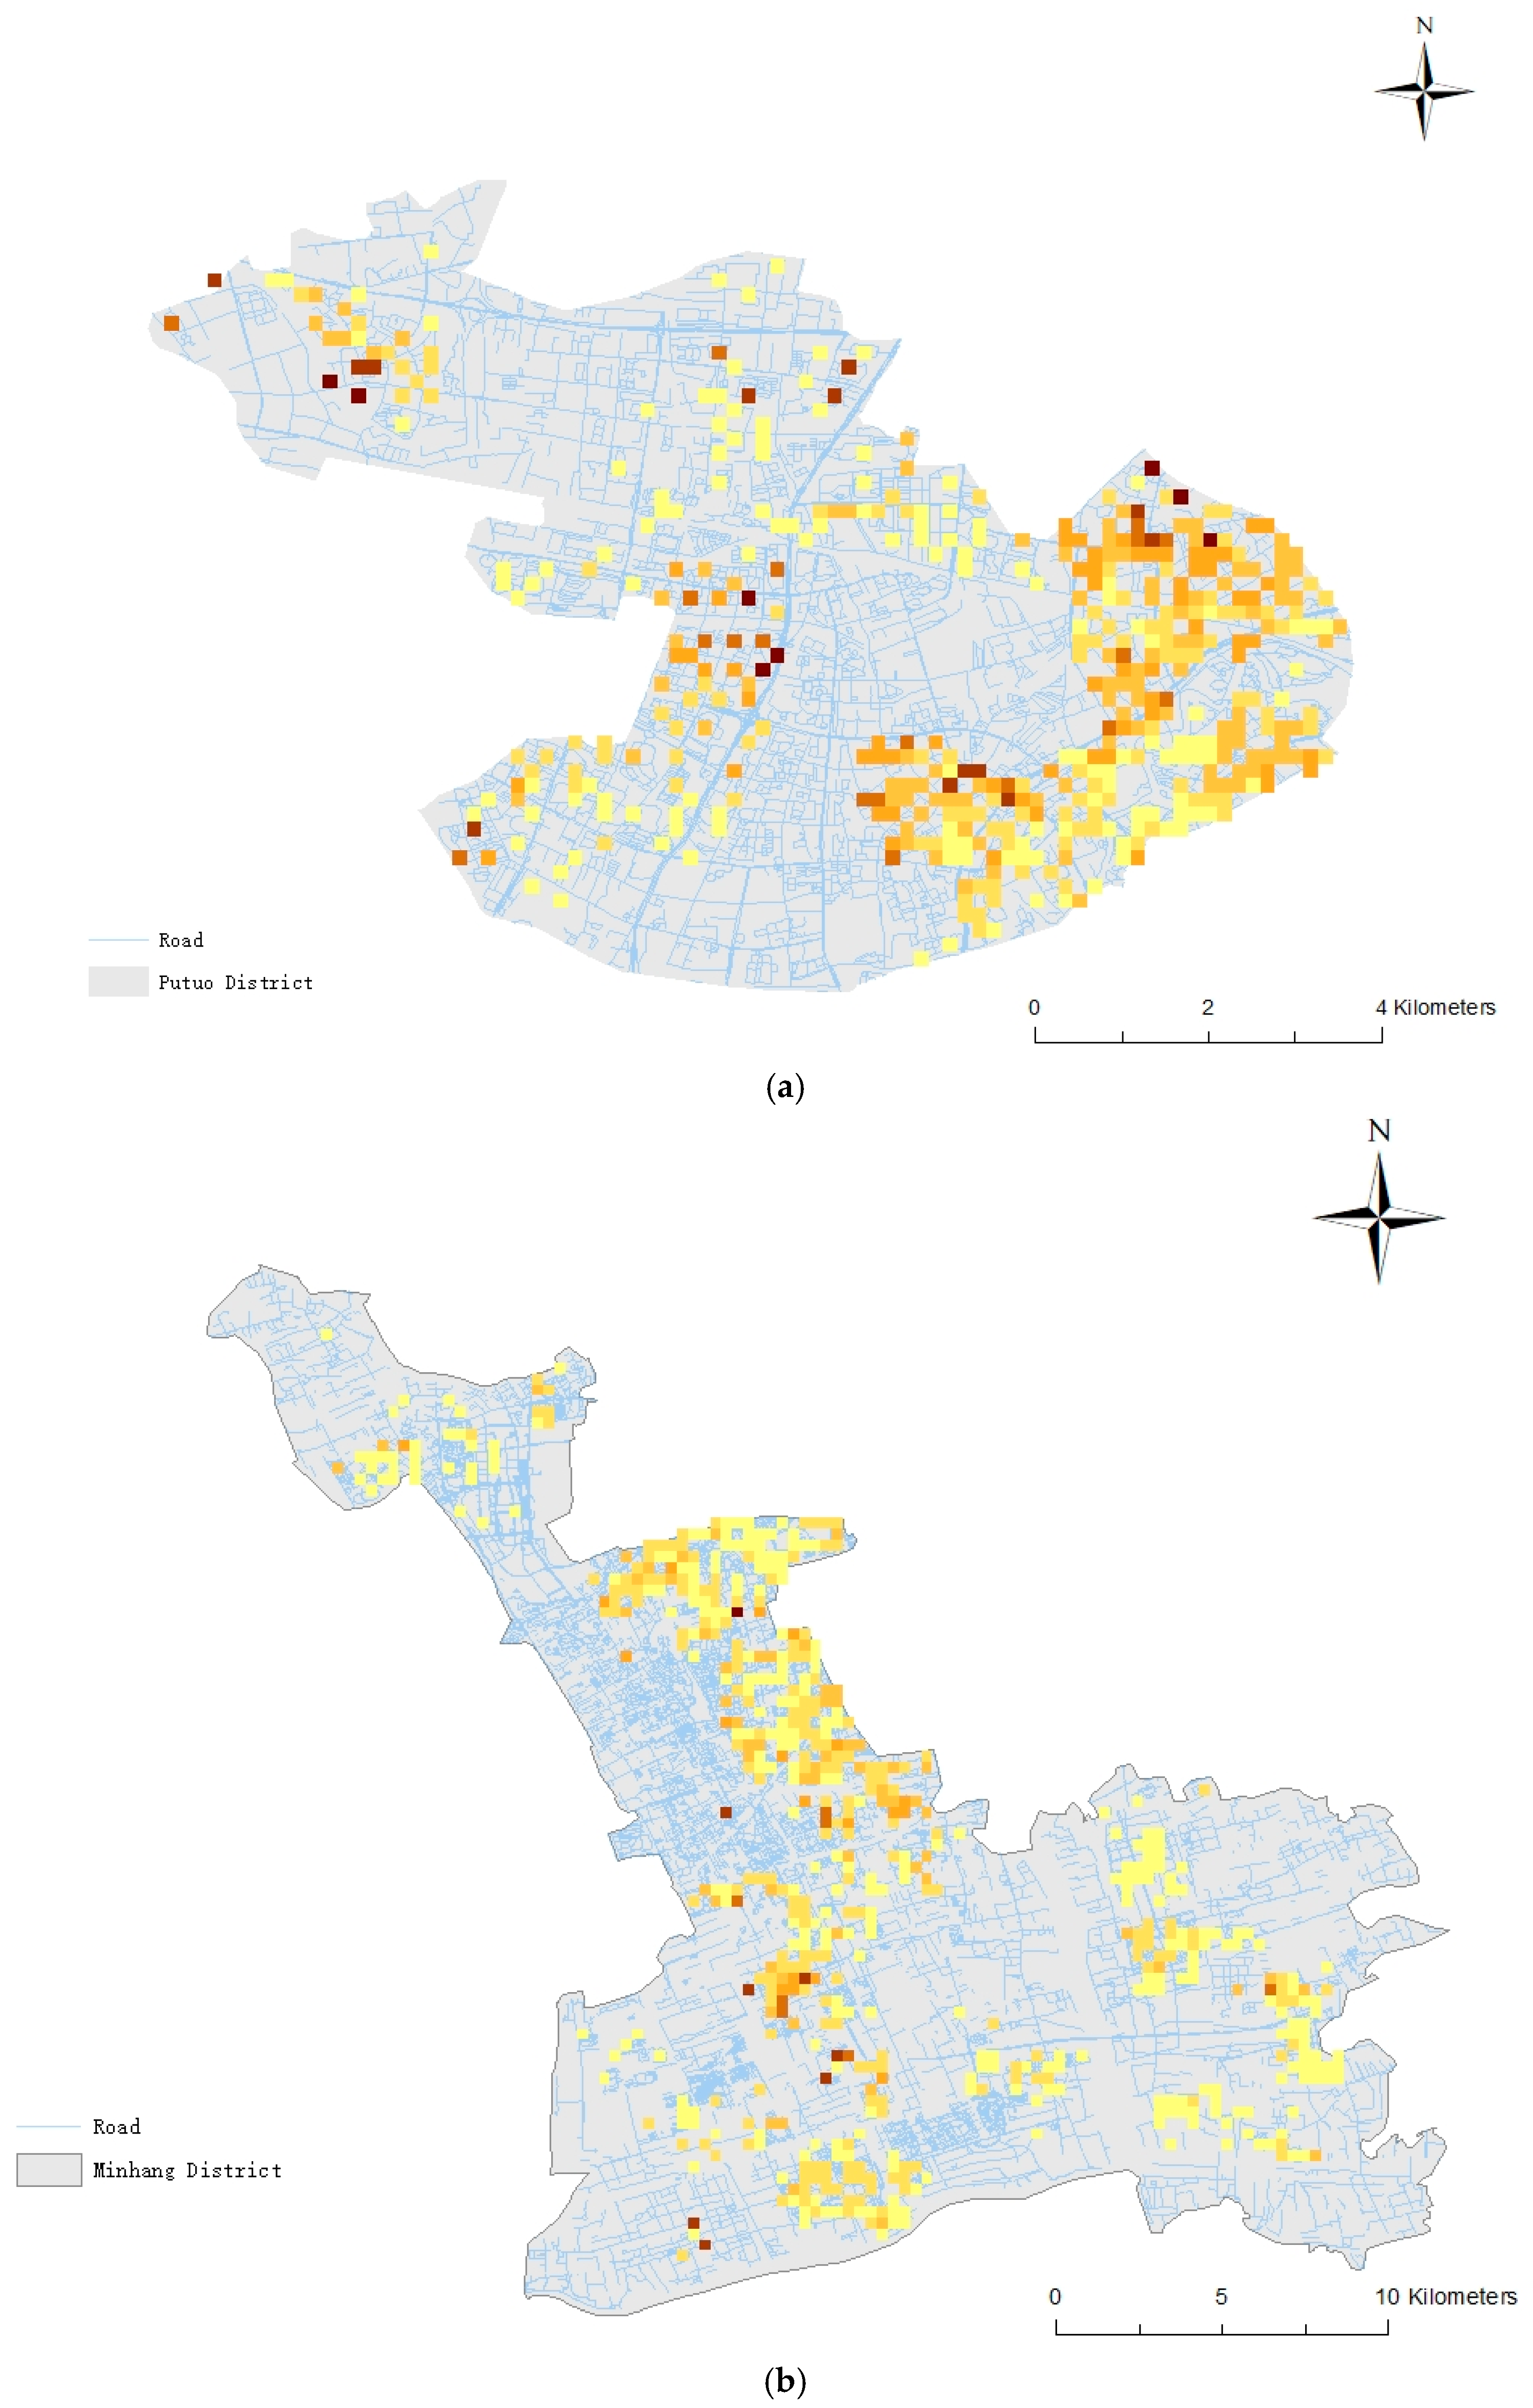
(2) Residential community data. Residential community data were obtained from Lianjia, a major property transaction platform, including attributes such as names, addresses, average housing prices, completion years, building counts, and household numbers. Adjacent residential communities were aggregated into residential clusters following Lianjia’s classification. A data cleaning procedure was applied to remove entries missing critical attributes (e.g., address, household count) or with fewer than five households. After cleaning, 971 communities in Minhang and 651 communities in Putuo remained. The spatial distribution of these communities is shown in Figure 3.
(3) Travel time data. Geocoding and travel time estimation for public transport, cycling, and walking were performed using the Baidu Map API. To address cross-boundary effects, a 15 min travel time buffer was applied for each mode to include surrounding communities and wet markets, improving upon conventional Euclidean-distance buffers (e.g., [49]).

3.4. Measurement of Accessibility and Equity

3.4.1. Gaussian Two-Step Floating Catchment Area (2SFCA) Method and Accessibility by Transportation Mode

The two-step floating catchment area (2SFCA) method with a Gaussian function was adopted to measure spatial accessibility to wet markets. Incorporating the Gaussian function accounts for the distance decay effect within the catchment area, improving the accuracy of accessibility estimates.
The method calculates the accessibility score of every residential community to wet markets in Putuo and Minhang Districts. It takes three main components into account:
(1) Service capacity of each wet market ( S j ), approximated by its operational area. According to the Shanghai Planning Guidance of 15 min Community-life Circle [5], every 1000 residents are expected to enjoy 120m2 of wet market area. Therefore, service capacity is calculated as:
S j = A r e a 120   × 1000
(2) Demand of wet markets, represented by the population ( P k ) of residential community k .
(3) Travel cost between one’s residence to wet markets, represented by the travel time ( T j k ) from residential community k to wet market j .
The Gaussian decay function and the 2SFCA calculations are as following:
G T j k , T 0 = e 1 / 2 × ( T j k / T 0 ) 2 e 1 / 2 1 e 1 / 2 ,   T j k T 0
R j = S j k T j k T 0 P k G T j k , T 0
A k = k T j k T 0 R j G T j k , T 0
where R j is the service capacity to population ratio of wet market j , T 0 is the 15 min travel time threshold, and A k is the accessibility index of residential community k .
To reflect real-world travel behaviors, accessibility was estimated separately for walking, cycling, and public transport. Travel times for each mode were obtained from the Baidu Map API. Accessibility scores were calculated for each mode using the Gaussian 2SFCA method described above. A composite accessibility score was calculated using weights based on survey data from Nanjing [3]: 55% walking, 30% cycling, and 15% public transport. Driving is excluded as the Gaussian-2SFCA method in this research adopts the 15 min walkable community concept as a theoretical base to determine the catchment area. Also, Zhong et al. [3] found that residents seldom go food shopping by car in their survey data. Given the absence of Shanghai-specific surveys on travel behavior for food shopping, we derived mode-specific weights from a comprehensive study conducted in Nanjing [3]. This approximation is justified by the comparable urban and economic contexts of Nanjing and Shanghai, both being core metropolises within the Yangtze River Delta region. Critically, they share similar urban transit structures characterized by high-density, small-world network topologies [50,51] and analogous patterns of public transport efficiency, with high coverage in urban cores and lower coverage in peripheries [52,53]. Therefore, applying the travel mode split observed in Nanjing is a methodologically sound and reasonable proxy for estimating composite accessibility in Shanghai.
A c o m p o s i t e = 0.15 × A p u b l i c   t r a n s p o r t + 0.30 × A c y c l i n g + 0.55 × A w a l k i n g

3.4.2. Outlier Detection

After computing the accessibility scores for each transportation mode and the composite accessibility score, the Z-standardization method was applied to detect extreme values. Residential communities with |z| > 3 were excluded to prevent outliers from biasing the equity assessment [54]. 8 in 971 communities for Minhang and 5 in 651 communities in Putuo are excluded as outliers.

3.4.3. Equity Evaluation: Coefficient of Variation (CoV) and Gini Coefficient

Equity of accessibility was assessed using the coefficient of variation (CoV) and the Gini coefficient. The CoV reflects the relative dispersion of accessibility scores within each district:
C o V =     σ μ
where σ is the standard deviation and μ is the mean of accessibility scores. Higher CoV values indicate greater disparity.
The Gini coefficient is the index representing the “ratio of the area of the gap between the Lorenz Curve and the line of perfect equality, over the area under the line of perfect equality” [42]. The Lorenz Curve here is the curve representing the cumulative distribution function of the accessibility scores across the households [45]. The Gini coefficient measures inequality in the distribution of accessibility:
G = 1 k = 1 n Y k + Y k 1 X k X k 1
where Y k is the cumulative proportion of accessibility, X k is the cumulative proportion of households, and n is the total number of residential communities. A Gini coefficient closer to 0 indicates more equitable distribution, while values approaching 1 reflect stronger inequity.

4. Results

4.1. Accessibility Analysis

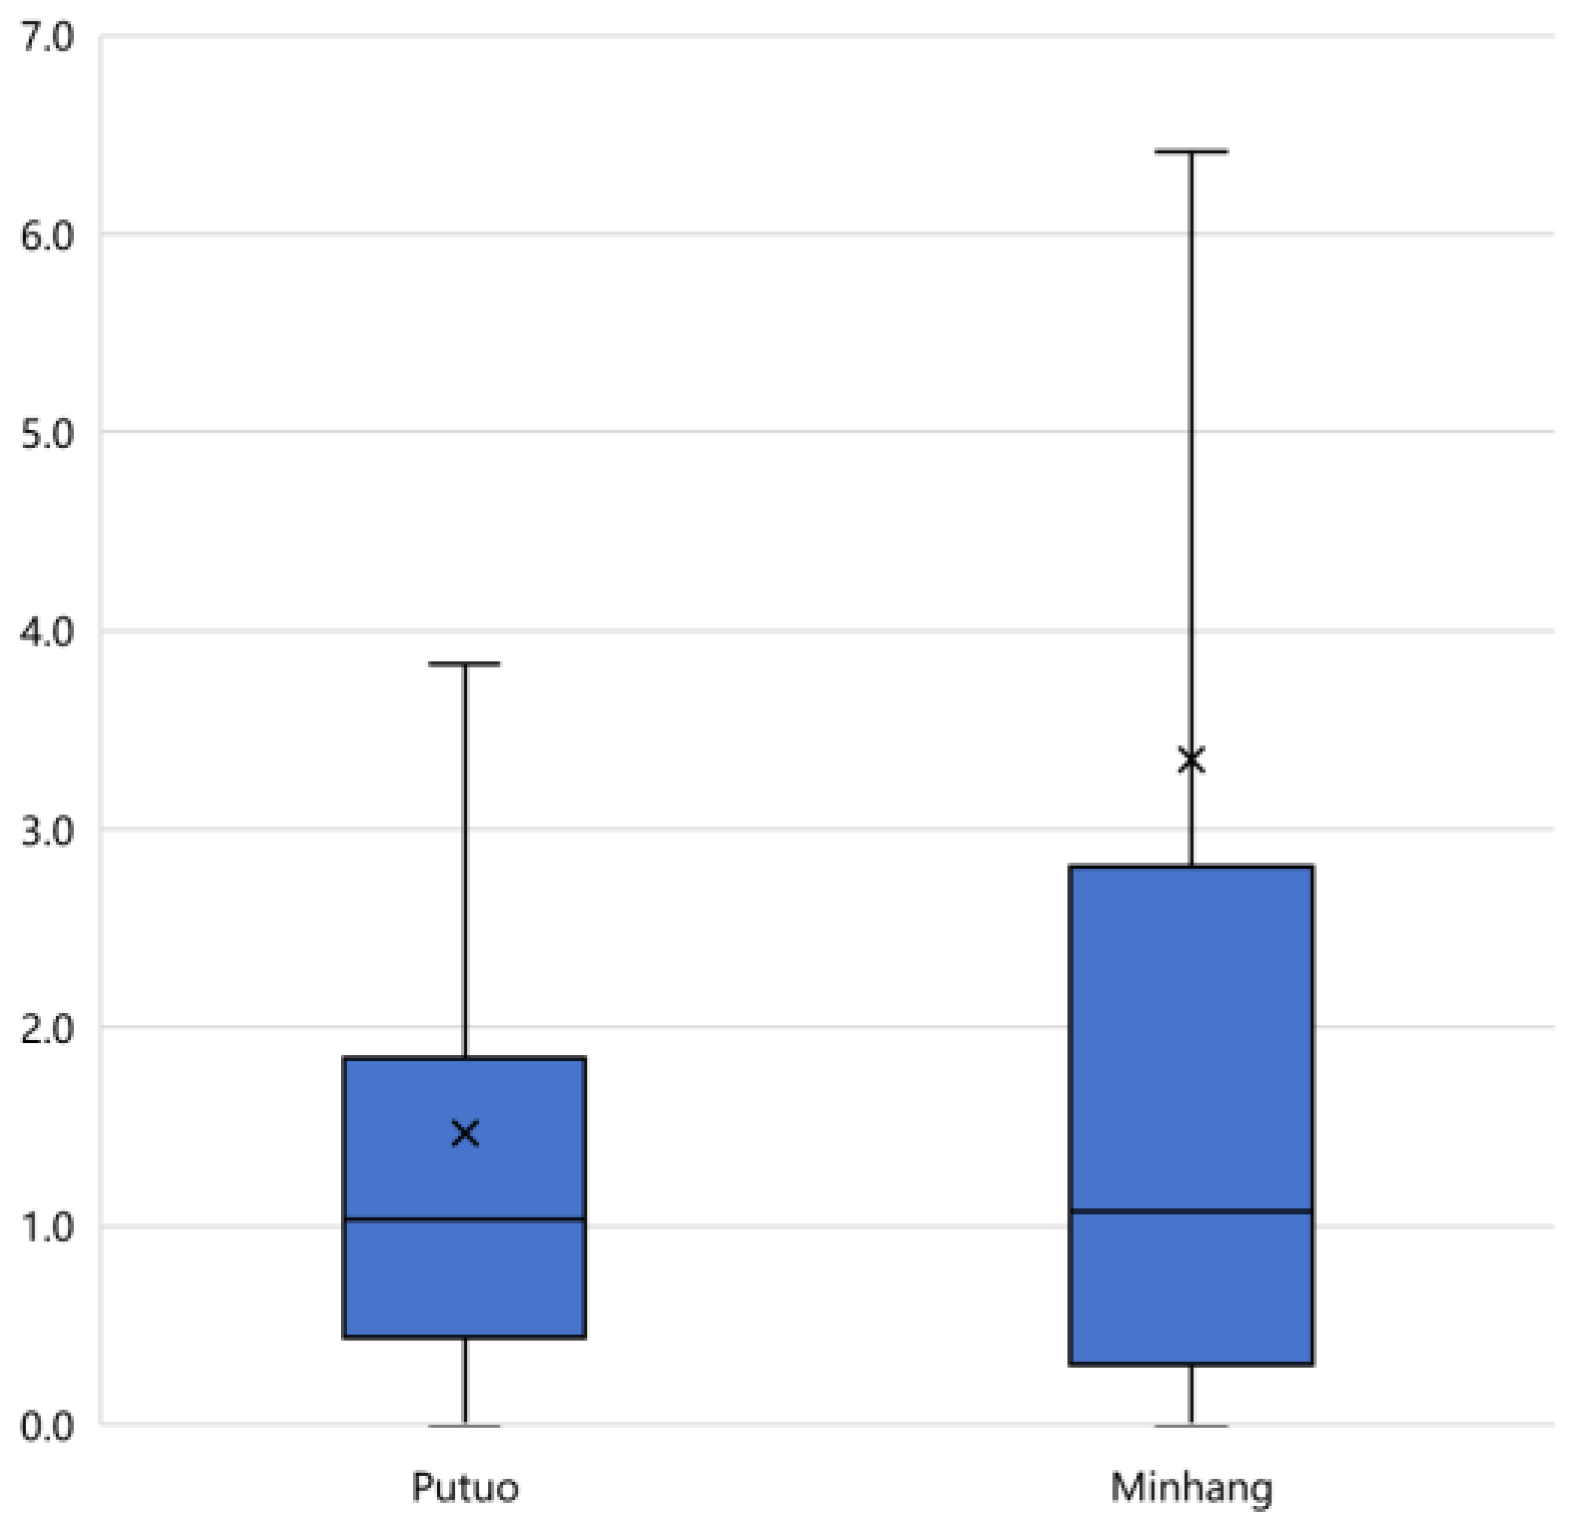
Figure 4 shows the distribution of composite accessibility scores across residential communities (excluding outliers). Minhang demonstrates higher average accessibility than Putuo across all transportation modes, but with greater dispersion (higher CoV) (Table 1). While the composite accessibility scores of Minhang performs better on average, the lower 50% of communities in both districts have similarly limited access. The top 50% communities of Minhang drive the district’s higher average, with several extreme values pulling the mean far above the interquartile range. In contrast, Putuo exhibits a more evenly distribution of accessibility, with its mean accessibility closer to the median and less influenced by extreme values. Table 1 further confirms this trend. For every transportation mode and the composite score, Minhang consistently reports higher averages as well as higher CoV, whereas Putuo has lower averages but more balanced accessibility.
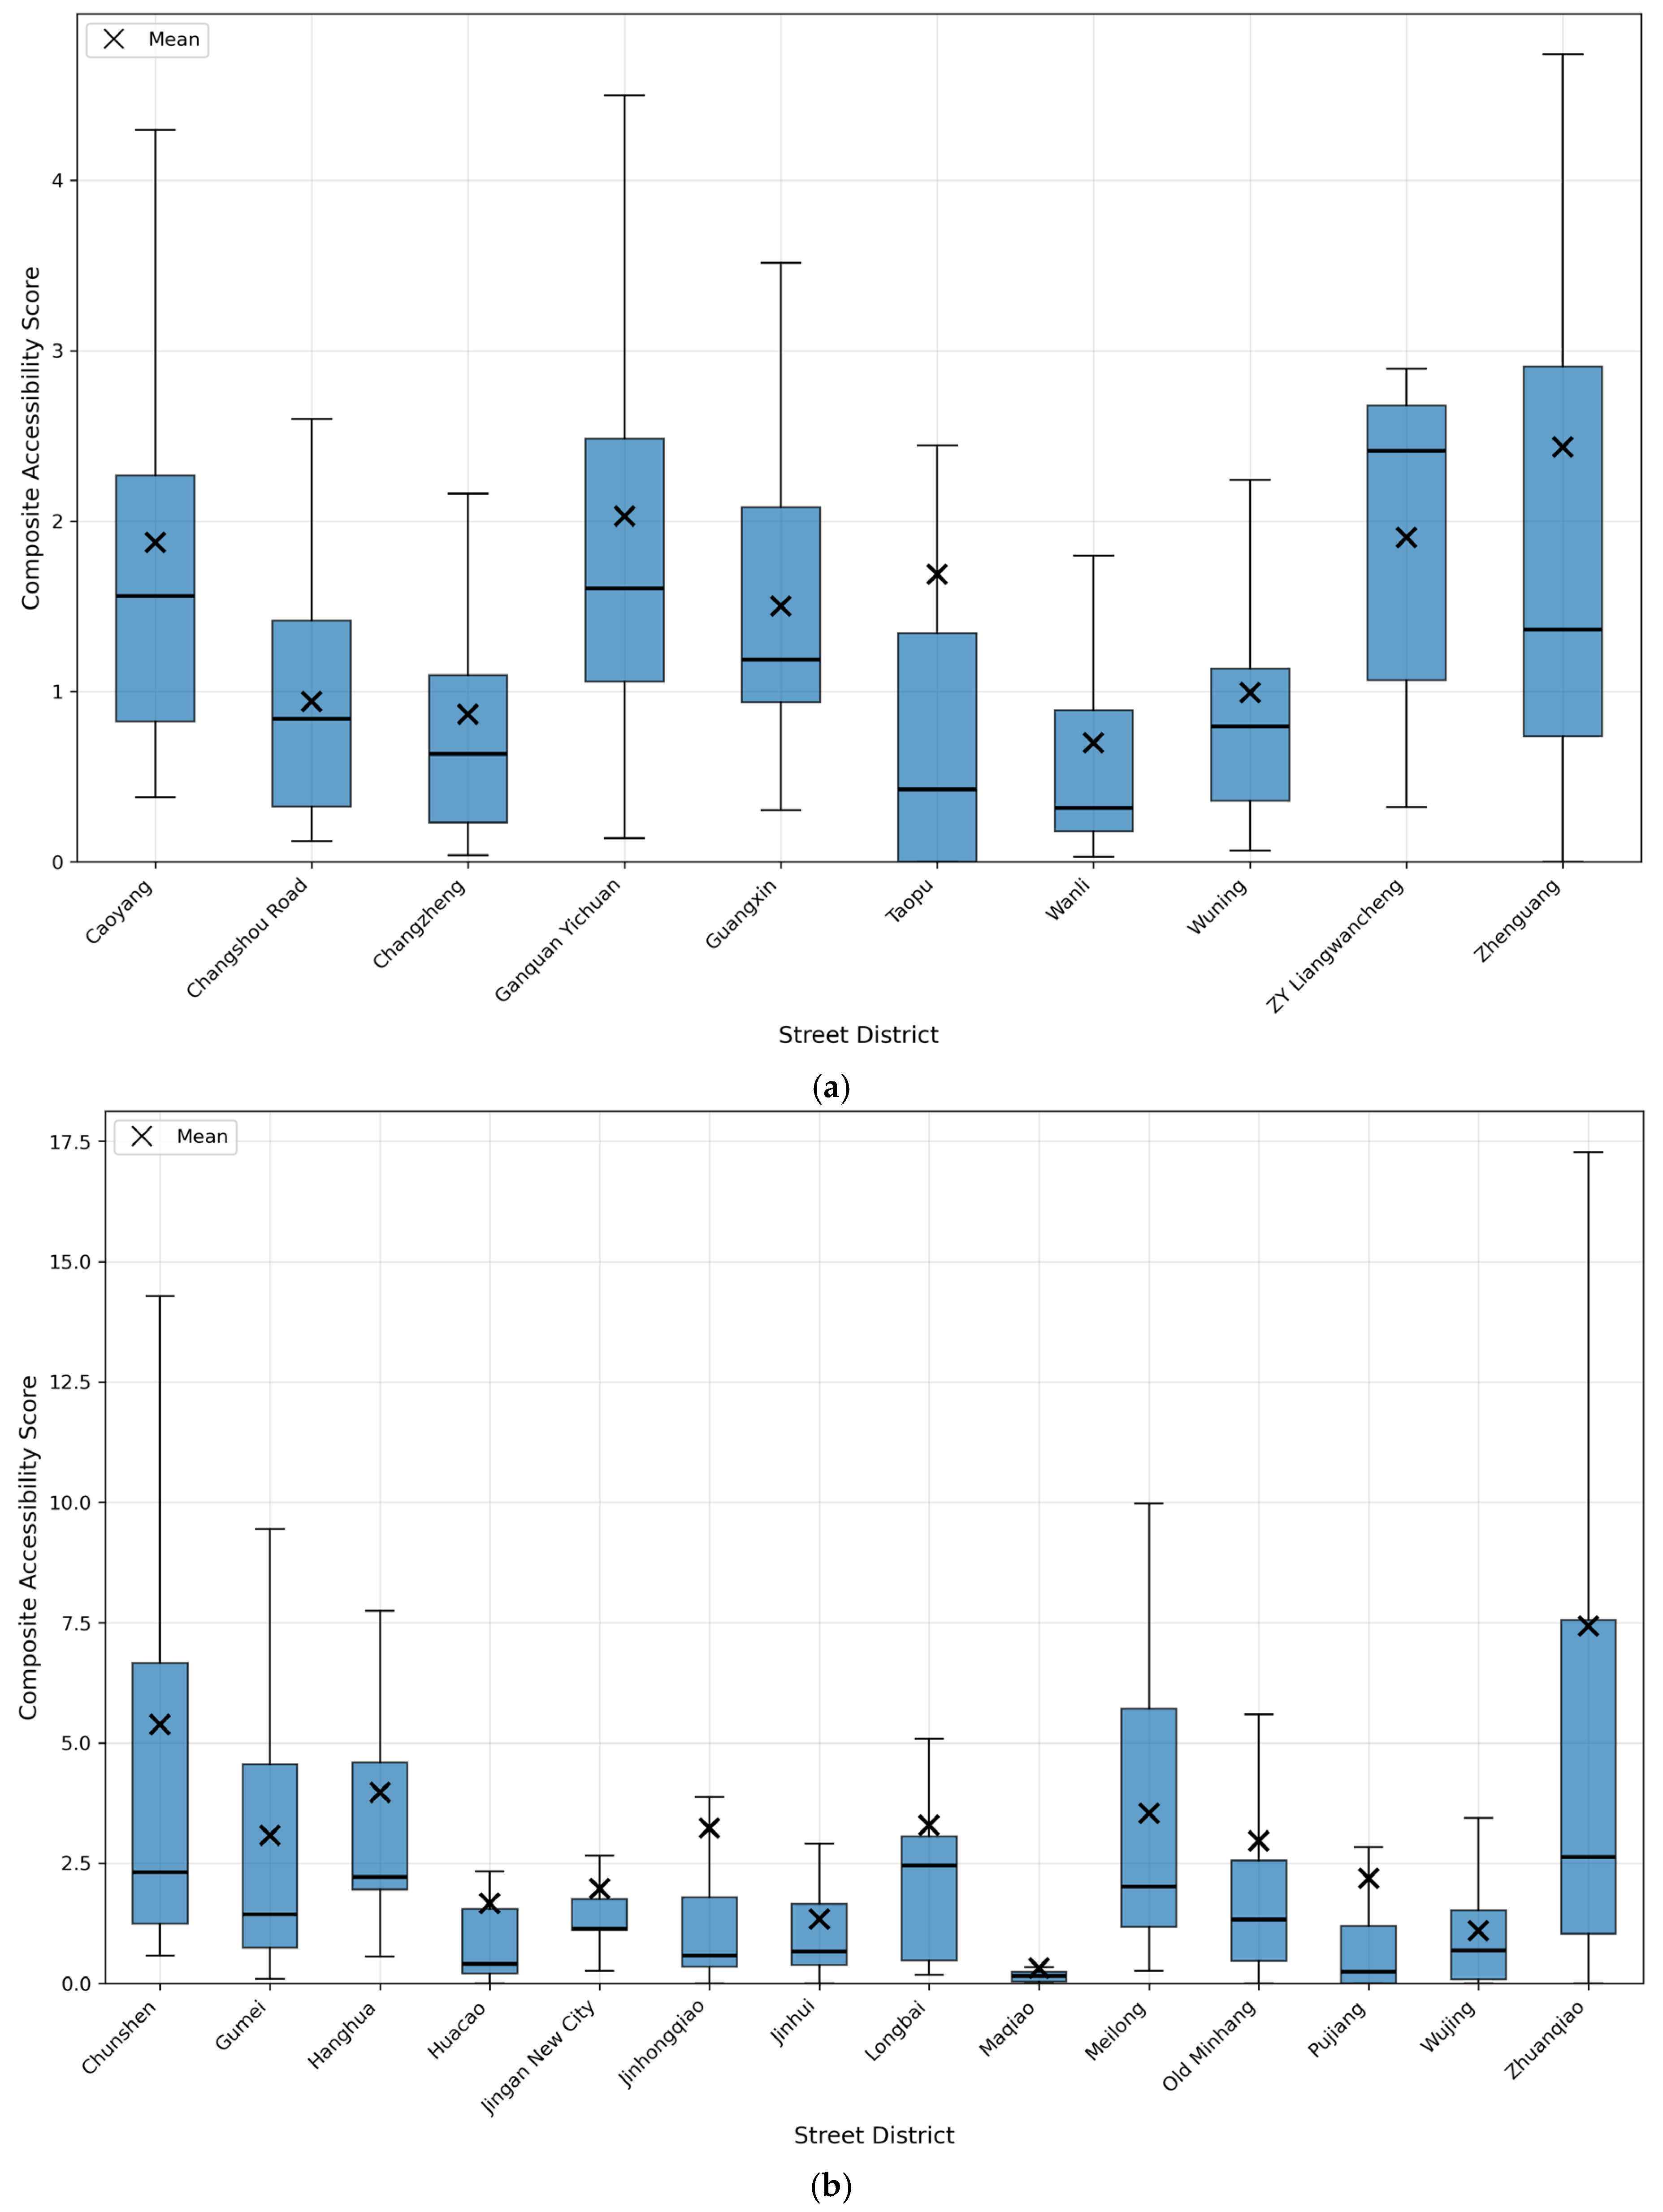
Figure 5 presents cluster-level results. Intra-district analysis reveal imbalances within Minhang, with nine out of fourteen clusters having median accessibility above the third quartile. Some clusters (e.g., Maqiao, Huacao, Jinhongqiao, Jinhui, Pujiang, Wujing) have very low accessibility (medians lower than 1.0), while others (e.g., Chunshen, Hanghua, Longbai, Meilong, Zhuanqiao) show medians above 2.0. In Putuo, accessibility is more balanced, with most clusters near the median. An exception is Taopu, where 25% of communities have zero access. Changshou Road, Changzheng, Wanli, and Wuning have the lowest access, while ZY Liangwancheng and Zhenguang have the highest accessibility.
Besides descriptive statistics, a statistical test is performed to validate the difference in composite accessibility scores between two districts. We employ Welch’s t-test. This test is particularly suitable for data with heterogeneous variances and does not require normality assumptions, making it appropriate for our dataset characterized by significant variance differences between groups (Levene’s test: F = 31.09, p < 0.001). The substantial sample sizes (Putuo: n = 646; Minhang: n = 963) satisfy the Central Limit Theorem conditions for parametric testing.
Welch’s t-test (Table 2) confirmed this difference was statistically significant (t = −6.145, p < 0.001). The effect size was small to medium (Cohen’s d = −0.260). The 95% confidence interval for the mean difference [−2.454, −1.266] indicates that Minhang district has significantly higher accessibility levels than Putuo district.

4.2. Equity Analysis

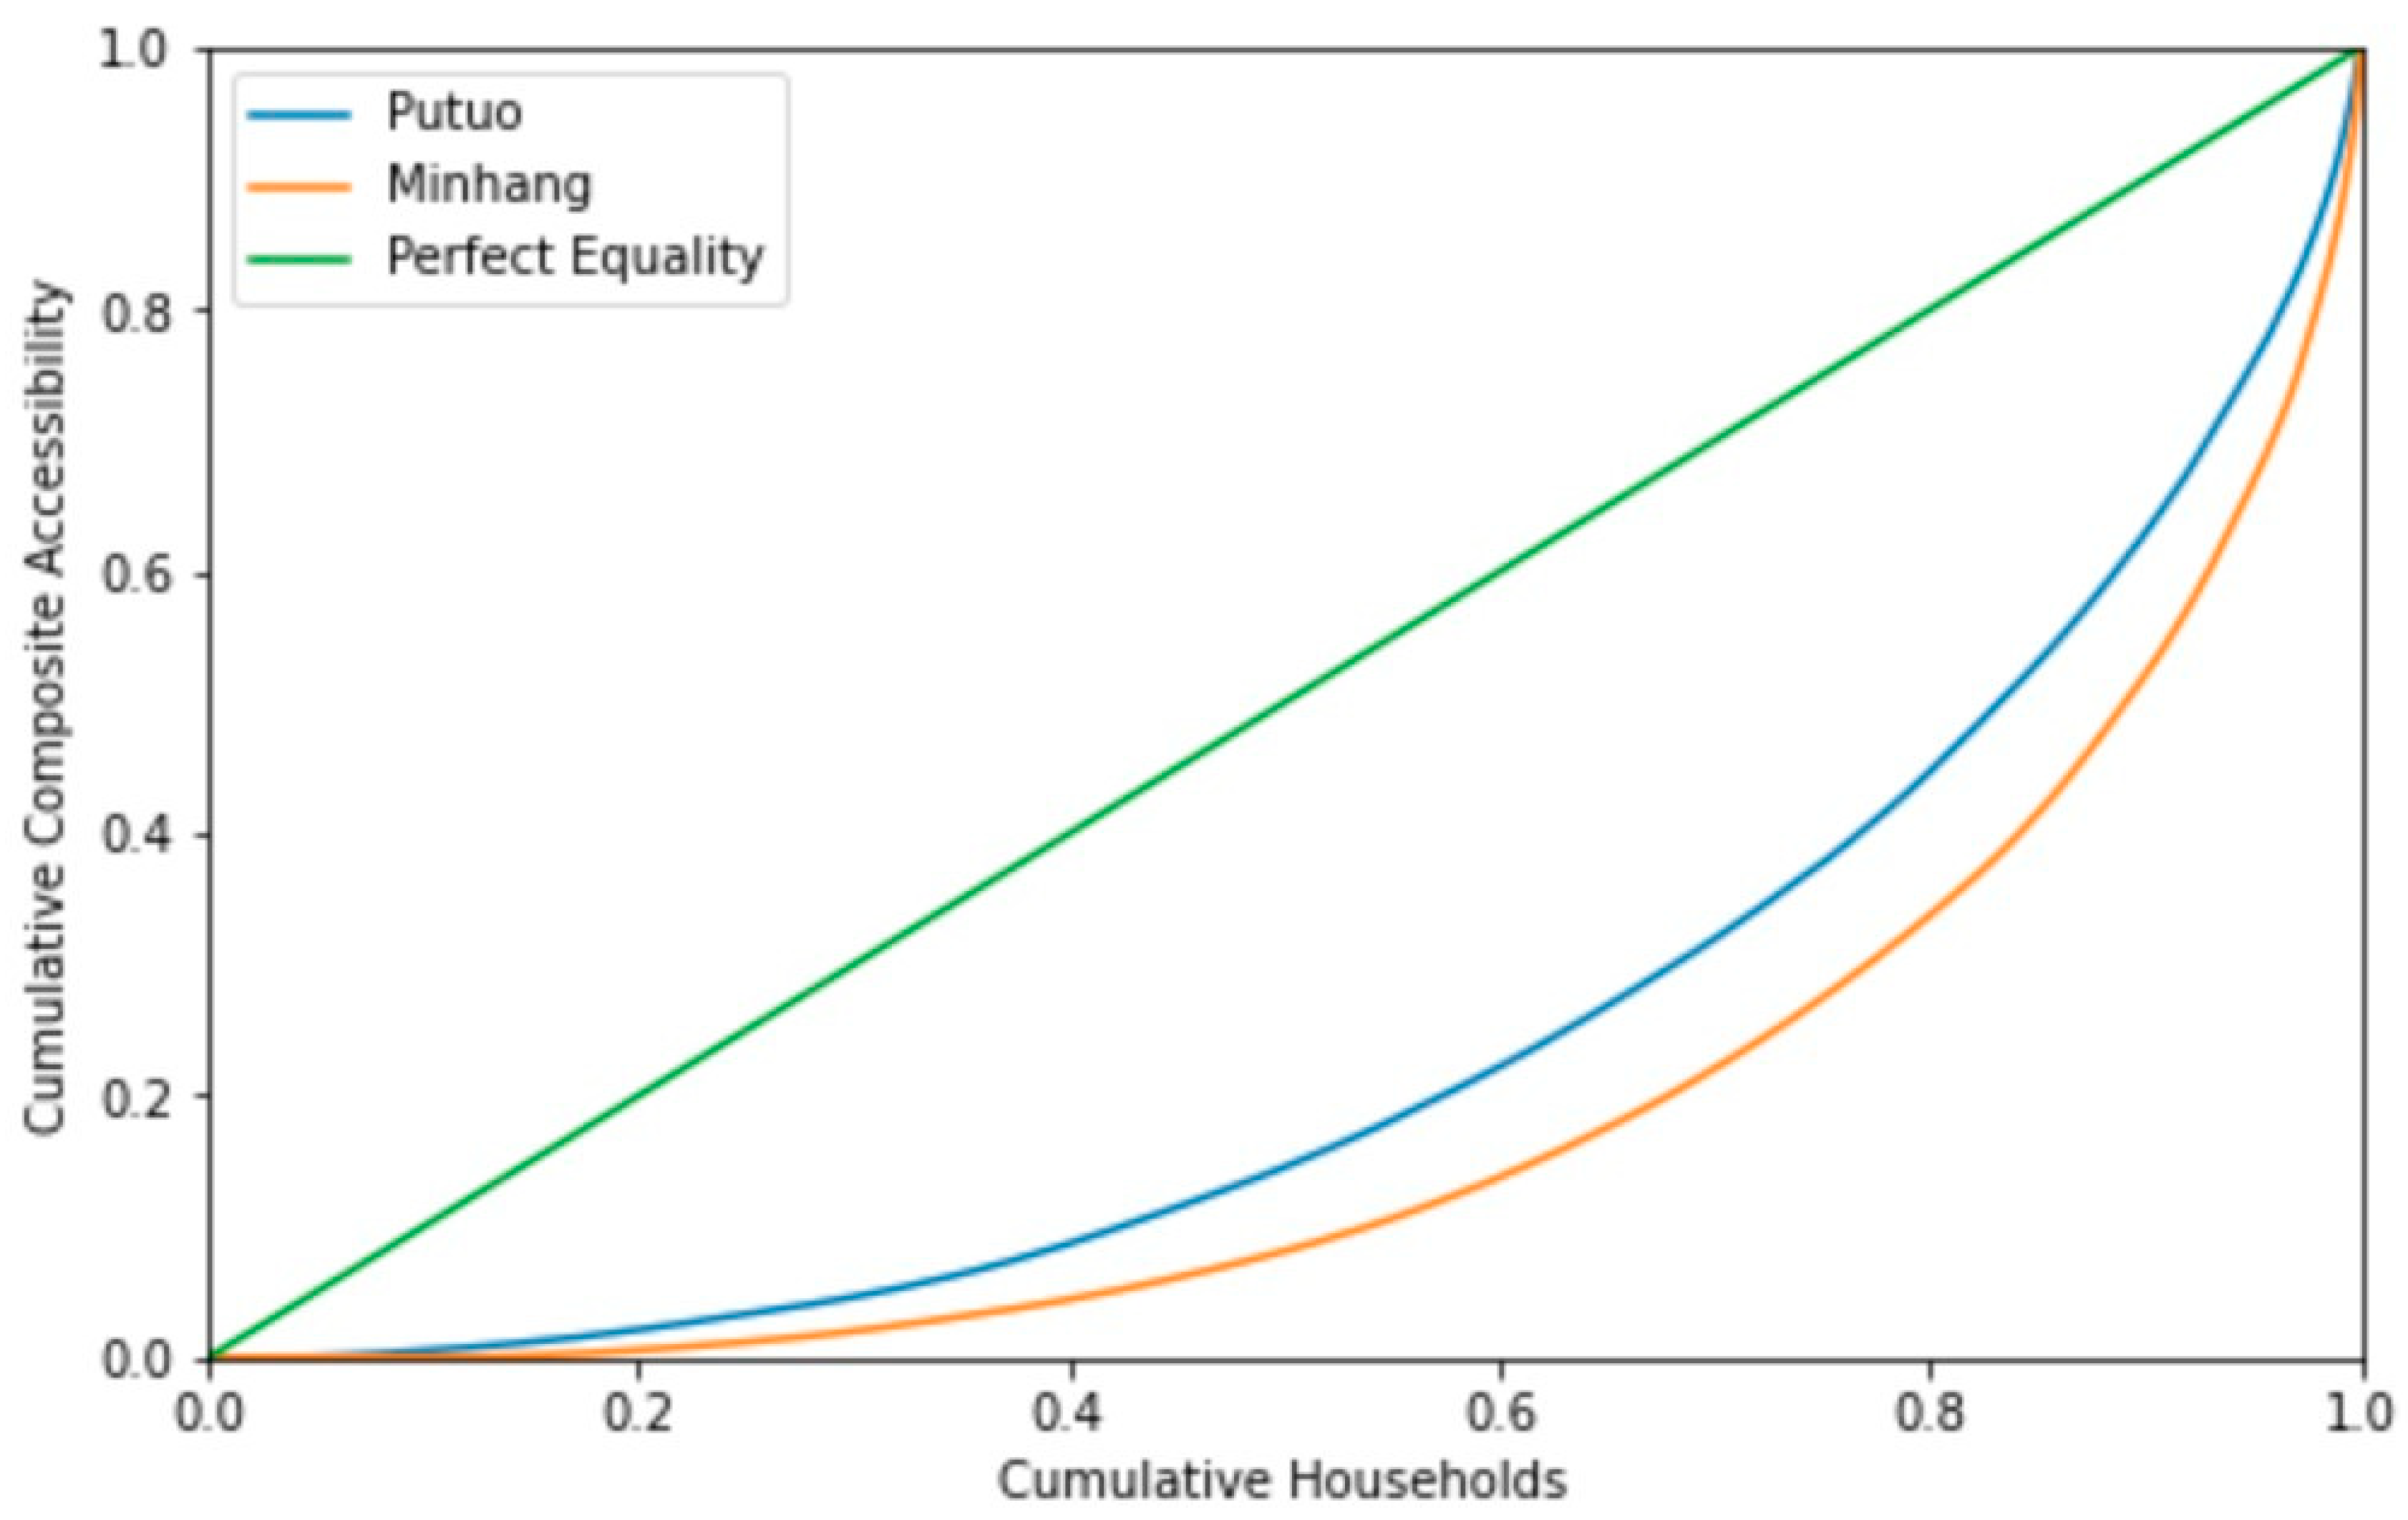
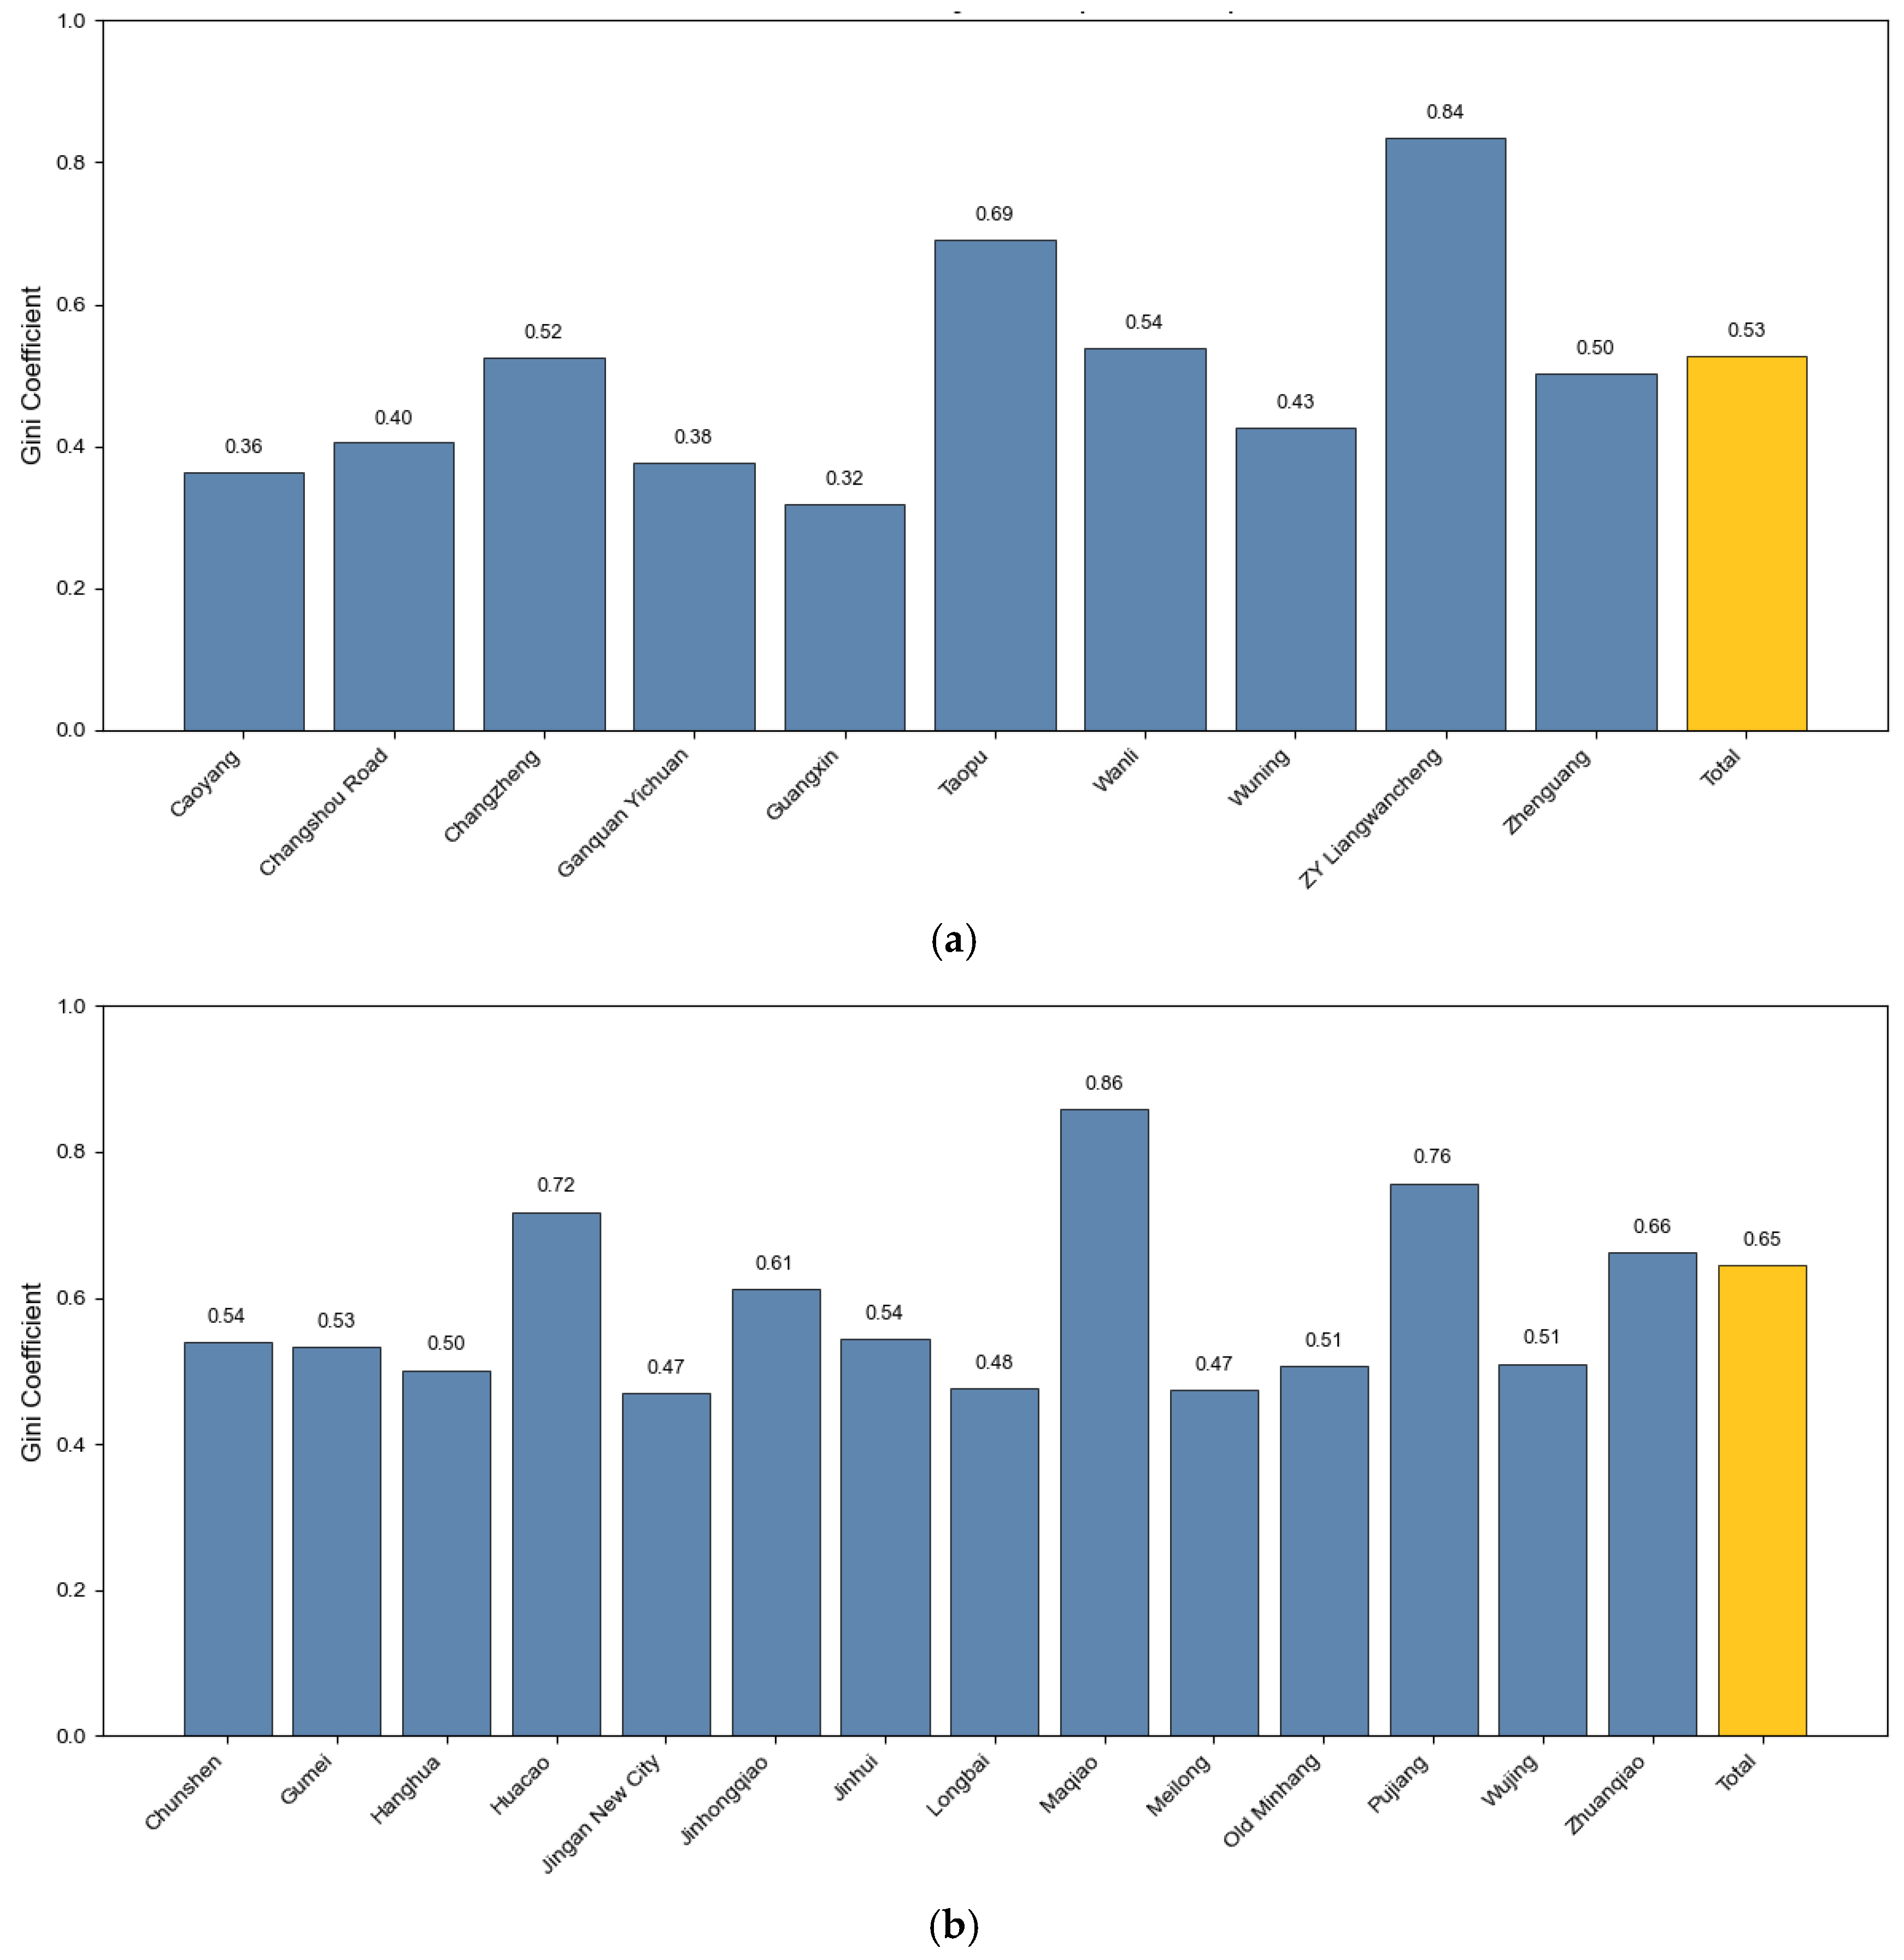
Equity of accessibility was evaluated using Lorenz curves (Figure 6) and Gini coefficients (Figure 7). The overall Gini coefficient is 0.65 for Minhang and 0.53 for Putuo, indicating higher inequality in the peripheral district.
Cluster-level Gini coefficients (Figure 7) also reveal high accessibility inequality within Minhang, with the highest of Maqiao (0.87) and the lowest of Jingan New City (0.47). Most clusters fluctuate around 0.50, which is in alignment with the intra-district imbalances observed in Figure 6. Putuo performs much better overall, with half of its clusters below 0.50. However, ZY Liangwancheng (0.84) and Taopu (0.69) show high inequality. ZY Liangwancheng’s coefficient should be interpreted cautiously given its small sample size (only consists five communities), which may distort the statistic. Clusters such as Changzheng (0.52), Wanli (0.54) and Zhenguang (0.50) should also be paid attention to as they demonstrate higher-than-average inequality.
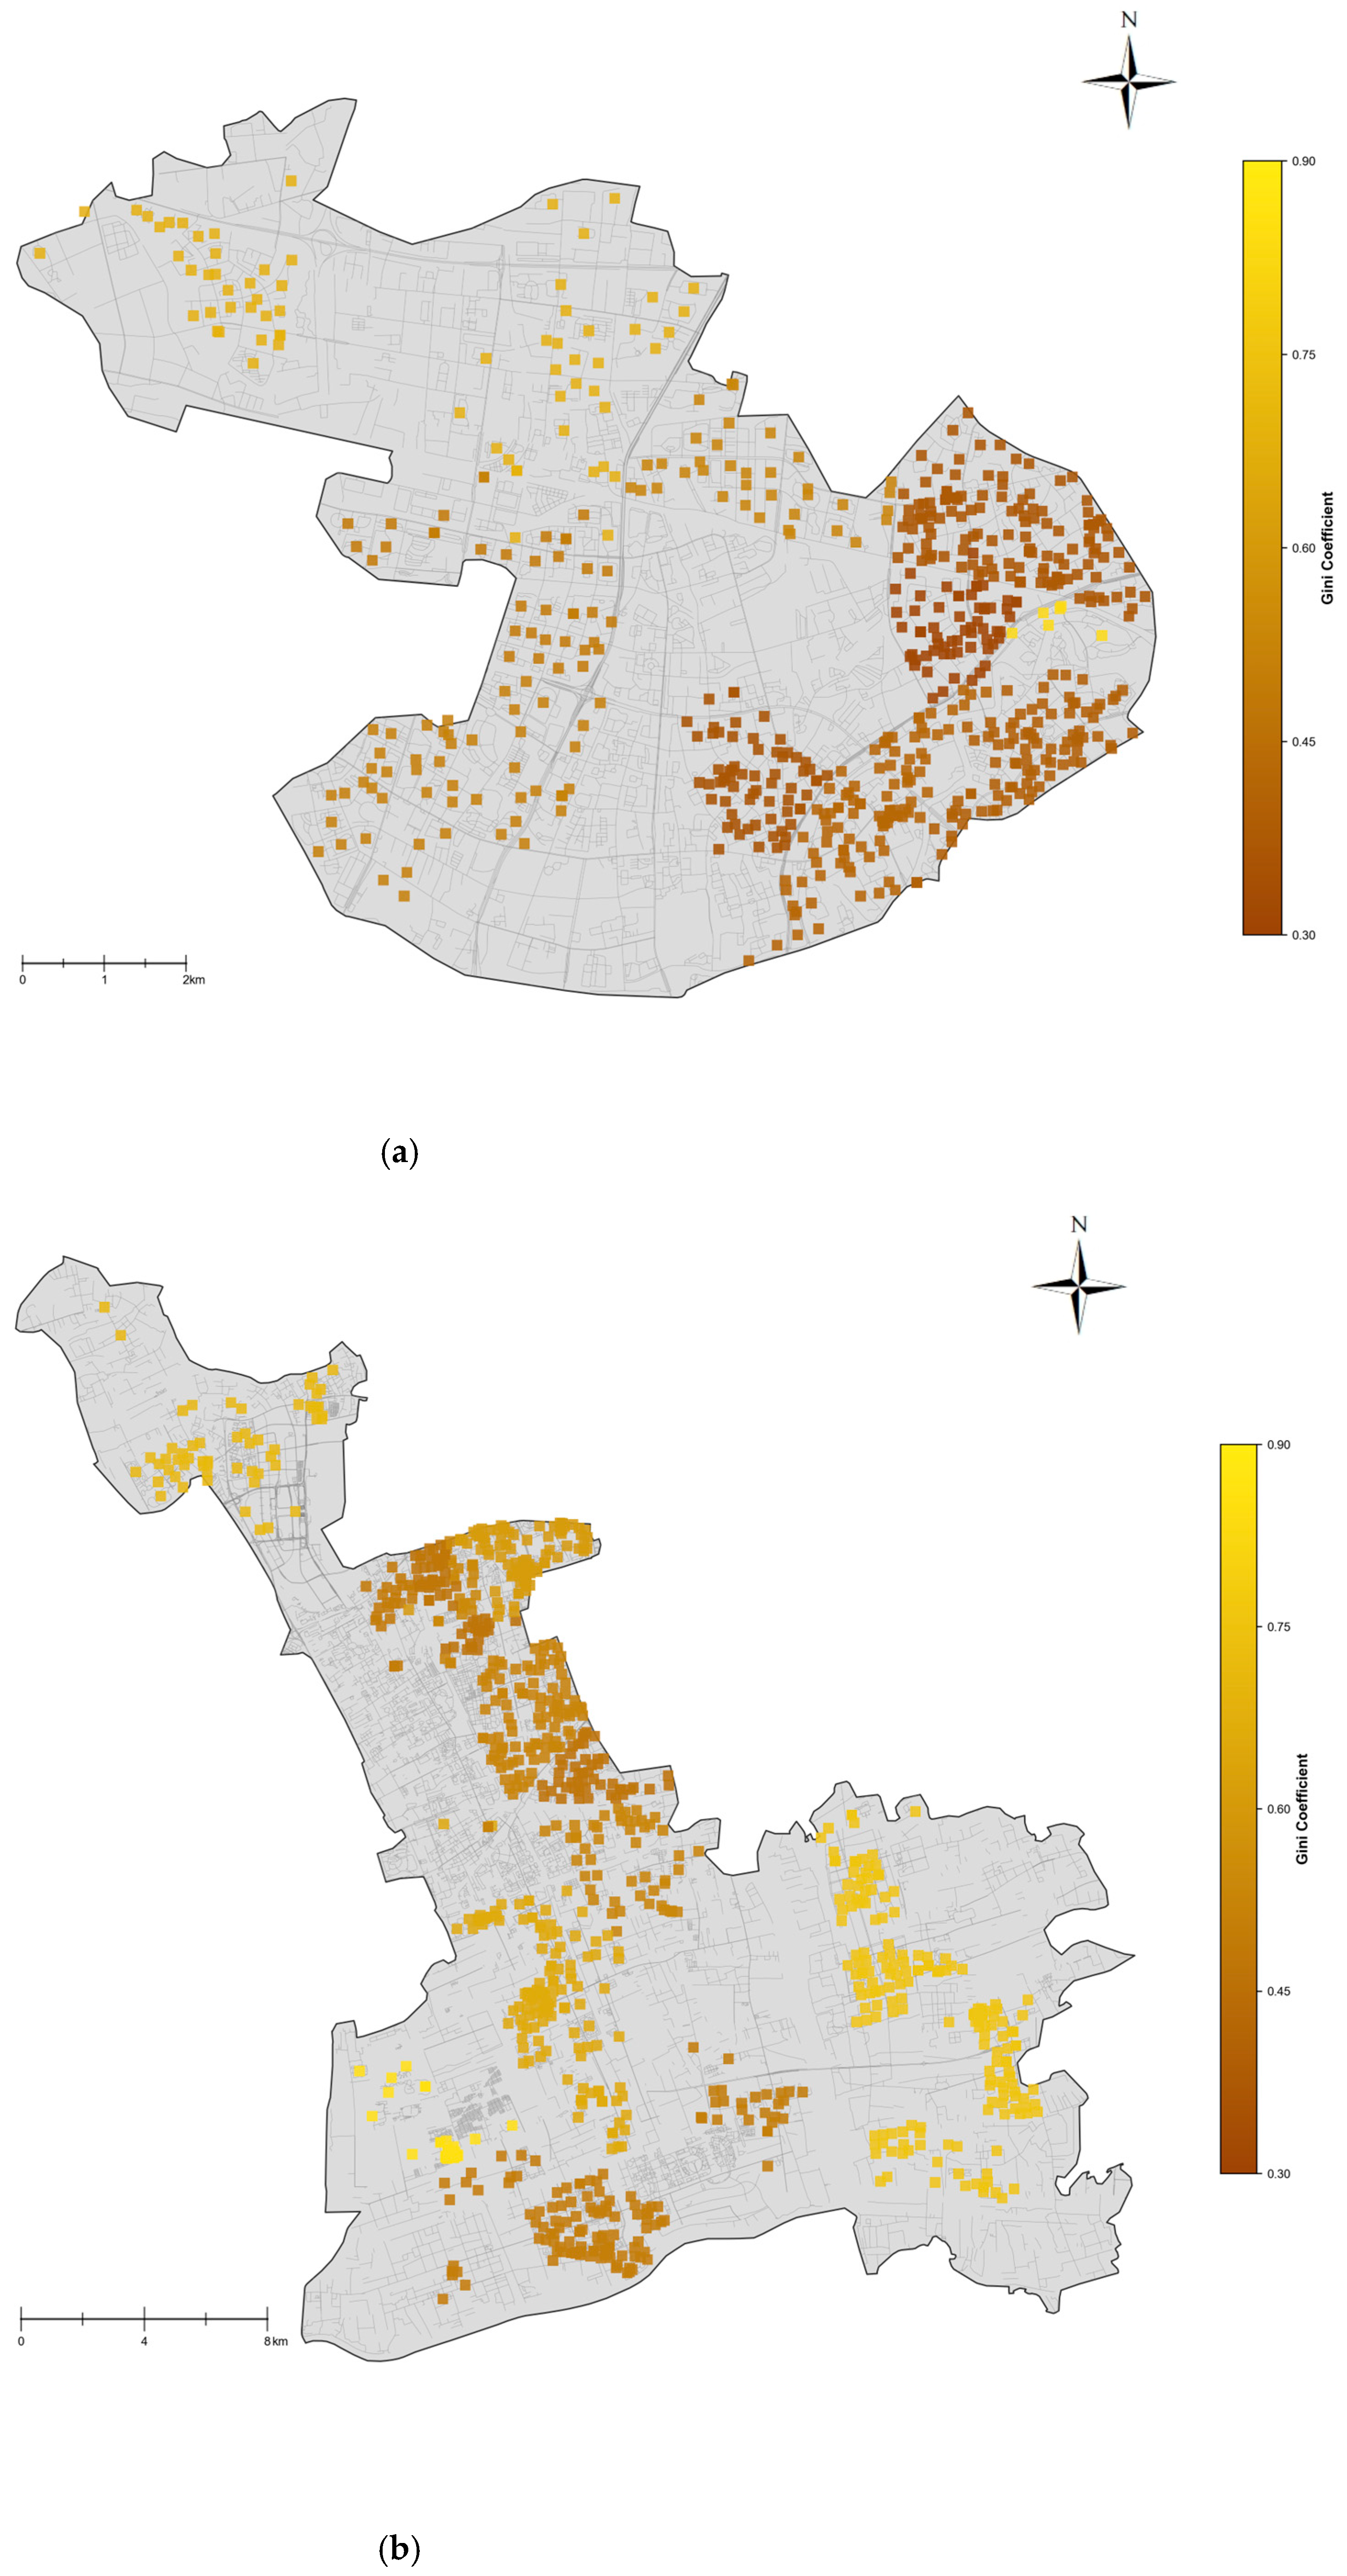
The spatial distribution of Gini coefficients across residential clusters is further visualized in Figure 8, providing a geographical perspective on intra-district equity patterns. In Putuo (Figure 8a), clusters with relatively high inequality (Gini > 0.5) are primarily located in the northwestern and southwestern parts of the district (Taopu and parts of Changzheng), consistent with the boxplot results in Figure 5a. These areas exhibit sharper contrasts in accessibility. In Minhang (Figure 8b), the spatial pattern of inequality is more pronounced and widespread. High Gini values are observed across multiple clusters, particularly in the northern (e.g., Huacao, Jinhongqiao) and southern (e.g., Pujiang, Maqiao) peripheries, where rapid and fragmented urban development has led to stark disparities in wet market access. The central clusters, though showing better accessibility on average, still exhibit considerable internal variability. This spatial heterogeneity underscores the challenge of achieving equitable service distribution in rapidly expanding urban peripheries, where planning and infrastructure provision often lag behind residential development.

4.3. Accessibility–Equity Relationship

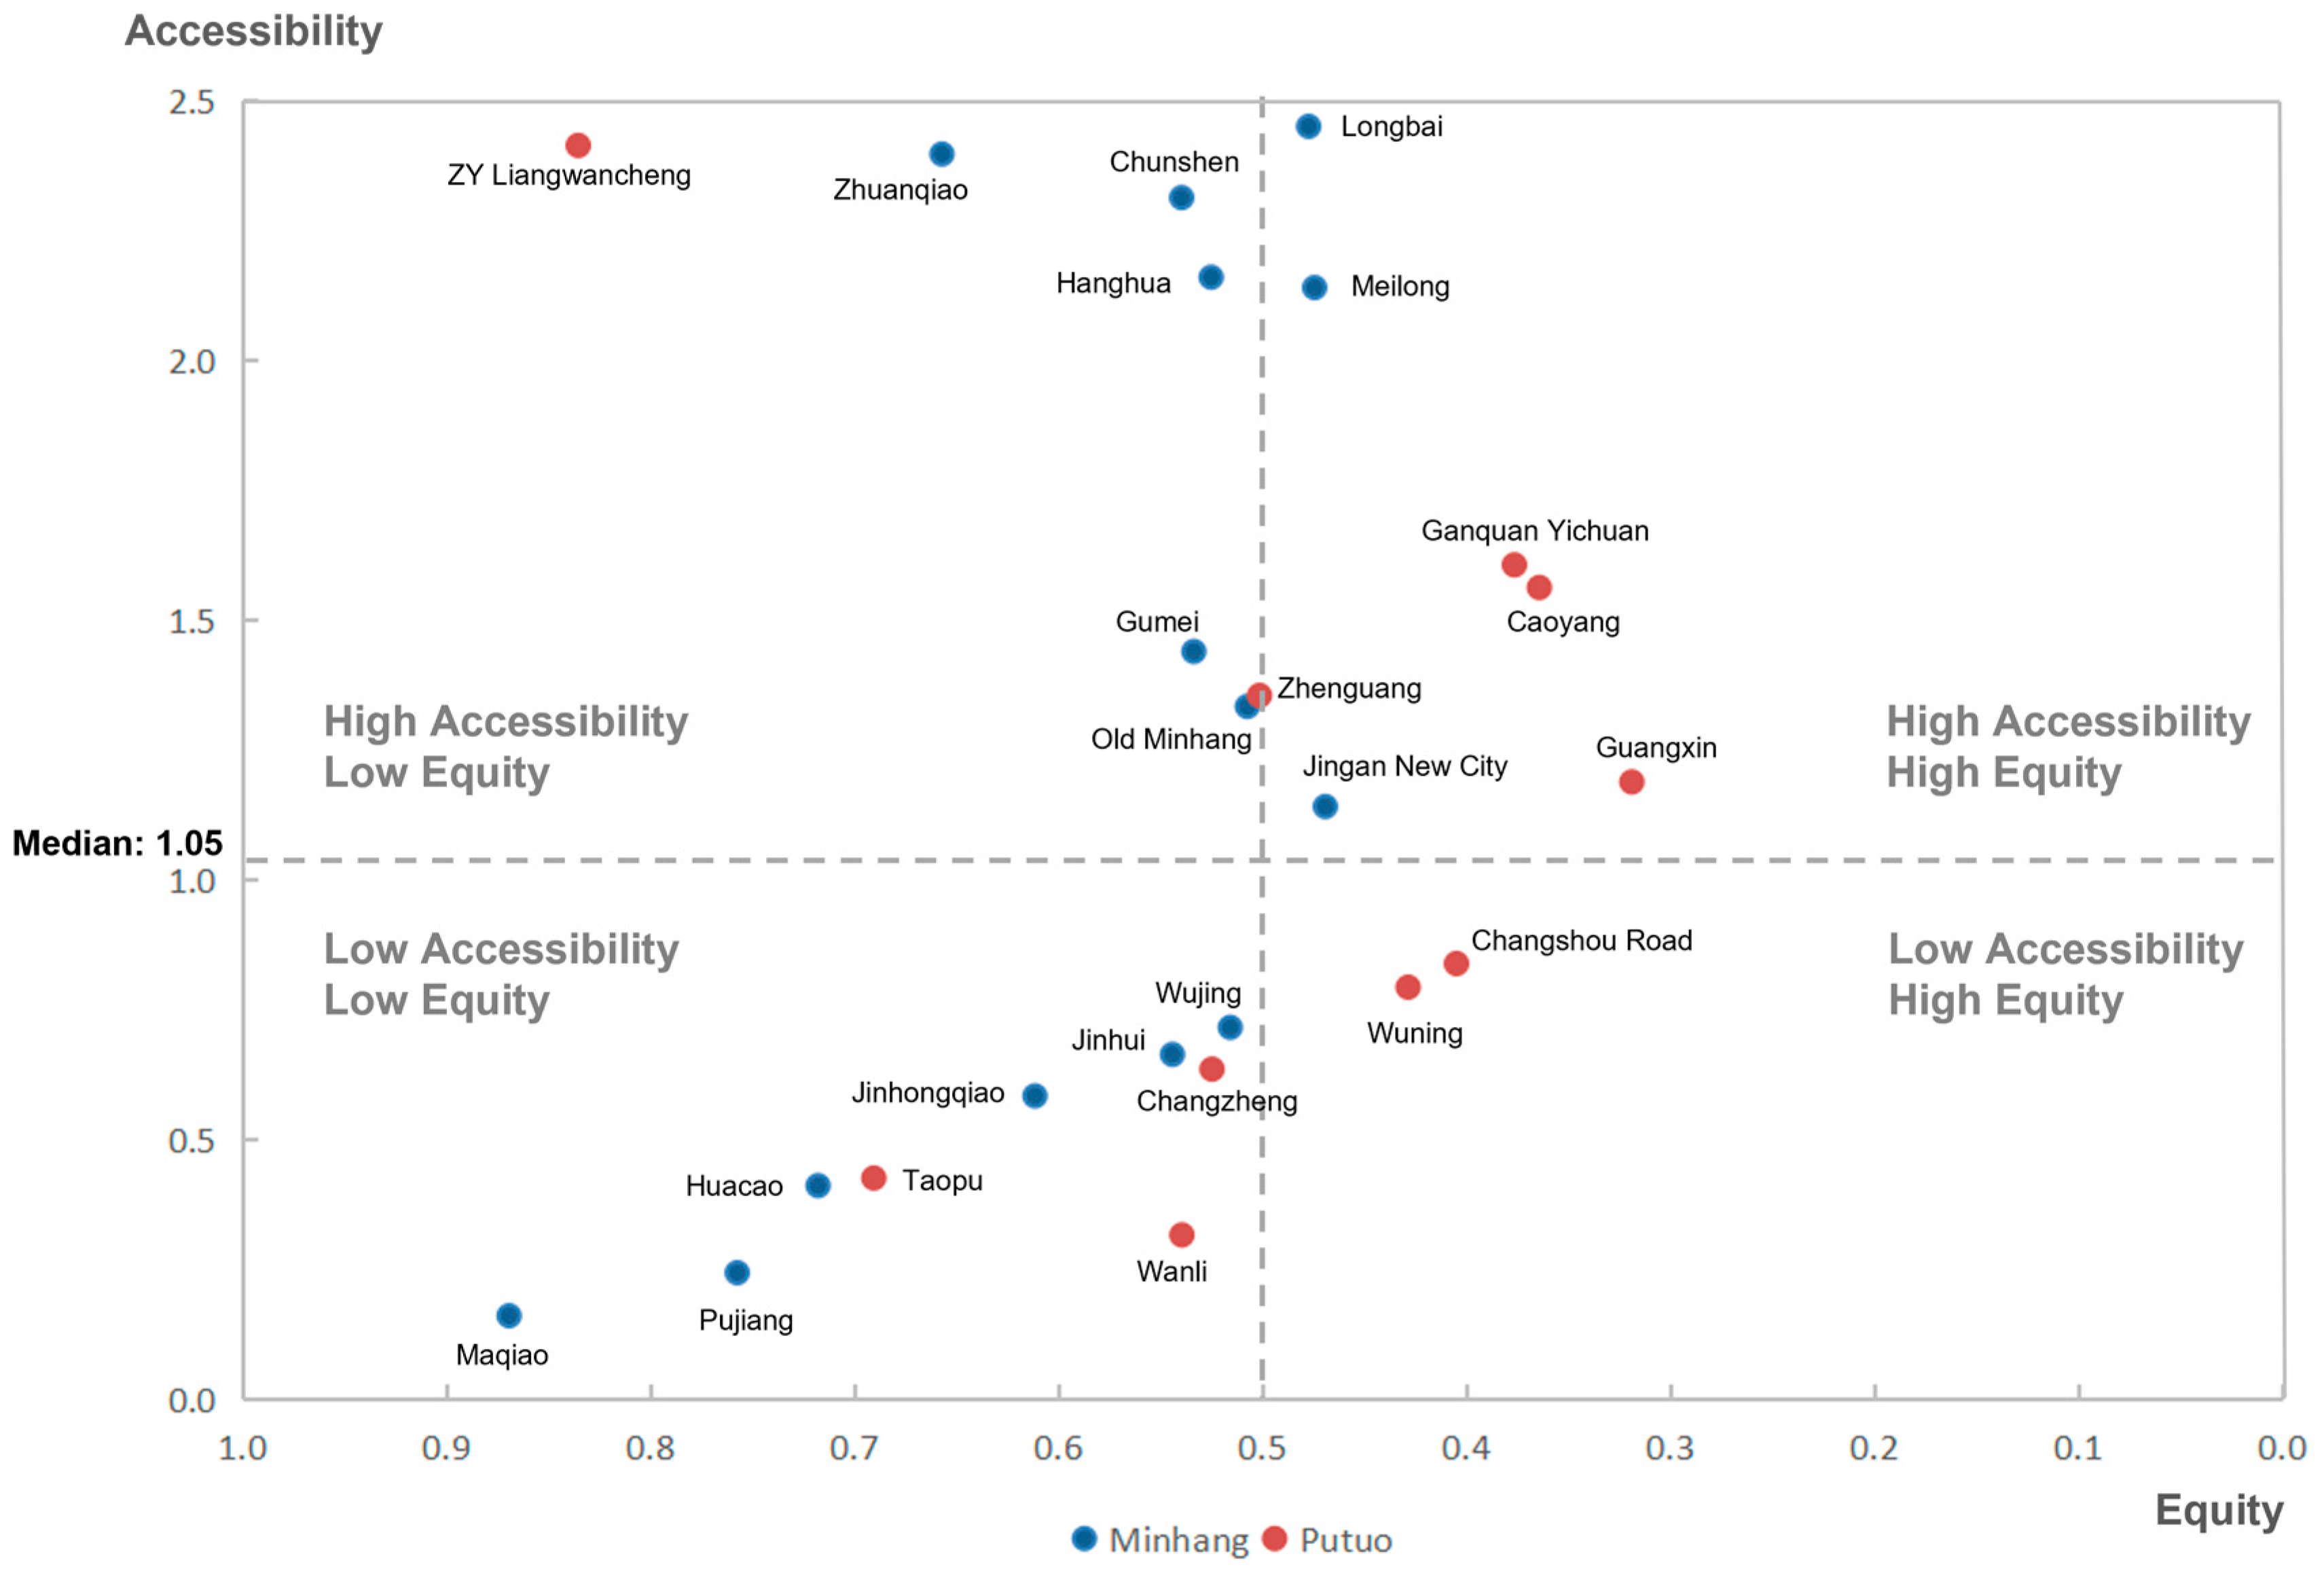
To further examine the relationship of accessibility levels and their equity distribution, a four-quadrant analysis of the accessibility and equity of all the clusters was conducted (Figure 9). The median composite accessibility score of 1.05 and the conventional Gini coefficient of 0.5 were used as thresholds to differentiate “high” and “low” performance.
Clusters in Minhang are primarily concentrated in the high accessibility–low equity and low accessibility–low equity quadrants. This indicates that while some clusters enjoy relatively convenient access to wet markets, the benefits are distributed unevenly across the district, leading to equity concerns. At the same time, a significant number of clusters (n = 6, 43%) exhibit both low accessibility and low equity, reflecting the challenges faced by peripheral districts in achieving adequate and balanced service coverage during rapid urban expansion.
In contrast, clusters in Putuo are relatively evenly distributed across three quadrants: the low accessibility–low equity, low accessibility–high equity, and high accessibility–high equity quadrants. This pattern suggests a more diversified spatial structure in Putuo. Some areas are constrained by limited access, while others achieve more equitable distribution despite lower accessibility. There are also a few clusters with both high accessibility and high equity, reflecting the relatively mature and stable service environment in the urban core.

4.4. Spatial Distribution of Accessibility

The spatial distributions of accessibility in Minhang and Putuo districts were examined and visualized using raster maps (Figure 10, Figure 11 and Figure 12). Accessibility scores of multiple communities within the same raster cell were averaged, and natural breaks method is applied to the classification of the values for the color bands. The lightest color refers to the communities with zero or virtually zero accessibility scores, while the dark colors refer to the ones with high accessibility scores. These maps can only be used to assess the intra-district spatial equity in accessibility, but are not comparable across the two districts due to different classification thresholds by the natural breaks.
For public transportation, Figure 10a and Figure 11a show that both districts have generally poor accessibility, with most communities have near zero accessibility scores and hotspots existing only in very limited local neighborhoods. This can be interpreted as fixed-route bus services being inefficient for short-distance travel. However, proximity to subway stations may create hotspots with very high accessibility (e.g., Caoyang Road station in Putuo, Chunshen Road station in Minhang), as subway trips expand residents’ activity range and enable them being covered by more 15 min service zones of wet markets. Nevertheless, public transit accessibility has a limited impact on the composite accessibility score, as it carries a relatively low weight (15%) in the overall scoring calculation.
For cycling, Figure 11b shows that most residential communities in the middle and southwestern part of Minhang enjoy relatively high cycling accessibility scores, with several hotspots appearing where communities are located very close to wet markets. In contrast, communities in the northern (Huacao and Jinhongqiao) and eastern (Pujiang) parts of the district, as well as those in Old Minhang near the southern boundary, generally have low or near-zero scores. These areas merit particular attention when considering the provision of additional wet markets. In Putuo (Figure 10b), a clear spatial gradient is observed: accessibility tends to increase from the boundary toward the center, exception in the northwestern (western Taopu), which has a relatively good level of cycling accessibility. Clusters near the southern boundary of Putuo (Changzheng, Wuning and Changshou Road) perform worse than those closer to the district center (Caoyang, Zhenguang and Ganquan Yichuan). In the northern part, most communities (Wanli and eastern Taopu) exhibit low accessibility with only a few hotspots.
Walking is the most common travel mode for accessing wet markets. The walking accessibility map of Minhang (Figure 11c) reveals an overall poor and uneven distribution. Most residential communities in the northern (Huacao) and southern parts (Pujiang along the eastern boundary, Maqiao along the western boundary, Old Minhang and Hanghua near the southern boundary) fall out of the 15 min walking service range of wet markets. Even in the central part of Minhang, where residential communities are concentrated, around half of them still show low accessibility scores. These low-scoring communities are scattered without a clear spatial pattern, indicating spatial inequalities. In Putuo (Figure 10c), the spatial pattern of walking accessibility resembles that of cycling (Figure 10b). Clusters close to the center (Caoyang, Zhanguang and Guanixn) and in the east (Ganquan Yichuan and Guangxin) exhibit high scores, while most communities in the north (eastern Taopu and Wanli) have virtually zero accessibility. In the northwestern (western Changzheng) and southwestern corners (western Taopu), a few communities display higher accessibility, further contributing to intra-district contrasts.
Figure 12 presents the spatial distribution of composite accessibility scores, derived from the weighted combination of the three transportation modes. In Minhang (Figure 12b), the highest-performing clusters are concentrated in the central areas (Zhuanqiao, Chunshen and Meilong). Most communities in other clusters, however, display generally poor accessibility, with only a few scattered hotspots. Within some clusters, localized areas have relatively good accessibility (e.g., southwestern corner of Old Minhang, center of Pujiang, and the northern parts of Hanghua and Longbai), whereas adjacent areas remain underserved. The accessibility levels in the upper-middle of Minhang (Gumei, Jingan New City, and Jinhongqiao) appears fragmented, showing a patchy distribution. Overall, these spatial contrasts highlight the significant inequality of accessibility within Minhang, consistent with its high total Gini coefficient of 0.65.
In Putuo (Figure 12a), composite accessibility is highest in the central clusters (Zhenguang, Caoyang, and Guangxin) and in the northeastern part (Ganquan Yichuan), consistent with their high median values in Figure 5a. A general trend of increasing accessibility from the boundary to the center is evident. Most communities in the northern part (eastern Taopu and Wanli) remain at the lowest level, while the northwestern corner (western Taopu) has relatively good accessibility. Similar intra-cluster contrast happens to Changzheng, with northern communities outperforming southern ones. Such contrasts make Taopu and Changzheng among the least equitable clusters in Putuo, which is also reflected in their relatively high Gini coefficients (Figure 7a). Overall, however, accessibility in Putuo is distributed in a more balanced and contiguous pattern across the district, rather than being limited to a few highly localized hotspots as observed in Minhang.

4.5. Building Age and Accessibility

To examine the relationship between residential building age and composite accessibility scores, an Analysis of Variance (ANOVA) was performed. Residential communities were classified into three categories: new housing (building age ≤ 10 years), standard housing (10–25 years), and old housing (>25 years). There are 14 communities without available building age data (12 in Minhang and 2 in Putuo), and they are filtered from this analysis. The distribution of residential communities across building age categories and their corresponding accessibility statistics are summarized in Table 3.
Normality tests (Shapiro–Wilk) indicated that accessibility scores in all categories violated the normality assumption (p < 0.05). Levene’s test revealed that Minhang violated the homogeneity of variance assumption (p = 0.0235), while Putuo met this assumption (p = 0.4602). Consequently, the non-parametric Kruskal–Wallis test was employed for both districts. It showed significant differences in accessibility across building age categories in both Minhang (H = 53.60, p < 0.001) and Putuo (H = 10.00, p = 0.007). Dunn’s post hoc tests with Bonferroni correction identified the specific pairwise differences (Table 4):
The analysis reveals distinct patterns between the two districts. In Minhang, new housing developments exhibit significantly lower accessibility compared to both standard and old housing, while the latter two categories show comparable accessibility levels. This suggests that in rapidly expanding peripheral areas, newer residential developments may not be adequately served by wet market facilities. In contrast, Putuo demonstrates a more uniform accessibility landscape, with only standard housing showing significantly lower accessibility compared to old housing.

5. Discussion

5.1. Reinterpreting the Urban Core–Peripheral Divide

The results reveal clear disparities between the urban core (Putuo) and the periphery (Minhang). Overall, Minhang exhibits a higher average accessibility level, yet the benefits are distributed much less evenly, whereas Putuo demonstrates a more balanced but generally lower level of accessibility. This contrast reflects broader patterns of urban development observed in many rapidly urbanizing metropolises, where peripheral areas expand very fast while mature cores evolve more gradually.
In rapidly growing peripheral districts such as Minhang, urban expansion often outpaces the provision of supporting public facilities. Large-scale housing construction and rapid population influx have contributed to fragmented service coverage, resulting in the coexistence of clusters with high accessibility and severe supply shortages. This phenomenon aligns with the growth patterns of many cities, where suburban development accelerates while supporting infrastructure falls behind [55,56,57]. This core–periphery disparity can be interpreted through the lens of growth polarization theory [58], which posits that economic activities and resources tend to agglomerate in urban cores, creating a “center-periphery” dynamic that can leave suburban areas relatively under-serviced. In Shanghai, this manifests as historical infrastructure investments being concentrated in central districts like Putuo, while rapidly growing peripheries like Minhang struggle to keep pace with service provision for new developments. Furthermore, the prevalence of gated communities in Chinese cities [59] may exacerbate these spatial inequities. These enclosed residential enclaves can create physical and social barriers that fragment the urban fabric, potentially weakening the integration of new neighborhoods with existing wet market services and deepening accessibility disparities within the periphery.
By contrast, long-established core districts like Putuo have undergone decades of incremental development. Facilities in these areas are more evenly distributed, reflecting a process of planning and gradual adaptation to local needs. However, the relative maturity of facilities also implies that they may not fully meet contemporary needs for convenience and service quality, leading to overall lower accessibility levels despite more equitable coverage. The building age analysis (Section 4.5) supports this, showing that older housing (>25 years) in Putuo has significantly higher accessibility to wet markets compared to standard housing (10–25 years), with no significant difference between standard and newer housing (≤10 years). This suggests that older, established neighborhoods benefit from proximity to long-existing wet markets, which were integrated during earlier urban planning phases. In contrast, newer developments, though limited in number, may not be as well-served by updated infrastructure, contributing to Putuo’s lower overall accessibility. Thus, the observed divergence between Putuo and Minhang illustrates how different stages of urban development shape the balance between accessibility and equity in public service provision, with Putuo’s mature urban fabric fostering equity but struggling to meet modern demands compared to Minhang’s fragmented but higher average accessibility.

5.2. Policy Implications

The accessibility and equity patterns identified in this study point to the need for differentiated planning strategies and targeted policy responses to balance efficiency with equity in service provision.
First, targeted interventions are needed. In rapidly expanding peripheral districts, where accessibility is high but unevenly distributed, the priority lies in addressing spatial inequalities. This can be achieved by constructing new wet markets or establishing temporary or mobile markets that flexibly meet demand in identified underserved neighborhoods. In urban cores such as Putuo, accessibility levels are generally lower but more evenly distributed. Additionally, land availability and high costs may limit new construction. Policy priorities in such areas should focus on improving quality and efficiency of existing infrastructure rather than large-scale new development. On the one hand, renovating and modernizing old wet markets can enhance user experience and strengthen their role as places for daily interaction and social-cultural hubs. On the other hand, transport improvements play a complementary role. Although public transport contributes relatively little to composite accessibility, enhancements of walking and cycling networks can significantly improve last-mile accessibility and expand the effective service area of existing markets.
Second, land-use adjustments are essential. Integrating wet markets into mixed-use developments, such as locating markets on the ground floors of residential or commercial complexes, can help bring services closer to residents in both mature and newly developed areas. This approach not only improves daily convenience but also supports more compact and sustainable urban forms. This could combine with the city digital twins (CDTs) [60] and considering the roles of dynamic urban population activities [61] and stakeholders [62].
Finally, while this study focuses on Shanghai, the policy implications are broadly relevant to other fast-growing metropolises worldwide. The observed divergence between urban cores and peripheries is not unique to Shanghai. For instance, traditional food markets in cities across Asia [16] and Sub-Saharan Africa [17] face pressures from supermarketization and urban expansion, often resulting in fragmented access and heightened spatial inequalities in the periphery, while established urban cores contend with aging infrastructure. Beyond the specific findings, the integrated methodological framework of Gaussian-enhanced 2SFCA method and Gini coefficient analysis provides a transferable toolkit for diagnosing such disparities in other contexts. This approach, adaptable to various public facilities and leveraging widely available spatial data and mapping APIs, can effectively inform targeted interventions. Thus, the strategies and policies identified from our case can provide valuable guidance for building more inclusive and adaptive urban food systems in the face of rapid transformation.

5.3. Limitations and Future Research

Several limitations of this study should be acknowledged, which could be addressed in future research.
From the perspective of data source, this research uses residential community data from Lianjia website, while it only contains commercial housing. Social housing and public housing are not included in this research due to the inaccessibility of related data, which may lead to the overlook of some disadvantaged groups.
Methodologically, the Gaussian-2SFCA method uses a fixed 15 min threshold to determine the service range of wet markets. In reality, some residents may be willing to go to a wet market over 15 min travel. Future studies could adopt flexible distance decay functions to better capture various travel behavior, and expand to time thresholds of 10 min and 20 min other than sole 15 min in the research. The service capacity is assumed to increase linearly with the wet markets’ operational area. However, the real relationship between a wet market’s service capacity and its floorspace area may be non-linear. In the composite accessibility score calculate, this research adopts a food shopping travel survey results in Nanjing to approximate the wet market travel behaviors in Shanghai. Although the two cities have similarities, it can not reflect the accurate reality in Shanghai. In the future research, we plan to distribute surveys and conduct interviews to accurately understand Shanghai residents’ food shopping behaviors as well as their satisfaction levels towards wet markets. Lastly, this study does not take different age groups into account, particularly the travel needs and preferences of the elderly. This is also one of the critiques towards 15 min life circle concept by Mouratidis [63]. The elderly are often more sensitive to distance and travel time, resulting in a steeper distance decay curve than younger adults. They also tend to choose walking more often than cycling while visiting wet markets [3]. Therefore, to calculate a more accurate composite accessibility score for the elderly would require adjusting the weights of transportation modes according to demographic characteristics of residents.
The analysis and discussion section mainly focuses on the spatial inequality of the distribution of wet markets related to residential communities, while it overlooks the social inequality reflected by the spatial distribution, partially because of the unavailability of some demographic-sensitive public data at fine scale. Future research could be conducted to uncover the relationship between wet market spatial distribution and social equity indicators such as property price and residents’ socioeconomic characteristics.
Thirdly, accessibility is measured based solely on residents’ homes, while some workers may choose to shop near their workplaces. Nevertheless, given that most wet markets in China have the tradition of opening in the very early morning and closing before noon, the home-based assumption is reasonably consistent with most Chinese residents’ lifestyles.

6. Conclusions

This study applied the Gaussian-modified 2SFCA method and Gini coefficients to quantitatively assess wet market accessibility and spatial equity in two contrasting districts of Shanghai: Putuo District (urban core) and Minhang District (periphery). The analysis provides new evidence on fresh food accessibility in a high-density metropolitan context.
The results show a clear disparity between the two districts. Minhang exhibits higher average accessibility levels but with uneven distribution, where underserved communities coexist alongside clusters of high accessibility. Putuo, by contrast, demonstrates a much more equal distribution but remains lower overall accessibility. Together, these findings contribute to wider insights on urban service provision by showing how different stages of urban development shape accessibility-equity trade-offs. Peripheral districts in fast-growing cities may achieve higher accessibility on average but face severe internal inequalities, while mature urban cores achieve more coverage but risk declining service quality over time.
Policy implications of this study underscore the importance of targeted interventions. Expanding wet market supply is a priority in peripheral districts, while upgrading aging facilities and enhancing last-mile accessibility are more feasible in urban cores. Beyond Shanghai, the insights and the methodological approach developed in this study offer actionable guidance for planners and policymakers in rapidly urbanizing cities worldwide, providing a pathway toward designing more inclusive, equitable, and adaptive urban food systems.

Author Contributions

Conceptualization, Y.L.; methodology, Y.L. and K.Z.; software, Y.L.; validation, Y.L.; formal analysis, Y.L. and K.Z.; investigation, Y.L.; resources, Q.-C.W.; data curation, Y.L.; writing-original draft preparation, Y.L.; writing-review and editing, K.Z. and Q.-C.W.; visualization, Y.L.; supervision, K.Z.; project administration, Q.-C.W.; funding acquisition, Q.-C.W. All authors have read and agreed to the published version of the manuscript.

Funding

This research was funded by City University of Hong Kong’s Presidential Assistant Professor Start-Up Grant, Project Number: 9382011.

Conflicts of Interest

The authors declare no conflict of interest.

References

  1. Sonnino, R. Food system transformation: Urban perspectives. Cities 2023, 134, 104164. [Google Scholar] [CrossRef]
  2. Qi, X.; Si, Z.; Zhong, T.; Huang, X.; Crush, J. Spatial determinants of urban wet market vendor profit in Nanjing, China. Habitat Int. 2019, 94, 102064. [Google Scholar] [CrossRef]
  3. Zhong, T.; Si, Z.; Crush, J.; Xu, Z.; Huang, X.; Scott, S.; Zhang, X. The impact of proximity to wet markets and supermarkets on household dietary diversity in Nanjing City, China. Sustainability 2018, 10, 1465. [Google Scholar] [CrossRef]
  4. Zhong, S.; Crang, M.; Zeng, G. Constructing freshness: The vitality of wet markets in urban China. Agric. Human Values 2020, 37, 175–185. [Google Scholar] [CrossRef]
  5. Shanghai Urban Planning and Land Resources Administration Bureau. Planning Guidance of 15-Minute Community-Life Circle—Planning and Construction Guidance, Action Guidelines; Shanghai Urban Planning and Land Resources Administration Bureau: Shanghai, China, 2016.
  6. Shanghai Municipal Commission of Commerce. Shanghai Standard Wet Market Renewal and Upgrade Plan. Available online: https://www.shanghai.gov.cn/gwk/search/content/459d1edc79634ae6b9d4aa69f5d90210 (accessed on 20 October 2025).
  7. Chen, Y. Neighborhood form and residents’ walking and biking distance to food markets: Evidence from Beijing, China. Transp. Policy 2019, 81, 340–349. [Google Scholar] [CrossRef]
  8. Si, Z.; Scott, S.; McCordic, C. Wet markets, supermarkets and alternative food sources: Consumers’ food access in Nanjing, China. Can. J. Dev. Stud. 2019, 40, 78–96. [Google Scholar] [CrossRef]
  9. Zhang, Q.F.; Pan, Z. The transformation of urban vegetable retail in China: Wet markets, supermarkets and informal markets in Shanghai. J. Contemp. Asia 2013, 43, 497–518. [Google Scholar] [CrossRef]
  10. Everts, J.; Jackson, P.; Juraschek, K.A. The socio-material practices of the transformation of urban food markets. Area 2021, 53, 389–397. [Google Scholar] [CrossRef]
  11. Mele, C.; Ng, M.; Chim, M.B. Urban markets as a ’corrective’ to advanced urbanism: The social space of wet markets in contemporary Singapore. Urban Stud. 2015, 52, 103–120. [Google Scholar] [CrossRef]
  12. Nicholls, S. Measuring the accessibility and equity of public parks: A case study using GIS. Manag. Leisure 2001, 6, 201–219. [Google Scholar] [CrossRef]
  13. Yang, N.; Shen, L.; Shu, T.; Liao, S.; Peng, Y.; Wang, J. An integrative method for analyzing spatial accessibility in the hierarchical diagnosis and treatment system in China. Soc. Sci. Med. 2021, 270, 113656. [Google Scholar] [CrossRef]
  14. Zhang, M.; Li, Z.; Peng, H. The accessibility analysis of multiple public facilities in the central urban areas based on multi-transportation modes: A study in Chengdu. Trans. GIS 2023, 27, 2213–2233. [Google Scholar] [CrossRef]
  15. Luo, W.; Qi, Y. An enhanced two-step floating catchment area (E2SFCA) method for measuring spatial accessibility to primary care physicians. Health Place 2009, 15, 1100–1107. [Google Scholar] [CrossRef]
  16. Gorton, M.; Sauer, J.; Supatpongkul, P. Wet markets, supermarkets and the "big middle" for food retailing in developing countries: Evidence from Thailand. World Dev. 2011, 39, 1624–1637. [Google Scholar] [CrossRef]
  17. Anku, E.K.; Ahorbo, G.K. Conflict between supermarkets and wet-markets in Ghana: Early warning signals and preventive policy recommendations. Int. J. Bus. Soc. Res. 2017, 7, 1–17. [Google Scholar] [CrossRef]
  18. Battersby, J. The food desert as a concept and policy tool in African cities: An opportunity and a risk. Sustainability 2019, 11, 458. [Google Scholar] [CrossRef]
  19. Battersby, J.; Crush, J. Africa’s urban food deserts. In Urban Forum; Springer: Dordrecht, The Netherlands, 2014; Volume 25, pp. 143–151. [Google Scholar]
  20. Zhen, C. Food deserts: Myth or reality? Annu. Rev. Resour. Econ. 2021, 13, 109–129. [Google Scholar] [CrossRef]
  21. Stanley, A.K.; Hadi, Y.; Newbold, D.; Heuvelman, H.; Krige, A. Identifying predictors for food insecurity in England: A cross-sectional database analysis. J. Health Popul. Nutr. 2025, 44, 53. [Google Scholar] [CrossRef] [PubMed]
  22. Janatabadi, F.; Newing, A.; Ermagun, A. Social and spatial inequalities of contemporary food deserts: A compound of store and online access to food in the United Kingdom. Appl. Geogr. 2024, 163, 103184. [Google Scholar] [CrossRef]
  23. Teixeira, V.A.V.; Ribeiro, N.F. The lamprey and the partridge: A multi-sited ethnography of food tourism as an agent of preservation and disfigurement in Central Portugal. J. Herit. Tour. 2013, 8, 193–212. [Google Scholar] [CrossRef]
  24. Bakri, A.F.; Ibrahim, N.; Ahmad, S.S.; Zaman, N.Q. Public perception on the cultural significance of heritage buildings in Kuala Lumpur. Procedia Soc. Behav. Sci. 2015, 202, 294–302. [Google Scholar] [CrossRef]
  25. Geng, X.; Chen, K.; Fukuda, S.; Moritaka, M.; Liu, R.; Wei, A. Retail of Fresh Vegetables in China: Why Wet Markets Are Not Replaceable by Supermarkets? Faculty of Agriculture, Kyushu University: Fukuoka, Japan, 2020. [Google Scholar]
  26. Li, L.; Wang, D. Do neighborhood food environments matter for eating through online-to-offline food delivery services? Appl. Geogr. 2022, 138, 102620. [Google Scholar] [CrossRef]
  27. Farrington, J.H. The new narrative of accessibility: Its potential contribution to discourses in (transport) geography. J. Transp. Geogr. 2007, 15, 319–330. [Google Scholar] [CrossRef]
  28. Páez, A.; Scott, D.M.; Morency, C. Measuring accessibility: Positive and normative implementations of various accessibility indicators. J. Transp. Geogr. 2012, 25, 141–153. [Google Scholar] [CrossRef]
  29. Panagiotopoulos, G.; Kaliampakos, D. Accessibility and spatial inequalities in Greece. Appl. Spat. Anal. Policy 2019, 12, 567–586. [Google Scholar] [CrossRef]
  30. Zhou, H.; Li, X.N. Research on vegetable market layout planning strategy from the perspective of resource allocation: Taking Yuhong district in Shenyang as an example. City House 2021, 9, 108–111. [Google Scholar]
  31. Sun, B.L.; Zhang, H.; Li, L. The spatial distribution equity of wet markets in central urban district in Tianjin based on GIS analysis. Planners’ J. 2015, 31, 298–304. (In Chinese) [Google Scholar]
  32. Liang, H.; Zhang, Q. Assessing the public transport service to urban parks on the basis of spatial accessibility for citizens in the compact megacity of Shanghai, China. Urban Stud. 2018, 55, 1983–1999. [Google Scholar] [CrossRef]
  33. Hare, T.S.; Barcus, H.R. Geographical accessibility and Kentucky’s heart-related hospital services. Appl. Geogr. 2007, 27, 181–205. [Google Scholar] [CrossRef]
  34. Jin, H.; Lu, Y. Multi-mode huff-based 2SFCA: Examining geographical accessibility to food outlets in austin, Texas. ISPRS Int. J. Geo-Inf. 2022, 11, 579. [Google Scholar] [CrossRef]
  35. Li, J.; Kim, C. Exploring relationships of grocery shopping patterns and healthy food accessibility in residential neighborhoods and activity space. Appl. Geogr. 2020, 116, 102169. [Google Scholar] [CrossRef]
  36. Ng, K.; Chen, C.; Jenelius, E. The 15-minute city around one’s trajectory: Evaluating food accessibility for transit users in Stockholm, Sweden. J. Transp. Geogr. 2025, 127, 104283. [Google Scholar] [CrossRef]
  37. Radke, J.; Mu, L. Spatial decompositions, modeling and mapping service regions to predict access to social programs. Geogr. Inf. Sci. 2000, 6, 105–112. [Google Scholar] [CrossRef]
  38. Cheng, G.; Zeng, X.; Duan, L.; Lu, X.; Sun, H.; Jiang, T.; Li, Y. Spatial difference analysis for accessibility to high level hospitals based on travel time in Shenzhen, China. Habitat Int. 2016, 53, 485–494. [Google Scholar] [CrossRef]
  39. Gu, X.; Tao, S.; Dai, B. Spatial accessibility of country parks in Shanghai, China. Urban For. Urban Green. 2017, 27, 373–382. [Google Scholar] [CrossRef]
  40. Ashik, F.R.; Mim, S.A.; Neema, M.N. Towards vertical spatial equity of urban facilities: An integration of spatial and aspatial accessibility. J. Urban Manag. 2020, 9, 77–92. [Google Scholar] [CrossRef]
  41. Liang, H.; Yan, Q.; Yan, Y.; Zhang, Q. Using an improved 3SFCA method to assess inequities associated with multimodal accessibility to green spaces based on mismatches between supply and demand in the metropolitan of Shanghai, China. Sustain. Cities Soc. 2023, 91, 104456. [Google Scholar] [CrossRef]
  42. Tahmasbi, B.; Mansourianfar, M.H.; Haghshenas, H.; Kim, I. Multimodal accessibility-based equity assessment of urban public facilities distribution. Sustain. Cities Soc. 2019, 49, 101633. [Google Scholar] [CrossRef]
  43. Litman, T. Evaluating Transportation Equity: Guidance for Incorporating Distributional Impacts in Transportation Planning; Victoria Transport Policy Institute: Victoria, BC, Canada, 2007. [Google Scholar]
  44. Jin, M.; Liu, L.; Tong, D.; Gong, Y.; Liu, Y. Evaluating the spatial accessibility and distribution balance of multi-level medical service facilities. Int. J. Environ. Res. Public Health 2019, 16, 1150. [Google Scholar] [CrossRef] [PubMed]
  45. Jang, S.; An, Y.; Yi, C.; Lee, S. Assessing the spatial equity of Seoul’s public transportation using the Gini coefficient based on its accessibility. Int. J. Urban Sci. 2017, 21, 91–107. [Google Scholar] [CrossRef]
  46. Wu, J.; Chen, H.; Wang, H.; He, Q.; Zhou, K. Will the opening community policy improve the equity of green accessibility and in what ways?—Response based on a 2-step floating catchment area method and genetic algorithm. J. Clean. Prod. 2020, 263, 121454. [Google Scholar] [CrossRef]
  47. Ou, G.; Zhou, M.; Zeng, Z.; He, Q.; Yin, C. Is there an equality in the spatial distribution of urban vitality: A case study of Wuhan in China. Open Geosci. 2021, 13, 469–481. [Google Scholar] [CrossRef]
  48. Survey Office of the National Bureau of Statistics in Shanghai. 2020 Shanghai Statistical Yearbook; China Statistic Press: Beijing, China, 2021.
  49. Wang, L.; He, S.; Zhao, C.; Su, S.; Weng, M.; Li, G. Unraveling urban food availability dynamics and associated social inequalities: Towards a sustainable food environment in a developing context. Sustain. Cities Soc. 2022, 77, 103591. [Google Scholar] [CrossRef]
  50. Wei, Y.; Ning, S. Establishment and analysis of the supernetwork model for Nanjing metro transportation system. Complexity 2018, 2018, 4860531. [Google Scholar] [CrossRef]
  51. Zhang, D.M.; Du, F.; Huang, H.; Zhang, F.; Ayyub, B.M.; Beer, M. Resiliency assessment of urban rail transit networks: Shanghai metro as an example. Saf. Sci. 2018, 106, 230–243. [Google Scholar] [CrossRef]
  52. Fan, N.; Chen, X.; Tian, T.; Zhao, S. Comparison of the transportation network for public transit and private vehicles in Shanghai: An accessibility approach. Heliyon 2024, 10, e24886. [Google Scholar] [CrossRef]
  53. Yuan, H.; Deng, L.; Li, X.H. GIS-based accessibility analysis of public libraries: A case study of Nanjing City. Lib. Res. 2020, 50, 1–9. (In Chinese) [Google Scholar]
  54. Sun, P.; Chawla, S. On local spatial outliers. In Proceedings of the Fourth IEEE International Conference on Data Mining, Brighton, UK, 1–4 November 2004; pp. 209–216. [Google Scholar]
  55. Deng, Y.; Liu, J.; Luo, A.; Wang, Y.; Xu, S.; Ren, F.; Su, F. Spatial mismatch between the supply and demand of urban leisure services with multisource open data. ISPRS Int. J. Geo-Inf. 2020, 9, 466. [Google Scholar] [CrossRef]
  56. Egidi, G.; Cividino, S.; Quaranta, G.; Alhuseen, A.; Salvati, L. Land mismatches, urban growth and spatial planning: A contribution to metropolitan sustainability. Environ. Impact Assess. Rev. 2020, 84, 106439. [Google Scholar] [CrossRef]
  57. Wang, Z.; Liu, C.; Tian, Y. The Effect of Urban–Rural Public Service Gaps on Consumption Gaps Under the Perspective of Sustainable Development: Evidence from China. Sustainability 2025, 17, 6148. [Google Scholar] [CrossRef]
  58. Krugman, P. Increasing returns and economic geography. J. Polit. Econ. 1991, 99, 483–499. [Google Scholar] [CrossRef]
  59. Pow, C.-P. Gated Communities in China: Class, Privilege and the Moral Politics of the Good Life; Routledge: London, UK, 2009. [Google Scholar]
  60. Wang, Q.C.; Wan, L. Activity-Based Models for Smart and Sustainable Urban Environment. In Routledge Handbook of Smart Built Environment; Routledge: London, UK, 2025; pp. 220–242. [Google Scholar]
  61. Wang, Q.C.; Sun, M.; Liu, X.; Tao, F.; Yang, D.; Bardhan, R. Reflecting City Digital Twins (CDTs) for sustainable urban development: Roles, challenges and directions. Digit. Eng. 2025, 5, 100035. [Google Scholar] [CrossRef]
  62. He, P.; Wang, Q.; Wang, H.; Xue, J.; Bao, H.X.; Shen, G.Q.; Guo, S.; Ni, M.; Wang, S. From participation to partnership: A systematic review of public engagement in sustainable urban planning. Environ. Impact Assess. Rev. 2026, 117, 108187. [Google Scholar] [CrossRef]
  63. Mouratidis, K. Time to challenge the 15-minute city: Seven pitfalls for sustainability, equity, livability, and spatial analysis. Cities 2024, 153, 105274. [Google Scholar] [CrossRef]
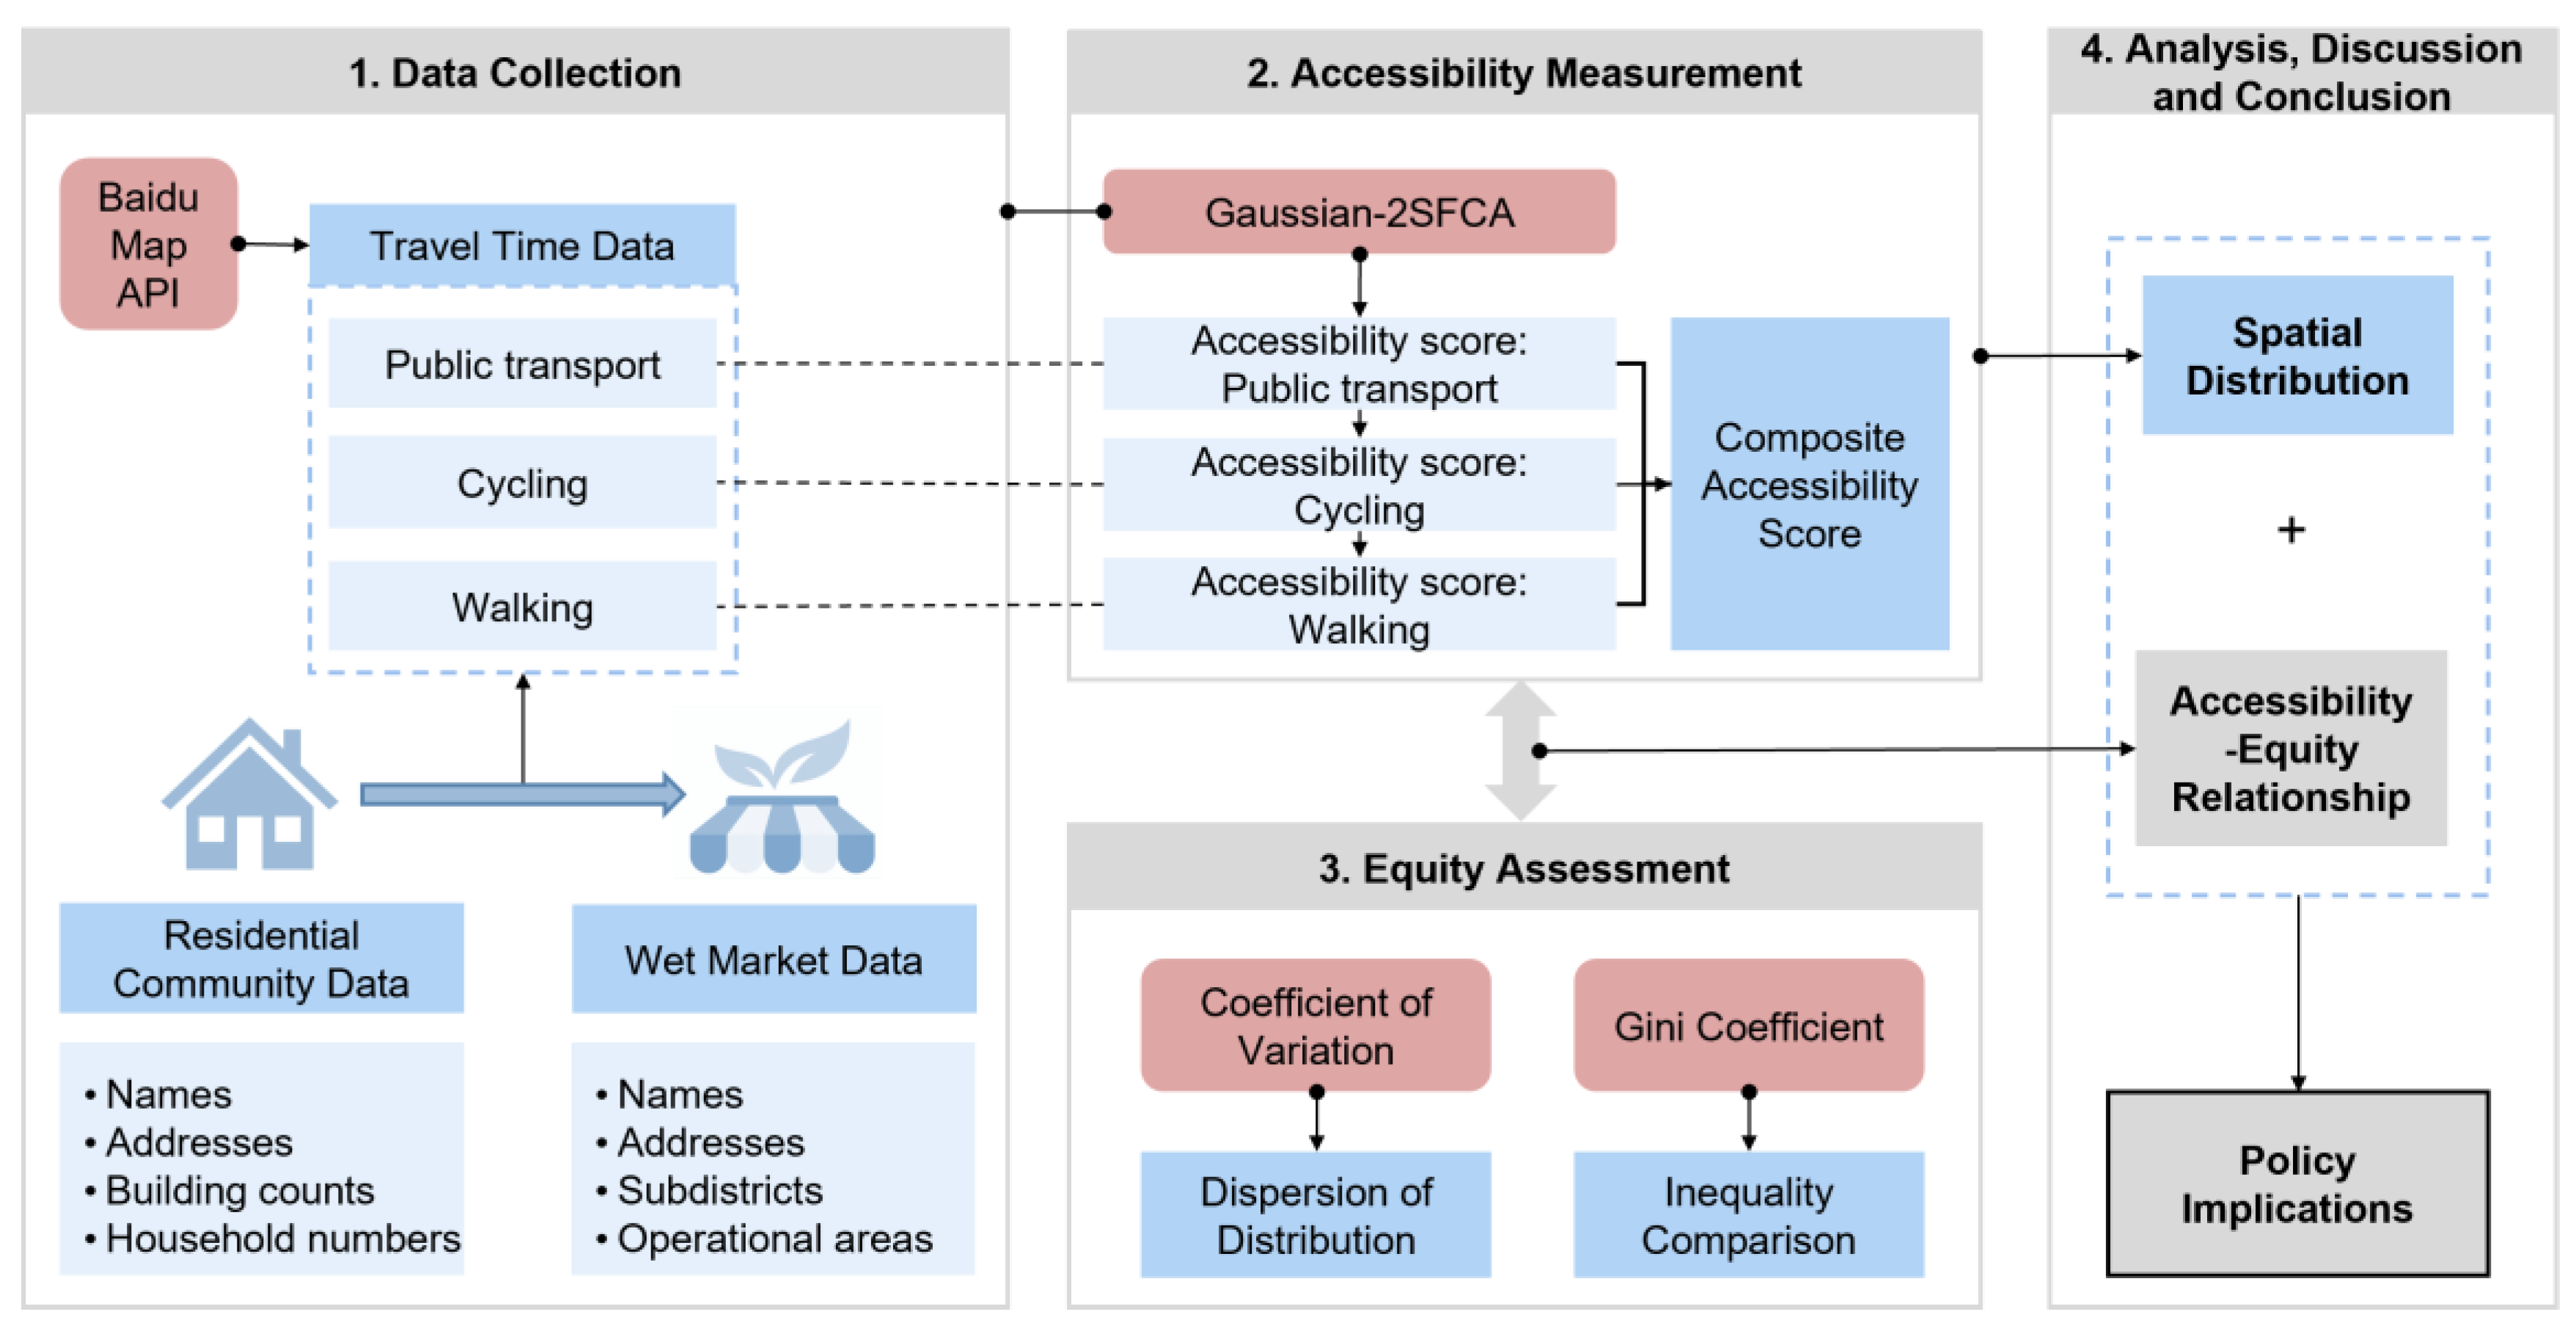
Figure 1. Research framework.
Land 14 02107 g001
Figure 2. Study area.
Land 14 02107 g002
Figure 3. Distribution of residential clusters in Putuo (a) and Minhang (b).
Land 14 02107 g003aLand 14 02107 g003b
Figure 4. Putuo and Minhang composite accessibility scores (outliers not displayed).
Land 14 02107 g004
Figure 5. Composite accessibility scores by residential clusters (outliers not displayed). (a) Putuo; (b) Minhang.
Land 14 02107 g005
Figure 6. Lorenz curves of Putuo and Minhang wet market accessibility.
Land 14 02107 g006
Figure 7. Gini coefficients by residential clusters. (a) Putuo; (b) Minhang.
Land 14 02107 g007
Figure 8. Map of Gini coefficients. (a) Putuo; (b) Minhang.
Land 14 02107 g008
Figure 9. Four-quadrant analysis of the relationship between accessibility and equity.
Land 14 02107 g009
Figure 10. Putuo spatial accessibility to wet markets by transportation modes. (a) public transportation; (b) cycling; (c) walking.
Land 14 02107 g010
Figure 11. Minhang spatial accessibility to wet markets by transportation modes. (a) public transportation; (b) cycling; (c) walking.
Land 14 02107 g011
Figure 12. Composite spatial accessibility to wet markets. (a) Putuo; (b) Minhang.
Land 14 02107 g012
Table 1. Average and CoV of accessibility scores by transportation modes and districts.
Travel ModePutuoMinhang
Public Transport—Average0.567 2.831
Public Transport—CoV3.519 6.851
Cycling—Average1.477 3.361
Cycling—CoV0.647 1.598
Walking—Average1.536 3.005
Walking—CoV1.625 3.173
Composite—Average1.475 3.335
Composite—CoV1.212 2.738
Table 2. Welch’s t-test.
t-statistic−6.144594
Degrees of freedom (Welch)1069.9
p-value0.0000
Effect size (Cohen’s d)−0.2598
Table 3. Building Age Distribution and Accessibility Statistics by District.
CategoryDistrictCountMeanStdMedian
New HousingMinhang1341.2512.7690.306
Putuo501.4191.9890.875
Standard HousingMinhang5553.4178.1491.140
Putuo2351.4121.9070.840
Old HousingMinhang2623.6788.0801.436
Putuo3591.4901.5651.135
Table 4. Significant Differences in Accessibility Between Building Age Categories.
DistrictSignificant Pairsp-ValueMedian Comparison
MinhangNew vs. Standard Housing<0.0010.306 < 1.140
New vs. Old Housing<0.0010.306 < 1.436
Standard vs. Old Housing1.0001.140 ≈ 1.436
PutuoStandard vs. Old Housing0.0080.840 < 1.135
Disclaimer/Publisher’s Note: The statements, opinions and data contained in all publications are solely those of the individual author(s) and contributor(s) and not of MDPI and/or the editor(s). MDPI and/or the editor(s) disclaim responsibility for any injury to people or property resulting from any ideas, methods, instructions or products referred to in the content.