Abstract
Experts have long associated West Africa’s drylands with extensive and severe land degradation. In fact, the term “desertification” was coined in reference to the great Sahelian droughts of the 1970s and 1980s. Thus, much research has focused on Sahelian countries where there have also been numerous large-scale projects to combat desertification. Wetter, southern Sudanian savannas have received less attention. At the same time, scientific experts and policymakers have seriously questioned desertification as a concept and advocate for a new paradigm of land degradation neutrality (LDN). This entails assessing both land degradation and rehabilitation. The northern Sudanian savannas of Togo had been previously identified as an area with widespread and increasing land degradation based on regional analyses with coarse satellite imagery. Little or no rehabilitation had been either studied or detected. This study sought to follow up on these previous works to investigate local-scale patterns of both land degradation and rehabilitation. Fieldwork entailed a place-based approach using unmanned aerial vehicles (UAVs or drones) and participatory exercises with local stakeholders across nine sites. The spatial analysis incorporated local perceptions to classify the drone imagery. Results indicate that LDN varies markedly among the communities and that patterns of LDN are highly heterogeneous at these local scales.
1. Introduction
As a response to severe and widespread African droughts and famines, governments around the world ratified the United Nations Convention to Combat Desertification (UNCCD) in 1994. Desertification was conceived as a global and irreversible threat whereby deserts steadily encroached on productive lands due to droughts, inappropriate land-use practices, and population pressure [1]. The UNCCD became an international mechanism that provided funding and technical assistance for environmental projects throughout Earth’s drylands. The UNCCD [2] specifically defines desertification as: “land degradation in arid, semi-arid and dry sub-humid areas resulting from various factors, including climatic variations and human activities.” Land degradation is defined as “reduction or loss, in arid, semi-arid and dry sub-humid areas, of the biological or economic productivity and complexity of rainfed cropland, irrigated cropland, or range, pasture, forest and woodlands resulting from land uses or from a process or combination of process, including processes arising from human activities and habitation patterns…”
Over the decades, these definitions have become highly controversial among policymakers and scientists [3,4,5]. Critics charge that desertification and land degradation are uniquely context-specific, which makes measuring and monitoring these processes at any scale deeply problematic [6,7,8]. Scholars now recognize that old models of rampant global land degradation are incompatible with existing Earth observation data and analyses [9,10]. At the same time, numerous case studies highlight the positive human role dryland communities play in reversing degradation by rehabilitating fields, pastures and forests [11,12,13]. In fact, the UNCCD and other world bodies are now advocating for a new paradigm called Land Degradation Neutrality (LDN) [14].
LDN is a conceptual framework and policy instrument that seeks to balance processes of land degradation and restoration at multiple geographic scales from local to regional or even global [15]. Achieving LDN requires mapping and monitoring patterns and processes of both land degradation and rehabilitation at multiple temporal and spatial scales. The World Overview of Conservation Approaches and Technologies (WOCAT) is a global network of specialists who promote Sustainable Land Management (SLM) and LDN globally by developing standardized tools and methods that have been refined over nearly two decades [16]. These experts specifically note the difficulty of mapping LDN and highlight the importance of integrating Earth observation data with participatory methods to develop monitoring tools for use by policymakers [17]. These WOCAT approaches motivate the study presented here whereby the research team combined Unmanned Aerial Vehicle (UAV—or “drone”) imagery with stakeholder participation to map patterns of both land degradation and rehabilitation at very local scales (nine villages) in the northern Savanes Region of Togo.
To do so, we explore the spatial relationships among land-use/land-cover composition, tree clustering and dispersal, and degradation at sites experiencing a variety of degradation or rehabilitation trajectories in the Savanes Region of northern Togo (Figure 1). By using UAV imagery, we were able to detect and quantify heterogeneity in landscape composition at a finer spatial resolution than publicly available satellite imagery. The analysis is informed by stakeholder input from a Togolese environmental development organization with an interest in mapping these features to guide rehabilitation interventions within these communities.
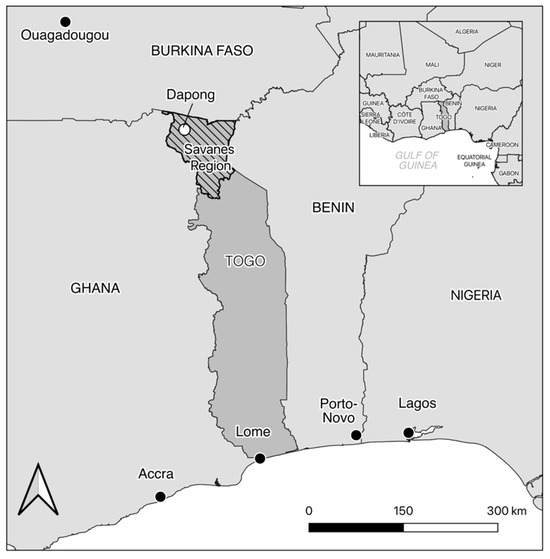
Figure 1.
The study area, the Savanes Region (hatched area) of Togo is located in West Africa, bordering Burkina Faso to the North, Ghana to the West, and Benin to the East. Dapong, located in northwest Togo, is the regional capital of the Savanes Region.
The use of UAVs for environmental monitoring and conservation is growing in Africa, but remains relatively rare compared with other parts of the world. Our focus on detecting both land degradation and rehabilitation with drones parallels work on “degradation hotspots” and “restoration hope spots” in the Mt. Elgon Region of Uganda [18]. Researchers in Côte d’Ivoire successfully used UAVs to measure tree loss in protected forests [19]. Drones helped conservation biologists in Madagascar identify areas of illegal deforestation within the Ambohimahamasina Forest [20]. All studies emphasize the advantages of using the ultra-high-resolution imagery drones provide to detect fine-scale features that commercial satellites cannot. UAV research in Africa tends to take place in heavily forested regions associated with protected areas involving large teams of European and African scientists. This case study of a savanna ecosystem dominated by agriculture undertaken by a small team of anthropologists, graduate students and a local NGO adds a new dimension to drone fieldwork in African contexts.
Our work builds on and extends previous studies of land degradation in Togo. In 1996, the French Office of Scientific and Technical Research Overseas (ORSTOM)’s conducted a land degradation assessment of the entire country including the Savanes Region (Figure 2a) [21]. The assessment found more than 85% of Togo experienced some degree of degradation. In 2016, the Project for Integrated Management of Disasters and Lands (PGICT) and the Permanent Interstate Committee for Drought Control in the Sahel (CILSS) conducted an updated degradation assessment (Figure 2b), using the same categorical degradation severity scale as the 1996 OSTROM study: (1) Very slight; (2) Slight, locally varied; (3) Slight, locally moderate; (4) Moderate; and (5) Severe [22].
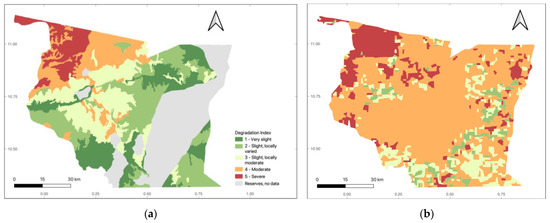
Figure 2.
Previous land degradation assessments of Northern Togo. (a) Degradation in 1996 [21]; (b) degradation in 2016 [22].
The two maps show that land degradation in the Savanes Region has increased in severity and also in extent. Whereas there were large areas of slight to very slight (1–3) degradation in 1996, there were only scattered pockets of such areas in 2016. These previous studies assessed land degradation at very coarse scales for the entire country or region. Similarly, they focused primarily on its severity and did not seek to assess rehabilitation. This study used these maps to identify local sites along a gradient of land degradation severity from Severe (5) to Slight, Locally Varied (2) and then map spatial patterns of both degradation and rehabilitation at a local scale using community input.
2. Materials and Methods
2.1. Site Selection
We selected nine sites with varying degradation severities and trajectories to document a diverse set of landscape conditions. We calculated degradation trajectory based on the 1996 ORSTOM (Figure 2a) and 2016 PGICT degradation (Figure 2b) maps. The data and methods used to create the 1996 and 2016 degradation maps differ as the 1996 map regional boundaries are based on topographic features while the 2016 map regional boundaries are 1 km × 1 km raster grid cells. Due to the different data and methods between the two degradation maps, the calculated difference map (Figure 3) does not aim to be a precise representation of degradation trajectory over time in the region but instead informed the study site selection process.
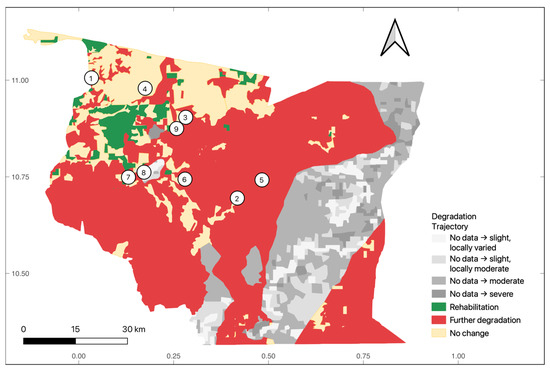
Figure 3.
Degradation trajectories 1996–2016 and study sites. See Table 1 for numbers and their corresponding site names.
Each of the two maps were converted from PDF forms to TIF image files and then imported to Adobe Illustrator v. 29.7 to remove text labels and roads from the maps. The maps were then imported to ArcGIS Pro v. 3.2.1, and georeferenced based on satellite imagery base maps. The images were then vectorized and categorized based on the original maps. Degradation trajectory change was then calculated using the Identity tool in ArcGIS. The resulting 1996–2016 degradation trajectory map (Figure 3) was used to select locations and include a variety of degradation severities and trajectories.
Our site selection was conducted in collaboration with our research partners from the Gestion de l’Environnement et Valorisation des Produits Agropastoraux et Forestiers (GEVAPAF), a Togolese non-governmental organization (NGO) which works to support community natural resource management in the Savanes Region. With our GEVAPAF partners, we selected nine sites: Biankouri, Kadegli, Kantindi, Nanoume, Ogaro, Pana, Sissiak, Sounsourri, and Toaga (Table 1).

Table 1.
Degradation trajectory per site.
2.2. Image Collection and Processing
We collected images using a DJI Mavic Pro with a standard RGB camera. All flight paths were programmed using DroneDeploy’s Fly v. 2.83.0 app. Collection paths parameters included flight altitudes ranging from 100 m to 125 m, at least 75% front and 65% side overlap, and oblique imagery capture. These settings are in-line with recommendations from DroneDeploy for optimum stitching and three-dimensional photogrammetry modeling. Spatial resolution with these parameters produced a 3 cm × 3 cm spatial resolution in final processed imagery.
In the field, the imagery was stitched using the Pix4D to produce initial orthomosaics. When we returned to the United States, the imagery was processed again by DroneDeploy to produce additional photogrammetry products including digital terrain and digital elevation model rasters.
2.3. Classification and Feature Identification
The orthomosaics were uploaded as assets to Google Earth Engine (GEE) for supervised land-use/land-cover (LULC) classification. Due to the high spatial resolution, the imagery was resampled to 0.5 m × 0.5 m resolution to conduct classifications due to computational limits. The imagery was then classified into seven categories: developed (including structures, roads, and courtyards), uncultivated herbaceous vegetation, trees (broadleaf and palms), bare soils, exposed rocks, agricultural fields, and water.
Instances of trees, palms, and compounds were also manually digitized as point features (Figure 4). The point features were analyzed for density, calculated as a function of instance and area mapped, and clustering using average nearest neighbor (ANN) clustering in ArcGIS Pro. Participants from GEVAPAF emphasized the importance of trees and their role in preventing soil erosion. They advise rural producers to both conserve trees and also plant them. Thus, village landscapes with a high density of tree cover generally indicate active soil conservation through either protecting existing trees or reforestation.
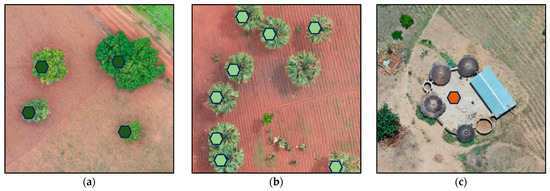
Figure 4.
Trees, palms, and home compounds were digitized per site from orthomosaic imagery (a) Trees at Sounsourri—dark green hexagons; (b) Palms at Sissiak—light green hexagons; (c) home compound at Kantindi—brown hexagon (See Appendix A, Figure A1).
Landscapes with few or no trees suggest high rates of soil erosion and severe land degradation.
2.4. Rapid Agricultural Land Assessments
Before conducting drone fieldwork in each community, the PI (West) and staff from GEVAPAF visited each village to speak with local leaders. The goal was to introduce the project and request permission to fly drone missions. Rural producers are keenly aware of land degradation and frequently stated that they considered their village to be “degraded”. Thus, the topic resonated with them. GEVAPAF likewise focuses on issues related to land degradation and development. They promote reforestation and specialize in helping villages plant native trees such as baobab (Adansonia digitata), locust bean (Fr.—néré, Parkia bigblosa), and shea nut (Fr.—karité, Vitellaria paradoxa). GEVAPAF also promotes agroforestry and help villages build houses out of local rock, which decreases their dependance on non-local cement. GEVAPAF provided translation and logistical assistance for fieldwork activities. Their staff also helped select study sites based on previous maps (see Figure 3). During the initial site visit, community members openly shared their local perceptions of land degradation. In one case, the customary chief (Moba—tchamba) described how their landscape was dominated by rocks. As a young man, there were no rocks in their fields and they could easily plow. Now, the rocks “have grown” and their plows strike them frequently while plowing. GEVAPAF explained that this is due to rampant soil erosion. Farmers frequently clear trees to create fields and then progressively remove trees from within fields to facilitate plowing and cultivate large fields. They then plant maize, cotton, and sometimes sorghum or millet year-after-year without fallows. This leads to sheet erosion and soils become thin and impoverished.
The PI and graduate student Rojas held a workshop with GEVAPAF and shared a random sample of 24 individual photos from all drone missions and all villages. This was conducted with GEVAPAF staff and included six men (ages 24–60) and two women (ages 24–30). All participants were born in the region, grew up farming in rural villages and had professional experience conducting environmental projects throughout the area. They were asked to categorize each as examples of “degradation”, “rehabilitation”, or “neutral”. Staff consistently categorized photos with just fields and particularly fields containing exposed rocks as degraded. They explained that such areas are prone to erosion and are likely impoverished. Similarly, areas with just trees and agricultural fields with trees were categorized as rehabilitated. These are likely areas that have been reforested or where trees have been protected. Housing compounds were considered neutral and areas that featured no agriculture but contained rocks, trees, grasses, or other vegetation were considered neutral. These categorizations were used as input for the degradation classification. For instance, areas of “agriculture” with “more than 10% tree cover” would be considered “rehabilitated”. Areas of “agriculture” containing “more than 20% rock or bare soil” would be considered “degraded”.
2.5. Degradation Classification
In QGIS (version 3.26), a 5 m × 5 m fishnet grid was overlayed with the 0.5 m LULC classification of each site. The zonal histogram tool was then used to calculate the instance of each LULC per class. The percent LULC class in grid cells is used an input in the degradation classification model (Figure 5) which classifies each cell as degraded, rehabilitated, developed, or unclassified. This produced a series of maps as seen in Appendix A, Figure A1 for Kadegli. The classification decision tree was designed to reflect local stakeholder perspectives on indicators of degradation and rehabilitation in the landscape.
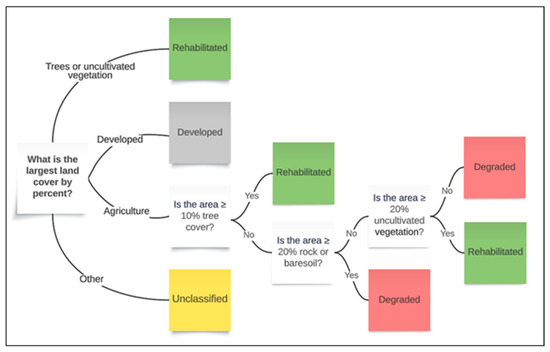
Figure 5.
Decision trees used for classifying 5 m × 5 m grid cells as degraded, rehabilitated, developed, or unclassified.
3. Results
3.1. Land Management
Conversations with community members and GEVAPAF partners found heterogeneous land management practices including agroforestry, protected areas, and conservation education sites as well as sites without active rehabilitation efforts. Although common in other parts of dryland West Africa, we saw no evidence of soil and water conservation (SWC) interventions such as zaï, contour stone bunds, or semipermeable rock dams at any of the sites [18,23].
There were protected areas surrounded by fields at both Biankouri and Nanoume. There is a forested preserve (about 69,900 m2) set aside for conservation purposes at Biankouri while there is a sacred forest (about 13,700 m2) at Nanoume. At the Biankouri reserve, the soils are bright and bare, suggesting significant degradation. The site had recently been created as a community conservation area to prevent erosion and enhance biodiversity. The land in and around the Nanoume sacred forest is rocky and therefore difficult to cultivate.
Both Ogaro and Sissiak are representative of different forms of agroforestry (Figure 6). At Sissiak, community members manage an agroforestry parkland where a mosaic of trees and cultivated crops are actively maintained. While at Ogaro, the Cellule d’Appui des Producteurs Agricole des Savanes (CAPAS), a Catholic development NGO, funds an alley cropping agroforestry project. Trees appear in straight rows alongside crop furrows in Ogaro (panel a), whereas they appear randomly distributed among fields in Sissiak (panel b).
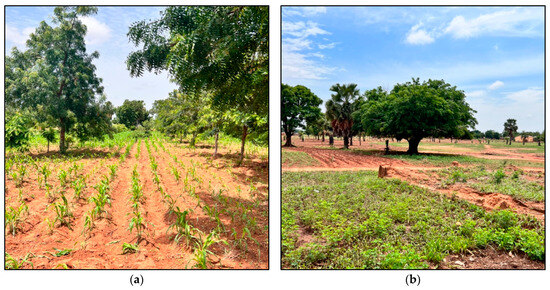
Figure 6.
Agroforestry strategies varied by site. (a) Alley cropping at Ogaro; (b) Agroforestry parkland at Sissiak.
At Kadegli and Kantindi, most land was cultivated with the exception of some vegetation and trees along an ephemeral streambed running through the study area. At Pana, there were no protected areas, agroforestry, or other rehabilitation land management. Community members at Pana also expressed significant concerns about the loss of topsoil resulting in increasing surface rocks, making tillage and cultivation more challenging.
Sounsourri and Toaga are both sites of private, educational conservation and rehabilitation. The Toaga study site is a large, village-owned educational conservation site with high tree density and significant areas of uncultivated vegetation. The Sounsourri study site includes a four-hectare permaculture teaching farm, Permaculture Institute for the Study of Communal Economic Systems (PISCES), using a variety of regenerative agriculture techniques including agroforestry and composting.
3.2. LULC Classifications
Using ArcGIS Pro and the Accuracy Assessment tool in Image Analyst, LULC classification training and testing accuracy was calculated to produce a confusion matrix per site and was found to be greater than 92%, suggesting high classification accuracy based on the training regions. Results of the LULC classification found variation among sites, particularly around percent tree cover, ranging from 7.2 to 20.6%, and vegetation cover, ranging from 2.6 to 29.0% (Table 2 and Figure 7). All sites but Toaga were classified as 50% agricultural fields. The developed and exposed rock classes were consistently the lowest percent covers for the sites. Only Sounsourri and Toaga had standing water (0.2 and 2.9%, respectively).
Table 2.
Percent LULC per site.
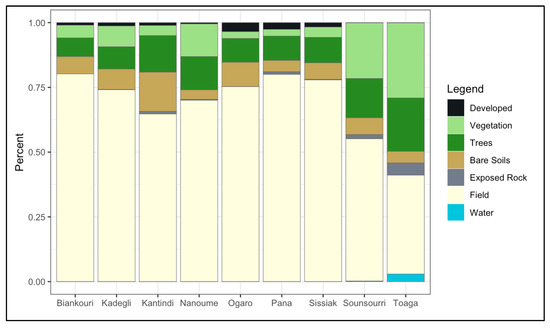
Figure 7.
Percent LULC per site.
Toaga and Sounsourri, both conservation sites, displayed the highest rate of vegetation (29.0 and 21.5%) and tree cover (20.6 and 15.2%) and the lowest percent agricultural fields (38.2 and 55.0%). Biankouri and Pana both displayed the highest percent field cover (80.2 and 80.0%), and each had among the lowest corresponding percent tree (7.2 and 9.4%) and vegetation cover (4.9 and 2.6%). Kantindi and Ogaro exhibited the highest percent cover of bare soil (15.1 and 9.4%) and among the lowest percent cover of uncultivated vegetation (3.9 and 2.6%).
3.3. Degradation Classifications
The average ratio of degraded (60.4%) to rehabilitated (33.3%) was almost 2:1 across all nine sites (Table 3 and Figure 8). Toaga had the highest proportion of rehabilitated (62.36%) compared to degraded (31.7%) and was the only site with a higher proportion of rehabilitation than degraded land. Sounsourri displayed roughly equal rates of rehabilitated (45.1%) and degraded (49.5%). Biankouri (77.8%), Pana (70.7%), and Kadegli (68.3%) experienced the highest rates of degradation.
Table 3.
Percent degradation classification per site.
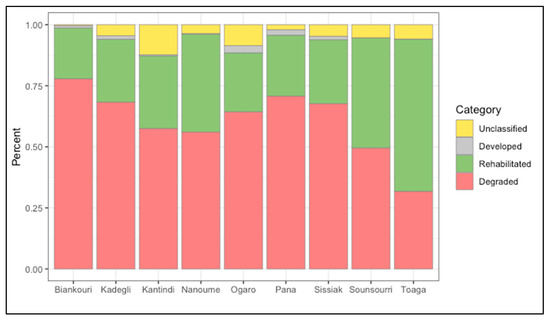
Figure 8.
Degradation classification per site.
3.4. Spatial Analysis of Trees, Palms, and Compounds
Analysis of the patterns of density and clustering of trees, palms, and compounds found varying results across the sites (Table 4 and Figure 9). The highest density of trees per hectare was observed at Toaga (35.88) and Ogaro (31.54) and the lowest density was observed at Kadegli (7.06).
Table 4.
Density of trees, palms, and compounds per site.
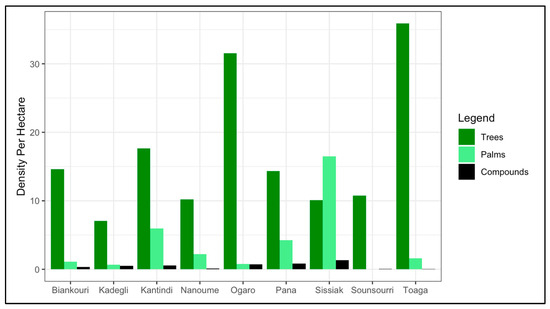
Figure 9.
Density per hectare of trees, palms, and compounds per site.
Seven of the nine sites displayed statically significant tree clustering (Table 5 and Figure 10), with the lowest tree NNR at Kadegli (0.645). Both Sounsourri (1.076) and Nanoume (1.059) had NNR for tree distribution less than the threshold of 1, suggesting trees were dispersed evenly across the study site. Palms across most sites were more clustered than trees. This may be because palms in some sites are planted in lines to demarcate field or property boundaries. At Ogaro, the NNR of palms (1.402) was greater than the threshold and greater than the NNR of tree distribution (0.847). This is likely due to the small number of palms at this site rather than the result of a planting or a clustered preserve.
Table 5.
Spatial clustering, average nearest neighbor statistics of trees, palms, and compounds.
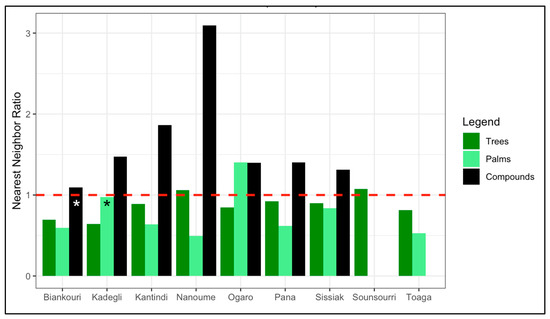
Figure 10.
NNR for tree, palm, and compound points per site.
While trees and palms were generally clustered, the spatial patterns observed for compounds were significantly different. For the six sites with sufficient compound observations and statically significant results, compounds displayed NNR values greater than the threshold suggesting home compounds were highly spatially dispersed across the study area. This suggests families may try to maximize distance between neighbors when establishing new homesteads.
4. Discussion
Previous surveys of land degradation in the Savanes Region detected large spatially coherent areas of increasing degradation and much smaller but dispersed areas of rehabilitation (see Figure 2). These national assessments used coarse spatial data for such analyses and, hence, reveal large regions of homogeneity. For the most part, the ORSTOM and CILLS projects relied primarily on the expert knowledge of Togolese scientific agencies and European researchers to inform their work. In contrast, the work presented here sought to understand degradation and rehabilitation patterns and processes from the bottom-up and at much finer scales of individual communities. The use of drones facilitates such analyses because of the extremely high spatial resolution of the imagery they provide. This kind of detail is more easily interpreted by local stakeholders such as everyday farmers and NGO agents because features such as rocks, fields and trees are easily visible in the imagery. Moreover, drone imagery can be quickly shared in the field with local participants and their perspectives used to inform the image classification and spatial analysis. This place-based and bottom-up perspective detected a high degree of heterogeneity among sites.
The relative proportion of degradation/rehabilitation varied across villages and differed markedly from previous assessments and particularly the more recent 2016 CILLS study. For instance, Toaga is a community conservation area that featured the lowest percentage of degraded area (31.2%—Table 3), but it lies within an area of “moderate” degradation in 2016 with “No change” in degradation severity between 1996 and 2016 (Table 1). Similarly, Pana was located within an area of “moderate” degradation in 2016 but of “Further degradation” between 1996 and 2016 (Table 1). The drone imagery analysis assessed Pana as the second most degraded site at 70.7% (Table 3) due to the high proportion of rocks within agricultural fields. The case of Biankouri, however, is consistent. It has the highest percentage of degraded area (77.8%—Table 3) and lies within an area of severe and further degradation (Table 1).
Individual trees are readily apparent in the drone imagery and one can easily differentiate among distinct types. The type, distribution, and spatial arrangement of trees indicate different land management practices. For instance, Sissiak featured a relatively low density of trees per hectare (10.10) but a very high number of palm trees (822) (Table 4). Trees and palms, however, were relatively evenly distributed within the village landscape based on their NNR (0.897) (Table 5). This suggests an agroforestry parkland whereby farmers deliberately preserve trees and cultivate around them. This is in contrast to the practice of alley-cropping in Ogaro where trees are intentionally planted within fields in rows and results in a very high density of trees per hectare (31.54) (Table 4), but similar NNR (0.847) (Table 5).
Sounsourri and Toaga featured the lowest percentages of degraded area of 49.5 and 31.7, respectively, across all communities (Table 3). Such results are consistent with the fact that they are demonstration sites for agroecology and village-led conservation. Biankouri featured the highest proportion of degraded area at 77.8% (Table 3) but lies in an area identified in previous studies of severe and increasing degradation (Table 1). Unlike the other sites, compounds in Biankouri are not highly clustered (Figure 10) and suggest that land degradation is enhanced by the widespread distribution of households practicing intensive agriculture between them. The landscape in Biankouri appears saturated with agricultural fields with few trees and is definitively not an agroforestry parkland like Sissiak.
5. Conclusions
Overall, the results demonstrate that drones are very effective tools for assessing land degradation neutrality (LDN) at local scales. Because of their extremely high spatial resolution, features characteristic of both land degradation and rehabilitation are easily detected. Moreover, the imagery resolution lends itself to visible interpretation by stakeholders. Bare soil, rock, individual trees and agricultural fields are readily apparent. The presence, absence and distribution of these features can be used as input to classify imagery and detect spatial patterns for individual communities. Thus, the amount of degraded/rehabilitated land can be quantitatively assessed and measure the relative LDN among sites. This study shows that LDN varies widely among the nine localities. This local LDN also differs markedly from previous regional assessments using coarser data. In some cases, village LDN is consistent with previous studies such as Biankouri which features low LDN due to the high proportion of degraded land and was mapped by others as severely degraded. In others, such as Toaga and Sounsourri, the opposite is true.
Interactions with GEVAPAF and community partners explain these discrepancies. Farmers and local leaders deliberately set aside conservation areas in Toaga and Sounsourri as demonstration sites for agroecology and permaculture. Similarly, places such as Sissiak and Ogaro exhibit intentional agroforestry efforts. Thus, drone imagery combined with participatory fieldwork can measure, map and visualize patterns of LDN in ways that other spatial data cannot.
Our study, however, has limitations. We know from visiting and spending time in these heterogeneous savanna landscapes of the Savanes Region that such analyses are very sensitive to the precise flight path of the drone itself. Flying a mission 100 m in another direction and surveying a different area in close proximity could yield very different results. We acknowledge this weakness but feel this does not diminish our overall conclusion that LDN varies across sites at such local scales.
This collaborative fieldwork combining drone imagery with stakeholder interactions could be a model methodology for similar LDN assessments in other contexts. Such imagery and analyses (i.e., the resulting maps) could be used for ongoing LDN monitoring and be specifically useful for interventions. It is our hope that our study in the Savanes Region of northern Togo will promote similar collaborations in other contexts to promote this kind of participatory LDN assessment.
Author Contributions
Conceptualization, D.M. and C.T.W.; methodology, D.M. and C.T.W.; software, D.M.; validation, D.M.; formal analysis, D.M.; investigation, C.T.W., D.M. and A.J.R.; resources, C.T.W., A.M. and GEVAPAF, data curation; writing—original draft preparation, D.M.; writing—D.M. and C.T.W.; visualization, D.M.; supervision, C.T.W. and A.M.; project administration, C.T.W.; funding acquisition, C.T.W. and A.M. All authors have read and agreed to the published version of the manuscript.
Funding
This research was funded by National Science Foundation, grant number BCS-1759064. This research also received support from a Population Research Infrastructure Program (iPOP) award to the Carolina Population Center (P2C HD050924) at The University of North Carolina at Chapel Hill by the Population Dynamics Branch (PDB) of the Eunice Kennedy Shriver National Institute of Child Health and Human Development.
Data Availability Statement
Data can be provided on request.
Acknowledgments
We would also like to thank our research assistant, Aimé Somé, and our partners at GEVAPAF for their expertise and interpretation.
Conflicts of Interest
The authors declare no conflicts of interest.
Appendix A


Figure A1.
Kadegli: (a) Orthomosaic true color; (b) NDVI; (c) points of digitized trees, palms, and home compounds; (d) LULC classification; (e) degradation classification.
References
- Grainger, A. Desertification: How People Make Deserts, How People Can Stop and Why They Don’t; Earthscan: London, UK, 1984. [Google Scholar]
- United Nations Convention to Combat Desertification. United Nations Convention to Combat Desertification in Those Countries Experiencing Serious Drought and/or Desertification, Particularly in Africa; United Nations: New York, NY, USA, 1994. [Google Scholar]
- Thomas, D.S.G.; Middleton, N.J. Desertification: Exploding the Myth; John Wiley & Sons: Chichester, UK, 1994. [Google Scholar]
- Stafford Smith, D.M. Desertification: Reflections on the mirage. In The End of Desertification? Disputing Environmental Change in the Drylands; Behnke, R.H., Mortimore, M., Eds.; Springer: Heidelberg, Germany, 2016; pp. 539–560. [Google Scholar]
- Swift, J. Desertification: Narratives, winners and losers. In The Lie of the Land: Challenging Received Wisdom on the African Environment; Leach, M., Mearns, R., Eds.; Heinemann: Portsmouth, NH, USA, 1996; pp. 73–90. [Google Scholar]
- Warren, A. Land degradation is contextual. Land Degrad. Dev. 2002, 13, 449–459. [Google Scholar] [CrossRef]
- Gray, L.C. Is land being degraded? A multi-scale investigation of landscape change in southwestern Burkina Faso. Land Degrad. Dev. 1999, 10, 329–343. [Google Scholar] [CrossRef]
- Andersson, E.; Brogaard, S.; Olsson, L. The political ecology of land degradation. Annu. Rev. Environ. Resour. 2011, 36, 295–319. [Google Scholar] [CrossRef]
- Behnke, R.H.; Mortimore, M. Introduction: The end of desertification? In The End of Desertification: Disputing Environmental Change in the Drylands; Behnke, R.H., Mortimore, M., Eds.; Springer: Heidelberg, Germany, 2016; pp. 1–34. [Google Scholar]
- Cherlet, M.; Hutchinson, C.; Reynolds, J.; Hill, J.; Sommer, S.; von Maltitz, G. (Eds.) World Atlas of Desertification; Publication Office of the European Union: Luxembourg, 2018. [Google Scholar]
- Reynolds, J.F.; Stafford Smith, D.M.; Lambin, E.F.; Turner II, B.L.; Mortimore, M.; Batterbury, S.P.J.; Downing, T.E.; Dowlatabadi, H.; Fernández, R.J.; Herrick, J.E.; et al. Global desertification: Building a science for dryland development. Science 2007, 316, 847–851. [Google Scholar] [CrossRef] [PubMed]
- Reij, C.; Winterbottom, R. Scaling Up Regreening: Six Steps to Success a Practical Approach to Forest and Landscape Restoration; World Resources Institute: Washington, DC, USA, 2015; p. 72. [Google Scholar]
- Sendzimir, J.; Reij, C.P.; Magnuszewski, P. Rebuilding resilience in the Sahel: Regreening in the Maradi and Zinder regions of Niger. Ecol. Soc. 2011, 16, 1. [Google Scholar] [CrossRef]
- Cowie, A.; Orr, B.J.; Castillo Sanchez, V.M.; Chasek, P.; Crossman, N.D.; Erlewein, A.; Louwagie, G.; Maron, M.; Metternicht, G.I.; Minelli, S.; et al. Land in balance: The scientific conceptual framework for Land Degradation Neutrality. Environ. Sci. Policyt 2018, 79, 25–35. [Google Scholar] [CrossRef]
- Kust, G.; Andreeva, O.; Cowie, A. Land degradation neutrality: Concept development, practical applications and assessment. J. Environ. Manag. 2017, 195, 16–24. [Google Scholar] [CrossRef] [PubMed]
- Schlingloff, S.; Harari, N.; Studer, R.M.; Decision support for sustainable land management. World Overview of Conservation Approaches and Technologies (WOCAT). 2021. Available online: https://wocat.net/documents/1076/DS-SLM_overview.pdf (accessed on 20 October 2025).
- Teich, I.; Harari, N.; Caza, P.; Henao-Henao, J.P.; Lopez, J.C.; Raviolo, E.; Díaz-González, A.M.; González, H.; Bastidas, S.; Morales-Opazo, C.; et al. An interactive system to map land degradation and inform decision-making to achieve land degradation neutrality via convergence of evidence across scales: A case-study in Ecuador. Land Degrad. Dev. 2023, 34, 4475–4487. [Google Scholar] [CrossRef]
- Opedes, H.; Nedala, S.; Mücher, C.A.; Baartman, J.E.M.; Mugagga, F. How can drones uncover land degradation hotspots and restoration hopespots? An integrated approach in the Mount Elgon Region with community perceptions. Land 2024, 13, 1. [Google Scholar] [CrossRef]
- Ouattara, T.A.; Sokeng, V.-C.; Zo-Bi, I.C.; Kouamé, K.F.; Grinand, C.; Vaudry, R. Detection of forest tree losses in Côte d’Ivoire using drone aerial images. Drones 2022, 6, 83. [Google Scholar] [CrossRef]
- Williams, J. UAV survey mapping of illegal deforestation in Madagascar. Plants People Planet 2024, 6, 1151–1572. [Google Scholar] [CrossRef]
- Brabant, P.; Darracq, S.; Égué, K.; Simonneux, V. Togo: Human-Induced Land Degradation Status: Explanatory Notes on the Land Degradation Index Map 1:500,000; ORSTOM: Paris, France, 1996; p. 67. [Google Scholar]
- Comité Permanent Inter-états de Lutte contre la Sécheresse dans le Sahel. Étude Socio-Economique sur La Dégradation Des Terres Au Togo; CILSS: Lomé, Togo, 2017; p. 116. [Google Scholar]
- West, C.T.; Benecky, S.; Karlsson, C.; Reiss, B.; Moody, A. Bottom-up perspectives on the re-greening of the Sahel: An evaluation of the spatial relationship between soil and water conservation (SWC) and tree-cover in Burkina Faso. Land 2020, 9, 208. [Google Scholar] [CrossRef]
Disclaimer/Publisher’s Note: The statements, opinions and data contained in all publications are solely those of the individual author(s) and contributor(s) and not of MDPI and/or the editor(s). MDPI and/or the editor(s) disclaim responsibility for any injury to people or property resulting from any ideas, methods, instructions or products referred to in the content. |
© 2025 by the authors. Licensee MDPI, Basel, Switzerland. This article is an open access article distributed under the terms and conditions of the Creative Commons Attribution (CC BY) license (https://creativecommons.org/licenses/by/4.0/).