Article

Beyond Proximity: Assessing Social Equity in Park Accessibility for Older Adults Using an Improved Gaussian 2SFCA Method

1
School of Internet of Things, Nanjing University of Posts and Telecommunications, Nanjing 210003, China
2
Smart Health Big Data Analysis and Location Services Engineering Lab of Jiangsu Province, Nanjing 210003, China
3
Department of Geomatics Engineering, College of Civil Engineering, Nanjing Forestry University, Nanjing 210037, China
4
College of Marine Science and Engineering, Nanjing Normal University, Nanjing 210023, China
*
Author to whom correspondence should be addressed.
Land 2025, 14(11), 2102; https://doi.org/10.3390/land14112102
Submission received: 21 August 2025 / Revised: 15 October 2025 / Accepted: 20 October 2025 / Published: 22 October 2025

Abstract

Urban park green spaces (UPGSs) play a critical role in enhancing residents’ quality of life, particularly for older adults. However, inequities in accessibility and resource distribution remain persistent challenges in aging urban areas. To address this issue, this study takes Gulou District, Nanjing City, as an example and proposes a comprehensive framework to evaluate the overall quality of UPGSs. Furthermore, an enhanced Gaussian two-step floating catchment area (2SFCA) method is introduced that incorporates (1) a multidimensional park quality score derived from an objective evaluation system encompassing ecological conditions, service quality, age-friendly facilities, and basic infrastructure; and (2) a Gaussian distance decay function calibrated to reflect the walking and public transit mobility patterns of the older adults in the study area. The improved method calculates the accessibility values of UPGSs for older adults living in residential communities under the walking and public transportation scenarios. Finally, factors influencing the social equity of UPGSs are analyzed using Pearson correlation coefficients. The experimental results demonstrate that (1) high-accessibility service areas exhibit clustered distributions, with significant differences in accessibility levels across the transportation modes and clear spatial gradient disparities. Specifically, traditional residential neighborhoods often present accessibility blind spots under the walking scenario, accounting for 50.8%, which leads to insufficient accessibility to public green spaces. (2) Structural imbalance and inequities in public service provision have resulted in barriers to UPGS utilization for older adults in certain communities. On this basis, targeted improvement strategies based on accessibility characteristics under different transportation modes are proposed, including the establishment of multi-tiered networked UPGSs and the upgrading of slow-moving transportation infrastructure. The research findings can enhance service efficiency through evidence-based spatial resource reallocation, offering actionable insights for optimizing the spatial layout of UPGSs and advancing the equitable distribution of public services in urban core areas.

1. Introduction

Urban park green spaces (UPGSs) serve as critical public infrastructure that enhances residents’ quality of life, particularly for older adults [1,2,3]. With global aging accelerating, older adults face reduced mobility, heightened reliance on public transit, and increased environmental sensitivity, intensifying the mismatch between UPGS supply and spatial service demand [4,5,6]. To address this issue, the World Health Organization (WHO) underscores that urban design must prioritize the physical and mental needs of older adults through optimized spatial layouts [7], yet inequitable UPGS access remains a persistent challenge. Under these circumstances, developing precise UPGS configuration strategies tailored to older adults has become a critical challenge for advancing urban sustainable development.
To facilitate effective evaluation of UPGSs, numerous studies have been conducted, particularly proposing a comprehensive set of assessment indicators. Among these indicators, accessibility emerges as a pivotal metric for quantifying spatial resource access [8,9,10]. Initially conceptualized as the ease or difficulty of travel between locations, its definition has evolved to incorporate spatio-temporal (e.g., travel time costs) and socioeconomic dimensions (e.g., disparities in access across demographic groups) [11,12,13]. Current research predominantly employs three core analytical frameworks to assess UPGS accessibility, namely network analysis for spatial coverage evaluation, the Gaussian two-step floating catchment area (2SFCA) method for demand-pattern integration, and space syntax analysis for traffic-flow dynamics. [14,15,16]. For example, some studies analyzed the accessibility of UPGSs by integrating land use and population distribution data, with the aim of deriving targeted park site selection recommendations [17,18,19]. With advancements in big data technologies, scholars are increasingly using multi-source data (e.g., mobile signaling records, street view images, social media data) to leverage their complementary advantages in accessibility evaluation [20,21,22,23].
Although accessibility provides a benchmark for identifying the physical coverage of UPGSs, it fails to reflect comprehensive barriers faced by specific populations [24,25,26]. Consequently, the concept of equity is introduced to assess the distributional rationality of urban public service resources. It serves as a fundamental metric for assessing the equity of resource allocation between diverse social segments [27,28,29]. The equity analysis of UPGSs has evolved through three phases: regional equity (distribution equality) [30,31,32], spatial equity (accessibility efficiency) [33,34], and social equity (population disparity) [35], with current studies predominantly focusing on spatial dimensions [36,37,38]. Despite improvements to traditional models through distance decay functions, attraction models, and threshold settings, these single-dimensional optimizations are fundamentally limited in their ability to reveal the accessibility characteristics of specific populations [39]. Meanwhile, rapid population aging has driven a profound shift in societal needs. Due to socioeconomic vulnerabilities, older adults face heightened risk of social exclusion and exhibit greater demand for public infrastructures [40,41]. In this context, UPGSs enhance physical, psychological, and social well-being while reducing health risks for older adults [42]. Consequently, equitable access to UPGSs becomes essential for promoting the living quality of older adults [43]. Existing studies have applied methods such as AG2SFCA and gradient boosting decision trees to analyze park accessibility for older adults [14,44,45]. However, these studies have not accounted for the influence of park environmental quality on its attractiveness to older adults.
To address the above issues, this study comprehensively considers the demand characteristics of older adults and selects Gulou District in Nanjing as a case study. Specifically, we collect multi-source big data, including questionnaires, remote sensing imagery, mobile signaling records, and points of interest (POIs), to establish a UPGS foundational database. On this basis, an improved Gaussian 2SFCA method is proposed, in which the traditional area-based supply indicator is replaced by a comprehensive score of park quality across multiple dimensions. In this framework, a Gaussian distance decay function is incorporated to better simulate the travel behavior of older adults, considering that visitation probability declines with increasing distance. This integration enables a more refined and equitable assessment of UPGS accessibility for the older adults in the study area, which can better reflect their actual needs and behavioral characteristics. Finally, from the perspective of social equity, we apply Pearson correlation coefficients to analyze UPGS equity disparities and their causes and propose corresponding strategies (Figure 1). This research aims to provide scientific references for the planning of UPGSs and ensuring environmental justice for vulnerable groups.
The structure of this paper is as follows: Section 1 provides the context and motivation for this study and a review of the existing literature. Section 2 establishes the research foundation by introducing the study area, datasets, and software used. Section 3 constructs the methodological framework for park quality assessment, accessibility measurement, and equity evaluation. Section 4 presents the empirical results of older adults from quality scoring, multimodal accessibility analysis, and social equity assessment. Section 5 provides an in-depth discussion by connecting key findings with regional development contexts. Section 6 synthesizes the conclusions and derives practical planning strategies.

2. Research Area and Data

2.1. Research Area

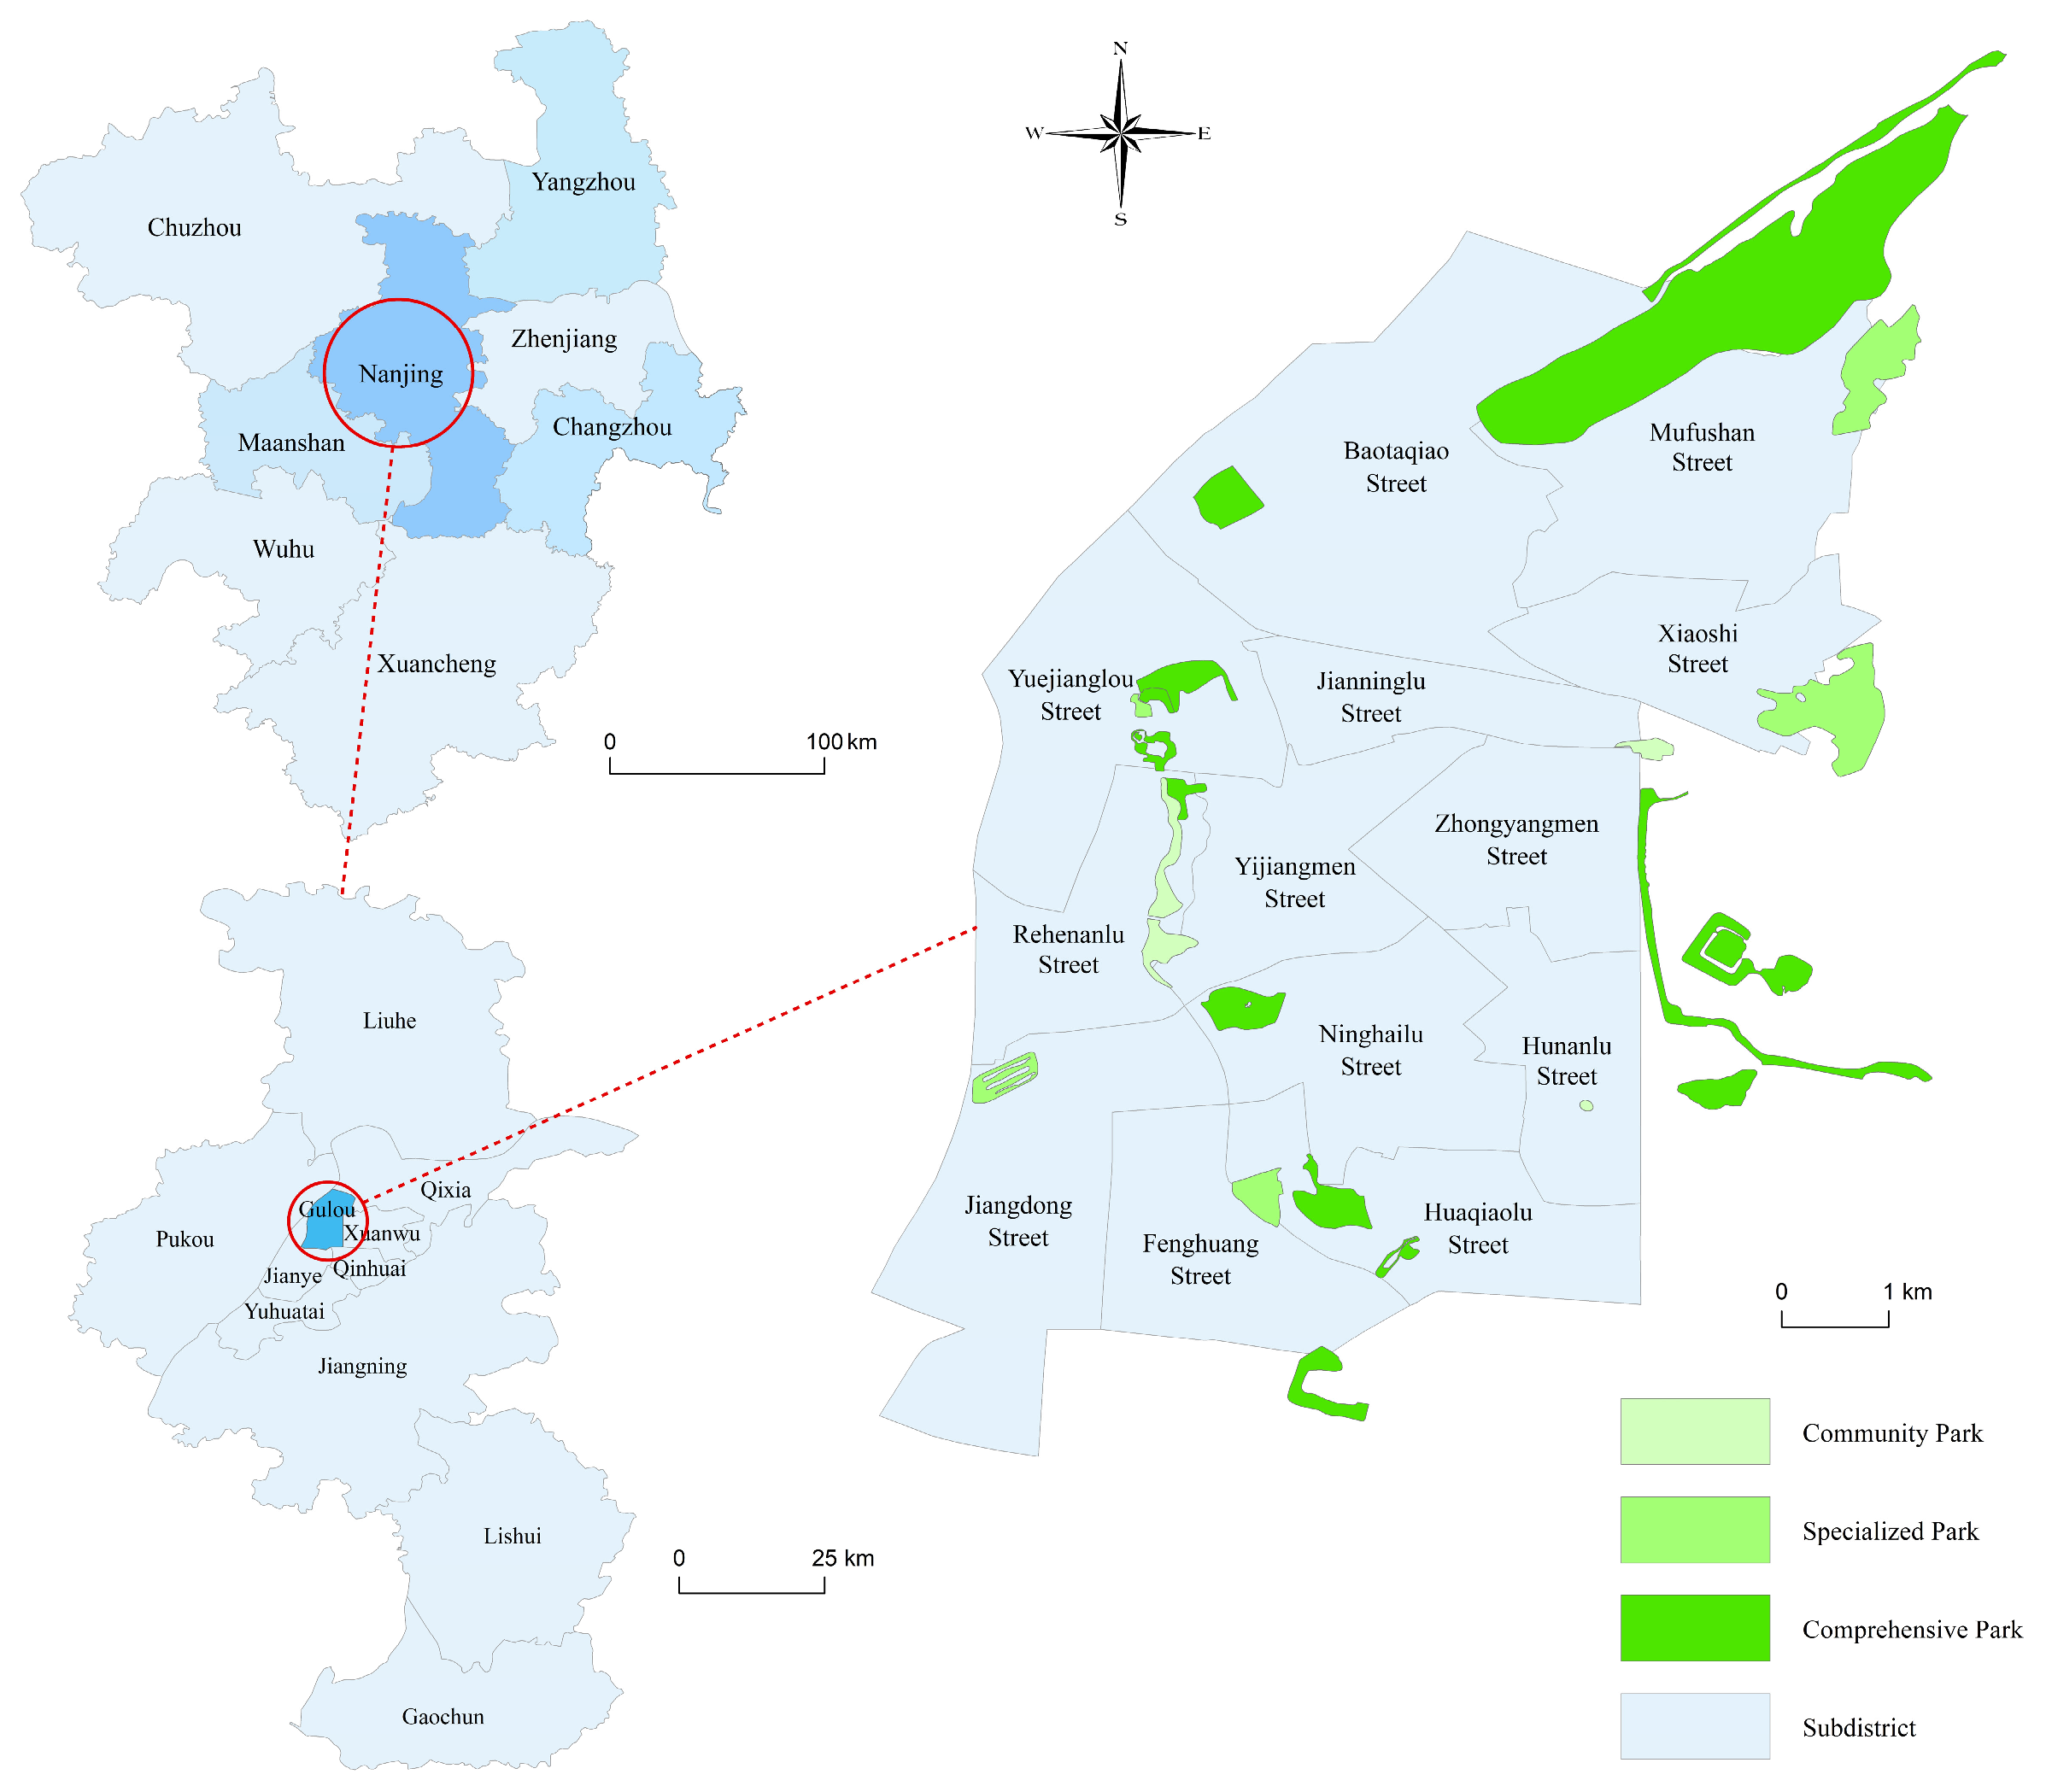
Gulou District is situated along the Yangtze River in Nanjing. With a total area of 54.18 km2, it governs 13 sub-districts and is characterized by a gentle topography dominated by uplands and plains. The region boasts a well-developed economy, supported by a complex transportation network and abundant vegetation resources. It has multiple types of park greenery, including comprehensive parks, specialized parks, and community parks (Figure 2). Moreover, Gulou District is characterized by a deeply aged society [46]. As the most densely populated historic urban area in Nanjing, it had a permanent resident population of 942,700 at the end of 2023, which included 307,100 older adults, representing over 30% of the total. Due to historical factors, a large number of older adults in the jurisdiction are concentrated in some historically built residential communities. The existing spatial layouts and facilities in these areas are ill-suited to the living needs and activity expectations of older adults, which further accentuates the persistent issues related to the shortage and inferior quality of urban public spaces.

2.2. Research Data

This study employs interdisciplinary methods such as remote sensing interpretation, big data mining, and field investigation to evaluate the service level of UPGSs for older adults. The research data comprises administrative division data, urban road data, UPGS data, residential community data, service evaluation data, park facility data, and older adults data (Table 1). The administrative division data is sourced from the Tianditu Spatio-Temporal Information Cloud Platform (https://www.tianditu.gov.cn), and the urban road data comes from Open Street Map. The UPGS data, sourced from 2024 Gaofen-2 imagery, is processed in ENVI 5.6 to extract park boundaries and calculate the annual average NDVI and NDWI. These indices serve as quantitative metrics for assessing the ecological regulation capacity and visual landscape comfort, respectively, and are used to support the evaluation of social equity. The residential community data is obtained from the points of interest (POIs) data of residential communities crawled from the Amap Open Platform, and the housing price data is provided by https://nj.lianjia.com/. This dataset encompasses 1066 residential communities, detailing their names, locations, housing prices, and affiliated sub-districts, which closely aligns with the number of 1095 communities reported by the Gulou District Real Estate Bureau in 2024. The service evaluation data is collected through questionnaires (Appendix A), with a total of 573 questionnaires evenly distributed across various parks within the jurisdiction. The questionnaire design follows the cognitive habits of older adults, with the content presented as concise as possible to facilitate quick and accurate responses. Park facility data is collected through field surveys and Gaode Map’s open platform, including facility POIs (both inside and outside of the parks), night lighting, signage systems, and barrier-free facilities. The older adults data is derived from mobile phone signaling data provided by the China Unicom Smart Footprint Platform. To ensure data reliability, the older adults in the study area is quantified based on their presence within polygon-based base station units from 00:00 to 05:00 over ten days. This dataset shows a strong correlation (r = 0.8032) with the permanent older adults from the 7th National Population Census at the sub-district level.

3. Research Methods

3.1. Park Quality Fairness Evaluation System

Traditional quality evaluations mostly focus on a single dimension such as spatial scale, making it difficult to meet the special needs of older adults. Therefore, supported by the age-friendly theory [47] in combination with the behavioral preference characteristics of the older adults, this study selects four primary indicators: basic environment, service quality, age-friendly facilities, and ecological environment (Table 2). Among these indicators, the basic environment indicator evaluates each park’s spatial scale, layout form, and daily maintenance and encompasses three secondary indicators: area size, shape index, and sanitary conditions. The service quality indicator assesses the service efficiency and attractiveness of parks comprehensively through two secondary indicators, namely service function diversity based on external Gaode Map POI data and overall satisfaction rate derived from the questionnaires. The age-friendly facility indicator focuses on practical convenience and safety assurance during age-appropriate activities, including internal facility POIs derived from the Gaode Map data and age-friendly facility counts from field surveys. The ecological environment indicator measures the ecological regulation capacity and visual landscape comfort and consists of two secondary indicators: daily average NDVI and NDWI calculated from GF-2 satellite images.
To mitigate the inherent biases of traditional subjective weighting methods and the inaccuracies stemming from information redundancy between indicators, this study employs the entropy method for objective weighting. This approach determines the relative importance of each indicator based on the underlying data patterns. The formulas are as follows:
R x   = x ij m × n = x 11 x 12 x 1 n x 21 x 22 x 2 n x m 1 x m 2 x mn
y ij = x ij min   x ij max   x ij min   x ij
P ij = y ij j   = 1 m y ij
e j = 1 lnn i = 1 m P ij × ln P ij
w j = 1 e j j = 1 n 1 e j
where Rx represents the original matrix containing the data for all indicators, yij denotes positive indicators, Pij is the proportion of each yij, ej refers to the entropy value of each indicator, and wj represents the weight assigned to each indicator.

3.2. Accessibility Analysis Based on the Improved Gaussian Two-Step Floating Catchment Area Method (2SFCA)

Widely regarded as a premier method for assessing UPGS accessibility [48,49], the Gaussian two-step floating catchment area method effectively integrates supply–demand relationships, distance decay, and practical ease of use to attain accurate spatial accessibility metrics. However, traditional 2SFCA method only measures park supply capacity based on area and fails to fully account for the dynamic impact of distance on service accessibility. Therefore, this study starts from the demand side and optimizes the traditional 2SFCA method by introducing an attraction algorithm to build a comprehensive evaluation system for park quality. Specifically, by integrating key factors such as park facilities, landscape, maintenance, carrying capacity, and population-specific friendliness, this system generates an objective quality score for each park, establishing it as the core metric for assessing supply capacity. Furthermore, the Gaussian-based distance decay function proposed by Dai is adopted to model the travel impedance that spatial distance imposes on park access [50]. This step is crucial to mitigate the overestimation of accessibility that would otherwise arise from ignoring the friction of distance.
In the analysis, residential community centroid points (i) are designated as demand bases. To account for the travel patterns of older adults involving walking and public transportation, time thresholds of 15 and 30 min, respectively, are adopted in accordance with the Nanjing Territorial Spatial Master Plan (2021–2035). Based on the average walking speeds of older adults, the time thresholds are converted into distance thresholds (d0) to define the search range for each community. Within the defined search area, spatial analyses are employed to identify all UPGSs (j). For each identified park, weighted calculations are performed by incorporating the supply–demand ratio (Rⱼ) derived from park quality equity evaluations and the Gaussian decay function-adjusted weights based on actual distances. Finally, the accessibility value (A) for residential community point (i) is obtained by summing all UPGS calculation results. Higher Aᵢ values indicate greater convenience in accessing UPGS services for older adults. The formulas are as follows:
R j =   S j k     d k j     d 0 G d ij D k
A i = j     { d ij     d 0 ( i ) } R j   ×   G ( d ij )
G d ij = e 1 2   ×   d ij d 0 i 2 e 1 2 1   e 1 2 , d ij     d 0 i
where Sj represents the supply scale of UPGS j, which is measured based on the park quality comprehensive score; dkj denotes the actual distance from residential community k to UPGS j; Dk refers to the demand scale of residential community k within the search range, which is quantified by older adults counts; Rj indicates the supply–demand ratio of UPGS j within the search threshold [dijd0(i)] for residential community i; and G(dij) defines the Gaussian decay function that accounts for the effects of spatial friction in the calculation of accessibility.

3.3. Social Equity Evaluation Method

Social equity has been narrowly conceptualized in traditional evaluations, which emphasize spatial resource distribution without connecting it to the quality of the residential environment [43]. To address this limitation, this study conducts social equity assessments from two perspectives: composite living environment conditions and spatial equity. (1) The composite living environment index, which is grounded in the concept of age-friendly communities, characterizes residential environment quality through three pillars: comfort (represented by housing prices), aesthetics (measured based on 30 min park accessibility), and harmony (using density of older adults as a negative indicator of public service pressure). The entropy method assigns weights to standardized indicators that are multiplied by normalized data to calculate the composite living environment score for each community. (2) Spatial equity evaluation comprises three indicators: park quality accessibility, walking accessibility, and public transport accessibility. Park quality accessibility is defined as the sum of UPGS quality scores calculated for each residential community within a given service range.
The Pearson correlation coefficient characterizes the linear relationship between the composite living environment and spatial equity for each residential community. An overlay analysis of the composite living environment and spatial equity indicators reveals their spatial associations, which are categorized into four spatial patterns: “high–high”, “high–low”, “low–high”, and “low–low”. Specifically, “high–high” indicates high-quality living environment and strong spatial equity, representing high social equity. “High–low” and “low–high” reflect imbalanced states, corresponding to moderate social equity. “Low–low” signifies low-quality living environment and weak spatial equity, indicating low social equity. Service blind spots are defined as “low–low” regions in the overlap analysis results, which represent priority zones requiring improvement in subsequent planning.

4. Results

4.1. Comprehensive Evaluation of the Quality of Parks in Gulou District

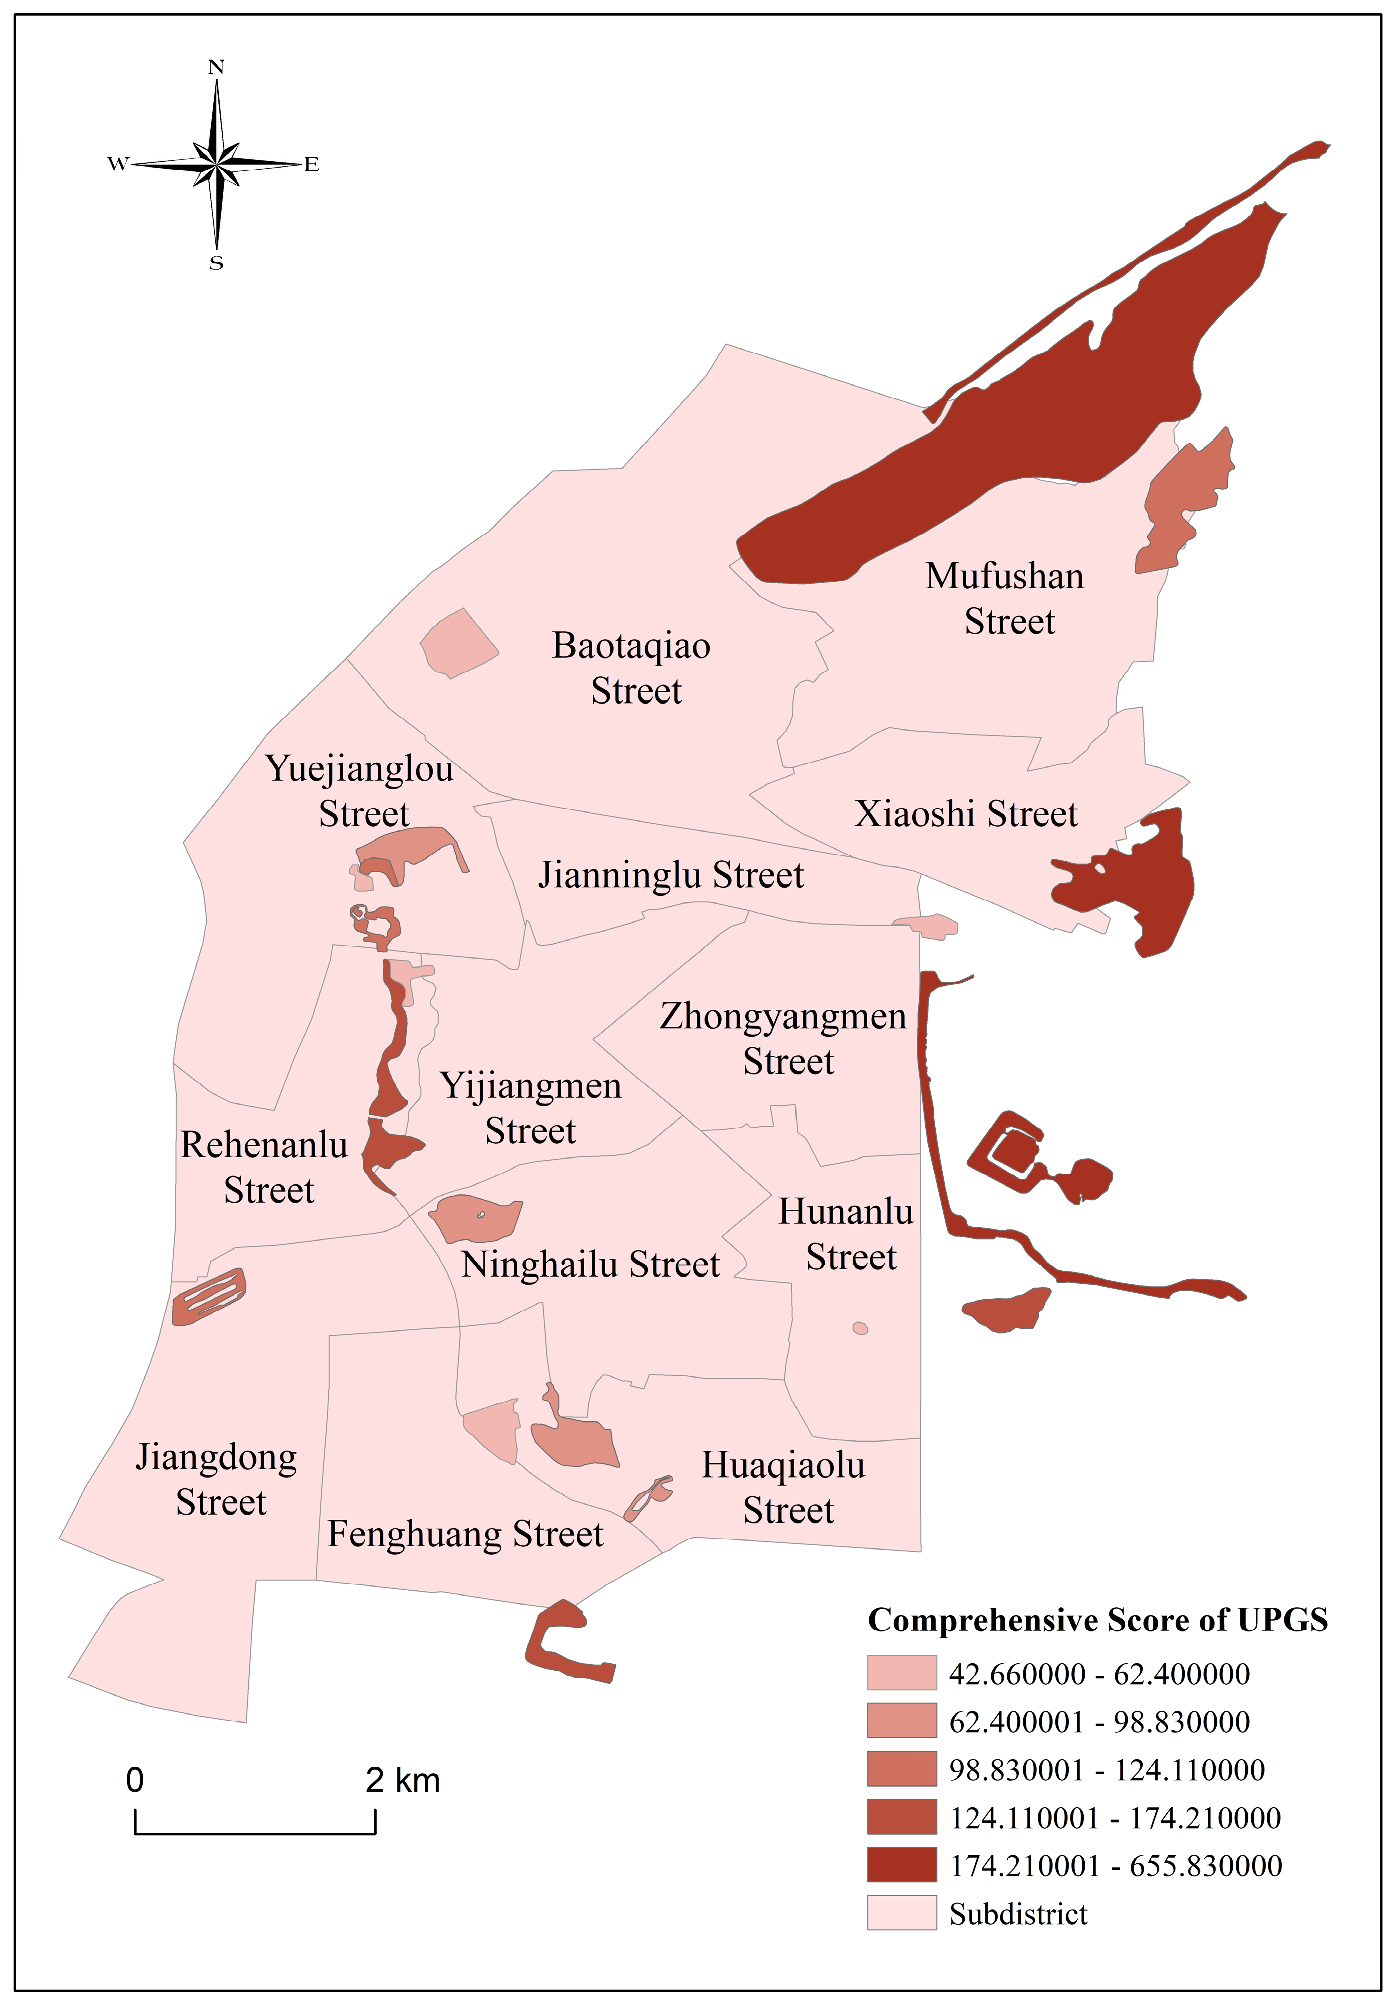
Figure 3 and Figure 4 show that significant differences exist in the UPGS comprehensive scores. A few large parks, such as Xuanwu Lake Park and Hongshan Forest Zoo, have quality scores that are far above the average, while more than 60% of parks have scores below the mean. This pattern indicates an imbalance in both quantity and quality of park resources within the study area.
Figure 5 indicates a skewed distribution of basic environment scores, with the scores of 75% of parks falling below the average. Only a small number of parks, including the Nanjing Muyan Riverside Scenic Area and Xuanwu Lake Park, score above the average. This result aligns closely with the questionnaire results. Specifically, only 38% of older adults are satisfied with basic environment conditions, suggesting this inadequacy is a widespread concern. Thus, enhancing these conditions remains a critical challenge for most UPGSs.
Regarding service quality, only four UPGSs, including Hongshan Forest Zoo and Xuanwu Lake Park, score above average. Conversely, the scores of 80% of parks fall below the mean, making service quality the lowest-rated indicator across all evaluation criteria. This finding aligns with the questionnaire results, in which only 32% of older adults express satisfaction with park service quality, including staff attitude and activity diversity. Furthermore, the considerable gap between the highest and average scores suggests that excellence in providing diversified services is currently confined to a small number of parks.
Regarding age-friendly facility scores, 30% of parks achieve scores above the mean. This percentage is relatively high among all evaluation indicators, which indicates that targeted progress has been made in constructing age-friendly facilities in some parks. However, the extremely low minimum score reveals serious deficiencies in certain parks. This outcome aligns with the questionnaire results, which show that 29% of respondents characterize park supporting facilities as “sufficient”, while 24% characterize them as “insufficient”. Overall, these findings highlight that most parks fail to adequately meet the needs of older adults regarding service diversity and facility completeness.
Ecological environment demonstrates the highest performance among all evaluation criteria, as evidenced by 60% of parks scoring above the average. This result is highly consistent with the evaluation of park ecological environment in the questionnaire. The survey shows that 35% of respondents rate the park ecological environment (e.g., green coverage, water cleanliness) as “satisfactory,” 50% consider it as “general,” and only 15% are “dissatisfied”. The results suggest that most parks exhibit specific ecological strengths, yet the overall scores remain low, indicating substantial potential for upgrading their ecological quality and service functions.
In summary, high-quality parks achieve higher scores regarding basic environment and diversity of service functions, while medium- and low-quality parks score higher in service quality and ecological environment.

4.2. Evaluation of Accessibility of UPGS for Older Adults Under Different Transportation Modes

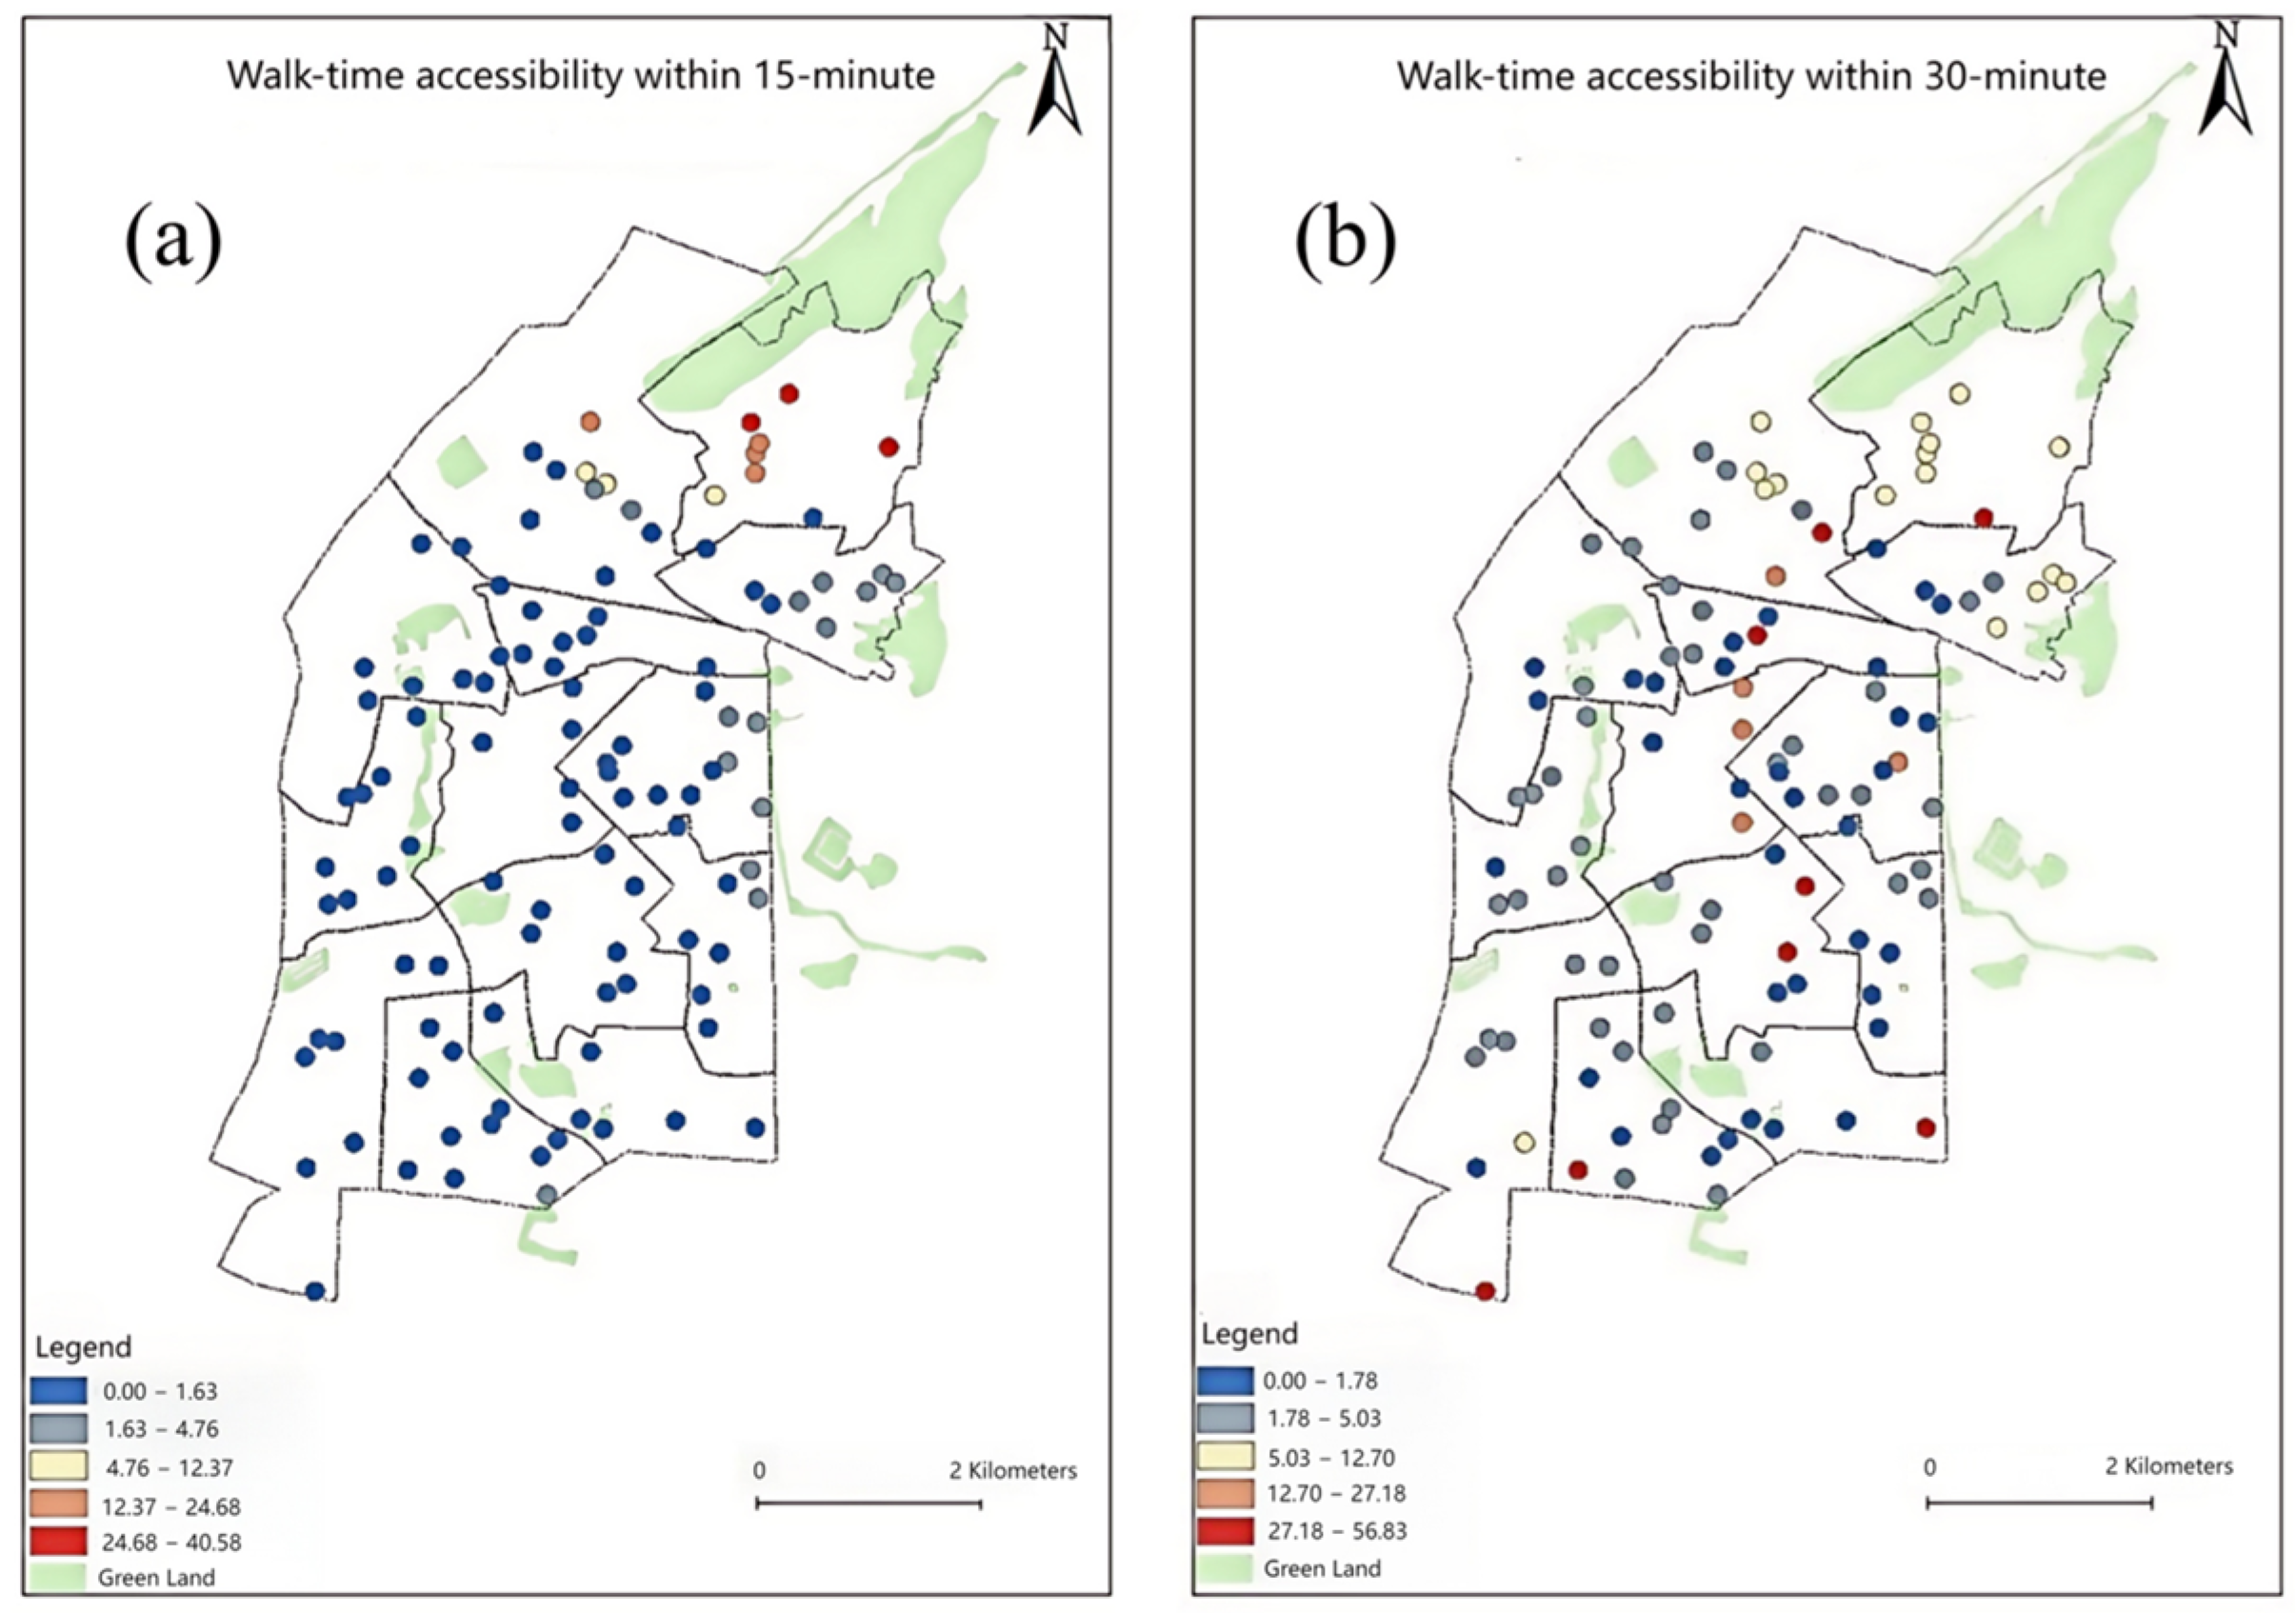
Given that older adults rely predominantly on walking and public transit for their daily travel, this study analyzes UPGS accessibility under these two transportation modes. Under the walking mode with a 15 min threshold, the UPGS accessibility exhibits significant spatial heterogeneity. Low-value areas (Ai ≤ 0.5) account for 50.8% of the total, revealing that in more than half of the communities, older adults cannot effectively access UPGS within a practical walking range.
When the walking time threshold is extended to 30 min, the accessibility range exhibits a reduction. Concurrently, there is a substantial decrease in the proportion of extremely low values, being 39.2 percentage points lower than that under the 15 min threshold. This aligns with the survey results, wherein 46% of respondents report commuting times within 30 min. Extending the threshold can enhance the spatial coverage efficiency of UPGS. Nevertheless, persistent localized gaps in certain areas require targeted optimization of green space layouts to mitigate service deficits across different threshold scenarios.
In summary, the accessibility of green spaces for older adults in Gulou District shows significant spatial clustering, with high-quality parks located in the northern and eastern regions. This synergy between quality and accessibility is empirically confirmed: 42% of older adults give ratings indicating satisfaction when parks are accessible within a 15 min walk, compared with 28% when it is beyond 30 min (Figure 6). Well-equipped parks enhance both appeal and practical access, confirming that quality directly shapes usage convenience. These findings provide an empirical basis for addressing spatial mismatch and optimizing public service resource allocation.
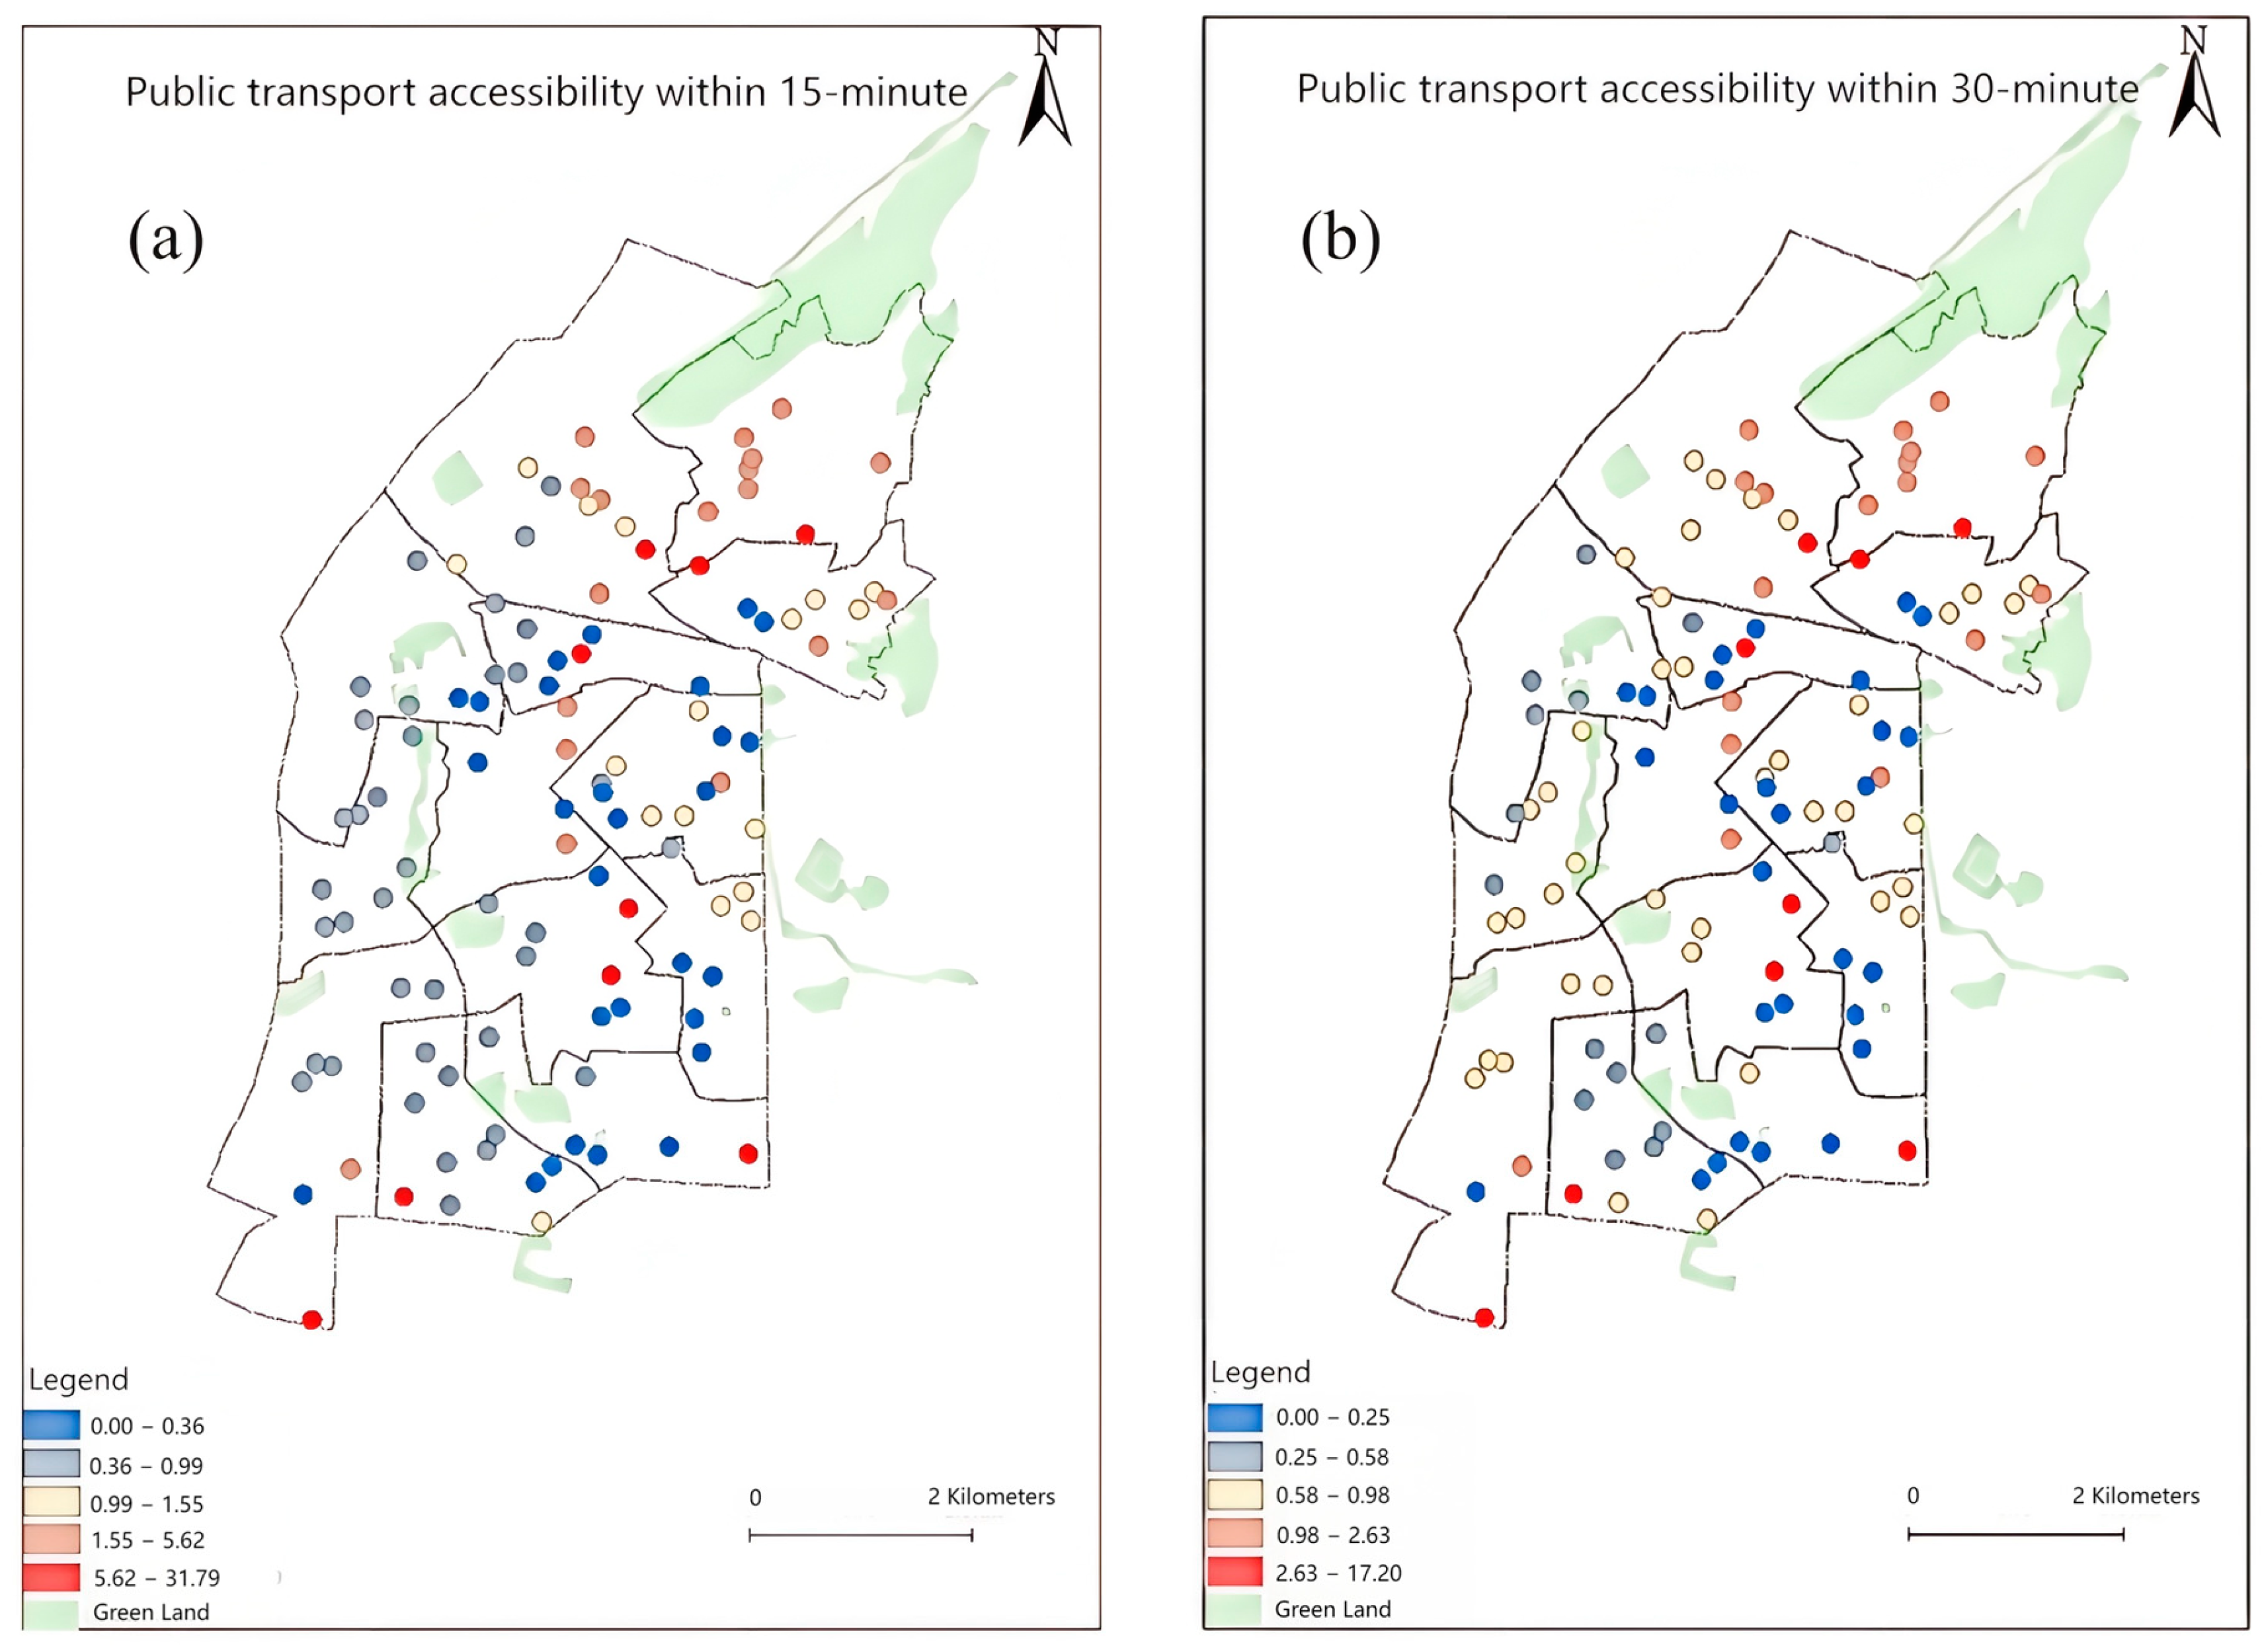
From the perspective of public transportation, park accessibility for older adults in Gulou District exhibits a clear spatial pattern of differentiation (Figure 7). High-value areas in Yijiangmen and Zhongyangmen subdistricts exhibit radiating distribution patterns toward the southwest. Low-value clusters in the southern districts reflect weak service capabilities regarding green space provision. These findings suggest targeted strategies are needed to improve park quality and optimize public transport connections in the southern districts, which could address imbalanced resource distribution between regions.
When the public transit time threshold is set to 30 min, there are minimal horizontal differences regarding accessibility. The gap between the maximum and minimum values reaches 17.16543844. Higher transit efficiency expands the service radius of parks, allowing older adults to overcome the constraints of walking and reach quality parks, effectively diminishing the extent of low-accessibility zones. However, high-value areas remain relatively limited. This limitation can be attributed to the surge of older adults within transit coverage zones, which has heightened pressure on green space capacity and restricts the expansion of high-accessibility areas.
From the perspective of spatial distribution patterns, areas with extremely low accessibility (Ai ≤ 0.5) account for 26.6% of the total and show a distinct spatial clustering in central and southwestern Gulou District. These regions exhibit insufficient public transit route coverage density, low UPGS quality, or inadequate age-friendly facilities, which prevent older adults from efficiently accessing high-quality green spaces. These findings confirm that public transportation partially reduces the proportion of low-accessibility areas by 24.2 percentage points compared to walking accessibility. While this improvement is notable, it has yet to address structural imbalances in resource allocation across districts. A targeted optimization of bus route planning in central and southwestern areas should be prioritized to promote equitable UPGS distribution.

4.3. Analysis of the Social Equity of UPGS Accessibility for Older Adults in Gulou District

A comprehensive assessment of UPGS services for older adults in Gulou District reveals suboptimal equity performance, with significant geographical variations in accessibility across the district’s regions and communities. From a social equity perspective, these disparities systematically stem from three core factors:
(1)
Imbalanced UPGS spatial distribution: A significant disparity is found between the clustered and excessive UPGS availability in some districts and severe deficits in areas with higher older population densities, indicating substantial inequality in access to nearby green spaces.
(2)
Unreasonable spatial configuration of UPGS quality: UPGSs of differing quality levels are distributed sporadically throughout the study area, regardless of the actual distribution of older adults or their particular activity demands. A significant disparity exists between high-quality, well-equipped parks and ordinary green spaces with outdated facilities and limited functions, leading to compromised service efficacy for the older adults. Consequently, the inferior quality and insufficient integration of age-friendly facilities in these spaces restrict their usability, fostering inequitable access to premium green resources despite geographical closeness.
(3)
Mismatch between UPGS supply and age-specific demands: Current planning does not adequately align with the activity preferences of older adults, creating a disconnect between supply and demand. As a result, UPGSs that are physically present often fail to effectively serve older adults living nearby. This mismatch highlights an inequity in meeting the specific environmental needs of this population.
As illustrated in Figure 8, significant service inequity emerges in Gulou District, Nanjing. There is a notable number of service blind spots (“low–low” zones) under the 15 min walking threshold. This finding is corroborated by the survey results: 25% of older adults indicate that the nearby UPGS can only partially fulfill their daily recreational needs. These data reveal widespread service deficiencies within short walking distances, compounded by a distinct clustering of service blind spots in central and northwestern Gulou District. This pattern signals fundamental flaws in resource allocation and broader social equity challenges, underscoring that the city’s comprehensive growth has failed to ensure an equitable distribution of green spaces. Consequently, this study identifies a necessity for targeted planning strategies to achieve more precise resource allocation and to foster greater urban equity through enhanced UPGS optimization.

5. Discussion

This study integrates multi-source data, including remote sensing images, POIs, and survey data, to develop a refined analytical framework that effectively captures the spatial relationship between the distribution of UPGSs and the specific needs of older adults. Compared with traditional approaches, this study offers a more nuanced and equity-sensitive framework. It incorporates multimodal travel behaviors and replaces simplistic park supply measures with a multidimensional quality score that integrates ecological conditions, service facilities, and age-friendly design. Furthermore, by using real-time mobile signaling data instead of aggregated population proxies, this study enables a more accurate, context-aware, and socially equitable evaluation of urban park accessibility in Gulou District, Nanjing. Overall, the proposed framework exhibits strong cross-regional applicability due to its expanded theoretical foundation, which avoids over-reliance on study-area-specific constraints. For regional adaptation, two dynamic adjustments are required. First, the park quality assessment system should be calibrated based on local facility configurations, ecological attributes, and functional usage patterns. Second, Gaussian decay function parameters need to be re-estimated using mobility data of older adults from the target region, including pedestrian movement patterns and public transit preferences.
Regarding specific findings, the high-accessibility zones in Gulou District demonstrate pronounced spatial clustering, while traditional residential areas exhibit significant deficiencies in walking accessibility. The results obtained using these quantitative metrics are consistent with the survey data (47% of older adults rate park facilities as “average,” and 14% express “dissatisfaction”), which further indicates that structural mismatches in resource allocation negatively impact user experiences and reflect persistent spatial inequity. When contextualized within broader research, these findings show consistency with studies conducted in Shanghai, China, but contrast with studies conducted in European cities [23,51,52]. The primary reason for this phenomenon lies in the varying degrees of urban development among different cities. Specifically, European cities generally have a lower population density and sufficient per capita land availability, while the limited land resources in Nanjing highlight its relative gap in green space provision. In comparison, Shanghai mirrors Nanjing in its developmental trajectory and socio-cultural fabric. The similarity in results, particularly regarding the spatial equity of green resources, arises from their comparable urban density, historical planning priorities, and the similar challenges they face in serving older adults in high-demand areas. This parallel not only validates the findings of this study in Nanjing, but also suggests that the proposed evaluation framework may have broader applicability in similar urban settings.
To dissect the intra-regional disparities, a finer-grained analysis further reveals that the spatial imbalance stems from underlying regional factors. In central Gulou, historical urban patterns (ancient capital of China) have created areas with high concentrations of older adults, but insufficient park provision. The limited land resources have been predominantly devoted to government premises, educational institutions, and residential areas, making land reserved for parks comparatively scarce. This situation is worsened after the COVID-19 pandemic, as campus closures have curtailed the informal access to institutional green spaces that many older adults previously depended on. Northwestern Gulou is designated as a major logistics hub of east China following the administrative merger between former Gulou District and Xiaguan District since 2013. This transformation fosters strong industrial growth, which, in turn, drives dense urban development that intensifies traffic and noise pollution, which creates additional barriers to the development of age-friendly UPGSs. The abovementioned issues can be addressed through targeted strategies, such as establishing multi-level green networks, promoting shared institutional green spaces, and enhancing age-friendly slow-traffic infrastructures.
Based on the above findings, feasible strategies can be implemented to improve the accessibility of UPGSs for the older adults in Gulou District. For instance, the local government could address spatial supply shortages by constructing pocket parks or repurpose idle urban spaces into age-friendly green zones. Meanwhile, institutions such as universities and government agencies, which often possess abundant high-quality green spaces, could open these areas to community residents during off-peak hours. This approach would foster shared use of green resources while maintaining normal operations, thereby helping to alleviate the supply–demand imbalances for nearby older adults. Additionally, since older adults are more vulnerable to the adverse effects of pedestrian environments on walking speed and safety, it is also recommended that Nanjing implements age-friendly modifications to its slow traffic systems to enhance walkability to UPGSs for older adults.

6. Conclusions

This study addresses inequities in UPGS accessibility and resource allocation in the context of urban aging, using Gulou District, Nanjing, as a case study, and reveals significant disparities in accessibility across transportation modes alongside structural imbalances in public service provision. We propose a comprehensive framework to evaluate the overall quality of UPGSs. The improved Gaussian two-step floating catchment area method was employed to calculate accessibility values for older adults across different transportation modes. Subsequently, Pearson correlation coefficients were used to analyze the relationships between composite living environment indicators and spatial equity metrics across residential communities. Moreover, this study explores the differences and drivers of UPGS social equity, offering a foundation for optimizing green space planning. It empowers planners to better understand spatial patterns and supply conditions through a comprehensive accessibility and equity assessment and delivers scientific evidence for accurately identifying and meeting the green space needs of older adults.
The study results reveal that high-accessibility UPGS zones in Gulou District exhibit clustered spatial distributions. Accessibility levels demonstrate pronounced disparities between the walking and public transit modes, each displaying distinct spatial gradients. Under the walking scenario, traditional residential areas consistently show accessibility deficits, with 50.8% of neighborhoods registering low accessibility within the 15 min walking threshold. Extending this threshold to 30 min reduces overall disparities, the proportion of low-accessibility communities decreases by approximately 39.2% compared to the 15 min threshold, but fails to eliminate localized service blind spots. For public transit, the high-accessibility areas radiate outward from the central zones under the 15 min threshold. When extending to a 30 min threshold, the proportion of areas with extremely low accessibility decreases to 26.6%, but deficiencies in the transit network of central and southwestern regions continue to constrain accessibility. Furthermore, an analysis of public service provision reveals structural imbalances and inequities. Over 60% of parks fall below average in comprehensive quality, with particularly low scores for the service quality and basic environmental indicators. Further analysis identifies three primary causes of this social inequity: imbalanced spatial distribution of UPGSs, suboptimal allocation of quality resources, and inadequate alignment with age-specific demands.
The research findings offer valuable references for optimizing UPGS spatial layouts in aging urban centers and advancing equitable public service allocation, ultimately contributing to the realization of inclusive development in healthy human settlements. While demonstrating strong significance, this study can still be refined from the following perspectives: (1) expanding the scope to integrate collaborative perspectives within public service systems, and exploring spatial coupling relationships between UPGSs and facilities like nursing homes and community health centers; (2) uncovering the deeper social mechanisms underlying spatial equity by integrating socioeconomic indicators such as income and education of older adults.

Author Contributions

Conceptualization, Y.H., W.W. and Z.S.; methodology, Y.H. and W.W.; validation, Y.H., W.W. and Z.S.; formal analysis, Y.H., J.Z. and H.C.; writing—original draft preparation, Y.H. and H.C.; writing—review and editing, H.C.; funding acquisition, Y.H. All authors have read and agreed to the published version of the manuscript.

Funding

This research is funded by National Natural Science Foundation of China, grant number 42401570, and the Open Foundation of the Key Laboratory of Coupling Process and Effect of Natural Resources Elements, grant number 2024KFKT020.

Data Availability Statement

The data that support the findings of this study are available from the corresponding author upon reasonable request.

Acknowledgments

The authors express their gratitude toward the journal editors and reviewers, whose thoughtful suggestions have played a significant role in improving the quality of this paper.

Conflicts of Interest

The authors declare no conflicts of interest.

Appendix A

      Questionnaire on Park Usage Among Older Adults
Dear Senior Residents,
To improve park environments and facilities for your comfort, we conduct this anonymous survey. Your responses will remain confidential and used solely for statistical analysis. Please answer truthfully. Thank you for your cooperation.
I. Demographic Information
1. Gender:
A. Male (52%)
B. Female (48%)
2. Age group:
A. 50–60 years (23%)
B. 60–70 years (45%)
C. 70–80 years (27%)
D. ≥80 years (5%)
3. Residential community: ______
4. Most frequently visited park: ______
II. Park Usage Patterns
5. Preferred park visitation times (multiple selections allowed):
A. Early morning (5:00–9:00) (68%)
B. Morning (9:00–12:00) (28%)
C. Afternoon (12:00–17:00) (35%)
D. Evening (after 17:00) (52%)
6. Primary transportation mode to parks:
A. Walking (73%)
B. Public transit (25%)
C. Other: ______ (2%)
7. Typical travel time to parks:
A. ≤15 min (41%)
B. 15–30 min (46%)
C. >30 min (13%)
III. Park Environment and Facility Evaluation
8. Satisfaction with basic environment (e.g., space, cleanliness):
A. Satisfied (38%)
B. Neutral (45%)
C. Dissatisfied (17%)
9. Does neighborhood park greenery meet daily leisure needs?
A. Fully meets (22%)
B. Partially meets (53%)
C. Inadequately meets (25%)
10. Completeness of park facilities:
A. Complete (29%)
B. Moderate (47%)
C. Incomplete (24%)
11. Satisfaction with service quality (e.g., staff attitude, activity diversity):
A. Satisfied (32%)
B. Neutral (51%)
C. Dissatisfied (17%)
12. Satisfaction with ecological environment (e.g., green coverage, water cleanliness):
A. Satisfied (35%)
B. Neutral (50%)
C. Dissatisfied (15%)
13. Perceived overall park safety:
A. Safe (86%)
B. Neutral (13%)
C. Unsafe (1%)
14. Overall park satisfaction:
A. Satisfied (51%)
B. Neutral (41%)
C. Dissatisfied (8%)
IV. Additional Suggestions
15. Further recommendations for park environments, facilities, or services:
______
We sincerely appreciate your participation!

References

  1. Akpinar, A. How Is Quality of Urban Green Spaces Associated with Physical Activity and Health? Urban For. Urban Green. 2016, 16, 76–83. [Google Scholar] [CrossRef]
  2. Cao, Y.; Guo, Y.; Fang, Y.; He, X. Refuge Green Space Equity: A Case Study of Third Ring Road on Chengdu. Land 2023, 12, 1460. [Google Scholar] [CrossRef]
  3. Li, X.; Ma, X.; Hu, Z.; Li, S. Investigation of Urban Green Space Equity at the City Level and Relevant Strategies for Improving the Provisioning in China. Land Use Policy 2021, 101, 105144. [Google Scholar] [CrossRef]
  4. Meng, D.; Zhang, J.; Cai, Z.; Xu, S. Evaluating the Accessibility of Seniors to Urban Park Green Spaces. J. Urban Plan. Dev. 2024, 150, 05024021. [Google Scholar] [CrossRef]
  5. Gong, F.; Zheng, Z.-C.; Ng, E. Modeling Elderly Accessibility to Urban Green Space in High Density Cities: A Case Study of Hong Kong. Procedia Environ. Sci. 2016, 36, 90–97. [Google Scholar] [CrossRef]
  6. Zhang, F.; Li, D.; Ahrentzen, S.; Zhang, J. Assessing Spatial Disparities of Accessibility to Community-Based Service Resources for Chinese Older Adults Based on Travel Behavior: A City-Wide Study of Nanjing, China. Habitat Int. 2019, 88, 101984. [Google Scholar] [CrossRef]
  7. Xu, Y.; Zhou, C.; Hu, B. Measuring the Accessibility of Emergency Shelters Based on an Improved Two-Step Floating Catchment Area Model. Int. J. Digit. Earth 2025, 18, 2479864. [Google Scholar] [CrossRef]
  8. Li, P.; Wu, W.; Yin, Y. Enhanced Accessibility to Park Cooling Services in Developed Areas: Experimental Insights on the Walkability in Large Urban Agglomerations. Build. Environ. 2025, 272, 112665. [Google Scholar] [CrossRef]
  9. Zhang, D.; Ma, S.; Fan, J.; Xie, D.; Jiang, H.; Wang, G. Assessing Spatial Equity in Urban Park Accessibility: An Improve Two-Step Catchment Area Method from the Perspective of 15-Mintue City Concept. Sustain. Cities Soc. 2023, 98, 104824. [Google Scholar] [CrossRef]
  10. Tannous, H.O.; Major, M.D.; Furlan, R. Accessibility of Green Spaces in a Metropolitan Network Using Space Syntax to Objectively Evaluate the Spatial Locations of Parks and Promenades in Doha, State of Qatar. Urban For. Urban Green. 2021, 58, 126892. [Google Scholar] [CrossRef]
  11. Hansen, W.G. How Accessibility Shapes Land Use. J. Am. Inst. Plan. 1959, 25, 73–76. [Google Scholar] [CrossRef]
  12. Wu, L.; Kim, S.K.; Lin, C. Socioeconomic Groups and Their Green Spaces Availability in Urban Areas of China: A Distributional Justice Perspective. Environ. Sci. Policy 2022, 131, 26–35. [Google Scholar] [CrossRef]
  13. Wang, S.; Wang, M.; Liu, Y. Access to Urban Parks: Comparing Spatial Accessibility Measures Using Three GIS-Based Approaches. Comput. Environ. Urban Syst. 2021, 90, 101713. [Google Scholar] [CrossRef]
  14. Li, C.; Wang, J. Using an Age-Grouped Gaussian-Based Two-Step Floating Catchment Area Method (AG2SFCA) to Measure Walking Accessibility to Urban Parks: With an Explicit Focus on Elderly. J. Transp. Geogr. 2024, 114, 103772. [Google Scholar] [CrossRef]
  15. Chen, P.; Wang, W.; Qian, C.; Cao, M.; Yang, T. Gravity-Based Models for Evaluating Urban Park Accessibility: Why Does Localized Selection of Attractiveness Factors and Travel Modes Matter? Environ. Plan. B Urban Anal. City Sci. 2024, 51, 904–922. [Google Scholar] [CrossRef]
  16. Wu, W.; Zheng, T. Establishing a “Dynamic Two-Step Floating Catchment Area Method” to Assess the Accessibility of Urban Green Space in Shenyang Based on Dynamic Population Data and Multiple Modes of Transportation. Urban For. Urban Green. 2023, 82, 127893. [Google Scholar] [CrossRef]
  17. Łaszkiewicz, E.; Wolff, M.; Andersson, E.; Kronenberg, J.; Barton, D.N.; Haase, D.; Langemeyer, J.; Baró, F.; McPhearson, T. Greenery in Urban Morphology: A Comparative Analysis of Differences in Urban Green Space Accessibility for Various Urban Structures across European Cities. Ecol. Soc. 2022, 27, 22. [Google Scholar] [CrossRef]
  18. Li, X.; Huang, Y.; Ma, X. Evaluation of the Accessible Urban Public Green Space at the Community-Scale with the Consideration of Temporal Accessibility and Quality. Ecol. Indic. 2021, 131, 108231. [Google Scholar] [CrossRef]
  19. He, B.; Hu, J.; Liu, K.; Xue, J.; Ning, L.; Fan, J. Exploring Park Visit Variability Using Cell Phone Data in Shenzhen, China. Remote Sens. 2022, 14, 499. [Google Scholar] [CrossRef]
  20. Lin, Y.; Zhou, Y.; Lin, M.; Wu, S.; Li, B. Exploring the Disparities in Park Accessibility through Mobile Phone Data: Evidence from Fuzhou of China. J. Environ. Manag. 2021, 281, 111849. [Google Scholar] [CrossRef]
  21. Benati, G.; Calcagni, F.; Matellozzo, F.; Ghermandi, A.; Langemeyer, J. Unequal Access to Cultural Ecosystem Services of Green Spaces within the City of Rome—A Spatial Social Media-Based Analysis. Ecosyst. Serv. 2024, 66, 101594. [Google Scholar] [CrossRef]
  22. Jin, Y.; Xu, Y.; Liu, W. The Green Quality of Urban Spatial Development: A Multi-Dimensional and Multi-Regional Model Using Big Data. Urban For. Urban Green. 2023, 85, 127953. [Google Scholar] [CrossRef]
  23. Kaufmann, T.; Vispute, S.; Kansal, M.; O’Brien, D.T.; Shekel, T.; Gabrilovich, E.; Wellenius, G.A.; Dijkstra, L.; Veneri, P. Variation in Access to Urban Parks across Six OECD Countries. npj Urban Sustain 2025, 5, 40. [Google Scholar] [CrossRef]
  24. Bai, X.; Cao, K.; Tian, W. How Do Community Parks Affect Environmental Justice for Older Adults: Insights from Availability, Accessibility, and Attractiveness. Urban For. Urban Green. 2025, 113, 129017. [Google Scholar] [CrossRef]
  25. Mayaud, J.R.; Tran, M.; Nuttall, R. An Urban Data Framework for Assessing Equity in Cities: Comparing Accessibility to Healthcare Facilities in Cascadia. Comput. Environ. Urban Syst. 2019, 78, 101401. [Google Scholar] [CrossRef]
  26. Wei, J.; Chen, M.; Chu, C.; Zhao, C.; Xia, X.; Li, Y. Assessing Cultural Ecosystem Services Supply–Demand Balance of Urban Parks in the Context of Old and New Urban Districts. Ecol. Indic. 2024, 159, 111688. [Google Scholar] [CrossRef]
  27. Peng, L.; Zhang, L.; Li, X.; Wang, P.; Zhao, W.; Wang, Z.; Jiao, L.; Wang, H. Spatio-Temporal Patterns of Ecosystem Services Provided by Urban Green Spaces and Their Equity along Urban-Rural Gradients in the Xi’an Metropolitan Area, China. Remote Sens. 2022, 14, 4299. [Google Scholar] [CrossRef]
  28. Rui, J. Green Disparities, Happiness Elusive: Decoding the Spatial Mismatch between Green Equity and the Happiness from Vulnerable Perspectives. Cities 2025, 163, 106063. [Google Scholar] [CrossRef]
  29. Chen, Y.; Men, H.; Ke, X. Optimizing Urban Green Space Patterns to Improve Spatial Equity Using Location-Allocation Model: A Case Study in Wuhan. Urban For. Urban Green. 2023, 84, 127922. [Google Scholar] [CrossRef]
  30. Zhou, C.; Xie, M.; Zhao, J.; An, Y. What Affects the Use Flexibility of Pocket Parks? Evidence from Nanjing, China. Land 2022, 11, 1419. [Google Scholar] [CrossRef]
  31. LaReaux, J.; Watkins, D. Geospatial Analysis for Promoting Urban Green Space Equity: Case Study of Detroit, Michigan, USA. Urban For. Urban Green. 2025, 105, 128716. [Google Scholar] [CrossRef]
  32. Lu, Y.; Chen, R.; Chen, B.; Wu, J. Inclusive Green Environment for All? An Investigation of Spatial Access Equity of Urban Green Space and Associated Socioeconomic Drivers in China. Landsc. Urban Plan. 2024, 241, 104926. [Google Scholar] [CrossRef]
  33. Guo, R.; Ann Diehl, J.; Zhang, R.; Wang, H. Spatial Equity of Urban Parks from the Perspective of Recreational Opportunities and Recreational Environment Quality: A Case Study in Singapore. Landsc. Urban Plan. 2024, 247, 105065. [Google Scholar] [CrossRef]
  34. Zhang, S.; Yu, P.; Chen, Y.; Jing, Y.; Zeng, F. Accessibility of Park Green Space in Wuhan, China: Implications for Spatial Equity in the Post-COVID-19 Era. Int. J. Environ. Res. Public Health 2022, 19, 5440. [Google Scholar] [CrossRef] [PubMed]
  35. Ren, X.; Guan, C. Evaluating Geographic and Social Inequity of Urban Parks in Shanghai through Mobile Phone-Derived Human Activities. Urban For. Urban Green. 2022, 76, 127709. [Google Scholar] [CrossRef]
  36. Tomasiello, D.B.; Giannotti, M. Unfolding Time, Race and Class Inequalities to Access Leisure. Environ. Plan. B Urban Anal. City Sci. 2023, 50, 927–941. [Google Scholar] [CrossRef]
  37. Liu, B.; Tian, Y.; Guo, M.; Tran, D.; Alwah, A.A.Q.; Xu, D. Evaluating the Disparity between Supply and Demand of Park Green Space Using a Multi-Dimensional Spatial Equity Evaluation Framework. Cities 2022, 121, 103484. [Google Scholar] [CrossRef]
  38. Muzzamil Hussain Khattak, M.; Asif Khan, M.; Ud Din, S.; Khan, M.Z.; Faisal Habib, M. Examining Equity of Walking Accessibility to Green Spaces: A Case Study of Islamabad. Ain Shams Eng. J. 2023, 14, 102556. [Google Scholar] [CrossRef]
  39. Enssle, F.; Kabisch, N. Urban Green Spaces for the Social Interaction, Health and Well-Being of Older People—An Integrated View of Urban Ecosystem Services and Socio-Environmental Justice. Environ. Sci. Policy 2020, 109, 36–44. [Google Scholar] [CrossRef]
  40. Wang, C.; Lassi, N. Protecting Biodiversity and Human Health along the Belt and Road. Glob. Transit. 2023, 5, 79–88. [Google Scholar] [CrossRef]
  41. Chen, P.; Jian, I.Y.; Zhang, L.; Siu, K.W.M.; Liu, J.; Liu, Z.; Chen, X. Towards a Smart Healthy City: A Generalised Flow-Based 2SFCA Method for Incorporating Actual Mobility Data in Healthcare Accessibility Evaluation. Travel Behav. Soc. 2024, 34, 100706. [Google Scholar] [CrossRef]
  42. Ali, M.J.; Rahaman, M.; Hossain, S.I. Urban Green Spaces for Elderly Human Health: A Planning Model for Healthy City Living. Land Use Policy 2022, 114, 105970. [Google Scholar] [CrossRef]
  43. Lu, J.; Li, L.; Wang, W. Assessing Accessibility and Environmental Equity in the Context of Sustained Aging: Pathways for Age-Friendly Urban Park Planning. Urban For. Urban Green. 2025, 108, 128768. [Google Scholar] [CrossRef]
  44. Zhao, H.; Feng, G.; Zhao, W.; Wang, Y.; Chen, F. Analyzing Urban Parks for Older Adults’ Accessibility in Summer Using Gradient Boosting Decision Trees: A Case Study from Tianjin, China. Land 2025, 14, 185. [Google Scholar] [CrossRef]
  45. Beck, H.; Berney, R.; Kirk, B.; Yocom, K.P. Building Equity into Public Park and Recreation Service Investment: A Review of Public Agency Approaches. Landsc. Urban Plan. 2024, 247, 105069. [Google Scholar] [CrossRef]
  46. The Report on the Information of the Elderly Population and the Development of the Aging Cause in Nanjing in 2023 was Released. Civil Affairs Trend. Nanjing Civil Affairs Bureau. Available online: https://mzj.nanjing.gov.cn/njsmzj/mzdt/202406/t20240613_4690010.html (accessed on 22 July 2025).
  47. Safaie Ghamsary, E.; Karimimoshaver, M.; Akhavan, A.; Afzali Goruh, Z.; Aram, F.; Mosavi, A. Locating Pocket Parks: Assessing the Effects of Land Use and Accessibility on the Public Presence. Environ. Sustain. Indic. 2023, 18, 100253. [Google Scholar] [CrossRef]
  48. Heikinheimo, V.; Tiitu, M.; Viinikka, A. Data on Different Types of Green Spaces and Their Accessibility in the Seven Largest Urban Regions in Finland. Data Brief 2023, 50, 109458. [Google Scholar] [CrossRef]
  49. Stoia, N.L.; Niţă, M.R.; Popa, A.M.; Iojă, I.C. The Green Walk—An Analysis for Evaluating the Accessibility of Urban Green Spaces. Urban For. Urban Green. 2022, 75, 127685. [Google Scholar] [CrossRef]
  50. Dai, D. Racial/Ethnic and Socioeconomic Disparities in Urban Green Space Accessibility: Where to Intervene? Landsc. Urban Plan. 2011, 102, 234–244. [Google Scholar] [CrossRef]
  51. Liang, H.; Yan, Q.; Yan, Y.; Zhang, Q. Using an Improved 3SFCA Method to Assess Inequities Associated with Multimodal Accessibility to Green Spaces Based on Mismatches between Supply and Demand in the Metropolitan of Shanghai, China. Sustain. Cities Soc. 2023, 91, 104456. [Google Scholar] [CrossRef]
  52. Pinto, L.V.; Ferreira, C.S.S.; Inácio, M.; Pereira, P. Urban Green Spaces Accessibility in Two European Cities: Vilnius (Lithuania) and Coimbra (Portugal). Geogr. Sustain. 2022, 3, 74–84. [Google Scholar] [CrossRef]
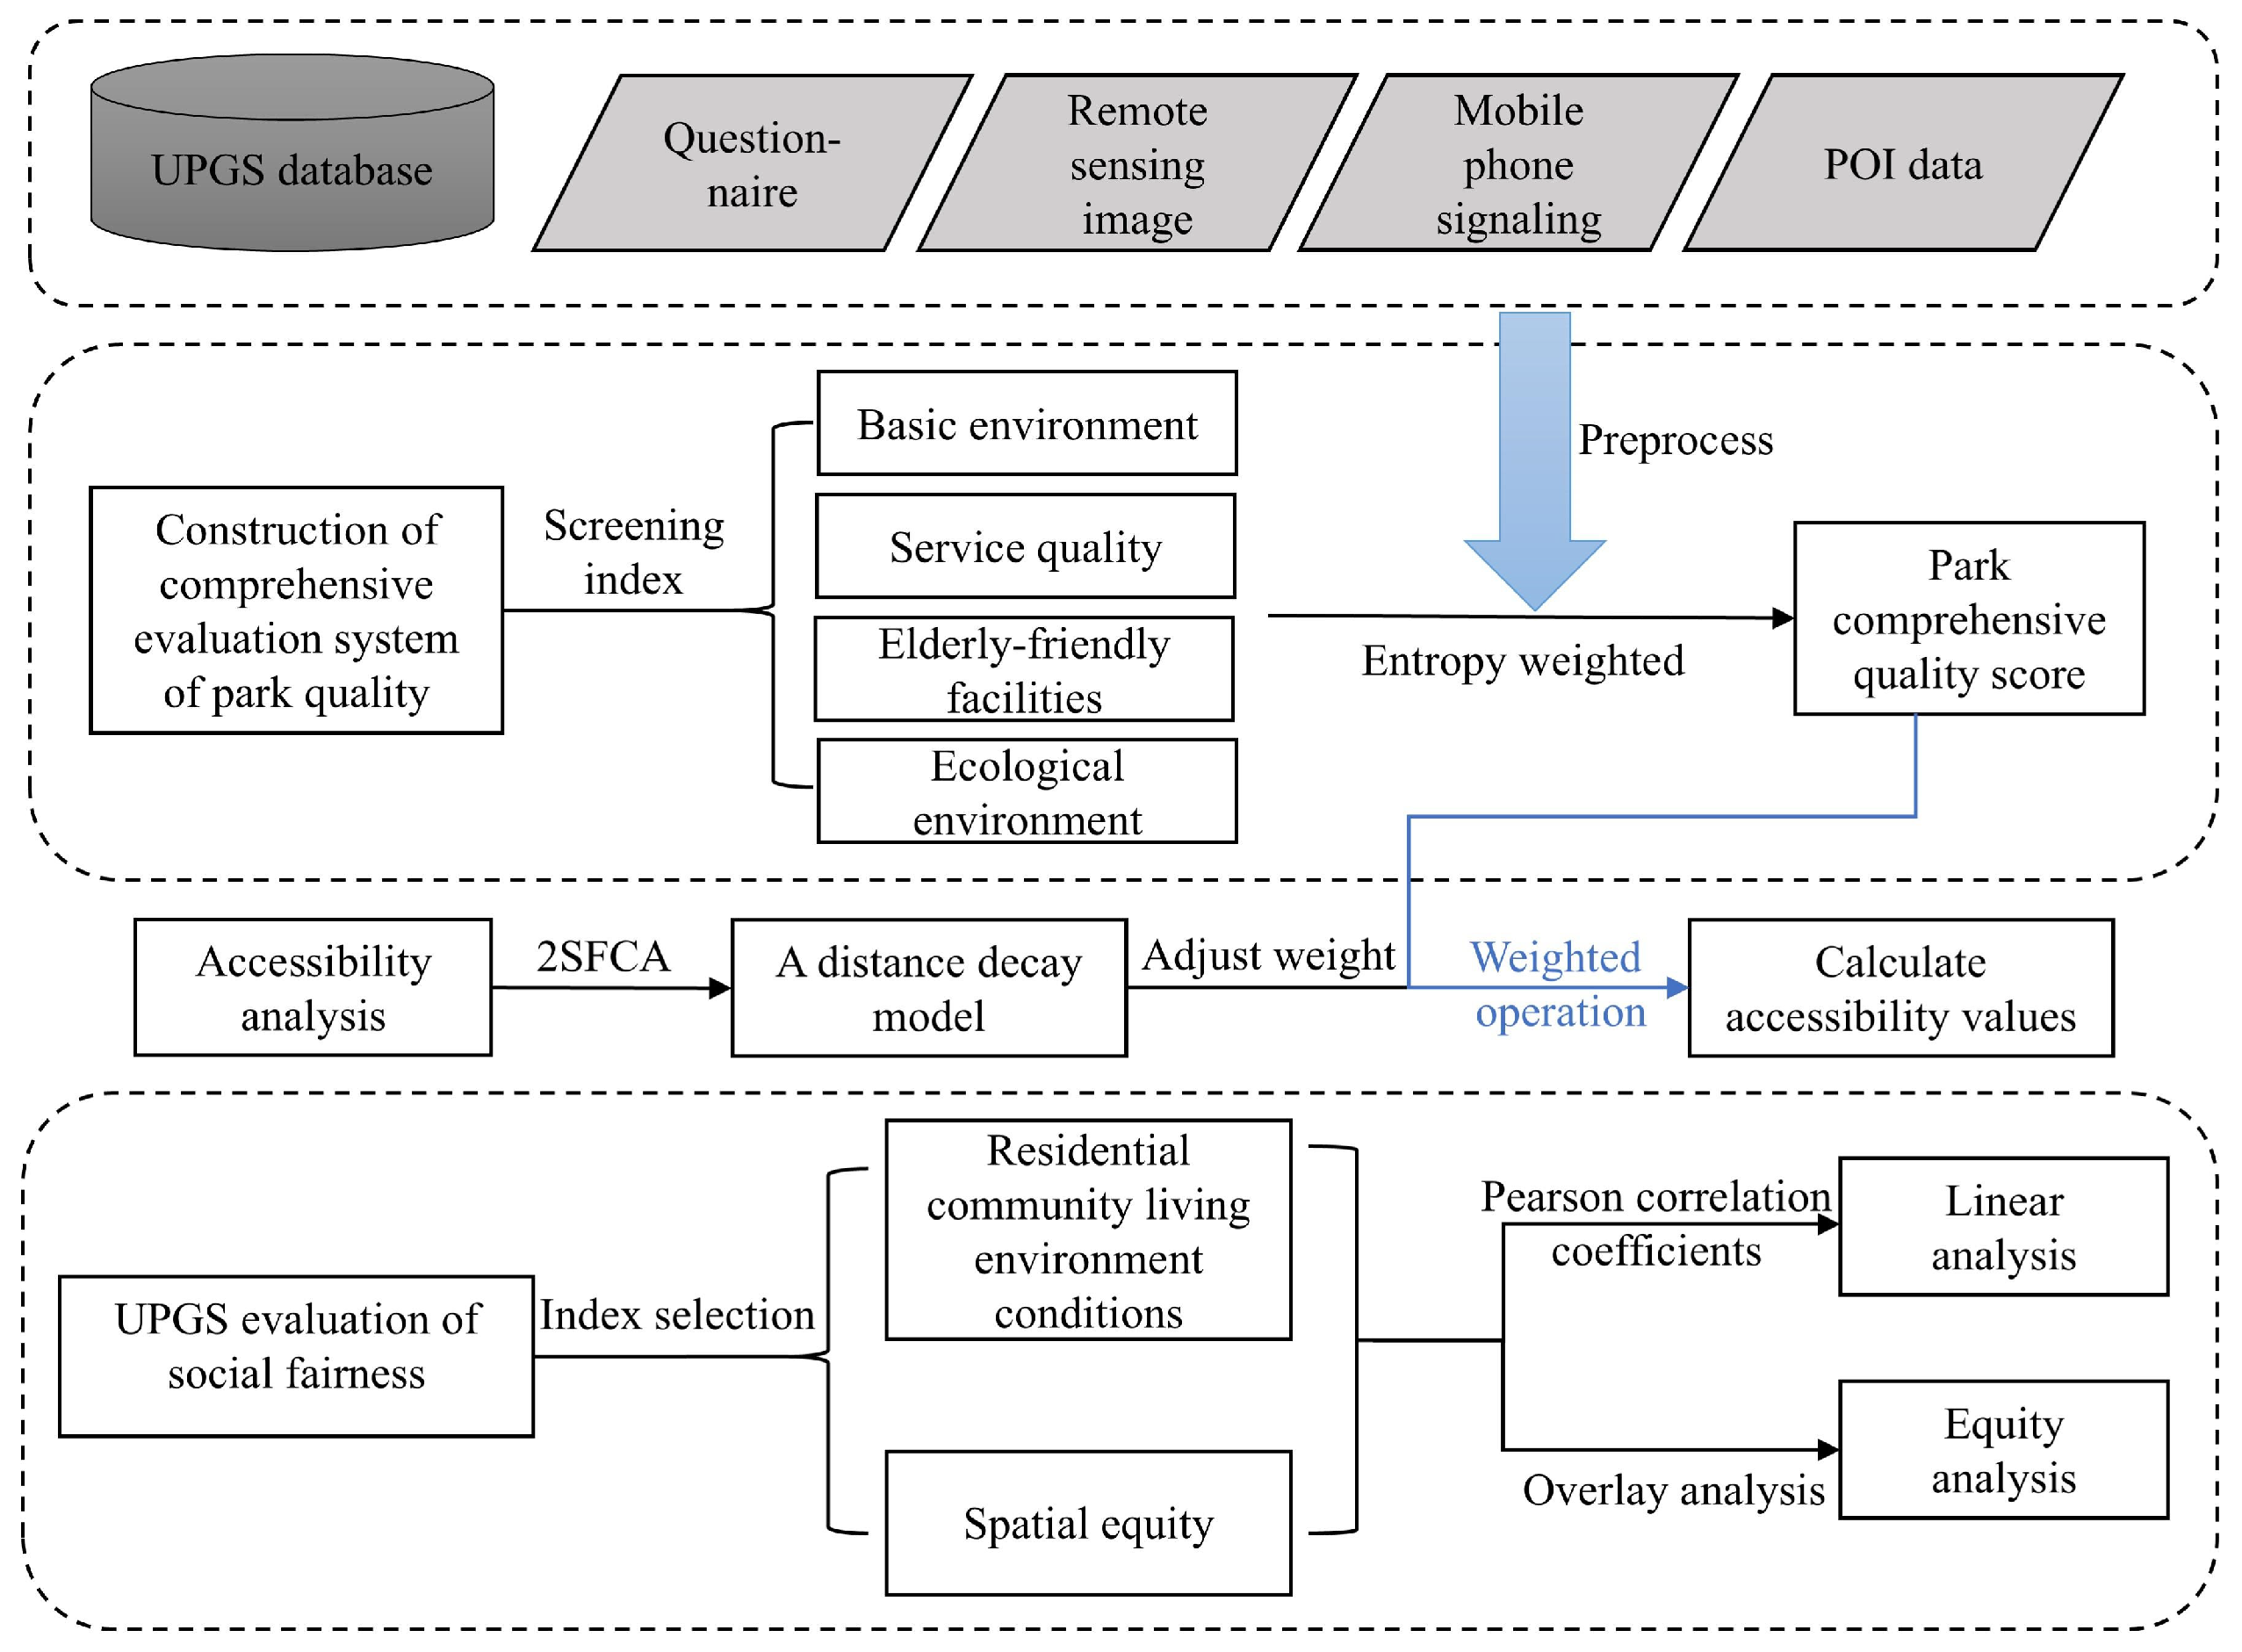
Figure 1. Overall research roadmap.
Land 14 02102 g001
Figure 2. A sketch map of the study area (note: some parks that are adjacent to the Drum Tower area and have great influence are also included in the evaluation of this study, such as Xuanwu Lake Park, Hongshan Forest Zoo, and Mochou Lake Park).
Land 14 02102 g002
Figure 3. Spatial distribution of green space comprehensive scores.
Land 14 02102 g003
Figure 4. Comparison of UPGS comprehensive scores (note: the numbers on the horizontal axis correspond to the parks as follows: 1—Bazishan Park, 2—Daqiao Park, 3—Gulin Park, 4—Gulou Park, 5—Hongshan Forest Zoo, 6—Jimingsi Park, 7—Jinghai Temple, 8—Mochou Lake Park, 9—Nanjing Muyan Riverside Landscape Area, 10—Nanjing Stone City Heritage Park, 11—Qingliangshan Park, 12—Shence Gate Park, 13—Lion Mountain Scenic Area, 14—Tao Xingzhi Memorial Hall, 15—Wulongtan Park, 16—Xiaotao Park, 17—Xiuqiu Park, 18—Xuanwu Lake Park, 19—Yuejianglou Scenic Area, 20—Zhenghe Baochuan Heritage Park. These numbers corresponding to the park names are also applicable to Figure 5).
Land 14 02102 g004
Figure 5. Evaluation scores of UPGSs.
Land 14 02102 g005
Figure 6. Spatial distribution of parks accessible for older adults within 15 and 30 min walking thresholds.
Land 14 02102 g006
Figure 7. Spatial distribution of parks accessible to older adults within 15 and 30 min public transit thresholds.
Land 14 02102 g007
Figure 8. Overlap analysis of residential compound living index and 15 min walking time.
Land 14 02102 g008
Table 1. Data categories and sources.
Data TypeData ResourcesData Content
Administrative division dataMap World spatio-temporal information cloud platformStreet administrative boundaries
Urban road dataOpen Street MapUrban main roads, secondary roads, and branch roads
UPGS dataGF-2 satellite imagesUPGS boundary, vegetation and water area, etc.
Residential district dataGaode Map open platform, chain homePOIs, housing prices, etc.
Service evaluation dataQuestionnaireSubjective evaluation by older adults
Park facility dataOn-site investigation, Gaode mapPublic service facility POIs, accessibility of facilities, etc.
Older adults dataChina Unicom Smart Footprint PlatformNumber of older adults in each region
Table 2. Park quality fairness evaluation system.
Primary IndicatorsSecondary IndicatorsSourceWeight
Basic environmentArea sizeStatistically obtained via ArcGIS Arcmap 10.8 vectorization0.1552
Shape indexCalculated based on the perimeter and area of each UPGS0.1258
Sanitary conditionsQuestionnaires, field research and public comment data, health environment data0.0671
Service qualityService function diversityPOI data of Gaode map outside the park0.0283
Overall satisfaction rateNumber of favorable comments in the questionnaires0.1893
Age-friendly facilitiesInternal supporting facilitiesPOI data derived from Gaode map inside each park0.1007
Quantity of age-friendly facilitiesField investigation, number of facilities suitable for older adults0.1303
Ecological environmentDaily average NDVICalculated with GF-2 images in 20240.0997
Daily average NDWICalculated with GF-2 images in 20240.1036
Disclaimer/Publisher’s Note: The statements, opinions and data contained in all publications are solely those of the individual author(s) and contributor(s) and not of MDPI and/or the editor(s). MDPI and/or the editor(s) disclaim responsibility for any injury to people or property resulting from any ideas, methods, instructions or products referred to in the content.